Thermal and Performance Analysis of a Photovoltaic Module with an Integrated Energy Storage System


1
Department of Electrical, Electronic, and Information Engineering, University of Bologna, 40136 Bologna, Italy
2
Department of Energy, Politecnico di Milano, 20156 Milano, Italy
*
Author to whom correspondence should be addressed.
Appl. Sci. 2017, 7(11), 1107; https://0-doi-org.brum.beds.ac.uk/10.3390/app7111107
Submission received: 19 September 2017
/
Revised: 18 October 2017
/
Accepted: 23 October 2017
/
Published: 25 October 2017
(This article belongs to the Special Issue Computational Intelligence in Photovoltaic Systems)
Abstract
:This paper is proposing and analyzing an electric energy storage system fully integrated with a photovoltaic PV module, composed by a set of lithium-iron-phosphate (LiFePO4) flat batteries, which constitutes a generation-storage PV unit. The batteries were surface-mounted on the back side of the PV module, distant from the PV backsheet, without exceeding the PV frame size. An additional low-emissivity sheet was introduced to shield the batteries from the backsheet thermal irradiance. The challenge addressed in this paper is to evaluate the PV cell temperature increase, due to the reduced thermal exchanges on the back of the module, and to estimate the temperature of the batteries, verifying their thermal constraints. Two one-dimensional (1D) thermal models, numerically implemented by using the thermal library of Simulink-Matlab accounting for all the heat exchanges, are here proposed: one related to the original PV module, the other related to the portion of the area of the PV module in correspondence of the proposed energy-storage system. Convective and radiative coefficients were then calculated in relation to different configurations and ambient conditions. The model validation has been carried out considering the PV module to be at the nominal operating cell temperature (NOCT), and by specific experimental measurements with a thermographic camera. Finally, appropriate models were used to evaluate the increasing cell batteries temperature in different environmental conditions.

1. Introduction
Photovoltaic energy is one of most promising among renewable energy sources. Future development of photovoltaic and, in general, of all clean and renewable technologies, is related to the possibility to use energy when is needed. For this reason, energy storage represents a key component in the development of renewable energies [1,2,3,4]. Energy storage makes it possible to meet users needs during out-of-production periods. In this way, renewable energies can be really competitive with fossil sources and nuclear energies. Nowadays, electrochemical storage (i.e., battery) represents the most used and reliable technology to store electrical energy. Battery energy storage systems (BESS) represent one of the most promising and flexible solutions for storage [5,6]. An effective and flexible implementation strategy of storage in energy systems is to join the storage elements to the renewable generation units. For this purpose, an electric energy storage system fully integrated within a single photovoltaic (PV) module [7], constituting a modular generation-storage PV unit, is proposed and evaluated in this paper. In this way, each PV module can be treated as a self-rechargeable battery unit (Figure 1), and the whole PV generation-storage system can be simply built by properly combining the PV units (i.e., series/parallel/connections). In particular, each PV unit would be composed of a commercial PV module, a dc/dc chopper with both maximum power point tracking MPPT and battery charge regulator capabilities, a charge monitoring system (BMS), and a set of lithium-iron-phosphate (LiFePO4) flat batteries for energy storage (typical thickness less than 1 cm), connected in series. The batteries were surface-mounted on the back side of the PV module by an aluminum-bar structure which keeps the batteries distant from the PV backsheet without exceeding the PV frame size (typical air-gap was about 2 cm). Thus, the battery disposition didn’t exceed the original PV size, but allowed natural air cooling of the backsheet. An additional low-emissivity, aluminum sheet was introduced to shield the batteries from the backsheet irradiance, in consideration of the usual maximum temperature limit of the batteries (50–55 °C). This paper is aimed at evaluating the PV cell temperature increase due to the reduced thermal exchanges on the back PV side, and to estimate battery temperature in order to verify their thermal limits. A PV model based on material, environmental parameters, and electro-thermal characteristics, was developed, taking into account the energy balance. The entire solar radiation incident on PV module was converted into electrical and heat energy. Consequently, excessive heat and thermal stress can result in cell fault and/or energy losses [8]. Two one-dimensional (1D) thermal models accounting for all the heat exchanges are proposed. The first one concerns the original (commercial) PV module, the second one is related to the PV module with the proposed energy-storage system mounted on the back side. Convective and radiative coefficients were calculated in relation to different configurations and environmental conditions. The considered models were numerically implemented using the thermal library of Simulink-Matlab. The model validation were carried out by the PV module normal operating cell temperature(NOCT) given by the manufacturer, and by specific experimental measurements on the real PV module, including thermographic camera images, with and without the proposed BESS.
2. Thermal Model of a Single PV Module
This section deals with simple thermal models for PV modules, with and without the integrated energy storage system. The heat exchanges were theoretically analyzed and compared with reference to the two aforementioned models. The first aim of this analysis is to determine the temperature increase in PV cells in the case of the presence of the storage system, considering the different heat exchanges.
2.1. Models
For a PV module, the steady-state thermal balance can be written as [9]:
With reference to the thermal balance (Equation (1)), the heat exchanges of the commercial PV module are described in Figure 2a: Gn is the specific radiation incident on the module’s surface (W/m2); Gn must be multiplied by the area of the PV module A (m2) in order to get the total incident power. Ppv (W) is the electrical power generation, proportional to the total incident power, and η is the photovoltaic conversion efficiency. Grif is the total radiative power reflected from the surface of the PV module that is proportional to the reflection index ρ.
The Q terms [W] consider convective Qconv and radiative Qrad exchanges of the front (f) and back (b) sides of the PV module with the surrounding environment.
As for the commercial PV module, the heat exchanges of the PV module with an energy storage system are shown in Figure 2b. By introducing flat batteries on the back side of the PV module it is evident that both convective and radiative heat exchanges were limited. In particular, radiative exchange was limited due to the reflection of infrared (IR) rays by the aluminum flat plates (having extremely low emissivity). The PV module backsheetemited IR rays, proportional to its temperature (T4). The aluminum plate acted as a thermal shield, reducing overheating of the batteries. However, the IR rays reflected from the backsheet increased the temperature of the PV module. In addition, the presence of batteries led to a restriction in the convective heat exchange, even though air circulation was still possible through the airgap (i.e., almost 2 cm).
The decrease of the radiative and conductive exchanges of the backsheet due to the batteries led to higher backsheet and PV cell temperatures compared to commercial PV modules.
In the thermal models under consideration, the following assumptions have been made:
- One-dimensional (1D) thermal models.
- Isothermal surface was approximated as a flux node, so edge effects were neglected.
- Negligible thermal capacitances [10].
- Material properties of PV module layers were constant, as shown in Table 1.
- PV cell temperature was considered uniform due to the higher value of its thermal conductivity (k) compared to any of the other layers.
- Apparent sky temperature Ts was calculated according to [11]:where Ta is the air temperature and δT is the variation depending on atmospheric conditions.
- Ground temperature (on the back side of the PV module) was equal to air temperature (Tg = Ta).
- Convective heat exchange coefficients were evaluated with empirical formulations and it was assumed that wind flowed around the module, both front and back sides [12].
- Reflection (ρ), transmission (τ), and absorption (α) coefficients were independent from temperature.
- Internal reflection phenomena between the layers of PV module were neglected.
- Emissivity of surfaces were independent from temperature and wavelength, values are given in Table 2.
- According to the radiative heat transfer, the view factor was assumed to be unity. With this approximation, the front surface of PV module saw only the sky, whereas the back surface saw only the ground. Radiative heat exchange coefficients were simplified by this assumption.
- All surfaces had the same area A of the PV module: A = 1.31 m2 in the case study.
- Batteries did not produce any heat flow while charging or discharging (battery losses were neglected).
2.2. Thermal Balance Equations
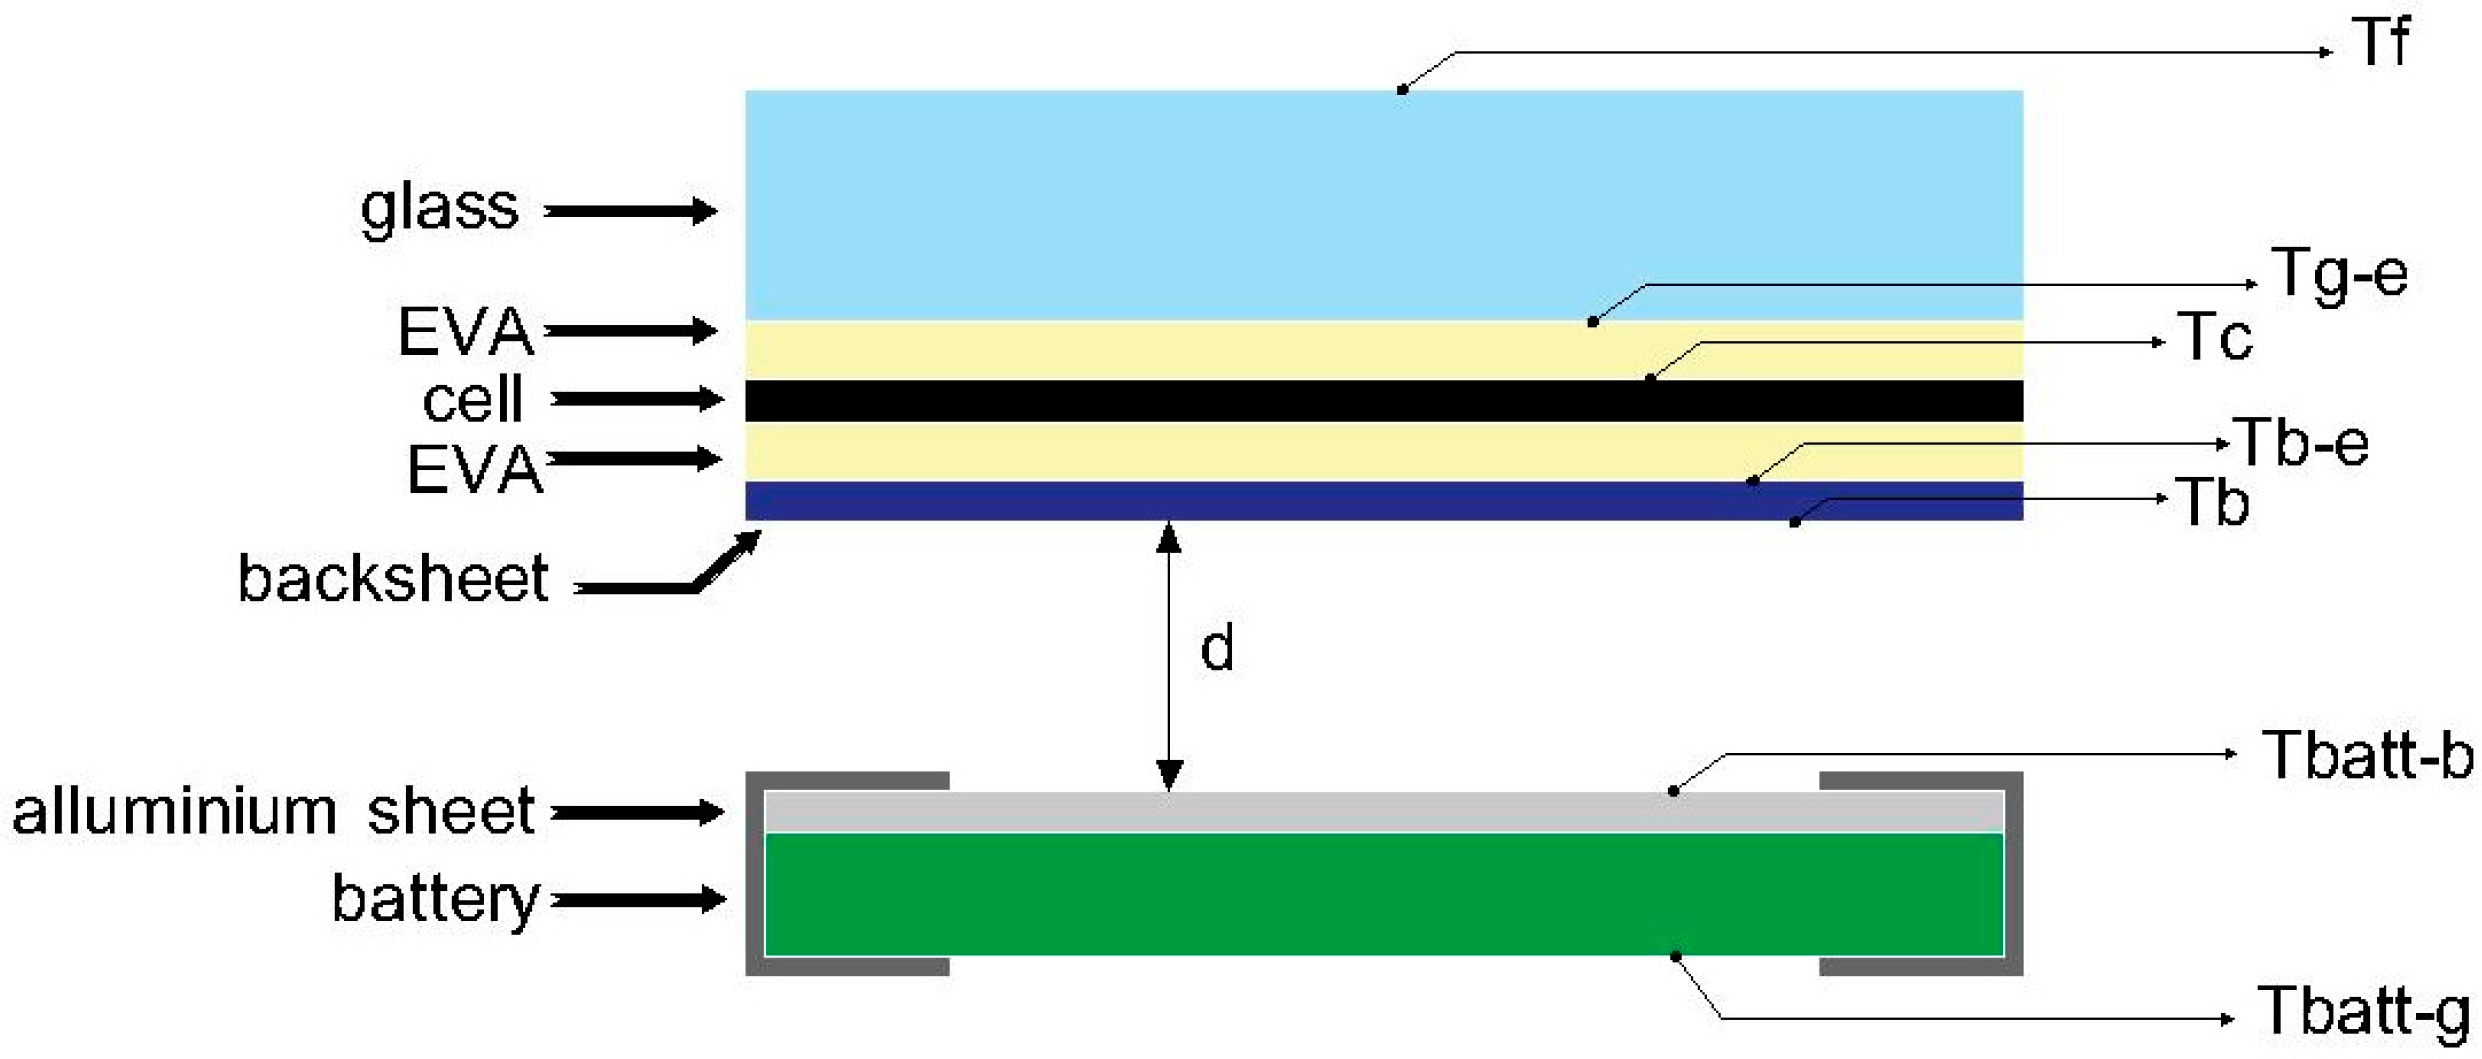
A PV module contains a number of layers from the front to the back side as follows: glass (g), EVA (e′), silicon PV cell, another EVA layer (e″), and backsheet (b) [13]. The batteries were mounted on the back side of the PV module by an aluminum-bar structure so as to leave an airgap (d ≈ 2 cm) between the batteries and the PV backsheet, as depicted in Figure 3.
The thermal balance for each layer can be expressed taking into account all the thermal power exchanges such as convective (conv), radiative (rad), and conductive (cond) powers Q. The incident thermal power on the surface of the PV module is transmitted to the different layers (G1, G2, G3, and G4) on the basis of absorption and transmission coefficients. The summary of these thermal balances can be expressed as:
where K represents the ratio between the area of silicon of the PV cells and the total PV module area.
In addition to the previous thermal balances (Equation (3)), in the case of the PV module with energy storage, the thickness of the batteries (batt) can be taken into account as:
where Qcond,al+batt is the conductive heat transfer between the battery layer and aluminum sheet.
2.3. Convective and Radiative Coefficients
Convective and radiative coefficients are calculated according to the geometry of the PV module and ambient conditions such as wind speed, air temperature, and ground temperature.
The convective heat exchange is given by:
being hconv [W/(m2 K)] the convective coefficient, A the exchange area (m2), ΔT the difference between two surfaces at different temperatures, L the characteristic length of the geometry of the PV module (area/perimeter), k the thermal conductivity of the fluid for a reference temperature [W/(m K)], and Nu the dimensionless Nusselt number. In addition to the Nusselt number, the following numbers are helpful in order to determine the heat transfer:
where the Prandtl number (Pr) gives the information about the type of fluid. It also provides information about the thickness of the thermal and hydrodynamic boundary layer. Reynolds number (Re) gives information about whether the flow is inertial or viscous force dominant, in order to determine if the flow is laminar or turbulent. The Grashoff number (Gr) is used in the correlation of heat and mass transfer due to the thermally induced natural convection of a solid surface immersed in a fluid. The Rayleigh number (Ra) is defined as the product of the Grashof number and the Prandtl number, and it describes the relationship between momentum diffusivity and thermal diffusivity. Parameters of interest in (Equation (6)) are: dynamic viscosity v (m2/s); thermal diffusivity α (m2/s); gravity acceleration g (m/s2); isobaric compression ratio β (1/K); temperature difference ΔT, and wind speed u (m/s). All these thermal properties are evaluated at the reference temperature Tref = (Ta + Tw)/2, where Ta is the air temperature (i.e., the fluid that is surrounding the PV module) and Tw is temperature of the surface under consideration (K).
The transition from laminar to turbulent flow was determined by the critical values (cr): Racr = 109, Recr = 105, Grcr = 109. Measurements were taken when the wind speed was not too high, so Reynolds number was usually Re < Recr. In this way Nusselt number for forced convection is empirically calculated as [14]:
In natural convection, empirical Churchill and Chu formulas are used to calculate the convective coefficient for the PV module front and back surfaces. The Churchill–Bernstein equation is valid for a wide range of Reynolds and Prandtl numbers, and it can be used for any object of cylindrical geometry in which boundary layers develop freely, without constraints imposed by other surfaces [15], leading to:
Note that the Nusselt number (Equation (8)) does not change in a forced convection field, whereas it does change from the front to back sides of the PV module in natural convection. For the back side, Nu has to hold on gravity force, so it is important to correct the Rayleight number with a coefficient g cosβ [13]. The g is the acceleration due to gravity, and the cosβ is the tilt angle of PV module. The buoyancy force on the tilt plane has to be divided into parallel and perpendicular components. On the front side these components do not interfere with the fluid and both contribute to the natural heat exchange. However, on the back side, the speed of the fluid interferes with the surface. The ratio between the Grashoff number (Gr) and the second power of the Reynolds number (Re2) is calculated and, according to Gr/Re2, evaluates the nature of convection: natural, forced or mixed [14]: Gr/Re2 ~ 1 means mixed convection; Gr/Re2 >> 1 natural convection; Gr/Re2 << 1 forced convection. In the case that convection is mixed and the flows of natural and forced convection are in opposition, the largest Nu is considered to be the proper value. In the case that the flows in mixed convection are not in opposition, Nu is considered as:
In order to estimate the PV cell temperature, it is important to correctly state the physical problem of the heat exchanges between the two plates, and in particular the convection exchanges. The temperature of the air standing around the planes is taken into account in this paper, and for this reason natural convection is considered. Figure 4 shows the geometric arrangement used to calculate the natural convection between two plane plates (i.e., backsheet and battery), where Tb is the temperature of the backsheet, and Tbatt-b is the temperature of the battery, L1 and L2 are the dimensions of the first and the second plane, respectively.
According to [14], the Ra number is given by:
where Tw* (K) is the average temperature of the plates. The Nu number can be evaluated considering the case of two opened planes surrounded by air, as follows [14]:
By these assumptions, air temperature Ta, backsheet temperature Tb, and battery temperature Tbatt-b are taken into account. It should be considered that the critical value of the Ra number has never reached (Ra < Racr = 105), which justifies the validity of this approach.
The radiative heat exchange (Qrad) is simplified by considering parallel planar bodies with the same area (A), and the radiative heat coefficient (hrad) is calculated with reference to the unity view factor (i.e., F12 = 1), leading to:
where T1 and T2 are the surface temperatures (K), ε1 and ε2 are the corresponding emissivity coefficients, and σ is the Stephan-Boltzmann constant [5.67 × 10⁻⁸ W/(m2 K4)]. Equation (13) is used to evaluate all the radiative exchanges, i.e., sky-PV front side, backsheet-ground, backsheet-aluminum plate, battery-ground, considering the corresponding areas.
3. Models Results and Measurements
3.1. Simulink Thermal Models
A one-dimensional thermal model was implemented by the thermal library of Simulink-Matlab. By properly setting the boundary conditions, it was possible to calculate the temperature between layers and surfaces, with particular reference to PV cells and batteries. The schemes of the thermal models under consideration are depicted in Figure 5, with reference to the commercial PV module (Figure 5a) and the modified PV module with battery energy storage (Figure 5b). This last model makes reference to the area corresponding to the batteries.
Temperatures Ta, Ts and Tg were set by thermal blocks as ideal temperature sources. Thermal fluxes through the different layers (G1, G2, G3 and G4) were modeled by ideal heat flux sources. All the heat exchanges were modeled according to the previous sections, properly setting the parameters. Temperatures of the different thermal nodes were detected and displayed by ideal temperature sensors.
3.2. Thermal Model Validation
In order to validate the proposed Simulink thermal model, the calculated temperature of the PV cell was compared with the NOCT given by the PV module manufacturer. The environment parameters defining the NOCT were: wind speed 1 m/s; air temperature 20 °C; solar radiation 800 W/m2; tilt angle of PV module 45°. In the case study, NOCT = 46 °C (the temperature-power coefficientis−0.52%/°C). The corresponding PV cell temperature obtained by the Simulink thermal model (without storage batteries) was ≈45 °C, with an acceptable matching.
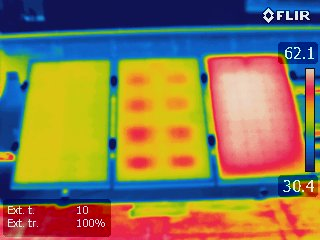
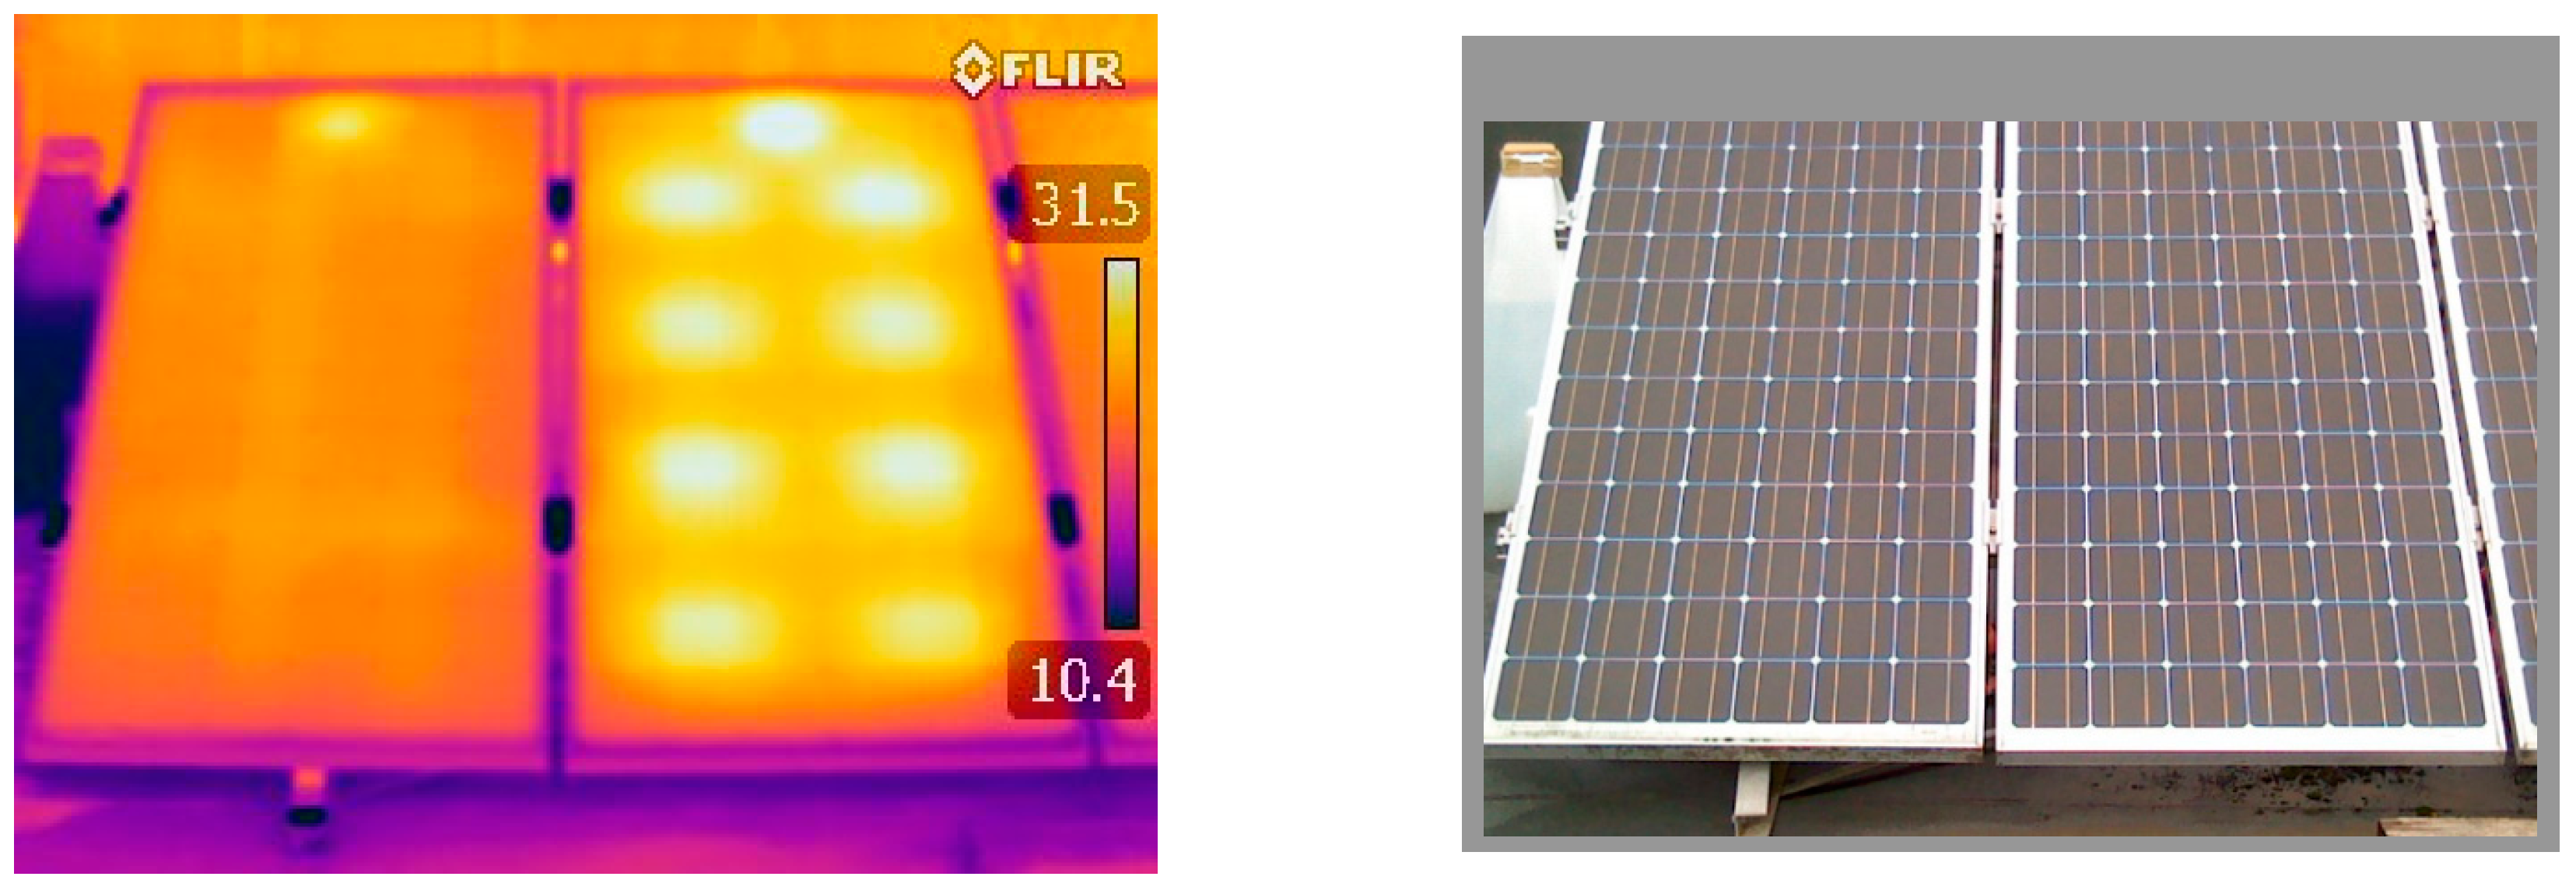
Thermal models were also validated by experimental measurements on real PV module prototypes, with and without the battery storage system, using a thermographic camera, an anemometer, and a few thermometers. At first, the thermographic camera was set up with precision in consideration of the reflected temperature compensation (RTC), distance of object, relative humidity, and air temperature. After these settings were established, several thermal pictures were taken, and the temperatures were compared. Some example results are given in Figure 6 and Figure 7. It is interesting to notice that, as expected, front surface temperature increased in the area corresponding to the back side battery areas (Figure 6). Measurements were taken in different ambient conditions and thermal pictures of both front and back sides of PV module were taken, for both the cases with and without storage batteries. The hotspots introduced in the PV module by the batteries obviously cause a slight decrease in the voltage of the corresponding PV cells (approx. −0.5%/°C), and a general decrease in the PV module power and efficiency [16].
Temperatures estimated by the thermographic camera (Tf, Tb, Tbatt-b, Tbatt-g) were properly averaged, and compared to the corresponding temperatures obtained by the thermal model. In general, the matching was satisfactory in the areas without the batteries, the difference in temperature being in the order of 1 °C. In the areas occupied by the batteries the difference was in the order of 3 °C. The difference was greater in the model with the batteries, but it was still somewhat acceptable, considering that all the edge effects were neglected in the 1D thermal model.
An additional validation, only for the model without batteries, was made comparing the PV cell temperature obtained by the Simulink thermal model to the corresponding values calculated with the formula [17] using the NOCT, where Ta and Gn were typical for the given month. In this case, again, the matching was satisfactory with the difference of temperature being within 1 °C.
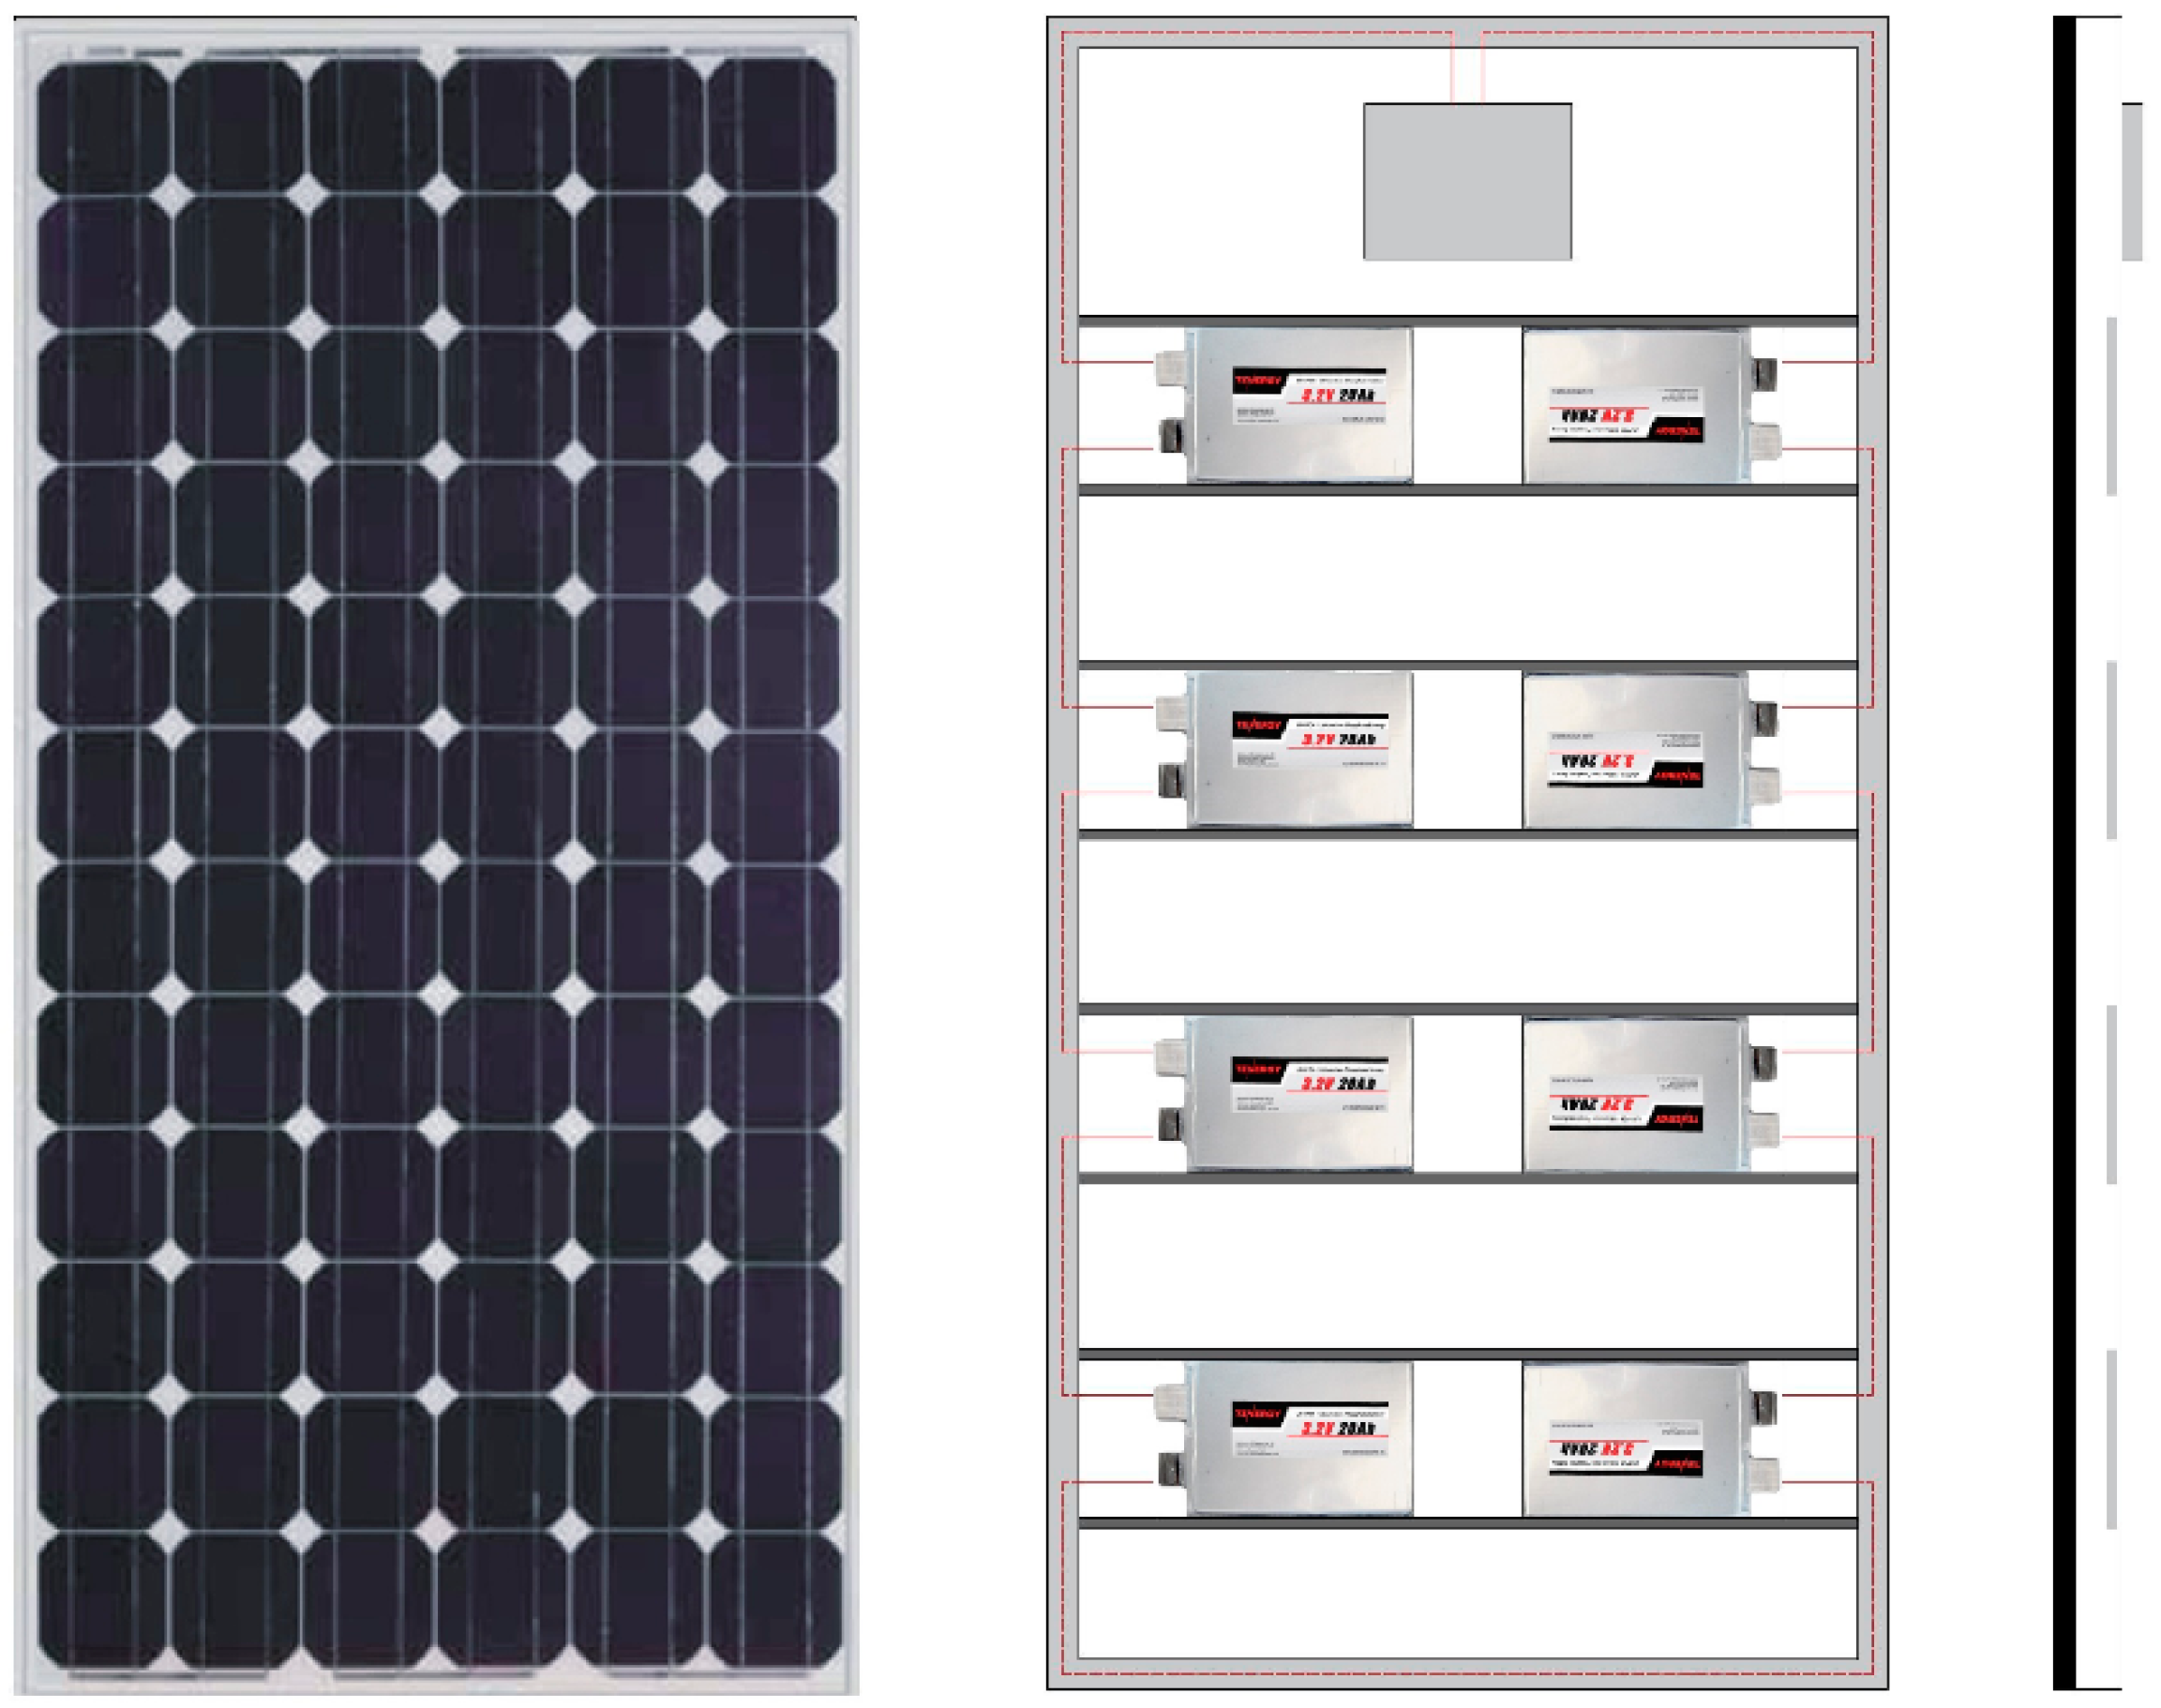
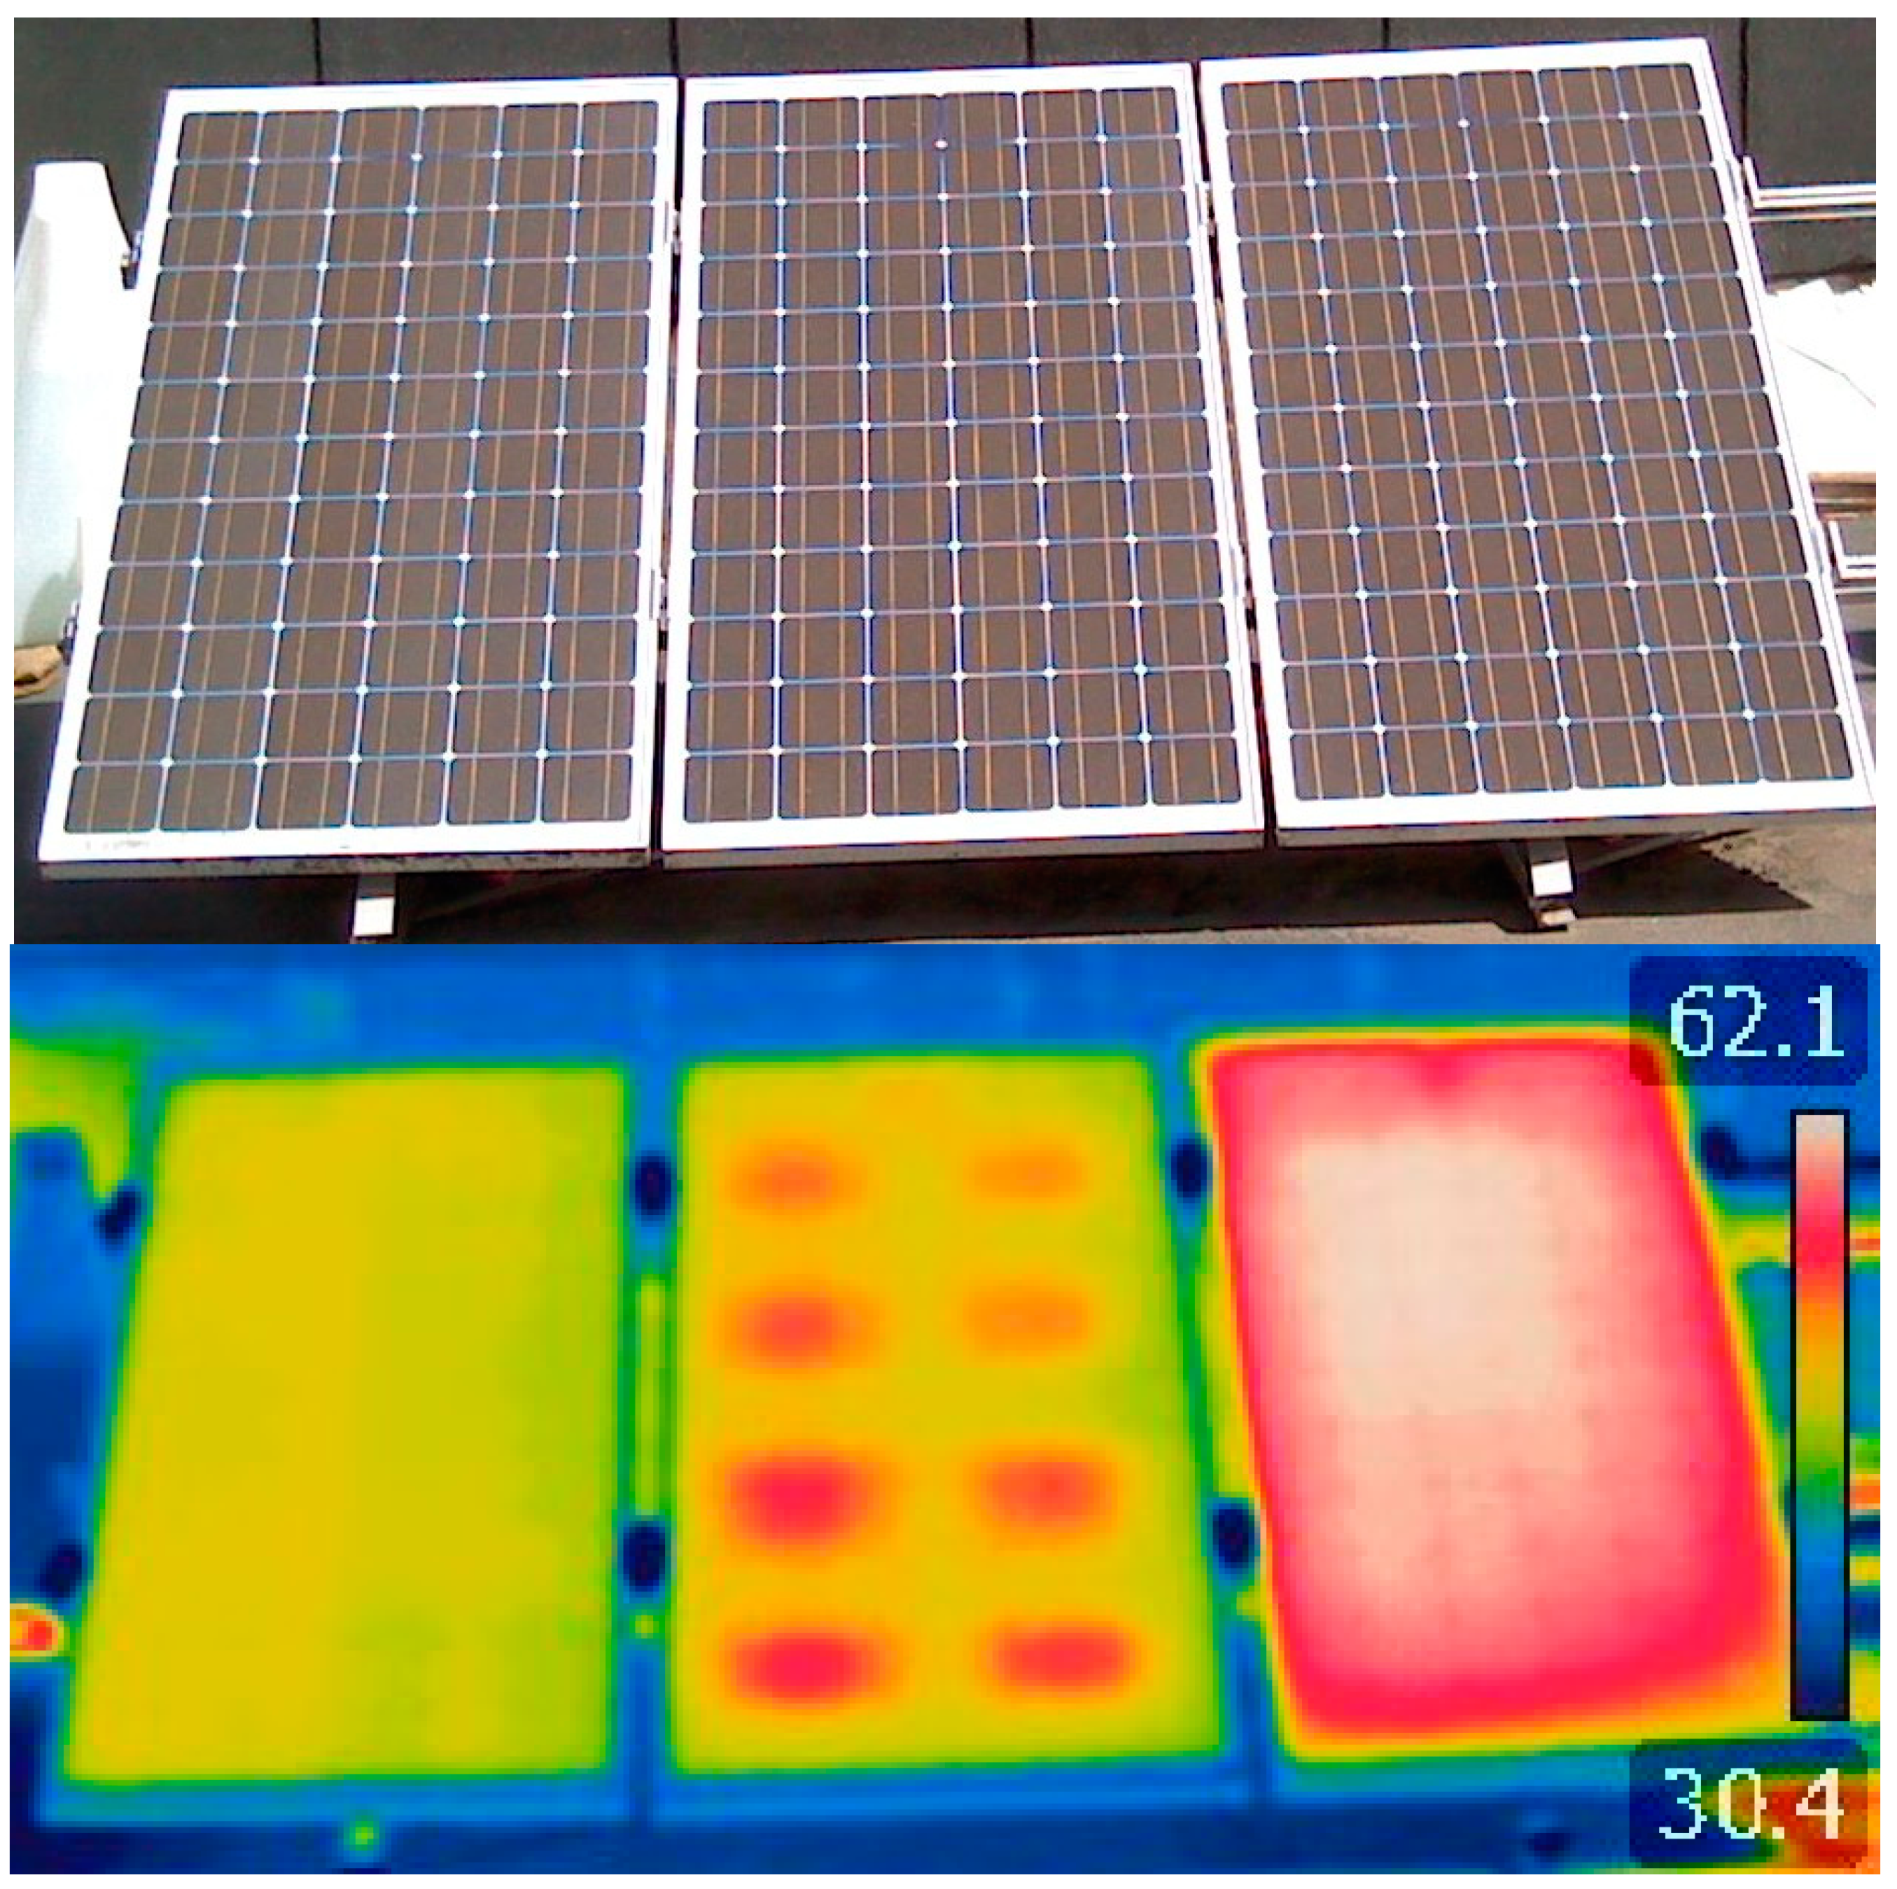
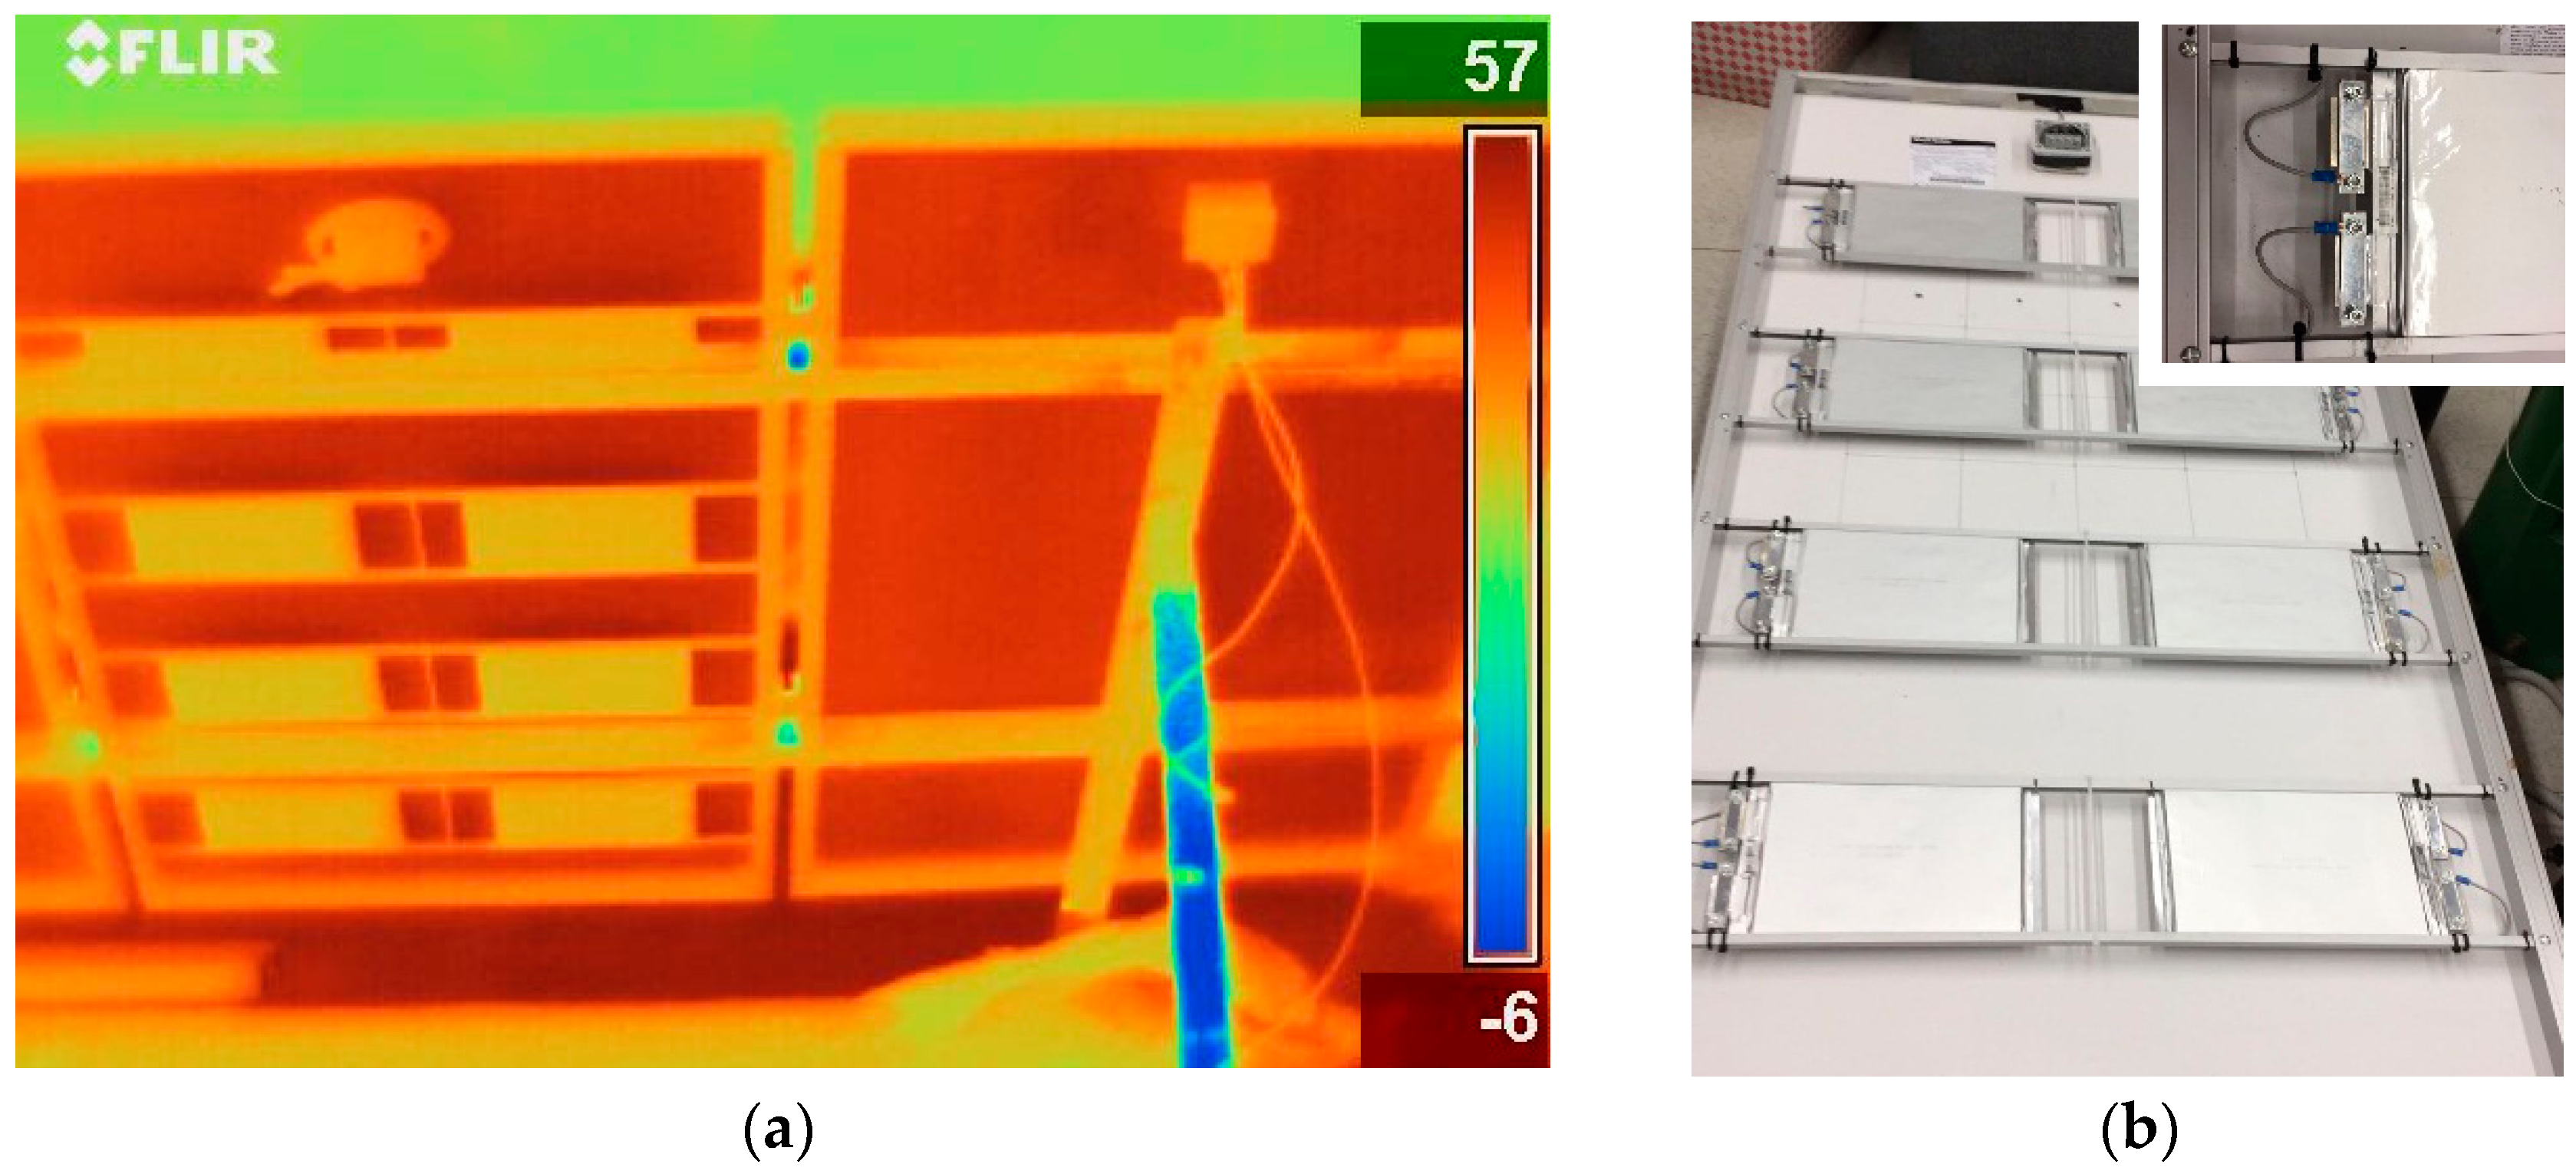
Figure 8 shows the measured thermal behavior of the PV modules with and without the mounted battery storage system, and with an external flat panel completely covering the backsheet. Figure 9 shows further details about back side module thermal behavior (with and without BESS) and the mounted battery with relative layout.
4. Temperature Extrapolation
In order to determinate the over-temperature limit of PV cells due to the battery placement in the back side of the commercial PV module in different environmental conditions, the proposed thermal models were evaluated by setting different inputs (Ta and Gn) corresponding to the average temperature for each month of the year, at the solar midday. Specifically, the reference conditions are in accordance with an installation of Bologna, Italy (latitude 44°30′, tilt angle of PV modules 30°). Concurrently, the temperature of the batteries was determined in order to verify the restrictions given by the manufacturer. Thermal powers G1, G2, G3 and G4 were calculated according to Equation (3). Wind speed was set to 1 m/s for both the front to back sides of PV module (i.e., mixed convection).
Table 3 shows the resulting temperatures for each month, in the worst case scenario without electric power conversion (open circuit, Ppv = 0). In particular, for the commercial PV model (without batteries) Tf, Tc,pv, and Tb represent the front, PV cell, and back temperatures, according to Figure 3. The same temperatures are shown for the two relevant regions of the modified PV module with integrated energy storage: the area covered by the batteries, and the remaining area (not covered by batteries). In this case, the average PV cell temperature Tc,pv+batt was calculated as the weighted average of Tc,pv in the two regions, with respect to the size of the corresponding areas. The temperatures of the batteries were considered as well, both of the backsheet and the ground side (Tbatt-b and Tbatt-g), according to Figure 3. In the end, the over-temperature ΔT was calculated to illuminate the difference in PV cell temperatures between the original commercial PV module and the modified one with the integrated energy storage.
Regarding the modified PV module with integrated energy storage, the thermal exchanges related to the area not covered by batteries were treated similarly to the case of the commercial PV module without batteries. In this case, a reduced convective coefficient (decreased to 20%) was taken into account, and a unity view factor for the radiative exchange with the ground was still assumed, but a reduced radiative surface was assumed (decreased to 80%).
Table 3 shows that the thermal radiation shield (aluminum plates) causes an important increase in the PV cell temperature in the area covered by batteries, in the order of 20 °C. However, because of this shield, the over-temperature of the batteries compared to the air was limited to 5–10 °C, and the temperature of the batteries didn’t exceed 40 °C, far from the limit given by the manufacturer for this type of storage element (i.e., max 50–55 °C).
Table 3 referred to the worst case scenario of open circuit operation. Table 4 shows the temperature in the case of active PV conversion (η = 12%) in order to understand the corresponding decrease, estimated at about 4–5 °C over the year. In general, with or without PV conversion, the average PV cell temperature over the module area in the case of energy storage exceeds the corresponding temperature of the commercial PV module of 10–15 °C.
The last column of Table 4 reports the decrease (in percent) of the electric power produced by the PV module with integrated storage batteries, obtained in consideration of the over-temperature ΔT and the temperature-power coefficient (−0.52%/°C) for the case study. Corresponding to Table 4, Figure 10 shows the power produced by the PV module with integrated storage batteries (in percent) compared to the power produced by the original PV module without the batteries. It should be noted that the decrease is rather noticeable, in the order of 6%, but this is representing the worst case scenario (i.e., the highest daily radiation and temperature considered for each month at solar midday on a sunny day).
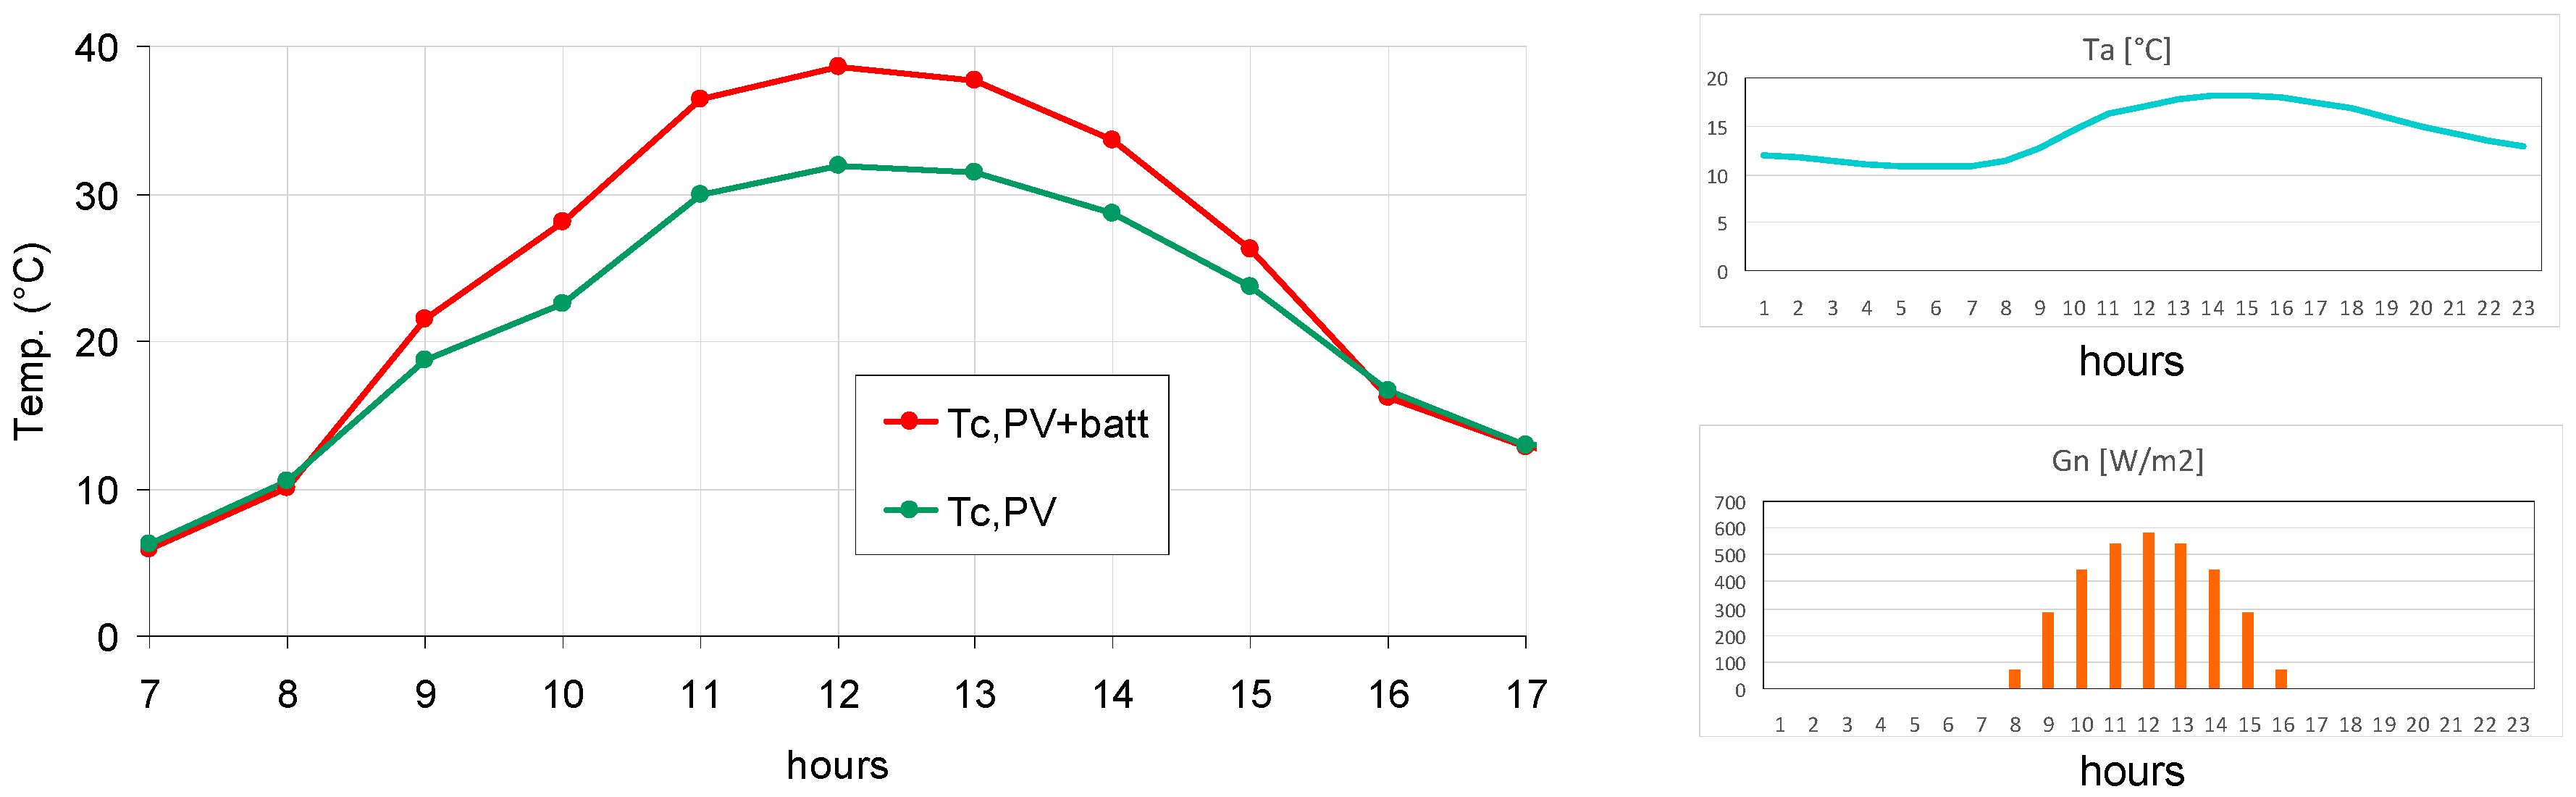
As a further example of the application of the proposed thermal model, the daily profile of the PV cell’s temperature (averaged over the PV module area) with and without integrated storage batteries is given in Figure 11. Weather conditions were assumed to be a typical sunny day in Bologna on April 15.
5. Conclusions
The thermal analysis of a commercial PV module with an integrated energy storage system has been carried out in this paper. Energy storage was implemented by a set of thin flat batteries placed on the back side of the module, without exceeding the original thickness of the aluminum frame. An airgap was intentionally introduced between the batteries and backsheet, for the sake of air cooling, with a thermal radiation shield to prevent overheating of the batteries. The thermal analysis was carried out by introducing a simplified 1D thermal model for the PV module, with and without the batteries.
Thermal models were numerically implemented by Simulink/Matlab, and different verification tests were carried out to validate the model results. Both PV cells and batteries temperature were extrapolated by the proposed thermal models, considering the different environmental conditions within the 12 months of the year (using midday values). In general, it has been proved that the batteries’ temperature does not exceed 40 °C, which leaves a safety margin as compared to the maximum operating temperature given by the manufacturer (50–55 °C).
As expected, despite the cooling airgap, there is a remarkable PV cell temperature increase introduced by the back side batteries, estimated at 20–25 °C for the PV cells on the battery area. Considering the average PV cell temperature over the whole PV module, this increment is reduced to 10–15 °C, representing a reasonable over-temperature in terms of the restriction of the PV conversion efficiency. A first estimation of the electric power decrease in real operating conditions is in the order of 6%, considering the worst case scenario for each month of the year (solar midday on a sunny day).
By the proposed thermal model, the analysis can be readily extended to the average PV module temperature over the whole year in order to precisely estimate the reduction in annual production of electric energy and to evaluate the overall performance of the integrated PV generation-storage system. A more detailed investigation of the electrical performance over the whole year will be the subject of a future paper.
Author Contributions
ManelHammami was the corresponding author and, with Simone Torretti, contributed to the manuscript composition, model developments, and thermal measurements. Simone Torretti also implemented and simulated the system by Simulink. Francesco Grimaccia and Gabriele Grandi supervised the manuscript composition and the experimental tests, carried out at the Department of Electrical, Electronic and Information Engineering, University of Bologna (Italy).
Conflicts of Interest
The authors declare no conflict of interest.
References
- Thang, T.V.; Ahmed, A.; Kim, C.; Park, J. Flexible System Architecture of Stand-Alone PV Power Generation with Energy Storage Device. IEEE Trans. Energy Convers. 2015, 30, 1386–1396. [Google Scholar] [CrossRef]
- Li, P.; Dargaville, R.; Cao, Y.; Li, D.-Y. Storage Aided System Property Enhancing and Hybrid Robust Smoothing for Large-Scale PV Systems. IEEE Trans. Smart Grid 2016. [Google Scholar] [CrossRef]
- Reddy, S.S.; Momoh, J.A. Realistic and Transparent Optimum Scheduling Strategy for Hybrid Power System. IEEE Trans. Smart Grid 2015, 6, 3114–3125. [Google Scholar] [CrossRef]
- Fath, H.; Al Tarabsheh, A.; Ghazal, A.; Asad, M.; Morci, Y.; Etier, I.; El Haj, A. Performance of Photovoltaic Cells in Photovoltaic Thermal (PVT) Modules. IET Renew. Power Gener. 2016, 10, 1–7. [Google Scholar]
- Khelifa, A.; Touafek, K.; Ben Moussa, H. Approach for the Modelling of Hybrid Photovoltaic–thermal Solar Collector. IET Renew. Power Gener. 2015, 9, 207–217. [Google Scholar] [CrossRef]
- Xu, X.; Meyers, M.M.; Sammakia, B.G.; Murray, B.T.; Chen, C. Performance and Reliability Analysis of Hybrid Concentrating Photovoltaic/thermal Collectors with Tree-Shaped Channel Nets’ Cooling System. IEEE Trans. Compon. Packag. Manuf. Technol. 2013, 3, 967–977. [Google Scholar] [CrossRef]
- Grandi, G.; Rossi, C.; Hammami, M. Modulo Fotovoltaico con Sistema di Accumulo Integrato (PV Module with Integrated Energy Storage); Patent Deposit Number A28517 LCA.gf; Alma Mater Studiorum, University of Bologna: Bologna, Italy, 2016. [Google Scholar]
- Hu, Y.; Cao, W.; Ma, J.; Finney, S.J.; Li, D. Identifying PV Module Mismatch Faults by a Distribution Analysis. IEEE Trans. Device Mater. Reliab. 2014, 14, 951–960. [Google Scholar] [CrossRef]
- Bardhi, M.; Grandi, G.; Tina, G.M. Comparison of PV Cell Temperature Estimation by Different Thermal Power Exchange Calculation Methods. In Proceedings of the International Conference on Renewable Energies and Power Quality (ICREPQ’12), Santiago de Compostela, Spain, 28–30 March 2012. [Google Scholar]
- Tina, G.M.; Scrofani, S. Electrical and Thermal Model for PV Module Temperature Evaluation. In Proceedings of the Mediterranean Electrotechnical Conference, MELECON, Ajaccio, France, 5–7 May 2008; pp. 585–590. [Google Scholar]
- Bardhi, M.; Grandi, G.; Premuda, M. Steady State Global Power Balance for Ground- Mounted Photovoltaic Modules Ground-Mounted Photovoltaic Modules. In Proceedings of the Third International Renewable Energy Congress, Hammamet, Tunisia, 20–22 December 2011; pp. 359–365. [Google Scholar]
- Hemenway, D.; Sakurai, H.; Sampath, W.; Barth, K. Thermal Modeling of PV Modules Using Computational Simulation. In Proceedings of the IEEE 40th Photovoltaic Specialist Conference, Denver, CO, USA, 8–13 June 2014; pp. 1344–1347. [Google Scholar]
- Chen, Y.; Zhuo, F.; Liu, X.; Xiong, L. Thermal Modelling and Performance Assessment of PV Modules Based on Climatic Parameters. In Proceedings of the IEEE Energy Conversion Congress and Exposition (ECCE), Montreal, QC, Canada, 20–24 September 2015; pp. 3282–3286. [Google Scholar]
- Guyer, E.C. Handbook of Applied Thermal Design; CRC Press: Boca Raton, FL, USA, 1999. [Google Scholar]
- Adrian, B. Convective Heat Transfer, 4th ed.; Wiley: Hoboken, NJ, USA, 2013. [Google Scholar]
- Hu, Y.; Cao, W.; Wu, J.; Ji, B.; Holliday, D. Thermography-Based Virtual MPPT Scheme for Improving PV Energy Efficiency under Partial Shading Conditions. IEEE Trans. Power Electron. 2014, 29, 5667–5672. [Google Scholar] [CrossRef]
- Romary, F.; Caldeira, A.; Jacques, S.; Schellmanns, A. Thermal Modelling to Analyze the Effect of Cell Temperature on PV Modules Energy Efficiency. In Proceedings of the 2011 14th European Conference on Power Electronics and Applications (EPE 2011), Birmingham, UK, 30 August–1 September 2011; pp. 1–9. [Google Scholar]
Figure 1.
Rendering of the PV module with integrated batteries on the back side.

Figure 2.
Heat exchanges of PV module: (a) without battery storage system; (b) with storage battery system. Gn is the specific radiation incident on the module’s surface (W/m2); Ppv (W) is the electrical power generation, proportional to the total incident power; η is the photovoltaic conversion efficiency; Grif is the total radiative power reflected from the surface of the PV module that is proportional to the reflection index ρ.
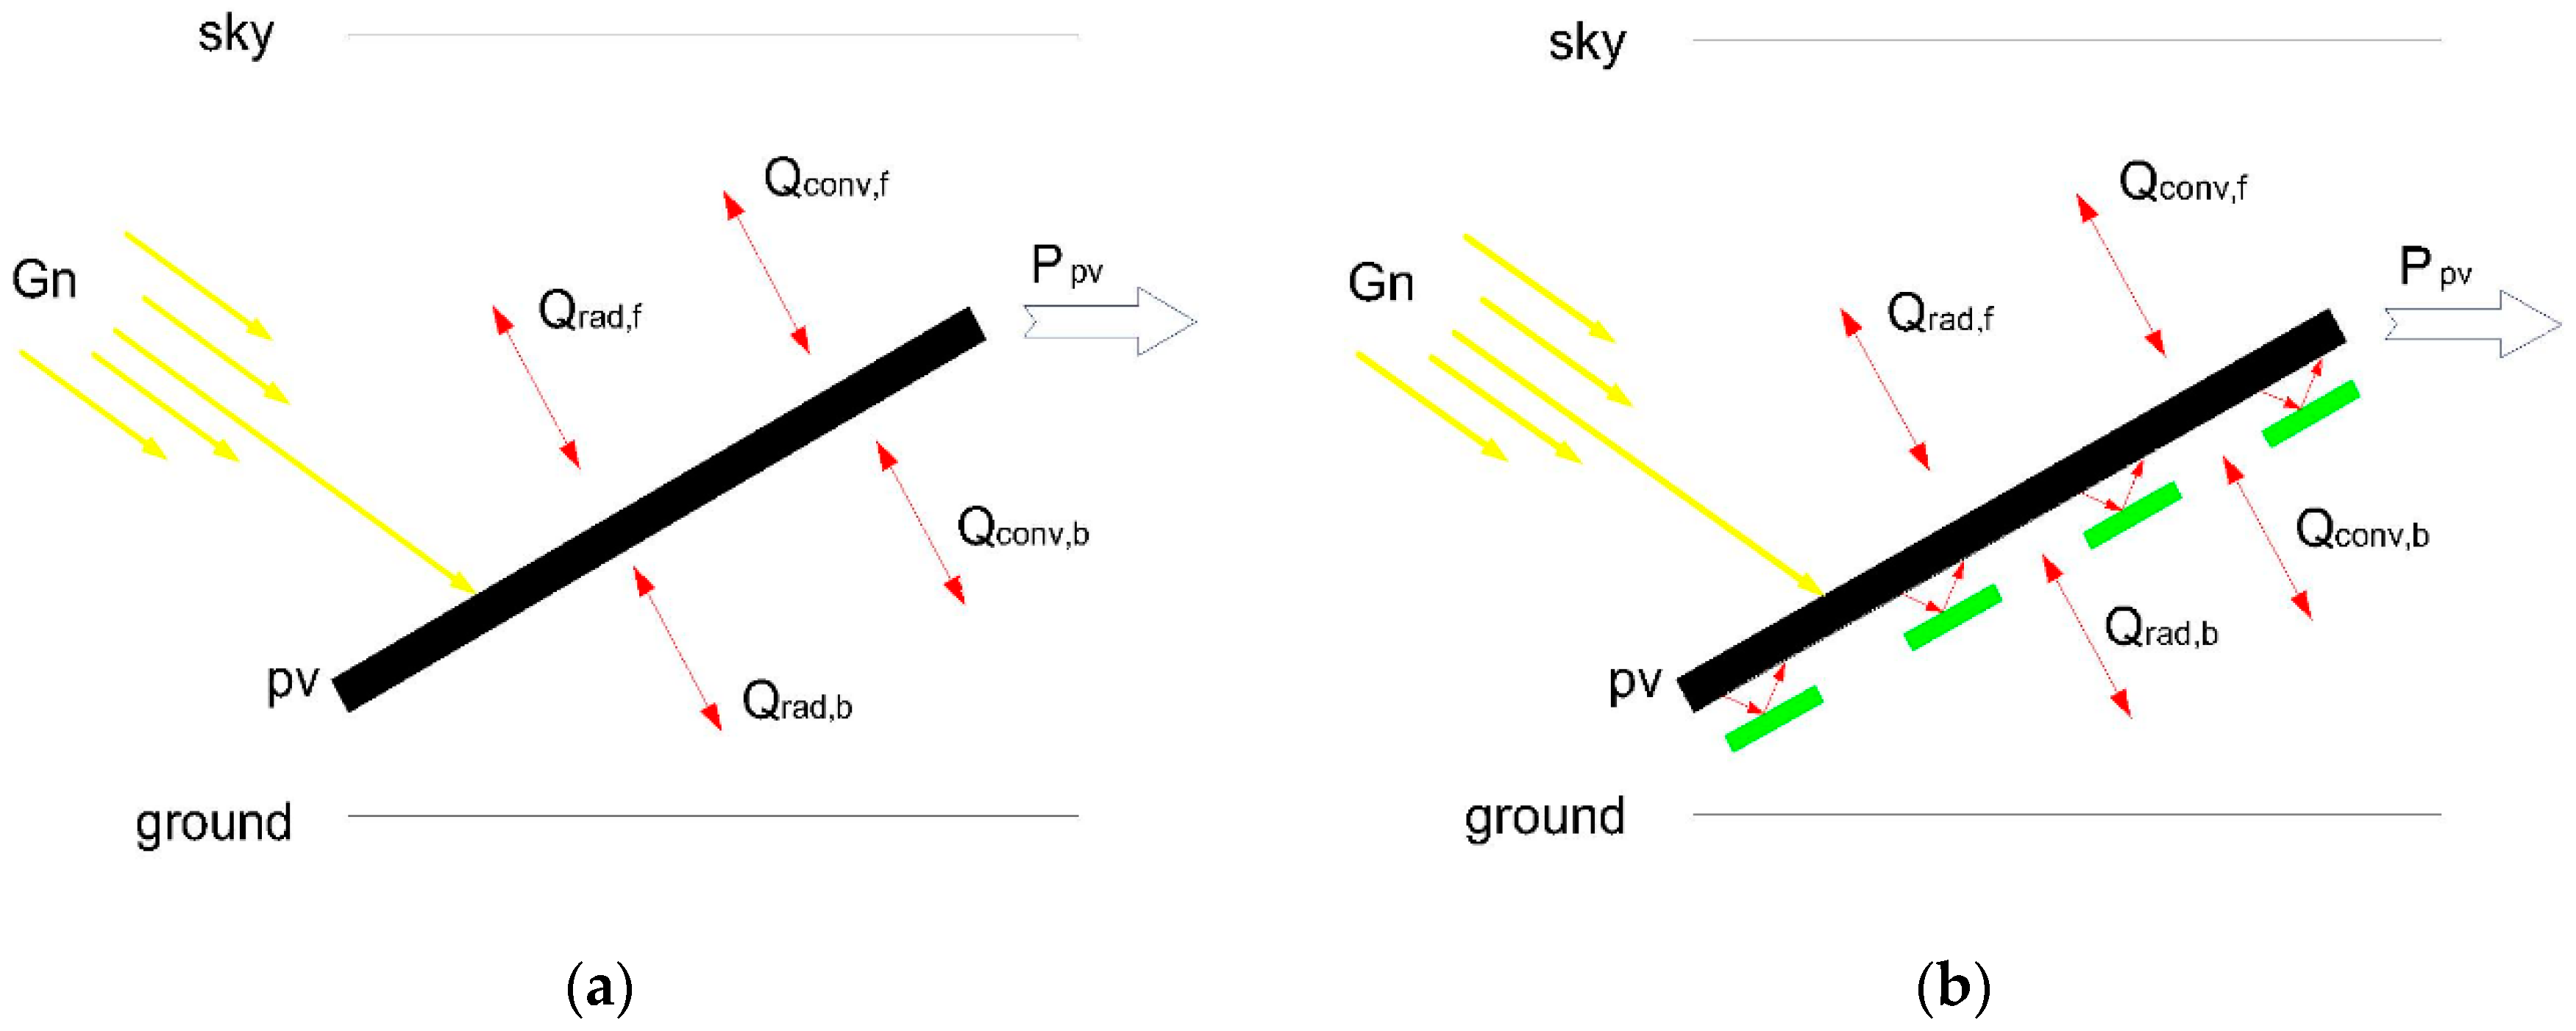
Figure 3.
Battery and PV module layers. T is temperature; b is backsheet; e is ethylene vinyl acetate (EVA); f is front side; g is ground and batt is battery.
Figure 3.
Battery and PV module layers. T is temperature; b is backsheet; e is ethylene vinyl acetate (EVA); f is front side; g is ground and batt is battery.

Figure 4.
Natural convection between plane plates (i.e., backsheet and battery). d is the distance between the PV unit and the battery; Tb is the temperature of backsheet; and Tbatt-b is the temperature of the battery; Ta is the temperature of the air; L1 and L2 are the dimensions of the first and the second plane, respectively.
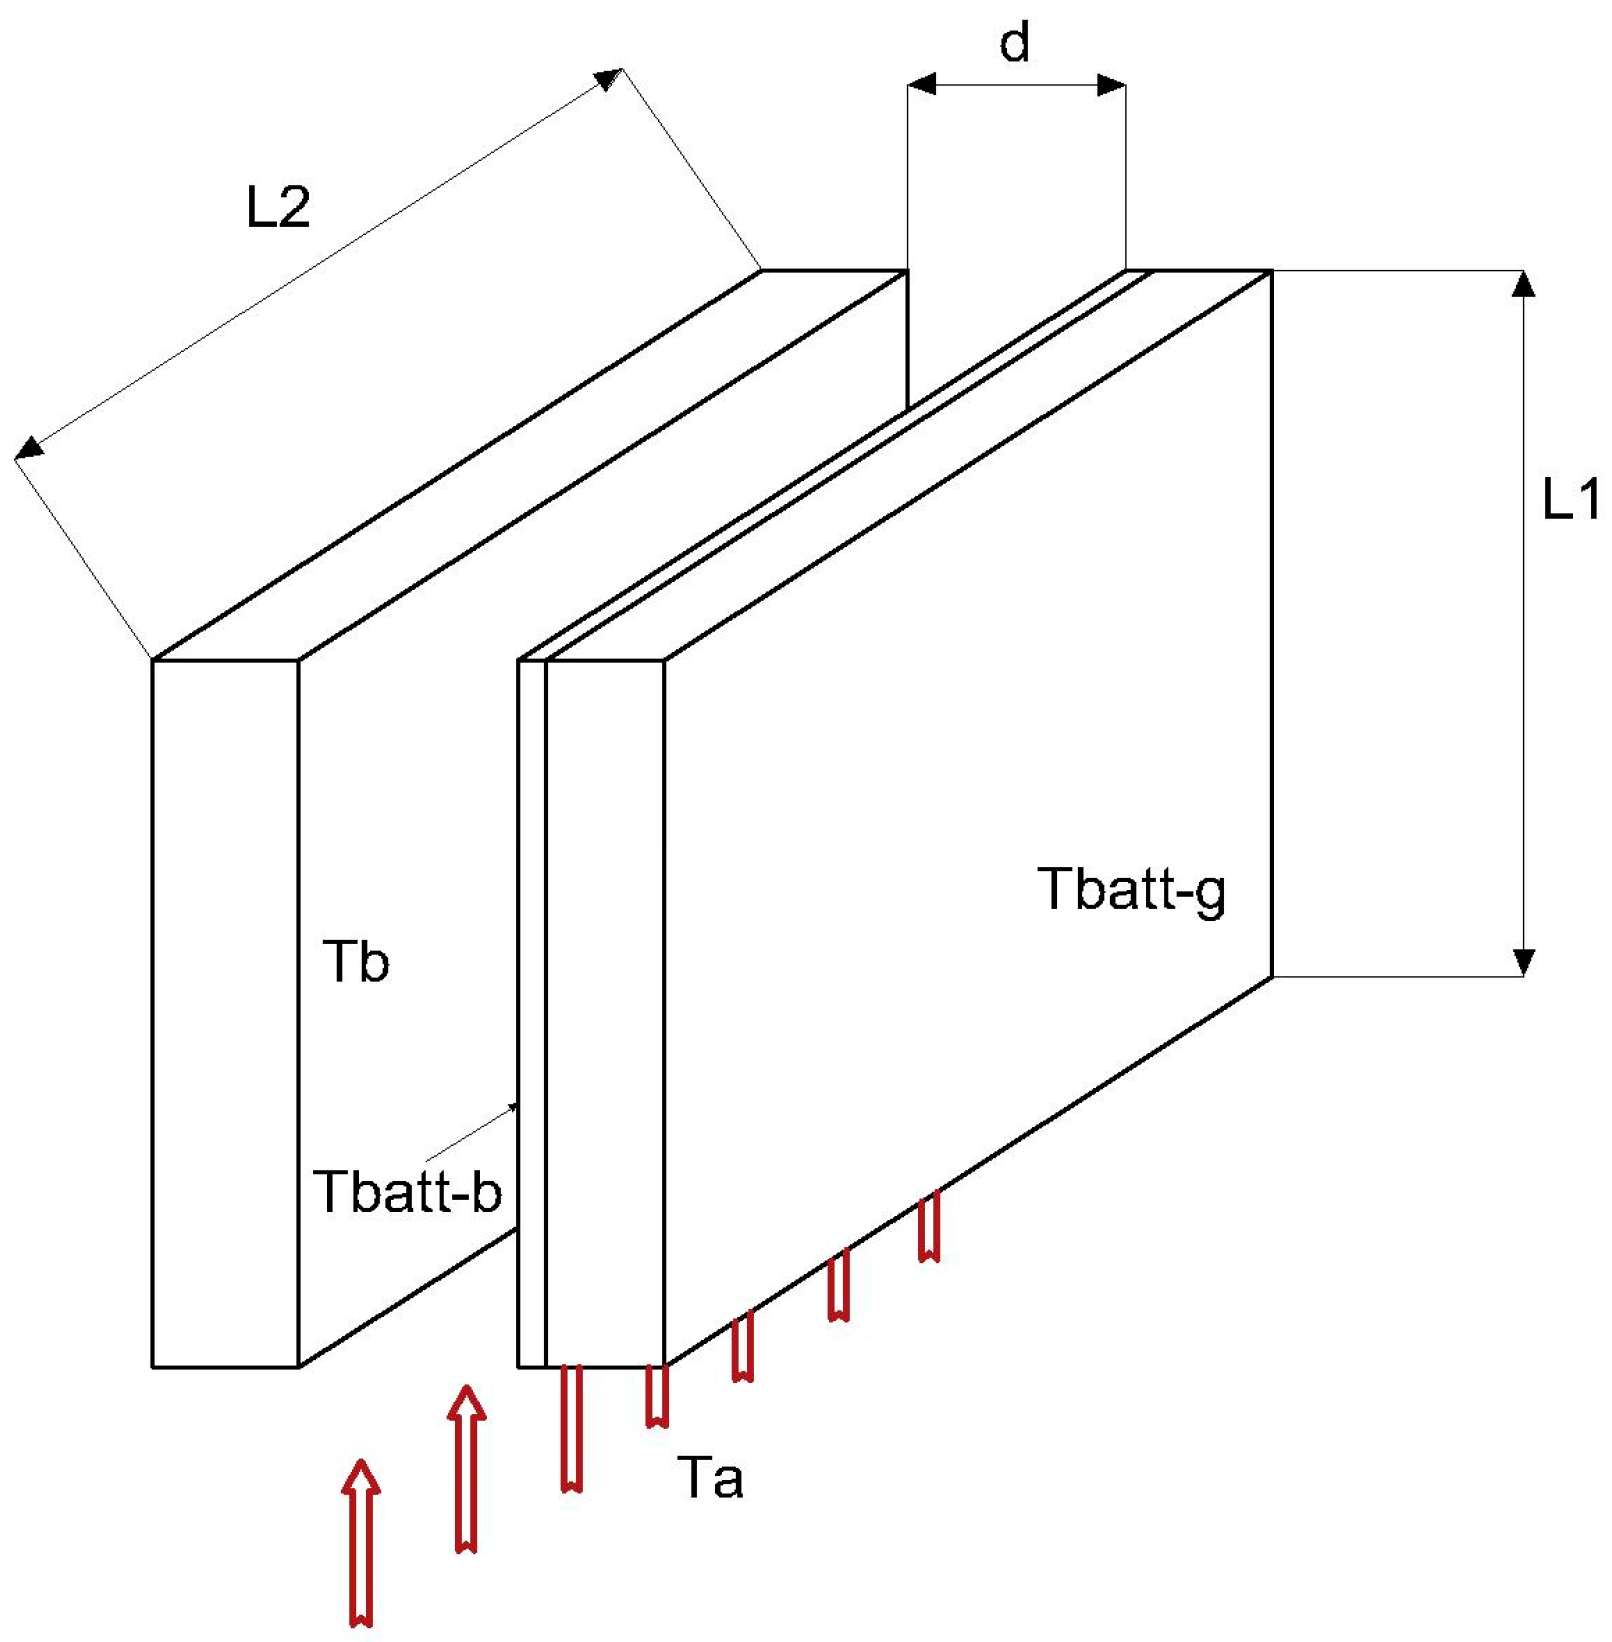
Figure 5.
Simulink thermal model without (a) and with (b) battery energy storage.
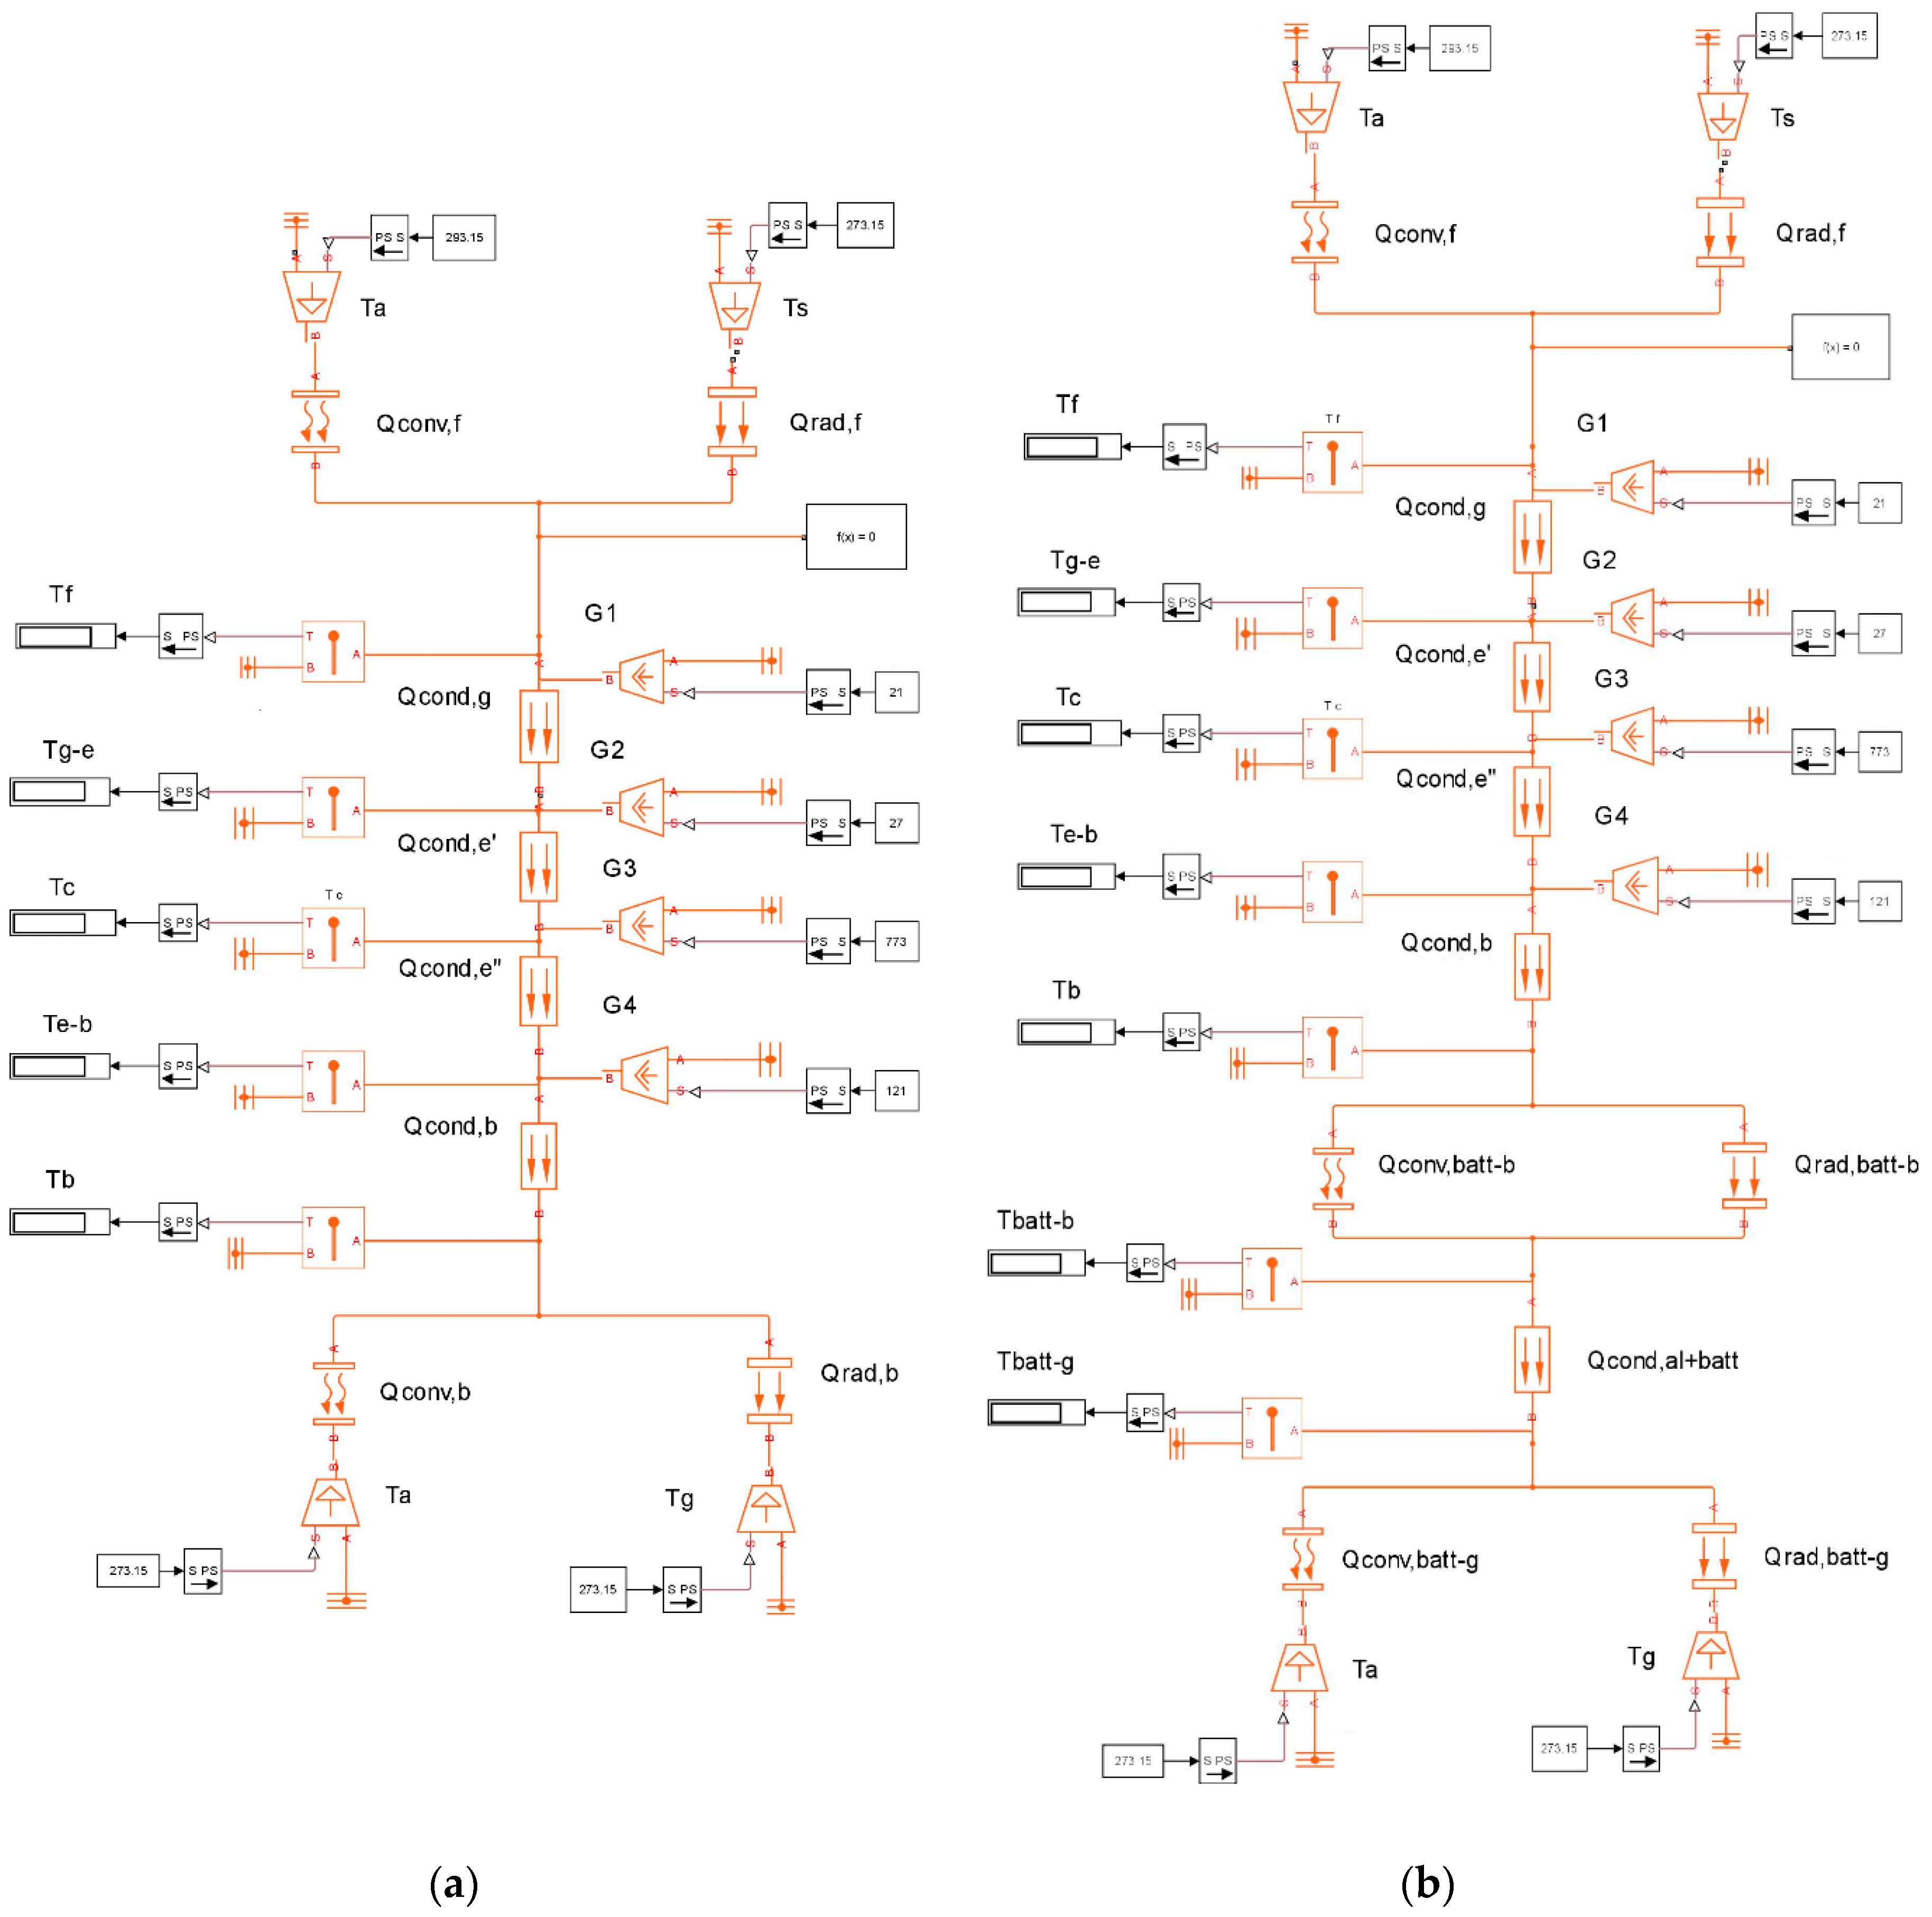
Figure 6.
Thermal (left) and visual (right) images of the PV modules with and without the battery storage system for ambient conditions Ta ≅ 8 °C and Gn ≅ 600 W/m2.
Figure 6.
Thermal (left) and visual (right) images of the PV modules with and without the battery storage system for ambient conditions Ta ≅ 8 °C and Gn ≅ 600 W/m2.

Figure 7.
Thermal images of front and back sides of the PV modules, with and without the battery storage system for ambient conditions Ta ≅ 15 °C and Gn ≅ 900 W/m2.
Figure 7.
Thermal images of front and back sides of the PV modules, with and without the battery storage system for ambient conditions Ta ≅ 15 °C and Gn ≅ 900 W/m2.
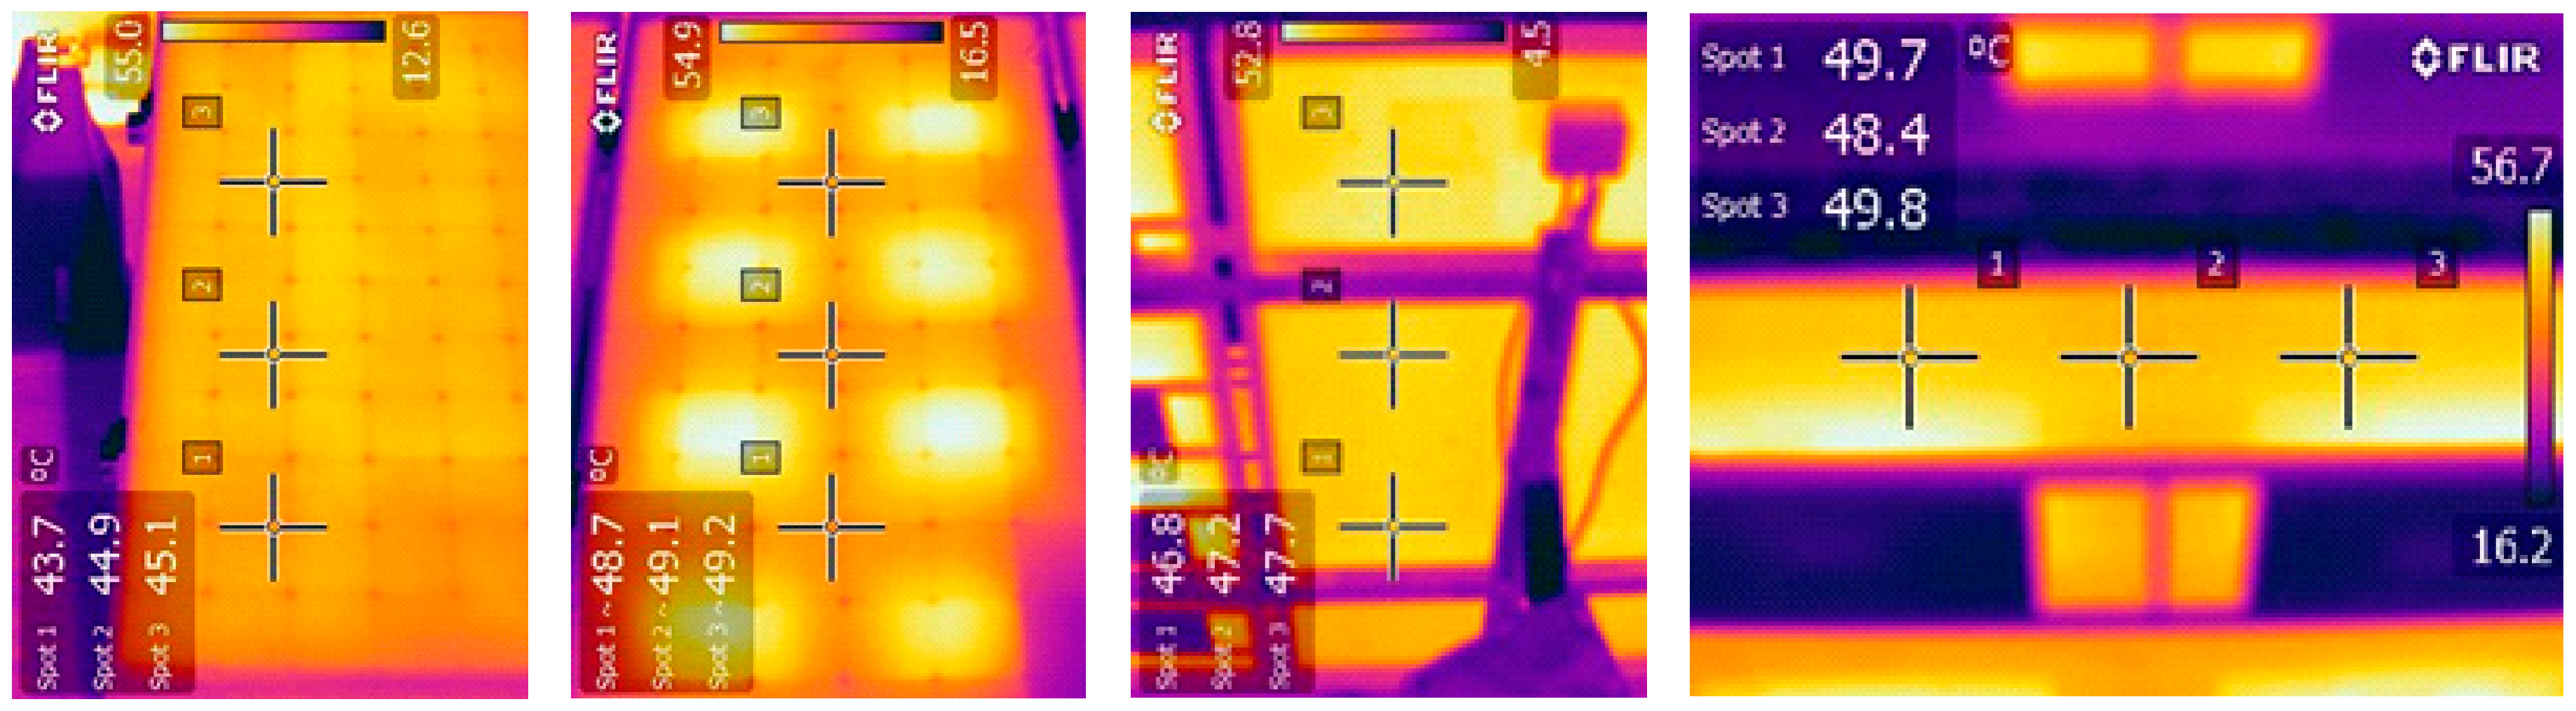
Figure 8.
Visual and thermal images of the PV modules: without (left) and with (center) the battery storage system, and with covered backsheet (right), for ambient conditions Ta ≅ 24 °C and Gn ≅ 800 W/m2.
Figure 8.
Visual and thermal images of the PV modules: without (left) and with (center) the battery storage system, and with covered backsheet (right), for ambient conditions Ta ≅ 24 °C and Gn ≅ 800 W/m2.

Figure 9.
Back side view details of PV modules: (a) thermal image with and without battery storage system; (b) visual picture of the installed battery and layout.
Figure 9.
Back side view details of PV modules: (a) thermal image with and without battery storage system; (b) visual picture of the installed battery and layout.

Figure 10.
Estimation of the power from the PV module with integrated storage batteries in % compared to the original PV module without batteries, corresponding to Table 4.
Figure 10.
Estimation of the power from the PV module with integrated storage batteries in % compared to the original PV module without batteries, corresponding to Table 4.
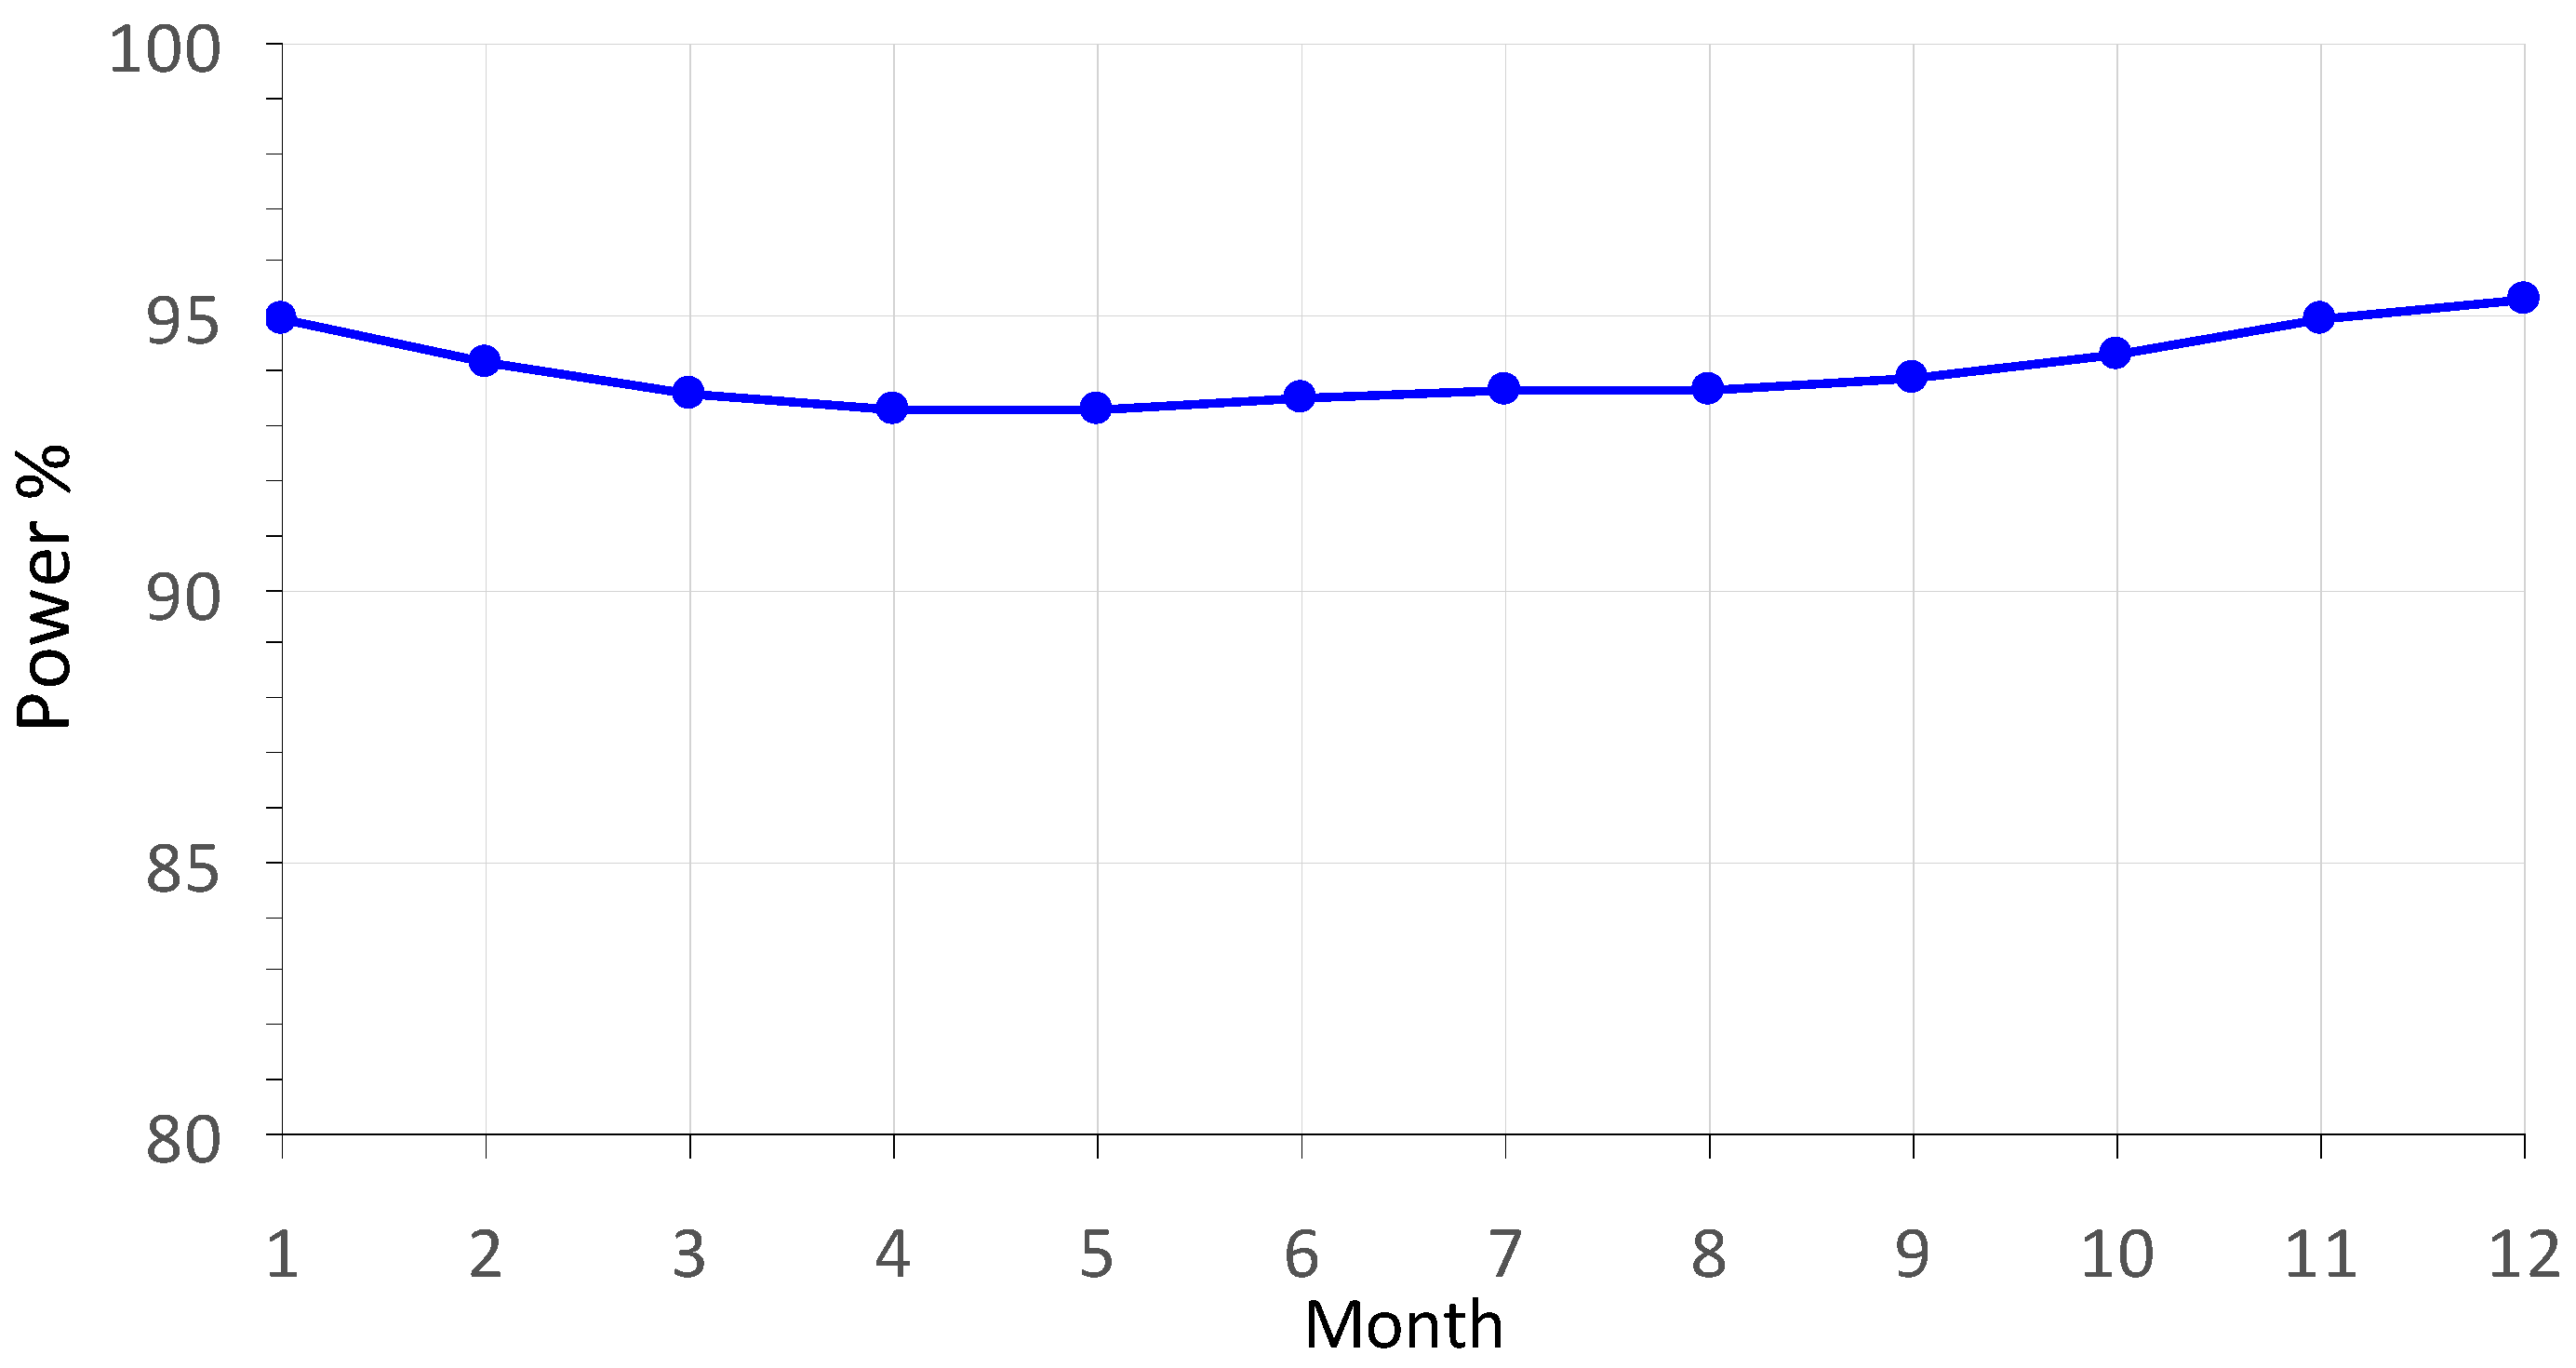
Figure 11.
Average PV cells temperature profile over the day (April 15) with and without integrated storage batteries, and corresponding air temperature (Ta) and sun irradiance (Gn).
Figure 11.
Average PV cells temperature profile over the day (April 15) with and without integrated storage batteries, and corresponding air temperature (Ta) and sun irradiance (Gn).


Table 1.
Thickness (s), thermal conductivity (k), and optical coefficients (ρ, τ, α) of the PV module layers.
Table 1.
Thickness (s), thermal conductivity (k), and optical coefficients (ρ, τ, α) of the PV module layers.
| Layer’s Material | s [mm] | k [W/(m·K)] | ρ | τ | α |
|---|---|---|---|---|---|
| Glass | 4.0 | 1.8 | 0.1 | 0.88 | 0.02 |
| Ethylene Vinyl Acetate (EVA) | 0.4 | 0.35 | - | 0.97 | 0.03 |
| Silicon PV cell | 0.4 | 150 | - | - | 1 |
| Backsheet | 0.3 | 0.3 | - | - | 1 |
Table 2.
Emissivity coefficients.
| ε | |
|---|---|
| PV module front surface (glass) (f) | 0.91 |
| PV module back surface (backsheet) (b) | 0.85 |
| Sky | 0.91 |
| Ground | 0.94 |
| Polished aluminum plates | 0.04 |
Table 3.
Environmental data and temperatures obtained by thermal models (open circuit, Ppv = 0).
| Commercial PV Module | Modified PV Module with Integrated Energy Sotrage | ||||||||||||||
|---|---|---|---|---|---|---|---|---|---|---|---|---|---|---|---|
| °C | W/m2 | Without Batteries (°C) | Area Covered by Batteries (°C) | Area Not Covered by Batt. (°C) | avg (°C) | (°C) | |||||||||
| Ta | Gn | Tf | Tc,pv | Tb | Tf | Tc | Tb | Tbatt-b | Tbatt-g | Tf | Tc | Tb | Tc,pv+batt | ΔT | |
| January | 2.9 | 741 | 26.6 | 27.7 | 27.2 | 42.6 | 44.6 | 44.5 | 9.3 | 9.3 | 33.9 | 35.4 | 35.1 | 38.9 | 11.2 |
| February | 5.8 | 869 | 33.4 | 34.8 | 34.1 | 52.0 | 54.3 | 54.2 | 13.3 | 13.3 | 41.7 | 43.4 | 43.0 | 47.5 | 12.8 |
| March | 12.1 | 994 | 42.7 | 44.3 | 43.6 | 63.6 | 66.2 | 66.1 | 20.3 | 20.3 | 51.5 | 53.5 | 53.0 | 58.3 | 14.0 |
| April | 17.0 | 1079 | 49.6 | 51.3 | 50.5 | 71.6 | 74.4 | 74.3 | 26.0 | 26.0 | 58.6 | 60.7 | 60.2 | 65.9 | 14.6 |
| May | 21.5 | 1106 | 54.2 | 55.9 | 55.6 | 76.4 | 79.3 | 79.2 | 30.3 | 30.2 | 63.0 | 65.2 | 64.6 | 70.5 | 14.6 |
| June | 26.3 | 1107 | 58.5 | 60.2 | 59.4 | 80.0 | 82.9 | 82.8 | 34.8 | 34.8 | 66.9 | 69.1 | 68.5 | 74.3 | 14.1 |
| July | 28.9 | 1107 | 60.7 | 62.4 | 61.6 | 82.0 | 84.9 | 84.8 | 37.3 | 37.3 | 68.9 | 71.1 | 70.5 | 76.3 | 13.9 |
| August | 28.3 | 1095 | 59.8 | 61.6 | 60.7 | 81.0 | 83.8 | 83.8 | 36.6 | 36.6 | 68.0 | 70.2 | 69.7 | 75.4 | 13.8 |
| September | 24.1 | 1034 | 54.4 | 56.1 | 55.3 | 74.8 | 77.5 | 77.4 | 32.2 | 32.1 | 62.5 | 64.6 | 64.1 | 69.5 | 13.4 |
| October | 17.0 | 914 | 44.5 | 45.9 | 45.6 | 63.2 | 65.6 | 65.5 | 24.6 | 24.6 | 52.3 | 54.1 | 53.7 | 58.5 | 12.5 |
| November | 10.0 | 777 | 33.9 | 35.2 | 34.7 | 50.4 | 52.4 | 52.3 | 16.5 | 16.4 | 41.2 | 42.8 | 42.4 | 46.4 | 11.2 |
| December | 4.8 | 701 | 26.9 | 28.0 | 27.5 | 41.8 | 43.6 | 43.6 | 10.5 | 10.4 | 33.8 | 35.2 | 34.9 | 38.4 | 10.4 |
Table 4.
PV cell temperatures obtained by thermal models in the case of PV conversion (Ppv ≠ 0, η = 12%) and corresponding percentage decrease of electric power.
Table 4.
PV cell temperatures obtained by thermal models in the case of PV conversion (Ppv ≠ 0, η = 12%) and corresponding percentage decrease of electric power.
| Temperatures (°C) | Power | |||
|---|---|---|---|---|
| Tc,pv | Tc,pv+batt | ΔT | ΔP% | |
| January | 24.3 | 34.1 | 9.8 | −5.1 |
| February | 30.9 | 42.1 | 11.2 | −5.8 |
| March | 40.0 | 52.3 | 12.3 | −6.4 |
| April | 46.7 | 59.6 | 12.9 | −6.7 |
| May | 51.4 | 64.3 | 12.9 | −6.7 |
| June | 55.7 | 68.2 | 12.4 | −6.5 |
| July | 58.0 | 70.2 | 12.3 | −6.4 |
| August | 57.1 | 69.3 | 12.2 | −6.3 |
| September | 51.8 | 63.6 | 11.8 | −6.1 |
| October | 42.0 | 53.0 | 11.0 | −5.7 |
| November | 31.8 | 41.5 | 9.8 | −5.1 |
| December | 24.8 | 33.8 | 9.1 | −4.7 |
© 2017 by the authors. Licensee MDPI, Basel, Switzerland. This article is an open access article distributed under the terms and conditions of the Creative Commons Attribution (CC BY) license (http://creativecommons.org/licenses/by/4.0/).
Share and Cite
MDPI and ACS Style
Hammami, M.; Torretti, S.; Grimaccia, F.; Grandi, G. Thermal and Performance Analysis of a Photovoltaic Module with an Integrated Energy Storage System. Appl. Sci. 2017, 7, 1107. https://0-doi-org.brum.beds.ac.uk/10.3390/app7111107
AMA Style
Hammami M, Torretti S, Grimaccia F, Grandi G. Thermal and Performance Analysis of a Photovoltaic Module with an Integrated Energy Storage System. Applied Sciences. 2017; 7(11):1107. https://0-doi-org.brum.beds.ac.uk/10.3390/app7111107
Chicago/Turabian StyleHammami, Manel, Simone Torretti, Francesco Grimaccia, and Gabriele Grandi. 2017. "Thermal and Performance Analysis of a Photovoltaic Module with an Integrated Energy Storage System" Applied Sciences 7, no. 11: 1107. https://0-doi-org.brum.beds.ac.uk/10.3390/app7111107
Note that from the first issue of 2016, this journal uses article numbers instead of page numbers. See further details here.