Compensation for Group Velocity of Polychromatic Wave Measurement in Dispersive Medium


Department of Electrical and Computer Engineering, Seoul National University, Seoul 151-744, Korea
*
Author to whom correspondence should be addressed.
Appl. Sci. 2017, 7(12), 1306; https://0-doi-org.brum.beds.ac.uk/10.3390/app7121306
Submission received: 21 November 2017
/
Revised: 13 December 2017
/
Accepted: 15 December 2017
/
Published: 18 December 2017
(This article belongs to the Special Issue Ultrasonic Guided Waves)
Abstract
:The estimation of instantaneous frequency (IF) method is introduced to compensate for the group velocity of electromagnetic wave in dispersive medium. The location of the reflected signal can be obtained by using the time-frequency cross correlation (TFCC), following which it is used to extract the transmitted signal from the total signal acquired. The signal propagated in the dispersive medium is attenuated and distorted by the attenuation characteristics, which depend on the frequency of the medium. By using the IF curve calculated for the transmitted signal, the changed center frequency and time terms can be obtained. The obtained terms are used to compensate for the group velocity error induced by signal distortion and attenuation. Through experiments and simulation, the accuracy of the proposed method is 2% higher than that of the conventional method when the signal propagates over a long distance.
1. Introduction
It is important to accurately measure the group velocity of electromagnetic wave in a dispersive medium to detect defects and measure distances. Since the group velocity is dependent on the frequency, and dispersion occurs when a polychromatic wave composed of multiple frequencies propagates in a dispersive medium, it is difficult to measure the exact group velocity [1]. group velocity correction is necessary when a signal propagates in any medium other than air. Detection methods based on the electromagnetic wave, called reflectometry methods, are useful for fault localization and monitoring of the health of a cable with insulator. Reflectometry methods can be categorized into time domain reflectometry (TDR), frequency domain reflectometry (FDR), and time-frequency domain reflectometry (TFDR) [2,3,4,5,6,7] depending on the incident signal type. TDR and FDR use a step pulse and sinusoidal pulse defined in the time domain and frequency domain, respectively. They have been widely used in cable diagnostics owing to their ease of implementation. However, since the incident signals of TDR and FDR defined one domain are used, it is difficult to distinguish the acquired signal from the noise. In contrast to TDR and FDR, TFDR has a higher signal-to-noise (SNR) because the incident signal of TFDR is used as a chirp signal that has characteristics in both the time and frequency domains. In TFDR, the impedance discontinuity distance is measured by obtaining the time delay of the reflected signal generated from the impedance discontinuity point for a given group velocity. Since the group velocity is determined by the permittivity and permeability of the propagation medium, the propagation can be obtained from the information about the propagation medium. The time-frequency cross correlation function (TFCC) which is a measure of the similarity of two signals, and calculates the time delay, is based on the Wigner-Ville distribution, which is an energy distribution in time-frequency analysis. However, since the group velocity depends on the frequency, if the bandwidth is wide or distortion is increased by long-distance propagation, the error of the group velocity also becomes large. Especially, in case of submarine cable lengths of several hundred km, speed compensation is essential. Our research group has been investigated the compensation for group velocity [8]. The compensation method proposed in the previous method [8] does not consider the sweep rate of the reflected signal to be changed. That is, since the frequency components included in the chirp signal have different velocities, compensation is performed without taking into account dispersion, which causes an measurement error.
In this paper, we propose a method for compensating the group velocity of poly-chromatic wave in a dispersive medium based on instantaneous frequency (IF) estimation. Using TFCC, the location of transmitted signal is obtained and the signal is extracted from the total acquired signal. IF curves of incident and transmitted signal are derived by using the phase unwrapping process. The shifted center frequency and shortened time duration of transmitted signal are obtained based on the Fast Fourier Transform (FFT) and estimation of the IF curve. The group velocity compensation is carried out through the derived terms.
2. Group Velocity Measurement Based on Electromagnetic Wave Theory
The proposed group velocity measurement method consists of two main parts. The first part comprises the transmitted signal detection method using TFCC. After the first step, the time offset and shifted center frequency of the transmitted signal are used to compensate for the group velocity. In electromagnetic theory, the group velocity of an electromagnetic plane wave can be derived as follows [1]:
where are the operating frequency, relaxation frequency at which the imaginary part of the complex permittivity reaches a maximum, and resonant frequency, respectively. are the permittivity at infinity frequency and static permittivity, respectively. is the static permeability. According to (1), the group velocity depends on the operating frequency. When the polychromatic wave comprising several frequencies propagates in the dispersive media, the wave is distorted and a group velocity error occurs because of the frequency dependency of group velocity. Especially when the signal is transmitted over a long distance, the more high frequency components are attenuated, and velocity error is induced. In other words, as the signal propagates, the group velocity changes continuously with the propagation distance. In this paper, the incident signal is the signal that we injected into the cable, the reflected signal is generated at the cable termination, and transmitted signals are signals that are acquired by the oscilloscope through the inductive couplers as the incident signal flows along the cable, and the signals acquired after being reflected at the cable termination are classified as reflected signals, and the reflected signal is included in the transmitted signal. We use the Gaussian linear chirp signal as the incident polychromatic wave, and the incident signal is represented as follows:
where is the duration of the incident signal, A is the amplitude, is the normalized angular frequency sweep rate, and is the normalized angular frequency. The transmitted signal is expressed as follows:
where is the magnitude of the attenuation coefficient at the travelling distance, and d is the time delay of the transmitted signal. Also, because the transmitted signal has high frequency attenuation, we define the changed parameters and as frequency sweep rate and time duration of transmitted signal. The normalized cross-correlation between the incident signal and the transmitted signal is used to detect the transmitted signal from the cable termination. This can be expressed as follows [3]:
where is the energy of the incident signal in Wigner-Ville distribution, is the energy of the transmitted signal, and ⨂ is the correlation operator. Through the normalized cross-correlation process, the transmitted signal can be extracted from the total acquired signal.
3. Compensation of Group Velocity in Dispersive Medium
For the compensation of group velocity, we measure the IF curves of incident and transmitted signals. To acquire IF curves, the incident and transmitted signals are transformed through Hilbert transform for as following analytic representation:
where, is a output at a time t of Hilbert transform filter applied the signal r, M and are the magnitude and the instantaneous phase of the transmitted signal. And then, the instantaneous phase is derived as following:
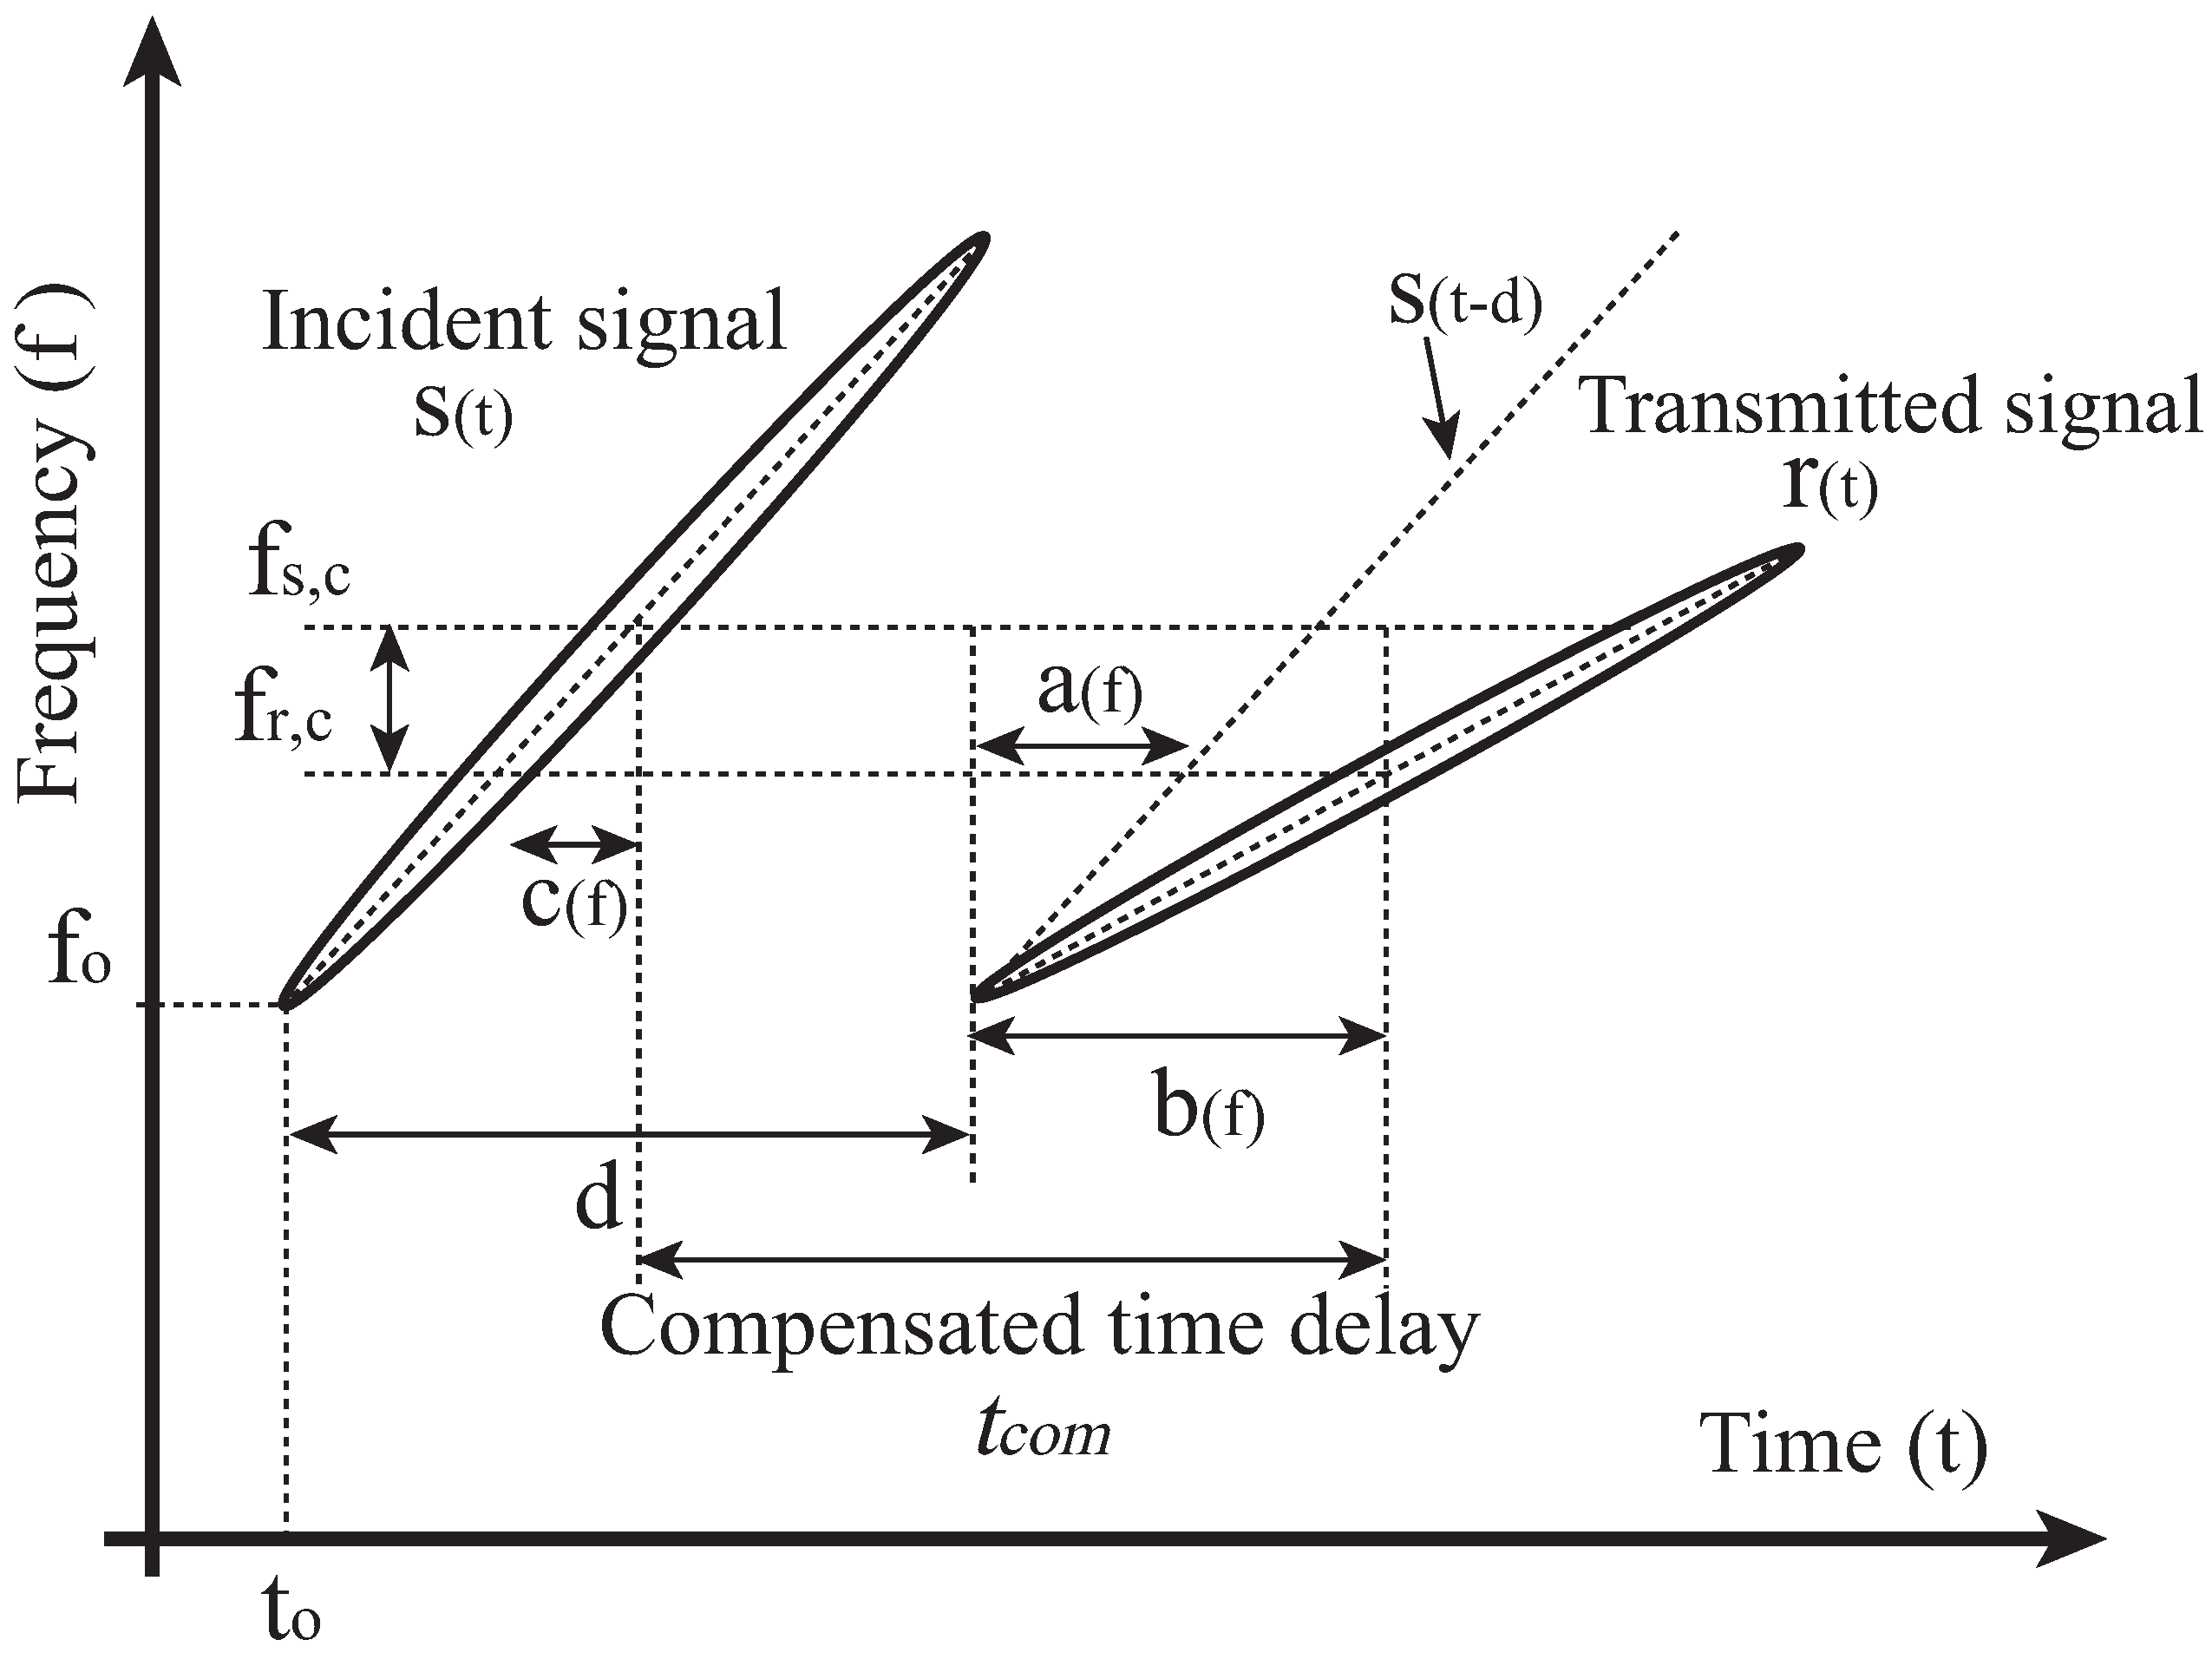
where, means the absolute function. Figure 1 shows the illustration of the compensation of IF curves. In Figure 1, and are the center frequency of incident signal and transmitted signal. To derive the time shifted terms, , of transmitted signal according to operation frequency, we obtained the shifted term using the delayed incident signal by the time delay, d, and the reflection signal as follows.
The concept of group velocity of polychromatic signal is associated with narrow-band pulses concentrated in the neighborhood of center frequency, , with an effective frequency band , where . Furthermore, the compensated time delay between incident signal and transmitted signal is derived as following:
And then, compensated group velocity is derived as follows: . where, l is the known length of target cable. In future work, we derive the frequency and group velocity, , curve based on (1). And then, we assume that the center frequency of transmitted signal is linearly decrease with time. According to this assumption, the center frequency of transmitted signal can be expressed as: where, and b are the constant. The travelling distance, D can be derived as: . This article compensates the speed with time delay compensation, and next it will develop this to estimate the distance through accurate propagation speed and time delay without travelling distance information.
4. Experimental Results
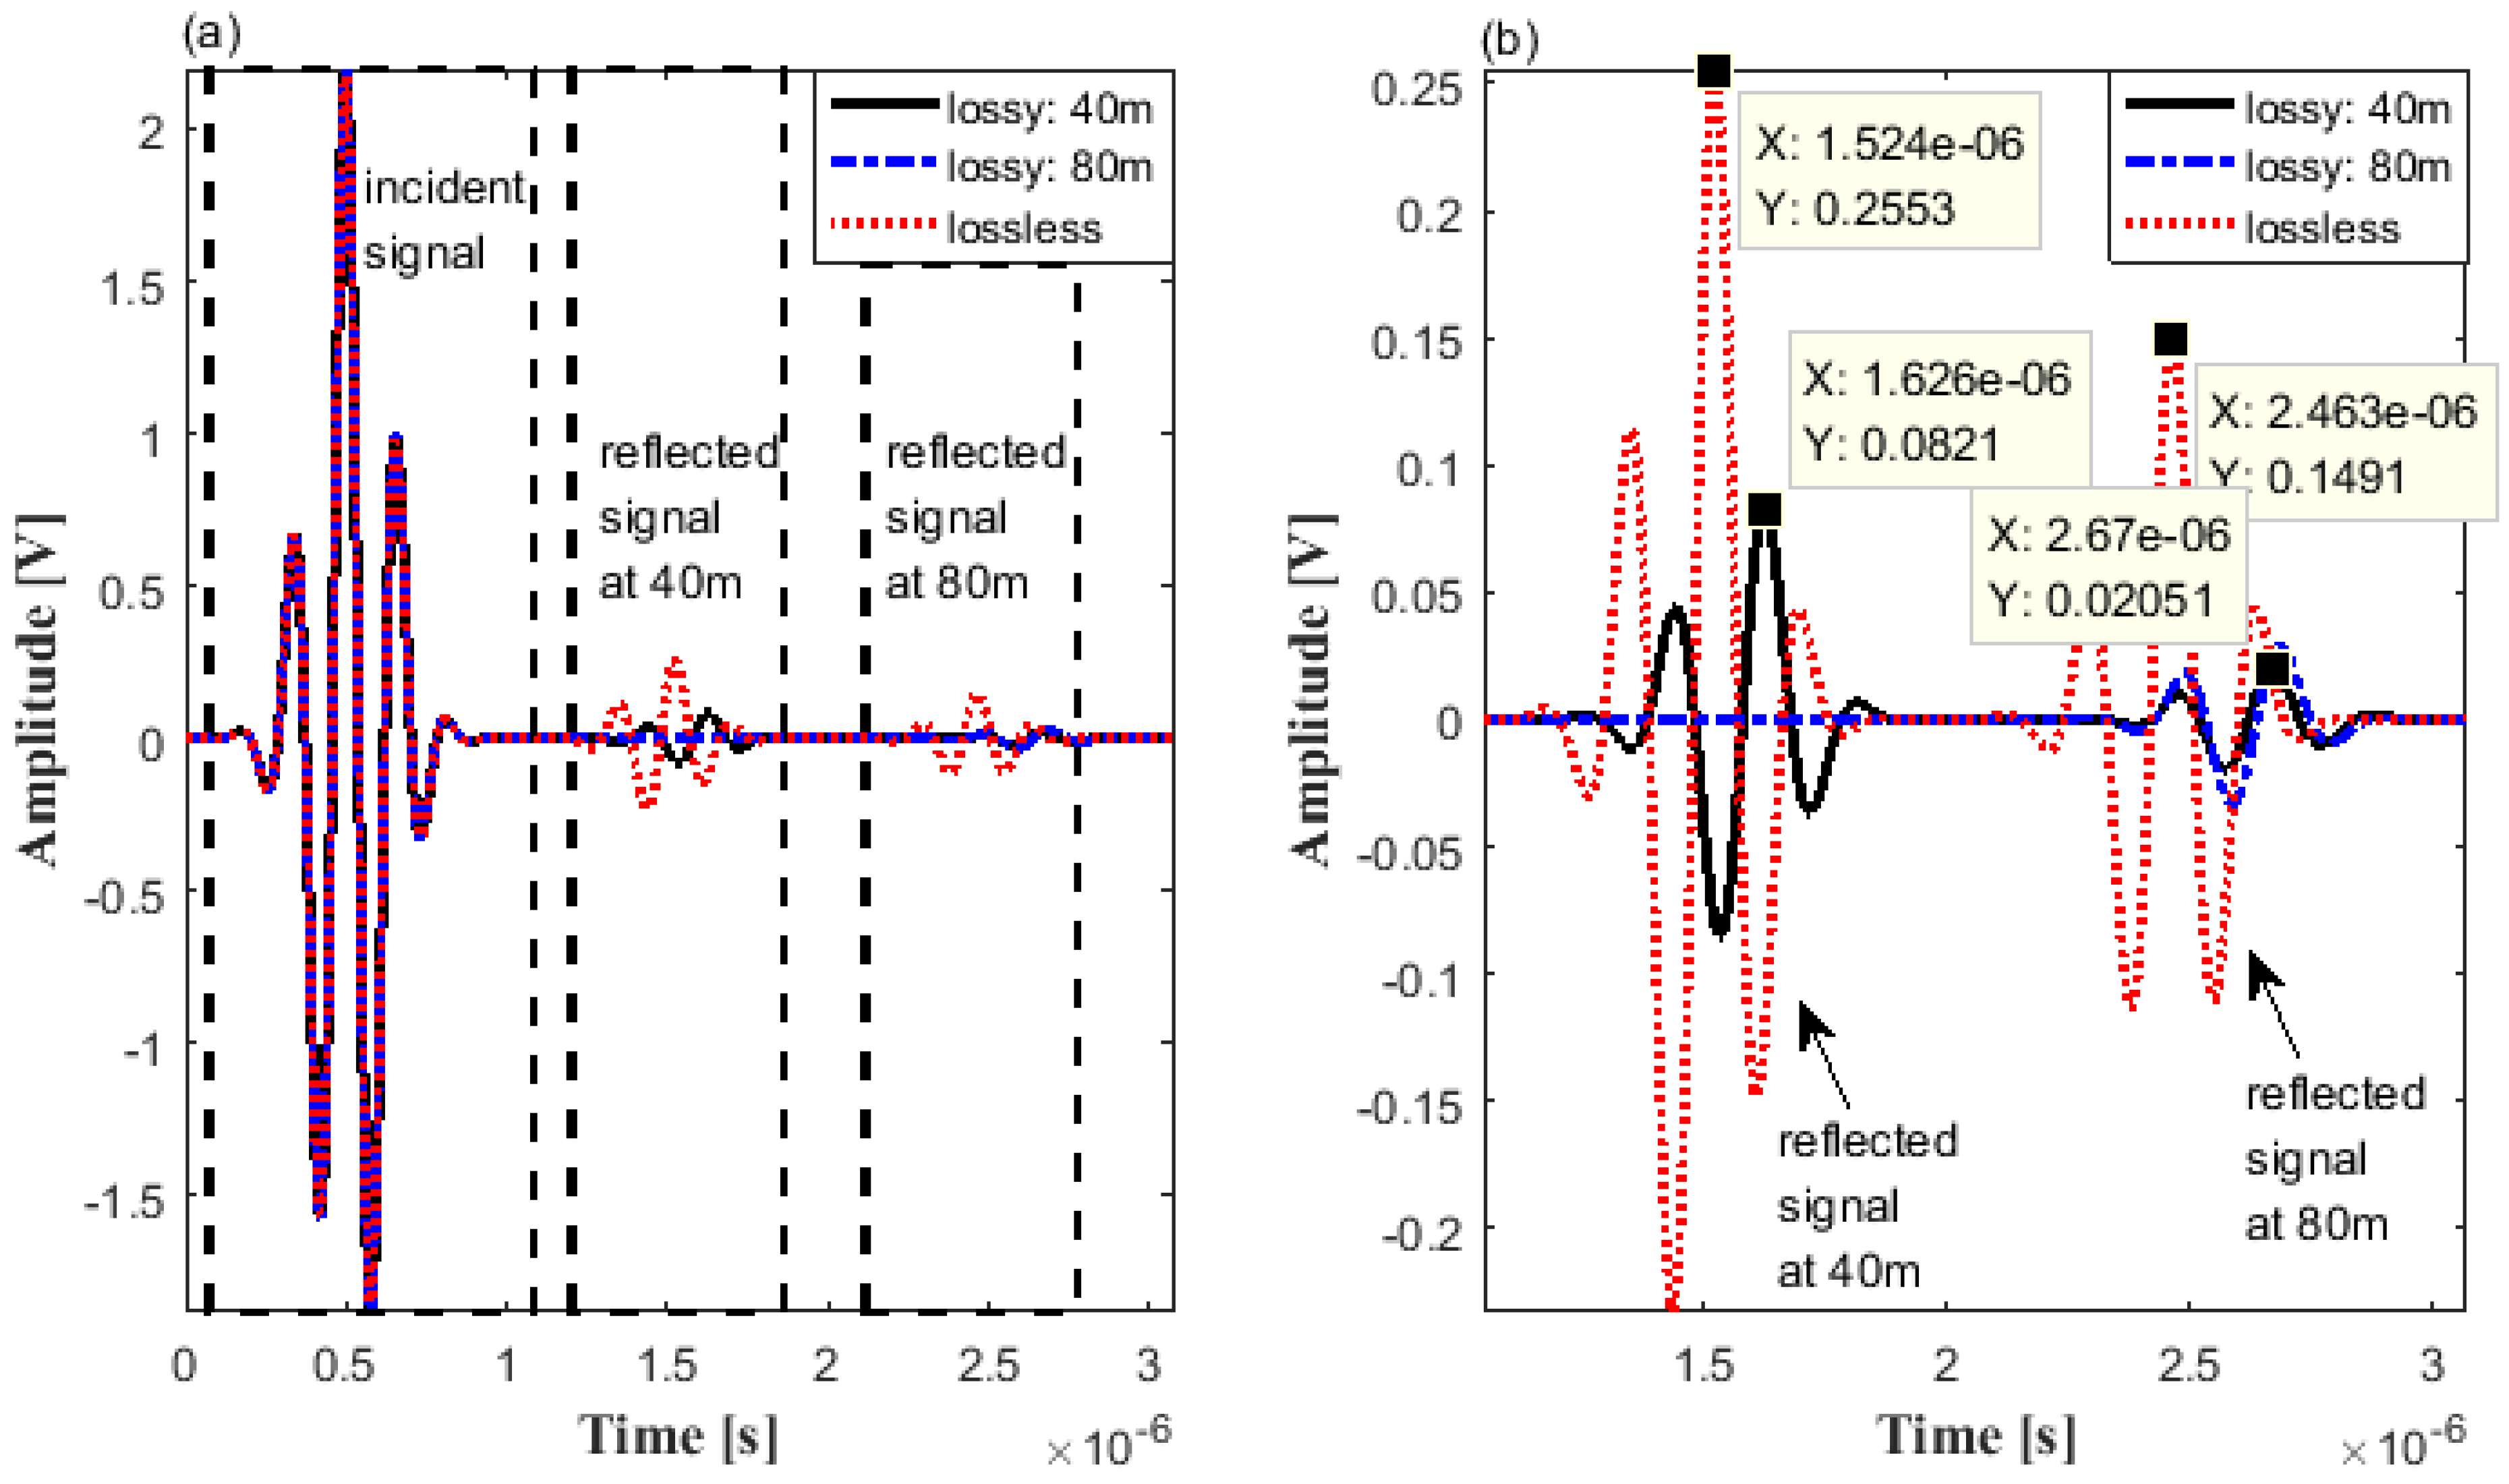
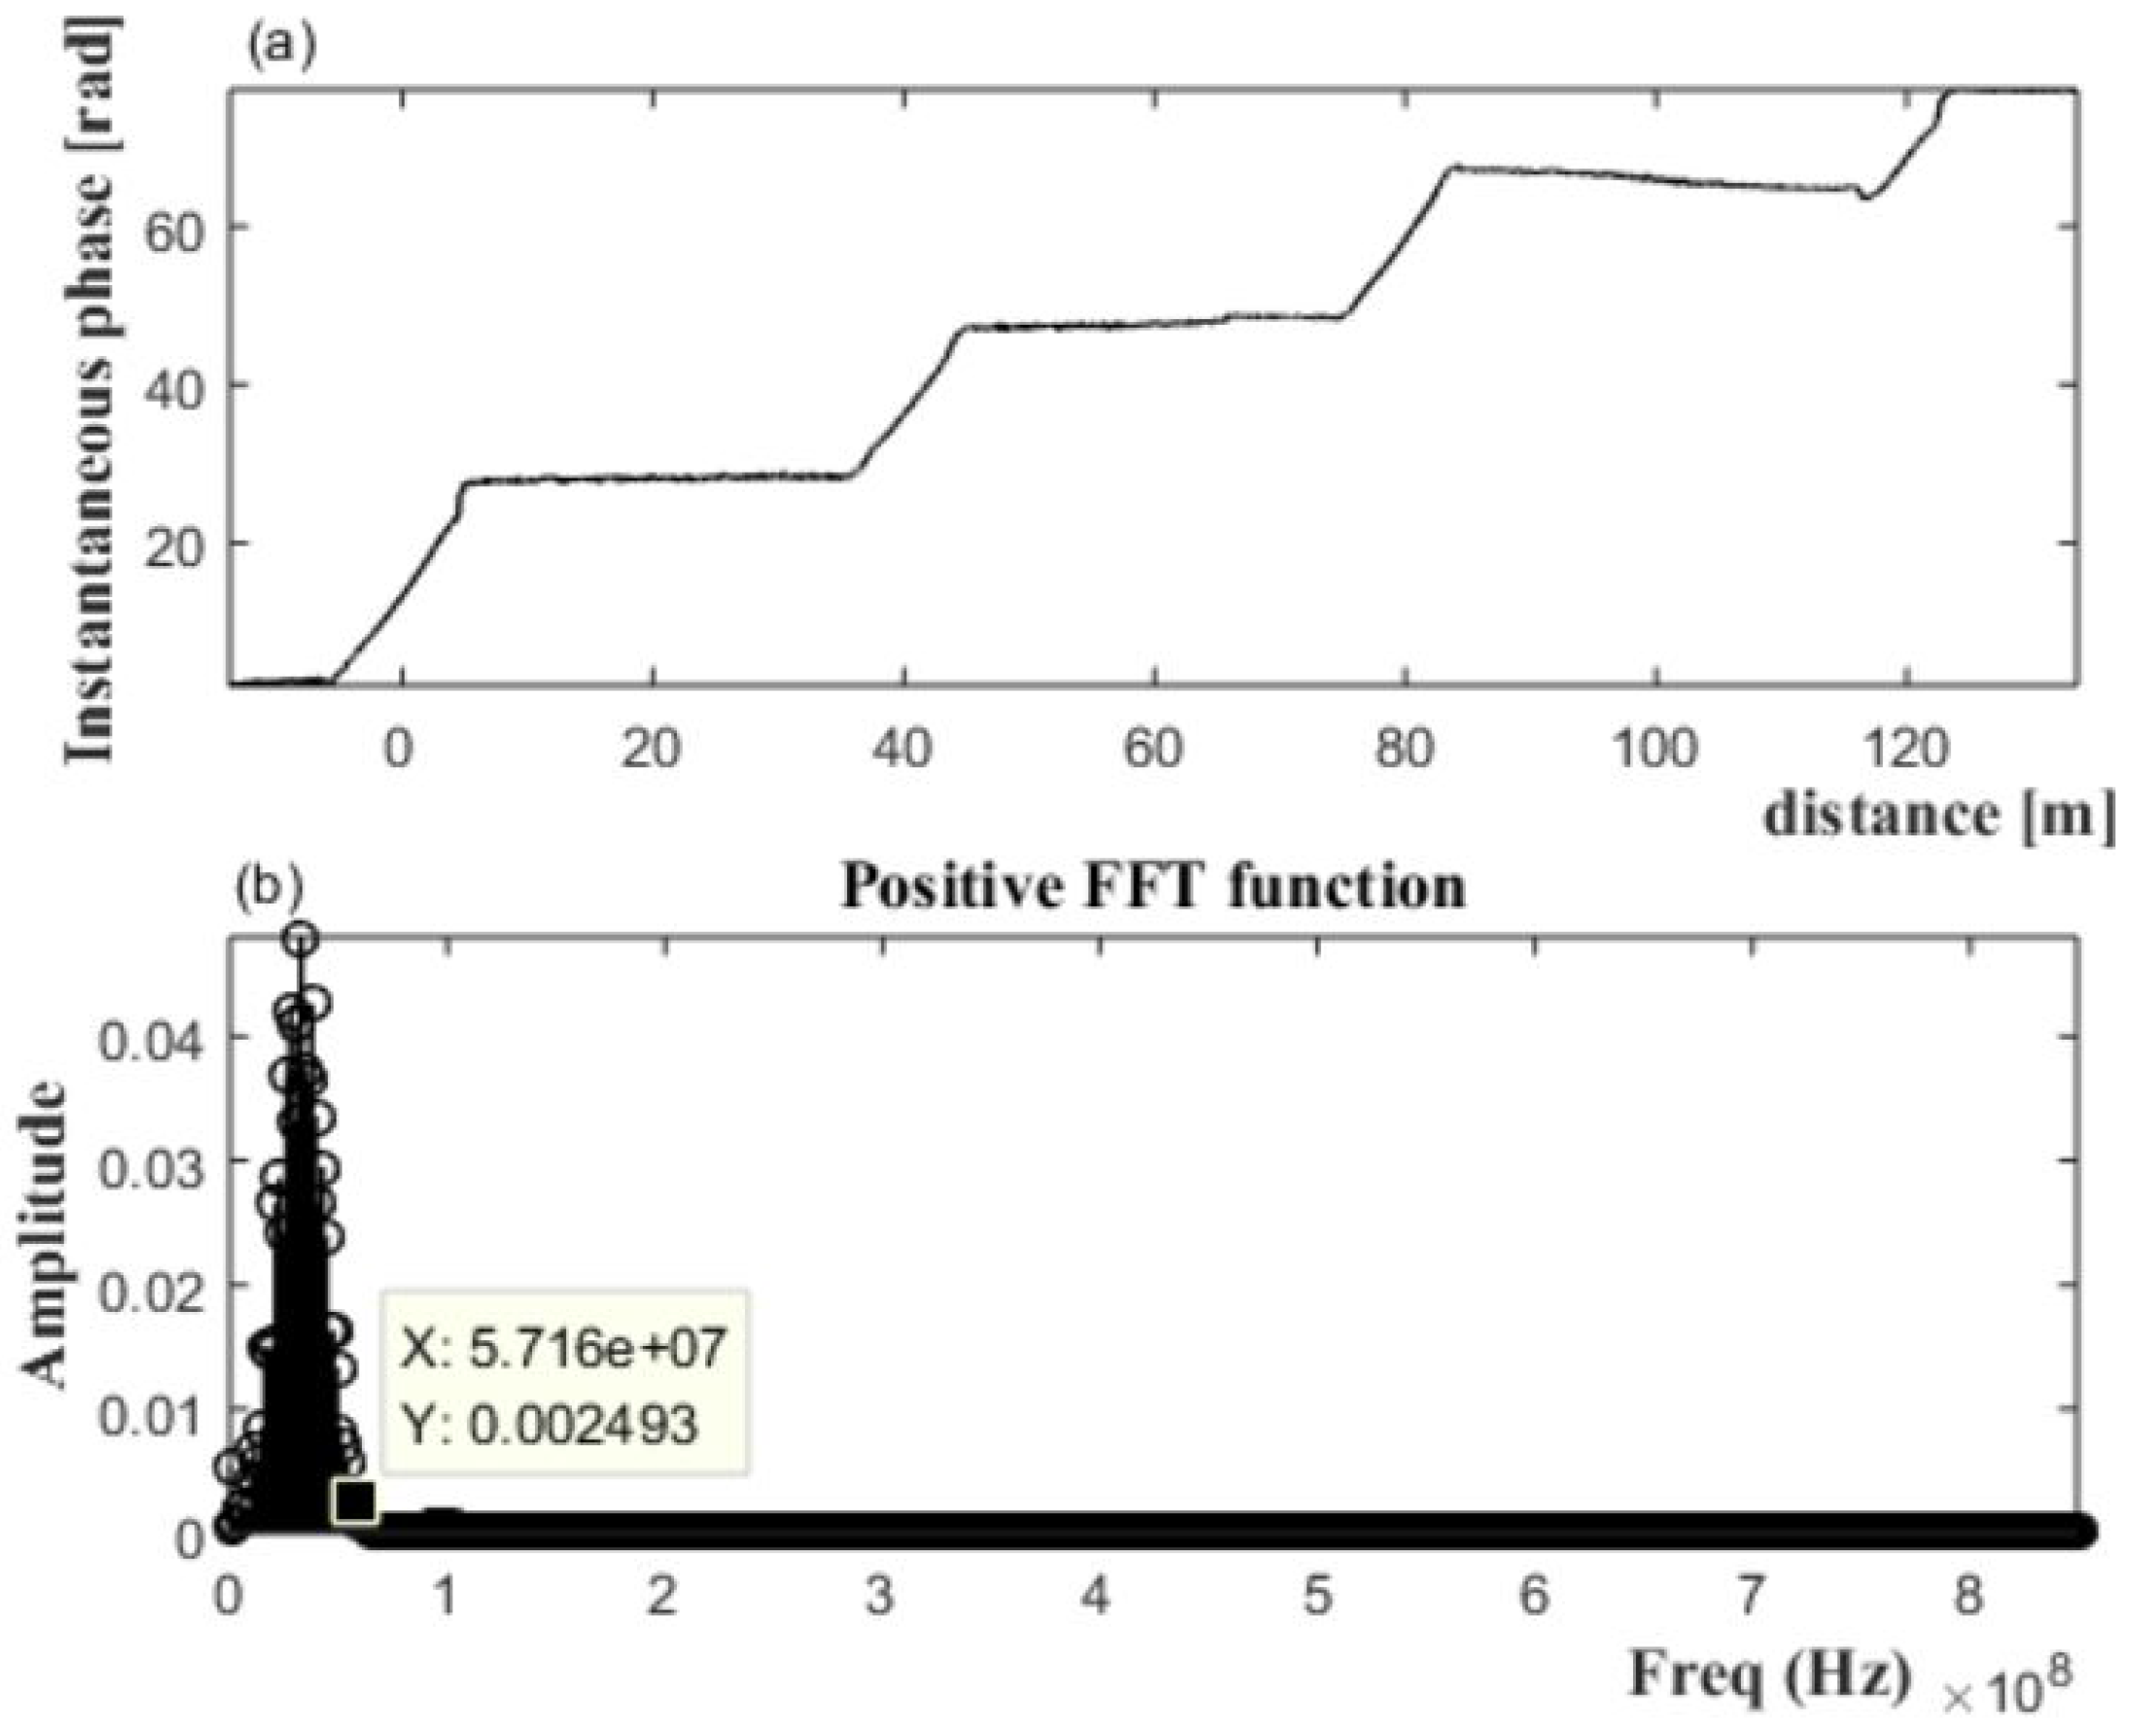
Figure 2 shows the illustration of the proposed system. The system is composed of (1) digital phosphor oscilloscope (DPO); (2) arbitrary waveform generator (AWG); and (3) inductive couplers. AWG generates the reference signal and apply the signal to target cable though the inductive coupler. The inductive coupler uses the electromagnetic induction phenomenon to apply a signal to the cable without connection between the cable core and signal line. In this paper, we use three inductive couplers and coupler 1 is used to apply a signal to cable, couplers 2 and 3 acquire the signal. An incident signal propagates along the cable and was acquired in the oscilloscope through the couplers 2 and 3. For ease of understanding, the signals were numbered according to the order in which they were acquired. The transmitted signals acquired through the couplers 2 and 3, before the signal being reflected, were numbered 1 and 2 and located at and , respectively. The distance propagated based on the first acquired signal though coupler 2 becomes the position of the signal. The signals reflected from the cable termination were in turn acquired via couplers 3 and 2, which were located at and . In order to verify the variation of group velocity due to the dispersion, we converted the experimental system into an equivalent circuit model using the simulation tool. Through the tuning of loss factor in the simulation tool, we conducted the simulation to compare the signal passing through the lossy medium with lossless medium. The comparison results are shown in Figure 3. The results consist of 3 types simulations: (a) lossless cable: 40 m; (b) lossy cable: 40 m; (c) lossy cable: 80 m. To verify the effect of loss factor, we compared the transmitted signal in lossy medium with that in lossless medium (simulations: (a) and (b)). Also, simulations were conducted with different cable lengths in order to analyze whether the group velocity of the signal varies due to the reflection (simulations: (b) and (c)). As shown in Figure 3a, the incident signals of each simulation are identical, but the reflected signals of each did not match. Figure 3b shows an enlarged view of the reflected signals. The highest peak in the time domain of the signal can be thought of as the highest energy point, and the group velocity of the signal can be determined by the time delay between these peak points, and this time delay is called the time of arrival of group velocity. Comparing the waveforms of (a) and (b), the time delay between the peak points of the reflected signal generated at and are and , respectively. If there was no change in group velocity depending on the travel distance, the time of arrival of group velocity of the reflected signal generated at had to be . More time delays mean slower group velocity. These results show that the group velocity is decreasing as the signal propagates. Since the incident signal is a positive chirp signal, the rear part of the signal in time domain contains a high frequency component. As shown in the reflected signals of red and black line of Figure 3b, in the front part, the zero-crossing points of each signal are matched, but the zero-crossing points in the rear part do not coincide with each other. These results indicate that the higher frequency components of the signal are attenuated as the signal propagates in the lossy medium. Comparing the reflected signals generated at , we verified that the reflection only affect the magnitude of signal, not group velocity. Figure 4a shows the total acquired signal from the inductive couplers after signal restoration process [9,10]. As seen in the fourth signal in Figure 4a, because the signal is difficult to distinguish from the noise, TFCC is used to roughly find the position of the transmitted signal. To evaluate the accuracy of proposed method, we solved the true value of group velocity using the time of arrival of group velocity of the signals in the time domain. However, the reflected signal at is too small to find out due to the attenuation. Because of this, it is very difficult to obtain the group velocity through the time delay between the highest peak points of the signal in the time domain, and the group velocity in the farther than can not be calculated. The TFCC graph is shown in the Figure 4b. As the signal propagates, attenuation of the signal occurs, which slows the group velocity and increases the time delay. Figure 4b depicts a TFCC graph based on the constant group velocity measured on 40 m. Therefore, the distance errors of 80 m and 120 m is getting larger. Based on unwrapping algorithm and Hilbert transform, the instantaneous phase of the transmitted signal can be derived and shown in Figure 5a. The signal having the positive slope of the instantaneous phase was extracted, and the frequency band of the extracted signal was obtained by FFT algorithm. In Figure 5a, the time duration of the signal is obtained by extracting the signal where the slope of the instantaneous phase is positive. The Figure 5b shows the frequency band of second signal of total signal. The changed values, time duration and frequency region, were obtained and substituted into Equation (7) to compensate the group velocity. As seen in Table 1, the group velocity in TFCC method seems to be equal regardless of the propagation distance. On the contrary, in the proposed method, the shifted terms , , can be obtained from the center frequency, , of the received signal from Figure 1 and Figure 5. The compensation time delay term is calculated according to Equation (8). The travelling distance, D, is the known value of the cable length and is the integral of the velocity determined by the center frequency of the transmitted signal. Based on the derived compensation time delay, , and the distance value, D, the average velocity during propagation of the transmitted signal can be obtained and are shown in Table 1. The measurement values in Table 1 were calculated by the time of arrival of group velocity of signal in Figure 5a. As the distance between each signal is set as , the group velocity, measurement value, can be obtained by dividing the distance by the measured group delay. The accuracy values in Table 1 were calculated by dividing the group velocity of proposed method by measurement value. As seen in Table 1, when the signal propagates to a short distance, the existing method is highly accurate, but the existing method does not reflect the change in group velocity when the signal propagates over a long distance. On the other hand, the proposed method compensates the group velocity change due to the dispersion, so that the accuracy of group velocity is good regardless of the distance.
5. Conclusions
In this paper, we proposed the group velocity compensation method using the derived time and center frequency offset terms based on the estimation of instantaneous frequency (IF). The proposed method can be divided two part. The one was the transmitted signal detector algorithm based on TFCC and multiple inductive couplers system. The second is the compensation algorithm, and the compensation terms was obtained based on the IF curve which was derived from Hilbert transform and phase unwrap algorithm of the transmitted signal. The variation of group velocity of chirp signal by dispersion in lossy medium was verified using a simulation tool. Through the comparison experiments with compensation without consideration of sweep rate change and existing methods using TFCC, superiority of the proposed method was proved. Although the group velocity of a signal propagating a short distance has similar accuracy in both the conventional method and the proposed method, when the signal propagates over a long distance (), the proposed method has better accuracy than the conventional method. This paper proposes a new method to compensate the group velocity error due to the dispersion of the chirp signal in the lossy medium, and this method can be applied to the detection of defect, it is possible to localize the fault in long-distance lines, such as submarine HVDC cable, without error.
Author Contributions
Seung Jin Chang made a theory, designed the experiments and wrote the paper; Seung-Il Moon analyzed the data.
Conflicts of Interest
The authors declare no conflict of interest.
References
- Cho, J.; Kim, H.; Jung, K.-Y. Simple transmission line model suitable for the electromagnetic pulse coupling analysis of twisted-wire pairs above ground. IEICE Electron. Express 2016, 13, 20160149. [Google Scholar] [CrossRef]
- Chowdary, K.M.; Majetich, S.A. Frequency-dependent magnetic permeability of Fe10Co90 nanocomposites. J. Phys. D Appl. Phys. 2014, 47, 175001. [Google Scholar] [CrossRef]
- Chang, S.J.; Lee, C.K.; Lee, C.-K.; Han, Y.J.; Jung, M.K.; Park, J.B.; Shin, Y.-J. Condition monitoring of instrumentation cable splices using Kalman filtering. IEEE Trans. Instrum. Meas. 2015, 64, 3490–3499. [Google Scholar] [CrossRef]
- Lee, C.K.; Park, J.B.; Shin, Y.J.; Yoon, T.S. High resolution LFMCW radar system using model-based beat frequency estimation in cable fault localization. IEICE Electron. Express 2014, 11, 20130768. [Google Scholar] [CrossRef]
- Lee, S.H.; Lee, C.K.; Park, J.B.; Choi, T.H. Diagnostic method for insulated power cables based on wavelet energy. IEICE Electron. Express 2013, 10, 20130335. [Google Scholar] [CrossRef]
- Kwak, K.S.; Doo, S.; Lee, C.K.; Yoon, T.S. Reduction of the blind spot in the time-frequency domain reflectometry. IEICE Trans. Electron. 2008, 5, 265–270. [Google Scholar] [CrossRef]
- Lee, C.K.; Kwak, K.S.; Yoon, T.S.; Park, J.B. Cable Fault Localization Using Instantaneous Frequency Estimation in Gaussian-Enveloped Linear Chirp Reflectometry. IEEE Trans. Instrum. Meas. 2013, 62, 129–139. [Google Scholar] [CrossRef]
- Shin, Y.J.; Song, E.S.; Kim, J.W.; Park, J.B.; Yook, J.G.; Powers, E.J. Time-frequency domain reflectometry for smart wiring systems. Proc. SPIE 2002, 4791. [Google Scholar] [CrossRef]
- Chang, S.J.; Lee, C.K.; Shin, Y.-J.; Park, J.B. Multiple Resolution Chirp Reflectometry for Fault Localization and Diagnosis High Voltage Cable in Automotive Electronics. Meas. Sci. Technol. 2016, 27, 125006. [Google Scholar] [CrossRef]
- Selesnick, I.W.; Figueiredo, M.A.T. Signal restoration with overcomplete wavelet transforms: comparison of analysis and systhesis priors. Proc. SPIE 2009, 7446. [Google Scholar] [CrossRef]
Figure 1.
Illustration of compensation method based on IF curves.

Figure 2.
Experimental setup.

Figure 3.
The results of acquired signals: 40 m lossy cable, 80 m lossy cable, lossless cable (a) total signal; (b) reflected signal.
Figure 3.
The results of acquired signals: 40 m lossy cable, 80 m lossy cable, lossless cable (a) total signal; (b) reflected signal.

Figure 4.
The results of (a) acquired signals, (b) TFCC graph.

Figure 5.
(a) Estimation of instantaneous phase, (b) frequency band of transmitted signal.


Table 1.
Estimation results of group velocity.
| Group Velocity | |||
|---|---|---|---|
| Cable Length: 40 m | Cable Length: 80 m | Cable Length: 120 m | |
| TFCC accuracy | |||
| proposed method accuracy | |||
| measurement value | |||
© 2017 by the authors. Licensee MDPI, Basel, Switzerland. This article is an open access article distributed under the terms and conditions of the Creative Commons Attribution (CC BY) license (http://creativecommons.org/licenses/by/4.0/).
Share and Cite
MDPI and ACS Style
Chang, S.J.; Moon, S.-I. Compensation for Group Velocity of Polychromatic Wave Measurement in Dispersive Medium. Appl. Sci. 2017, 7, 1306. https://0-doi-org.brum.beds.ac.uk/10.3390/app7121306
AMA Style
Chang SJ, Moon S-I. Compensation for Group Velocity of Polychromatic Wave Measurement in Dispersive Medium. Applied Sciences. 2017; 7(12):1306. https://0-doi-org.brum.beds.ac.uk/10.3390/app7121306
Chicago/Turabian StyleChang, Seung Jin, and Seung-Il Moon. 2017. "Compensation for Group Velocity of Polychromatic Wave Measurement in Dispersive Medium" Applied Sciences 7, no. 12: 1306. https://0-doi-org.brum.beds.ac.uk/10.3390/app7121306
Note that from the first issue of 2016, this journal uses article numbers instead of page numbers. See further details here.