Article

Laterally Loaded Single Pile Response Considering the Influence of Suction and Non-Linear Behaviour of Reinforced Concrete Sections

Department of Civil and Industrial Engineering, University of Pisa, Largo Lucio Lazzarino, 56122 (PI) Pisa, Italy
*
Author to whom correspondence should be addressed.
Submission received: 10 November 2017 / Revised: 12 December 2017 / Accepted: 15 December 2017 / Published: 17 December 2017

Abstract

:

Featured Application

An analysis method has been developed to study single piles under horizontal loading. The proposed method is innovative because it considers the highly non-linear response of circular reinforced concrete pile sections, taking also into account the influence of tension stiffening, and considers suction for partially saturated soil conditions.

Abstract

A hybrid BEM-p-y curves approach was developed for the single pile analysis with free/fixed head restraint conditions. The method considers the soil non-linear behaviour by means of p-y curves in series to a multi-layered elastic half-space. The non-linearity of reinforced concrete pile sections, also considering the influence of tension-stiffening, has been considered. The model reproduces the influence of suction by increasing the stress state and hence the stiffness of shallow soil-layers. Suction is modeled using the Modified-Kovacs model. The hybrid BEM-py curves method was validated by comparing results from data of 22 load tests on single piles. In addition, a detailed comparison is presented between measured and computed data on a large-diameter reinforced concrete bored single pile.

1. Introduction

The response to the horizontal loading of pile foundations has been the focus of many studies. However, as noted by Mokwa and Duncan [1] and Katzenbach and Turek [2], additional tests are needed to better understand the interactions between the soil, piles and superstructures. For the single pile case, it is well known that the key factors that influence the response include the restraint condition at the pile-head and the pile-soil relative stiffness. The installation technique seems to be less important, probably because of the large volume of soil involved in the response mechanism with respect to that related to vertical loads.
The most common analysis methods are continuum-based or Winkler-based approaches (non-linear transfer curves). Methods based on p-y curves are limited to the use of a subgrade soil reaction modulus, which does not represent an actual property of the soil, and the soil is schematized with a series of independent springs.
Some of the most common p-y curves (and implemented in software such as LPILE [3]) include those recommended by the American Petroleum Institute. These were obtained from experimental tests on steel pipe piles with an outer diameter of about 30 cm, and which are not affected by the non-linearity of the pile material. More recently new p-y curves were proposed by Khari et al. [4] and Xu et al. [5] developed a nonlinear analysis method for laterally loaded single reinforced concrete piles based on the beam-on-nonlinear-Winkler-foundation approach.
Continuum-based approaches are usually solved with boundary element methods (BEM) and finite element methods (FEM). Despite their great potential in geotechnical engineering applications, FEM suffers from the complexity of the domain discretization phase and the difficulty in input parameters definition. Furthermore, as evidenced by Mardfekri et al. [6], FEM results are affected by the pile modeling.
Often, therefore, they are used as a benchmark to validate other simplified approaches or as a tool to determine p-y curves for comparison with those obtained experimentally in situ [7,8].
In the work carried out by Fatahi et al. [9], instead, the influence of both the initial lateral stress state and interface parameters was investigated in depth by finite element method analysis. The results shown in [9] highlight the importance of selecting the most appropriate pile-soil interface parameters.
BEM approaches, however, describe the soil as a homogeneous elastic half-space, characterized by a Young modulus and Poisson ratio, and enable pile-soil-pile interactions to be directly evaluated, and group effects can be considered.
The computer codes that make use of this approach include DEFPIG [10], PIGLET [11], and PGROUPN [12]. With PGROUPN, the non-linear soil behaviour is modeled in an approximate way using a hyperbolic stress-strain law.
These methods provide a complete solution at the interfaces of the problem domain but entail numerical approximations when the analysis involves heterogeneous soils (different layers with different stiffnesses). To evaluate the displacement induced at one point of the subsoil by a load acting in another point, the elastic Mindlin solution is generally used [13].
The most important works and parametric studies using BEM approaches have been carried out by [14,15,16,17,18,19].
To account for the non-linear behaviour of the soil, Poulos and Davis [15] proposed an elastic-perfectly plastic model, in which pile-soil relative displacements are allowed once the limit pressure at the interfaces is reached. The same authors, however, explained that such a procedure tends to become less accurate as the number of plasticized boundary elements becomes bigger.
Another interesting and more rigorous method is the Strain Wedge Model [20,21] for the analysis of single piles and pile-groups. This method links the response of the one-dimensional beam on an elastic foundation with a three-dimensional representation of the pile-soil interaction, and thus with the development and mobilization of a passive wedge of soil in front of the pile.

2. Proposed “Hybrid BEM-p-y Curve” Method
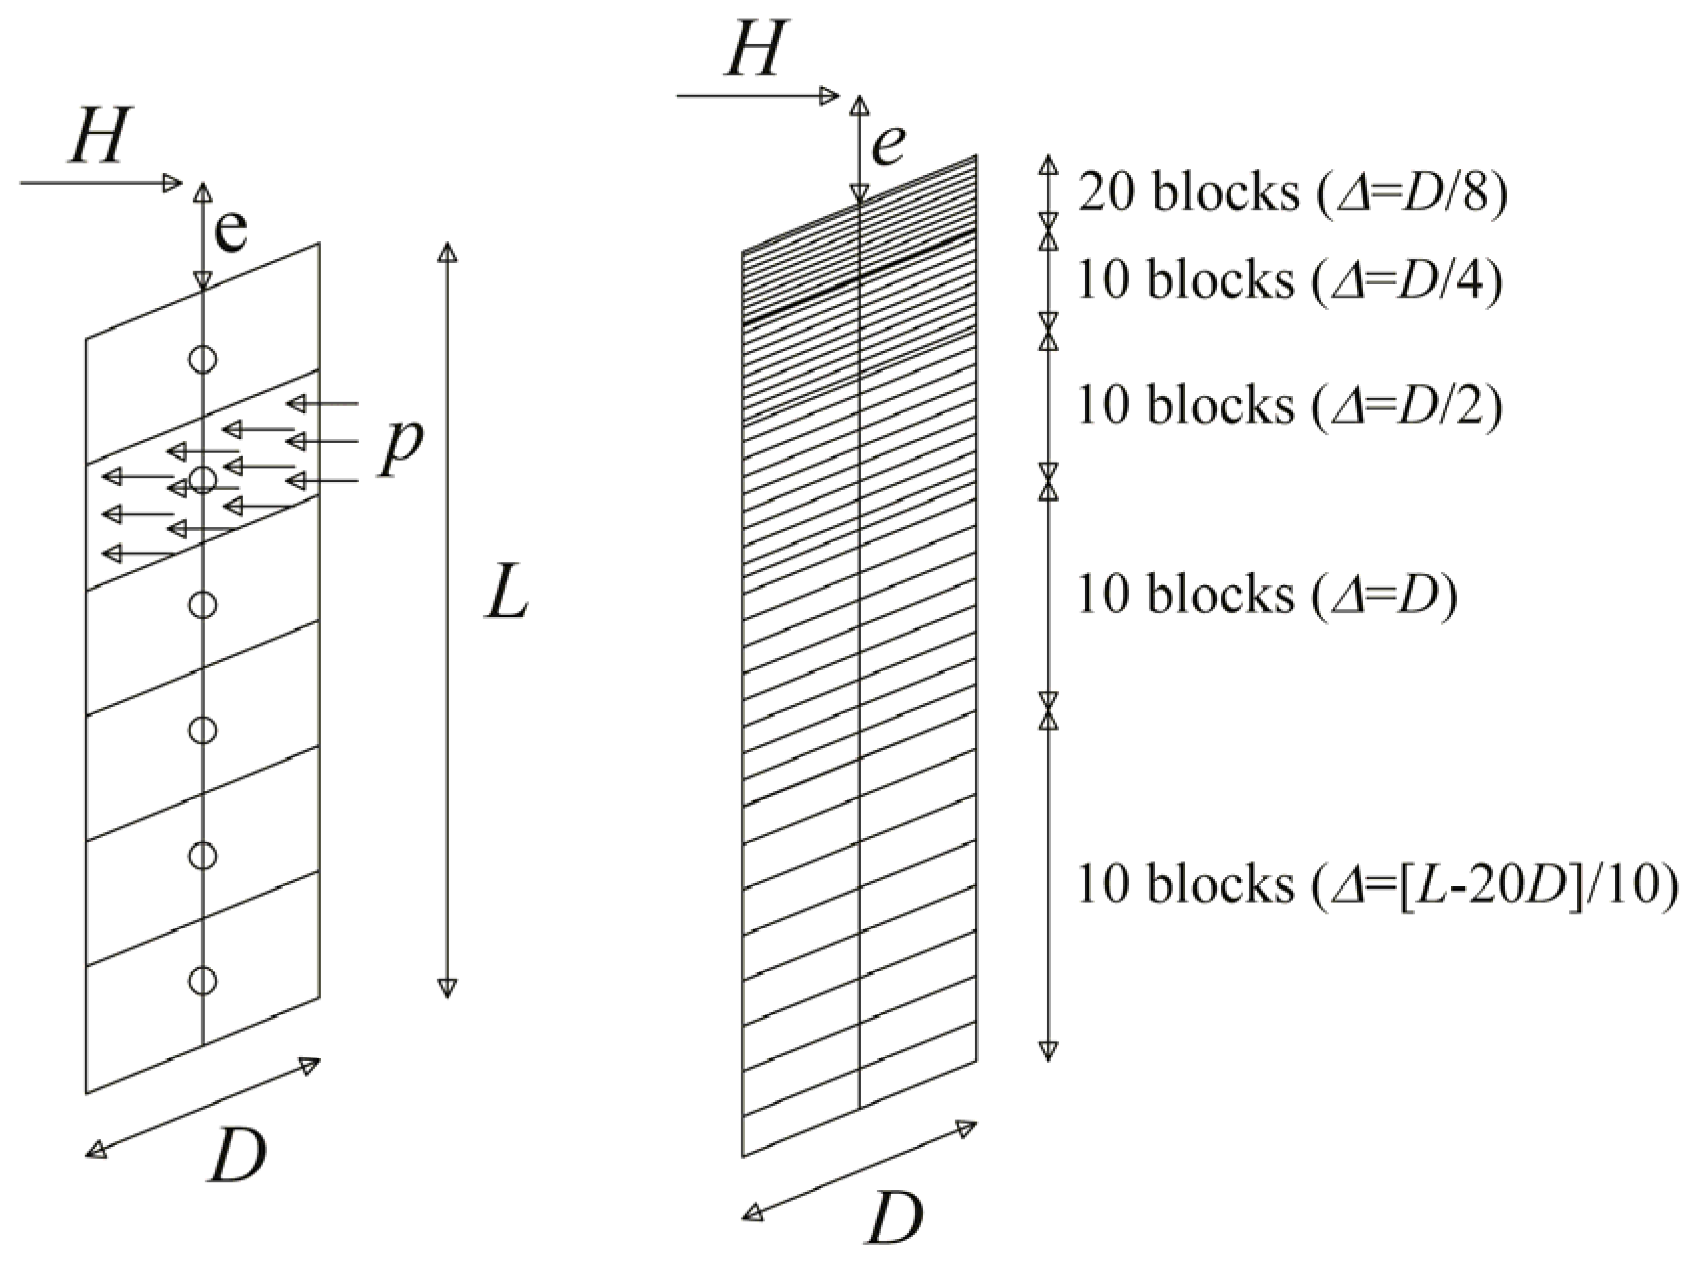
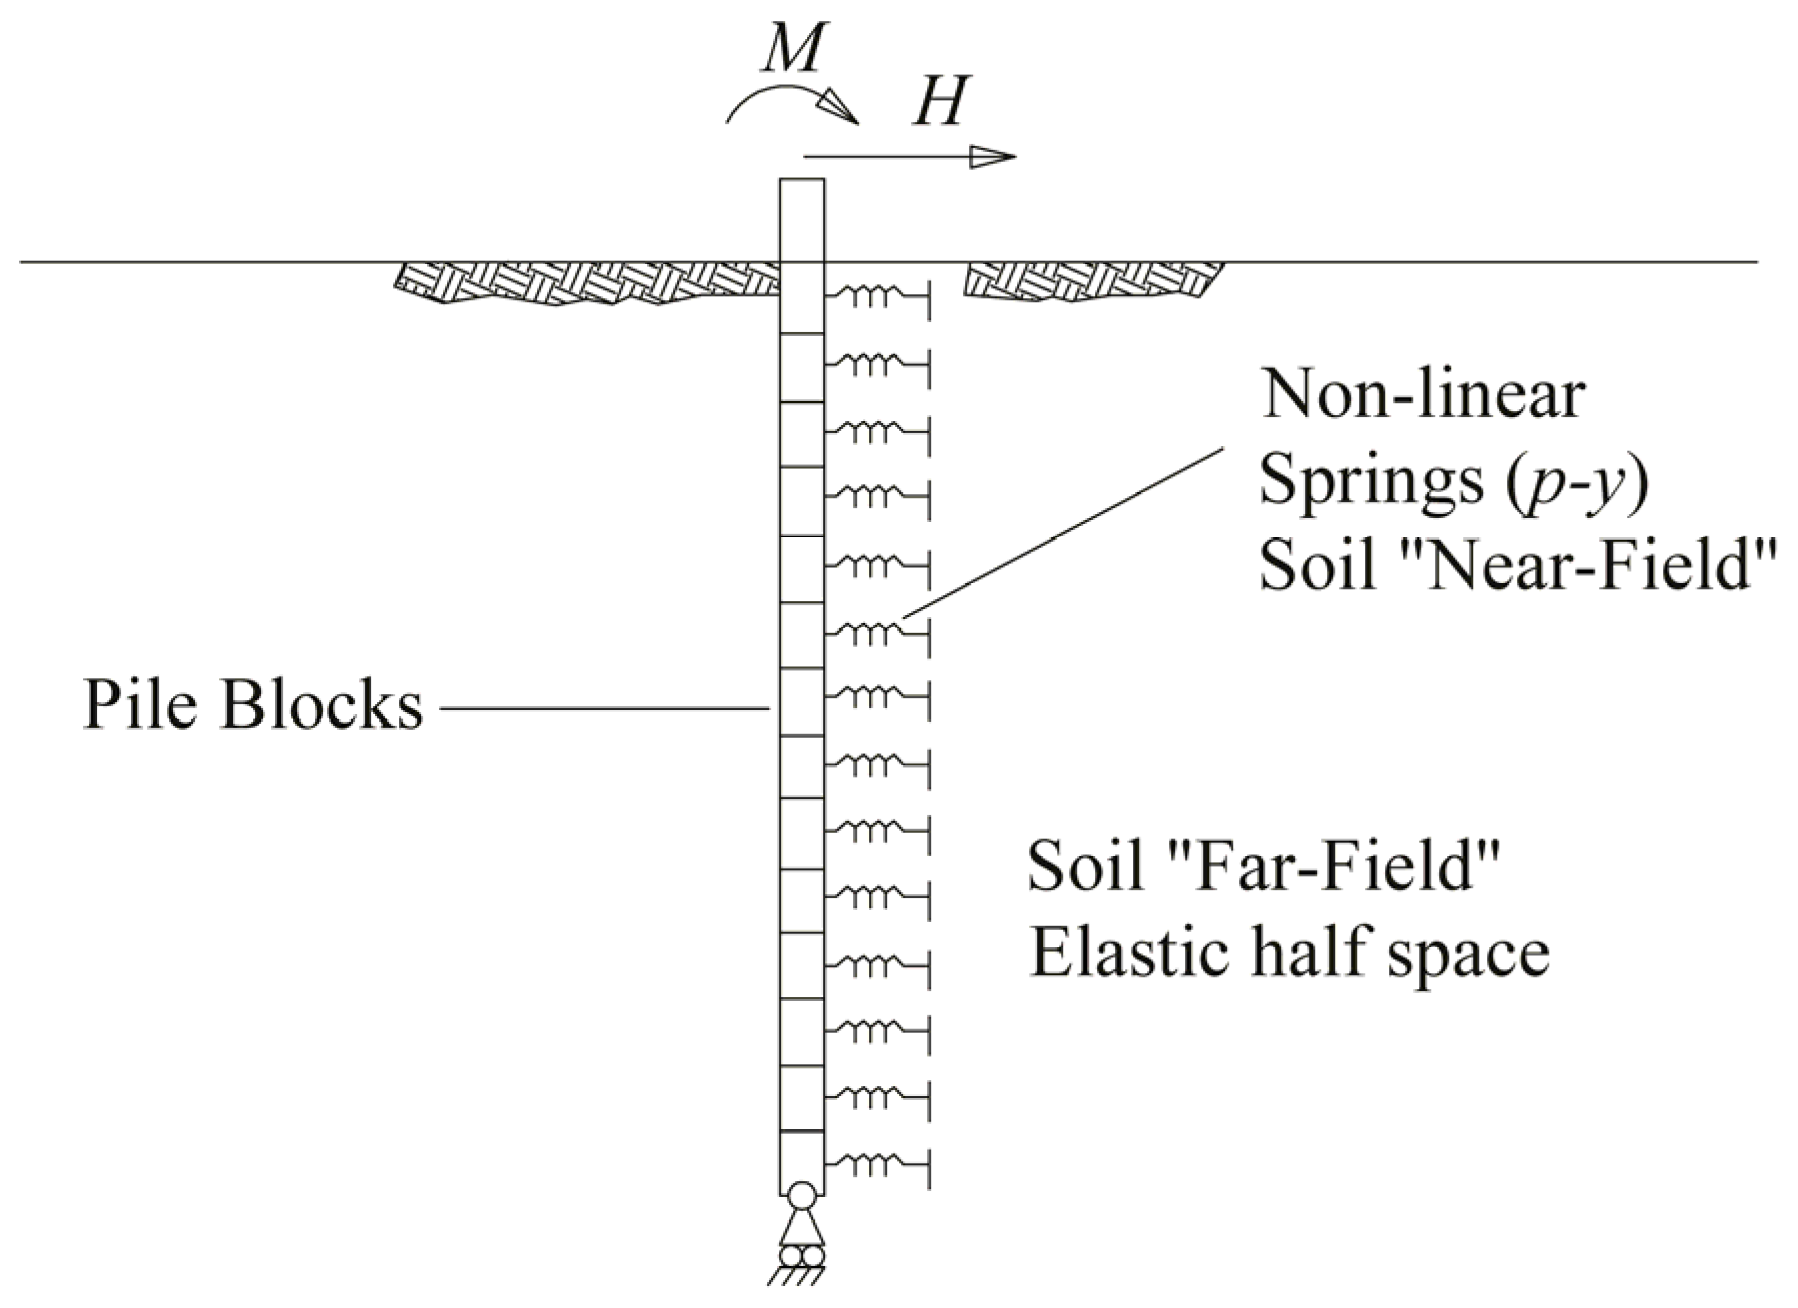
2.1. Pile Modelling

The proposed method was developed to capture the response of a single pile subjected to horizontal load. It consists of a hybrid BEM-p-y curve approach. The analysis is performed using a non-linear incremental tangent method. The pile is modeled as a vertical strip, geometrically defined by the outer diameter D and length L of the actual pile. In the proposed method the pile is a vertical floating pile, which cannot settle. The pile is discretized in 60 blocks of variable length with depth. With this kind of discretization, it is possible to minimize the calculation-time.
The definition of the discretization criterion was suggested by Landi [22] based on results obtained with a parametric study on a free-to-rotate single pile embedded in a homogeneous elastic half-space. Adopting a homogeneous discretization with depth when the number of blocks gradually increases, the solution becomes increasingly accurate, reaching an n* value beyond which the solution remains unchanged. The parametric study in the work of Landi [22] showed that by decreasing the relative stiffness K = Ep/Es the dependence of the response on the number of blocks starts to increase. Using an n value equal to 60 leads to an error that varies as a function of the relative stiffness K = Ep/Es: for K = 101, 102, 103, 104 the error is 20%, 10%, 5%, 2% respectively, in the evaluation of the pile-head deflection and the maximum bending moment. Since the displacements are mainly localized at a depth corresponding to 10–15 pile diameters, a suitable discretization is when the element height is sufficiently small for depths close to the ground surface.
On the basis of these observations, Landi [22] introduced the discretization shown in Figure 1, and in this case for K = 101, 102, 103, 104 the error was 8%, 7%, 4%, 2%, respectively, in the prediction of pile-head deflection. For the maximum moment along the pile shaft, the error was 8%, 5%, 2.5%, 1%, respectively.
The resulting discretization is shown as follows (Figure 1):
  • 20 blocks with a thickness ∆ = D/8, starting from the ground level up to a depth of 2.5D;
  • 10 blocks with a thickness ∆ = D/4, starting from a depth of 2.5D up to a depth of 5D;
  • 10 blocks with a thickness ∆ = D/2, starting from a depth of 5D up to a depth of 10D;
  • 10 blocks with a thickness ∆ = D, starting from a depth of 10D up to a depth of 20D;
  • 10 blocks with a thickness ∆ = (L − 20D)/10, starting from a depth of 20D up to the pile base depth.
The pile flexibility matrix, in case of linear elastic behaviour, is obtained using the elastic beam theory, and each coefficient of this matrix can be expressed using Equation (1) (Figure 2).
a i j = z i 3 3 E p I p + z i 2 ( z j z i ) 2 E p I p   if   z i < z j a i j = z j 3 3 E p I p + z j 2 ( z i z j ) 2 E p I p   if   z i z j
In this way, the horizontal displacement of each pile-block assumes the expression as in Equation (2).
y i = j = 1 n a i j P j + y 0 + θ 0 z i
in which Pj represents the load applied at the generic pile-block j (located at depth zj), and y0 and θ0 are the unknown displacement and rotation at the pile-head. Obviously if the pile-head is fixed, the rotation becomes a known term. Each pile-point displacement is a function of n + 2 (or n + 1, for fixed condition) unknowns, n pile-soil interface pressures, y0 and θ0.
The proposed method analyses both steel-pipe and reinforced concrete piles. For the analysis of steel piles, the flexural rigidity EpIp is assumed to be constant (which means hypothesizing a linear-elastic behaviour of the section until the ultimate bending moment occurs). For reinforced concrete sections, the development of cracks, even at low values of the bending moment, requires a different modeling for the pile response. For this material, in fact, it is also necessary to know the mechanical properties of both the concrete and steel, the number of longitudinal bars, and the spacing of the transverse reinforcement. These data provide the basis for the moment-curvature relationship (for each axial load value) for the reinforced concrete cross-section. The “moment-curvature-axial load” relationship is obtained by imposing the equilibrium equations to the translation and rotation at the geometric center of gravity of the section, varying the curvature and the deformation at the most compressed fiber in the section. This model has the additional feature of taking the influence of tension stiffening into account, as presented in Morelli et al. [23].
The main assumptions of the tension stiffening model are:
  • the conservation of planar sections;
  • concrete tension strength equal to zero for cracked sections;
  • perfect bonding between steel bars and the surrounding concrete;
  • the constitutive model proposed by Mander et al. [24] for confined concrete in compression;
  • the constitutive model proposed by Popovics [25] for unconfined concrete in compression;
  • the constitutive model proposed by CEB-FIP [26] for concrete in tension;
  • a simple strain-hardening model or a bilinear model for steel reinforcement;
  • a bond-slip law as suggested by Sigrist [27];
  • the tension stiffening is considered using a variable elastic modulus for the concrete in tension along a pile-block between two consecutive cracks;
  • the crack spacing can be estimated using the expression suggested by the CEB-FIP;
  • no other secondary cracks develop between two consecutive cracks.
Using these assumptions, the “average moment-curvature” relationship for a representative pile-section can be estimated as the weighted average of the moment-curvature relationships computed in the middle, at a quarter, at three quarters and at the cracked section of a block between two cracks.
Details on this model are presented in Morelli et al. [23], however this model represents an extension to the circular section of another model, which considers the tension stiffening influence for rectangular reinforced concrete sections, developed by Salvatore et al. [28]. Once the average moment-curvature relationship has been obtained, the coefficients of the flexibility matrix need to be defined using Equation (3) for the reinforced concrete pile, which is modeled as a beam with a variable flexural rigidity, EpIp, along the pile shaft. In Equation (3), the variation of both Ep and Ip along the shaft is fully considered by changing Ip of the section, while Ep is kept constant. Consequently, in an incremental analysis, the pile flexibility matrix needs to be updated at each load increment.
a i j = k = 1 i 1 [ ( ( l k l k 1 ) 3 3 E p I k + ( z j l k ) ( l k l k 1 ) 2 2 E p I k ) + ( ( l k l k 1 ) 2 2 E p I k + ( z j l k ) ( l k l k 1 ) E p I k ) ( z i l k ) ] + ( ( z i l i 1 ) 3 3 E p I i + ( z j z i ) ( z i l i 1 ) 2 2 E p I i )   if   z i < z j a i j = k = 1 j 1 [ ( ( l k l k 1 ) 3 3 E p I k + ( z j l k ) ( l k l k 1 ) 2 2 E p I k ) + ( ( l k l k 1 ) 2 2 E p I k + ( z j l k ) ( l k l k 1 ) E p I k ) ( z i l k ) ] + ( ( z j l j 1 ) 3 3 E p I j + ( z i z j ) ( z j l j 1 ) 2 2 E p I j )   if   z i z j
In Equation (3), zi and zj represent the distance between the fixed node in Figure 2 and the point along the beam in which the displacement is considered and the distance between the same fixed node and the point where the load is applied, respectively. On the other hand, lk, represents the distance between the fixed node and the lower part of block k, and EpIk is the flexural rigidity of block k (Figure 3).
Equation (3) was obtained using the commonly used approach for analyzing beams of variable flexural rigidity (Hetenyi [29], Reese and Van Impe [30]). This method consists of two steps: in the first step the beam (i.e., the pile) is divided into segments, and each segment is studied separately, and in the second step boundary conditions and continuity are imposed.

2.2. Soil Modelling

The “far-field” soil (soil at small strain level) is modeled as a multi-layered elastic half-space. BEM analysis requires an appropriate elementary singular solution to be integrated on the surface of the problem domain. In the case of piles subjected to horizontal loading, the elastic Mindlin [13] solution is generally used. This solution, which evaluates the pile-soil interactions, is valid and rigorous only in the case of a homogeneous elastic half-space, however it can still be considered valid in the case of a multi-layered elastic half-space as reported by Poulos and Davis [14]. The horizontal displacement sij at a point i belonging to the half space by a horizontal load Pj applied at point j can be expressed as in Equation (4) (Figure 4). Where the term bij represents the general expression for each “far-field soil” flexibility matrix coefficient.
s i j = P j ( 1 + ν ) 8 π E s ( 1 ν ) [ ( 3 4 ν ) R 1 + 1 R 2 + x 2 R 1 3 + 3 4 ν R 2 3 x 2 + 2 c z R 2 3 ( 1 3 x 2 R 2 2 ) + 4 ( 1 ν ) ( 1 2 ν ) R 2 + z + c ( 1 x 2 R 2 ( R 2 + z + c ) ) ] = b i j P j
The “near-field” soil (soil subjected to high stress and strain variations) and its non-linear response is introduced by placing non-linear springs (zero-length elements) in series to each pile-half-space node (Figure 5), with a shape dependent on the soil type. In the present study, the “p-y” curves proposed in [31,32,33] are used. The input data required for the soil are: the elastic modulus Emax at small strain levels (which can be estimated starting with the maximum shear modulus Gmax), the Poisson ratio, and the angle of internal friction (and the relative density DR) or the undrained shear resistance if the soil is cohesionless or cohesive, respectively.
In order to simply the modeling, the development of additional shear stresses along the pile shaft interface is neglected.
Currently, it is only possible to analyze free-head or fixed-head single-piles, however a different restraint can be added. The computation process ends with the calculation of the unknowns, which in this case are the soil pressures acting at the pile-soil interfaces, the rotation, and the horizontal displacement at the pile-head section. The analyses are performed in an incremental manner, using an adaptive step-size control.

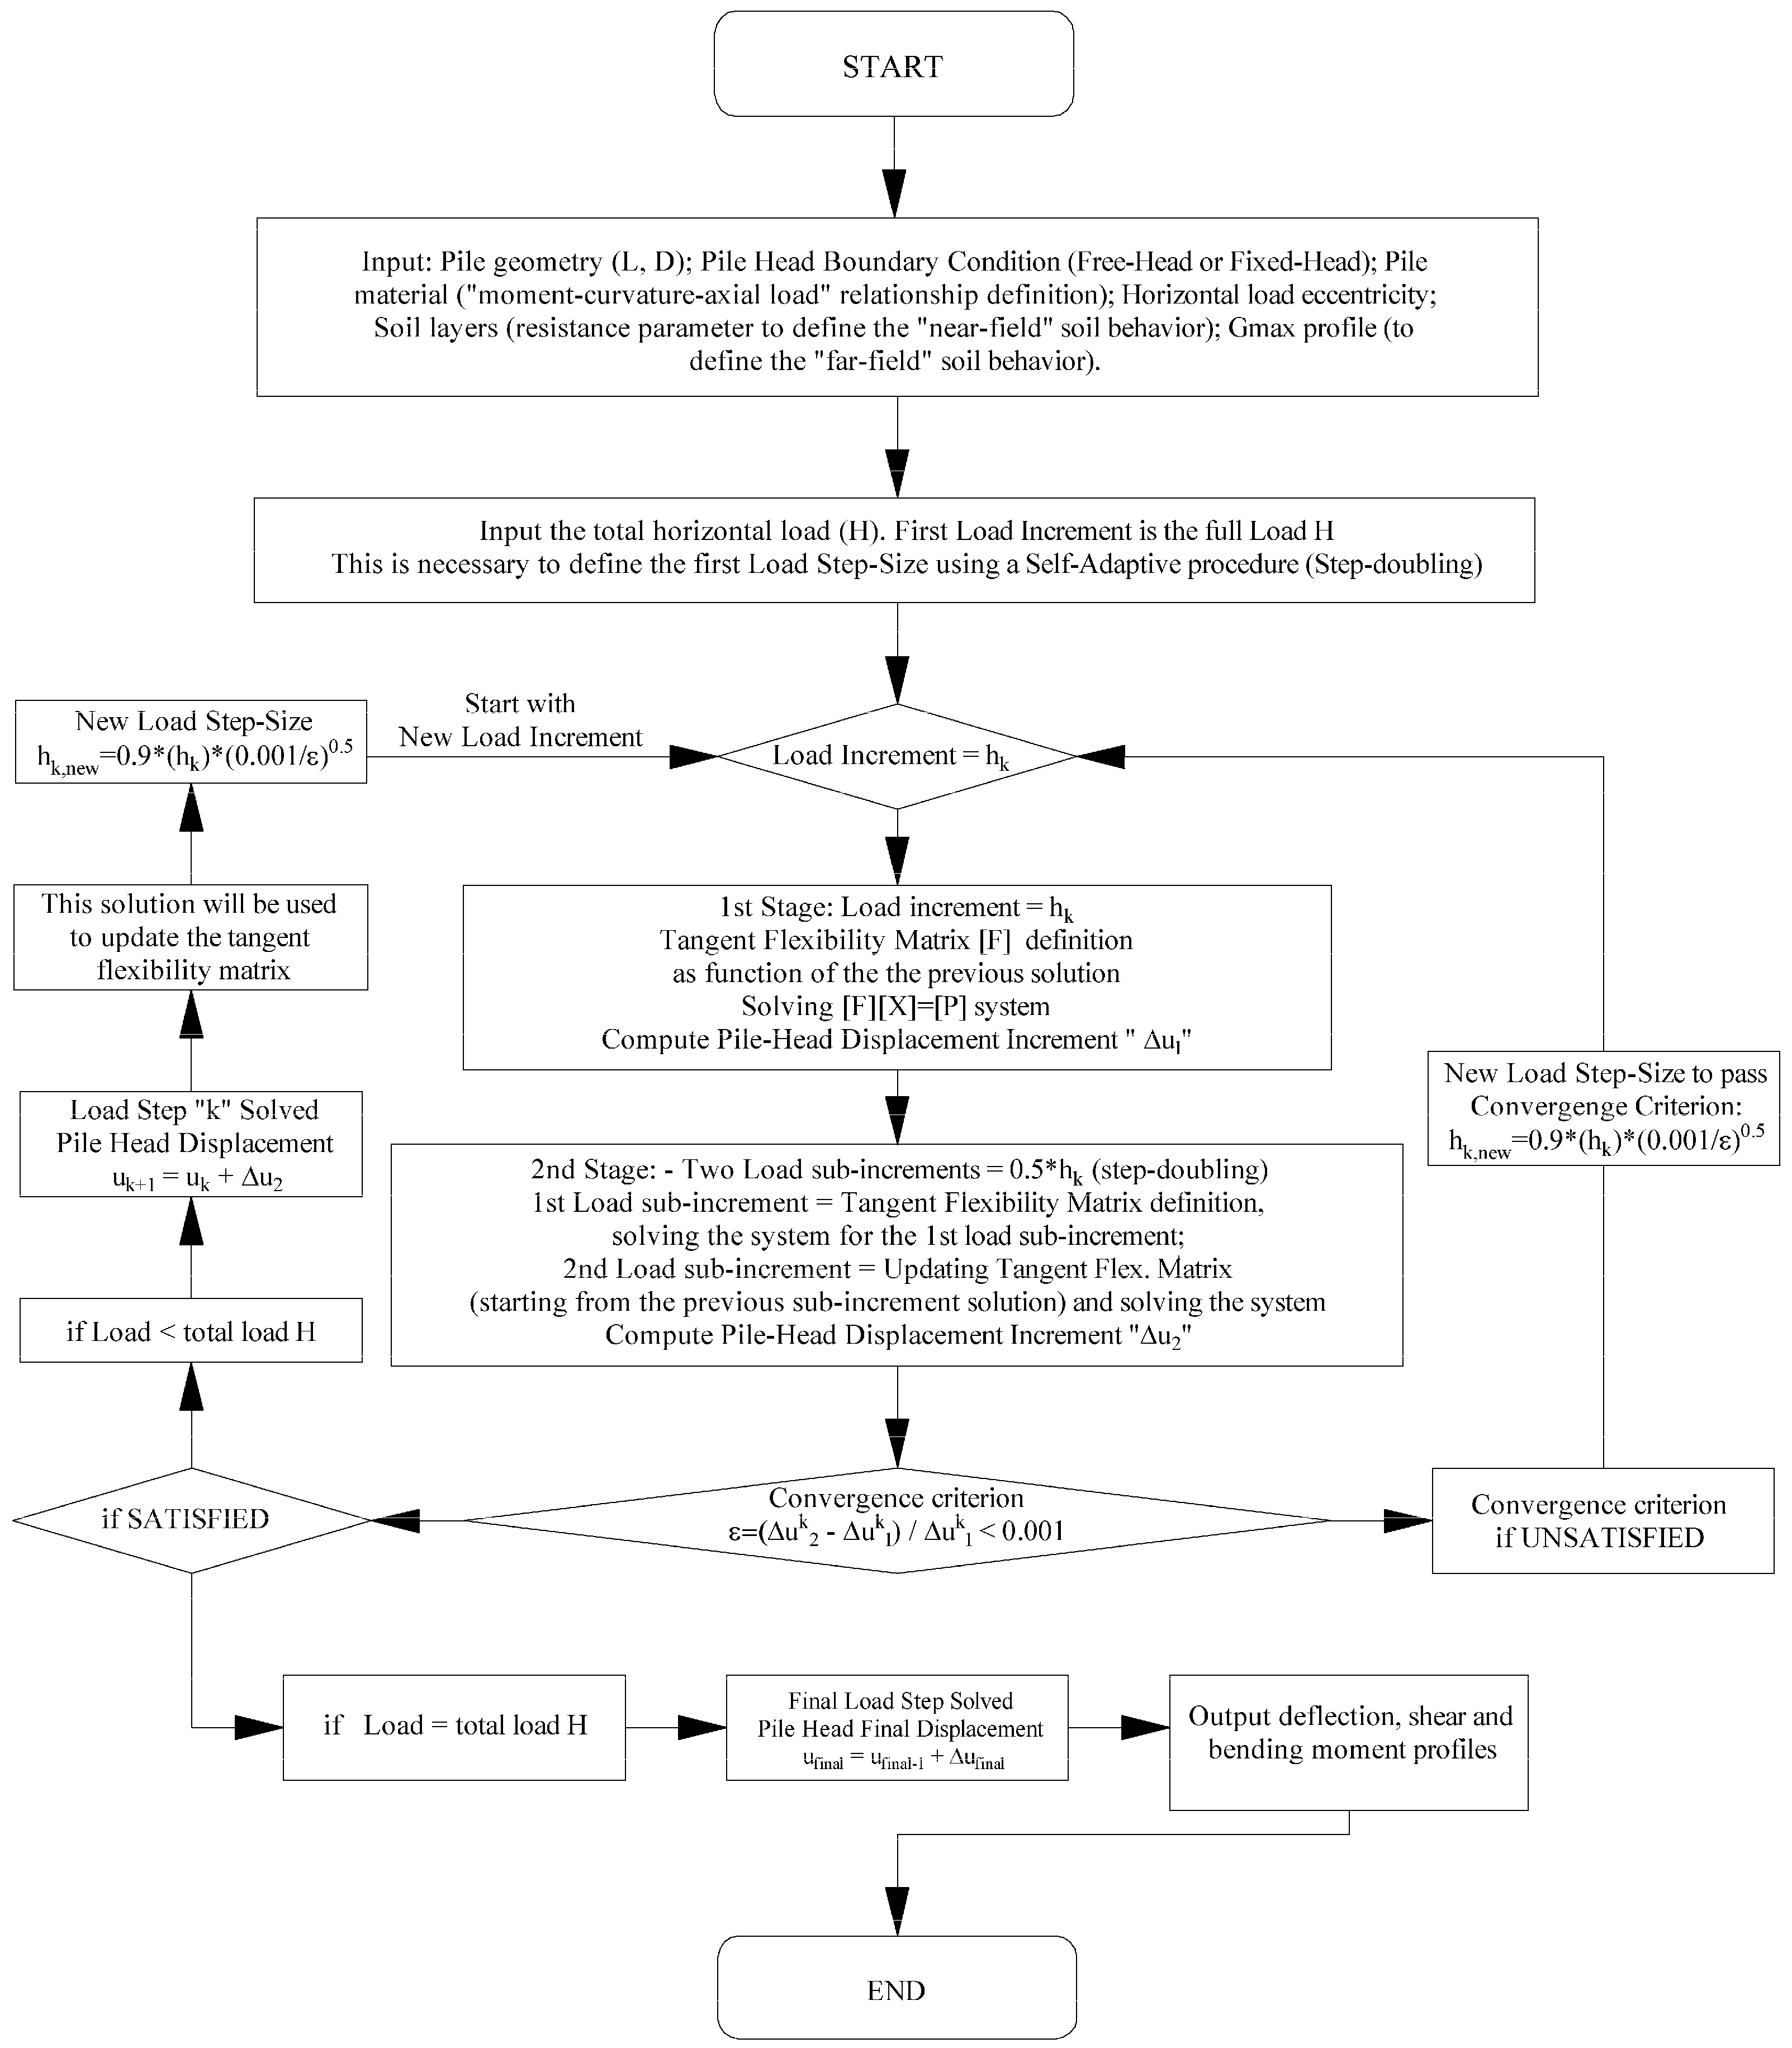
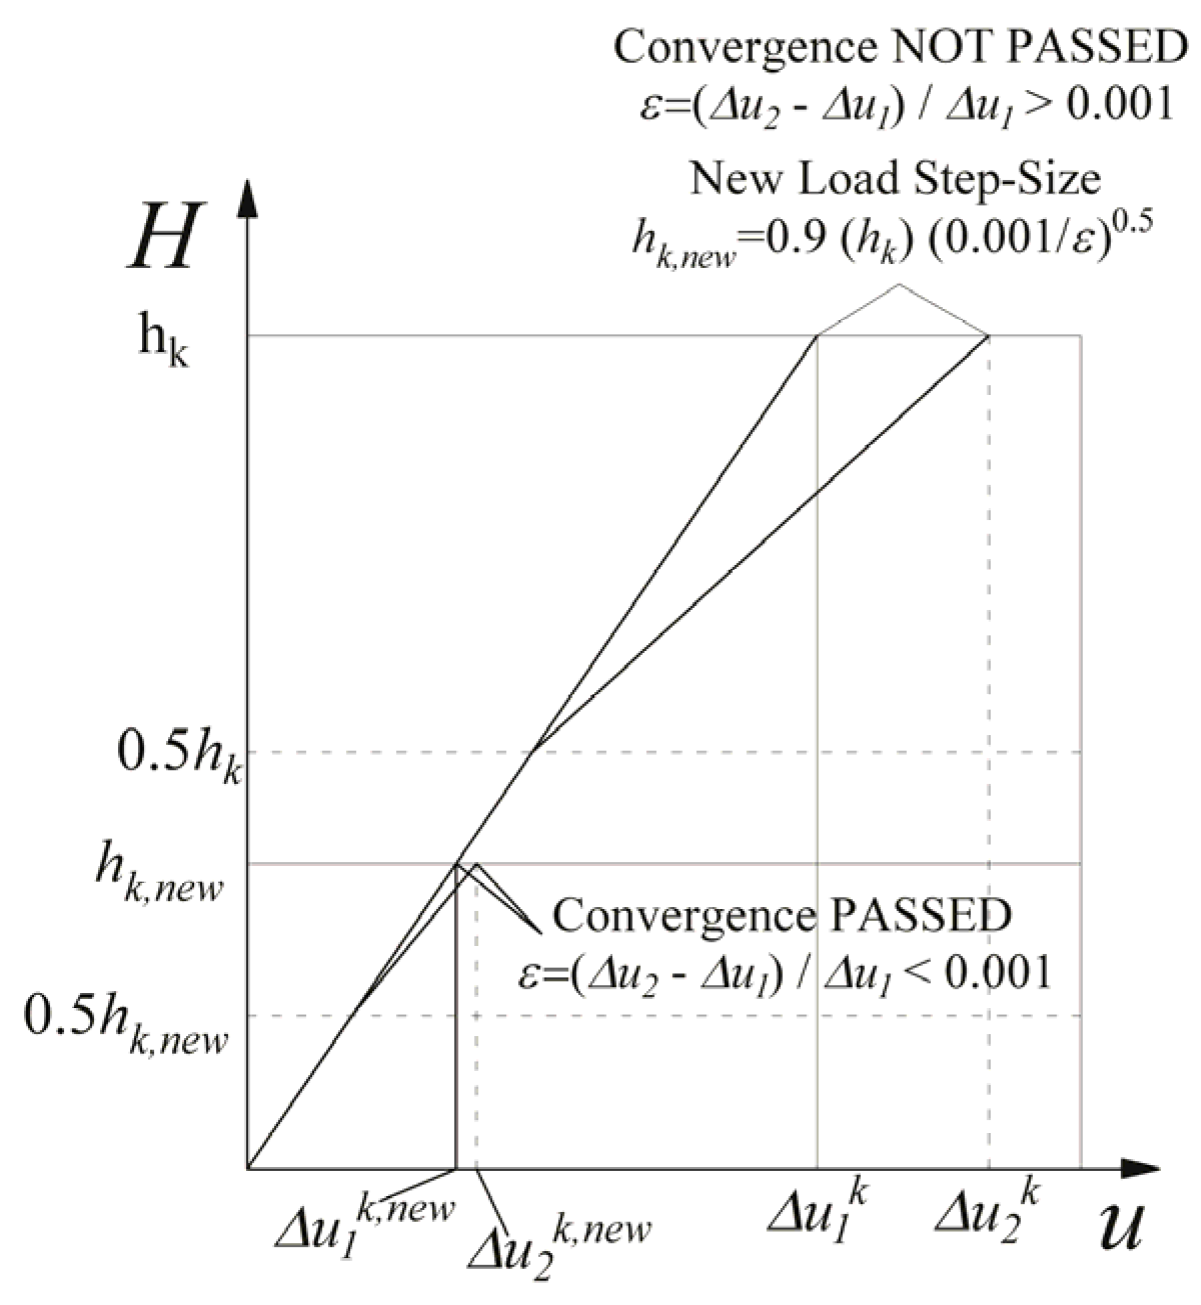
2.3. Non-Linear Solution Procedure

The solution system is defined as: [F][X] = [P] (Equation (5)). [X] is the unknowns vector composed of k + 2 or k + 1 terms for free or fixed head conditions, respectively, where k is the number of pile blocks, p are the k unknown pressures acting at the pile-soil interface, y0 is the single pile displacement at the pile-head, θ0 is the pile-head rotation. [P] is the known term vector, which has the same dimension as the vector [X]. [F] is a (k + 2) x (k + 2) or (k + 1) x (k + 1) matrix, obtained by adding the k x k pile flexibility matrix [FP] (containing the aij coefficients), the k x k soil (“far field”) flexibility matrix [FSFF] (composed of the bij coefficients), and the k x k soil “near field” flexibility matrix [FSNF] (composed of the cii coefficients, representing the flexibility of each non-linear spring). The final two (or one in the fixed-head condition) rows and columns of the matrix [F] are necessary to impose the equilibrium and to complete the compatibility equations at each pile-spring-soil interface node, respectively.
[ a 11 + b 11 + c 11 a 1 j + b 1 j a 1 k + b 1 k 1 z i a i 1 + b i 1 a i i + b i i + c i i a i k + b i k 1 z i a k 1 + b k 1 a k j + b k j a k k + b k k + c k k 1 z k 1 1 1 0 0 z 1 z j z k 0 0 ] [ p 1 Δ 1 D p i Δ i D p k Δ k D y 0 θ 0 ] = [ 0 0 0 H M ]
In Equation (5), H is the horizontal load applied and M is the bending moment applied.
The [FSNF] is a diagonal matrix, and each coefficient represents the “p-y” tangent flexibility evaluated at each spring displacement “y” value reached at each pile-spring node at the previous load increment (or sub-increment) step. Elements of the soil “far-field” matrix [FSFF] always remain constant, and are used to consider the interaction between the non-linear springs. The pile flexibility matrix, [FP], only in the case of a non-linear “moment-curvature” relationship for the pile section, is updated at each step, using the tangent flexural rigidities of the section, according to the bending moments reached at each pile node in the previous load increment (or sub-increment). In addition, at each load step (or sub-step) a check is carried out to determine whether the ultimate soil resistance at the pile-soil interface has been reached.
Once the initial flexibility matrix has been calculated, the total horizontal load is applied in the first step of the solution. At each generic load increment hk, an iterative process is performed where two solutions are obtained, the first using hk as the load increment, the second using two load steps equal to hk/2. The iterative scheme is described in Figure 6, which, for the sake of simplicity refers to the explicit Euler method with step-doubling and adaptive step-size control. However, a fourth order Runge-Kutta method can also be used to obtain some improvement in the accuracy of the solution.
Once these two solutions have been computed, the incremental ratio, ε, is computed according to Equation (6).
ε = Δ u 2 Δ u 1 Δ u 1
where ∆u1 and ∆u2 are the incremental displacement at the pile-head evaluated using one and two steps, respectively. The ε value is compared with a predefined tolerance taken as equal to 0.001 (Figure 7).
When this convergence criterion is not passed, the iterative process starts again with an updated load increment hknew which should be able to achieve the desired accuracy and can be estimated using Equation (7), as described in Press et al. [34].
h k n e w = S F h k ( t o l ε ) 1 p + 1
where p is the order of the method used (in the Euler method p = 1, in the Runge-Kutta method p = 4), and SF is a “safety factor” (taken as equal to 0.90) to guarantee the success in the next attempt. When this convergence criterion is passed, Equation (7) is used again to estimate the next step-size. The procedure stops when the final lateral load H is reached. Finally, the entire load-deflection curve and the deflection, shear, bending moment and pile-soil interface pressure profiles along the pile shaft at each load-step can be evaluated.

2.4. Influence of Suction on Pile Lateral Response

Suction is an important aspect in pile foundation subjected to lateral loads because the response of this foundation system is mainly affected by the shallower soil layers. The proposed method uses the “MK-Model” (Modified-Kovacs Model) described by Aubertin et al. [35]. This model makes use of a parameter defined as the equivalent capillary rise hc0 in the porous medium. The role of this parameter is the same as the average capillary rise in the original model developed by Kovacs and is calculated using the expression for the rise of water in a capillary tube (hc) with a diameter d.
For the sake of convenience, the expression to estimate the equivalent capillary rise in granular soils (Equation (8)) and in cohesive/plastic soils is reported below (Equation (9)).
h c 0 ( c m ) = 0.75 e D 10 [ 1 + 1.17 log C U ]
where D10 (in cm) is the diameter corresponding to 10% passing on the grain-size distribution curve, CU is the coefficient of uniformity (=D60/D10), and e is the void ratio.
h c 0 = 0.15 ρ s e w L 1.45
where wL is the liquid limit, and ρs is the solid grain density (kg/m3).
The MK-Model uses the equivalent capillary rise as a reference parameter to define the relationship between the degree of saturation Sr (or volumetric water content θ) and the matric suction Ψ. The model considers that water is held by capillary forces, responsible for capillary saturation Sc, and by adhesive forces, causing saturation by adhesion Sa. The Sc component is more important at relatively low suction values, while the Sa component becomes dominant at a higher suction when most capillary water has been withdrawn. The relationship proposed in the MK-Model is written as in Equation (10) for the degree of saturation:
S r = θ n = S c + S a ( 1 S c )
In this equation, to ensure that this component does not exceed unity at low suction a truncated value of the adhesion component Sa* is introduced in place of Sa used in the original model. The contribution of the capillary and the adhesion components to the total degree of saturation is defined as a function of hc0 and Ψ using the equations reported in Aubertin et al. [35].
Once the suction value Ψ has been obtained, the relationship (Equation (11)) proposed by Bishop [36] can be used to estimate the effective stress state.
σ v 0 = ( σ v 0 u a ) + χ ( u a u w )
where ua = air pressure; uw = water pressure; χ = effective stress parameter that is expressed as a function of the degree of saturation (Sr); and suction Ψ is equal to uauw.
In order to use Equation (11) correctly, the value of χ should be assessed on the basis of the actual degree of saturation of the soil layers above the water table. The relationship between χ and Sr is available in the literature for different soil types (for example in: Jennings and Burland [37], Bishop and Donald [38] and Bishop et al. [39]).
Implementing the “MK-Model” in the “hybrid BEM-py curve” method takes suction into account and increases the effective stress state of the upper soil layers. This thus increases both the stiffness and the resistance of the non-linear springs located close to the ground surface, which are expressed as a function of the soil stress state.

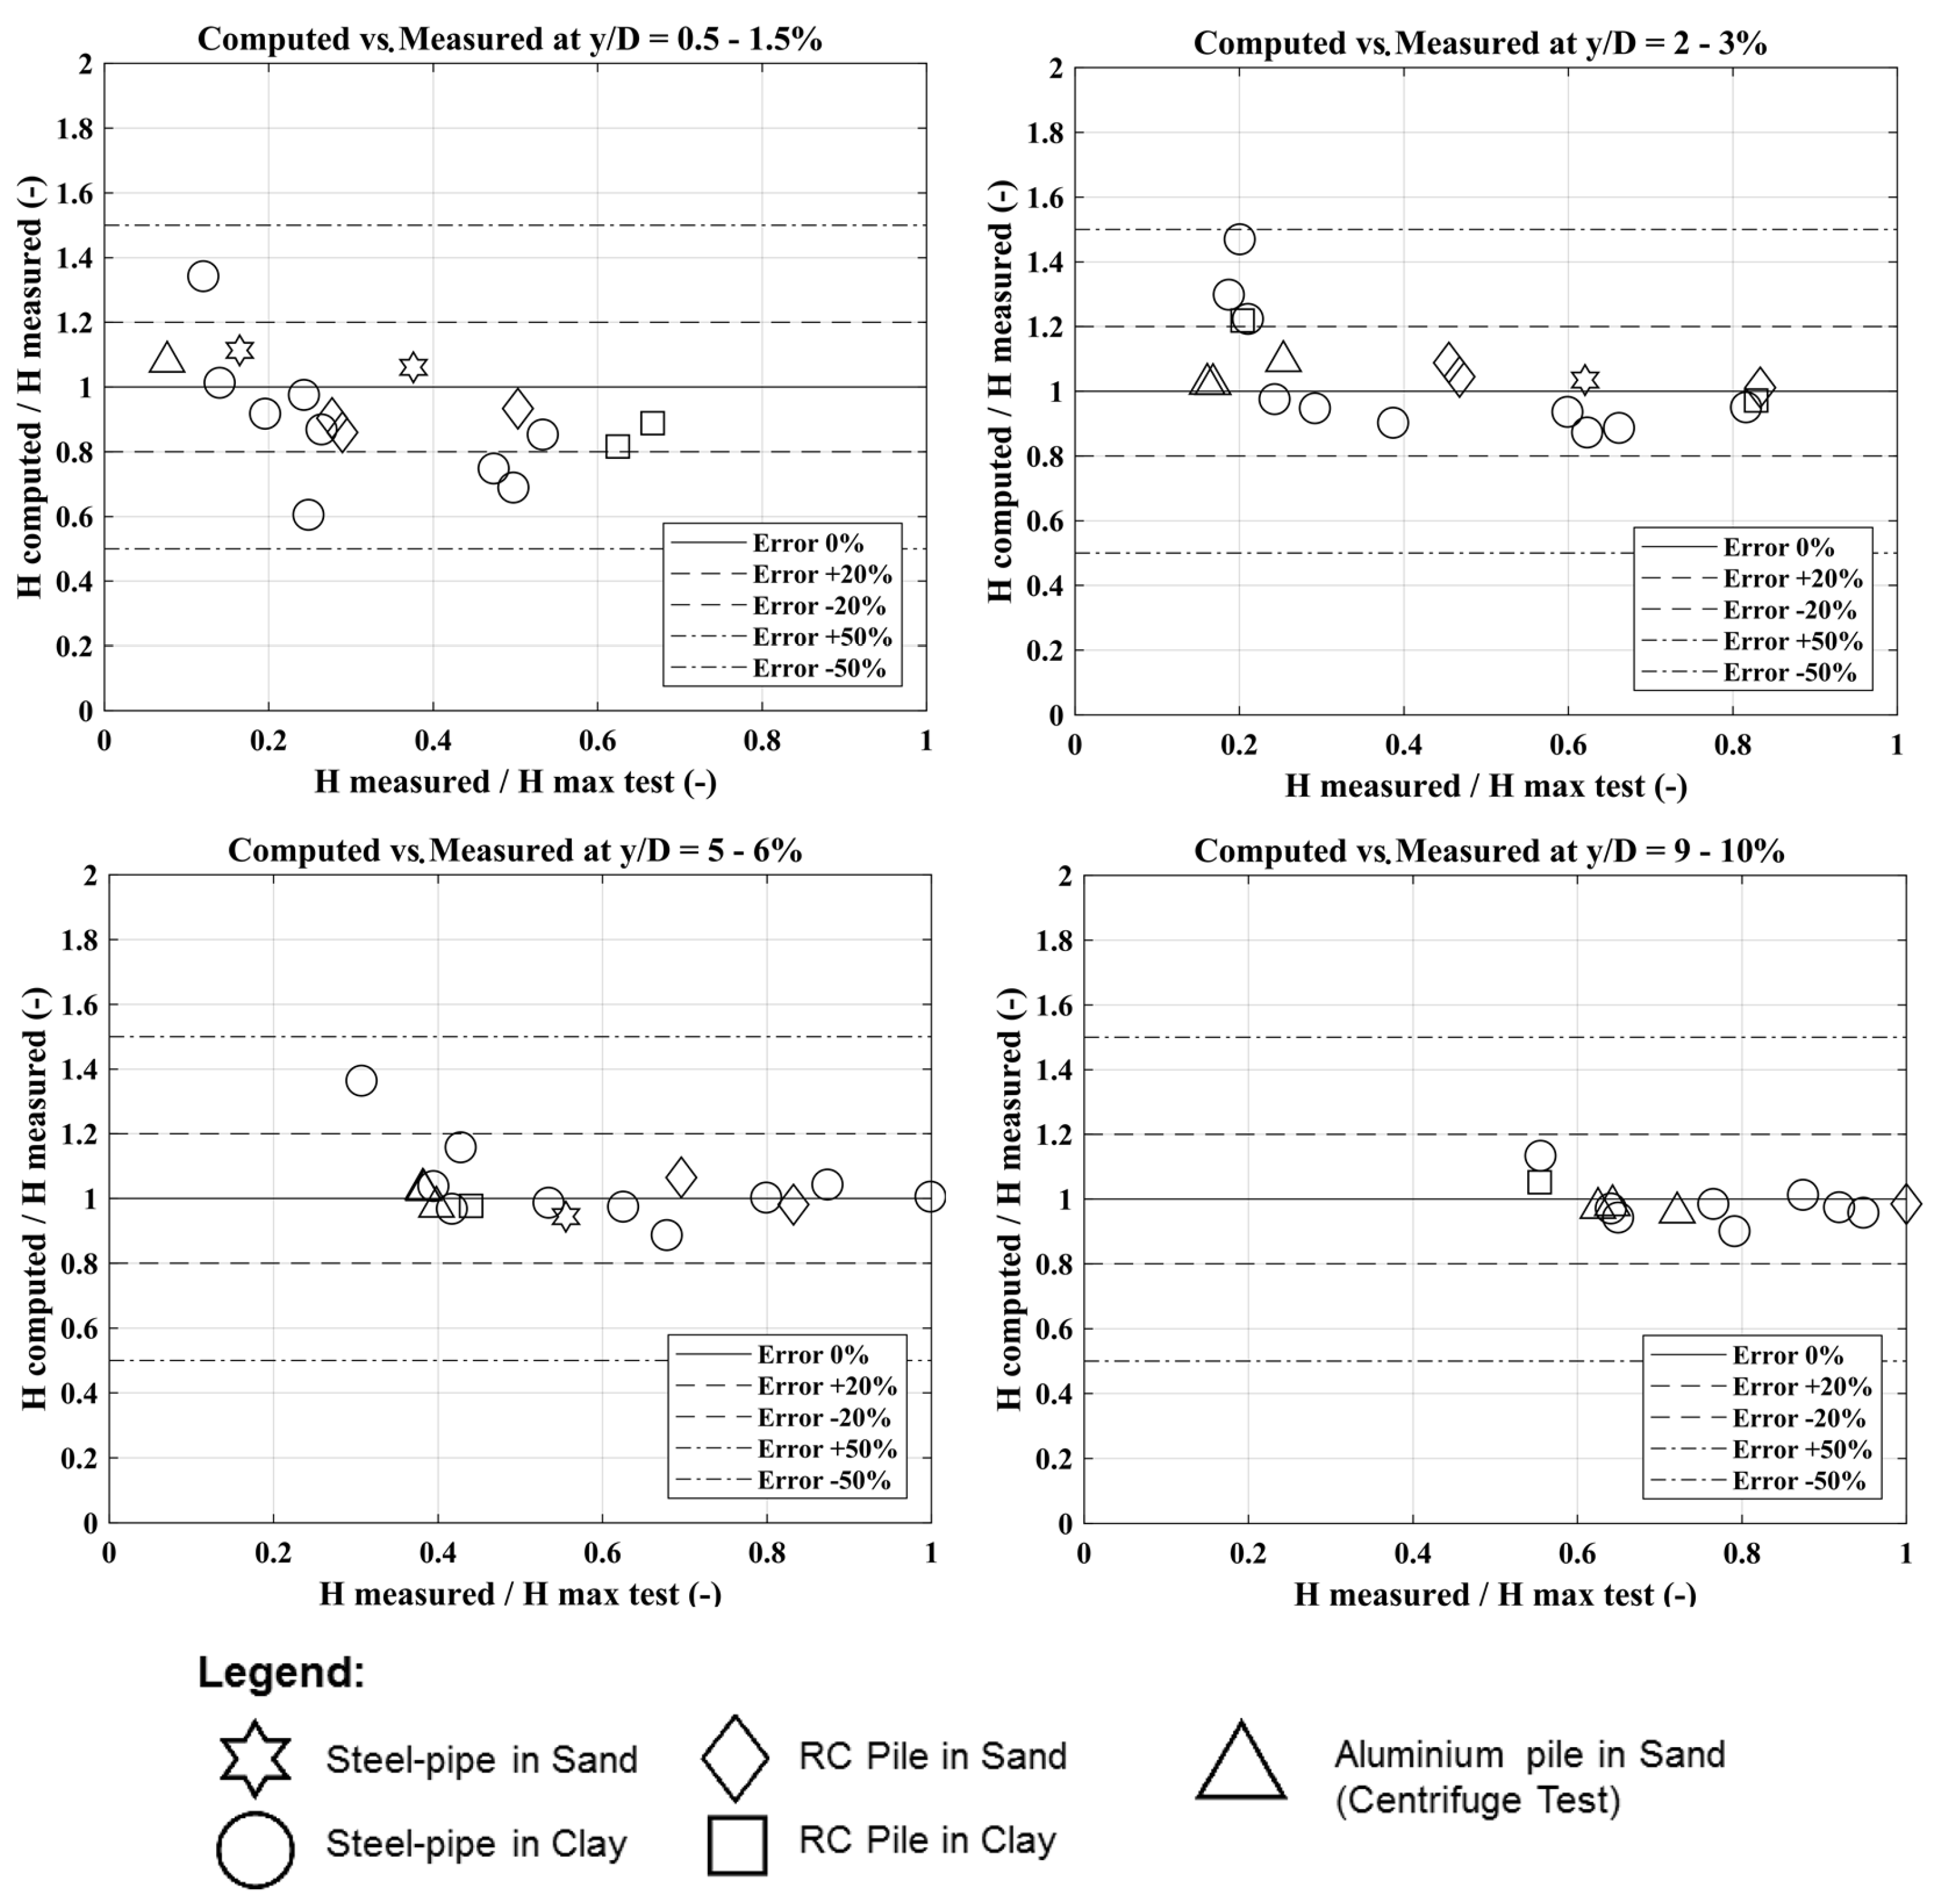
3. Validation of the Proposed Method

This section shows the prediction results of the single pile responses using the proposed “hybrid-BEM-py curve” method. The solutions obtained with the analyses are compared with the experimental results observed in lateral load tests on single piles both in coarse soils (sand and gravel) and cohesive soils (clays and silts) and both in steel pipes and reinforced concrete piles. The experimental results refer to lateral load tests reported in the literature with a total of 22 case histories for single pile analyses (Table 1). The aim of the analyses is to validate the proposed method. They are conducted not as a back analysis but as a class A prediction, directly using the actual pile mechanical and geometrical properties and the soil strength and stiffness parameters according to the interpretation of the in situ and laboratory tests data. The elastic modulus used as the input is a Young’s Modulus at small strain level Emax, which can be obtained starting with the Gmax (Shear Modulus at small strain levels) value, using the elastic relationship: E = 2G(1 + ν).
The results obtained highlight the possibility of providing a good forecast of the most representative aspects (pile-head displacement and rotation and maximum bending moment) of the single pile response.
Figure 8 shows a comparison between the measured and computed results. In these plots, the ratio between the measured horizontal load for a given displacement level (y/D) and the measured maximum lateral load during the test is on the x-axis, while the ratio between the computed and the measured load at the same displacement level is on the y-axis.
For 56 of the 65 reported points in Figure 8, the error in the load prediction is lower than 20%. The errors are higher for lower values of the relative displacements (y/D) and lower load level (Hmeasured/Hmax test). This statement is referred to the cases reported in [31,42,45,54]. In [45,54] the piles were filled with grout, so the initial pile flexural rigidity could be affected by the steel/grout interaction. In [31,42] the measured load vs. horizontal displacement plots present for lower load levels an unusual trend compared to the other cases.
For all the other cases, it seems that the comparison is satisfactory. The proposed model reproduces in a very accurate way the measured data for large diameter reinforced concrete piles in sand (diamond markers in Figure 8).
A comparison between the measured and computed data on a large-diameter reinforced concrete bored single pile tested in Taiwan by Huang et al. [43] is presented in the following section.

3.1. Analysis Results of a Specific Case Study

3.1.1. Soil Conditions and Pile Properties

A full-scale test program realized by Huang et al. [43] and set up in Taiwan, was used to evaluate the effects induced by the installation technology on the soil properties. Before installation, eight boreholes and eight SPT tests were performed, up to a depth of 80 m below the ground level (GL). Three CPT tests and two DMT tests were also conducted. The two CPT tests included the measurement of the shear wave velocity (SCPT). After installing the piles, but before the load tests, three DMT tests and three CPT tests were carried out. A comparison of the results obtained highlighted the most evident effects of the installation on soil properties occurring within the first 15 m of depth. The soil at the site, on the basis of samples and laboratory tests, was generally classified as silty sand (SM in the USCS classification) or silt (ML), with occasional layers of silty clay (CL). The water table was located at approximately 1 m below the ground level, and did not vary significantly during the tests. In Huang et al. [43] are fully presented the CPT, SPT and Gmax data profiles. The single bored pile had a diameter D equal to 1500 mm, a length, L, of 34.9 m and an intact flexural rigidity, EI, equal to 6.86 GNm2. Pile properties are summarized in Table 2.

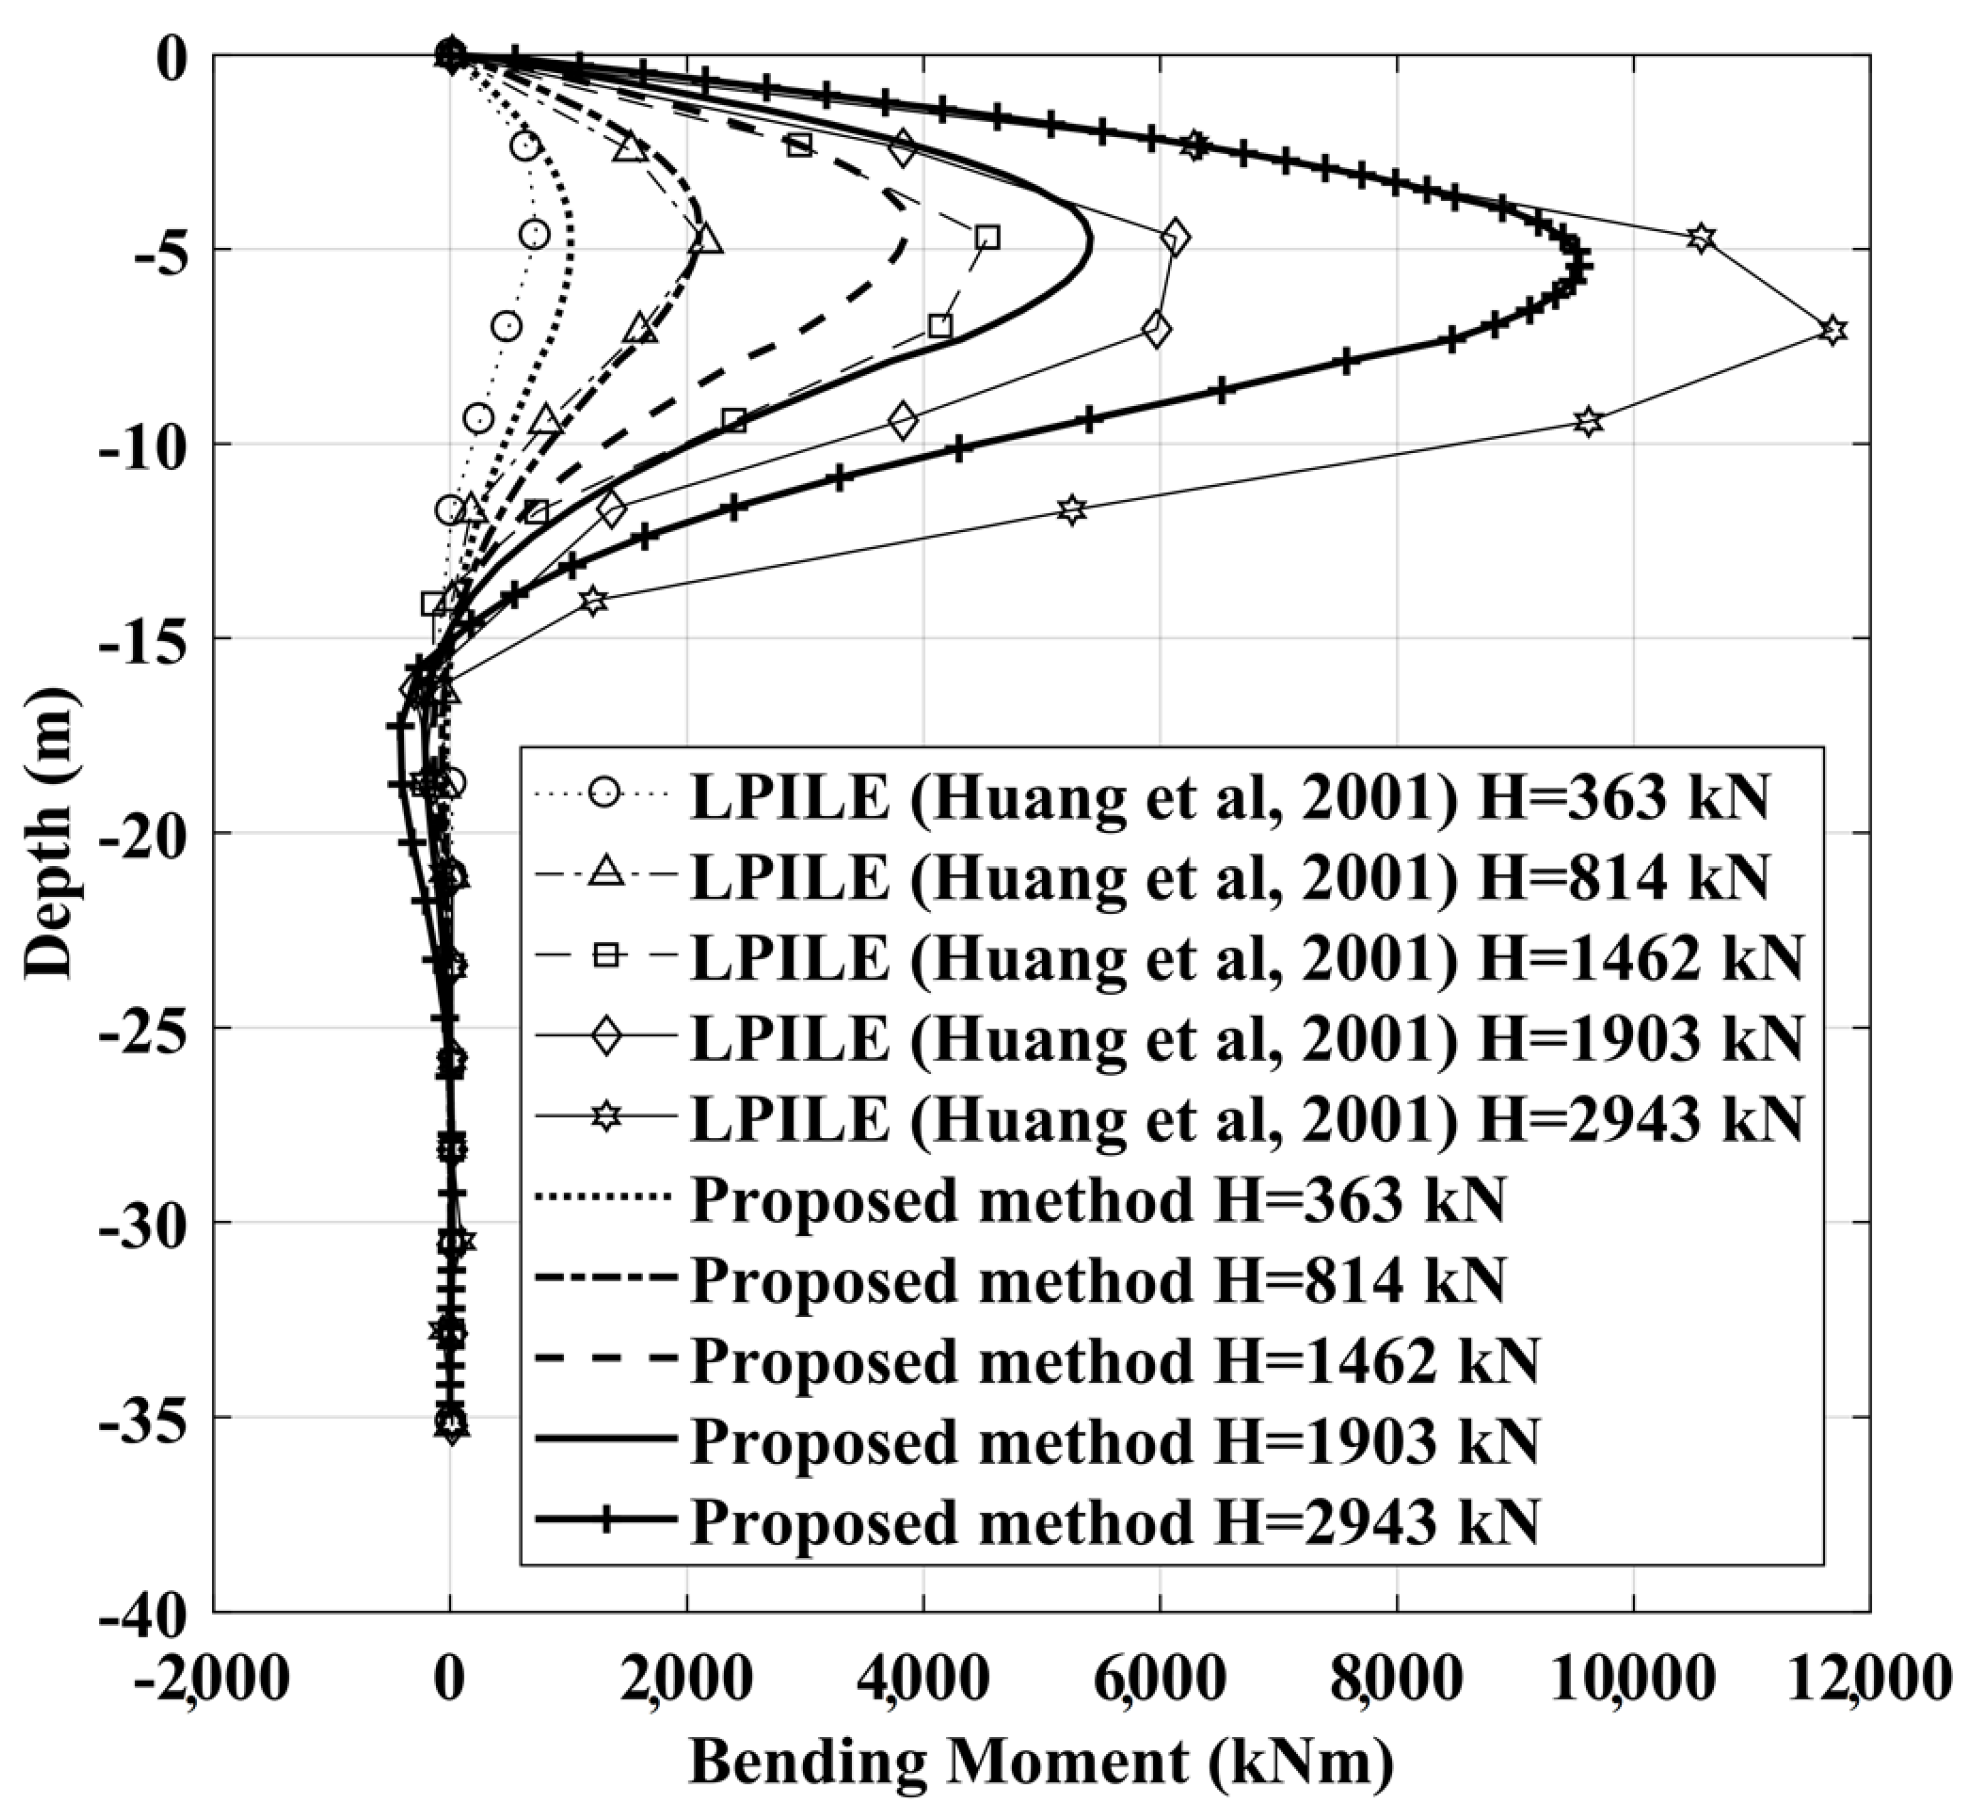
3.1.2. Single Bored Pile B7: Analysis Results

The soil unit weight, γ, of the soil was not reported in the article of Huang et al. [43] however it was estimated according to the interpretation of the CPT test data. Along the depth of interest, approximately equal to the first 15 m, corresponding to 10 pile diameters, the mean tip resistance was approximately 5 MPa. The mechanical properties of the pile used in the analysis were the same as those indicated in Table 2. Figure 9 presents the average moment-curvature relationship used in the analysis and computed using the model that considers the tension stiffening.
On the basis of the data provided by the CPT tests, a friction angle ϕ’ of 34° was used, obtained with the correlation proposed by Mayne [57].
φ = 17.6 + 11 log 10 ( q t σ v 0 σ v 0 p a t m )
The shear modulus profile at small strain levels was that provided by the authors in the SCPT data, but was simplified in the analysis, and thus a Gmax profile linearly increasing from 15 to 150 MPa was adopted. The Poisson ratio was taken as equal to 0.35, so Emax linearly increased from 40 to 400 MPa. The non-linear “p-y” curve adopted, to model the near-field soil response, was that proposed by Reese et al. [32]. Since the water table was located 1 m below the ground surface suction effects were considered in the analysis. Nevertheless, it was not possible to use the MK-model rigorously due to the lack of information about the actual degree of saturation above the water table. As a consequence, suction was considered by assuming that the upper soil layer was fully saturated by capillarity. This assumption enabled us to use Equation (11) to estimate the vertical effective stresses considering χ = 1 and a linearly increasing suction value from 0 kPa to 10 kPa starting from one-meter depth up to the ground surface.
This results in an increase in the ultimate pile-soil interface pressure, computed using the relationships suggested by Reese et al. [32], only in the first meter depth. Figure 10 compares the measured and computed load-deflection curves. The p-y curves used in Huang et al. [43] follow the shape suggested by Matlock [31] but were established using the DMT tests data.
The same figure also shows the deflection curve obtained without far-field component. As expected, there is a reduction in computed horizontal displacement. In this case, the reduction varies between 23% and 8% with increasing load level.
Pile deflection profiles versus depth are shown (computed and measured) for three different lateral load values at the pile-head, considering suction in Figure 11 and without suction in Figure 12.
The agreement is good in both cases however considering suction, there was an improvement in the prediction of the measured data.
In addition, Figure 13 compares the bending moments profiles for various load values computed with the proposed method and those obtained by Huang et al. [43] using LPILE. Note that in the work of Huang et al. [43] the load of 1462 kN was identified as the value at which corresponds the beginning of cracking in the concrete, and therefore there is a progressive decrease in the flexural rigidity EpIp.
Huang et al. [43] and Wu et al. [58] thus assigned a reduced flexural rigidity to the relevant section of the pile to simulate cracking. The reduced values of EpIp were necessary in both cases to achieve a suitable match between the load versus deflection curve obtained in their analysis and that measured during the lateral load test (Figure 10). The software used in these two studies was LPILE version 4.0 (p-y curves code, Reese and Wang [59]) and VERSAT-P3D (a quasi-3D-FEM code, Wu [60]), respectively. The proposed “hybrid BEM-py curve” method, on the other hand, automatically updates the flexural rigidity along the pile shaft according to the average bending moment—curvature relationship, computed on the basis of the geometrical and mechanical properties of the pile section.

4. Conclusions

A laterally loaded single pile is a soil-structure interaction problem that represents an interdisciplinary subject characterized by material non-linearities affecting both the soil and the pile. The possibility to capture the variation of the pile-soil relative stiffness during the application of a lateral load is a key aspect for the assessment of the overall lateral response. Even today, in fact, most of the computational platforms are specialized either for structural or for geotechnical applications.
Moreover, it is well known that the response of a single pile subjected to lateral load is mainly affected by the shallower soil layers. It is, therefore, an important aspect a proper evaluation of suction in case of partially saturated conditions. Suction, in fact, can be responsible for a higher initial stiffness of a single pile under lateral load and for a higher lateral resistance that should be considered.
For these reasons, a hybrid BEM-py curve method has been developed to study single piles under horizontal loading. This approach allows analyzing single piles with free or fixed head restraint conditions. The proposed method is innovative because it considers the highly non-linear response of circular reinforced concrete pile sections, taking also into account the influence of tension stiffening, and considers suction for partially saturated soils by means of the Modified-Kovacs Model.
The proposed method has two main advantages compared to more sophisticated codes: the time saved for computation (typically less than one minute for a complete analysis) and the simplicity in input data determination, since these can be obtained by means of a standard site investigation. The reliability of this method was verified here by comparing results from data from full scale and centrifuge tests on single piles (with a total of 22 case histories studied).
The results obtained have highlighted the possibility to provide a good forecast of the most representative aspects of the single pile lateral response.
The prediction errors are for most of the cases lower than 20%. The errors are higher for the case histories in which the piles were steel-pipes filled with grout, so the initial pile flexural rigidity could be affected by the steel/grout interaction. The proposed model reproduces in a very accurate way the measured data for reinforced concrete piles in sand. A detailed comparison is also presented between measured and computed data on a large-diameter reinforced concrete bored single pile laterally loaded in a full-scale test program realized by Huang et al. [43]. The computed results are in good agreement with the experimental data. Finally, it is important to underline that all the analyses have been carried out not as back-analyses but as class A predictions, using as input the actual pile properties and the soil strength and stiffness parameters according to the interpretation of the in situ and laboratory tests data.

Acknowledgments

This research did not receive any specific grant from funding agencies in the public, commercial, or not-for-profit sectors.

Author Contributions

Stefano Stacul and Nunziante Squeglia developed the proposed model for the laterally loaded single pile, Stefano Stacul analyzed the data and performed the comparison with experimental tests; Stefano Stacul, Nunziante Squeglia and Francesco Morelli wrote the paper.

Conflicts of Interest

The authors declare no conflict of interest.

References

  1. Mokwa, R.L.; Duncan, J.M. Experimental evaluation of lateral-load resistance of pile caps. J. Geotech. Geoenviron. Eng. 2001, 127, 185–192. [Google Scholar] [CrossRef]
  2. Katzenbach, R.; Turek, J. Combined pile-raft foundation subjected to lateral loads. In Proceedings of the International Conference on Soil Mechanics and Geotechnical Engineering, Osaka, Japan, 12–16 September 2005; AA Balkema Publishers: Rotterdam, The Netherlands; Volume 16. No. 4. [Google Scholar]
  3. Reese, L.C.; Wang, S.T.; Isenhower, W.M.; Arrellaga, J.A. Computer Program Lpile Plus; Version 5.0 Technical Manual; Ensoft: Austin, TX, USA, 2004. [Google Scholar]
  4. Khari, M.; Kassim, K.A.; Adnan, A. Development of Curves of Laterally Loaded Piles in Cohesionless Soil. Sci. World J. 2014, 2014, 917174. [Google Scholar] [CrossRef] [PubMed]
  5. Xu, L.Y.; Cai, F.; Wang, G.X.; Chen, G.X.; Li, Y.Y. Nonlinear analysis of single reinforced concrete piles subjected to lateral loading. KSCE J. Civ. Eng. 2017, 1–12. [Google Scholar] [CrossRef]
  6. Mardfekri, M.; Gardoni, P.; Roesset, J.M. Modeling laterally loaded single piles accounting for nonlinear soil-pile interactions. J. Eng. 2013, 2013, 243179. [Google Scholar] [CrossRef]
  7. Yang, Z.; Jeremić, B. Numerical analysis of pile behaviour under lateral loads in layered elastic–plastic soils. Int. J. Numer. Anal. Methods Geomech. 2002, 26, 1385–1406. [Google Scholar] [CrossRef]
  8. Yang, Z.; Jeremić, B. Numerical study of group effects for pile groups in sands. Int. J. Numer. Anal. Methods Geomech. 2003, 27, 1255–1276. [Google Scholar] [CrossRef]
  9. Fatahi, B.; Basack, S.; Ryan, P.; Zhou, W.H.; Khabbaz, H. Performance of laterally loaded piles considering soil and interface parameters. Geomech. Eng. 2014, 7, 495–524. [Google Scholar] [CrossRef]
  10. Poulos, H.G. User’s Guide to Program DEFPIG 3/4 Deformation Analysis of Pile Groups; Revision 6; School of Civil Engineering, University of Sidney: Sidney, Australia, 1990. [Google Scholar]
  11. Randolph, M.F. PIGLET, A Computer Program for the Analysis and Design of Pile Groups; Report Geo, 86033; Department of Engineering, University of Cambridge: Cambridge, UK, 1980. [Google Scholar]
  12. Basile, F. A practical method for the non-linear analysis of piled rafts. In Proceedings of the 18th International Conference on Soil Mechanics and Geotechnical Engineering, Paris, France, 2–5 September 2013. [Google Scholar]
  13. Mindlin, R.D. Force at a point in the interior of a semi-infinite solid. Physics 1936, 7, 195–202. [Google Scholar] [CrossRef]
  14. Spillers, W.R.; Stoll, R.D. Lateral response of piles. J. Soil Mech. Found. Division 1964, 90, 1–10. [Google Scholar]
  15. Poulos, H.G.; Davis, E.H. Pile Foundation Analysis and Design; Wiley & Sons: New York, NY, USA, 1980. [Google Scholar]
  16. Davies, T.G.; Banerjee, P.K. The displacement field due to a point load at the interface of a two layer elastic half-space. Geotechnique 1978, 28, 43–56. [Google Scholar] [CrossRef]
  17. Sharnouby, B.E.; Novak, M. Flexibility coefficients and interaction factors for pile group analysis. Can. Geotech. J. 1986, 23, 441–450. [Google Scholar] [CrossRef]
  18. Budhu, M.; Davies, T.G. Nonlinear analysis of laterality loaded piles in cohesionless soils. Can. Geotech. J. 1987, 24, 289–296. [Google Scholar] [CrossRef]
  19. Brown, D.; Morrison, C.; Reese, L. Lateral load behavior of pile group in sand. J. Geotech. Eng. 1988, 114, 1261–1276. [Google Scholar] [CrossRef]
  20. Ashour, M.; Norris, G.; Pilling, P. Lateral Loading of a Pile in Layered Soil Using the Strain Wedge Model. J. Geotech. Geoenviron. Eng. 1998, 124, 303–315. [Google Scholar] [CrossRef]
  21. Ashour, M.; Pilling, P.; Norris, G. Lateral Behavior of Pile Groups in Layered Soils. J. Geotech. Geoenviron. Eng. 2004, 130, 580–592. [Google Scholar] [CrossRef]
  22. Landi, G. Pali Soggetti a Carichi Orizzontali: Indagini Sperimentali ed Analisi. Ph.D Thesis, University of Naples Federico II, Napoli, Italy, 2006. (In Italian). [Google Scholar]
  23. Morelli, F.; Amico, C.; Salvatore, W.; Squeglia, N.; Stacul, S. Influence of Tension Stiffening on the Flexural Stiffness of Reinforced Concrete Circular Sections. Materials 2017, 10. [Google Scholar] [CrossRef]
  24. Mander, J.B.; Priestley, M.J.; Park, R. Theoretical stress-strain model for confined concrete. J. Struct. Eng. 1988, 114, 1804–1826. [Google Scholar] [CrossRef]
  25. Popovics, S. A numerical approach to the complete stress-strain curve of concrete. Cem. Concr. Res. 1973, 3, 583–599. [Google Scholar] [CrossRef]
  26. Comité Euro-International du Béton. CEB-FIP Model Code 1990; Bulletin d’Information: Telford, UK, 1993. [Google Scholar]
  27. Sigrist, V. Zum Verformungsvermögen von Stahlbetonträgern. PhD Thesis, Institut für Baustatik und Konstruktion, ETH Zürich, Zurich, Switzerland, 1995. [Google Scholar]
  28. Salvatore, W.; Buratti, G.; Maffei, B.; Valentini, R. Dual-phase steel re-bars for high-ductile rc structures, Part 2: Rotational capacity of beams. Eng. Struct. 2007, 29, 3333–3341. [Google Scholar] [CrossRef]
  29. Hetényi, M. Beams on Elastic Foundation: Theory with Applications in the Fields of Civil and Mechanical Engineery; University of Michigan Press: Ann Arbor, MI, USA, 1946. [Google Scholar]
  30. Reese, L.C.; Van Impe, W.F. Single Piles and Pile Groups under Lateral Loading; AA Balkema: Rotterdam, The Netherlands, 2001. [Google Scholar]
  31. Matlock, H. Correlations for design of laterally loaded piles in soft clay. In Proceedings of the 2nd Annual Offshore Technology Conference, Houston, TX, USA, 22–24 April 1970; Volume 1, pp. 577–588. [Google Scholar]
  32. Reese, L.C.; Cox, W.R.; Koop, F.D. Analysis of laterally loaded piles in sand. In Offshore Technology in Civil Engineering Hall of Fame Papers from the Early Years; American Society of Civil Engineers: Reston, VA, USA, 1974; pp. 95–105. [Google Scholar]
  33. Welch, R.C.; Reese, L.C. Lateral Load Behavior of Drilled Shafts. (No. Interim); University of Texas at Austin: Austin, TX, USA, 1972. [Google Scholar]
  34. Press, W.H.; Teukolsky, S.A.; Vetterling, W.T.; Flannery, B.P. Numerical Recipes in C++. The Art of Scientific Computing, 2nd ed.; Cambridge University Press: Cambridge, UK, 2002; pp. 714–718. [Google Scholar]
  35. Aubertin, M.; Mbonimpa, M.; Bussière, B.; Chapuis, R.P. A model to predict the water retention curve from basic geotechnical properties. Can. Geotech. J. 2003, 40, 1104–1122. [Google Scholar] [CrossRef]
  36. Bishop, A.W. The principle of effective stress. Teknisk Ukeblad 1959, 39, 859–863. [Google Scholar]
  37. Jennings, J.E.B.; Burland, J.B. Limitations to the use of effective stresses in partly saturated soils. Géotechnique 1962, 12, 125–144. [Google Scholar] [CrossRef]
  38. Bishop, A.W.; Donald, I.B. The experimental study of partly saturated soil in the triaxial apparatus. In Proceedings of the 5th International Conference on soil Mechanics and Foundation Engineering, Paris, France, 17–22 July 1961; Volume 1, pp. 13–21. [Google Scholar]
  39. Bishop, A.W.; Alpan, I.; Blight, G.E.; Donald, I.B. Factors Controlling the Strength of Partly Saturated Cohesive Soils. In Proceedings of the Research Conference on Shear Strength of Cohesive Soils, ASCE, Boulder, CO, USA, 13–17 June 1960; pp. 503–532. [Google Scholar]
  40. Brown, D.; Reese, L.; O’Neill, M. Cyclic lateral loading of a large-scale pile group. J. Geotech. Eng. 1987, 113, 1326–1343. [Google Scholar] [CrossRef]
  41. Cox, W.R.; Reese, L.C.; Grubbs, B.R. Field testing of laterally loaded piles in sand. In Proceedings of the Offshore Technology Conference, Houston, TX, USA, 6–8 May 1974. [Google Scholar]
  42. Dunnavant, T.W.; O’Neill, M.W. Experimental p-y Model for Submerged, Stiff Clay. J. Geotech. Eng. 1989, 115, 95–114. [Google Scholar] [CrossRef]
  43. Huang, A.B.; Hsueh, C.K.; O’Neill, M.W.; Chern, S.; Chen, C. Effects of construction on laterally loaded pile groups. J. Geotech. Geoenviron. Eng. 2001, 127, 385–397. [Google Scholar] [CrossRef]
  44. Khalili-Tehrani, P.; Ahlberg, E.R.; Rha, C.; Lemnitzer, A.; Stewart, J.P.; Taciroglu, E.; Wallace, J.W. Nonlinear load-deflection behavior of reinforced concrete drilled piles in stiff clay. J. Geotech. Geoenviron. Eng. 2013, 140. Available online: https://ascelibrary.org/doi/abs/10.1061/(ASCE)GT.1943-5606.0000957 (accessed on 17 December 2017). [CrossRef]
  45. Mandolini, A.; Viggiani, C. Terreni ed opere di fondazione di un viadotto sul fiume Garigliano. Rivista Italiana di Geotecnica 1992, 26, 95–113, (In Italian, summary in English). [Google Scholar]
  46. McVay, M.; Casper, R.; Shang, T.I. Lateral response of three-row groups in loose to dense sands at 3D and 5D pile spacing. J. Geotech. Eng. 1995, 121, 436–441. [Google Scholar] [CrossRef]
  47. Ng, C.W.; Zhang, L.; Nip, D.C. Response of laterally loaded large-diameter bored pile groups. J. Geotech. Geoenviron. Eng. 2001, 127, 658–669. [Google Scholar] [CrossRef]
  48. Portugal, J.C.; Sêco e Pinto, P.S. Analysis and design of piles under lateral loads. In Proceedings of the 2nd International Geotechnical Seminar on Deep Foundations on Bored and Auger Piles, Ghent, Belgium, 1–4 June 1993; pp. 309–312. [Google Scholar]
  49. Price, G.; Wardle, I.F. Horizontal load tests on steel piles in London clay. In Proceedings of the 10th International Conference on Soil Mechanics and Foundation Engineering, Stockholm, Sweden, 15–19 June 1981; Volume 2, pp. 803–808. [Google Scholar]
  50. Price, G.; Wardle, I.F. Lateral Load Tests on Large Diameter Bored Piles; Contractor Report 46; Transport and Road Research Laboratory, Department of Transport: Crowthorne, UK, 1987. [Google Scholar]
  51. Remaud, D.; Garnier, J.; Frank, R. Laterally loaded piles in dense sand: Group effects. In Proceedings of the Conference Centrifuge 98, Tokyo, Japan, 23–25 September 1998; pp. 533–538. [Google Scholar]
  52. Reese, L.; Cox, W.; Koop, F. Field testing and analysis of laterally loaded piles in stiff clay. In Proceedings of the Offshore Technology Conference, Houston, TX, USA, 5–8 May 1975; pp. 671–690. [Google Scholar]
  53. Reese, L.C.; Welch, R.C. Lateral loading of deep foundations in stiff clay. J. Geotech. Geoenviron. Eng. 1975, 101, 633–649. [Google Scholar]
  54. Rollins, K.M.; Peterson, K.T.; Weaver, T.J. Lateral load behavior of full-scale pile group in clay. J. Geotech. Geoenviron. Eng. 1998, 124, 468–478. [Google Scholar] [CrossRef]
  55. Rollins, K.M.; Gerber, T.M.; Lane, J.D.; Ashford, S.A. Lateral resistance of a full-scale pile group in liquefied sand. J. Geotech. Geoenviron. Eng. 2005, 131, 115–125. [Google Scholar] [CrossRef]
  56. Rollins, K.M.; Olsen, K.G.; Jensen, D.H.; Garrett, B.H.; Olsen, R.J.; Egbert, J.J. Pile spacing effects on lateral pile group behavior: Analysis. J. Geotech. Geoenviron. Eng. 2006, 132, 1272–1283. [Google Scholar] [CrossRef]
  57. Mayne, P.W. In-situ test calibrations for evaluating soil parameters. In Characterisation and Engineering Properties of Natural Soils. In Proceedings of the Second International Workshop on Characterisation and Engineering Properties of Natural Soils, Singapore, 29 November–1 December 2006; Taylor & Francis: New York, NY, USA; pp. 1601–1652. [Google Scholar]
  58. Wu, G.; Finn, W.L.; Dowling, J. Quasi-3D analysis: Validation by full 3D analysis and field tests on single piles and pile groups. Soil Dyn. Earthq. Eng. 2015, 78, 61–70. [Google Scholar] [CrossRef]
  59. Reese, L.C.; Wang, S.T. LPILE 4.0, Ensoft, Inc.: Austin, TX, USA, 1993.
  60. Wu, G. VERSAT-P3D: A Computer Program for Dynamic 3-Dimensional Finite Element Analysis of Single Piles and Pile Groups; Wutec Geotechnical International: Vancouver, BC, Canada, 2006. [Google Scholar]
Figure 1. Pile—discretization.
Applsci 07 01310 g001
Figure 2. Pile flexibility matrix using the elastic beam theory (auxiliary restraint approach).
Applsci 07 01310 g002
Figure 3. Scheme for the flexibility matrix of a pile modeled as a beam with variable flexural rigidity (see Equation (3)).
Applsci 07 01310 g003
Figure 4. Mindlin solution scheme.
Applsci 07 01310 g004
Figure 5. Hybrid BEM-p-y method.
Applsci 07 01310 g005
Figure 6. Flow chart of the proposed solution procedure.
Applsci 07 01310 g006
Figure 7. Adaptive step-size control.
Applsci 07 01310 g007
Figure 8. Comparison of measured and computed horizontal loads at the same displacement level: y/D = 0.5–1.5%; y/D = 2–3%; y/D = 5–6%; y/D = 9–10%.
Applsci 07 01310 g008
Figure 9. Computed “average moment-curvature” relationship for B7 pile section.
Applsci 07 01310 g009
Figure 10. Comparison of measured and computed (Huang et al. [43] and proposed method) Lateral Load vs. Head Deflection curve.
Applsci 07 01310 g010
Figure 11. Pile deflections versus depth for B7 single pile under various load levels: Computed data obtained considering suction.
Applsci 07 01310 g011
Figure 12. Pile deflections versus depth for B7 single pile under various load levels: Computed data obtained without considering suction.
Applsci 07 01310 g012
Figure 13. Computed bending moments of B7 single pile at various load levels (results obtained considering suction).
Applsci 07 01310 g013
Table 1. Case histories.
CasePile MaterialPile Diameter D (m)Pile Length L (m)Soil TypeH Max (kN)y/D (%) at H Max
[40]Steel with Grout-fill0.27313.11OC Clay92.711.2
[19]Steel with Grout-fill0.27313.11Sand133.513.8
[41]Steel-pipe0.6121Sand263.44.9
[42]Steel0.27311.8Clay116.831.4
[42]Steel1.2211.4Clay1074.74.79
[43]Bored RC1.534.9Silty Sand2945.78.5
[44]Bored RC (Flagpole)0.6011.68OC Clay104.724.9
[45]Multiton0.45717.5Clay119.88.9
[45]Multiton0.40617.5Clay119.911.7
[31]Steel-pipe0.31912.8Clay105.017.6
[46]Aluminum0.4313.3Sand109.518.6
[46]Aluminum0.4313.3Sand134.118.6
[47]Bored RC1.5030Sand2950.48.4
[48]Bored RC1.2040Clay300.740.7
[49]Steel-pipe0.40616.5Clay100.08.0
[50]Bored RC1.5012.5Sand2394.13.4
[51]Aluminum0.7212Sand804.715.4
[52]Steel-pipe0.64115.2Clay596.73.3
[53]Bored RC0.76212.8Clay443.53.8
[54]Steel with Grout-fill0.3058.7Clay178.322.0
[55]Steel pipe0.32411.5Sand112.313.3
[56]Steel pipe0.32411.9Clay210.827.6
Table 2. Structural properties of bored pile, Huang et al. [43].
Pile Diameter D (mm)1500
Pile Length (m)34.9
Cross Sectional area (cm2)17,672
Concrete compressive strength f’c (MPa)27.5
Reinforcement Yield Stress fy (MPa)471
Steel Ratio ρs 0.025
Intact flexural rigidity EI (GNm2)6.86

