Investigation into the Fire Hazards of Lithium-Ion Batteries under Overcharging


1
State Key Laboratory of Fire Science, University of Science and Technology of China, Hefei 230026, China
2
College of Ocean Science and Engineering, Shanghai Maritime University, Shanghai 201306, China
3
School of Environment and Safety Engineering, University of Jiangsu, Zhenjiang 212013, China
*
Author to whom correspondence should be addressed.
Appl. Sci. 2017, 7(12), 1314; https://0-doi-org.brum.beds.ac.uk/10.3390/app7121314
Submission received: 24 November 2017
/
Revised: 14 December 2017
/
Accepted: 15 December 2017
/
Published: 18 December 2017
(This article belongs to the Special Issue Advanced Materials for Rechargeable Lithium Batteries)
Abstract
:Numerous lithium-ion battery (LIB) fires and explosions have raised serious concerns about the safety issued associated with LIBs; some of these incidents were mainly caused by overcharging of LIBs. Therefore, to have a better understanding of the fire hazards caused by LIB overcharging, two widely used commercial LIBs, nickel manganese cobalt oxide (NMC) and lithium iron phosphate (LFP), with different cut-off voltages (4.2 V, 4.5 V, 4.8 V and 5.0 V), were tested in this work. Some parameters including the surface temperature, the flame temperature, voltage, and radiative heat flux were measured and analyzed. The results indicate that the initial discharging voltage increases with the growth of charge cut-off voltage. Moreover, the higher the cut-off voltage, the longer the discharging time to reach 2.5 V. An overcharged LIB will undergo a more violent combustion process and has lower stability than a normal one, and the increasing cut-off voltage aggravates the severity. In addition, it is also revealed that the NMC fails earlier than the LFP under the same condition. The temperatures for safety vent cracking, ignition, and thermal runaway of LIBs exhibit similar values for the same condition, which demonstrates that the LIB will fail at a certain temperature. Finally, the peak heat flux, total radiative heat flux, and total radiative heat will rise with the increase in voltage.
1. Introduction
With the continuation of environmental problems such as global warming, greenhouse gas emissions, and sea-level rise caused by extensive use of fossil fuels, LIBs have been widely used as a power source for electronic devices including laptops, mobile phones, electrical vehicles (EV), and hybrid electrical vehicles (HEV) due to their high energy density, stable performance, long life, and other excellent properties [1,2,3,4,5]. However, fires and explosions caused by LIBs have often been reported. From 24 August 2016 to 10 October 2016, there were many accidents induced by Samsung Note 7 phones, which forced Samsung to recall Note 7 all over the world and lost it billions of dollars. Moreover, a fire occurred in a BYD electric car resulting from the spontaneous combustion of the battery, and a Tesla Model S charging at a Tesla Supercharger in Norway caught fire on 1 January 2016. All of these incidents have raised serious concerns about the safety of LIBs. Therefore, it is necessary to conduct further research on the fire hazards of LIBs so that we can use them better.
Commonly, accidents were the result of overcharging LIBs; this problem has attracted many researchers’ attention. Samuel et al. [6] compared the thermal runaway behaviors of two widely used commercial LIBs (LCO/LMO) at different states of charge including overcharge by Accelerating Rate Calorimetry (ARC) measurements. Their results show that an LIB tends to exhibit thermal runaway behavior at overcharge state and the LIB based on LCO is found to be more thermally unstable than the LMO cell. Yuan et al. [7] investigated the overcharge behaviors of a large battery (32 Ah prismatic cell) by closely monitoring the internal/external cell temperature during the whole charge process. Their analysis revealed that lithium plating is one of the major causes responsible for thermal runaway during overcharge. Andrey et al. [8] conducted experiments on discharged, partially charged, fully charged, and overcharged cells with ARC to observe the thermal behaviors and gas release behaviors of cells during heating. They found that the thermal risk would increase with the growth of state of charge (SOC), and there were more gases released for overcharged cells than for normal ones. There are numerous articles associated with the effects of overcharge on the electrochemical stability, aging process, and electrode materials of LIB [9,10,11,12,13]. Qian et al. investigated the effects of slight overcharge (110% SOC) on the electrochemical performance of high-power batteries to identify the capacity decay mechanism. Their work revealed the abuse tolerance behaviors and capacity decay mechanism of a battery under overcharge with the help of X-ray Diffraction (XRD) and a Scanning Electron Microscope (SEM). Dmitry et al. studied the variation of electrode materials and separator after overcharge treatment by SEM. Furthermore, they explored the Differential Scanning Calorimetry (DSC) curves of LIBs with different overcharge conditions. However, there are few reports related to the fire hazards of overcharged LIB under external thermal abuse, and the overcharge condition scaled by cut-off voltage is also scarcely discussed.
In this work, we researched the fire hazards of two widely used commercial LIBs, NMC and LFP, under overcharge conditions scaled by cut-off voltage (4.2 V, 4.5 V, 4.8 V, and 5.0 V). Specific parameters including cell voltage, surface temperature, flame temperature, and heat flux were measured. The results were comparatively analyzed to provide basic knowledge on performance-based fire safety design.
2. Experiment
2.1. Samples
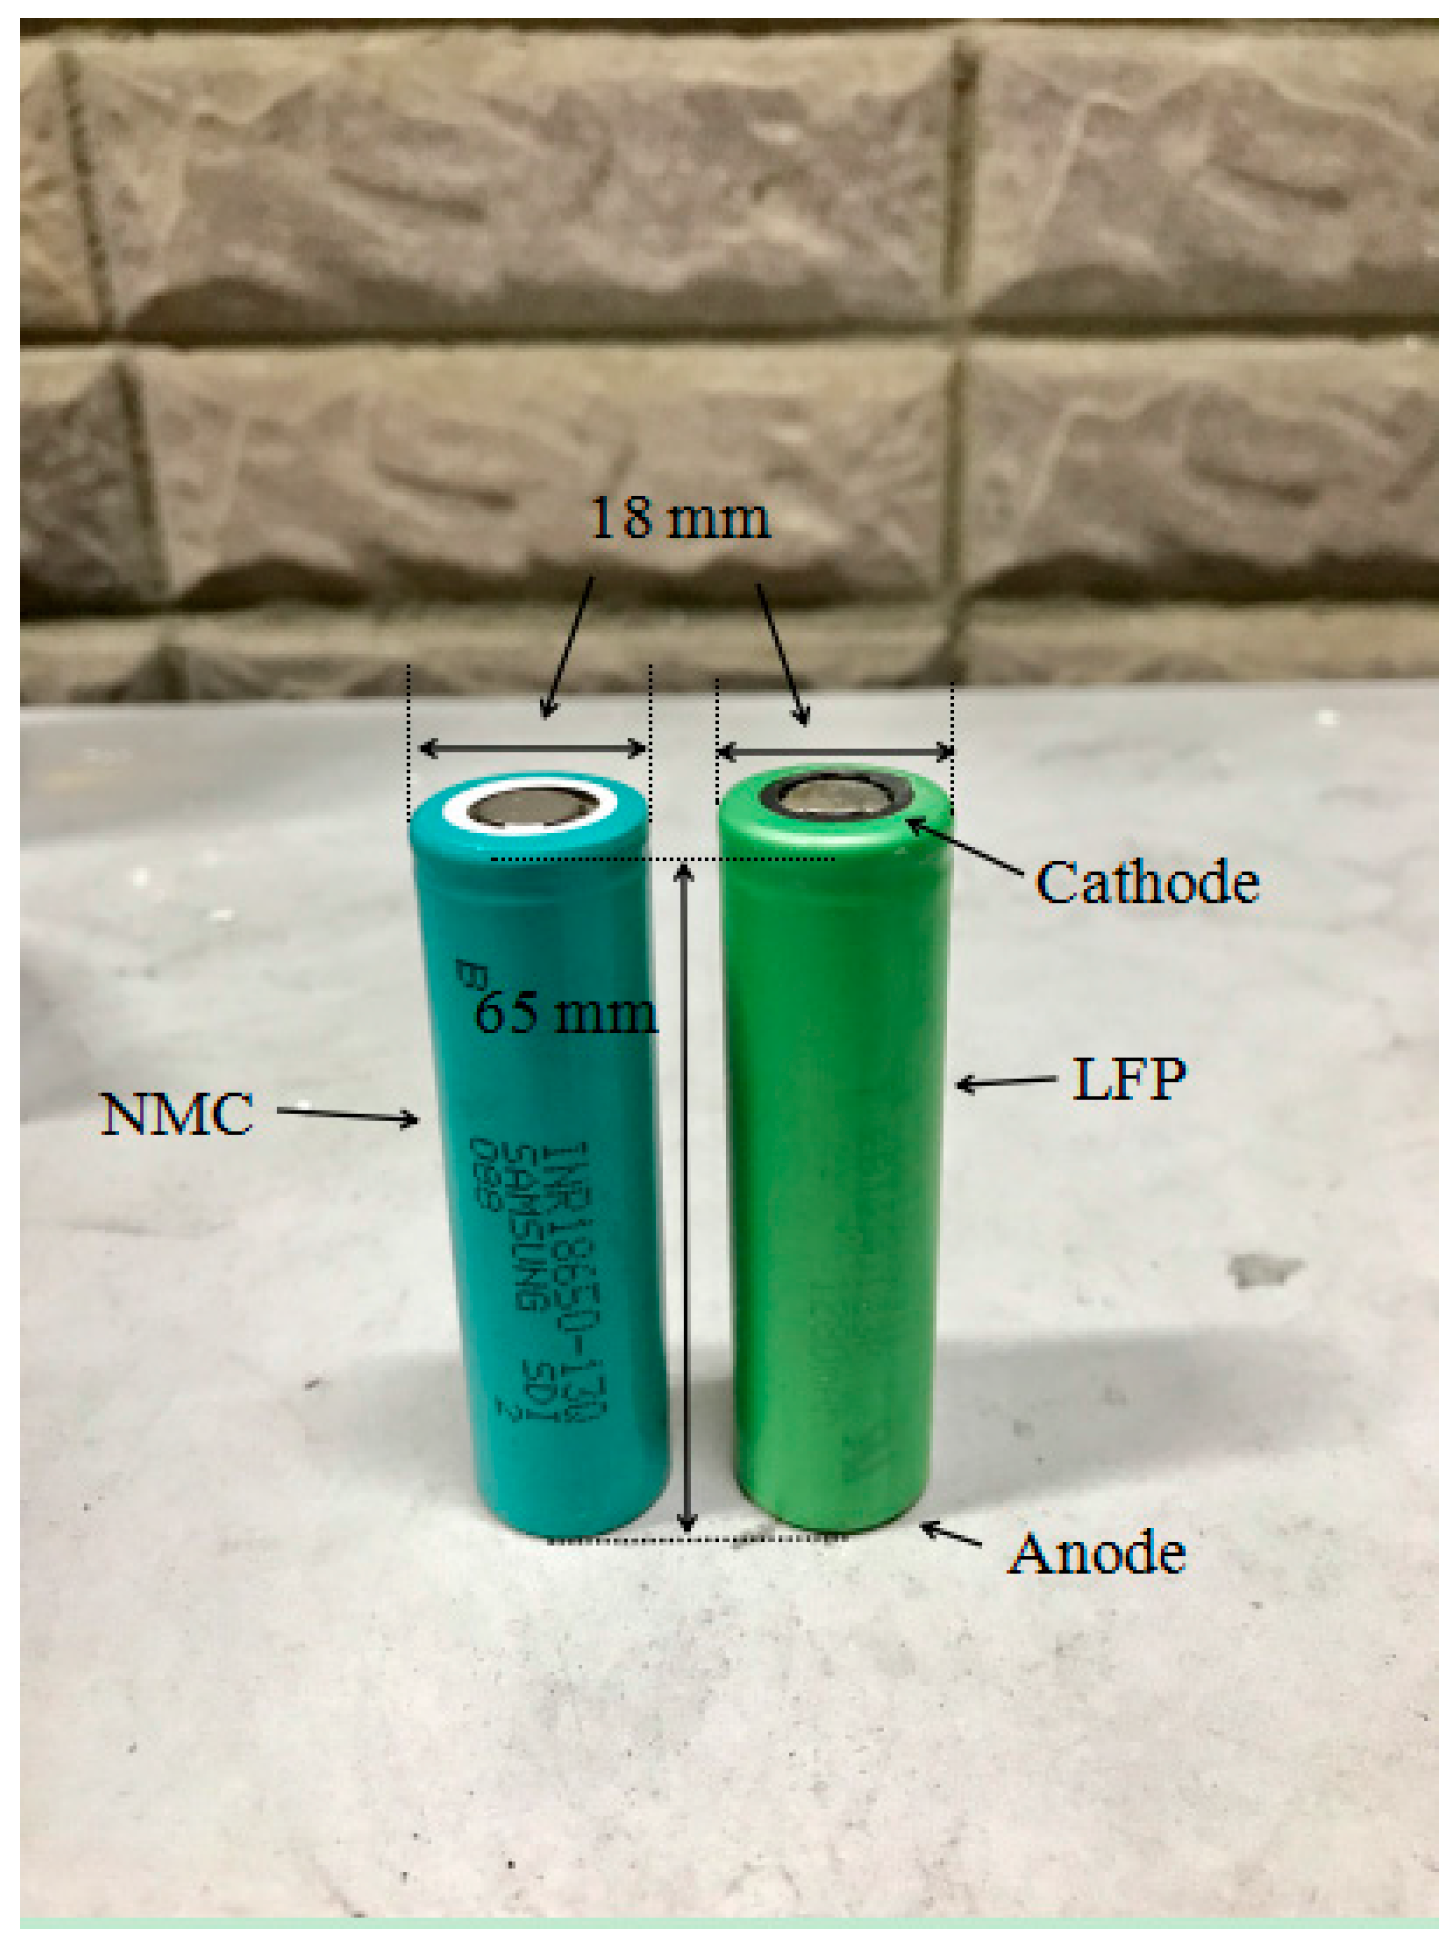
Two kinds of commercial 18650 LIBs with different cathode materials were used in this work. They were manufactured by Samsung and Sony, respectively, and their anode materials were similar, i.e., graphite. The cathode material for the former was NMC, while that for the latter was LFO. Both had a diameter of 18 mm and a height of 65 mm. Their nominal capacity and cut-off voltage were 1300 mAh and 4.2 V, respectively. Physical diagrams are shown in Figure 1. The electrochemical reactions of the NMC battery during charge and discharge can be presented as:
The LFP battery has a similar electrochemical reaction:
Before tests, the original energy stored in batteries was released by discharging with a constant current (CC) of 1300 mA until the voltage reached 2.5 V (the discharge cut-off voltage), and then the batteries would be charged by the same CC to the fixed voltage. Hereafter, the batteries were kept still for 24 h to ensure they remained stable before tests.
2.2. Apparatuses
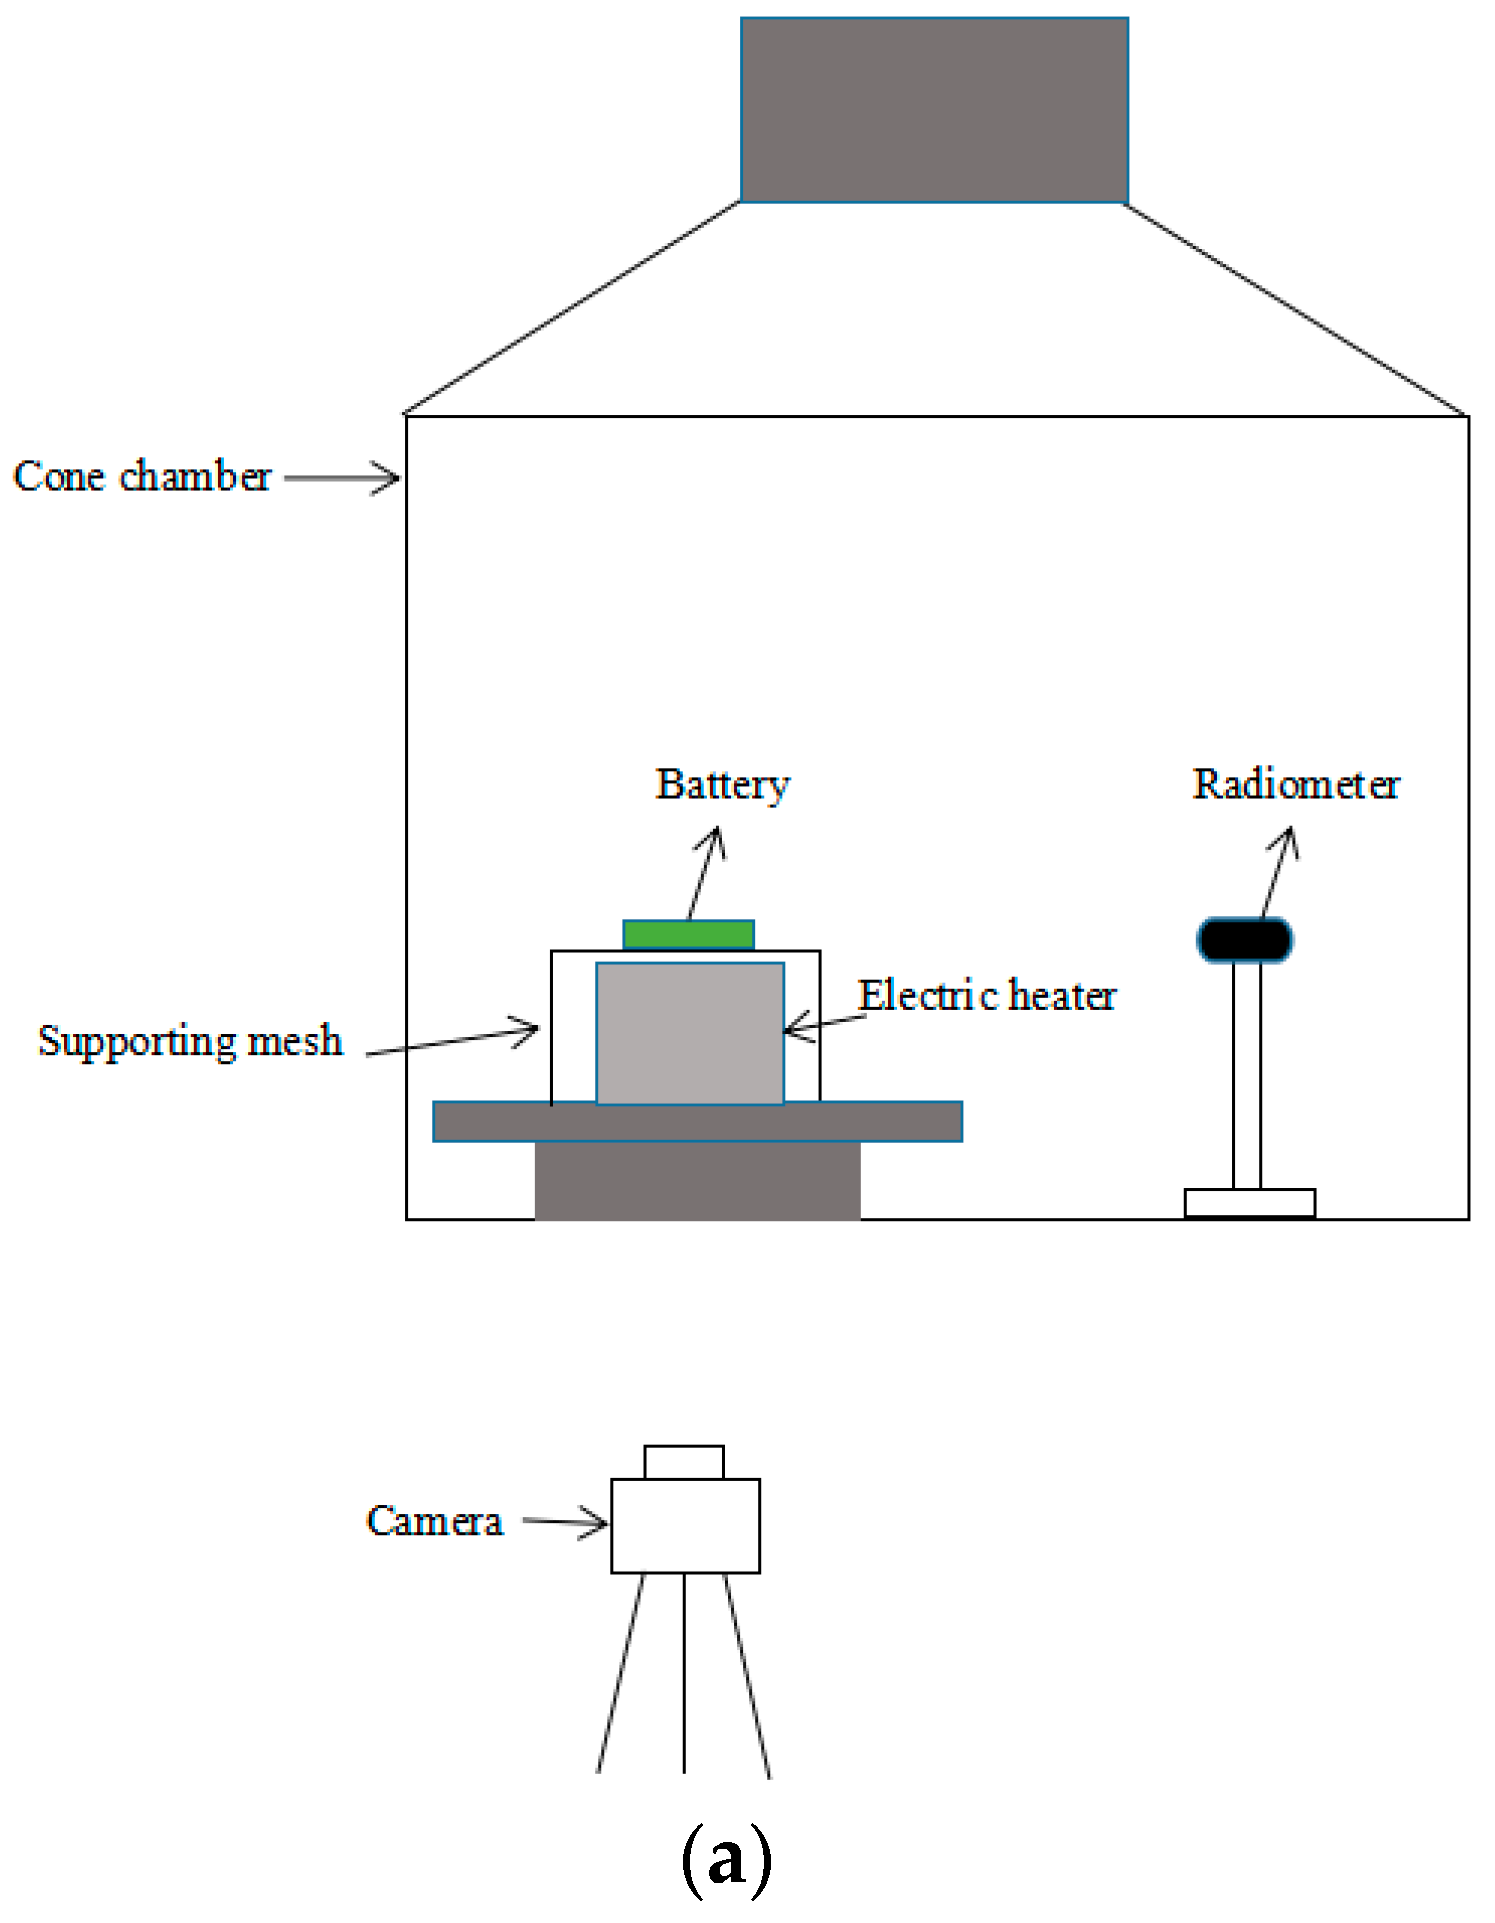
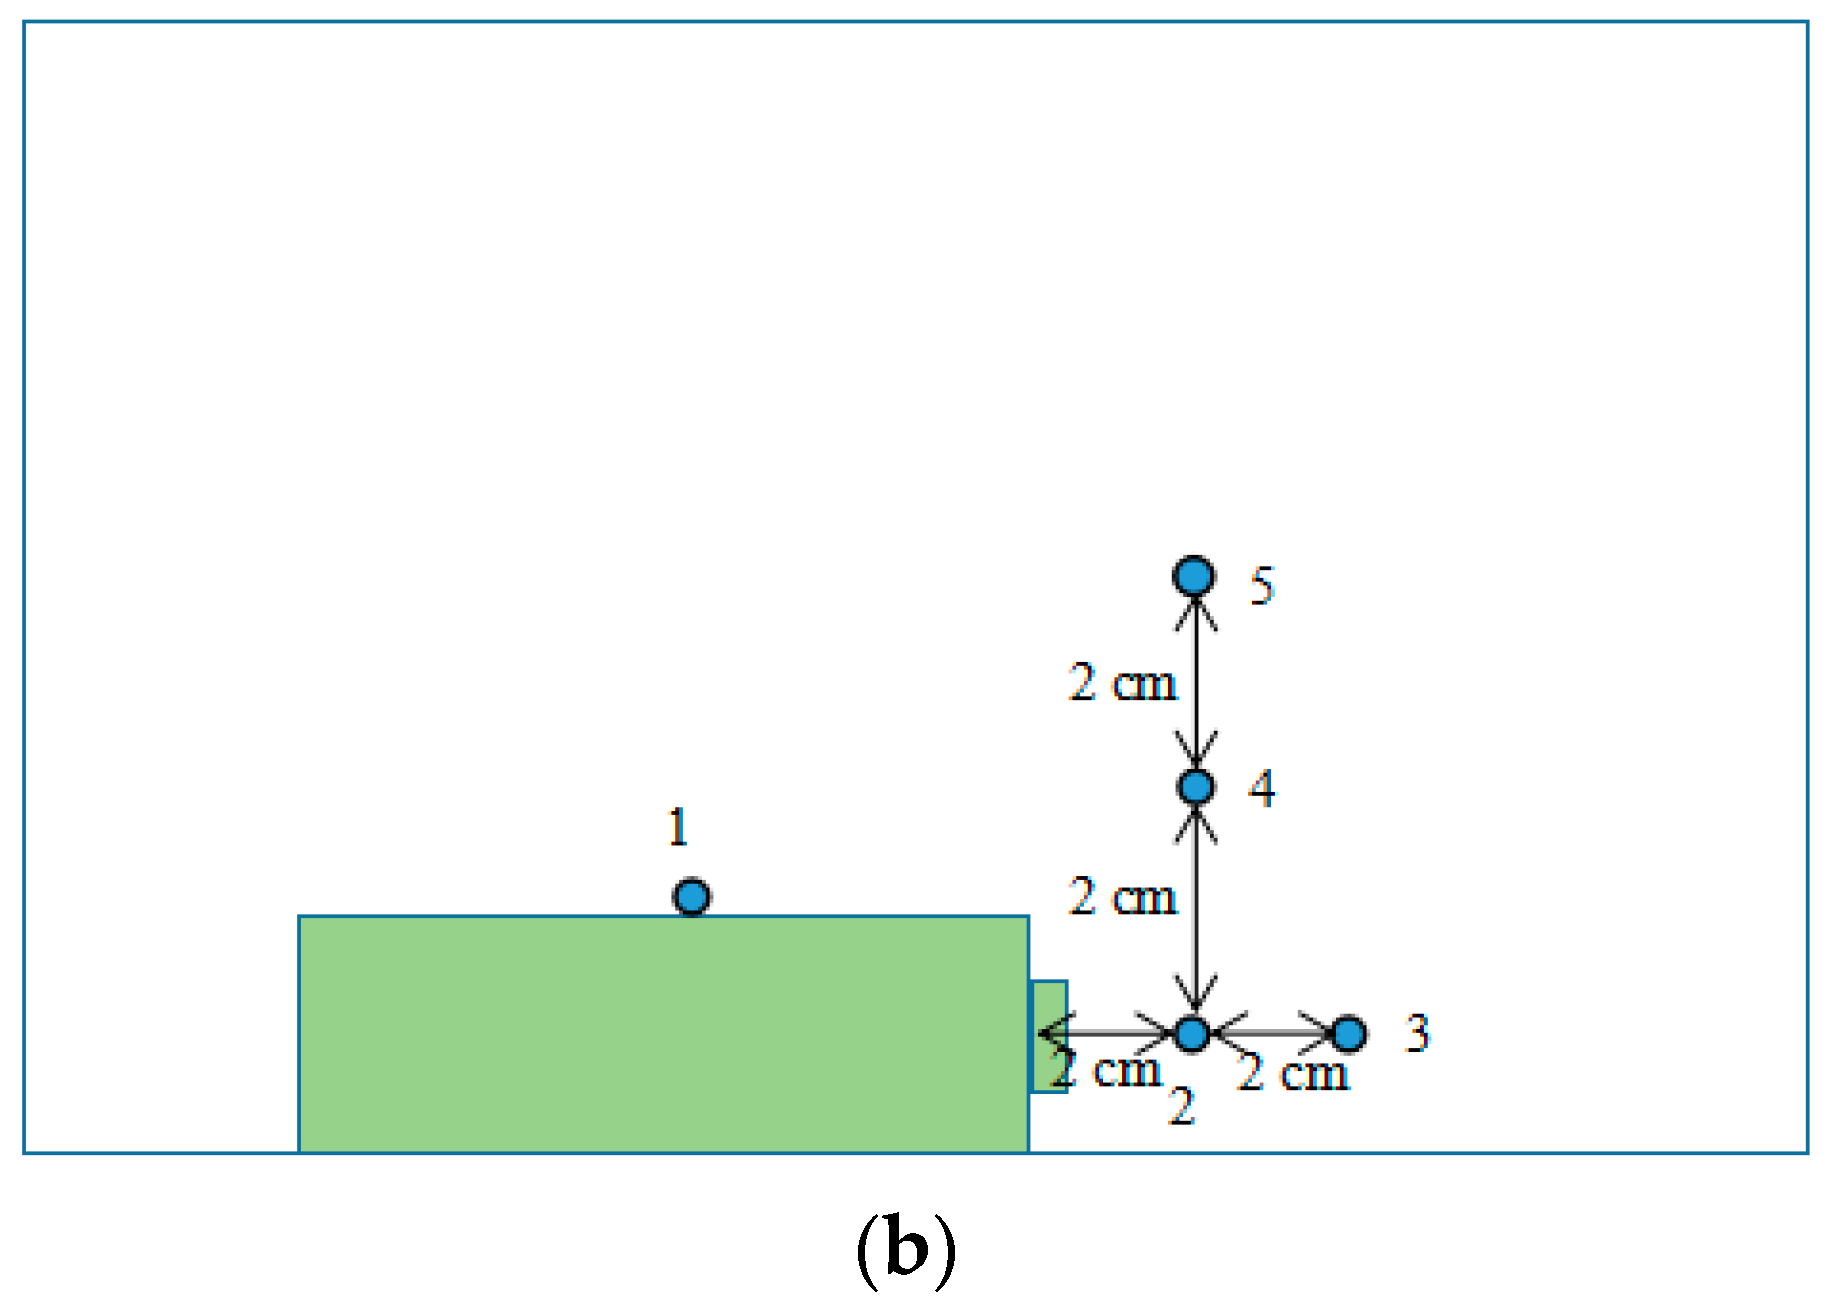
As shown in Figure 2, experiments were carried out in a well-ventilated cone chamber with dimensions of 1.2 m × 1.2 m × 1.2 m. The battery was placed upon a supporting mesh made of iron wire. The electric heater with 2 kW power was positioned below the mesh at a distance of 1 cm from the battery. A K-type thermocouple with a diameter of 1 mm was attached to the upper surface of the battery to measure its surface temperature and the temperature was recorded at the data acquisition equipment (NI cDAQ-9174) by a computer. The other four thermocouples were set up around the battery to measure the flame temperature; their arrangement is shown in Figure 2b. Cycling battery was achieved by charge/discharge cycle equipment (NEWARE CT-3008) with a voltage range from 0 V to 5 V. A camera (SONY XPS160) with 25 fps was employed to record the tests. Finally, a radiometer sensor (TS-10C) with 0.2 μV/(W m−2) resolution and 50 mV measurement range was positioned 29 cm horizontally away from the battery to measure the heat flux of fire and it was placed facing the safety vent so that the greatest heat flux could be acquired when LIBs caught fire.
2.3. Experimental Design
Experiments were carried out to explore the fire hazards of two widely used commercial LIBs under overcharging. Eight tests of four cut-off voltages (4.2 V, 4.5 V, 4.8 V, 5.0 V) and two kinds of LIBs were conducted. Each configuration was repeated four times under the same condition and the experimental configurations are listed in Table 1.
For convenience of comparison, the nominal battery capacity (1300 mAh) is defined as 100% SOC, and the different SOCs of overcharged LIBs will be defined accordingly based on the capacity obtained during charge, expressed as follows [14]:
where i is the battery current; Cn is the nominal capacity; and t is time.
3. Results and Discussion
3.1. Thermal Behaviors of LIB during Charging and Discharging
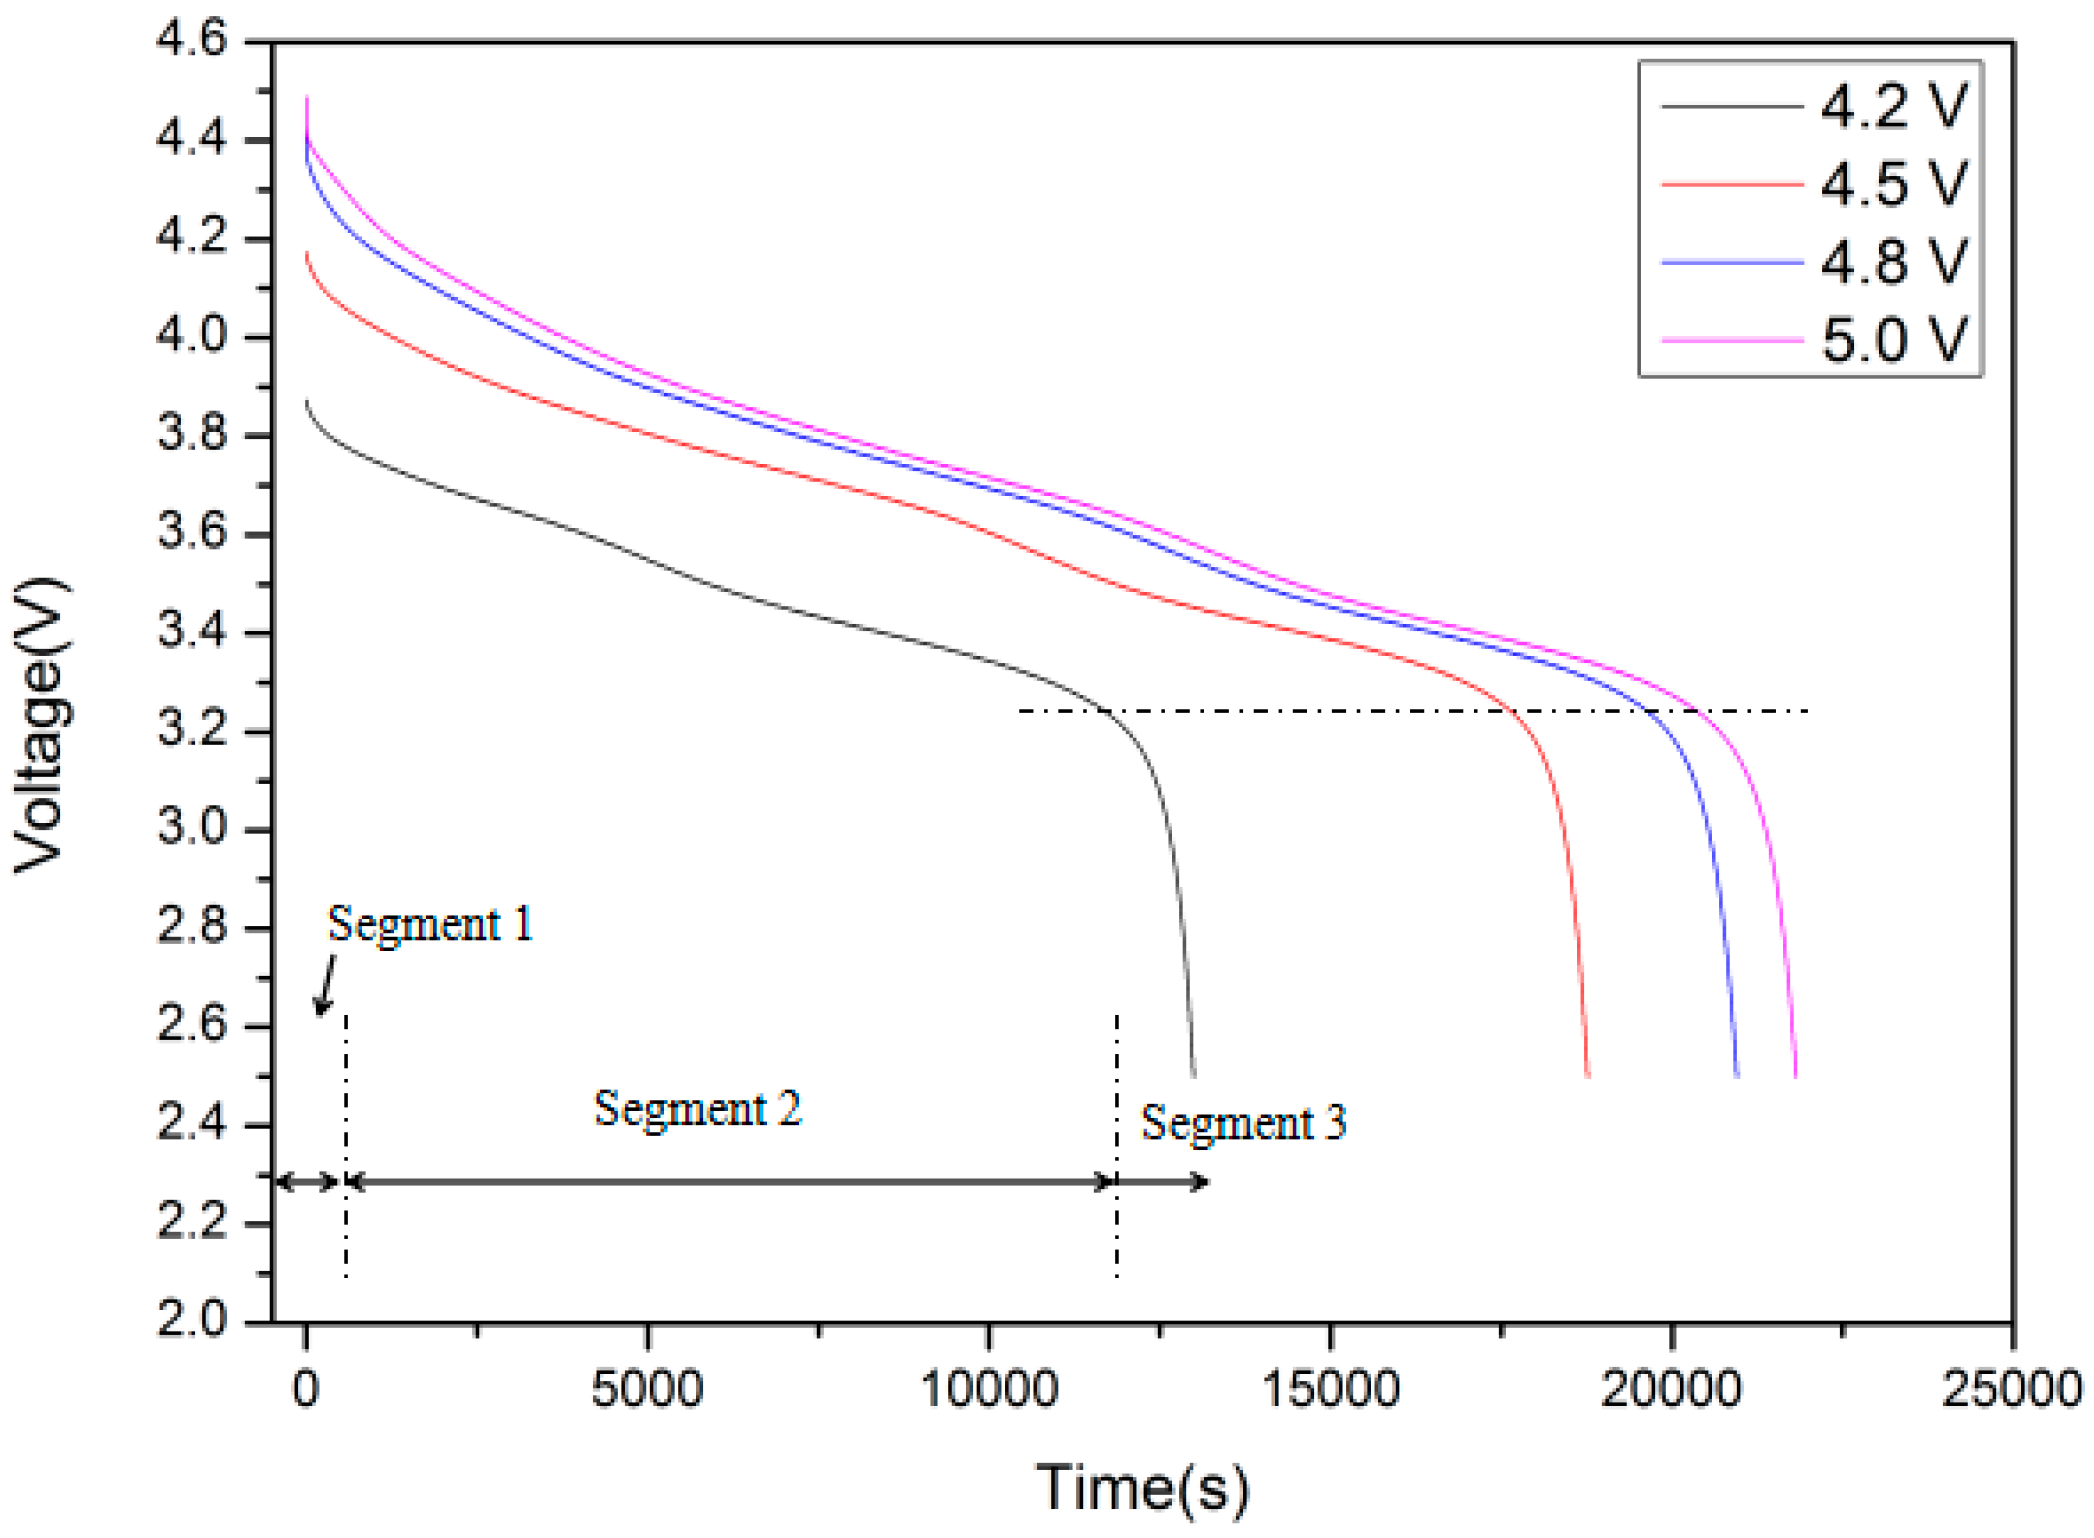
Figure 3 shows the discharging curves of LIBs subjected to different cut-off voltages. They were discharged at 2 C rate to the discharging cut-off voltage (2.5 V). From the curves, it can be seen that the discharging process of LIB can be divided into three segments. At the initial segment of discharging, there exists a short platform where voltage drops sharply. With the increase of voltage, the platform will be more obvious and last longer. The duration of this segment is short and will not exceed 100 s generally. After that, the battery enters a stable discharging segment where voltage decreases at a relatively stable rate until the battery gets into the epilogue of discharging. At the third segment, battery appears another platform and the voltage declines sharply. Soon after, the discharging ends when the voltage falls to 2.5 V. From the curves, it is found that the initial discharging voltage increases with the growth of cut-off voltage. The battery with higher cut-off voltage possesses higher initial discharging voltage. Moreover, the higher the cut-off voltage, the longer the discharging time to reach 2.5 V. Namely, the overcharged battery stores more energy and releases more energy in return. Finally, it is interesting to find that the battery will enter the third segment after the voltage drops to around 3.2 V, no matter what the initial state is.
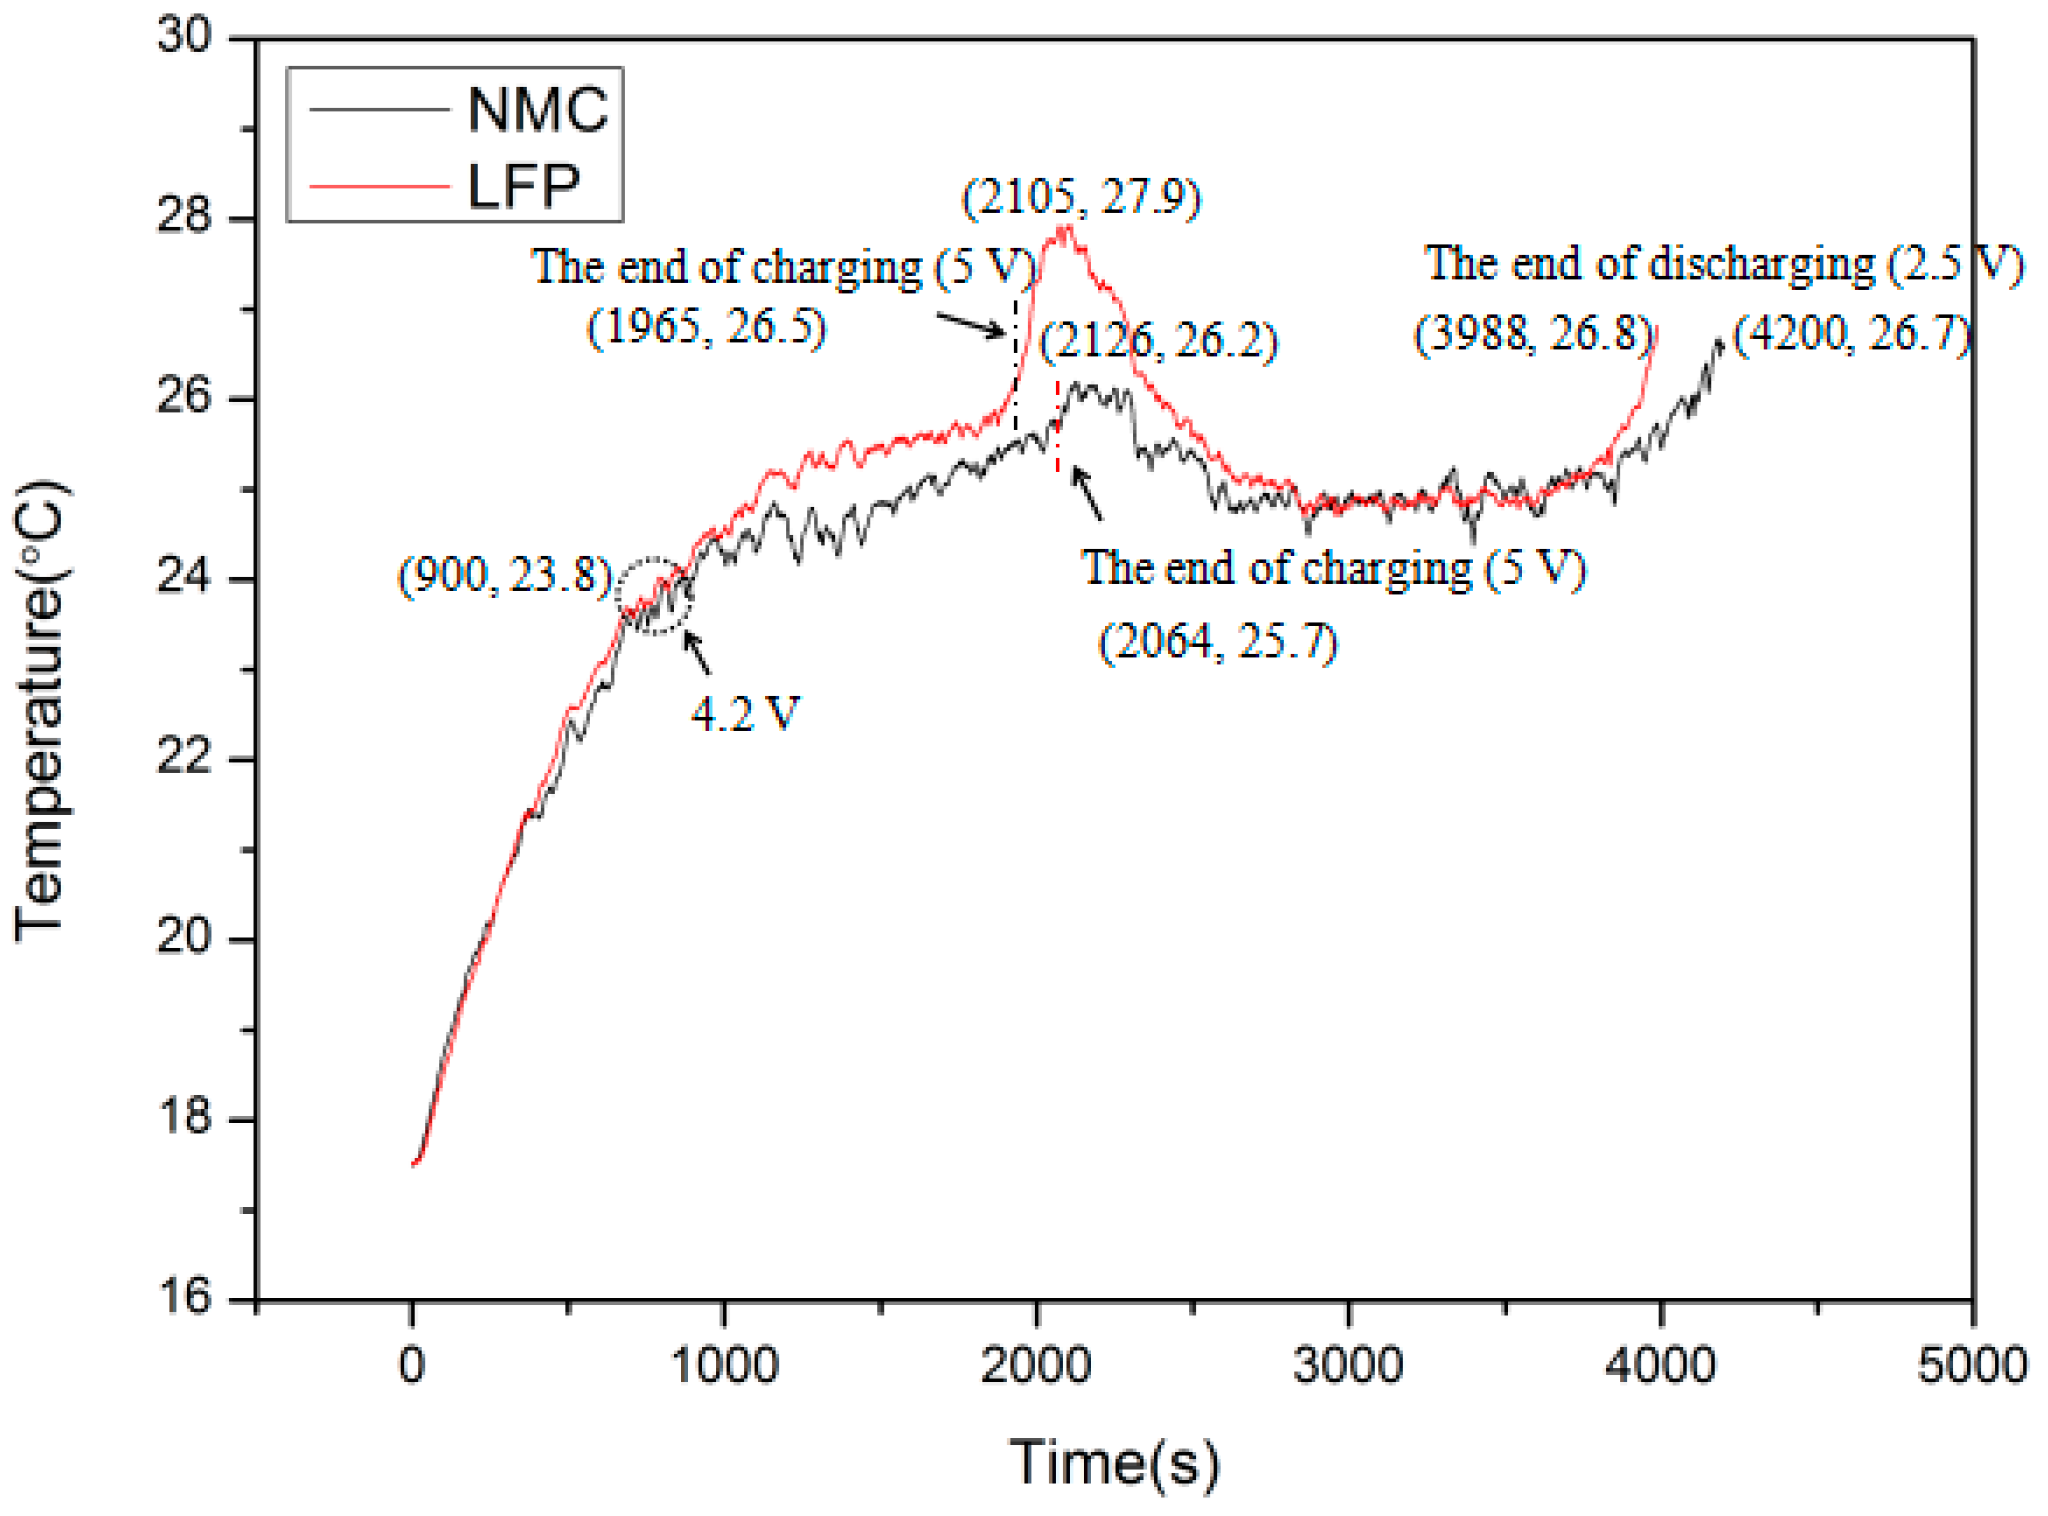
The surface temperature curves of LIBs during charging and discharging are presented in Figure 4. The batteries with a voltage of 2.5 V were firstly charged to 5 V at a 2 C rate and then discharged at the same rate to 2.5 V again. Both were measured at room temperature simultaneously. It can be seen that the surface temperature rises at a similar rate in the initial segment of charging. After around 980 s, the temperature increases to about 23.8 °C when the voltage grows to 4.2 V. Hereafter, the temperature difference between them becomes more obvious. The LFP battery possesses a higher surface temperature and reaches the end of charging sooner, when the temperature is 26.5 °C. Afterwards, the charging of the NMC battery also ends with a surface temperature of 25.7 °C. During the discharging process, there exist two obvious temperature rises at the initial and final stages. At the initial stage of discharging, the temperature has a huge increase and gets to a peak temperature of 27.9 or 26.2 °C, respectively. Hereafter, the temperature drops continually and fluctuates around 25 °C. With the end of discharging approaching, the temperature presents another rise and has an end temperature of 26.8 or 26.7 °C, respectively.
The surface temperature variation mainly results from the heat generated by the battery, including partly irreversible (Qirr) and partly reversible (Qrev), especially for the Joule heat included in Qirr [15]. This is the result of overcoming the internal resistance when current flows through the battery. Moreover, the internal resistance changes with the variation of temperature and SOC. At the initial time, the internal resistance gradually decreases during discharging, and then remains stable until discharging gets to the final stage, where the internal resistance rises up sharply [15]. This corresponds to the obvious temperature rise at the initial and the final stages.
3.2. Burning Process
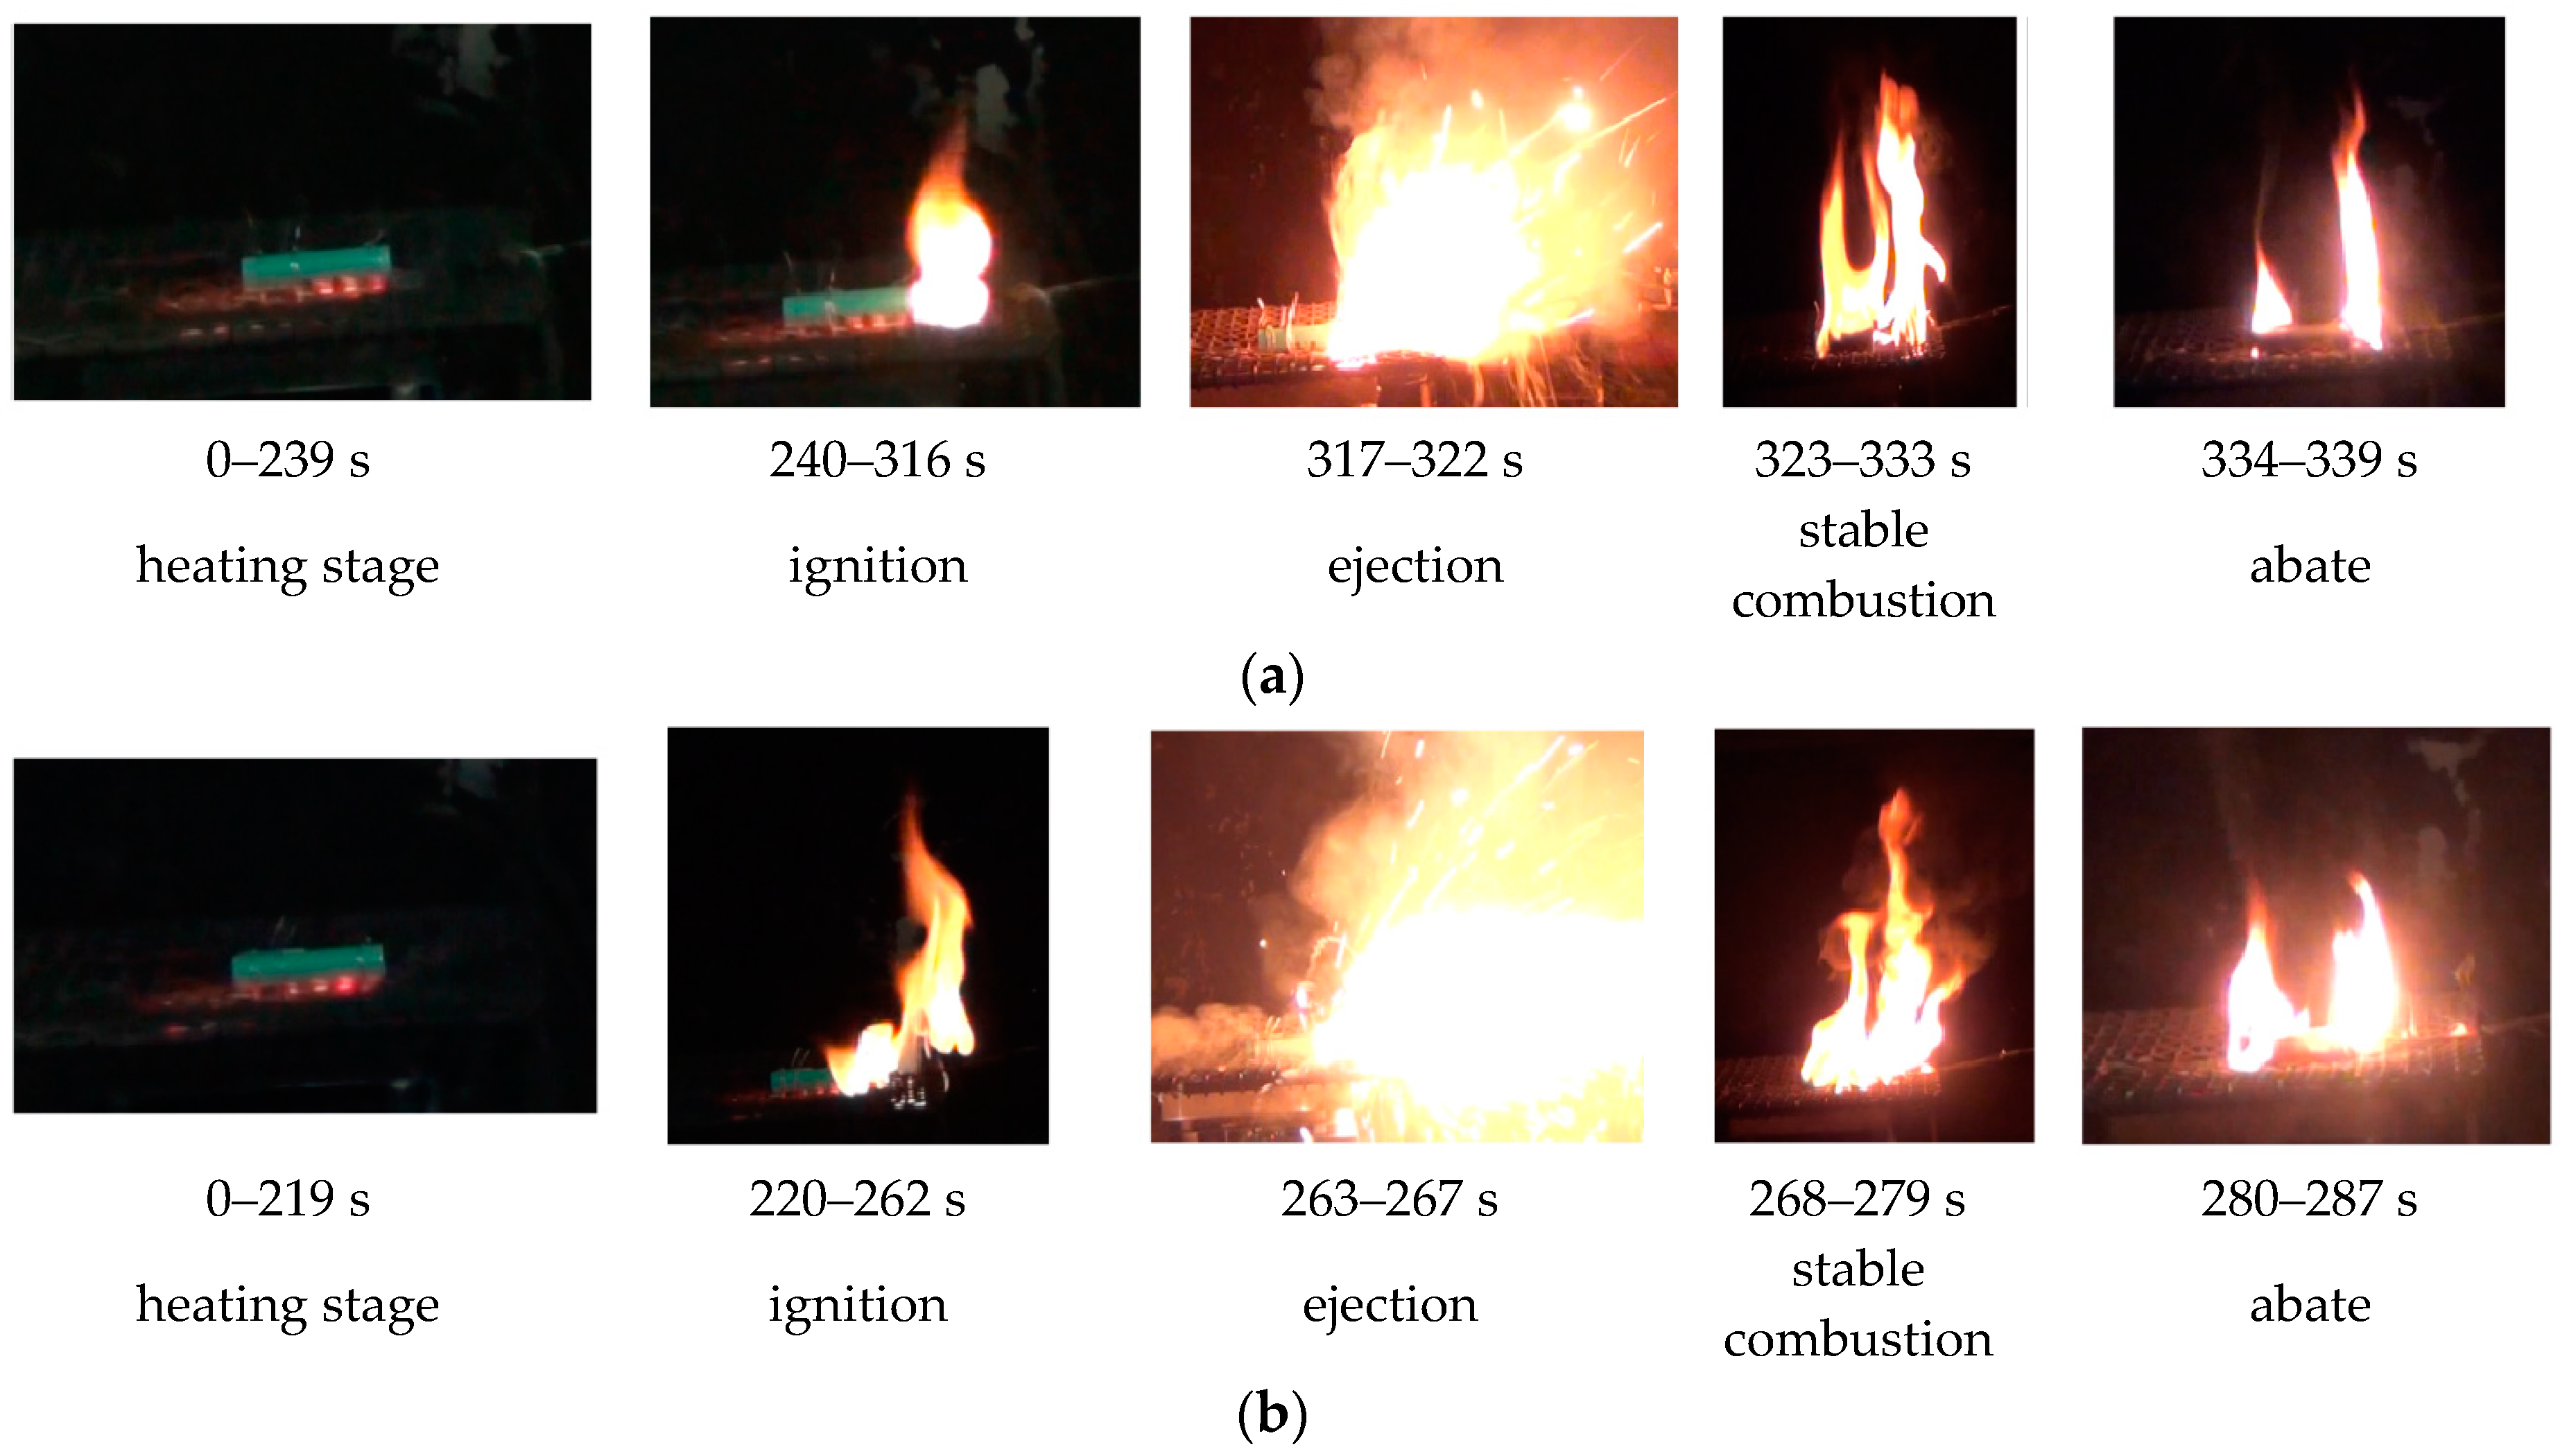
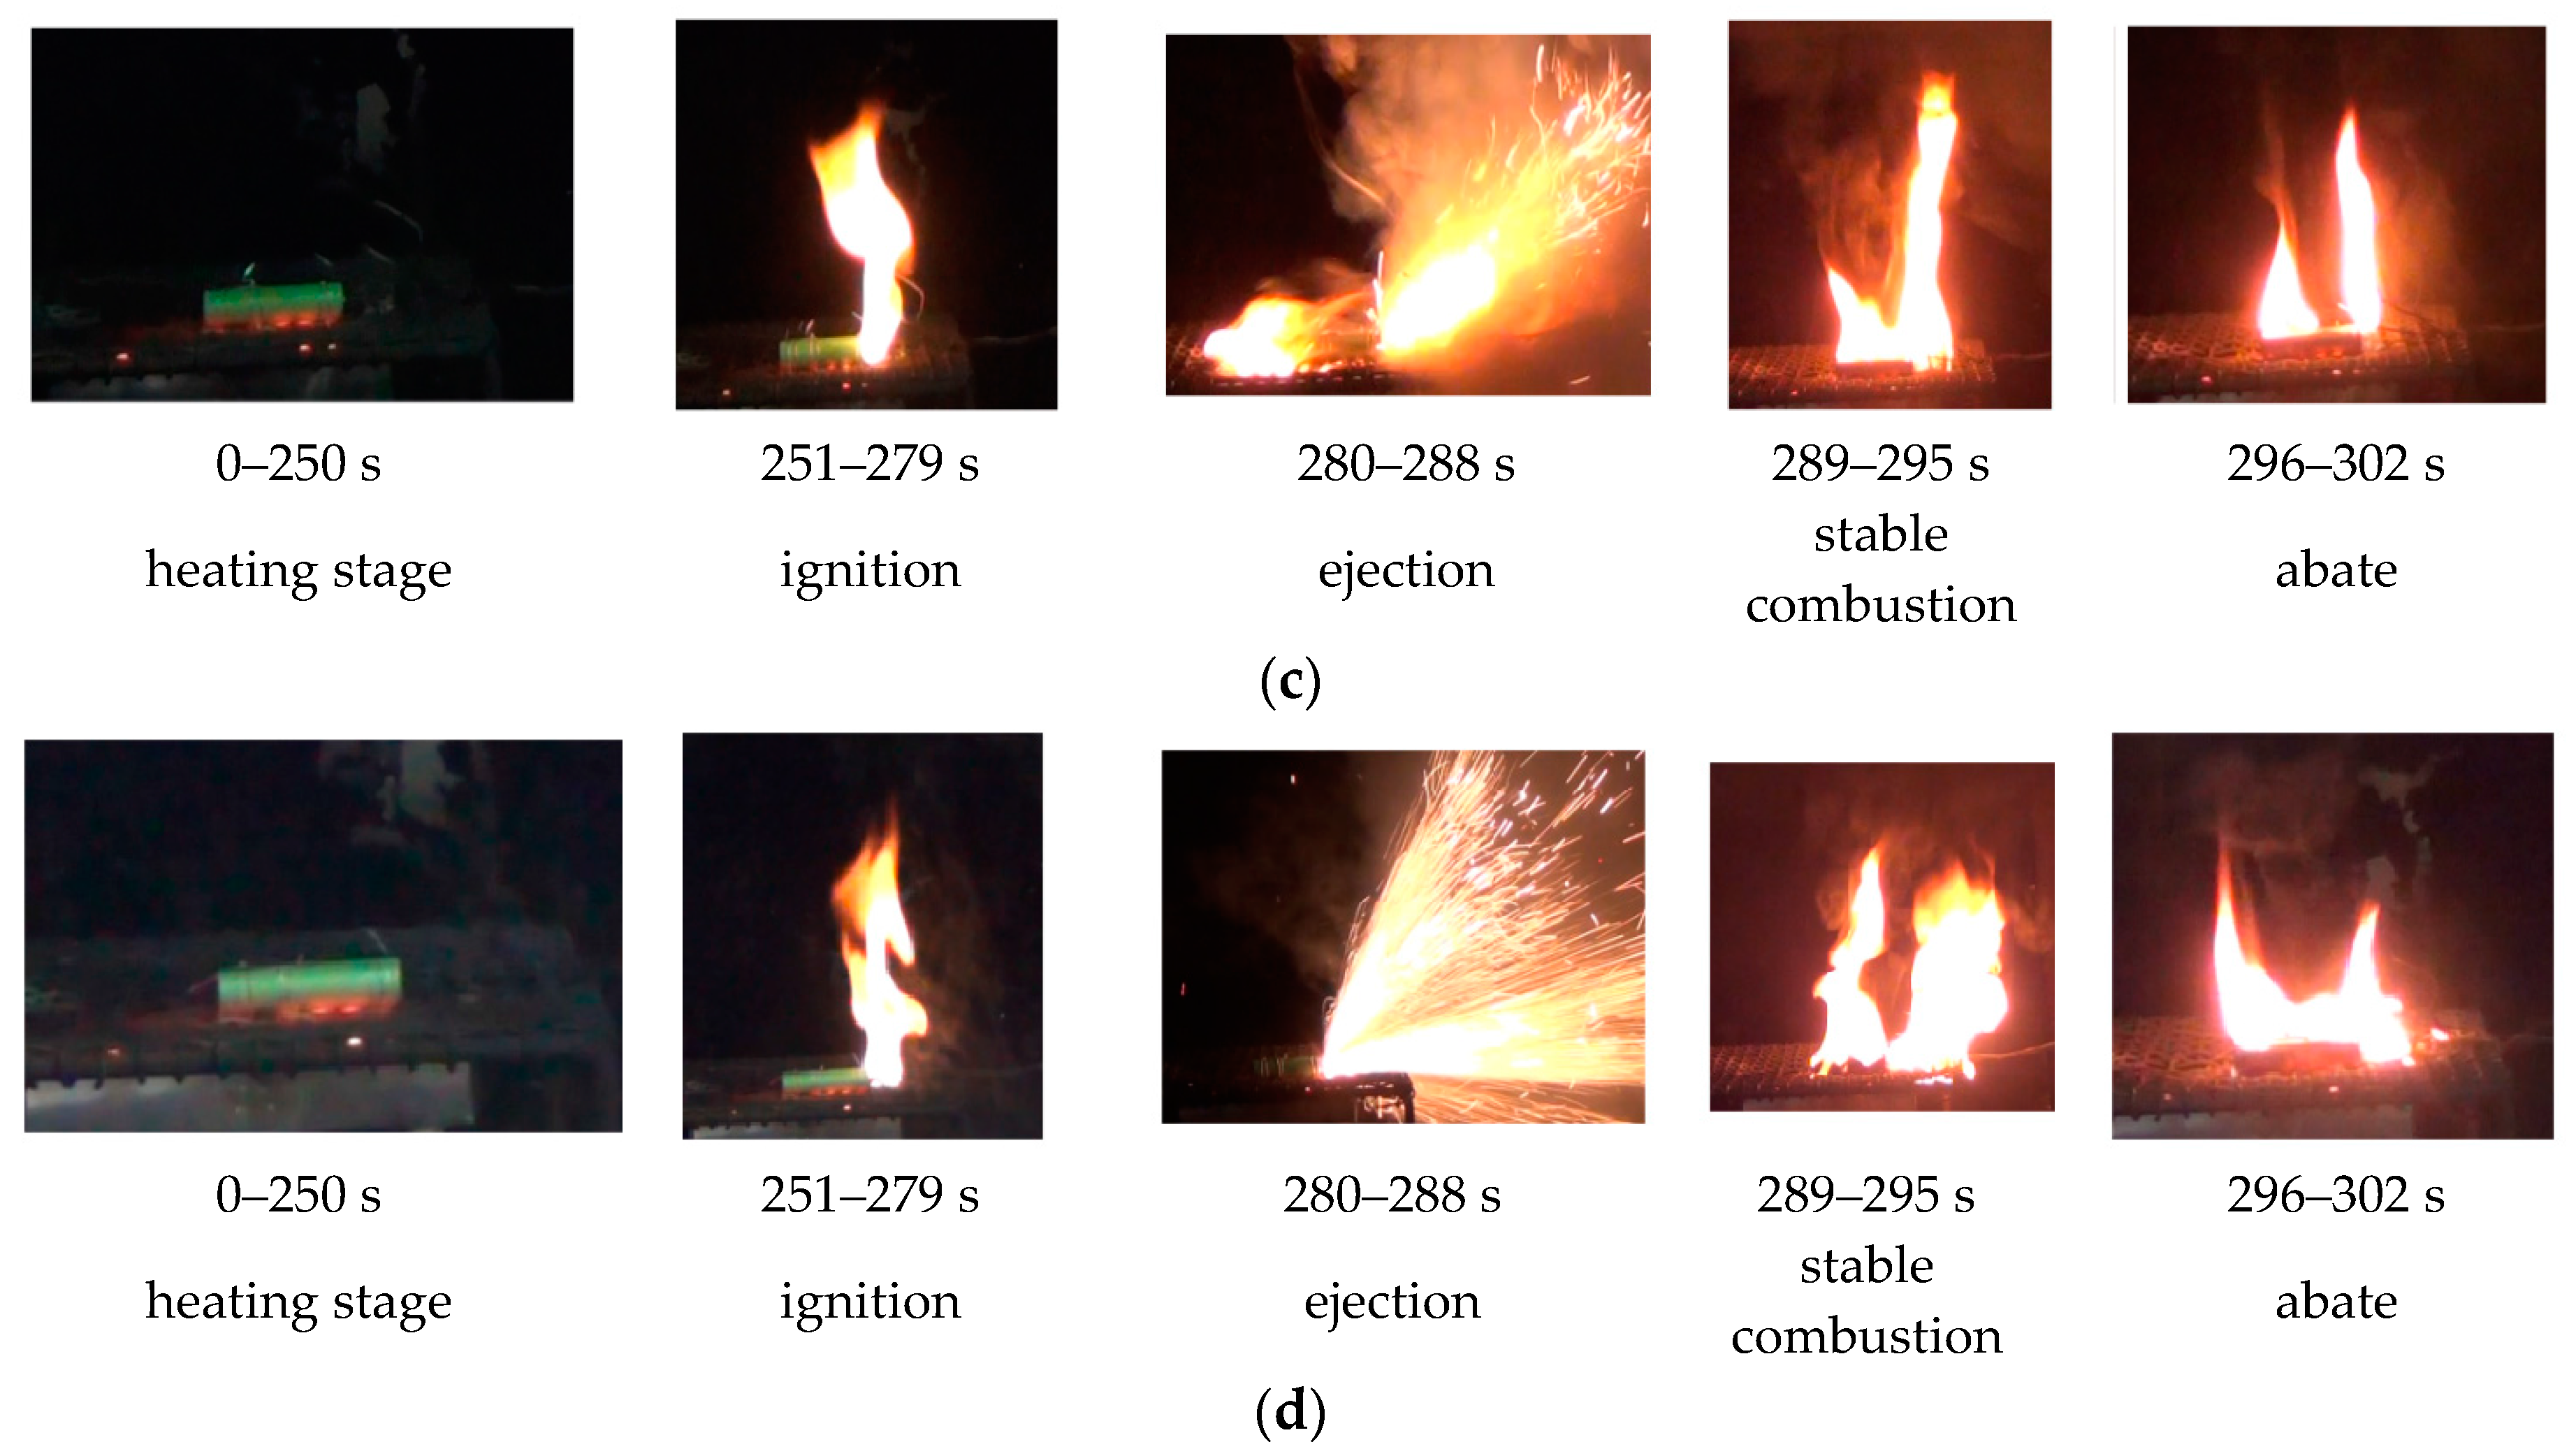
Figure 5 shows several typical moments during the burning process of LIB under the effect of a 2 kW power electric heater. The two types of LIBs exhibited similar burning phenomena during tests; these can be divided into five stages: (a) heating stage; (b) rupture and ignition; (c) violent ejection; (d) stable combustion; and (e) flame abatement. During the heating stage, the battery remained stable and only part of the packing melted. With the continuous rise of temperature, the safety vent cracked, accompanied by a clear sound. Hereafter, t smoke was released and then the smoke ignited. The flame lasted until a large quantity of smoke was liberated, resulting in the violent ejection, and then stable combustion could be observed. With the depletion of the combustibles, the fire began to abate and be extinguished. These phenomena were consistent with those observed in previous works [16,17,18].
Comparing the fire behaviors of 4.2 V LIB and 5.0 V LIB, it can be seen that the overcharged LIB exhibits earlier ignition, ejection, and stable combustion than the normal LIB. Moreover, its ejection and combustion are much more violent. This reveals that the overcharged LIB possesses a more serious combustion process and a lower stability than the normal LIB. It is the result of unstable electroactive materials, where highly delithiated electroactive materials become more reactive in the overcharged LIB [6].
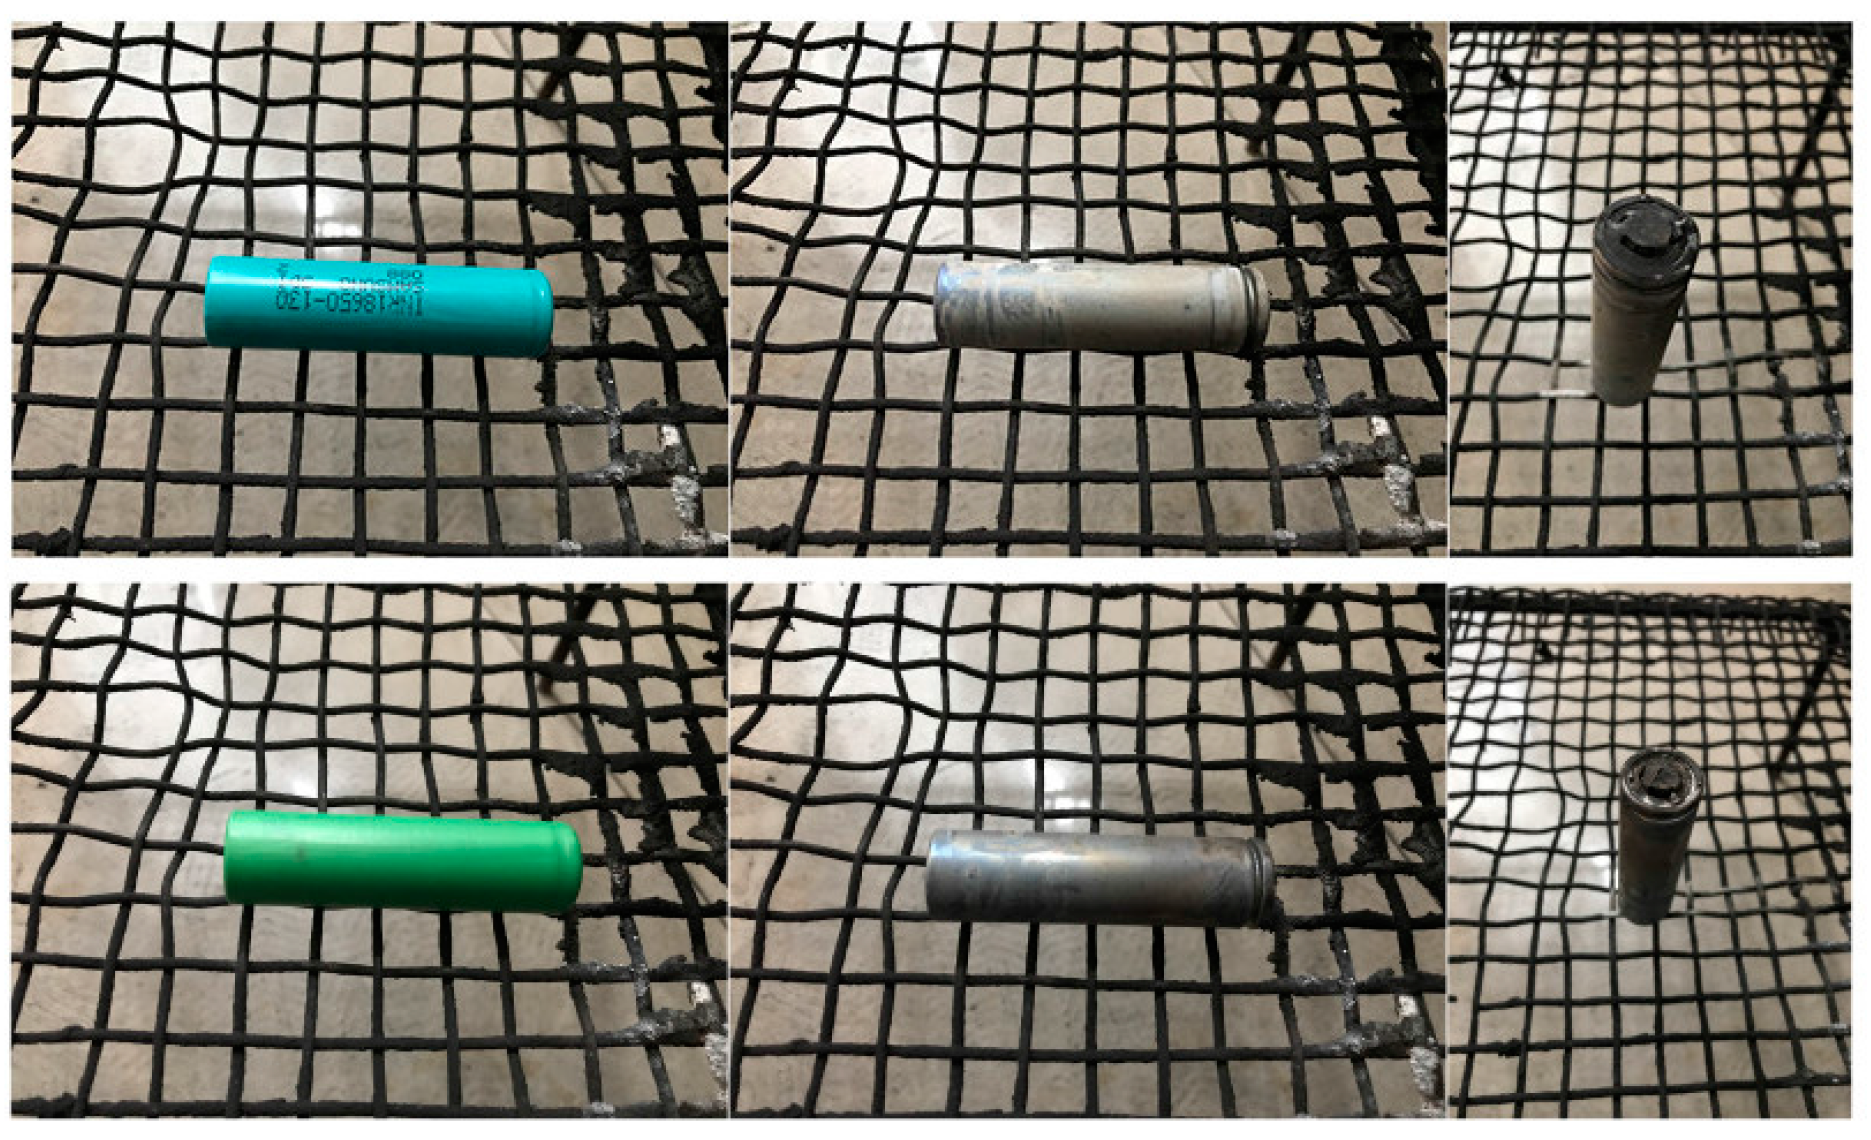
Some photographs of batteries before and after tests are presented in Figure 6. It is obvious that LIBs were severely damaged after burning. The surface packing was entirely burned away after tests. The iron can of battery deformed under the expansion of generated gases and there were some electrolyte residuals on the surface of the battery. Also, it is clear that the positive pole of battery was carbonized totally.
3.3. Battery Surface Temperature
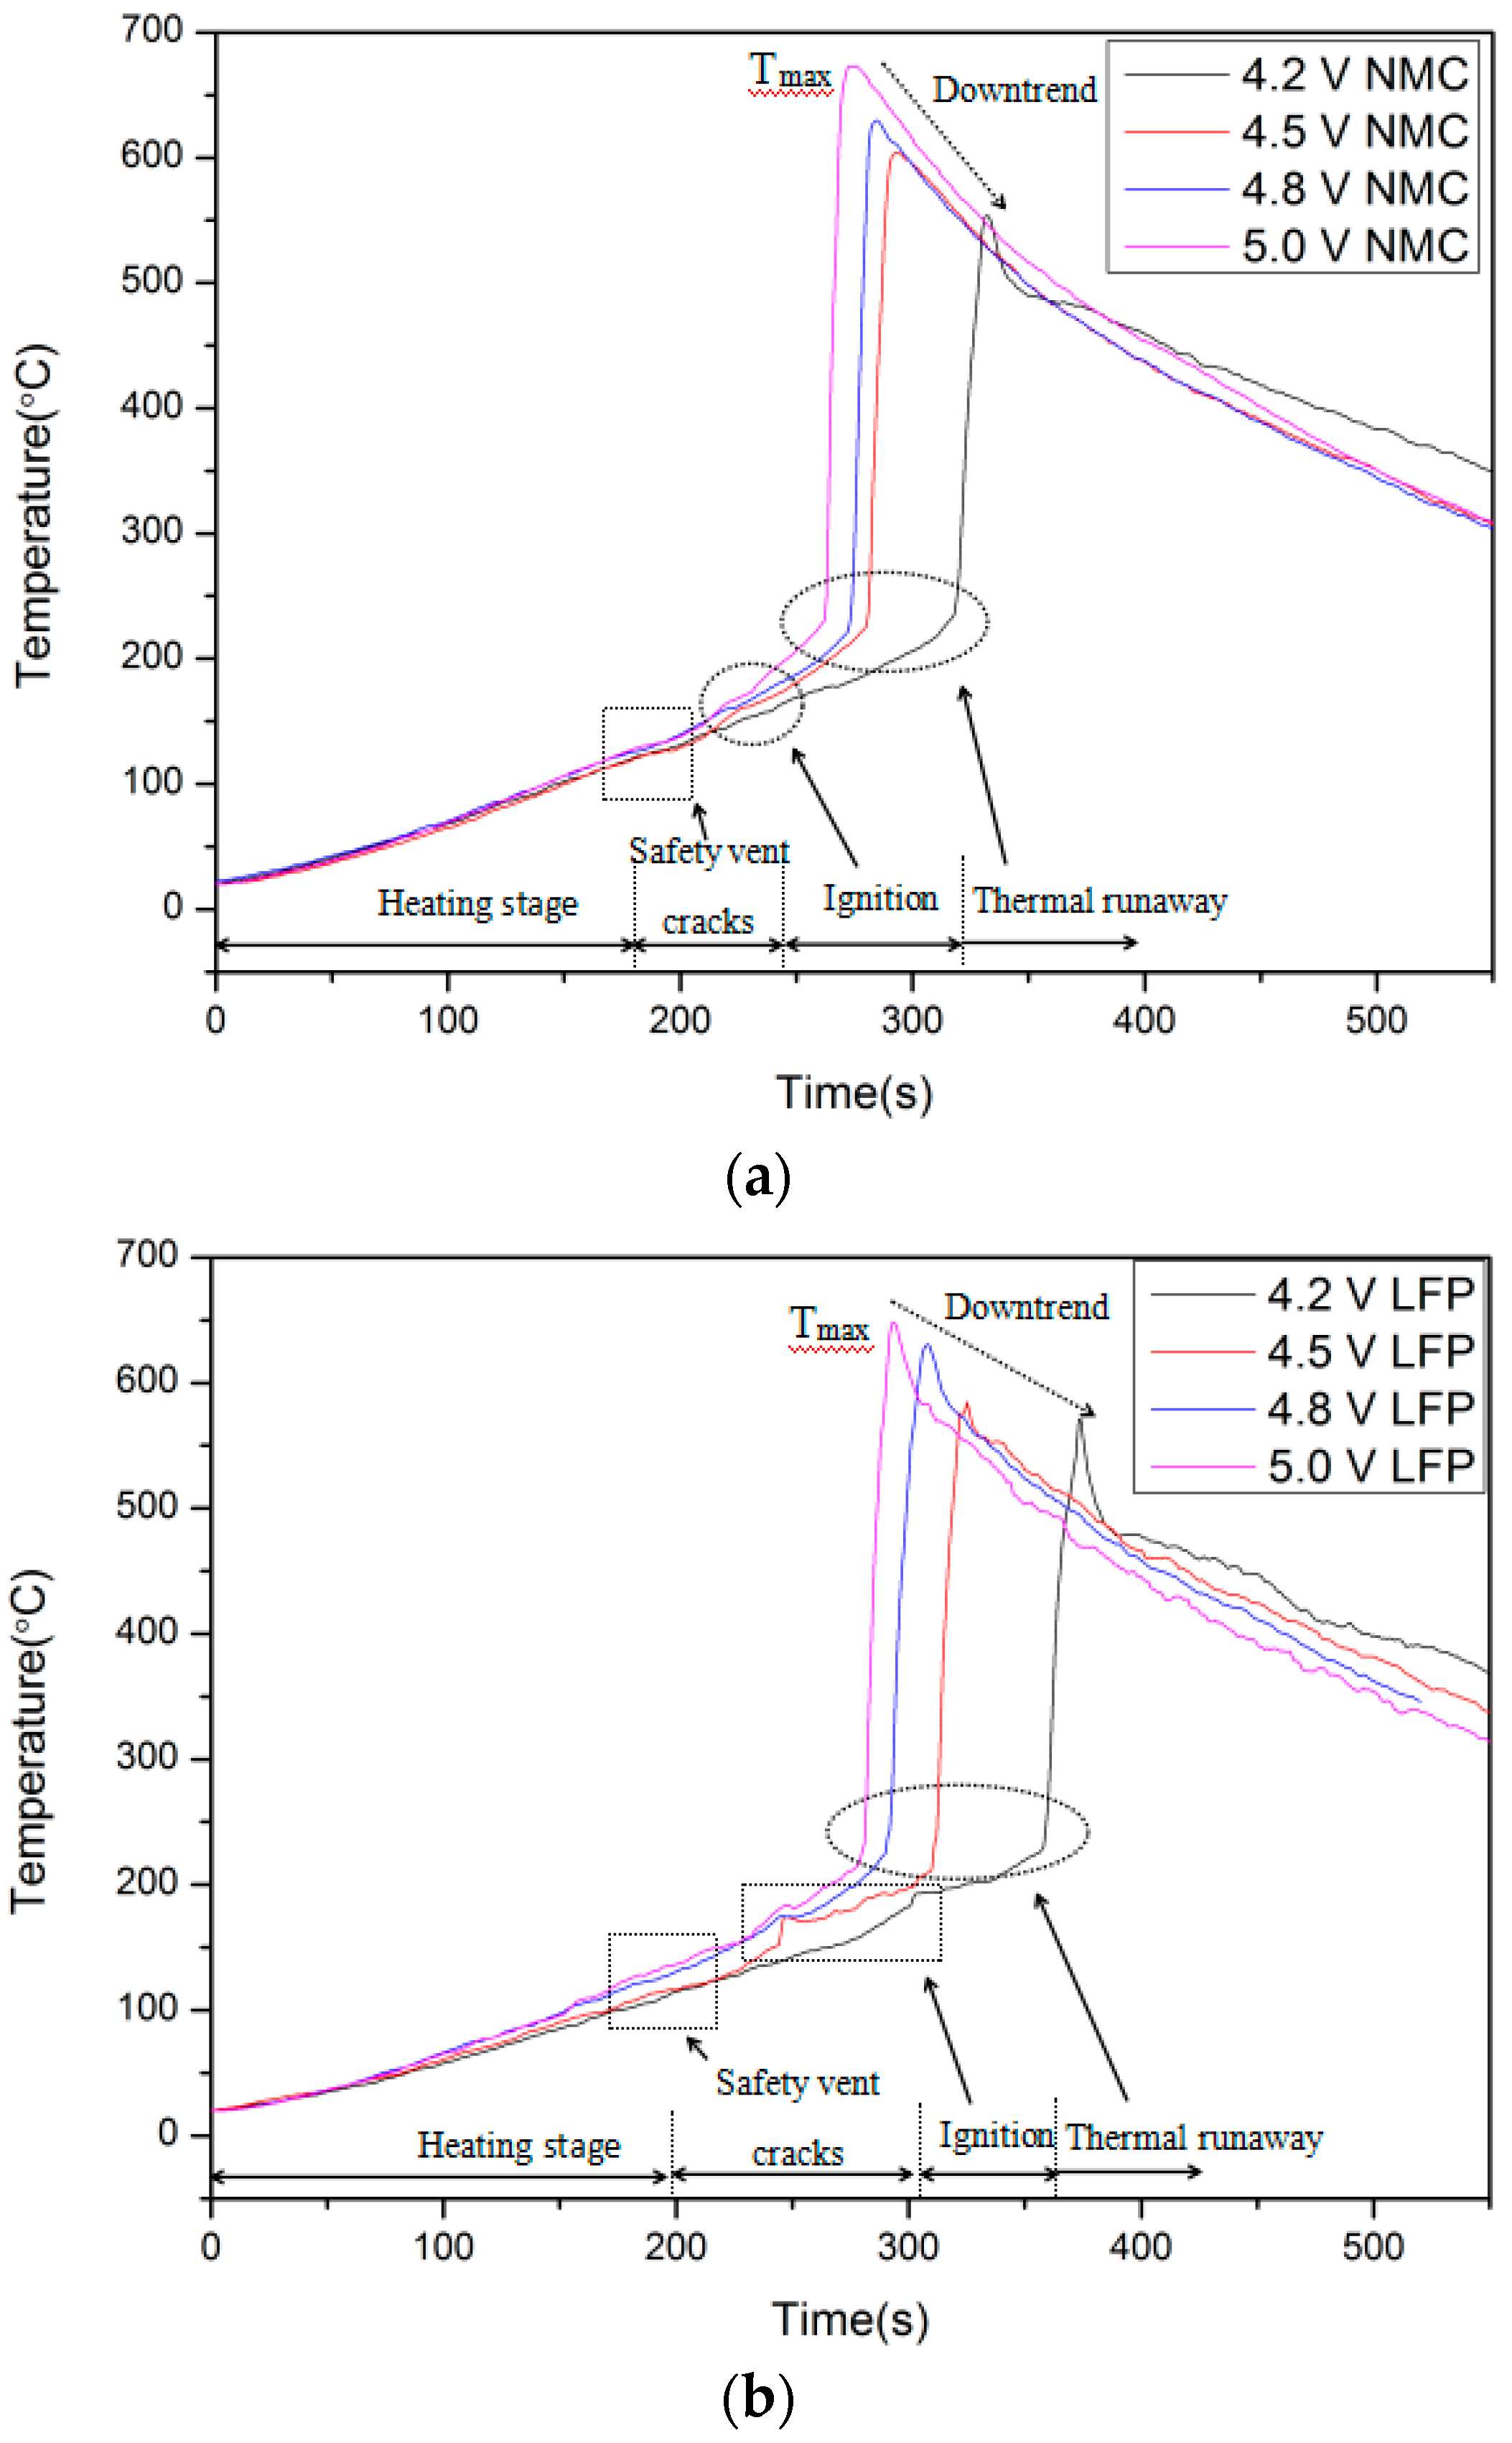
The histories of surface temperatures for all the configurations are plotted in Figure 7, where the five stages divided in Section 3.2 can also be observed. The variations of surface temperature during tests were discussed to analyze the fire behaviors of LIB. At the heating stage, the surface temperature rises smoothly due to continuous external heating, and the packing of the battery melts gradually. Subsequently, it can be seen that the safety vent cracks were accompanied by some smoke ejected. The smoke ejected is ignited later and a flame appears, followed by an accelerated temperature rise. Hereafter, thermal runaway occurs and it can be observed that the temperature increases sharply to a peak.
Key parameters, such as the time to safety vent cracks, the temperature to safety vent cracks, the time to ignition, the temperature to ignition, the time to thermal runaway, the temperature to thermal runaway, and the maximum temperature can be extracted from the curves and are listed in Table 2. Compared to the normal LIB, the overcharged LIB showed earlier safety vent cracks, ignition, and thermal runaway. Meanwhile, with the increasing voltage, the fire emerges earlier and the maximum surface temperature has an uptrend. Namely, an LIB overcharged beyond the cut-off voltage is more prone to be unstable and lose control. The phenomenon will become worse for a highly overcharged LIB. On the other hand, after comparing the details of these two types of LIBs, it is revealed that the NMC fails earlier than the LFP under external heating conditions, which is consistent with a previous report [19].
As shown in Equation (3), time to ignition (TTI) depends on the release rate of combustible gases inside the battery and the critical mass flow rate when gases are ignited [20]. Except for the radiation strength, TTI is affected by the pyrolysis kinetics of materials [20,21]. With the increase in voltage, the electroactive materials of the battery will become more reactive, and therefore it is easier to reach the critical condition of ignition.
where is the radiant heat flux, is the initial heat flux for ignition, is the material thermal inertia, and and are the ignition temperature and initial temperature, respectively.
The temperature rise rate is plotted against the surface temperature in Figure 8. The electronic heater heats up the LIBs from the ambient temperature of 20 °C. At around 160 °C, ignition appears for NMC and then the temperature rise rate has a minor increase that corresponds to the obvious temperature rise of the battery after ignition. It is noted that the temperature starts to rise distinctly at around 230 °C, which is regarded as the onset of thermal runaway. It is obvious that the temperature rise rate grows with the increase of cut-off voltage after the thermal runaway. The higher the cut-off voltage, the quicker the temperature rise rate will be. On the other hand, this reveals that the battery with the higher cut-off voltage will experience a more violent combustion if ignited.
With the continuous rise of temperature, the solid electrolyte interface (SEI) layer breaks down at 90–130 °C, causing the intercalated lithium to react with the organic solvents at 90–290 °C. The polymer separator melts at around 130 °C [22], allowing short circuits between electrodes. Hereafter, the metal oxide cathode materials decompose and react with the solvent at 150–500 °C [23,24,25]. Large quantities of heat are generated from these reactions, leading to the thermal runaway of the battery in the end. Results reported previously are consistent with what we obtained in the work.
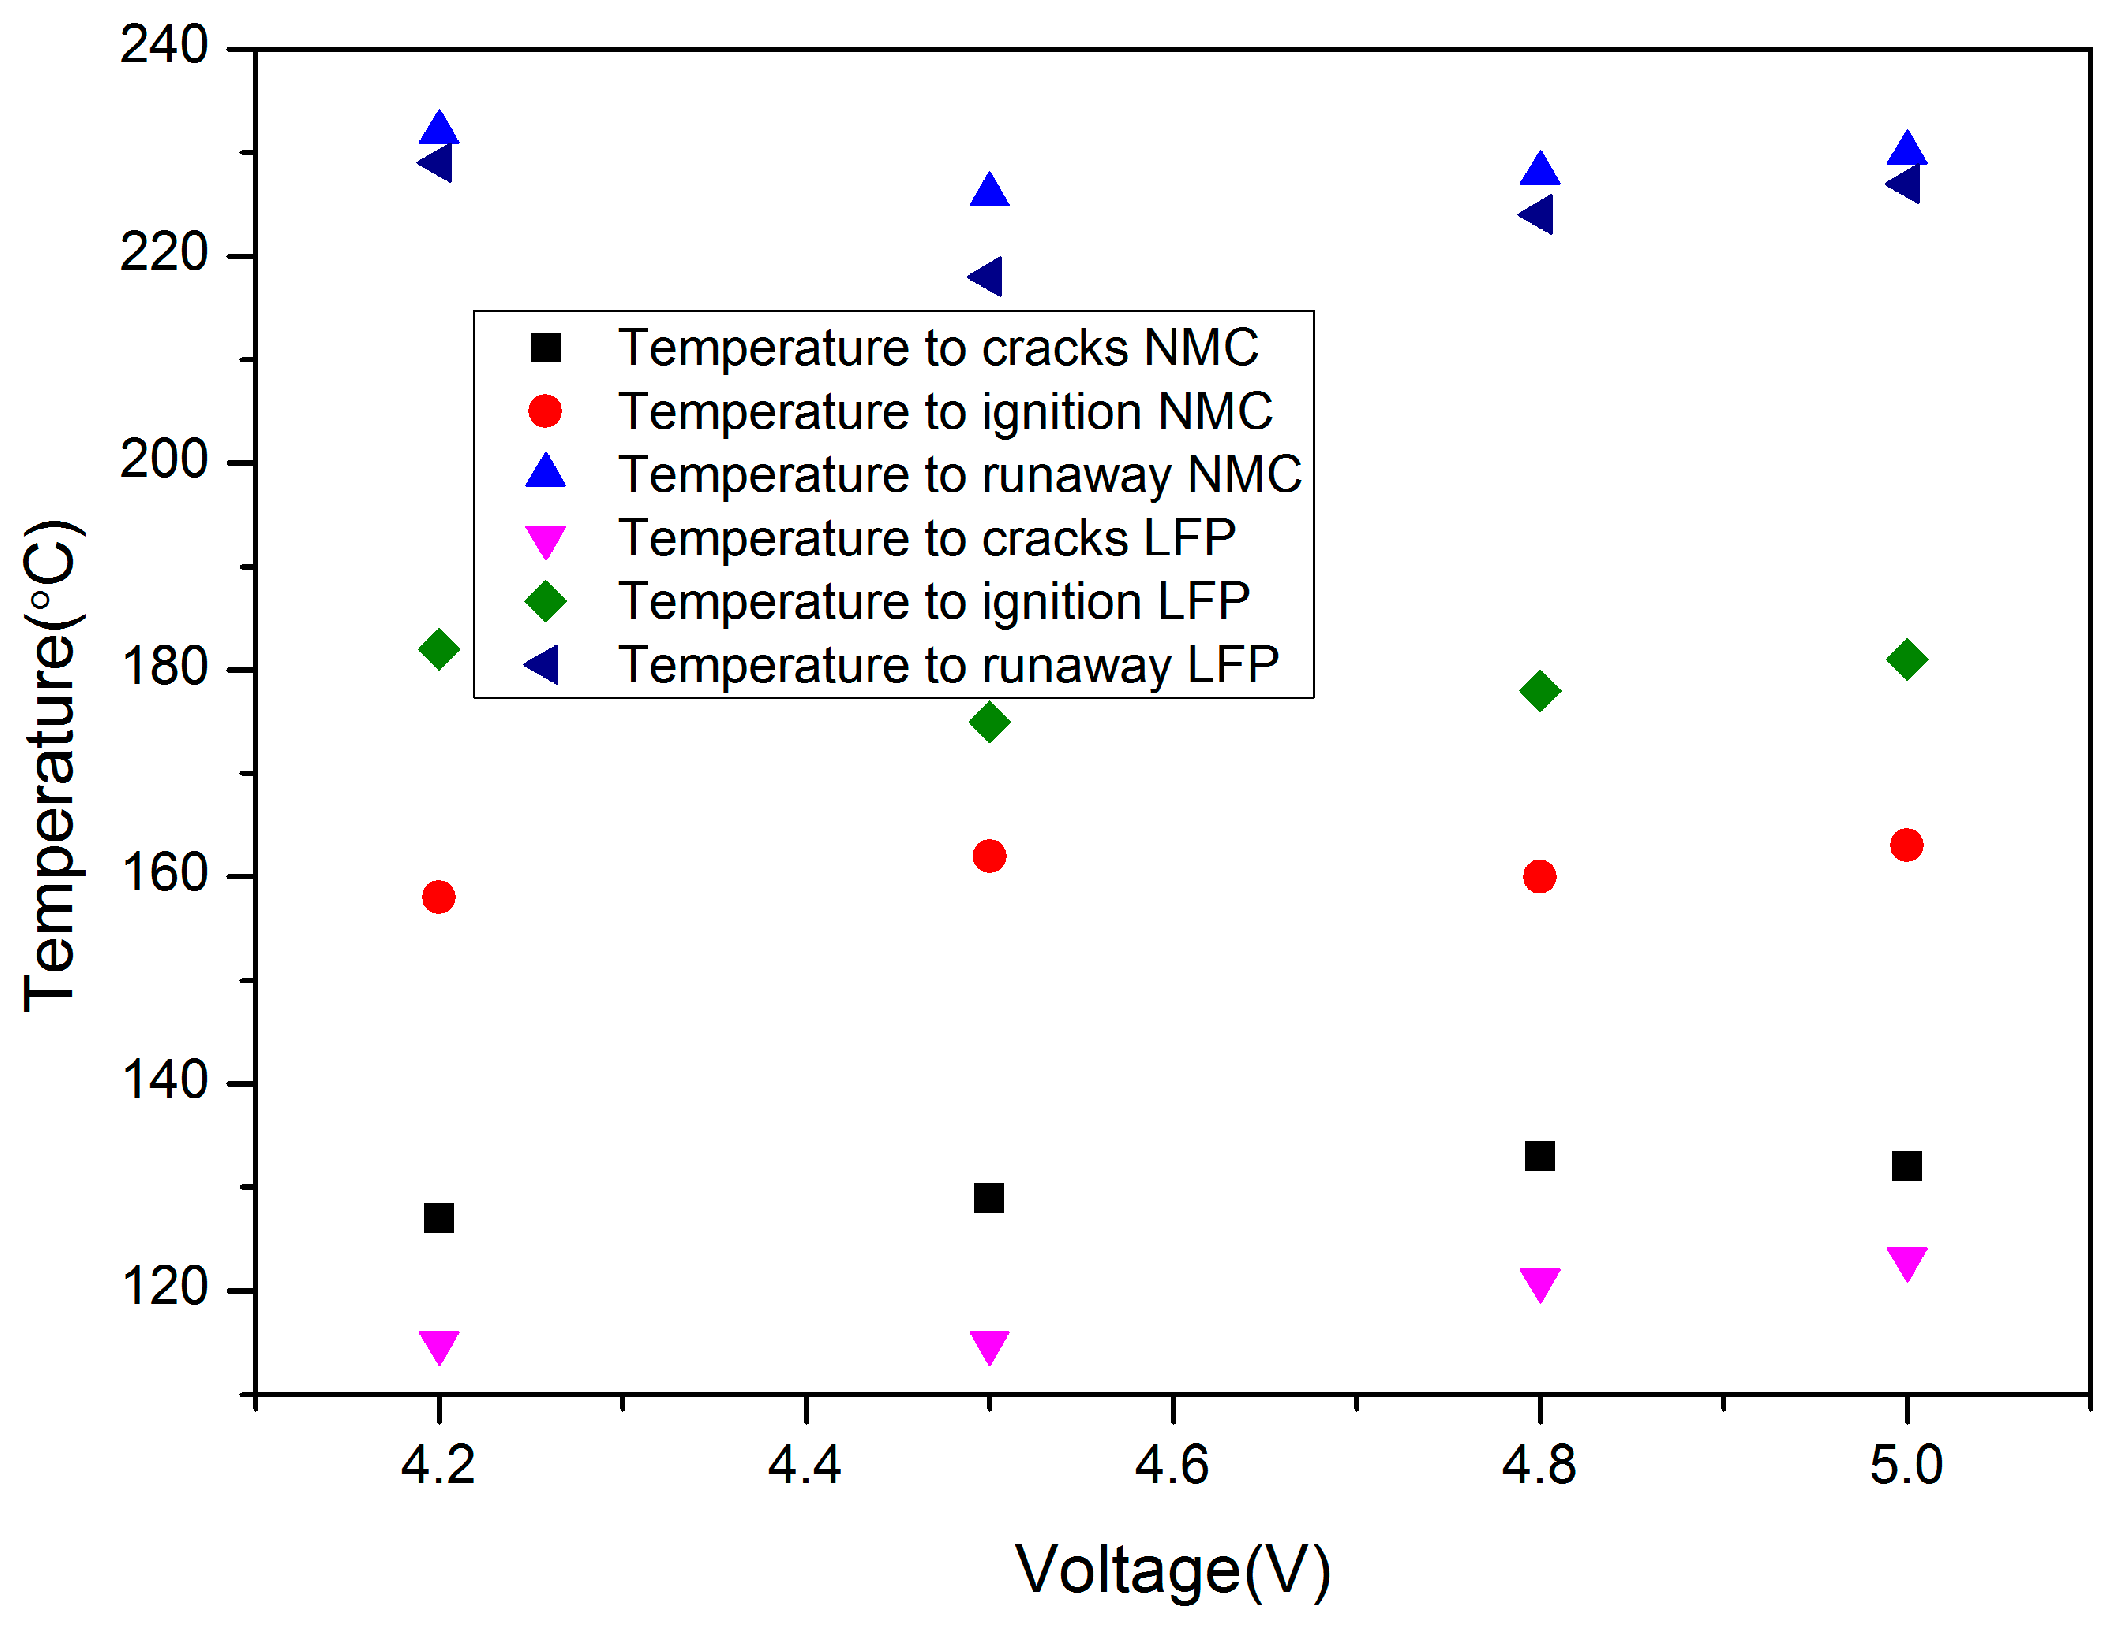
Moreover, it is interesting to find that the safety vent cracks temperature, the ignition temperature, and the thermal runaway temperature exhibit similar values for the same conditions, as shown in Figure 9. This reveals that LIB will fail at a certain temperature; the voltage has little influence on these parameters, and they mainly depend on the incident heat. This result is consistent with the research of Bilbao [26].
3.4. Flame Temperature
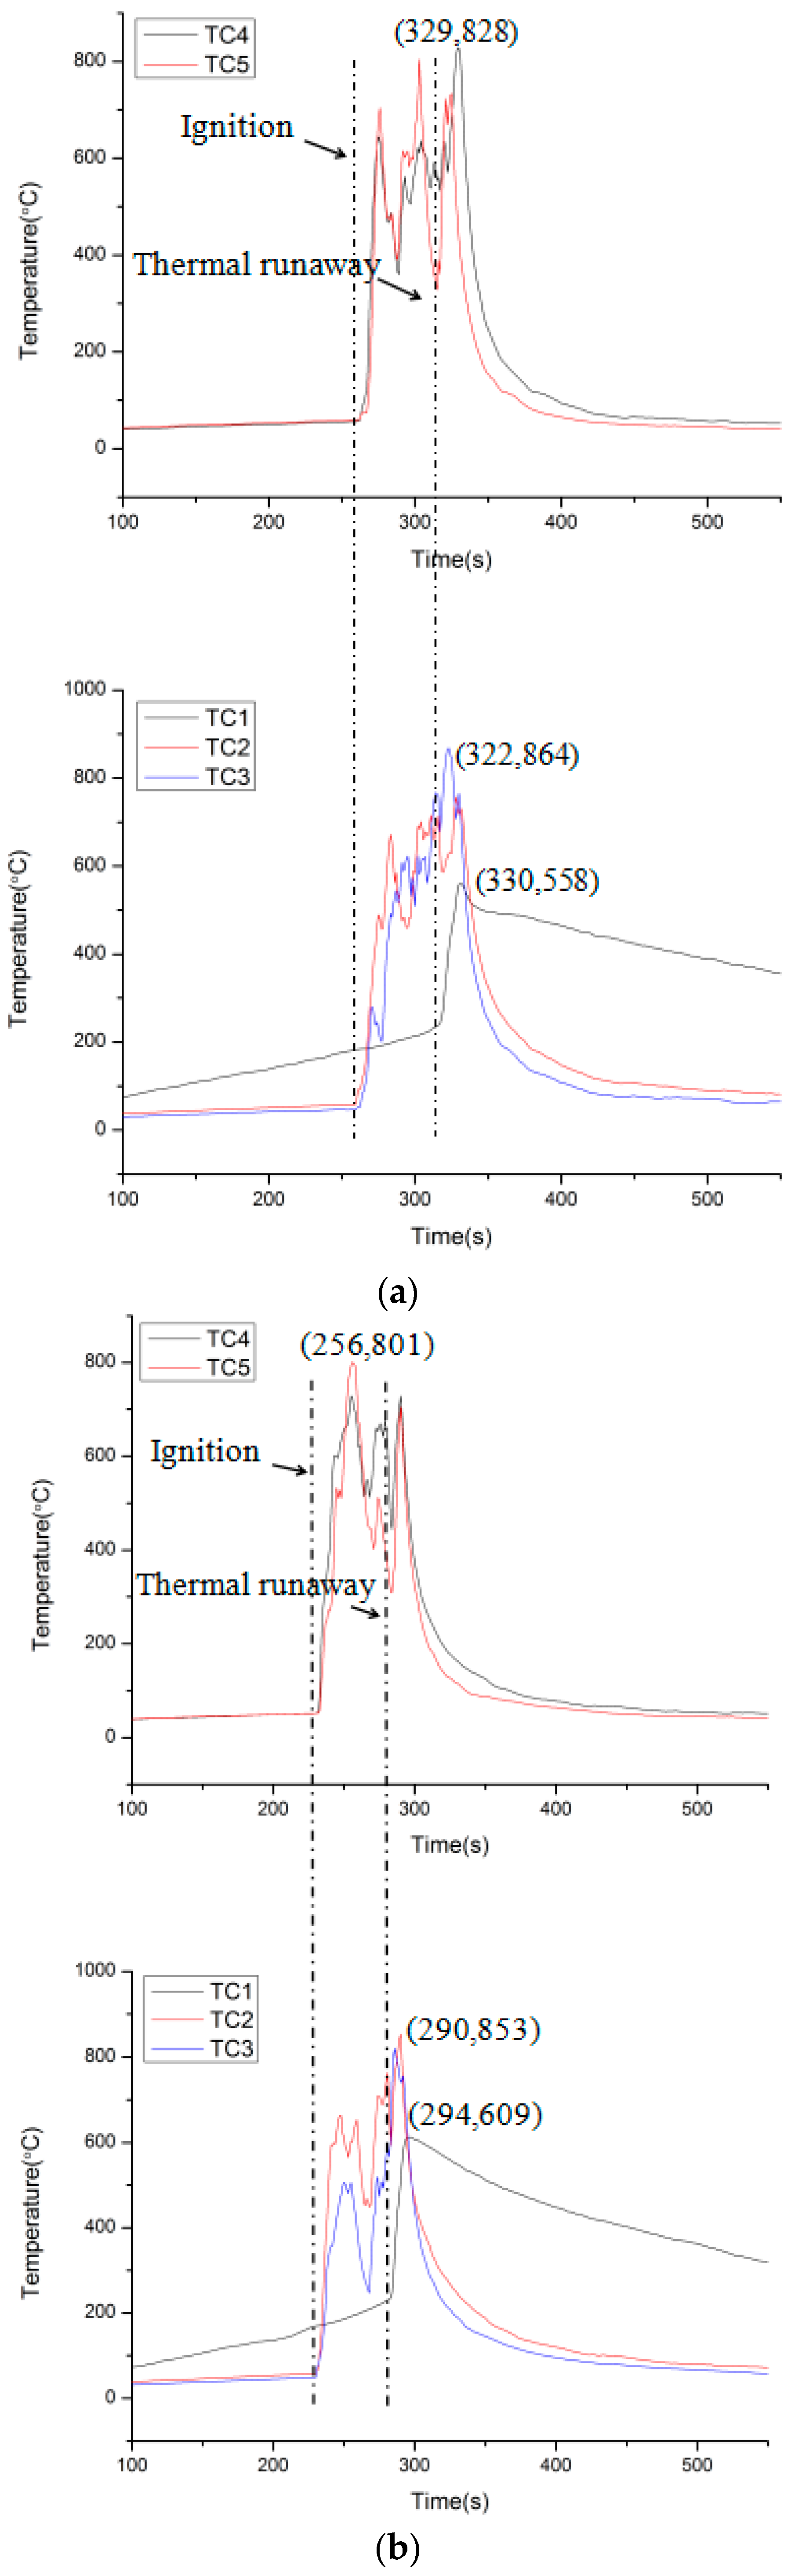
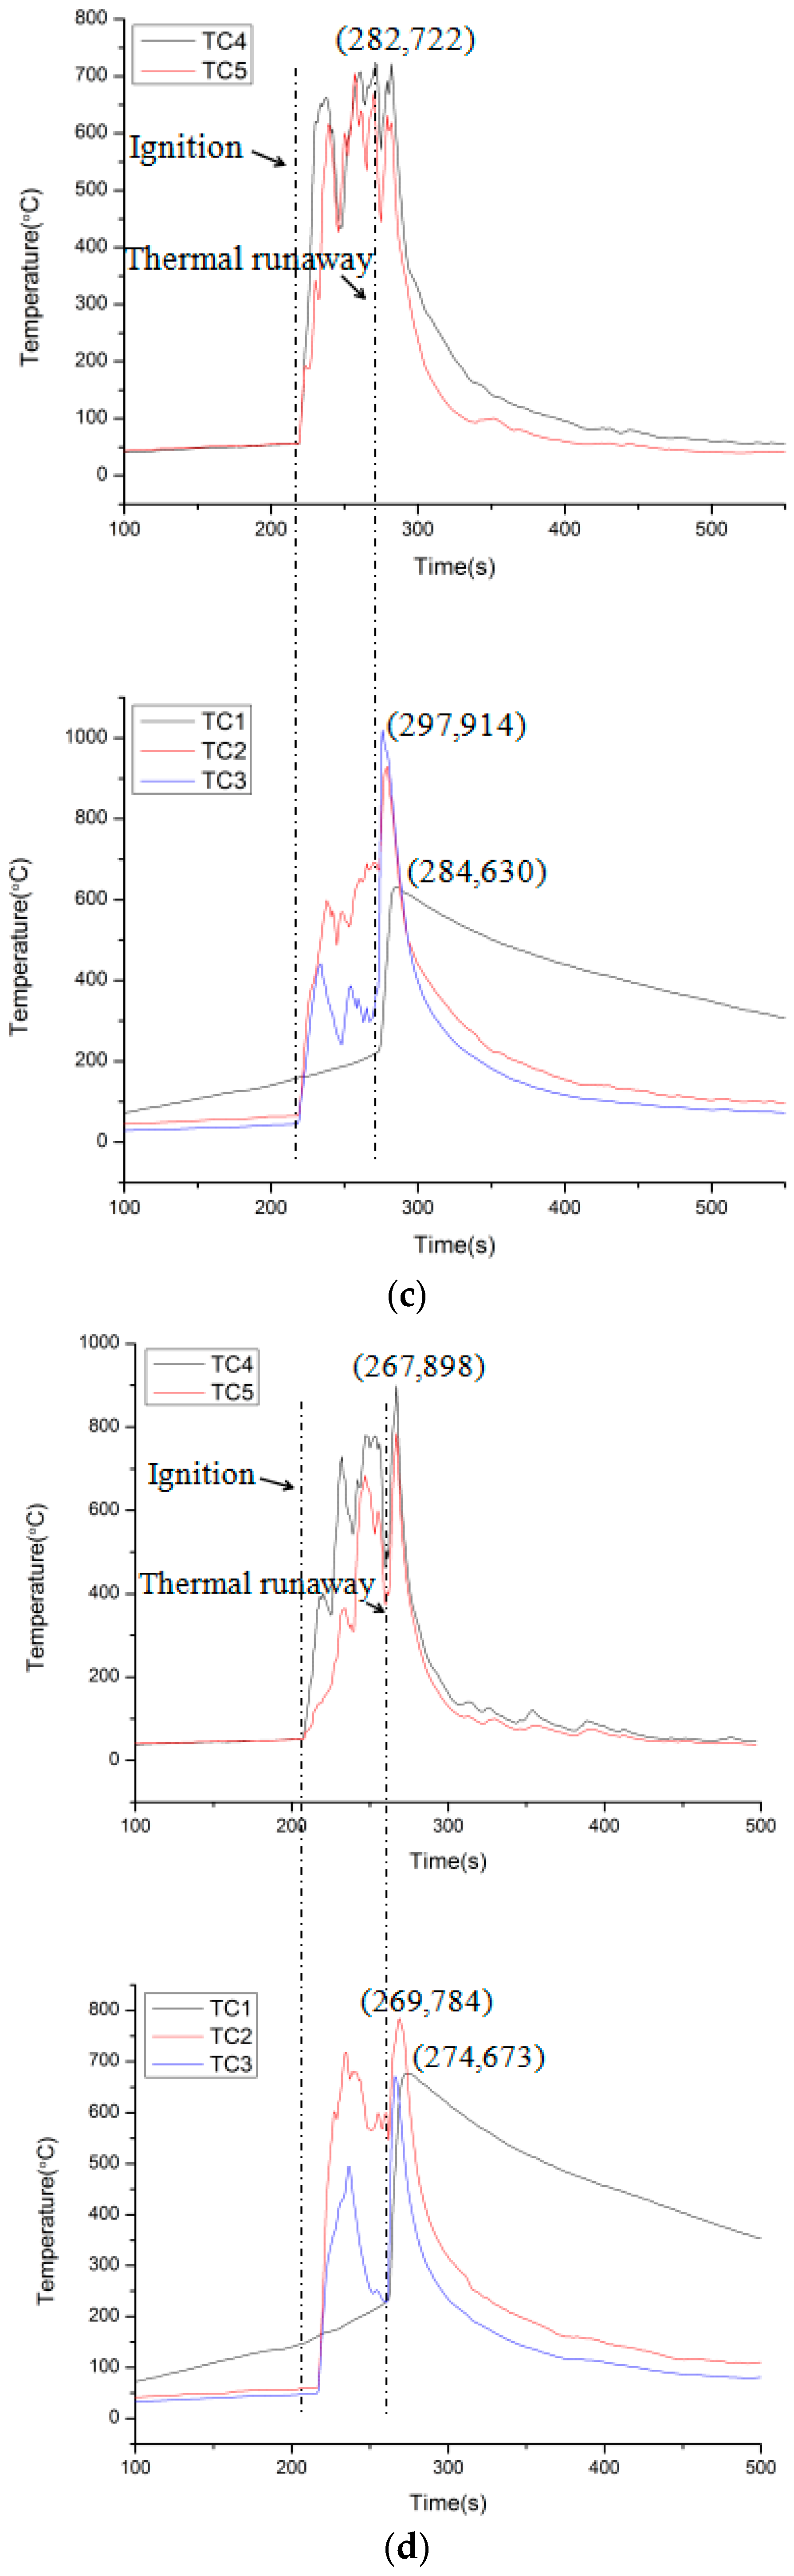
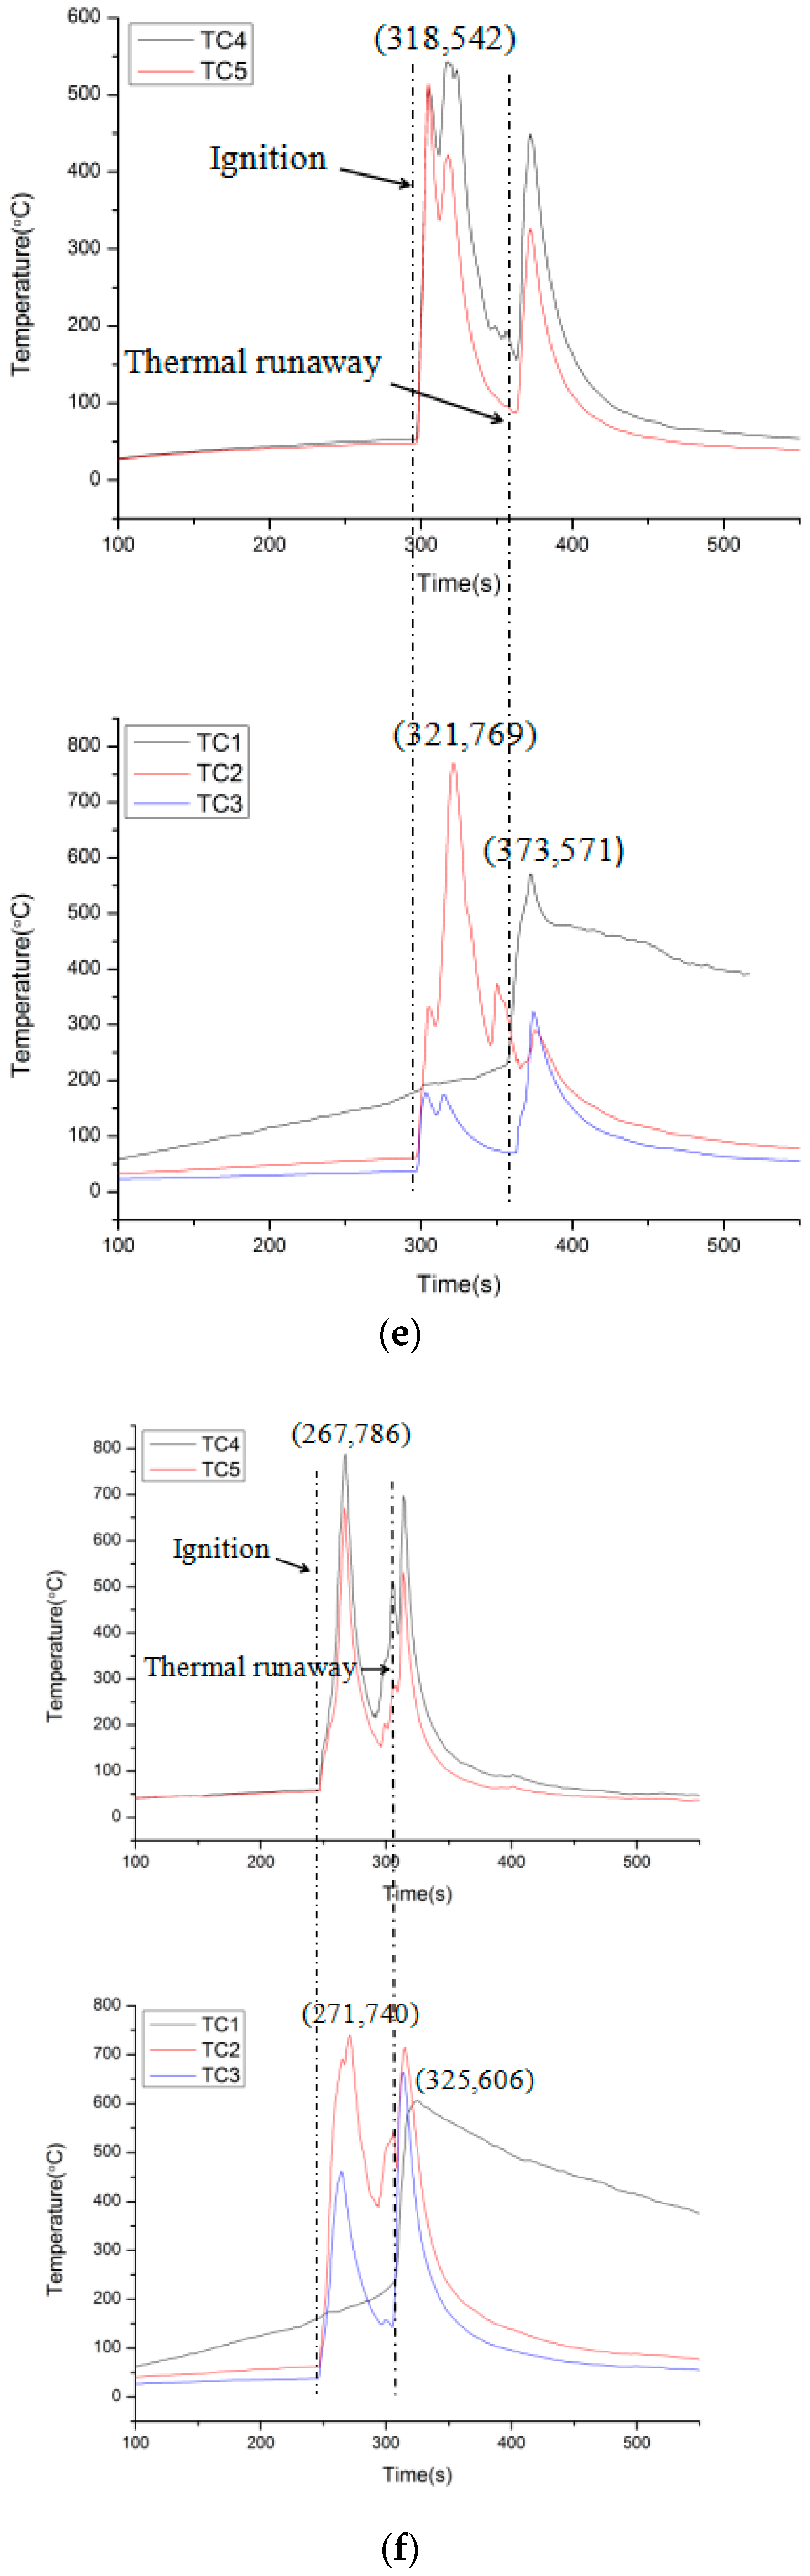
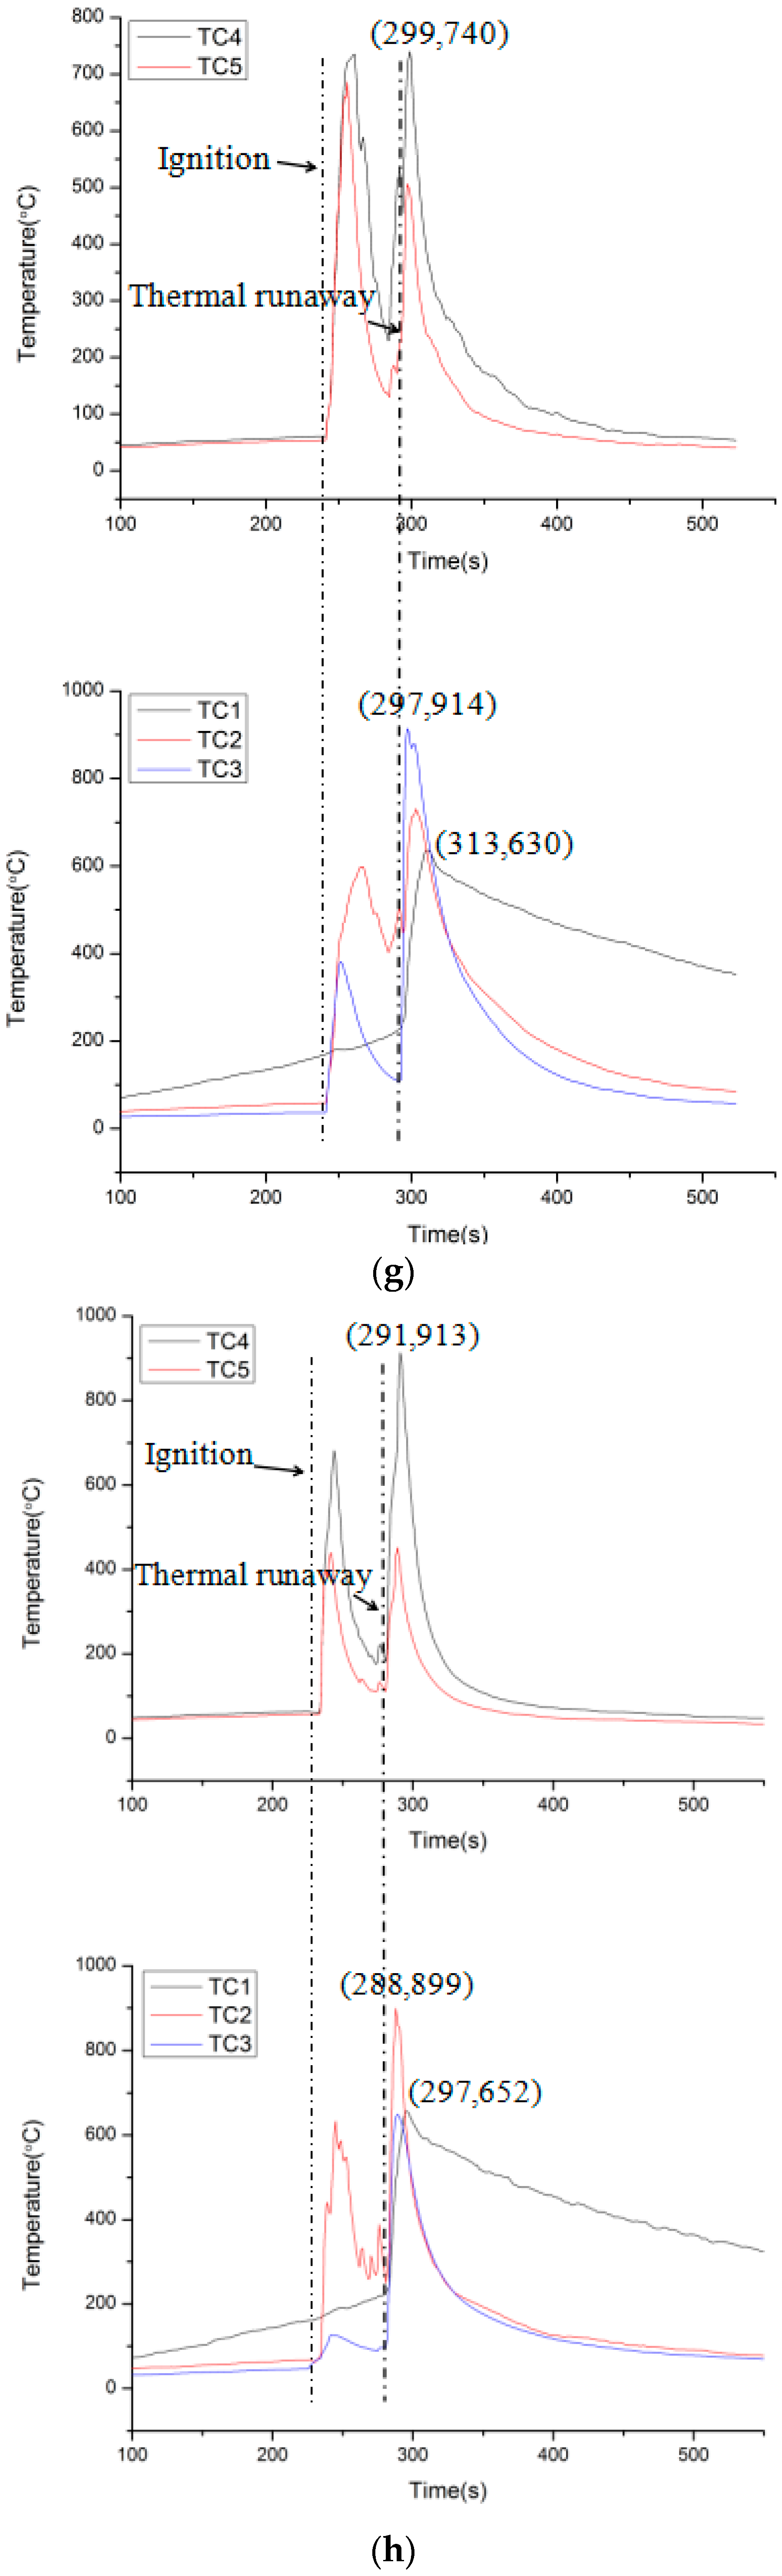
The typical curves of LIB flame temperature during tests are shown in Figure 10. All of them are relatively stable before ignition expressing as a platform. Hereafter, they have a sharp increase because of the fire ejected from the battery. After reaching a peak, the temperature fluctuates around 600 °C, which is caused by the jet fire’s instability. Afterwards, a second temperature rise can be observed. This is the result of violent ejection and combustion, and it appears earlier with an increase in voltage. Soon after, the temperature drops rapidly to nearly ambient temperature with the flame abating and extinguishing.
As shown in Figure 10, the temperatures of TC4 and TC5 exhibit similar curves, while the difference between TC2 and TC3 is relatively huge. TC4 and TC5 detect the temperature of flame axis away from the cathode 2 cm. Therefore, they are similar and stable. However, TC2 and TC3 have a distance from the cathode of 2 cm or 4 cm, respectively. It cannot be guaranteed that TC3 could be covered by flame all the time due to the instability of jet fire. Hence, the TC3 curve is generally under the curve of TC2.
3.5. Radiative Heat Flux
Radiative heat flux results from the temperature difference between two surfaces. Basically, the radiative heat flux is the same as the trend of the burning rate. More violent burning possesses a higher radiative heat flux. As a part of the total heat release rate, it can be used to characterize the behaviors of LIB fire, such as flame shape or flame temperature, which can be expressed as [27]:
where is the configuration factor from fire to the surface of the radiometer, is the Stefan–Boltzmann constant, is the soot absorption coefficient, Tf is the flame temperature, and Lm is the mean beam length of the flame.
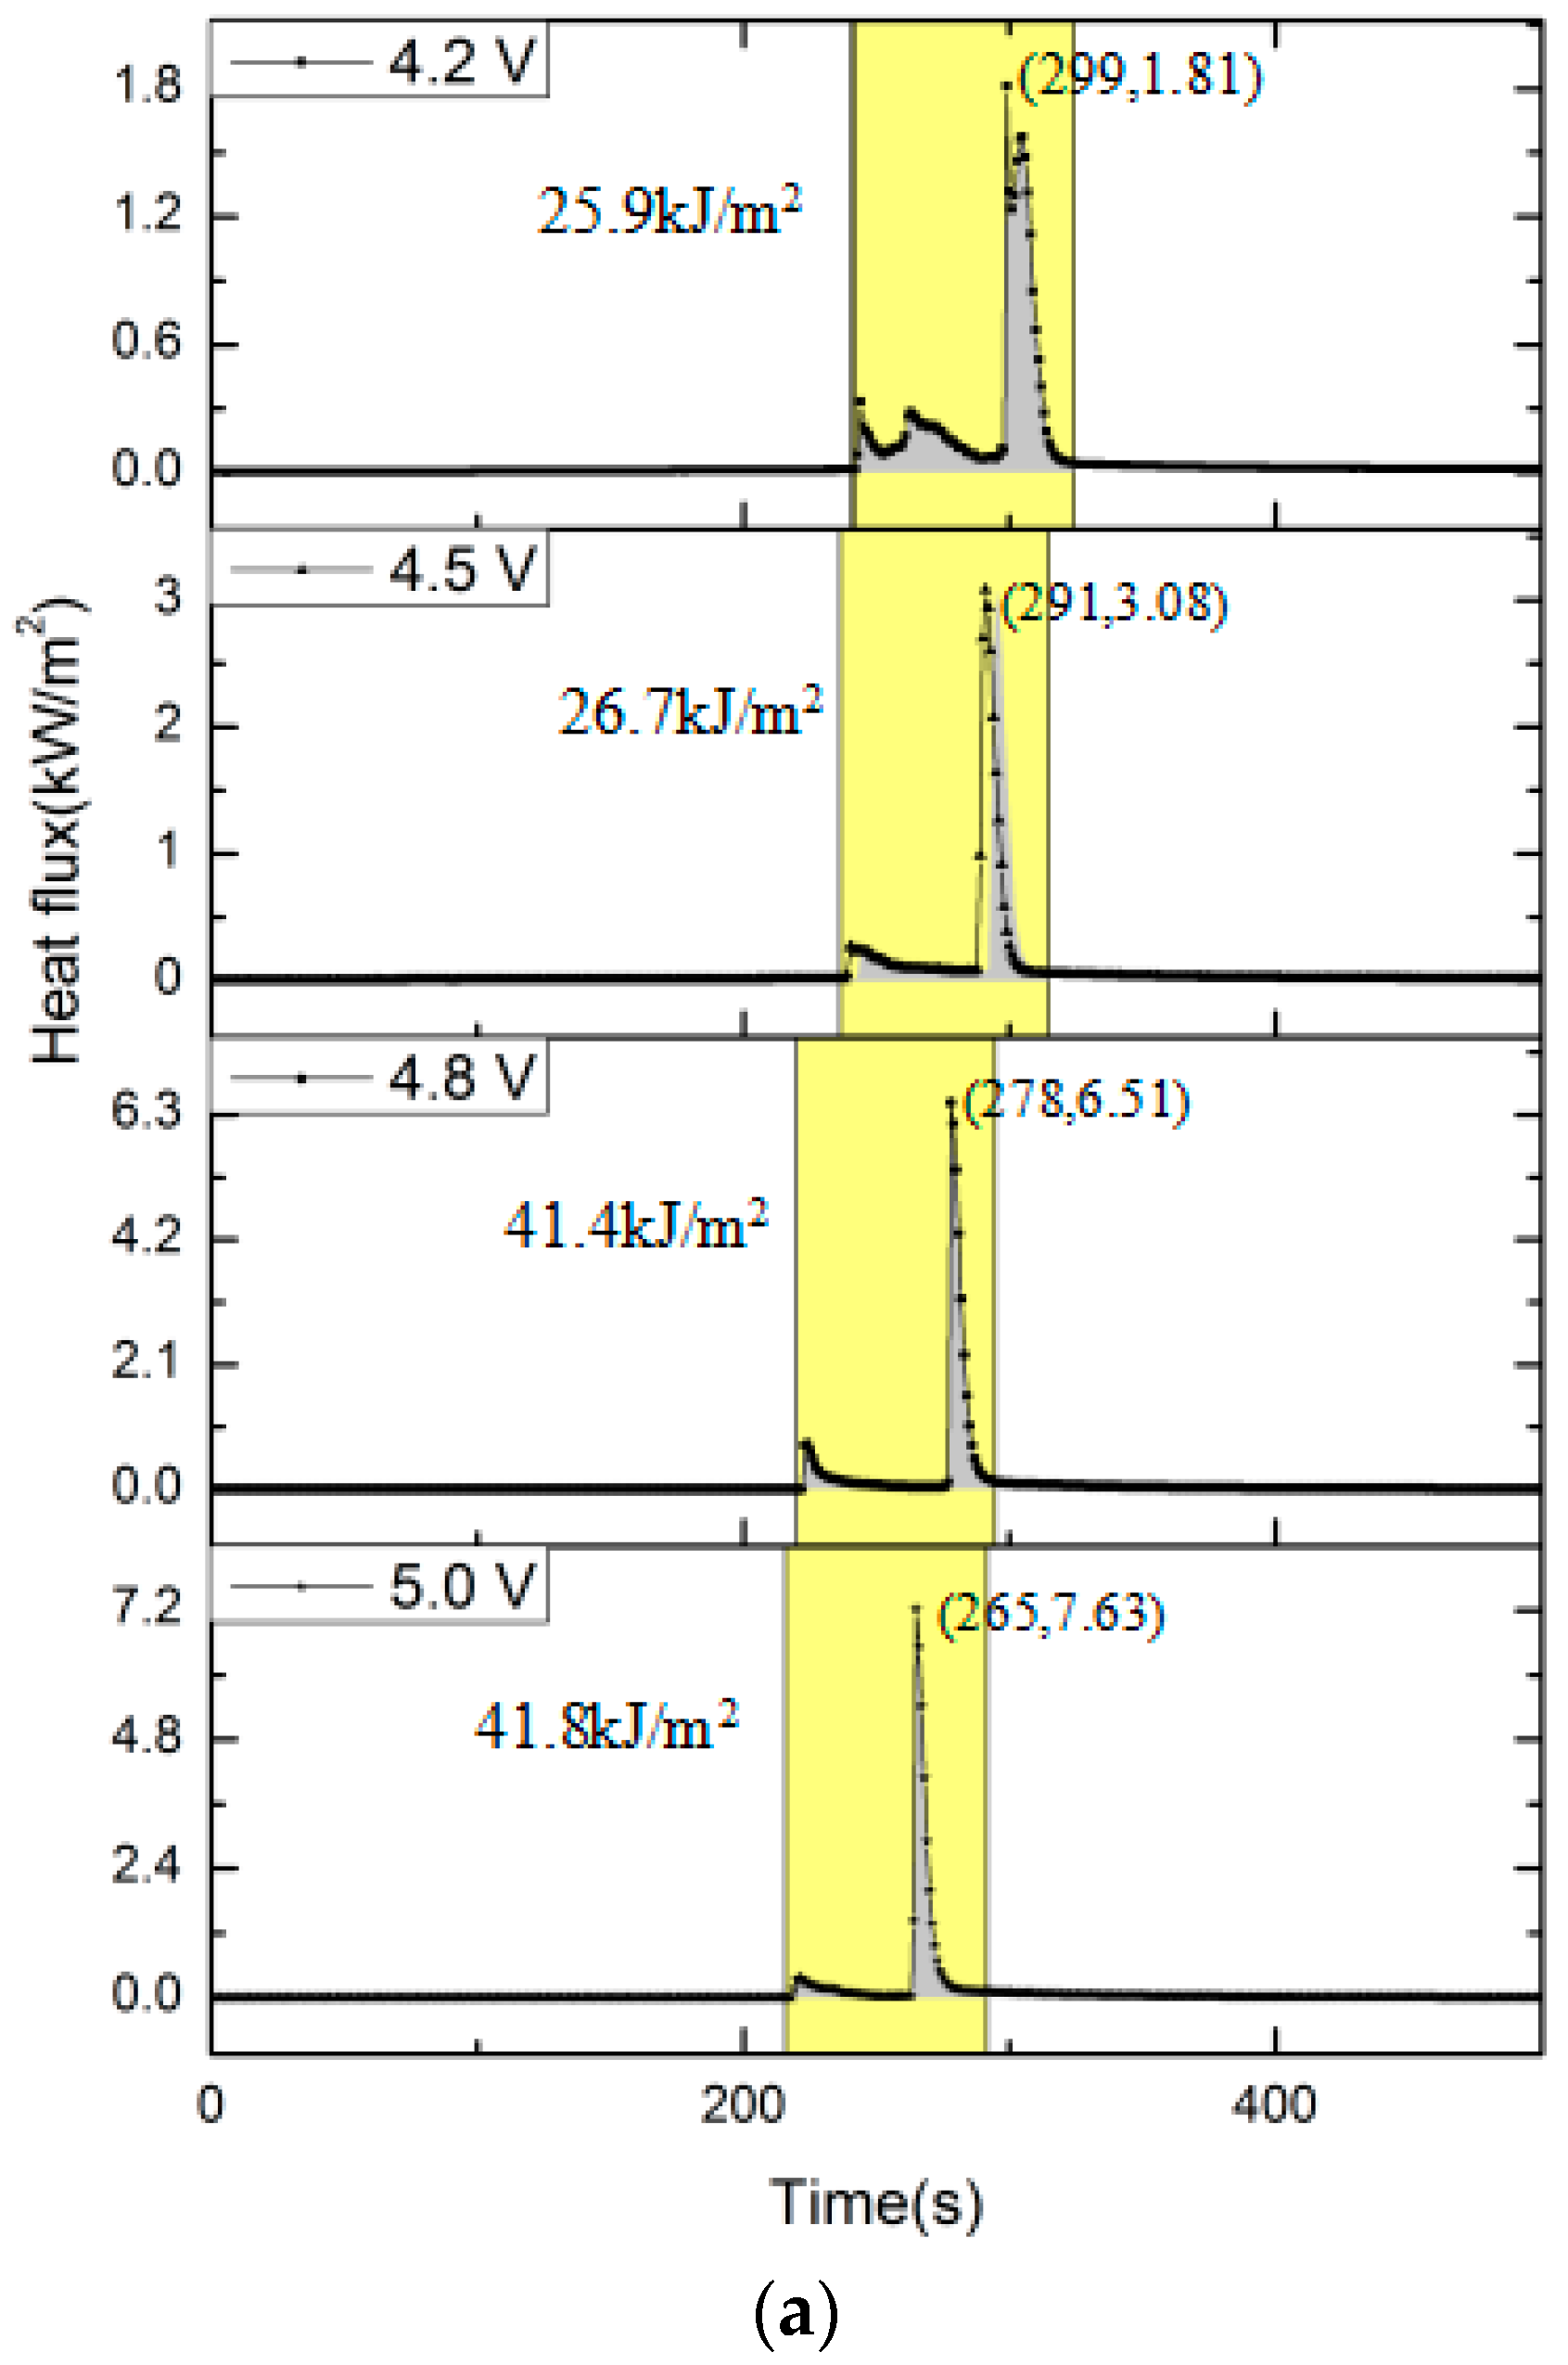
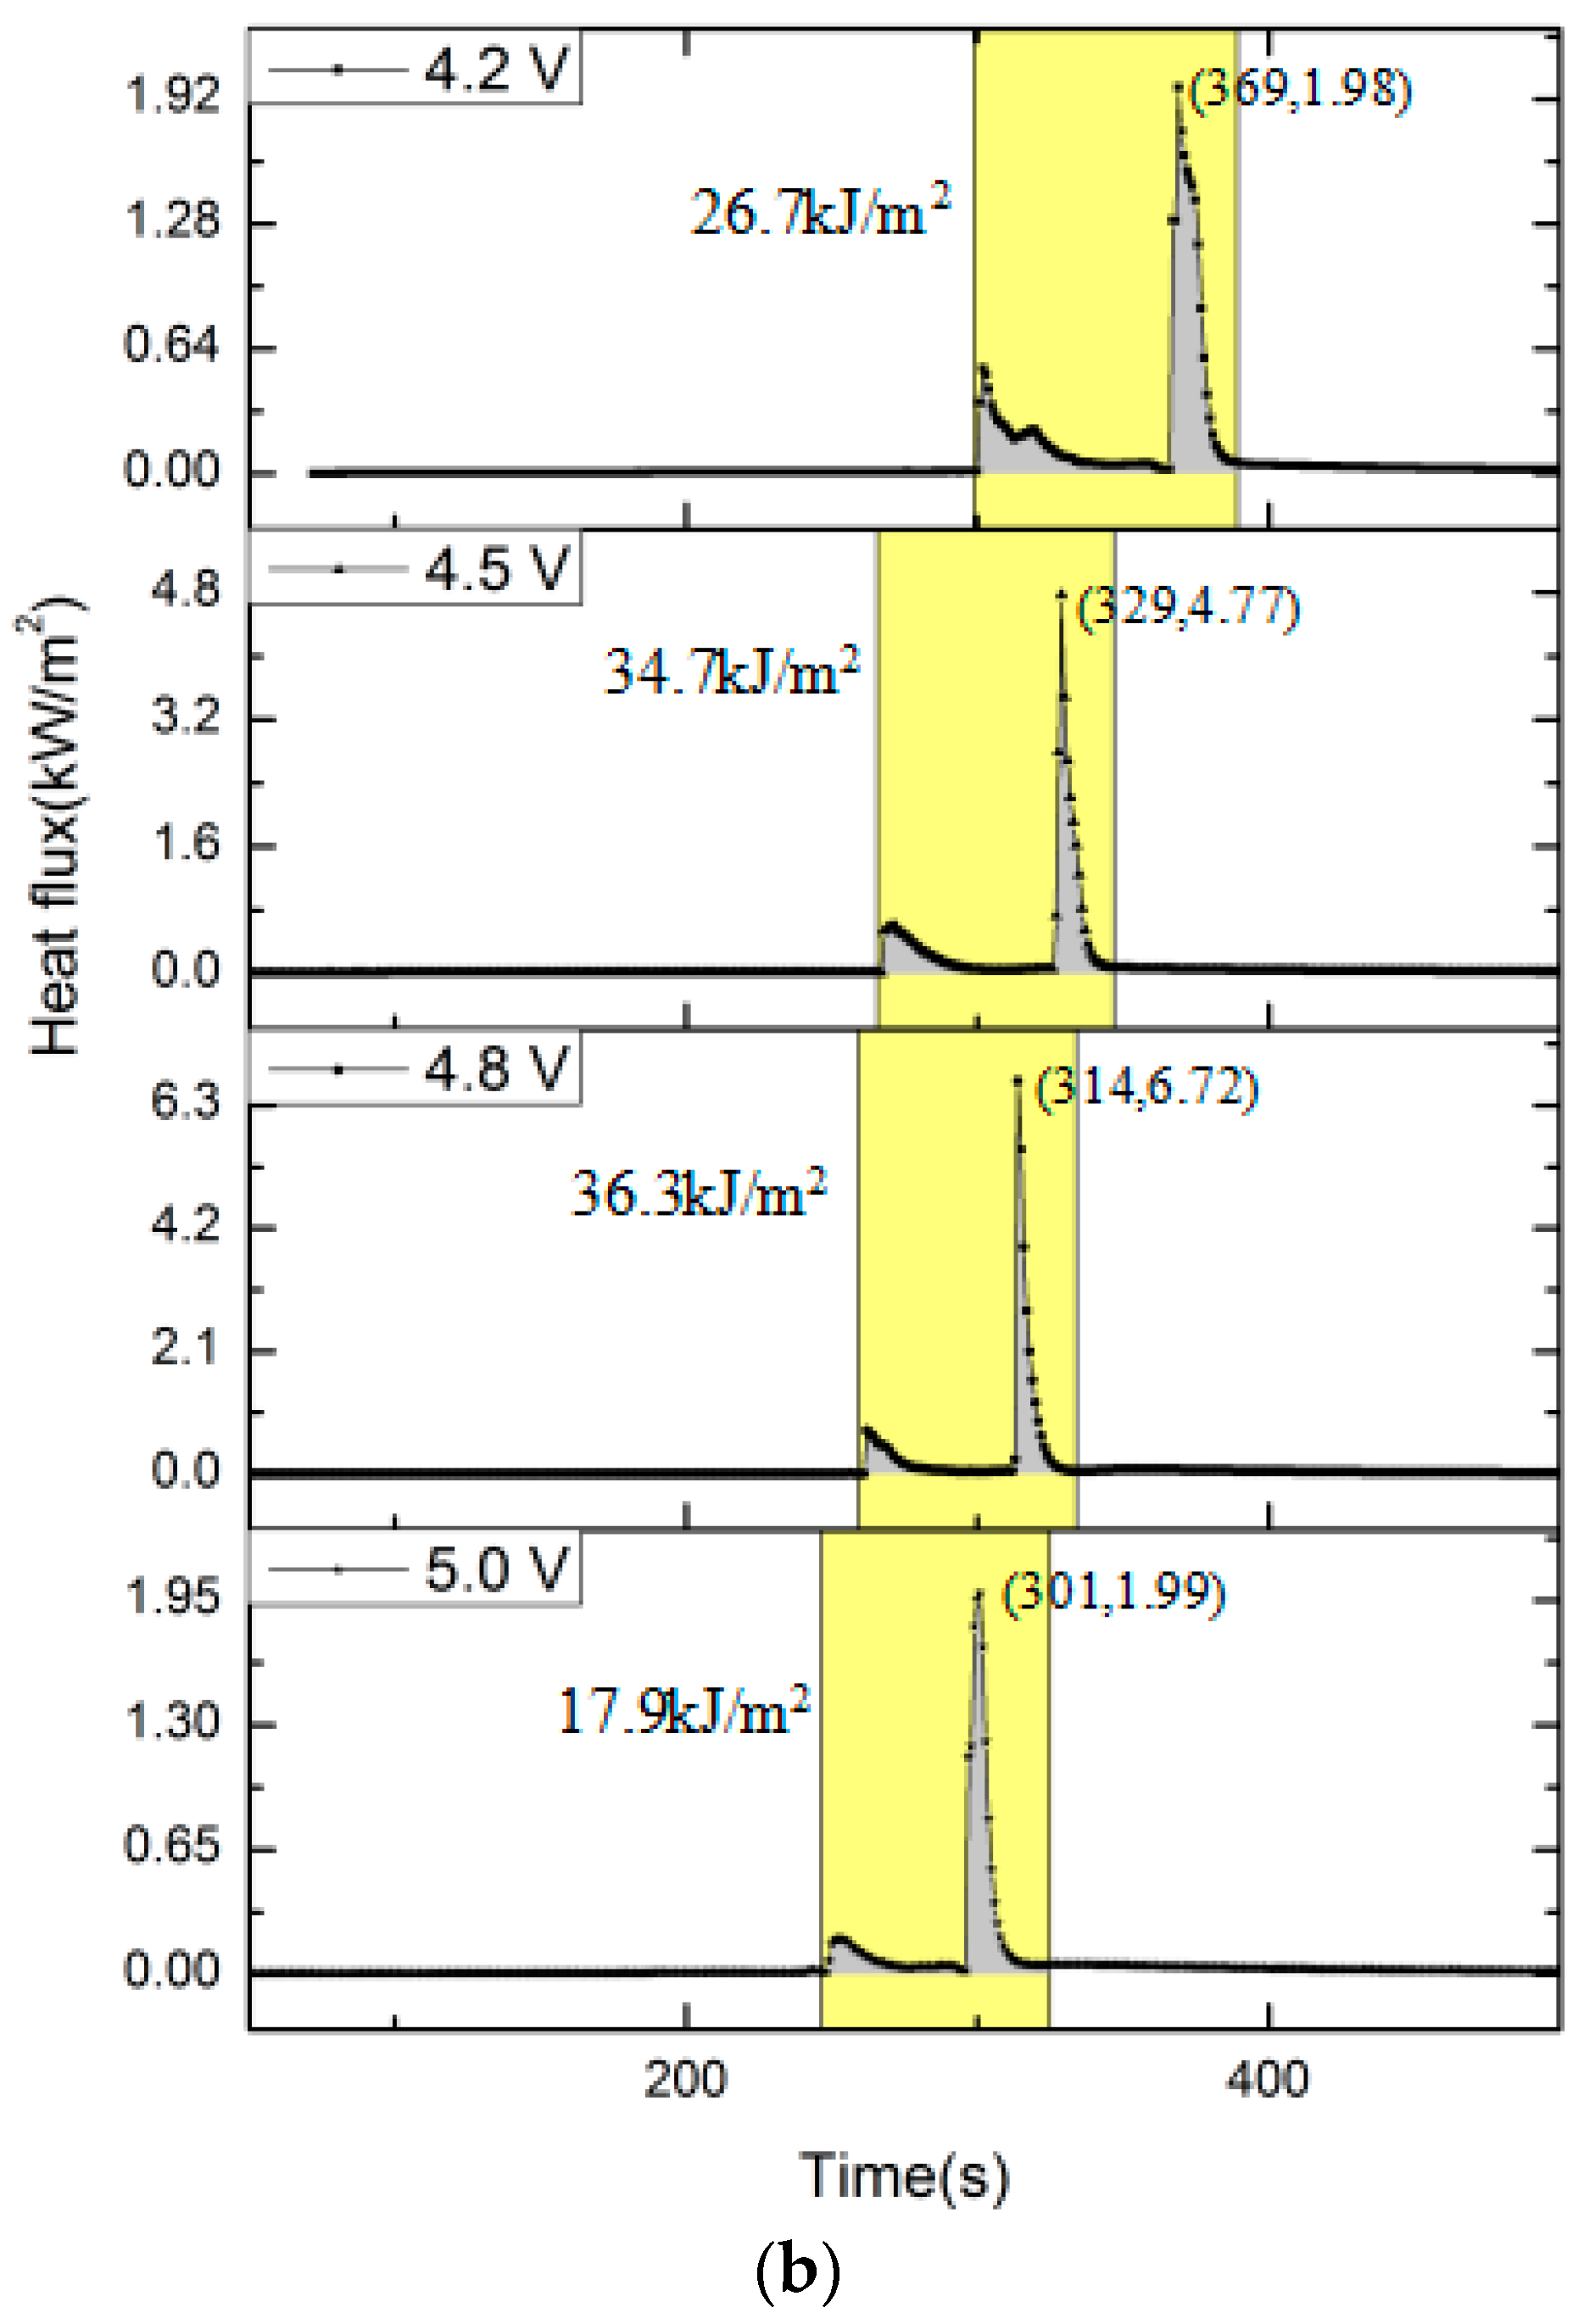
Figure 11 plots the variations of heat flux during tests. The total radiative heat can be obtained by integrating the heat flux and multiplying it by the radiative surface. Some detailed data on heat flux are listed in Table 3. For the NMC battery, it is shown that peak heat flux rose with the increase in voltage. Moreover, the total radiative heat flux and total radiative heat also presented a similar phenomenon. This indicates that the NMC with higher voltage will release more heat after catching fire. Moreover, it was found that the peak heat flux of NMC with higher voltage will appear earlier. On the other hand, LFP batteries exhibit similar circumstances in that the peak heat flux and total radiative heat grow with the increase in voltage except for the 5.0 V LFP. Both the peak heat flux and total radiative heat of 5.0 V LFP experience an obvious drop compared to the others. This is attributed to the violent ejection of a highly overcharged battery, resulting in incomplete combustion and less heat being released. This can be confirmed by the general observations on fire behavior in Section 3.2. In summary, overcharge treatment will increase the hazards of LIB, including the more violent ejection and combustion, the greater radiative heat released, and the earlier thermal runaway. It is important to avoid charging a battery beyond the cut-off voltage.
3.6. Discussion
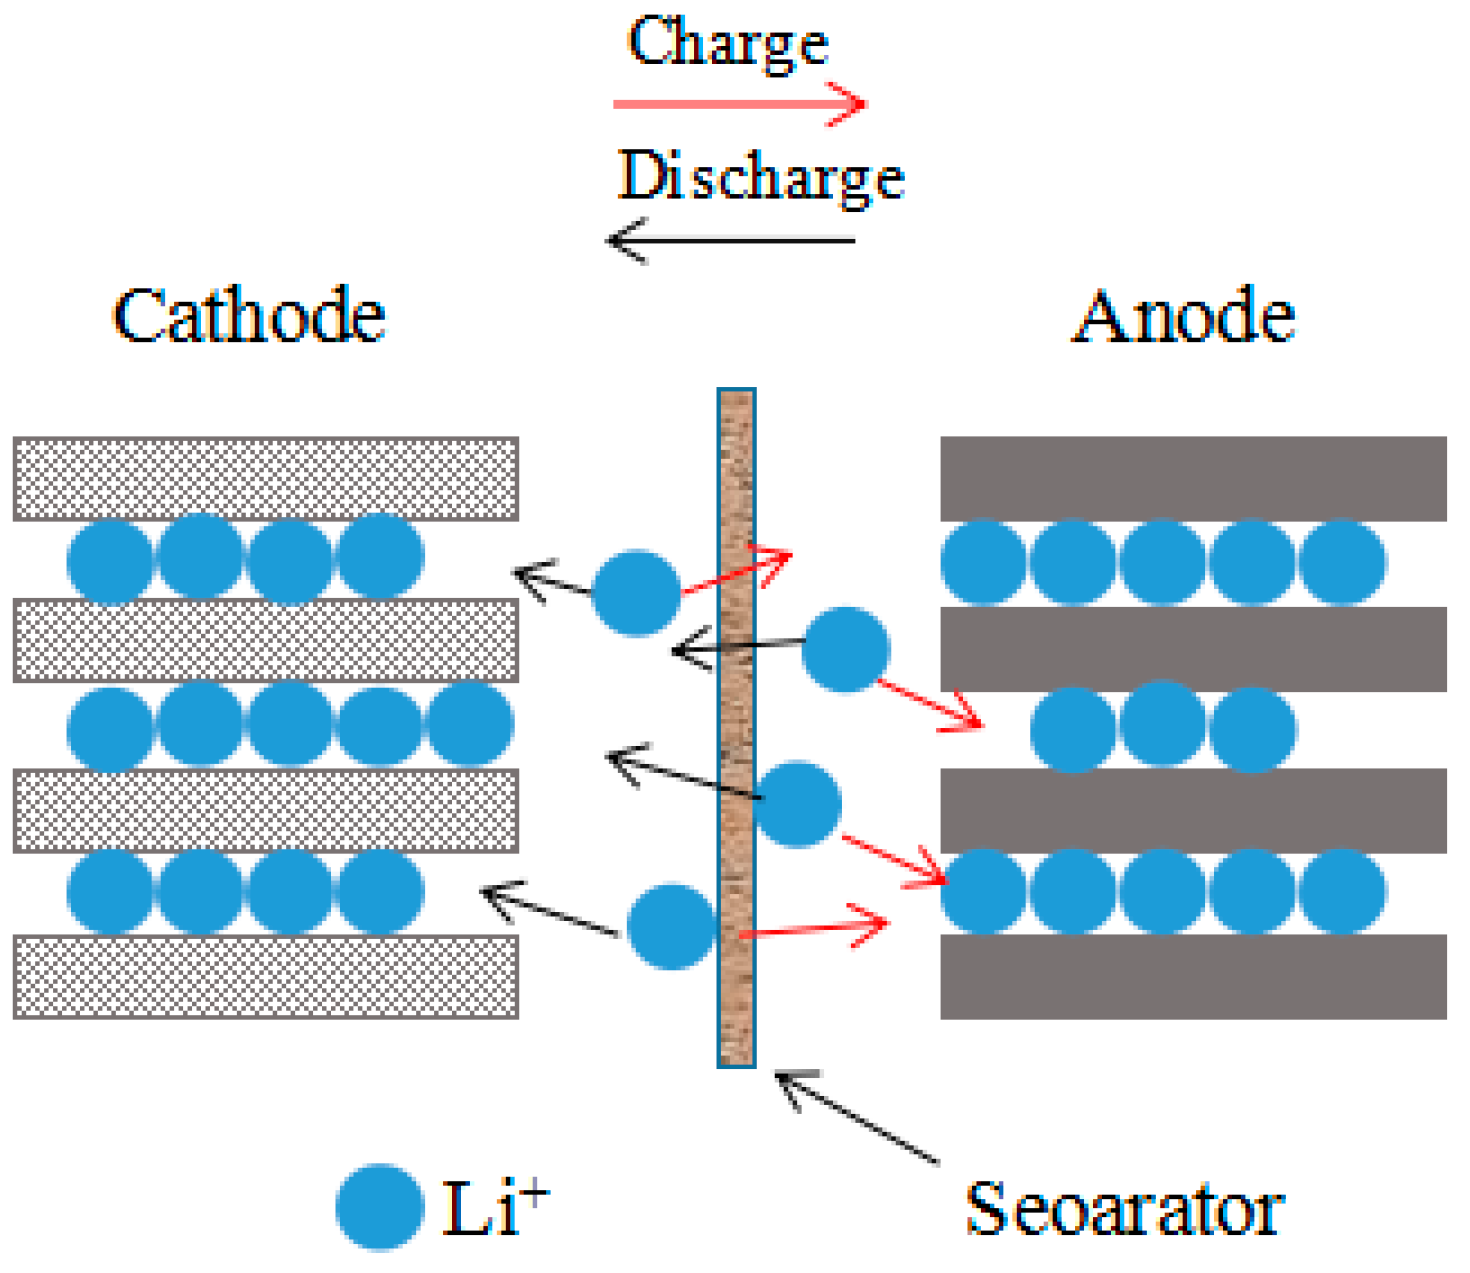
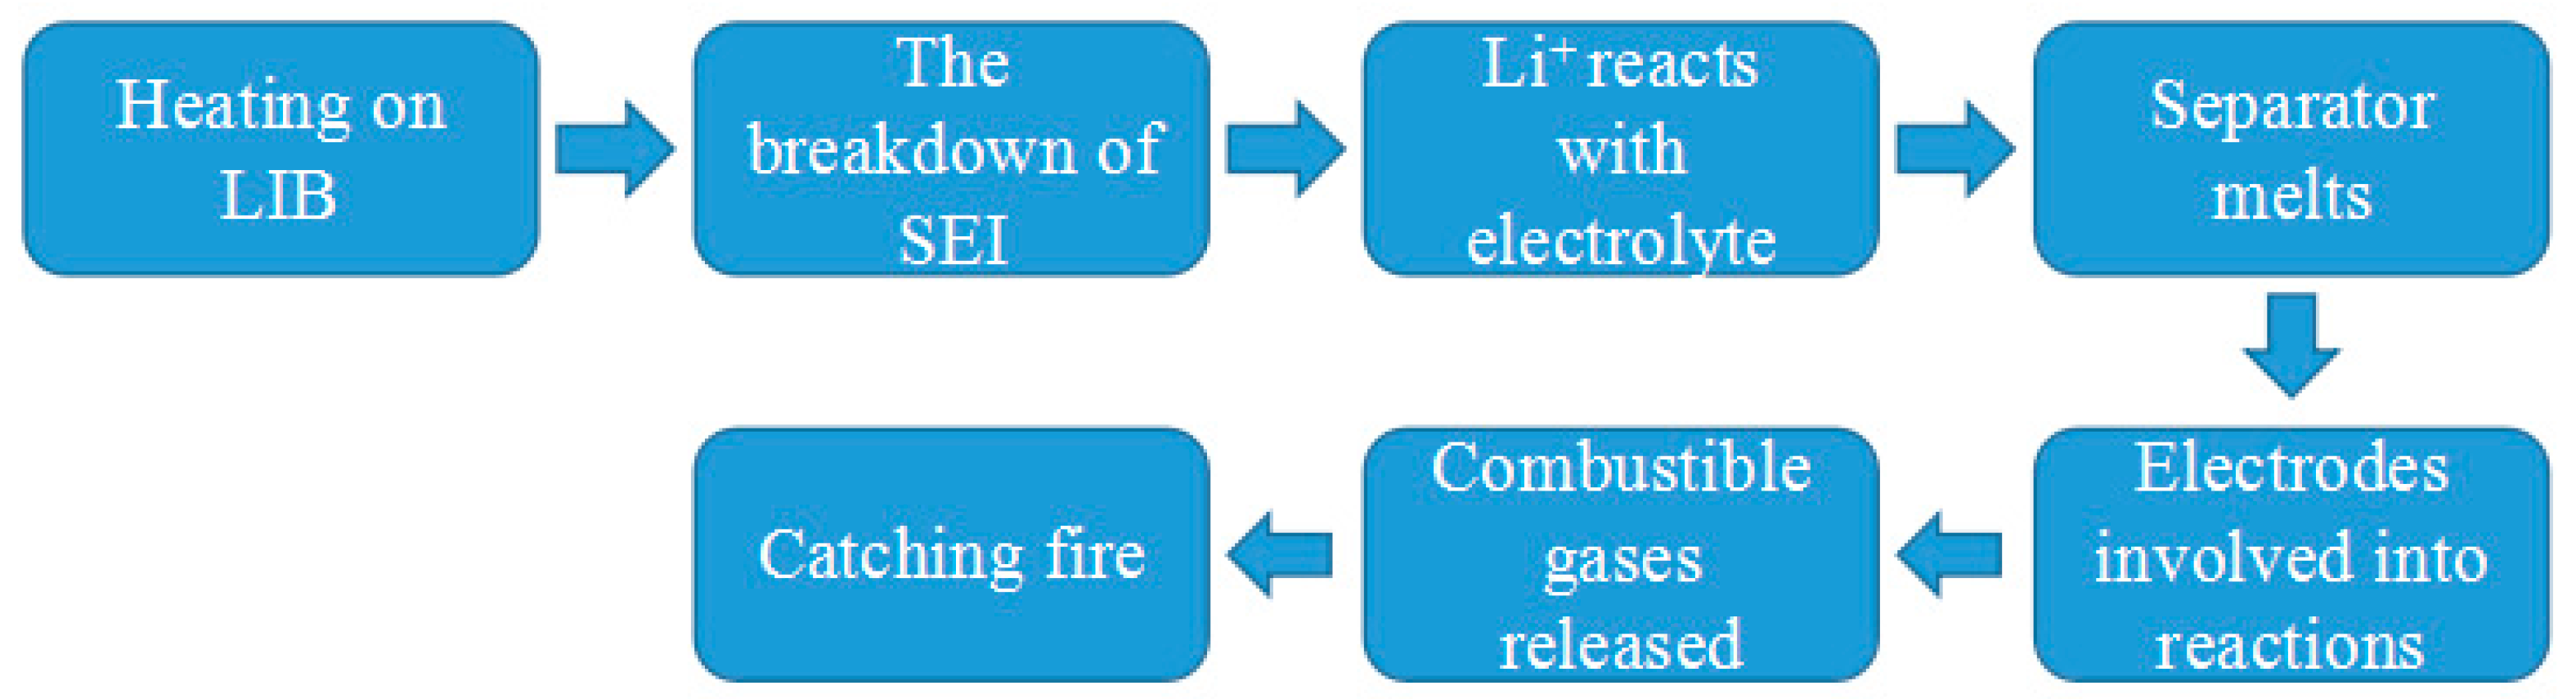
The experimental results reveal that a battery overcharged beyond the cut-off voltage will exhibit higher fire hazard, and the hazard increases with the rise in voltage. To explain why overcharge greatly affects the thermal behaviors of LIB, the charging mechanism of LIB needs to be clarified. When an LIB is in a state of equilibrium, there will be a lithium ion concentration difference between the cathode and anode that is related to the open circuit voltage of battery. The cut-off voltage is the open circuit voltage when battery is fully charged and it is generally taken to be 4.2 V for 18650 LIB. During charging, a voltage applied across the electrodes forces lithium ions to be extracted from the cathode crystal and transferred to the graphite anode through electrolyte. This results in a decline in the lithium ion concentration in the cathode and growth in the anode. The process is demonstrated vividly in Figure 12. Overcharge beyond the cut-off voltage implies the excessive extraction of lithium ions from the cathode, which causes the collapse of the cathode crystal. The collapsed cathode will lose the ability to absorb lithium ions. Hence, the LIB is damaged irreparably. On the other hand, overcharge will result in strong Li metal plating on the surface of the anode [7,28,29]. Li metals are sticky and will puncture the separator between the cathode and anode, resulting in the short circuiting of the battery. The overcharged LIB is in an unstable state. Finally, overcharge beyond the cut-off voltage will bring a high SOC to the battery. However, SOC has a great influence on the thermal stability of electroactive materials, where highly delithiated electroactive materials become more reactive [30,31]. This induces more intense reactions in the processing of thermal runaway, including SEI decomposition, the polymer separator shrinking, reaction between electrode materials, reaction between the electrode material and electrolyte, etc. [32,33]. The whole scheme of a battery catching fire is shown in Figure 13.
4. Conclusions
In order to have a better understanding of the fire hazards of overcharged LIB, two widely used commercial LIBs, NMC and LFP, with different cut-off voltage (4.2 V, 4.5 V, 4.8 V and 5.0 V), were tested in this work. The detailed analysis of the burning phenomena, the surface temperature, the flame temperature, voltage, and radiative heat flux offered here represents a comprehensive understanding of the fire hazards posed by burning LIB. The main conclusions are as follows:
- (1)
- The initial discharging voltage increases with the growth of charge cut-off voltage. A battery with higher cut-off voltage possesses a higher initial discharging voltage. Moreover, the higher the cut-off voltage, the longer the discharging time to reach 2.5 V.
- (2)
- LIB has a significant temperature rise during charging and discharging under the effect of irreversible heat (Qirr) and reversible heat (Qrev). Compared with the NMC battery, the LFP battery exhibits a more obvious temperature rise during the process.
- (3)
- Compared to the normal LIB, the overcharged LIB experiences earlier safety vent cracks, ignition, and thermal runaway. This reveals that the overcharged LIB possesses a more serious combustion process and a lower stability than the normal LIB. Moreover, the severity will deteriorate with the increase of cut-off voltage. The higher the voltage, the more reactive the electroactive materials of the battery will become. In addition, it is revealed that the NMC fails earlier than the LFP under the same conditions.
- (4)
- After thermal runaway, the temperature rise rate of LIB grows with the increase in the cut-off voltage. A battery with higher cut-off voltage will experience a more violent combustion if ignited. Moreover, it is interesting to note that the safety vent cracks temperature, the ignition temperature, and the thermal runaway temperature exhibit similar values for the same conditions, which demonstrates that LIB will fail at a certain temperature. The cut-off voltage has little influence on these parameters, which mainly depend on the incident heat.
- (5)
- For the NMC battery, the peak heat flux rises with the increase in voltage. The total radiative heat flux and total radiative heat also present the similar phenomenon. This indicates that the NMC with higher voltage will release more heat after catching fire. As for the LFP battery, it exhibits similar circumstances except for the 5.0 V LFP, whose peak heat flux and total radiative heat show an obvious drop compared to the others. This is attributed to the violent ejection of a highly overcharged battery, resulting in incomplete combustion and less heat being released.
Finally, it is expected that these results could be a reference for use in assessing LIB safety problems, especially when they are in a state of overcharge. Much more work is needed to have a detailed understanding of the fire hazards of LIB.
Acknowledgments
This work was supported by the National Nature Science Foundation of China (No. 51376172).
Author Contributions
Dongxu Ouyang, Jiahao Liu, Mingyi Chen, and Jian Wang wrote this work together.
Conflicts of Interest
The authors declare no conflicts of interest.
References
- Hannan, M.A.; Azidin, F.A.; Mohamed, A. Hybrid electric vehicles and their challenges: A review. Renew. Sustain. Energy Rev. 2014, 29, 135–150. [Google Scholar] [CrossRef]
- Budzianowski, W.M. Negative carbon intensity of renewable energy technologies involving biomass or carbon dioxide as inputs. Renew. Sustain. Energy Rev. 2012, 16, 6507–6521. [Google Scholar] [CrossRef]
- Sulaiman, N.; Hannan, M.A.; Mohamed, A.; Majlan, E.H.; Wan Daud, W.R. A review on energy management system for fuel cell hybrid electric vehicle: Issues and challenges. Renew. Sustain. Energy Rev. 2015, 52, 802–814. [Google Scholar] [CrossRef]
- Bandhauer, T.M.; Garimella, S.; Fuller, T.F. A critical review of thermal issues in lithium-ion batteries. J. Electrochem. Soc. 2011, 158, R1–R25. [Google Scholar] [CrossRef]
- Noh, H.J.; Youn, S.; Yoon, C.S.; Sun, Y.-K. Comparison of the structural and electrochemical properties of layered Li [Ni x Co y Mn z] O2 (x = 1/3, 0.5, 0.6, 0.7, 0.8 and 0.85) cathode material for lithium-ion batteries. J. Power Sources 2013, 233, 121–130. [Google Scholar] [CrossRef]
- Mendoza-Hernandez, O.S.; Ishikawa, H.; Nishikawa, Y.; Maruyama, Y.; Umedaa, M. Cathode material comparison of thermal runaway behavior of Li-ion cells at different state of charges including over charge. J. Power Sources 2015, 280, 499–504. [Google Scholar] [CrossRef]
- Yuan, Q.F.; Zhao, F.; Wang, W.; Zhao, Y.; Liang, Z.; Yan, D. Overcharge failure investigation of lithium-ion batteries. Electrochim. Acta 2015, 178, 682–688. [Google Scholar] [CrossRef]
- Golubkov, A.W.; Scheikl, S.; Planteu, R.; Voitic, G.; Wiltsche, H.; Stangl, C.; Fauler, G.; Thaler, A.; Hacker, V. Thermal runaway of commercial 18650 Li-ion batteries with LFP and NCA cathodes–impact of state of charge and overcharge. RSC Adv. 2015, 5, 57171–57186. [Google Scholar] [CrossRef]
- Qian, K.; Li, Y.; He, Y.-B.; Liu, D.; Zheng, Y.; Luo, D.; Li, B.; Kang, F. Abuse tolerance behavior of layered oxide-based Li-ion battery during overcharge and over-discharge. RSC Adv. 2016, 6, 76897–76904. [Google Scholar] [CrossRef]
- Belov, D.; Yang, M.H. Investigation of the kinetic mechanism in overcharge process for Li-ion battery. Solid State Ion. 2008, 179, 1816–1821. [Google Scholar] [CrossRef]
- Sharma, N.; Peterson, V.K. Overcharging a lithium-ion battery: Effect on the Li x C 6 negative electrode determined by in situ neutron diffraction. J. Power Sources 2013, 244, 695–701. [Google Scholar] [CrossRef]
- Zhang, L.; Ma, Y.; Cheng, X.; Du, C.; Guan, T.; Cui, Y.; Sun, S.; Zuo, P.; Gao, Y.; Yin, G. Capacity fading mechanism during long-term cycling of over-discharged LiCoO2/mesocarbon microbeads battery. J. Power Sources 2015, 293, 1006–1015. [Google Scholar] [CrossRef]
- Zhang, L.; Ma, Y.; Cheng, X.; Cui, Y.; Guan, T.; Gao, Y.; Du, C.; Yin, G.; Lin, F.; Nordlund, D. Degradation mechanism of over-charged LiCoO2/mesocarbon microbeads battery during shallow depth of discharge cycling. J. Power Sources 2016, 329, 255–261. [Google Scholar] [CrossRef]
- Hannan, M.A.; Lipu, M.S.H.; Hussain, A.; Mohamed, A. A review of lithium-ion battery state of charge estimation and management system in electric vehicle applications: Challenges and recommendations. Renew. Sustain. Energy Rev. 2017, 78, 834–854. [Google Scholar] [CrossRef]
- Sato, N. Thermal behavior analysis of lithium-ion batteries for electric and hybrid vehicles. J. Power Sources 2001, 99, 70–77. [Google Scholar] [CrossRef]
- Chen, M.; Zhou, D.; Chen, X.; Zhang, W.; Liu, J.; Yuen, R.; Wang, J. Investigation on the thermal hazards of 18650 lithium ion batteries by fire calorimeter. J. Therm. Anal. Calorim. 2015, 122, 755–763. [Google Scholar] [CrossRef]
- Chen, M.; Liu, J.; He, Y.; Yuen, R.; Wang, J. Study of the fire hazards of lithium-ion batteries at different pressures. Appl. Therm. Eng. 2017, 125, 1061–1074. [Google Scholar] [CrossRef]
- Fu, Y.; Lu, S.; Li, K.; Liu, C.; Cheng, X.; Zhang, H. An experimental study on burning behaviors of 18650 lithium ion batteries using a cone calorimeter. J. Power Sources 2015, 273, 216–222. [Google Scholar] [CrossRef]
- Liu, X.; Wu, Z.; Stoliarov, S.I.; Denlinger, M.; Masias, A.; Snyder, K. Heat release during thermally-induced failure of a lithium ion battery: Impact of cathode composition. Fire Saf. J. 2016, 85, 10–22. [Google Scholar] [CrossRef]
- Wang, Y.; Yang, L.; Zhou, X.; Dai, J.K.; Zhou, Y.; Deng, Z. Experiment study of the altitude effects on spontaneous ignition characteristics of wood. Fuel 2010, 89, 1029–1034. [Google Scholar]
- Zhang, Y.; Ji, J.; Li, J.; Sun, J.; Wang, Q.; Huang, X. Effects of altitude and sample width on the characteristics of horizontal flame spread over wood sheets. Fire Saf. J. 2012, 51, 120–125. [Google Scholar] [CrossRef]
- Roth, E.P.; Doughty, D.H.; Franklin, J. DSC investigation of exothermic reactions occurring at elevated temperatures in lithium-ion anodes containing PVDF-based binders. J. Power Sources 2004, 134, 222–234. [Google Scholar] [CrossRef]
- Wang, Q.; Ping, P.; Zhao, X.; Chu, G.; Sun, J.; Chen, C. Thermal runaway caused fire and explosion of lithium ion battery. J. Power Sources 2012, 208, 210–224. [Google Scholar] [CrossRef]
- Wang, Q.; Sun, J. Enhancing the safety of lithium ion batteries by 4-isopropyl phenyl diphenyl phosphate. Mater. Lett. 2007, 61, 3338–3340. [Google Scholar] [CrossRef]
- Venugopal, G. Characterization of thermal cut-off mechanisms in prismatic lithium-ion batteries. J. Power Sources 2001, 101, 231–237. [Google Scholar] [CrossRef]
- Bilbao, R.; Mastral, J.F.; Lana, J.A.; Ceamanos, J.; Aldea, M.E.; Betrán, M. A model for the prediction of the thermal degradation and ignition of wood under constant and variable heat flux. J. Anal. Appl. Pyrolysis 2002, 62, 63–82. [Google Scholar] [CrossRef]
- Liu, J.; He, Y.; Zhou, Z.; Yuen, R.; Wang, J. Investigation of enclosure effect of pressure chamber on the burning behavior of a hydrocarbon fuel. Appl. Therm. Eng. 2016, 101, 202–216. [Google Scholar]
- Lamb, J.; Orendorff, C.J.; Amine, K.; Krumdick, G.; Zhang, Z.; Zhang, L.; Gozdz, A.S. Thermal and overcharge abuse analysis of a redox shuttle for overcharge protection of LiFePO4. J. Power Sources 2014, 247, 1011–1017. [Google Scholar] [CrossRef]
- Erol, S.; Orazem, M.E.; Muller, R.P. Influence of overcharge and over-discharge on the impedance response of LiCoO2|C batteries. J. Power Sources 2014, 270, 92–100. [Google Scholar] [CrossRef]
- Furushima, Y.; Yanagisawa, C.; Nakagawa, T.; Aoki, Y.; Muraki, N. Thermal stability and kinetics of delithiated LiCoO2. J. Power Sources 2011, 196, 2260–2263. [Google Scholar] [CrossRef]
- Roth, E.P.; Doughty, D.H. Thermal abuse performance of high-power 18650 Li-ion cells. J. Power Sources 2004, 128, 308–318. [Google Scholar] [CrossRef]
- Kim, G.H.; Pesaran, A.; Spotnitz, R. A three-dimensional thermal abuse model for lithium-ion cells. J. Power Sources 2007, 170, 476–489. [Google Scholar] [CrossRef]
- Spotnitz, R.; Franklin, J. Abuse behavior of high-power, lithium-ion cells. J. Power Sources 2003, 113, 81–100. [Google Scholar] [CrossRef]
Figure 1.
The physical diagrams of batteries.

Figure 2.
(a) Schematic of experimental setup; (b) the thermocouples setup around the battery (TC1 was used to detect the battery surface temperature; TC2, 3, 4, 5 were used to detect the flame temperature).
Figure 2.
(a) Schematic of experimental setup; (b) the thermocouples setup around the battery (TC1 was used to detect the battery surface temperature; TC2, 3, 4, 5 were used to detect the flame temperature).


Figure 3.
Discharging curves of LIBs subjected to different cut-off voltage at 2 C rate.

Figure 4.
The surface temperature curves of LIBs during charging and discharging at 2 °C rate.

Figure 5.
Burning process of LIBs in tests: (a) 4.2 V NMC; (b) 5.0 V NMC; (c) 4.2 V LFP; (d) 5.0 V LFP.
Figure 5.
Burning process of LIBs in tests: (a) 4.2 V NMC; (b) 5.0 V NMC; (c) 4.2 V LFP; (d) 5.0 V LFP.


Figure 6.
Photographs of batteries before and after burning.

Figure 7.
The typical curves of LIB surface temperature during tests: (a) NMC; (b) LFP.

Figure 8.
The typical curves of LIB temperature rise rate vs. surface temperature during tests: (a) NMC; (b) LFP.
Figure 8.
The typical curves of LIB temperature rise rate vs. surface temperature during tests: (a) NMC; (b) LFP.

Figure 9.
Some critical temperatures of LIB in tests.

Figure 10.
The typical curves of LIB flame temperature during tests: (a) NMC (4.2 V); (b) NMC (4.5 V); (c) NMC (4.8 V); (d) NMC (5.0 V); (e) LFP (4.2 V); (f) LFP (4.5 V); (g) LFP (4.8 V); (h) LFP (5.0 V).
Figure 10.
The typical curves of LIB flame temperature during tests: (a) NMC (4.2 V); (b) NMC (4.5 V); (c) NMC (4.8 V); (d) NMC (5.0 V); (e) LFP (4.2 V); (f) LFP (4.5 V); (g) LFP (4.8 V); (h) LFP (5.0 V).


Figure 11.
Heat flux curves of LIBs during tests: (a) NMC; (b) LFP.


Figure 12.
The schematic of yjr electrochemical model.

Figure 13.
The schematic of s battery catching fire.


Table 1.
The experimental configurations.
| LIB Type | Test No. | Voltage/V | Capacity/mAh | SOC/% |
|---|---|---|---|---|
| NMC | 1 | 4.2 | 956.9 | 73.6 |
| 2 | 4.5 | 1334.6 | 102.7 | |
| 3 | 4.8 | 1507.2 | 115.9 | |
| 4 | 5.0 | 1538.0 | 118.3 | |
| LFP | 1 | 4.2 | 906.2 | 69.7 |
| 2 | 4.5 | 1302.0 | 100.2 | |
| 3 | 4.8 | 1416.5 | 109.0 | |
| 4 | 5.0 | 1501.3 | 115.5 |
Table 2.
Specifications of the battery surface temperature.
| LIB Type | Voltage/V | Time to Cracks/s | Temperature to Cracks/°C | Time to Ignition/s | Temperature to Ignition/°C | Time to Thermal Runaway/s | Temperature to Thermal Runaway/°C | The Maximum Temperature/°C |
|---|---|---|---|---|---|---|---|---|
| NMC | 4.2 | 197 | 127 | 239 | 158 | 317 | 232 | 553 |
| 4.5 | 196 | 129 | 230 | 162 | 280 | 226 | 606 | |
| 4.8 | 191 | 133 | 222 | 160 | 273 | 228 | 630 | |
| 5.0 | 190 | 132 | 219 | 163 | 262 | 230 | 673 | |
| LEP | 4.2 | 201 | 115 | 300 | 182 | 358 | 229 | 571 |
| 4.5 | 202 | 115 | 266 | 175 | 310 | 218 | 585 | |
| 4.8 | 185 | 121 | 259 | 178 | 290 | 224 | 630 | |
| 5.0 | 181 | 127 | 251 | 181 | 280 | 227 | 647 |
Table 3.
Some detailed data on heat flux in tests.
| LIB Type | Voltage/V | Peak Heat Flux (kW/m2) | Total Radiative Heat Flux (kJ/m2) | Total Radiative Heat (kJ) |
|---|---|---|---|---|
| NMC | 4.2 | 1.81 | 25.9 | 27.5 |
| 4.5 | 3.08 | 26.7 | 28.3 | |
| 4.8 | 6.51 | 41.4 | 43.9 | |
| 5.0 | 7.63 | 41.8 | 44.3 | |
| LFP | 4.2 | 1.98 | 26.7 | 28.3 |
| 4.5 | 4.77 | 34.7 | 36.8 | |
| 4.8 | 6.72 | 36.3 | 38.5 | |
| 5.0 | 1.99 | 17.9 | 19.0 |
© 2017 by the authors. Licensee MDPI, Basel, Switzerland. This article is an open access article distributed under the terms and conditions of the Creative Commons Attribution (CC BY) license (http://creativecommons.org/licenses/by/4.0/).
Share and Cite
MDPI and ACS Style
Ouyang, D.; Liu, J.; Chen, M.; Wang, J. Investigation into the Fire Hazards of Lithium-Ion Batteries under Overcharging. Appl. Sci. 2017, 7, 1314. https://0-doi-org.brum.beds.ac.uk/10.3390/app7121314
AMA Style
Ouyang D, Liu J, Chen M, Wang J. Investigation into the Fire Hazards of Lithium-Ion Batteries under Overcharging. Applied Sciences. 2017; 7(12):1314. https://0-doi-org.brum.beds.ac.uk/10.3390/app7121314
Chicago/Turabian StyleOuyang, Dongxu, Jiahao Liu, Mingyi Chen, and Jian Wang. 2017. "Investigation into the Fire Hazards of Lithium-Ion Batteries under Overcharging" Applied Sciences 7, no. 12: 1314. https://0-doi-org.brum.beds.ac.uk/10.3390/app7121314
Note that from the first issue of 2016, this journal uses article numbers instead of page numbers. See further details here.