Article

Comparative Interactions of Dihydroquinazolin Derivatives with Human Serum Albumin Observed via Multiple Spectroscopy

1
Department of Science of Pesticides, School of Resources and Environment, Anhui Agricultural University, No. 130 Changjiang West Road, Hefei 230036, China
2
Department of Applied Chemistry, China Agricultural University, No. 2 Yuanmingyuan West Road, Beijing 100193, China
3
Collaborative Innovation Center of Henan Grain Crops, National Key Laboratory of Wheat and Maize Crop Science, College of Plant Protection, Henan Agricultural University, Wenhua Road No. 95, Zhengzhou 450002, China
4
Department of Molecular Biosciences and Bioengineering, University of Hawaii at Manoa, Honolulu, HI 96822, USA
*
Authors to whom correspondence should be addressed.
Submission received: 19 December 2016 / Accepted: 14 February 2017 / Published: 17 February 2017
(This article belongs to the Section Chemical and Molecular Sciences)

Abstract

:
The interactions of dihydroquinazolines with human serum albumin (HSA) were studied in pH 7.4 aqueous solution via fluorescence, circular dichroism (CD) and Fourier transform infrared (FTIR) spectroscopic techniques. In this work, 6-chloro-1-(3,3-dimethyl-butanoyl)-2-(un)substitutedphenyl-2,3-dihydroquinazolin-4(1H)-one (PDQL) derivatives were designed and synthesized to study the impact of five similar substituents (methyl, methoxy, cyano, trifluoromethyl and isopropyl) on the interactions between PDQL and HSA using a comparative methodology. The results revealed that PDQL quenched the intrinsic fluorescence of HSA through a static quenching process. Displacement experiments with site-specific markers revealed that PDQL binds to HSA at site II (subdomain IIIA) and that there may be only one binding site for PDQL on HSA. The thermodynamic parameters indicated that hydrophobic interactions mainly drove the interactions between PDQL and HSA. The substitution using five similar groups in the benzene ring could increase the interactions between PDQL and HSA to some extent through the van der Waals force or hydrogen bond effects in the proper temperature range. Isopropyl substitution could particularly enhance the binding affinity, as observed via comparative studies.

Graphical Abstract

1. Introduction

Heterocyclic skeletons form the main part of many pharmaceutical, agrochemical and veterinary products, and quinazolines play a key role in the most important classes of heterocyclic compounds. These compounds are of considerable interest because of a variety of their biological activities, e.g., anticancer [1], antitubercular [2], antibacterial [3], antifungal [4], anti-HIV [5], analgesic [6] and anti-inflammatory activities [7,8,9]. Much attention has been focused on the quinazoline structures for the discovery of new biologically active molecules.
Human serum albumin (HSA), which is the main protein in human blood plasma, plays a pivotal role in the pharmacodynamic and pharmacokinetic properties because it can not only serve as a carrier for drugs, but also can participate in drug absorption, distribution and metabolism [10,11,12,13,14,15]. Interaction studies of HSA with biological molecules can elucidate the properties of the drug-protein complex because they may provide useful information about the structural features that determine the therapeutic effectiveness of drugs. Therefore, various studies on the interactions between HSA and small bioactive molecules have been reported over the years [16,17,18,19,20]. Generally, strong binding to HSA will decrease the concentrations of a free drug in plasma, whereas weak binding will reduce the duration of drug action. For having a suitable duration of drug actions, the introduction of a substituent is a common strategy to achieve binding affinity modification, particularly modification of the parent aromatic structures. At present, little information is available on the interactions between quinazolines and HSA [21,22,23]. In addition, substituents, such as methyl, methoxy, cyano, trifluoromethyl and isopropyl groups, are often introduced during the development of pharmaceutical products and agrochemicals to improve their bioactivity and metabolism. However, no information is available on the influence of these five similar substituents on the binding of quinazoline derivatives to HSA, so it is difficult during molecular design to estimate the impact of substituents on modified compounds.
Previously, quinazoline derivatives were designed and synthesized, on the basis of molecular similarity between an aromatic diamide fragment of the novel insecticide chlorantraniliprole and quinazoline, and the combination of active substructures by us, and some were found to possess certain insecticidal activity [22,23]. Meanwhile, we studied the impact of halogen substituents and the positions of the fluorine substituents on the interactions between quinazoline derivatives and HSA. To further exploit how the introduction of five common groups, including methyl, methoxy, cyano, trifluoromethyl and isopropyl, influences the binding interactions of the parent structure to HSA, five new 6-chloro-1-(3,3-dimethyl-butanoyl)-2-(un)substituted-phenyl-2,3-dihydroquinazolin-4(1H)-ones (PDQL) (3bf) (Figure 1) were designed and synthesized, and their interactions were investigated at three temperatures using fluorescence spectroscopy, circular dichroism (CD) and Fourier transform infrared (FTIR) spectroscopic techniques. The obtained interaction information, specifically the quenching mechanism, binding constants, binding forces and thermodynamic parameters, may offer a better understanding of the biological action in vivo. With the use of 3-(benzylideneamino)-6-chloro-1-(3,3-dimethylbutanoyl)-2-phenyl-2,3-dihydroquinazolin-4(1H)-one as a reference compound, the influences of the methyl, methoxy, cyano, trifluoromethyl and isopropyl substituents, which have different electrical properties and lipid solubilities, on PDQL-HSA interactions were studied under simulated physiological conditions. The results provide a quantitative understanding of the effects of these five similar substituents on PDQL-HSA interactions; such understanding will provide useful information for the further design of potential biologically active quinazolinone derivatives.

2. Materials and Methods

2.1. Apparatus

Melting points were measured with a Fisher-Johns melting point apparatus (Cole-Parmer Co., Shanghai, China) without correction. Nuclear magnetic resonance (NMR) spectra were recorded with a 400-MHz spectrometer (Bruker, Billerica, MA, USA) and a 600-MHz spectrometer (Agilent Technologies, Santa Clara, CA, USA) using tetramethylsilane (TMS) as an internal standard. IR spectra were recorded over the spectral range of 4000–400 cm−1 on a Bruker Tensor 27 (Bruker Optics GmbH, Ettlingen, Germany) with samples embedded in KBr pellets. Mass spectra were recorded with an HPLC-1100/TOF MS high-resolution mass spectrometer (HRMS, Agilent Technologies, Santa Clara, CA, USA). All fluorescence spectra were measured with a Cary Eclipse fluorescence spectrophotometer (Agilent Technologies, Santa Clara, CA, USA) equipped with a thermostat bath. Quartz cuvettes with a 1-cm path length and 3-mL volume were used for all measurements. All pH values were measured with a PHS-25 digital pH meter (Shanghai REX Instrument Factory, Shanghai, China).

2.2. Reagents

HSA (≥99.9%, fatty-acid free, A1887) and digitoxin (Dig, D5878) were purchased from Sigma-Aldrich (St. Louis, MO, USA) and were used without further purification. Phenylbutazone (PB, 451567) and flufenamic acid (FA, 186419) were of analytical grade and were purchased from J&K (Beijing, China), and the stock solutions were prepared in absolute ethanol. Deionized water was generated using a Milli-Q Plus System from Millipore (Beijing, China). All other commercial reagents were obtained from Sigma-Aldrich, Alfa Aesar (Ward Hill, MA, USA) and J&K (Beijing, China). Dilutions of the HSA stock solution (10 mM) in Tris-HCl buffer (pH 7.4) were prepared immediately prior to use, and the HSA concentration was measured according to the Bradford method [24]. Flash column chromatography with a silica gel was used to purify the products.

2.3. Fluorescence Spectra Measurements

The fluorescence emission spectra were recorded at 298 K, with the excitation and emission slits both adjusted to a width of 5.0 nm. The excitation wavelength was 280 nm, and the emission was recorded at wavelengths from 290–500 nm. The scan speed was 120 nm/min. The photomultiplier tube (PMT) voltage was set at 740 V.

2.4. Fluorescence Titration Experiments

A solution (3.0 mL) containing 1.0 × 10⁻⁶ M HSA was titrated by successive additions of 8.0 × 10⁻⁴ M ethanol stock solution of PDQL (the final concentration was 1.333–10.667 × 10⁻⁶ M). The titrations were performed manually using microsyringes, and then, the fluorescence intensity was measured (λex = 280 nm, λem = 337 nm). All experiments were performed at three temperatures (298, 307 and 316 K).

2.5. Site Marker Competitive Replacement Study

Studies of the PDQL-HSA binding location in the presence of three classical site makers (PB, FA and Dig) were conducted using fluorescence titration methods. The concentrations of HSA and site makers were all stabilized at 1.0 × 10⁻⁶ M. The PDQL solution was then gradually added to the site marker-HSA mixtures. The fluorescence intensity was measured at λex 280 nm and λem 337 nm.

2.6. Circular Dichroism Spectra Studies

The far-UV (200–260 nm) CD measurements were performed on a Jasco 810 spectropolarimeter (JASCO Inc., Tokyo, Japan) at room temperature. The instrument was usually purged with 99.9% dry nitrogen gas before the measurements were started. The CD measurements of HSA in the absence and presence of PDQL were collected using a 0.1-cm path length quartz cuvette from 200–260 nm with a 0.1-nm step resolution at a scanning speed of 50 nm/min. The data were recorded as the average of five successive scans. All observed CD spectra were baseline subtracted for the buffer, and the HSA secondary structure was estimated using CDSSTR software, which was provided in the CDPro software package [25].

2.7. Fourier Transform Infrared Measurements

FTIR spectra were recorded on a Thermo Scientific Nicolet iS50 FTIR spectrometer (Thermo, Waltham MA, USA) using the attenuated total reflection (ATR) method at room temperature. All spectra were collected using 32 scans with a resolution of 4 cm−1. The absorbance of the buffer solution (Tris-HCl buffer solution at pH 7.40) was measured and then digitally subtracted from the FTIR spectra of HSA collected in the range of 500–4000 cm−1 in the absence and presence of PDQL.

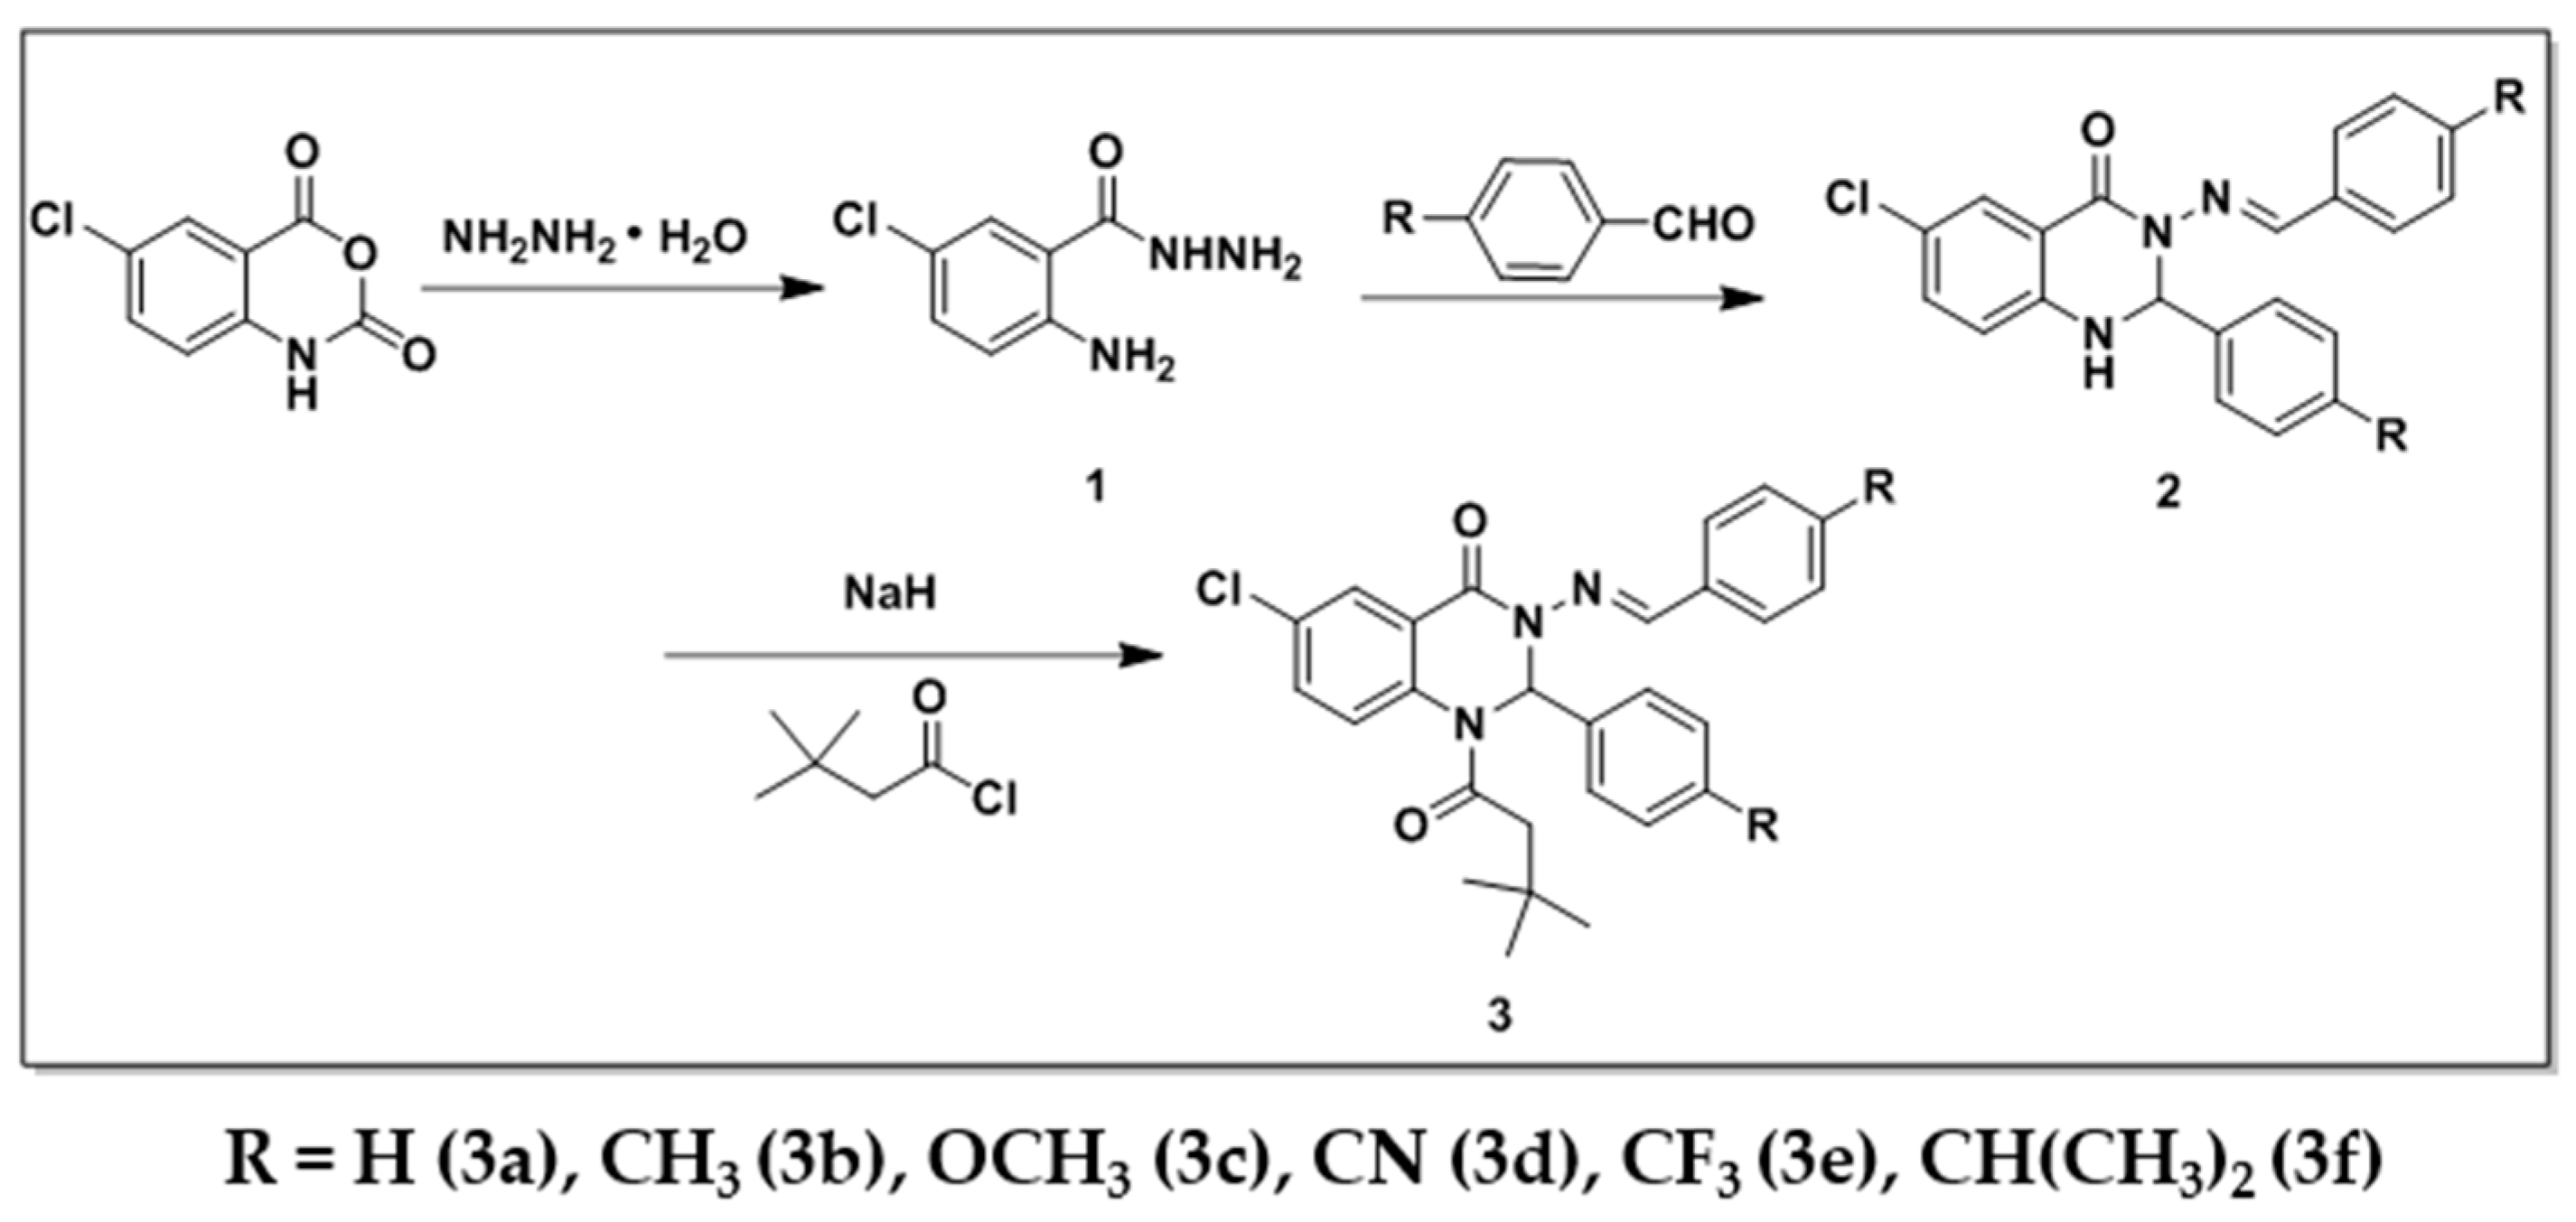
2.8. Synthesis of 6-Chloro-1-(3,3-dimethyl-butanoyl)-2-(un)substituted-phenyl-2,3-dihydroquinazolin-4(1H)-one Derivatives 3af

Compound 1 and the intermediate compounds (2af) were prepared according to the reported methods [26,27]. Their properties were as follows:
2-Amino-5-chlorobenzohydrazide (1): white crystals, yield 85%; m.p. 139.6–140.5 °C; 1H-NMR (400 MHz, DMSO-d6) δ 9.60 (s, 1H), 7.48 (d, J = 2.5 Hz, 1H), 7.16 (dd, J = 8.8, 2.5 Hz, 1H), 6.74 (d, J = 8.8 Hz, 1H), 6.46 (s, 2H), 4.42 (s, 2H).
3-(Benzylideneamino)-6-chloro-2-phenyl-2,3-dihydroquinazolin-4(1H)-one (2a): light yellow solid, yield 75.3%; m.p. 193.5–194.5 °C; 1H-NMR (600 MHz, chloroform-d) δ 9.20 (s, 1H), 7.93 (d, J = 2.5 Hz, 1H), 7.68–7.59 (m, 2H), 7.47–7.41 (m, 2H), 7.41–7.28 (m, 6H), 7.27–7.23 (m, 1H), 6.65 (d, J = 8.5 Hz, 1H), 6.28 (s, 1H), 4.96 (s, 1H).
6-Chloro-3-((4-methylbenzylidene)amino)-2-(p-tolyl)-2,3-dihydroquinazolin-4(1H)-one (2b): light yellow crystal, yield 63.7%; m.p. 193.3–194.1 °C; 1H-NMR (600 MHz, chloroform-d) δ 9.09 (s, 1H), 7.92 (d, J = 2.4 Hz, 1H), 7.54–7.52 (m, 2H), 7.31–7.29 (m, 2H), 7.24–7.22 (m, 1H), 7.16–7.07 (m, 4H), 6.62 (d, J = 8.5 Hz, 1H), 6.23 (s, 1H), 4.89 (s, 1H), 2.35 (s, 3H), 2.30 (s, 3H).
6-Chloro-3-((4-methoxybenzylidene)amino)-2-(4-methoxyphenyl)-2,3-dihydroquinazolin-4(1H)-one (2c): light yellow crystal, yield 60.5%; m.p. 204.3–206.1 °C; 1H-NMR (600 MHz, chloroform-d) δ 8.98 (s, 1H), 7.92 (d, J = 2.4 Hz, 1H), 7.57 (d, J = 8.3 Hz, 2H), 7.35 (d, J = 8.4 Hz, 2H), 7.28–7.19 (m, 1H), 6.90–6.76 (m, 4H), 6.62 (d, J = 8.5 Hz, 1H), 6.20 (s, 1H), 4.88 (s, 1H), 3.81 (s, 3H), 3.75 (s, 3H).
6-Chloro-3-((4-cyanophenylidene)amino)-2-(4-cyanophenyl)-2,3-dihydroquinazolin-4(1H)-one (2d): white crystal, yield 65.3%; m.p. 200.1–202.0 °C; 1H-NMR (600 MHz, DMSO-d6) δ 9.04 (s, 1H), 8.27 (d, J = 3.4 Hz, 1H), 7.89–7.82 (m, 6H), 7.63 (d, J = 2.5 Hz, 1H), 7.53 (d, J = 8.1 Hz, 2H), 7.37–7.32 (m, 1H), 6.86 (d, J = 8.7 Hz, 1H), 6.69 (d, J = 3.3 Hz, 1H).
6-Chloro-3-((4-(trifluoromethyl)benzylidene)amino)-2-(4-(trifluoromethyl)phenyl)-2,3-dihydroquinazolin-4(1H)-one (2e): white crystal, yield 65.3%; m.p. 200.1–202.0 °C; 1H-NMR (600 MHz, chloroform-d) δ 9.49 (s, 1H), 7.92 (d, J = 2.4 Hz, 1H), 7.72 (d, J = 8.0 Hz, 2H), 7.64–7.52 (m, 6H), 7.31–7.25 (m, 1H), 6.72 (d, J = 8.5 Hz, 1H), 6.34 (s, 1H), 5.02 (s, 1H).
6-Chloro-3-((4-isopropylbenzylidene)amino)-2-(4-isopropylphenyl)-2,3-dihydroquinazolin-4(1H)-one (2f): white crystal, yield 65.3%; m.p. 200.1–202.0 °C; 1H-NMR (600 MHz, chloroform-d) δ 9.10 (s, 1H), 7.96–7.85 (m, 1H), 7.57 (d, J = 8.0 Hz, 2H), 7.33 (s, 2H), 7.24–7.18 (m, 3H), 7.16–7.14 (m, 2H), 6.62 (d, J = 8.5 Hz, 1H), 6.25 (d, J = 2.4 Hz, 1H), 5.11 (s, 1H), 2.88 (m, 2H), 1.27–1.15 (m, 12H).
Compounds 3af were prepared with the same procedure. Compound 2 (3 mmol) in anhydrous tetrahydrofuran (30 mL) was cooled to 0 °C using an ice bath, and then, sodium hydride (3.6 mmol) was added. The mixture was stirred first for 0.5 h at 0 °C and by another 1.0 h at room temperature. tert-Butylacetyl chloride (3.6 mmol) in anhydrous tetrahydrofuran (5 mL) was then added slowly at 0 °C in 0.5 h, followed by stirring the mixture at room temperature overnight. Subsequently, the solvent was removed under vacuum, and the residue was purified by flash chromatography using hexane and ethyl acetate (v/v = 6:1) as the eluent to obtain the title compounds.
3-(Benzylideneamino)-6-chloro-1-(3,3-dimethylbutanoyl)-2-phenyl-2,3-dihydroquinazolin-4(1H)-one (3a): white solid, yield 49.5%; m.p. 149.5–150.8 °C; 1H-NMR (600 MHz, DMSO-d6) δ 9.17 (s, 1H), 7.81 (m, 4H), 7.61 (s, 2H), 7.52–7.41 (m, 3H), 7.33–7.13 (m, 5H), 2.67 (s, 2H), 0.95 (s, 9H); 13C-NMR (151 MHz, DMSO-d6) δ 171.56, 158.59, 152.50, 136.82, 136.54, 134.42, 133.39, 131.45, 130.95, 129.34, 129.27, 129.02, 128.16, 128.01, 127.57, 126.33, 125.90, 44.73, 32.14, 29.86; HRMS: m/z Calcd. for C27H26ClN3O2 [M + H]+ 460.1786, found 460.1776.
6-Chloro-1-(3,3-dimethylbutanoyl)-3-((4-methylbenzylidene)amino)-2-(p-tolyl)-2,3-dihydroquinazolin-4(1H)-one (3b): white solid, yield 53.3%; m.p. 149.3–150.1 °C; 1H-NMR (600 MHz, DMSO-d6) δ 9.07 (s, 1H), 7.80 (s, 1H), 7.77–7.63 (m, 3H), 7.59 (s, 2H), 7.30–7.22 (m, 2H), 7.12–7.00 (m, 4H), 2.65 (s, 2H), 2.33 (s, 3H), 2.17 (s, 3H), 0.94 (s, 9H); 13C-NMR (151 MHz, DMSO-d6) δ 171.48 , 158.50, 152.61, 141.45, 138.43, 136.80, 133.53, 133.29, 131.69, 130.89, 129.94, 129.81, 128.16, 127.97, 127.51, 126.26, 125.99, 44.75, 32.13, 29.86, 21.56, 20.97; IR (v, cm−1): 3430.9, 2954.1, 1678.4, 1665.8, 1604.4, 1466.7, 1360.8, 1229.5, 1140.3, 824.2, 754.5, 688.0, 592.2; HRMS: m/z Calcd. for C29H30ClN3O2 [M + H]+ 488.2027, found 488.2050.
6-Chloro-1-(3,3-dimethylbutanoyl)-3-((4-methoxybenzylidene)amino)-2-(4-methoxyphenyl)-2,3-dihydroquinazolin-4(1H)-one (3c): white solid, yield 59.5%; m.p. 104.5–105.8 °C; 1H-NMR (600 MHz, DMSO-d6) δ 9.04 (s, 1H), 7.80 (s, 1H), 7.76–7.72 (m, 2H), 7.65–7.57 (m, 3H), 7.08–7.01 (m, 4H), 6.84–6.82 (m, 2H), 3.80 (s, 3H), 3.64 (s, 3H), 2.66 (s, 2H), 0.95 (s, 9H); 13C-NMR (151 MHz, DMSO-d6) δ 171.47, 162.05, 159.69, 158.34, 136.74, 133.19, 130.83, 129.93, 128.27, 127.95, 127.67, 127.45, 126.83, 126.04, 114.85, 114.60, 55.83, 55.50, 44.80, 32.15, 29.87; IR (v, cm−1): 3430.4, 2957.9, 2226.2, 1695.2, 1669.1, 1479.8, 1422.5, 1364.4, 1262.8, 1233.3, 1147.7, 837.9, 557.1; HRMS: m/z Calcd. for C29H30ClN3O3 [M + H]+ 626.2707, found 626.2737.
6-Chloro-1-(3,3-dimethylbutanoyl)-3-((4-cyanophenylidene)amino)-2-(4-cyanophenyl)-2,3-dihydroquinazolin-4(1H)-one (3d): white solid, yield 46.7%; m.p. 115.3–116.1 °C; 1H-NMR (600 MHz, DMSO-d6) δ 9.27 (s, 1H), 7.99–7.97 (m, 2H), 7.96–7.84 (m, 3H), 7.83–7.74 (m, 3H), 7.66 (s, 2H), 7.38–7.36 (m, 2H), 2.68 (s, 2H), 0.94 (s, 9H); 13C-NMR (151 MHz, DMSO-d6) δ 171.66, 158.56, 141.83, 138.84, 136.71, 133.91, 133.31, 133.28, 131.31, 128.70, 128.11, 127.82, 127.51, 125.42, 118.99, 118.58, 113.25, 112.10, 44.67, 32.09, 29.82; IR (v, cm−1): 3677.4, 2964.2, 1670.3, 1481.0, 1356.5, 1270.9, 1231.8, 1143.7, 1087.3, 826.0, 692.8, 518.2; HRMS: m/z Calcd. for C29H24ClN5O2 [M + H]+ 510.1619, found 510.1643.
6-Chloro-1-(3,3-dimethylbutanoyl)-3-((4-(trifluoromethyl)benzylidene)amino)-2-(4-(trifluoromethyl) phenyl)-2,3-dihydroquinazolin-4(1H)-one (3e): white solid, yield 53.5%; m.p. 149.5–150.8 °C; 1H-NMR (600 MHz, DMSO-d6) δ 9.25 (s, 1H), 8.02 (d, J = 8.1 Hz, 2H), 7.91 (s, 1H), 7.86–7.73 (m, 3H), 7.73–7.61 (m, 4H), 7.41–7.40 (m, 2H), 2.67 (s, 2H), 0.95 (s, 9H); 13C-NMR (151 MHz, chloroform-d) δ 171.67, 158.56, 141.04, 138.39, 136.70, 133.83, 131.27, 131.05, 130.84, 129.74, 129.53, 129.31, 128.77, 128.07, 127.81, 127.68, 127.42, 126.33, 126.31, 126.28, 126.26, 126.23, 126.20, 125.54, 125.35, 125.17, 123.55, 123.37, 44.68, 32.11, 29.82; IR (v, cm−1): 3693.9, 2959.4, 2871.7, 1670.7, 1620.7, 1603.8, 1483.6, 1431.7, 1325.2, 1128.8, 1068.0, 1017.4, 829.5, 797.7, 761.9, 708.3, 690.9, 597.9; HRMS: m/z Calcd. for C29H24ClF6N3O2 [M + H]+ 596.1461, found 596.1536.
6-Chloro-1-(3,3-dimethylbutanoyl)-3-((4-isopropylbenzylidene)amino)-2-(4-isopropylphenyl)-2,3-dihydroquinazolin-4(1H)-one (3f): white solid, yield 46.3%; m.p. 124.4–125.8 °C; 1H-NMR (600 MHz, DMSO-d6) δ 9.12 (s, 1H), 7.81 (d, J = 2.3 Hz, 1H), 7.76–7.53 (m, 5H), 7.32–7.25 (m, 2H), 7.19–7.05 (m, 4H), 2.94–2.87 (m, 1H), 2.79–2.65 (m, 3H), 1.21–1.14 (m, 6H), 1.10–1.02 (m, 6H), 0.94 (s, 9H); 13C-NMR (151 MHz, DMSO-d6) δ 171.52, 158.46, 152.52, 152.20, 149.13, 136.79, 133.95, 133.31, 132.14, 130.85, 128.28, 127.95, 127.58, 127.29, 127.22, 126.32, 125.88, 44.76, 33.90, 33.35, 32.14, 29.85, 24.07, 24.06, 24.01; IR (v, cm−1): 3435.1, 2952.3, 1667.6, 1484.8, 1364.9, 1270.2, 1226.5, 815.7, 766.9, 526.9; HRMS: m/z Calcd. for C33H38ClN3O2 [M + H]+ 544.2653, found 544.2678.

3. Results and Discussion

3.1. Synthesis

t-Butylacetyl moieties were introduced to quinazolines to partially improve parent molecules binding to HSA through hydrophobic action [22], which was also utilized in our chemical design. For compound preparation, 5-chloro-isotoic anhydride was employed as a starting material, and reacted with hydrazine hydrate, p-substituted benzaldehyde in order to obtain the intermediate 2. Subsequently, Compounds 3bf were successfully synthesized from t-butylacetyl chloride in the presence of sodium hydride. The new compounds were well characterized by NMR and HRMS spectra (see Supplementary Materials).

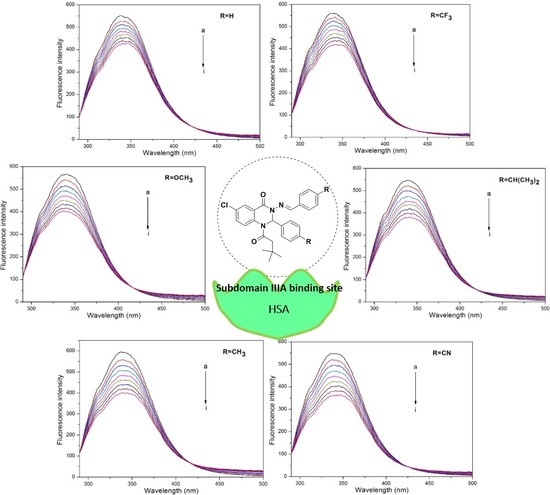
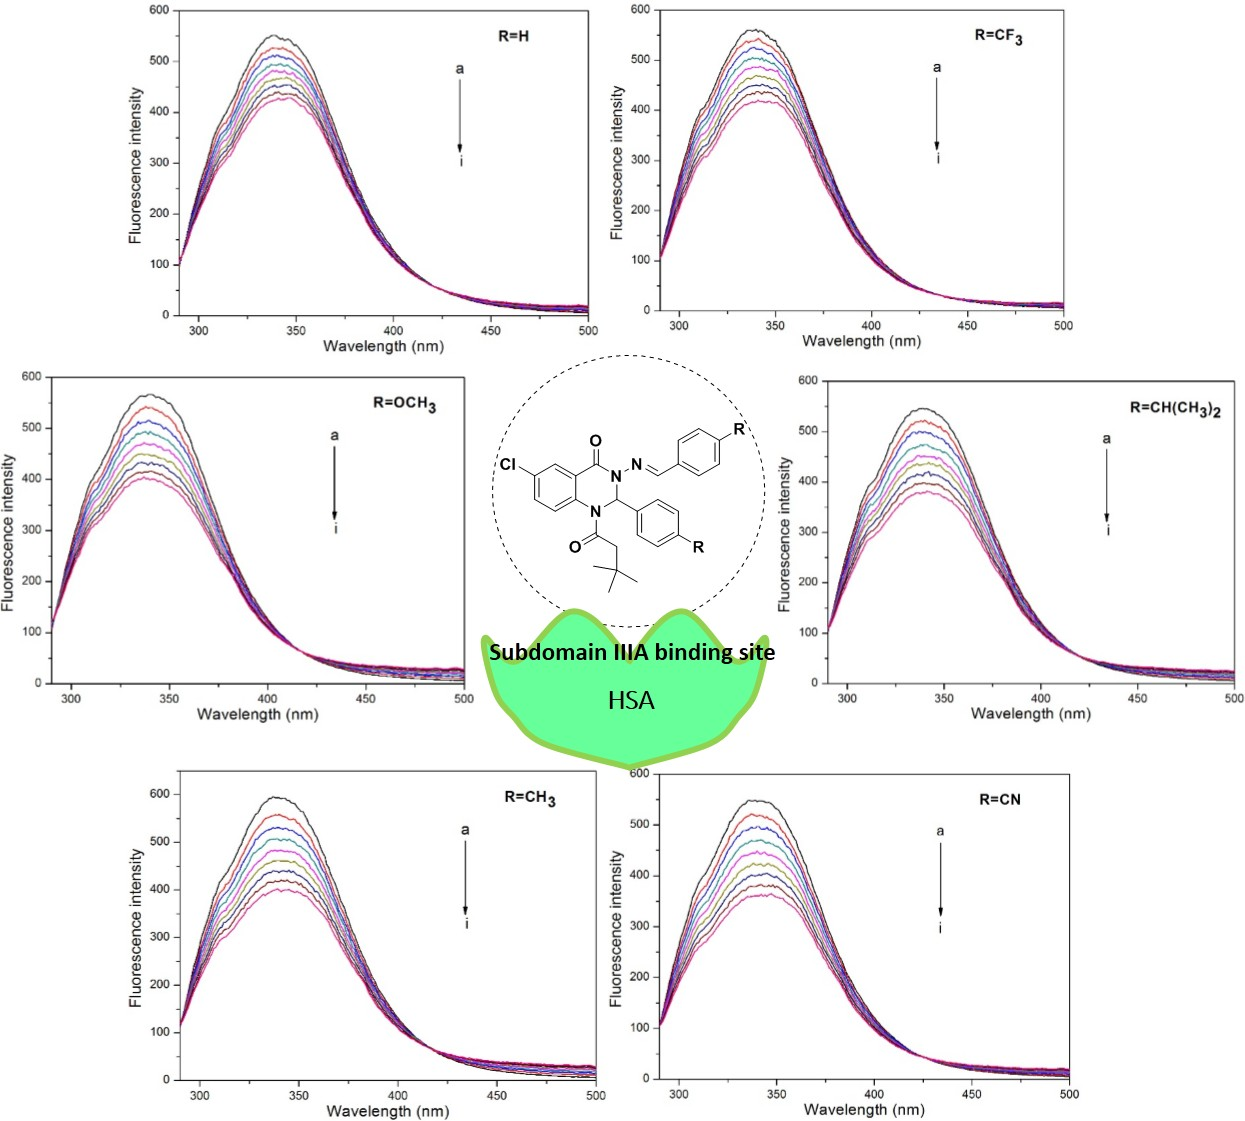
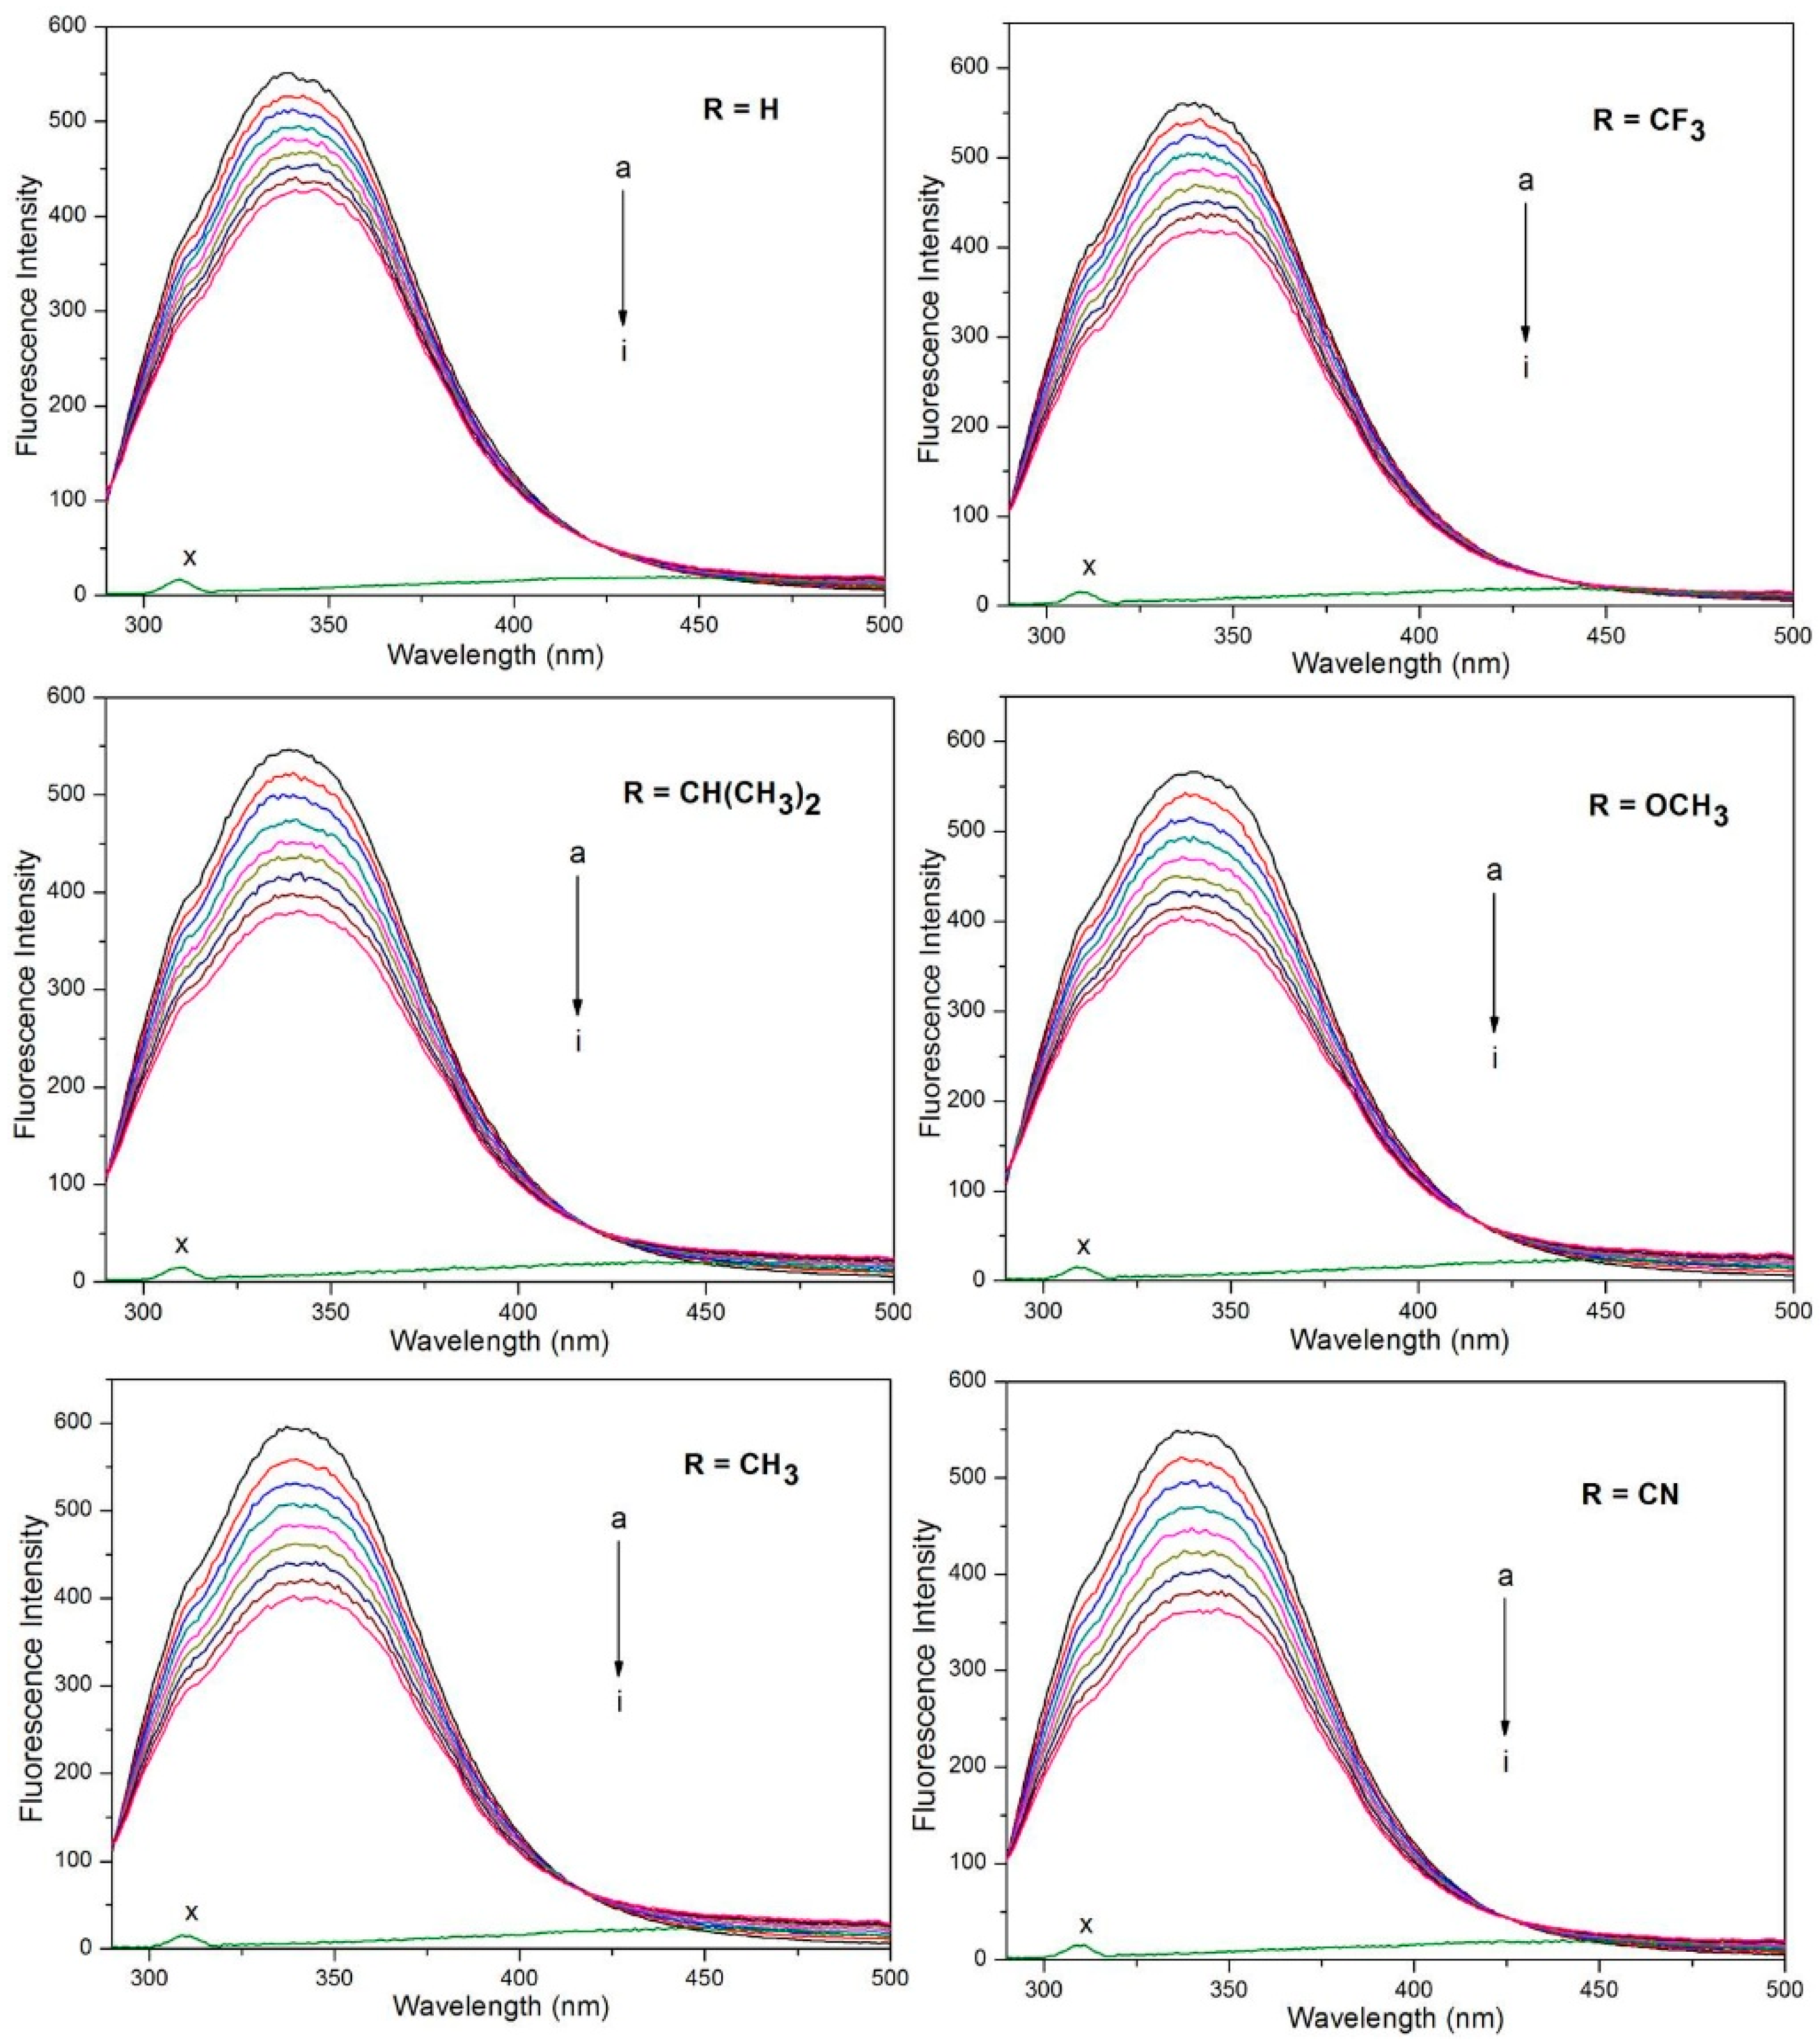
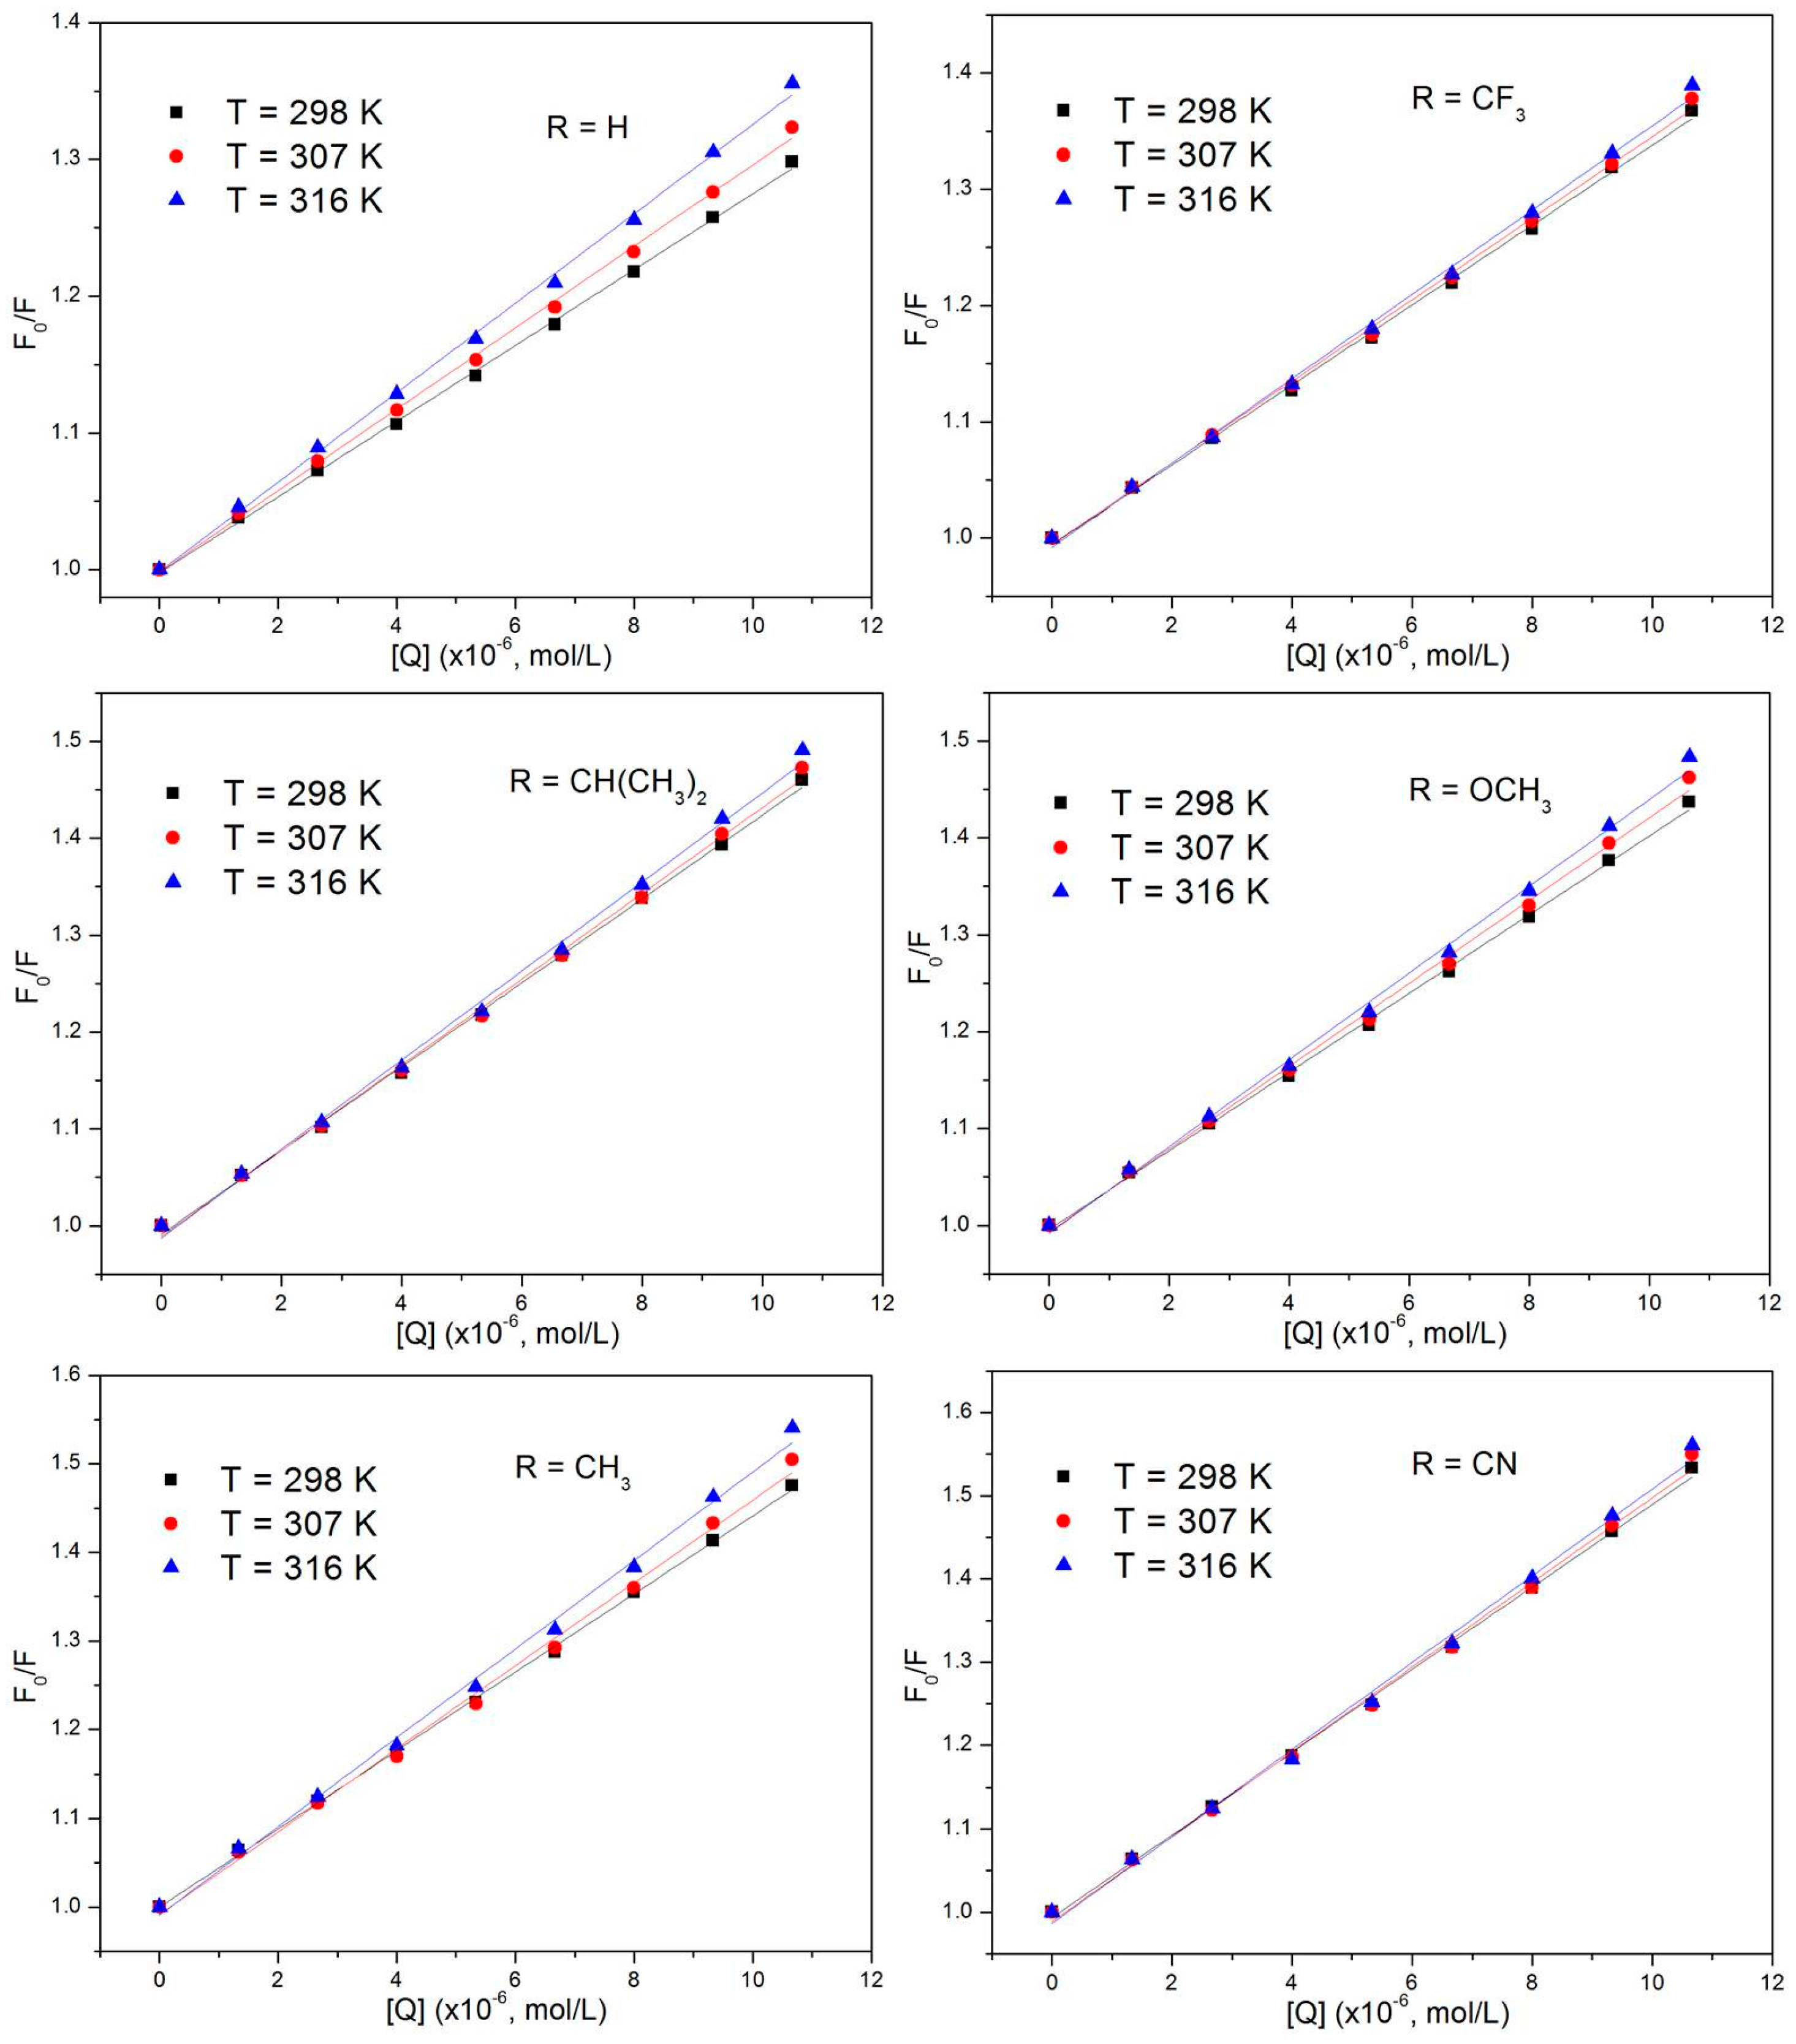
3.2. Fluorescence Quenching Mechanism

Fluorescence spectroscopy is a valuable tool to study protein-ligand interactions. Of the three aromatic amino acid residues, tryptophan (Trp) contributes most to intrinsic protein fluorescence [28]. The effect of PDQL on the fluorescence emission spectra of HSA was first tested (Figure 2). The strong fluorescence peak of HSA at approximately 340 nm decreased in the absence of PDQL (λex = 280 nm, 298 K). The results indicated that the binding of PDQL to HSA quenched the intrinsic fluorescence of the tryptophan residue in HSA.
Fluorescence quenching could proceed via dynamic or static quenching or a combination of both [29,30]. Dynamic quenching involves the collisional encounters between the quencher and the fluorophore during the lifetime of the excited state, whereas static quenching involves the formation of a ground state complex between the fluorophore and the quencher [31]. To determine the mechanism for the quenching of the intrinsic HSA fluorescence by PDQL, the experimental data were analyzed using the Stern-Volmer Equation (1) [32].
F0/F = 1 + KSV [Q] = 1 + K0 [Q]
where F0 and F are the steady-state fluorescence intensities of HSA in the absence and presence of the quencher, respectively. KSV is the Stern-Volmer quenching constant; Kq is the bimolecular quenching constant; τ0 is the average lifetime of the biomolecule without the quencher (τ0 = 10−8 s−1) [33]; and [Q] is the concentration of the quencher. Figure 3 shows that the Stern-Volmer plots at different temperatures and different concentrations of a quencher. The observed linear dependence between F0/F and the molar concentration of PDQL indicates a single quenching mechanism, either static or dynamic. The calculated values of Kq for all PDQL-HSA reactions in Table 1 fell in the range of 2.77 × 10¹² and 5.21 × 10¹² mol·L−1. These values are two orders of magnitude greater than the maximum collisional quenching constant of 2.0 × 10¹⁰ mol·L−1 [18,34,35], so static quenching presumably occurred via the formation of a complex.
For a complex formation process, a modified Stern-Volmer Equation (2) [36] was used to calculate the affinity binding constant Ka between PDQL and HSA.
F0/(F0F) = fa−1·Ka−1·[Q]−1 + fa−1
where F0 and F are the fluorescence intensities before and after the addition of the quencher, respectively. Ka is the effective quenching constant. fa represents the fraction of accessible fluorescence. Data were treated according to the modified Stern–Volmer equation to obtain the linear plots at different temperatures (Figure 4). A linear relationship exists between F0/(F0F) and the reciprocal value of the quencher concentration [Q], and the slope equals the value of fa−1·Ka−1. The values of Ka in Table 2 showed that the affinity constants all increased after the introduction of a substituent on the benzene ring.

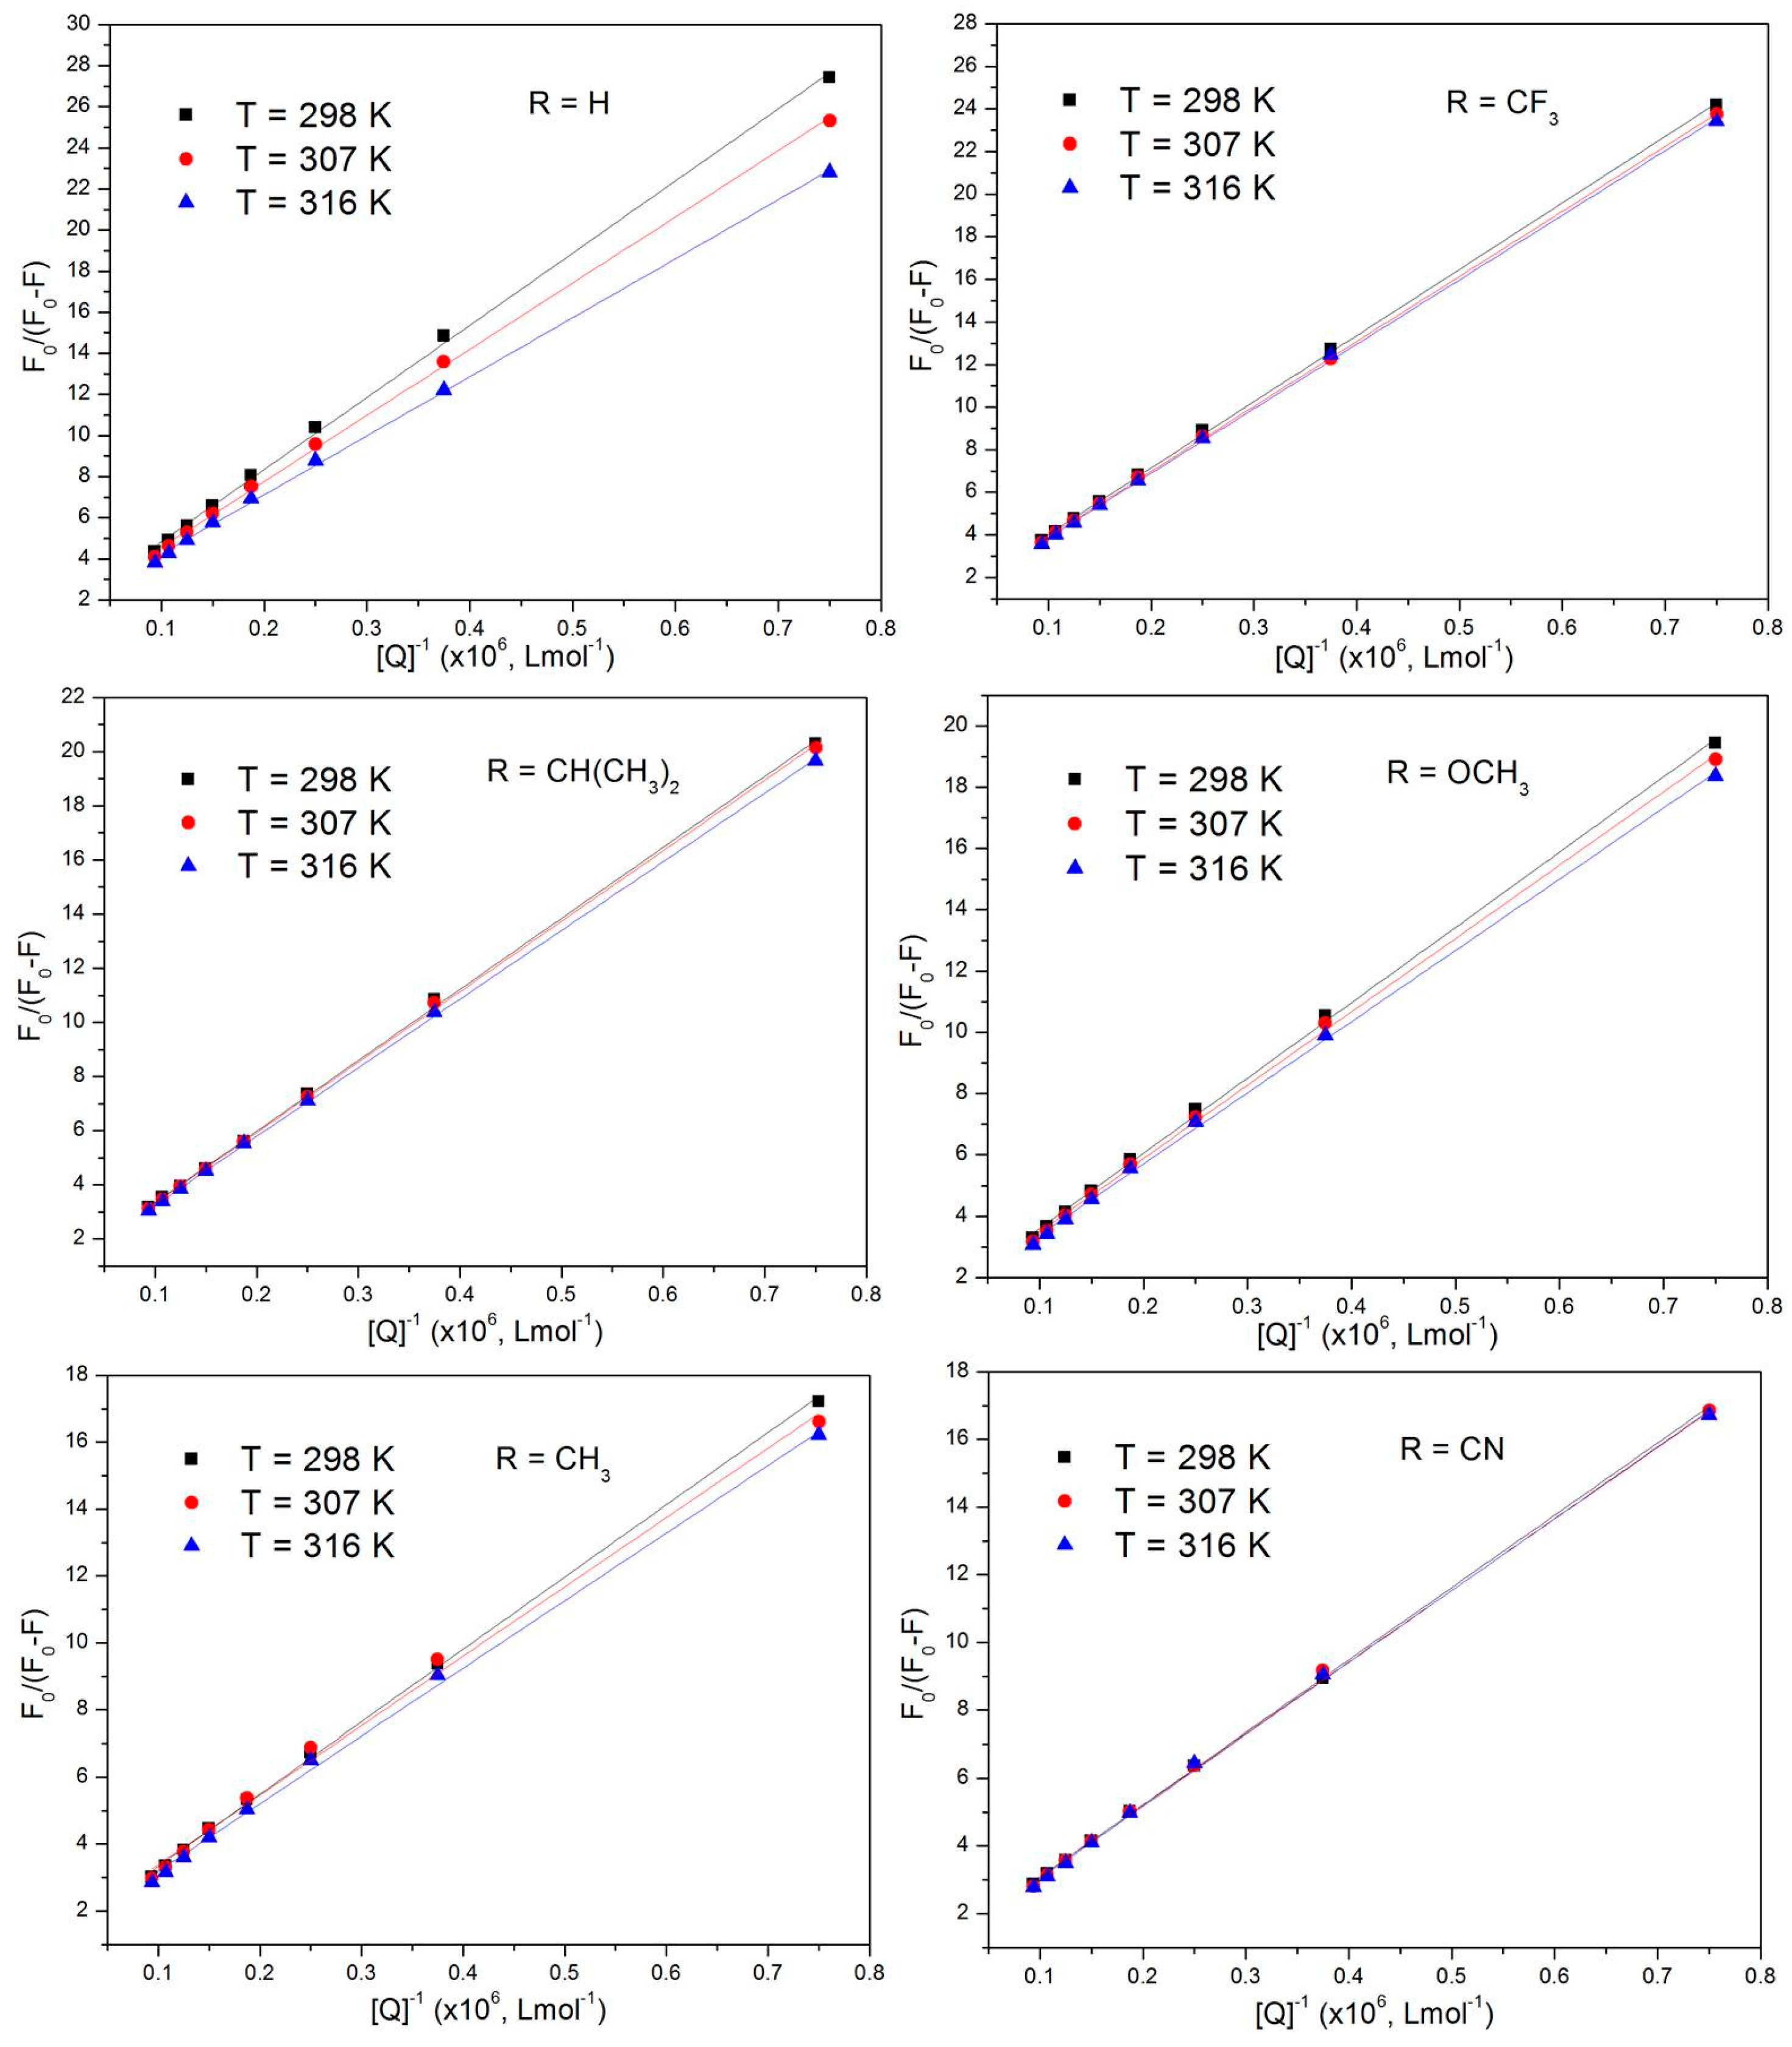
3.3. Binding Sites and Identification of Binding Sites on HSA

For static quenching, the number of binding sites can be determined according to the double-logarithmic equation (Equation (3)) [37,38,39]:
log[(F0F)/F] = logKb + nlg[Q]
where F0 and F are the fluorescence intensities in the absence and presence, respectively, of the ligand. The binding constant Kb is obtained from the y-intercept of the plot of log[(F0F)/F] versus log[Q]. n is not only the number of binding sites per protein, but also the plot slope. The related data were handled by this equation; a good linear relationship with a value of n of approximately one was obtained, which suggested that PDQL binds to HSA at a molar ratio of 1:1 (Table 2).
Three well-characterized high-affinity drug binding sites I, II and III, which are located in the hydrophobic cavities of subdomains IIA, IIIA and IB, respectively, of HSA [40], facilitate the effective transport of the drugs in the blood circulation. To confirm the binding site of PDQL on HSA, site-marker competitive-displacement experiments were conducted using phenylbutazone (PB, site I), flufenamic acid (FA, site II) and digitoxin (Dig, site III) as specific markers [41]. The binding constants of PDQL with HSA remarkably decreased after the addition of FA, whereas the addition of PB and Dig caused relatively small changes (Table 3). As discussed above, these results indicated that PDQL could be replaced by FA; thus, the predominant binding site of PDQL is in subdomain IIIA (site II).

3.4. Thermodynamic Parameters and Binding Modes

Essentially, there are four types of non-covalent interactions between ligand and protein, i.e., the hydrophobic effect, hydrogen bonding, van der Waals force and electrostatic interactions [42]. Generally, the signs and magnitudes of the thermodynamic parameters of the enthalpy change (ΔH) and entropy change (ΔS) are important for identifying the main forces involved in the binding process. Ross and Subramanian [43] used the laws of thermodynamics to evaluate the primary mode of binding forces between drugs and biological molecules: (1) ΔH > 0 and ΔS > 0 indicate a hydrophobic interaction; (2) ΔH < 0 and ΔS < 0 suggest that hydrogen bonding and van der Waals force are the dominant forces; and (3) ΔH ≅ 0 and ΔS > 0 imply that electrostatic interactions are dominant.
If ΔH does not vary significantly in the range of temperatures studied, both ΔH and ΔS can be evaluated from the Van ’t Hoff equation (Equation (4)):
lnKa = −ΔH/RT + ΔS/R
where Ka is analogous to the associative binding constants at the relevant temperature. R is the gas constant. ΔH and ΔS were calculated using the Van ’t Hoff plots (Table 4). The Gibbs’ free energy change (ΔG) was then estimated from the following relationship (Equation (5)):
ΔG = ΔHTΔS
The negative ΔG values listed in Table 5 indicated that the complexation of PDQL and HSA occurred spontaneously in the aqueous solution. The signs of ΔH and ΔS for the binding reaction were both found to be positive, which revealed that hydrophobic forces played the chief role in the process of PDQL binding to HSA.
With 3-(benzylideneamino)-6-chloro-1-(3,3-dimethylbutanoyl)-2-phenyl-2,3-dihydroquinazolin -4(1H)-one as a reference compound, the changes in ΔH and ΔS were compared and studied after the introduction of the five familiar substituents on the benzene ring. The signs of the ΔH change (ΔΔH) and the ΔS change (ΔΔS) listed in Table 6 showed that the binding affinities were enhanced by van der Waals or hydrogen bonding forces after the introduction of the substituted groups, which was indicated by the analysis based on the laws of thermodynamics, as summarized by Ross and Subramanian [43]. The fluorine atoms of the trifluoromethyl group and the nitrogen atoms of the cyano group may provide separated electron pairs, to form hydrogen bonds.
In addition, Table 7 lists the values of the ΔG change (ΔΔG) for the interaction of PDQL-HSA at the relevant temperature after the introduction of substituted groups in the benzene ring in PDQL. The ΔΔG value only slightly changed as the temperature changed and the negative sign of ΔΔG revealed that the introduction of substituted groups increased the binding affinity in the PDQL-HSA systems. Isopropyl substitution enhanced the binding affinity the most, followed by the cyano group, which had a slightly lower effect than the isopropyl substitution. The effects of the other three groups (methyl, methoxy and trifluoromethyl) substitutions on the benzene rings were identical. These groups substitute hydrogen atoms on the benzene ring, thereby increasing the space volume of the molecule; as a result, steric effects played probably a major role in the enhanced interaction of the PDQL-HSA system. Furthermore, the steric effect may be reflected by the form of van der Waals or hydrogen bonding forces. In contrast, the electrostatic properties and lipid solubilities of these groups play a minor role in the enhancement of the interaction of the PDQL-HSA system.

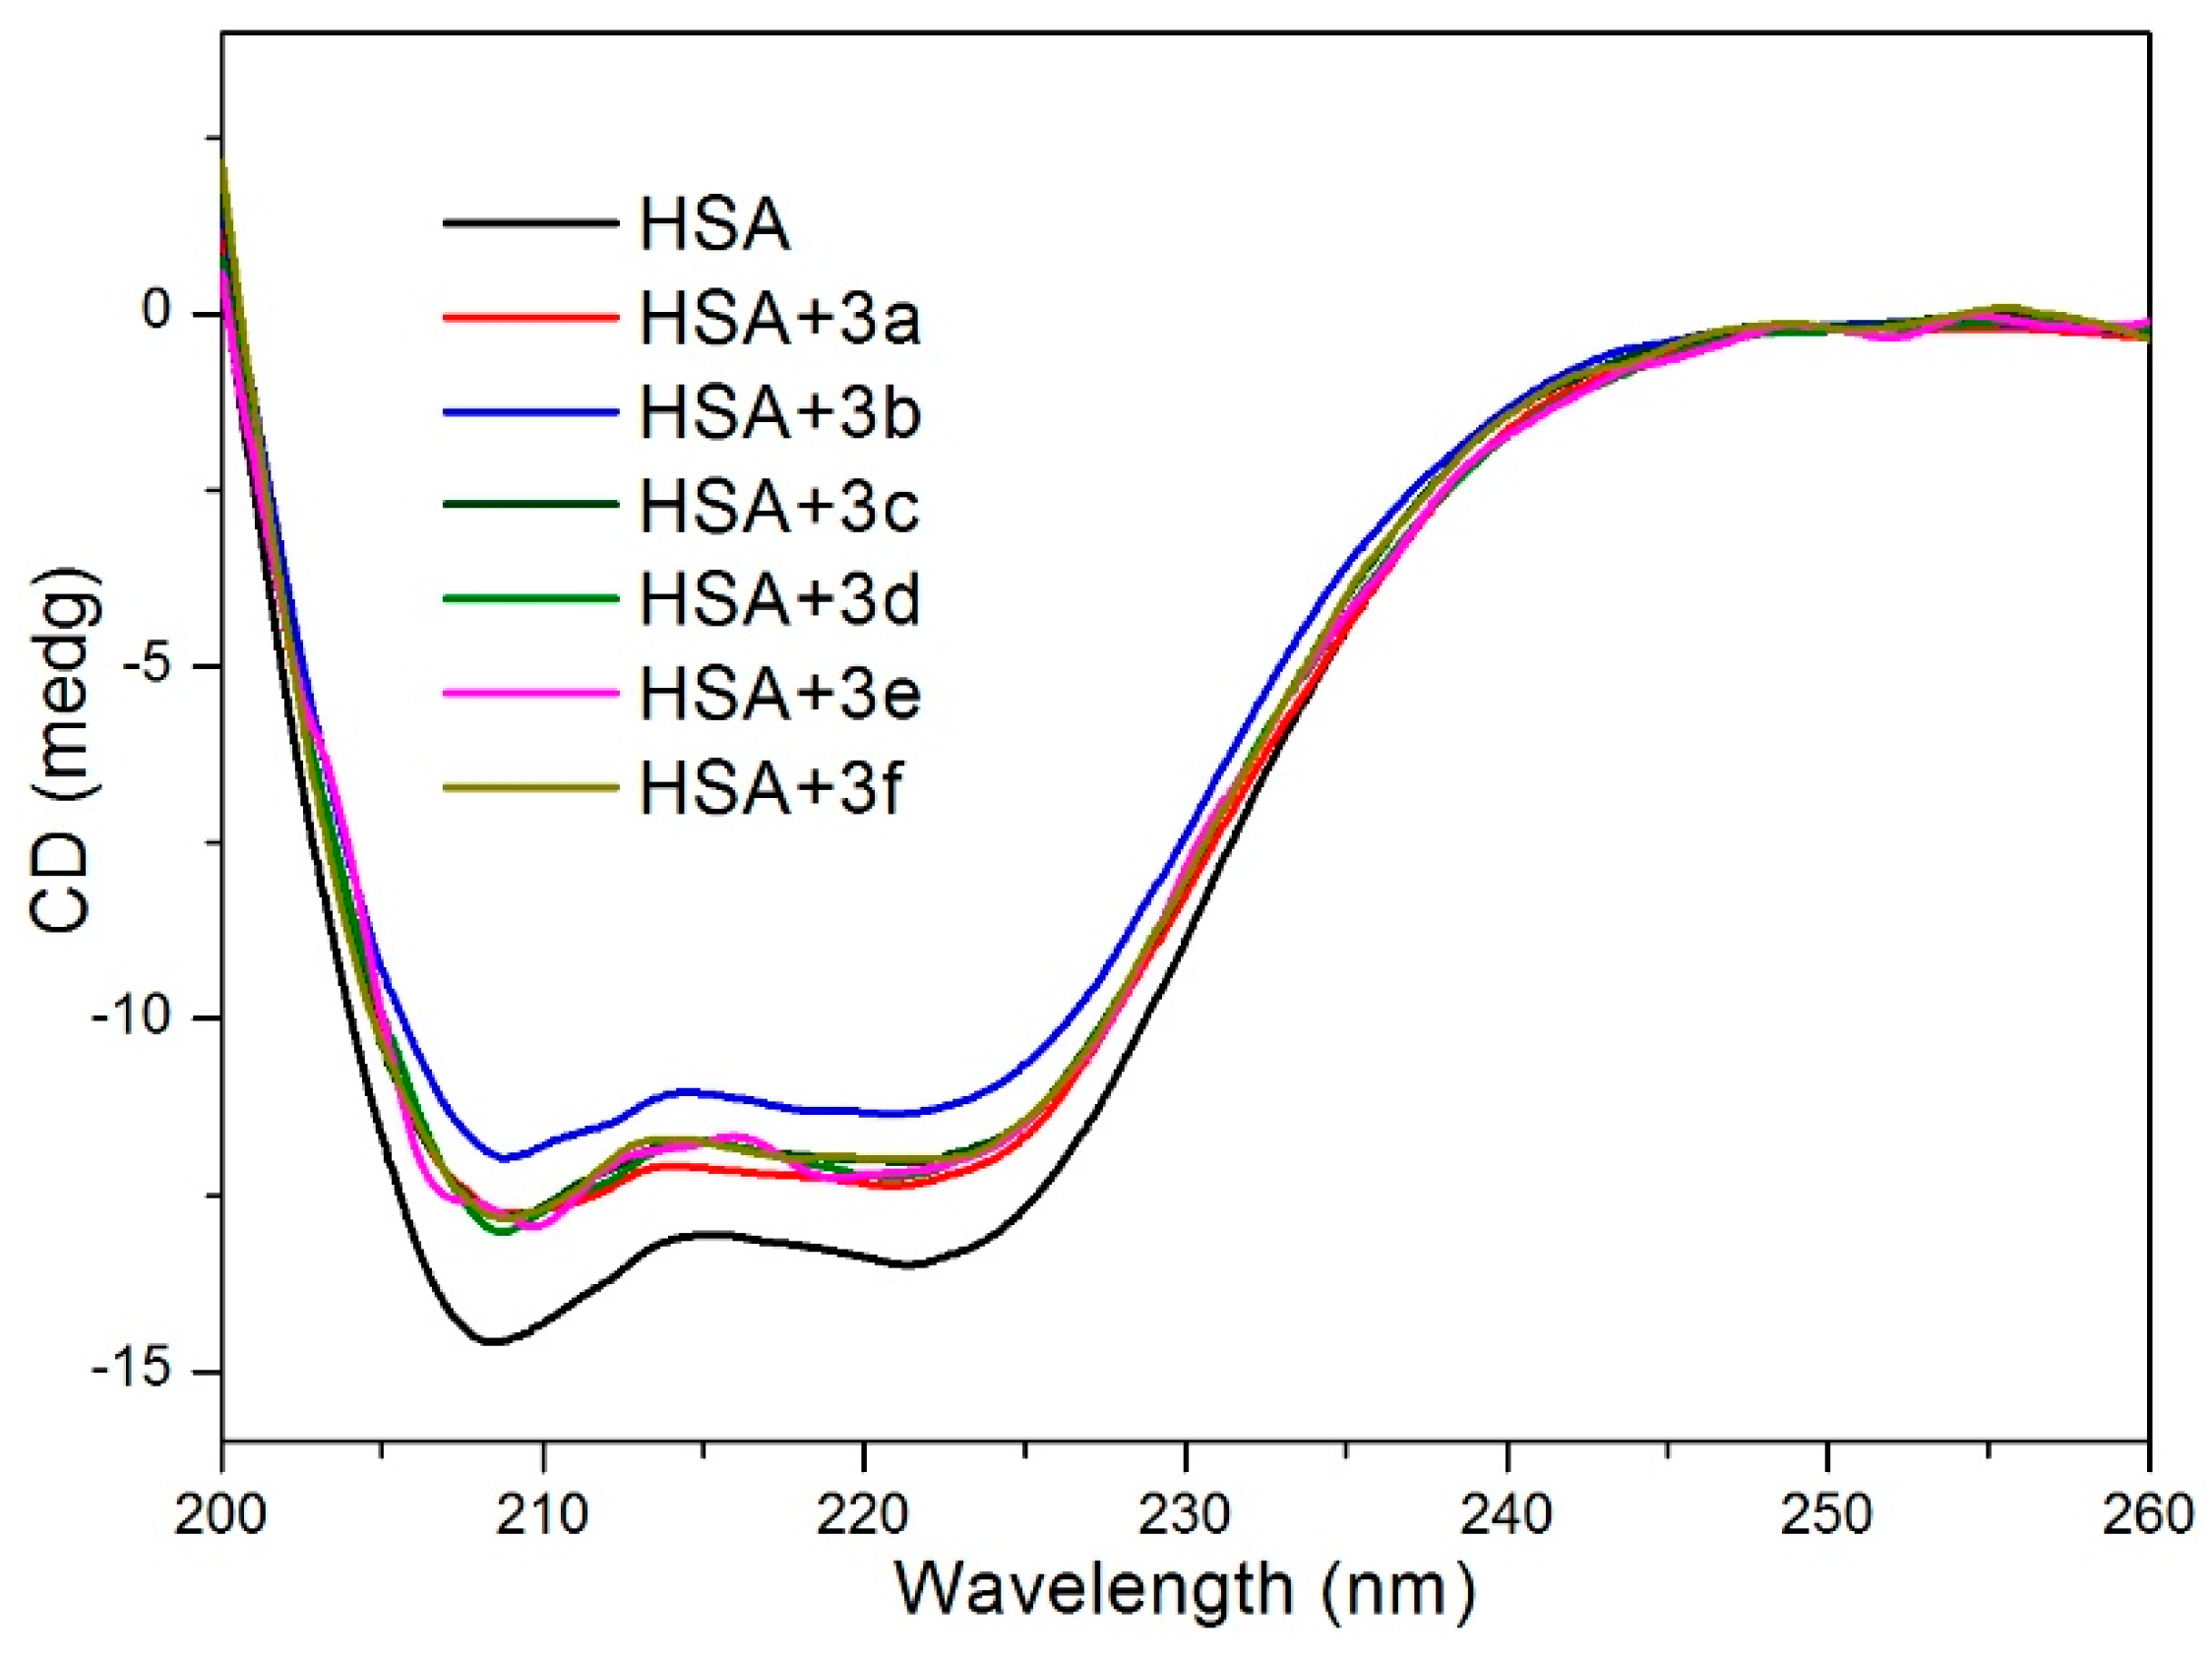
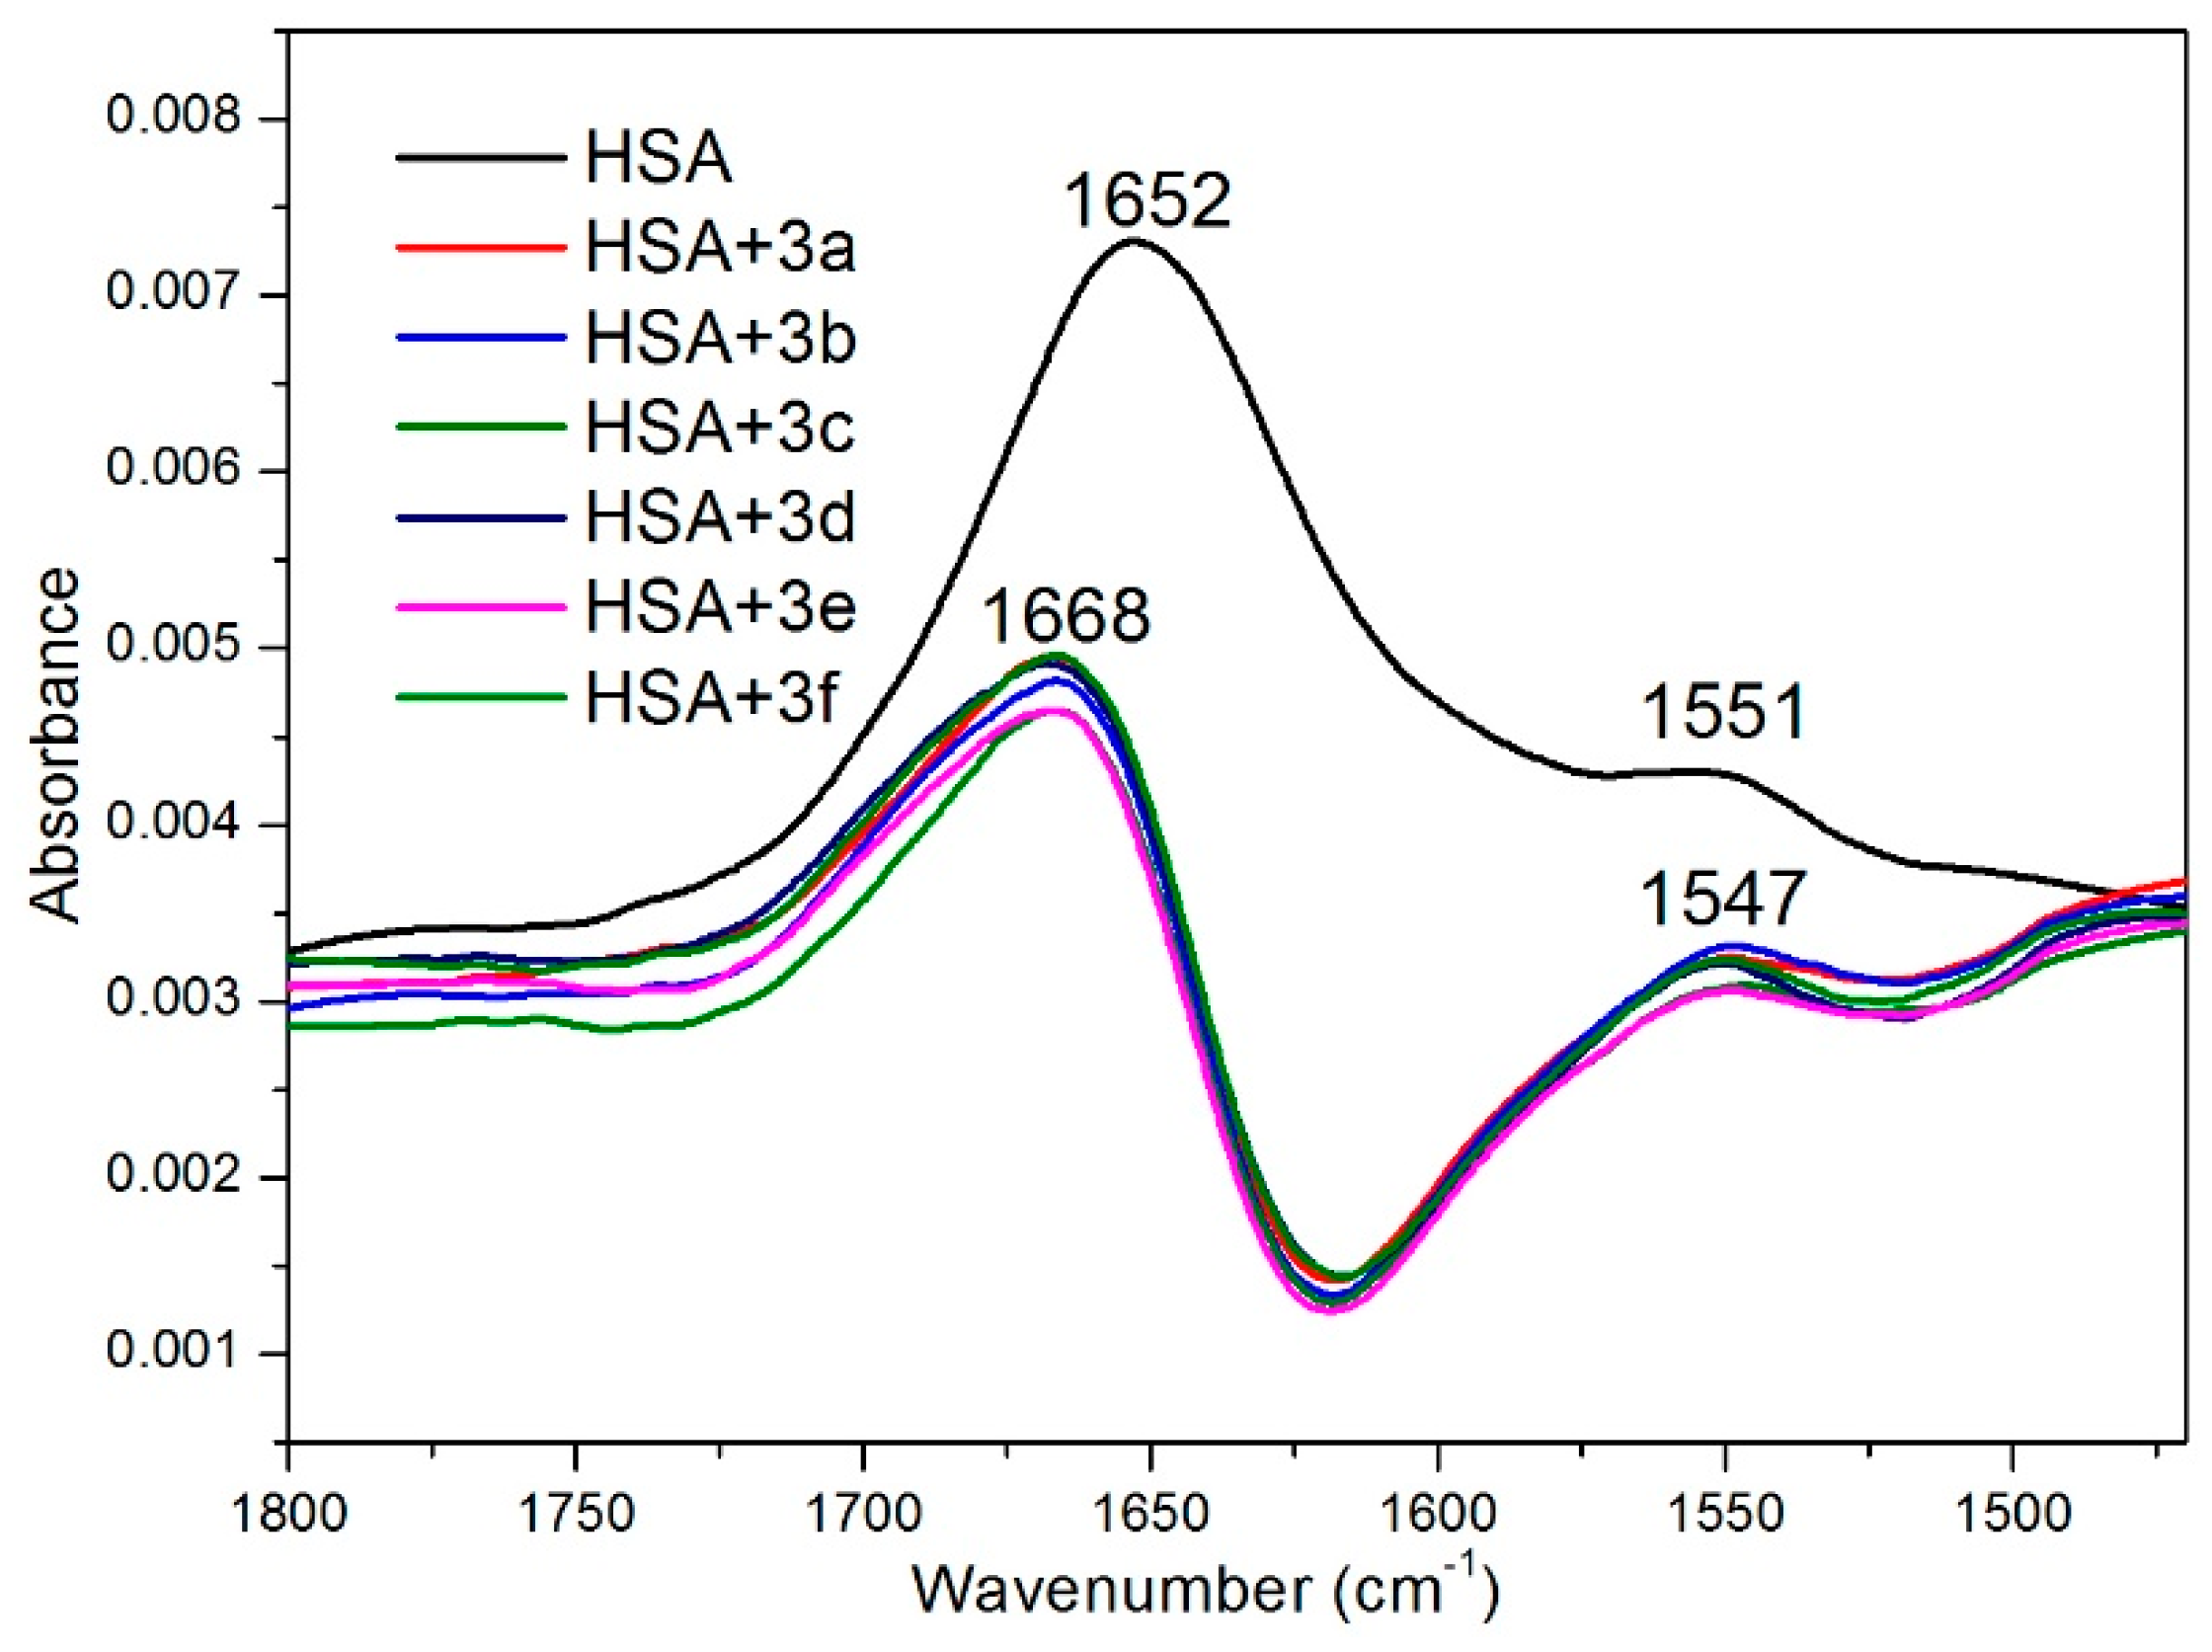
3.5. HSA Conformational Change Evaluated Using CD and FTIR Measurements

CD spectroscopy is a very useful and sensitive technique for obtaining information regarding the secondary protein structure. Far-UV CD measurements in the range of 200–260 nm for HSA with and without PDQL were conducted to explore the structural changes of HSA that occurred during the binding process. The CD spectra of the HSA and PDQL-HSA complex exhibited two negative bands in the UV region at 208 and 222 nm, which are characteristic of α-helix structural units in proteins (Figure 5). The intensities of the negative bands increased with the addition of PDQL without a change in either the position or the shape of the peak. The calculated values for the fractions of the α-helix, β-sheet, β-turn and random coil structures are listed in Table 8. The results indicated some loss in the α-helical structures and an increase in the disordered structural content in HSA after the addition of PDQL, in particular isopropyl-modified PDQL, which may be caused by the enhanced binding affinity from isopropyl substitution Therefore, the binding of PDQL may cause secondary structural changes in HSA.
To further verify the conformation changes of HSA with PDQL, FTIR spectroscopy was performed. The structural changes of HSA after binding to PDQL were observed using FTIR (Figure 6). Two bands in the secondary structure of a protein were observed by Zhu et al. [13], and these bands are the most widely-used vibrational bands in studies of changes in the HSA secondary structure using FTIR spectra in the range of 1700–1500 cm−1. The amide I band (1700–1600 cm−1, mainly the C=O stretch) and the amide II band (1600–1500 cm−1, a C–N stretching coupled with N-H bending) are correlated with the secondary structure of the protein. With the addition of PDQL to HSA, the peak position of amide I changed from 1652 cm−1 to 1668 cm−1, and the amide II peak shifted from 1551 to 1547 cm−1. Furthermore, the intensity of the amide I and amide II bands decreased, and the peak shape changed, revealing that the PDQLs interacted with the C=O and C–N groups in the protein structural subunits. This finding suggested that the PDQLs could also induce conformational changes in HSA during the binding process, as indicated by a comparison with the results of the CD experiments.

4. Conclusions

In this study, we investigated the interactions of six PDQLs with HSA via fluorescence spectroscopy, CD and FTIR and found that the PDQLs could bind to HSA at site II (subdomain IIIA), induce conformational and secondary structural changes of HSA and quench the intrinsic fluorescence of HSA in solution through a static quenching mechanism. The quenching of HSA fluorescence occurred with the formation of a 1:1 complex between PDQL and albumin. Furthermore, during the formation of the complex between HSA and PDQL, hydrophobic forces played a significant role. The steric effects of these groups play a major role in enhancing the PDQL-HSA interaction, whereas the electrostatic properties and lipid solubility of a group play only a minor role, according to comparative studies. The studies of the PDQL-HSA interactions showed that substitution with these familiar substituents on the benzene ring could enhance the binding affinity through van der Waals or hydrogen bonding forces, with the isopropyl substitution providing the largest enhancement of the binding affinity. This study provides useful information for further research in the rational design of this series of compounds.

Supplementary Materials

Supplementary materials are available online at https://0-www-mdpi-com.brum.beds.ac.uk/2076-3417/7/2/200/s1.

Acknowledgments

The authors are grateful to the National Natural Science Foundation of China (Nos. 31601657, 31272062, 31572033 and 21602043), the National Key Research and Development Program of China (2016YFD0200205 and 2016YFD0200201-1) and the Anhui Agricultural University Youth Fund Project (2014zr003 and yj2015-25).

Author Contributions

This research was carried on by all authors. Yi Wang, Rimao Hua and Shangzhong Liu designed the theme of the study, as well as manuscript preparation. Meiqing Zhu, Jia Liu, Risong Na, Feng Liu, Xiangwei Wu, Shisuo Fan, Zhen Wang, Dandan Pan and Jun Tang participated in the synthesis of compounds and fluorescence experiments. Qing X. Li contributed to data interpretation and manuscript revision.

Conflicts of Interest

The authors declare no conflict of interest.

References

  1. Alam, P.; Abdelhameed, A.S.; Rajpoot, R.K.; Khan, R.H. Interplay of Multiple Interaction Forces: Binding of Tyrosine Kinase Inhibitor Nintedanib with Human Serum Albumin. J. Photochem. Photobiol. B 2016, 157, 70–76. [Google Scholar] [CrossRef] [PubMed]
  2. Yadav, R.R.; Khan, S.I.; Singh, S.; Khan, I.A.; Vishwakarma, R.A.; Bharate, S.B. Synthesis, Antimalarial and Antitubercular Activities of Meridianin Derivatives. Eur. J. Med. Chem. 2015, 98, 160–169. [Google Scholar] [CrossRef] [PubMed]
  3. Yousef, T.A.; Alduaij, O.K.; Abu El-Reash, G.M.; El Morshedy, R.M. Semiempirical Studies, Spectral Analysis, in vitro Antibacterial and DNA Degradation Studies of Heterocyclic Thiosemicarbazone Ligand and Its Metal Complexes. J. Mol. Liq. 2016, 222, 762–776. [Google Scholar] [CrossRef]
  4. Hemalatha, K.; Madhumitha, G.; Ravi, L.; Khanna, V.G.; Al-Dhabi, N.A.; Arasu, M.V. Binding Mode of Dihydroquinazolinones with Lysozyme and Its antifungal Activity Against Aspergillus Species. J. Photochem. Photobiol. B 2016, 161, 71–79. [Google Scholar] [CrossRef] [PubMed]
  5. Wang, Z.; Wang, M.; Yao, X.; Li, Y.; Tan, J.; Wang, L.; Qiao, W.; Geng, Y.; Liu, Y.; Wang, Q. Design, Synthesis and Antiviral Activity of Novel Quinazolinones. Eur. J. Med. Chem. 2012, 53, 275–282. [Google Scholar] [CrossRef] [PubMed]
  6. Abdel-Aziz, A.A.M.; Abou-Zeid, L.A.; ElTahir, K.E.H.; Mohamed, M.A.; Abu El-Enin, M.A.; El-Azab, A.S. Design, Synthesis of 2,3-disubstituted 4(3H)-quinazolinone Derivatives as Anti-inflammatory and Analgesic Agents: COX-1/2 Inhibitory Activities and Molecular Docking Studies. Bioorg. Med. Chem. 2016, 24, 3818–3828. [Google Scholar] [CrossRef] [PubMed]
  7. Abdel-Aziz, A.A.M.; Abou-Zeid, L.A.; El Tahir, K.E.H.; Ayyad, R.R.; El-Sayed, M.A.A.; El-Azab, A.S. Synthesis, Anti-inflammatory, Analgesic, COX-1/2 Inhibitory Activities and Molecular Docking Studies of Substituted 2-mercapto-4(3H)-quinazolinones. Eur. J. Med. Chem. 2016, 121, 410–421. [Google Scholar] [CrossRef] [PubMed]
  8. Georgey, H.; Abdel-Gawad, N.; Abbas, S. Synthesis and Anticonvulsant Activity of Some Quinazolin-4-(3H)-one Derivatives. Molecules 2008, 13, 2557–2569. [Google Scholar] [CrossRef] [PubMed]
  9. Khattab, S.N.; Haiba, N.S.; Asal, A.M.; Bekhit, A.A.; Amer, A.; Abdel-Rahman, H.M.; El-Faham, A. Synthesis and Evaluation of Quinazoline Amino acid Derivatives as Mono Amine Oxidase (MAO) Inhibitors. Bioorg. Med. Chem. 2015, 23, 3574–3585. [Google Scholar] [CrossRef] [PubMed]
  10. Park, Y.S.; Polovka, M.; Martinez-Ayala, A.L.; González-Aguilar, G.A.; Ham, K.S.; Kang, S.G.; Park, Y.K.; Heo, B.G.; Namiesnik, J.; Gorinstein, S. Fluorescence Studies by Quenching and Protein Unfolding on the Interaction of Bioactive Compounds in Water Extracts of Kiwi Fruit Cultivars with Human Serum Albumin. J. Lumin. 2015, 160, 71–77. [Google Scholar] [CrossRef]
  11. Saeidifar, M.; Mansouri-Torshizi, H.; Saboury, A.A. Biophysical Study on the Interaction between two Palladium(II) Complexes and Human Serum Albumin by Multispectroscopic Methods. J. Lumin. 2015, 167, 391–398. [Google Scholar] [CrossRef]
  12. Sekar, G.; Sugumar, S.; Mukherjee, A.; Chandrasekaran, N. Multiple Spectroscopic Studies of the Structural Conformational Changes of Human Serum Albumin-Essential Oil Based Nanoemulsions Conjugates. J. Lumin. 2015, 161, 187–197. [Google Scholar] [CrossRef]
  13. Zhu, G.; Wang, Y.; Xi, L.; Liu, J.; Wang, H.; Du, L. Spectroscopy and Molecular Docking Studies on the Binding of Propyl Gallate to Human Serum Albumin. J. Lumin. 2015, 159, 188–196. [Google Scholar] [CrossRef]
  14. Galecki, K.; Hunter, K.; Dankova, G.; Rivera, E.; Tung, L.W.; McSherry, K. Experimental and Theoretical Investigation of Bezafibrate Binding to Serum Albumins. J. Lumin. 2016, 177, 235–241. [Google Scholar] [CrossRef]
  15. Ding, F.; Zhao, G.; Chen, S.; Liu, F.; Sun, Y.; Zhang, L. Chloramphenicol Binding to Human Serum Albumin: Determination of Binding Constants and Binding Sites by Steady-state Fluorescence. J. Mol. Struct. 2009, 929, 159–166. [Google Scholar] [CrossRef]
  16. Macmanusspencer, L.A.; Tse, M.L.; Hebert, P.C.; Bischel, H.N.; Luthy, R.G. Binding of Perfluorocarboxylates to Serum Albumin: A Comparison of Analytical Methods. Anal. Chem. 2010, 82, 974–981. [Google Scholar] [CrossRef] [PubMed]
  17. Ding, F.; Diao, J.; Sun, Y.; Sun, Y. Bioevaluation of Human Serum Albumin-Hesperidin Bioconjugate: Insight into Protein Vector Function and Conformation. J. Agric. Food Chem. 2012, 60, 7218–7228. [Google Scholar] [CrossRef] [PubMed]
  18. Ding, F.; Liu, W.; Li, Y.; Zhang, L.; Sun, Y. Determining the Binding Affinity and Binding Site of Bensulfuron-methyl to Human Serum Albumin by Quenching of the Intrinsic Tryptophan Fluorescence. J. Lumin. 2010, 130, 2013–2021. [Google Scholar] [CrossRef]
  19. Huang, S.; Qiu, H.; Lu, S.; Zhu, F.; Xiao, Q. Study on the Molecular Interaction of Graphene Quantum Dots with Human Serum Albumin: Combined Spectroscopic and Electrochemical Approaches. J. Hazard. Mater. 2015, 285, 18–26. [Google Scholar] [CrossRef] [PubMed]
  20. Ding, F.; Diao, J.; Yang, X.; Sun, Y. Structural Analysis and Binding Domain of Albumin Complexes with Natural Dietary Supplement Humic Acid. J. Lumin. 2011, 131, 2244–2251. [Google Scholar] [CrossRef]
  21. Pérez, D.I.; Pistolozzi, M.; Palomo, V.; Redondo, M.; Fortugno, C.; Gil, C.; Felix, G.; Martinez, A.; Bertucci, C. 5-Imino-1,2-4-thiadiazoles and Quinazolines Derivatives as Glycogen Synthase Kinase 3β (GSK-3β) and Phosphodiesterase 7 (PDE7) Inhibitors: Determination of Blood–brain Barrier Penetration and Binding to Human Serum Albumin. Eur. J. Pharm. Sci. 2012, 45, 677–684. [Google Scholar] [CrossRef] [PubMed]
  22. Liu, F.; Wang, Y.; Lv, C.; Wang, L.; Ou, J.; Wang, M.; Liu, S. Impact of Halogen Substituents on Interactions between 2-Phenyl-2,3-dihydroqulinazolin-4(1H)-one Derivatives and Human Serum Albumin. Molecules 2012, 17, 2000–2014. [Google Scholar] [CrossRef] [PubMed]
  23. Wang, Y.; Zhu, M.; Liu, F.; Wu, X.; Pan, D.; Liu, J.; Fan, S.; Wang, Z.; Tang, J.; Na, R.; Li, Q.L.; Hua, R.; Liu, S. Comparative Studies of Interactions between Fluorodihydroquinazolin Derivatives and Human Serum Albumin with Fluorescence Spectroscopy. Molecules 2016, 21, 1373–1386. [Google Scholar] [CrossRef] [PubMed]
  24. Bradford, M.M. A Rapid Method for the Quantitation of Microgram Quantities of Protein Utilizing the Principle of Protein-Dye Binding. Anal. Biochem. 2015, 72, 248–254. [Google Scholar] [CrossRef]
  25. Ding, F.; Liu, W.; Diao, J.; Sun, Y. Characterization of Alizarin Red S binding sites and structural changes on human serum albumin: A biophysical study. J. Hazard. Mater. 2011, 186, 352–359. [Google Scholar] [CrossRef] [PubMed]
  26. Sircar, J.C.; Capiris, T.; Kesten, S.J.; Herzig, D.J. Pyrazolo[5,1-b]quinazolin-9-ones: A New Series of Antiallergic agents. J. Med. Chem. 1981, 24, 735–742. [Google Scholar] [CrossRef] [PubMed]
  27. Fulop, F.; Simeonov, M.; Pihlaja, K. Formation of 1,2-dihydroquinazolin-4(3H)-ones. Reinvestigation of a Recently Reported 1,3,4-benzotriazepine synthesis. Tetrahedron 1992, 48, 531–538. [Google Scholar] [CrossRef]
  28. Bi, S.; Zhao, T.; Zhou, H.; Wang, Y.; Li, Z. Probing the Interactions of Bromchlorbuterol-HCl and Phenylethanolamine A with HSA by Multi-spectroscopic and Molecular Docking Technique. J. Chem. Thermodyn. 2016, 97, 113–121. [Google Scholar] [CrossRef]
  29. Papadopoulou, A.; Green, R.J.; Frazier, R.A. Interaction of Flavonoids with Bovine Serum Albumin: A Fluorescence Quenching Study. J. Agric. Food Chem. 2005, 53, 158–163. [Google Scholar] [CrossRef] [PubMed]
  30. Khan, S.N.; Islam, B.; Yennamalli, R.; Sultan, A.; Subbarao, N.; Khan, A.U. Interaction of Mitoxantrone with Human Serum Albumin: Spectroscopic and Molecular Modeling Studies. Eur. J. Pharm. Sci. 2008, 35, 371–382. [Google Scholar] [CrossRef] [PubMed]
  31. Xue, J.; Chen, Q. The Interaction between Ionic Liquids Modified Magnetic Nanoparticles and Bovine Serum Albumin and the Cytotoxicity to HepG-2 cells. Spectrochim. Acta A Mol. Biomol. Spectrosc. 2014, 120, 161–166. [Google Scholar] [CrossRef] [PubMed]
  32. Lakowicz, J.R. Mechanisms and Dynamics of Fluorescence Quenching. In Principles of Fluorescence Spectroscopy; Springer: Boston, MA, USA, 2006; pp. 331–351. [Google Scholar]
  33. Lakowicz, J.R.; Weber, G. Quenching of Fluorescence by Oxygen. Probe for Structural Fluctuations in Macromolecules. Biochemistry 1973, 12, 4161–4170. [Google Scholar] [CrossRef] [PubMed]
  34. Cacita, N.; Nikolaou, S. Studying the Interaction between Trinuclear Ruthenium Complexes and Human Serum Albumin by Means of Fluorescence Quenching. J. Lumin. 2016, 169, 115–120. [Google Scholar] [CrossRef]
  35. Ghorab, M.M.; Alsaid, M.S.; Al-Dosari, M.S.; El-Gazzar, M.G.; Parvez, M.K. Design, Synthesis and Anticancer Evaluation of Novel Quinazoline-sulfonamide Hybrids. Molecules 2016, 21, 189–200. [Google Scholar] [CrossRef] [PubMed]
  36. Ding, F.; Zhang, L.; Sun, Y.; Diao, J.-X.; Yang, X.-L.; Sun, Y.; Zhang, L. Specificity and Affinity of Phenosafranine Protein Adduct: Insights from Biophysical Aspects. J. Lumin. 2012, 132, 629–635. [Google Scholar] [CrossRef]
  37. Trivedi, V.D.; Vorum, H.; Honore, B.; Qasim, M.A. Molecular Basis of Indomethacin-human Serum Albumin Interaction. J. Pharm. Pharmacol. 1999, 51, 591–600. [Google Scholar] [CrossRef] [PubMed]
  38. Cui, F.; Fan, J.; Li, J.; Hu, Z. Interactions between 1-benzoyl-4-p-chlorophenyl Thiosemicarbazide and Serum Albumin: Investigation by Fluorescence Spectroscopy. Bioorg. Med. Chem. 2004, 12, 151–157. [Google Scholar] [CrossRef] [PubMed]
  39. Tang, K.; Qin, Y.; Lin, A.; Hu, X.; Zou, G. Interaction of Daunomycin Antibiotic with Human Serum Albumin: Investigation by Resonant Mirror Biosensor Technique, Fluorescence Spectroscopy and Molecular Modeling Methods. J. Pharm. Biomed. Anal. 2005, 39, 404–410. [Google Scholar] [CrossRef] [PubMed]
  40. Cheng, F.; Wang, Y.; Li, Z.; Dong, C. Fluorescence Study on the Interaction of Human Serum Albumin with Bromsulphalein. Spectrochim. Acta A Mol. Biomol. Spectrosc. 2006, 65, 1144–1147. [Google Scholar] [CrossRef] [PubMed]
  41. Sjöholm, I.; Ekman, B.; Kober, A.; Ljungstedt-Påhlman, I.; Seiving, B.; Sjödin, T. Binding of Drugs to Human Serum Albumin:XI. The Specificity of Three Binding Sites as Studied with Albumin Immobilized in Microparticles. Mol. Pharmacol. 1979, 16, 767–777. [Google Scholar] [PubMed]
  42. Leckband, D. Measuring the Forces that Control Protein Interactions. Annu. Rev. Biophys. Biomol. Struct. 2003, 29, 1–26. [Google Scholar] [CrossRef] [PubMed]
  43. Ross, P.D.; Subramanian, S. Thermodynamics of Protein Association Reactions: Forces Contributing to Stability. Biochemistry 1981, 20, 3096–3102. [Google Scholar] [CrossRef] [PubMed]
Figure 1. Synthetic route for 6-chloro-1-(3,3-dimethyl-butanoyl)-2-(un)substituted phenyl-2,3-dihydroquinazolin-4(1H)-one (PDQL).
Applsci 07 00200 g001
Figure 2. Fluorescence quenching spectra of HSA in the presence of different concentrations of PDQL at 298 K. λex = 280 nm; the HSA concentration was 1.0 × 10⁻⁶ M; (a–i) PDQL concentrations (×10−6 M) were 0.000, 1.333, 2.667, 4.000, 5.333, 6.667, 8.000, 9.333 and 10.667, respectively. (x) 1.0 × 10⁻⁶ M PDQL only.
Applsci 07 00200 g002
Figure 3. The Stern-Volmer plots for the fluorescence quenching of HSA by PDQL.
Applsci 07 00200 g003
Figure 4. Modified Stern-Volmer plots of PDQL-HSA systems.
Applsci 07 00200 g004
Figure 5. Far-UV circular dichroism (CD) spectra of the PDQL-HSA system: CHSA = 1.0 × 10⁻⁶ M and 1.0 × 10⁻⁶ M HSA + 2.0 × 10⁻⁶ M PDQL.
Applsci 07 00200 g005
Figure 6. FTIR spectra of free HSA (1.0 × 10⁻⁵ M) and the PDQL-HSA complex ((PDQL) = 2.0 × 10⁻⁵ M).
Applsci 07 00200 g006
Table 1. Stern-Volmer quenching constants for the interactions of PDQL with HSA at different temperatures.
CompoundT (K)KSV (×104 M−1)Kq (×1012 M−1·s−1)R aSD b
R = H2982.7692.7690.999560.00322
3072.9762.9760.999330.00424
3163.2683.2680.999190.00513
R = CH32984.2284.2280.999420.00562
3074.3374.3370.999240.00660
3164.5134.5130.999030.00776
R = OCH32984.0624.0620.999480.00512
3074.2804.2800.998890.00788
3164.4784.4780.998690.00896
R = CN2984.9614.9610.999340.00705
3075.0885.0880.998470.01100
3165.2145.2140.998240.01209
R = CF32983.4363.4360.999280.00511
3073.5073.5070.999210.00545
3163.6233.6230.998920.00658
R = CH(CH3)22984.3264.3260.999390.00589
3074.4234.4230.998940.00795
3164.5934.5930.998520.00975
a R is the correlation coefficient; b SD is the standard deviation for the KSV values.
Table 2. Binding constants of PDQL to HSA.
CompoundT (K)Ka (×104 M−1)nR aSD b
R = H2982.157940.993140.999450.01088
3072.343650.984230.999470.01059
3162.546370.974920.999280.01220
R = CF32983.523951.030960.999590.00978
3073.723921.028210.999660.00884
3163.903691.042610.999530.01056
R = OCH32983.570391.003010.999490.01055
3073.793931.015490.999180.01354
3164.062751.019810.999090.01435
R = CH(CH3)22985.167901.058120.999650.00921
3075.313041.062990.999610.00976
3165.468791.067130.999470.01149
R = CH32983.583070.990550.999430.01102
3073.696900.991080.999370.01160
3163.781310.996730.998950.01511
R = CN2984.795851.020420.999590.00962
3074.951091.038490.999230.01343
3165.083991.047160.998960.01578
a R is the correlation coefficient; b SD is the standard deviation for the n values.
Table 3. Effects of the site probes on the binding constants of PDQL to HSA.
CompoundSite MarkerKa (×104 M−1)R aSD b
R = HBlank2.157940.999490.26651
PB1.876450.999620.2702
FA1.041350.999480.25962
Dig2.176230.999380.24163
R = CF3Blank3.523950.999850.12641
PB3.441650.999710.18126
FA3.035070.999850.18132
Dig4.027410.999760.15165
R = OCH3Blank3.570390.999650.15519
PB2.898550.999410.22308
FA2.450950.999770.15596
Dig3.724780.999360.20352
R = CH(CH3)2Blank5.167900.999770.13434
PB4.503950.999940.07291
FA2.919380.999530.22246
Dig5.087740.999950.05945
R = CH3Blank3.583070.999540.16563
PB3.433020.999640.16227
FA2.952640.999870.11889
Dig3.752530.999430.18557
R = CNBlank4.795850.999870.08076
PB4.798390.999900.07751
FA3.286330.999340.19871
Dig5.002480.999520.14806
a R is the correlation coefficient; b SD is the standard deviation for the Ka values.
Table 4. Van ’t Hoff plots of PDQL-HSA systems.
CompoundVan ’t HoffR aSD b
R=HY = 12.88527 − 866.16/T0.999750.00264
R=CF3Y = 12.26971 − 536.08/T0.999710.00175
R=OCH3Y = 12.74821 − 675.57/T0.998450.00509
R = CH(CH3)2Y = 11.84592 − 296.08/T0.999440.00133
R=CH3Y = 11.43527 − 282.37/T0.997420.00274
R=CNY = 11.80447 − 305.68/T0.999490.00132
a R is the correlation coefficient; b SD is the standard deviation.
Table 5. Thermodynamic parameters of PDQL-HSA binding systems at different temperatures.
CompoundT (K)Ka (×104 M−1)R aΔH (kJ·mol−1)ΔG (kJ·mol−1)ΔS (Jmol−1·K−1)
R = H2982.157940.999497.20125−24.7229107.1281
3072.343650.99969−25.6871
3162.546370.99963−26.6513
R = CF32983.523950.999854.45697−25.9421102.0104
3073.723920.99994−26.8602
3163.903690.99980−27.7783
R = OCH32983.570390.999655.61669−25.9679105.9886
3073.793930.99944−26.9218
3164.062750.99961−27.8757
R = CH(CH3)22985.167900.999772.41609−26.933098.4869
3075.313040.99984−27.8194
3165.468790.99990−28.7058
R=CH32983.583070.999542.34762−25.984195.0728
3073.696900.99958−26.8397
3163.781310.99925−27.6954
R=CN2984.795850.999872.54142−26.705098.1424
3074.951090.99968−27.5883
3165.083990.99959−28.4716
a R is the correlation coefficient.
Table 6. Values of ΔΔH and ΔΔS.
CompoundΔΔH (kJ·mol−1)ΔΔS (Jmol−1·K−1)
R = CF3−2.74428−5.1177
R = OCH3−1.58456−1.1395
R = CH(CH3)2−4.78516−8.6412
R = CH3−4.85363−12.0553
R = CN−4.65983−8.9857
Table 7. Values of ΔΔG at the relevant temperature.
T (K)ΔΔG (kJ·mol−1)
R = CF3R = OCH3R = CH(CH3)2R = CH3R = CN
298−1.2192−1.2450−2.2101−1.2612−1.9821
307−1.1731−1.2347−2.1323−1.1526−1.9012
316−1.1270−1.2226−2.0527−1.0441−1.8203
Table 8. Conformation changes in the secondary structure of HSA with and without PDQL.
SampleSecondary Structure (%)
α-Helixβ-Sheetβ-TurnRandom Coil
HSA38.823.611.026.6
HSA + 3a (1:2)35.822.714.227.2
HSA + 3b (1:2)37.824.710.726.8
HSA + 3c (1:2)36.424.411.128.1
HSA + 3d (1:2)36.420.014.828.8
HSA + 3e (1:2)36.822.212.428.5
HSA + 3f (1:2)33.714.519.532.2

