Article

Ultrasonic Techniques for Air Void Size Distribution and Property Evaluation in Both Early-Age and Hardened Concrete Samples

1
Department of Civil and Environmental Engineering, Michigan Technological University, Houghton, MI 49931-1295, USA
2
Department of Mechanical Engineering and Engineering Mechanics, Michigan Technological University, 1400 Townsend Drive, Houghton, MI 49931-1295, USA
*
Author to whom correspondence should be addressed.
Submission received: 19 January 2017 / Revised: 6 March 2017 / Accepted: 8 March 2017 / Published: 16 March 2017
(This article belongs to the Special Issue Advanced Asphalt Materials and Paving Technologies)

Abstract

:
Entrained air voids can improve the freeze-thaw durability of concrete, and also affect its mechanical and transport properties. Therefore, it is important to measure the air void structure and understand its influence on concrete performance for quality control. This paper aims to measure air void structure evolution at both early-age and hardened stages with the ultrasonic technique, and evaluates its influence on concrete properties. Three samples with different air entrainment agent content were specially prepared. The air void structure was determined with optimized inverse analysis by achieving the minimum error between experimental and theoretical attenuation. The early-age sample measurement showed that the air void content with the whole size range slightly decreases with curing time. The air void size distribution of hardened samples (at Day 28) was compared with American Society for Testing and Materials (ASTM) C457 test results. The air void size distribution with different amount of air entrainment agent was also favorably compared. In addition, the transport property, compressive strength, and dynamic modulus of concrete samples were also evaluated. The concrete transport decreased with the curing age, which is in accordance with the air void shrinkage. The correlation between the early-age strength development and hardened dynamic modulus with the ultrasonic parameters was also evaluated. The existence of clustered air voids in the Interfacial Transition Zone (ITZ) area was found to cause severe compressive strength loss. The results indicated that this developed ultrasonic technique has potential in air void size distribution measurement, and demonstrated the influence of air void structure evolution on concrete properties during both early-age and hardened stages.

1. Introduction

As an important phase existing in the concrete, the air void content can significantly affect the physical properties of concrete, including the compressive strength [1], elastic modulus [2,3], permeability [4], and long-term freeze-thaw durability [5]. During the concrete construction, the air void content needs to be properly designed and controlled for appropriate property. Also, the influence of air void content on the concrete properties development during both early-age and hardened stages needs to be investigated.
The ultrasonic scattering method has been used to analyze hardened concrete air void characteristics by different researchers. For instance, Zhang [6] studied the microstructure evolution of cementitious material with the ultrasonic methods. Based on the ultrasonic monitoring results, the influences of mineral admixture type, steel fiber content, and curing temperature on the microstructure development were discussed. Zhu [7] analyzed the relationships between the ultrasonic wave speed and the existing air voids in cement paste. Particularly, the air voids can obviously decrease the compressional wave speed, while the influence of air void content on the shear wave speed was insignificant. Liu [8] analyzed the early-age concrete microstructure evolution with the measured ultrasonic pulse speed. The influences of the water/cement ratio, mixtures, and aggregates gradation on the microstructure were analyzed. Lai [9] applied the ultrasonic surface wave to detect the honeycomb defects existed in concrete during early stage. The results demonstrated that the honeycomb can cause obvious spectra dispersion of the surface wave. Punurai [10] analyzed the volume content of capillary pores and air voids in hardened cement pastes with ultrasonic measurement. The results were comparable to the traditional petrographic methods based on American Society for Testing and Materials (ASTM) C457 [11]. Sun [12] employed the log-normal distribution for the description of air void size distribution, and obtained the inversed air void size distribution based on the scattering attenuation calculation. Yim [13] quantified the air void size distribution by ultrasonic attenuation calculation with the Roney equation [14]. The three-dimensional characteristics of air voids were determined through the inverse analysis, with the result verified by the ASTM C457 test [11]. Guo [15] compared different distribution functions for the description of hardened concrete air void size distribution. Based on the verification with the ASTM C457 test, the combination of normal distribution for small air voids and log-normal distribution for large air voids performs better. Currently, the application of ultrasonic measurements on the air void content evolution during early stages has not been conducted to the best of the authors’ knowledge.
Besides the application on concrete air void structure analysis, the ultrasonic scattering technique has also been employed to investigate concrete properties evolution during both early-age and hardened stages. Boumiz [16] applied ultrasonic measurements to study the properties of early-age cement pastes and mortars. Particularly, the elastic modulus and Poisson’s ratio were determined acoustically. Jerome [17] monitored the setting process of mortar samples with the ultrasonic technique. The shear wave velocity was found more appropriate to determine the final setting time than the compression wave velocity. The method was further applied on the concrete samples [18], and the effect of aggregate on the setting process was also analyzed. Subramaniam [19] studied the steel reinforced concrete with the ultrasonic measurement. The wave reflection factor at the steel–concrete interface was calculated and its relationship to strength gain was also analyzed. Qixian [20] predicted the dynamic modulus of concrete with the measured surface wave velocity. The calculated dynamic modulus was in good accordance with the measured results through the resonance method. Trtnik [21] proposed the TG (Trtnik Gregor) parameter for the strength gain prediction, which is the peak value ratio between the high frequency and low frequency range of the transmission signal in the frequency domain. The TG parameter was found to be strongly linearly correlated to the strength gain during the first eight hours. The TG parameter also became stable after the first several curing hours; thus, it cannot be used for the strength gain prediction during the early stages (1–28 days). The ultrasonic pulse velocity (UPV) has also been used to monitor the hardening behavior. The UPV-based models were found to be especially suitable for the early age property prediction [22].
The influence of the air void structure on the concrete properties has already been widely studied [23], but the study on the influence of the air void structure evolution of concrete performance is relatively limited. Wong [24] studied the influence of entrained air voids on the concrete transport ability. It is reported that the entrained air void can decrease or increase the concrete transport ability, depending on saturation level. Gutmann [25] studied the strength loss due to the entrained air bubbles in concrete. The compressive strength was found to decrease, with [26] analyzing the effect of air void clustering on concrete strength loss. It is found that the strength loss was mainly caused by the total air content, rather than the air void clustering; this is contradictory to the findings of Hover [27]. Currently, research on how the transport ability is evaluated during curing age is limited, and the effect of air void clustering on compressive strength is still not clear.
This paper aims to monitor the air void structure evolution and the change of concrete properties during the early-age and hardened stages. Three concrete samples with the same mix design but different air entrainment agent dosages were prepared. The ultrasonic scattering measurements were conducted during early-age and hardened stages to detect the air void structure evolution. The experimental attenuation was obtained based on the wave spectral ratio of the first and the second transmission waves in the frequency domain. The method is following the former study [15] on hardened concrete samples by employing the combination of normal and log-normal distribution. The theoretical attenuation was then calculated with the obstacle scattering theory, by integrating the pre-determined cement paste, aggregate attenuation, and air void distribution effects. The inverse analyses were conducted to determine air void distribution parameters by achieving the minimum error between theoretical and experimental attenuations. The ultrasonic measured air void distribution was then verified with the ASTM C 457 [11] test results at Day 28. The influence of air void structure evolution on concrete properties were also evaluated in this study, including transport ability, compressive strength, and dynamic modulus. The transport ability was evaluated with the electrical resistivity measurement. The experimental measurements on compressive strength and ultrasonic parameters were fitted with linear relations at early stages. The dynamic modulus predicted with ultrasonic parameters was also compared with ASTM C 215 measurement of hardened concrete.

2. Attenuation-Based Ultrasonic Scattering Measurement Method

2.1. Theoretical Attenuation

The obstacle scattering theory built by Ying [28] was applied for the theoretical ultrasonic scattering calculation. This theory is based on a motion equation, which describes the wave function in homogeneous solid materials. Particularly, the wave function can be obtained by solving the motion equation, and represented with the Bessel function. The total energy loss can be obtained by the integration of the scattered wave and represented as the item scattering cross section γ S c a . In this research, both the aggregates and the air voids are considered as spherical obstacles. Then, assuming the obstacles inside concrete do not interact with each other [12], the total theoretical attenuation can be depicted as Equation (1).
α f = ( 1 ϕ ) α a , f + 1 2 i = 1 m 1 n i 1 γ i 1 , f S c a + 1 2 i = 1 m 2 n i 2 γ i 2 , f S c a
where α f is the total concrete sample attenuation coefficient (Nepper/m); ϕ is the combined volume fraction of the air voids and aggregate (%); α a , f is the attenuation coefficient of the viscoelastic cement paste (Nepper/m); n i 1 and n i 2 are the numbers of a certain size aggregate and air void per volume respectively; γ i 1 , f S c a and γ i 2 , f S c a represent the corresponding scattering cross sections of the aggregate and air voids respectively.

2.1.1. Attenuation Generated by Cement Paste and Aggregates

The attenuation generated by the cement paste matrix α a , f can be directly measured with the ultrasonic scattering measurement on the separately prepared cement paste with the same water/cement ratio. The aggregate size distribution G ( a i 1 ) can be determined with the designed aggregate aggregation. Then, the corresponding amount of a certain size aggregate per unit volume n i can be deduced as shown in Equation (2). Introducing Equation (2) into Equation (1), the theoretical attenuation generated by the aggregate can be determined as depicted in Equation (3).
n i 1 = [ [ G ( a i 1 ) G ( a i 1 1 ) ] ϕ 1 ] / 4 3 π a i 1 3
α f , a g g r e g a t e = 1 2 i = 1 m 1 [ [ G ( a i 1 ) G ( a i 1 1 ) ] ϕ i 1 γ i 1 , f S c a ] / 4 3 π a i 1 3
where ϕ 1 is the volume fraction of the total aggregate (%); a i 1 , ϕ i 1 and n i 1 represent the size, volume fraction and count per volume of a certain type aggregate; α f , a g g r e g a t e is the theoretical attenuation of the aggregate (Nepper/m).

2.1.2. Attenuation Generated by Air Voids

The normal and log-normal distribution are desirable to characterize the size distribution of small air voids and large air voids respectively [15]. The combination of the normal and log-normal distribution function is depicted in Equation (4). The detailed normal and log-normal distributions are shown as Equations (5) and (6) respectively
f = ϕ 21 × f n o r m ( r n o r m ; μ n o r m , σ n o r m ) + ϕ 22 × f l o g n o r m ( r l o g n o r m ; μ l o g n o r m , σ l o g n o r m )
where f represents the distribution function for the whole air void structure; r n o r m , μ n o r m , σ n o r m are the radius of the air void, mean value, and standard deviation of the norm size distribution, respectively; r l o g n o r m , μ l o g n o r m , σ l o g n o r m represent the corresponding parameters for the log-normal distribution. The volume fractions of small air voids and large air voids are ϕ 21 and ϕ 22 , respectively ( ϕ 2 = ϕ 12 + ϕ 22 ).
f n o r m ( r n o r m ; μ n o r m , σ n o r m ) = ( 1 / 2 π σ n o r m 2 ) exp [ ( r n o r m μ n o r m ) 2 / 2 σ n o r m 2 ]
f l o g n o r m ( r l o g n o r m ; μ l o g n o r m , σ l o g n o r m ) = ( 1 / 2 π σ l o g n o r m 2 ) exp [ ( ln r l o g n o r m μ l o g n o r m ) 2 / 2 σ l o g n o r m 2
where f n o r m ( r n o r m ; μ n o r m , σ n o r m ) and f l o g n o r m ( r l o g n o r m ; μ l o g n o r m , σ l o g n o r m ) represent the normal distribution and log-normal distribution separately, and r n o r m , μ n o r m , σ n o r m are the radius of the air void, mean value, and standard deviation of the norm size distribution, respectively, while r l o g n o r m , μ l o g n o r m , σ l o g n o r m represent those parameters for the log-normal distribution.
Then, the corresponding cumulative function for a certain size air void can be represented as F 2 ( a i 2 ) through the integration of distribution function f 2 ( a i 2 ) . Similar to the analysis of aggregate attenuation above, the amount of a certain size air void per unit volume n i 2 can be deduced as shown in Equations (7) and (8). Particularly, the air void size distribution function is divided by F 2 ( a N 2 ) F 2 ( a 12 ) for normalization, where a N 2 and a 12 represent the largest and smallest air void size respectively.
ϕ i 2 = [ F 2 ( a i 2 ) F 2 ( a i 2 1 ) ] ϕ 2 / [ F 2 ( a N 2 ) F 2 ( a 12 ) ]
n i 2 = [ F 2 ( a i 2 ) F 2 ( a i 2 1 ) ] ϕ 2 / [ F 2 ( a N 2 ) F 2 ( a 12 ) ] 4 3 π a i 2 2
where ϕ 2 is the volume fractions of the air void ( ϕ 1 + ϕ 2 = 1 ϕ ).
Introducing Equation (9) into Equation (1), the total theory attenuation can be linked to the air voids’ size distribution and aggregate gradation as illustrated in Equation (9).
α f , a i r v o i d = 1 2 i = 1 m 2 [ F 2 ( a i 2 ) F 2 ( a i 2 1 ) ] ϕ i 2 γ i 2 , f S c a / [ F 2 ( a N 2 ) F 2 ( a 12 ) ] 4 3 π a i 2 3

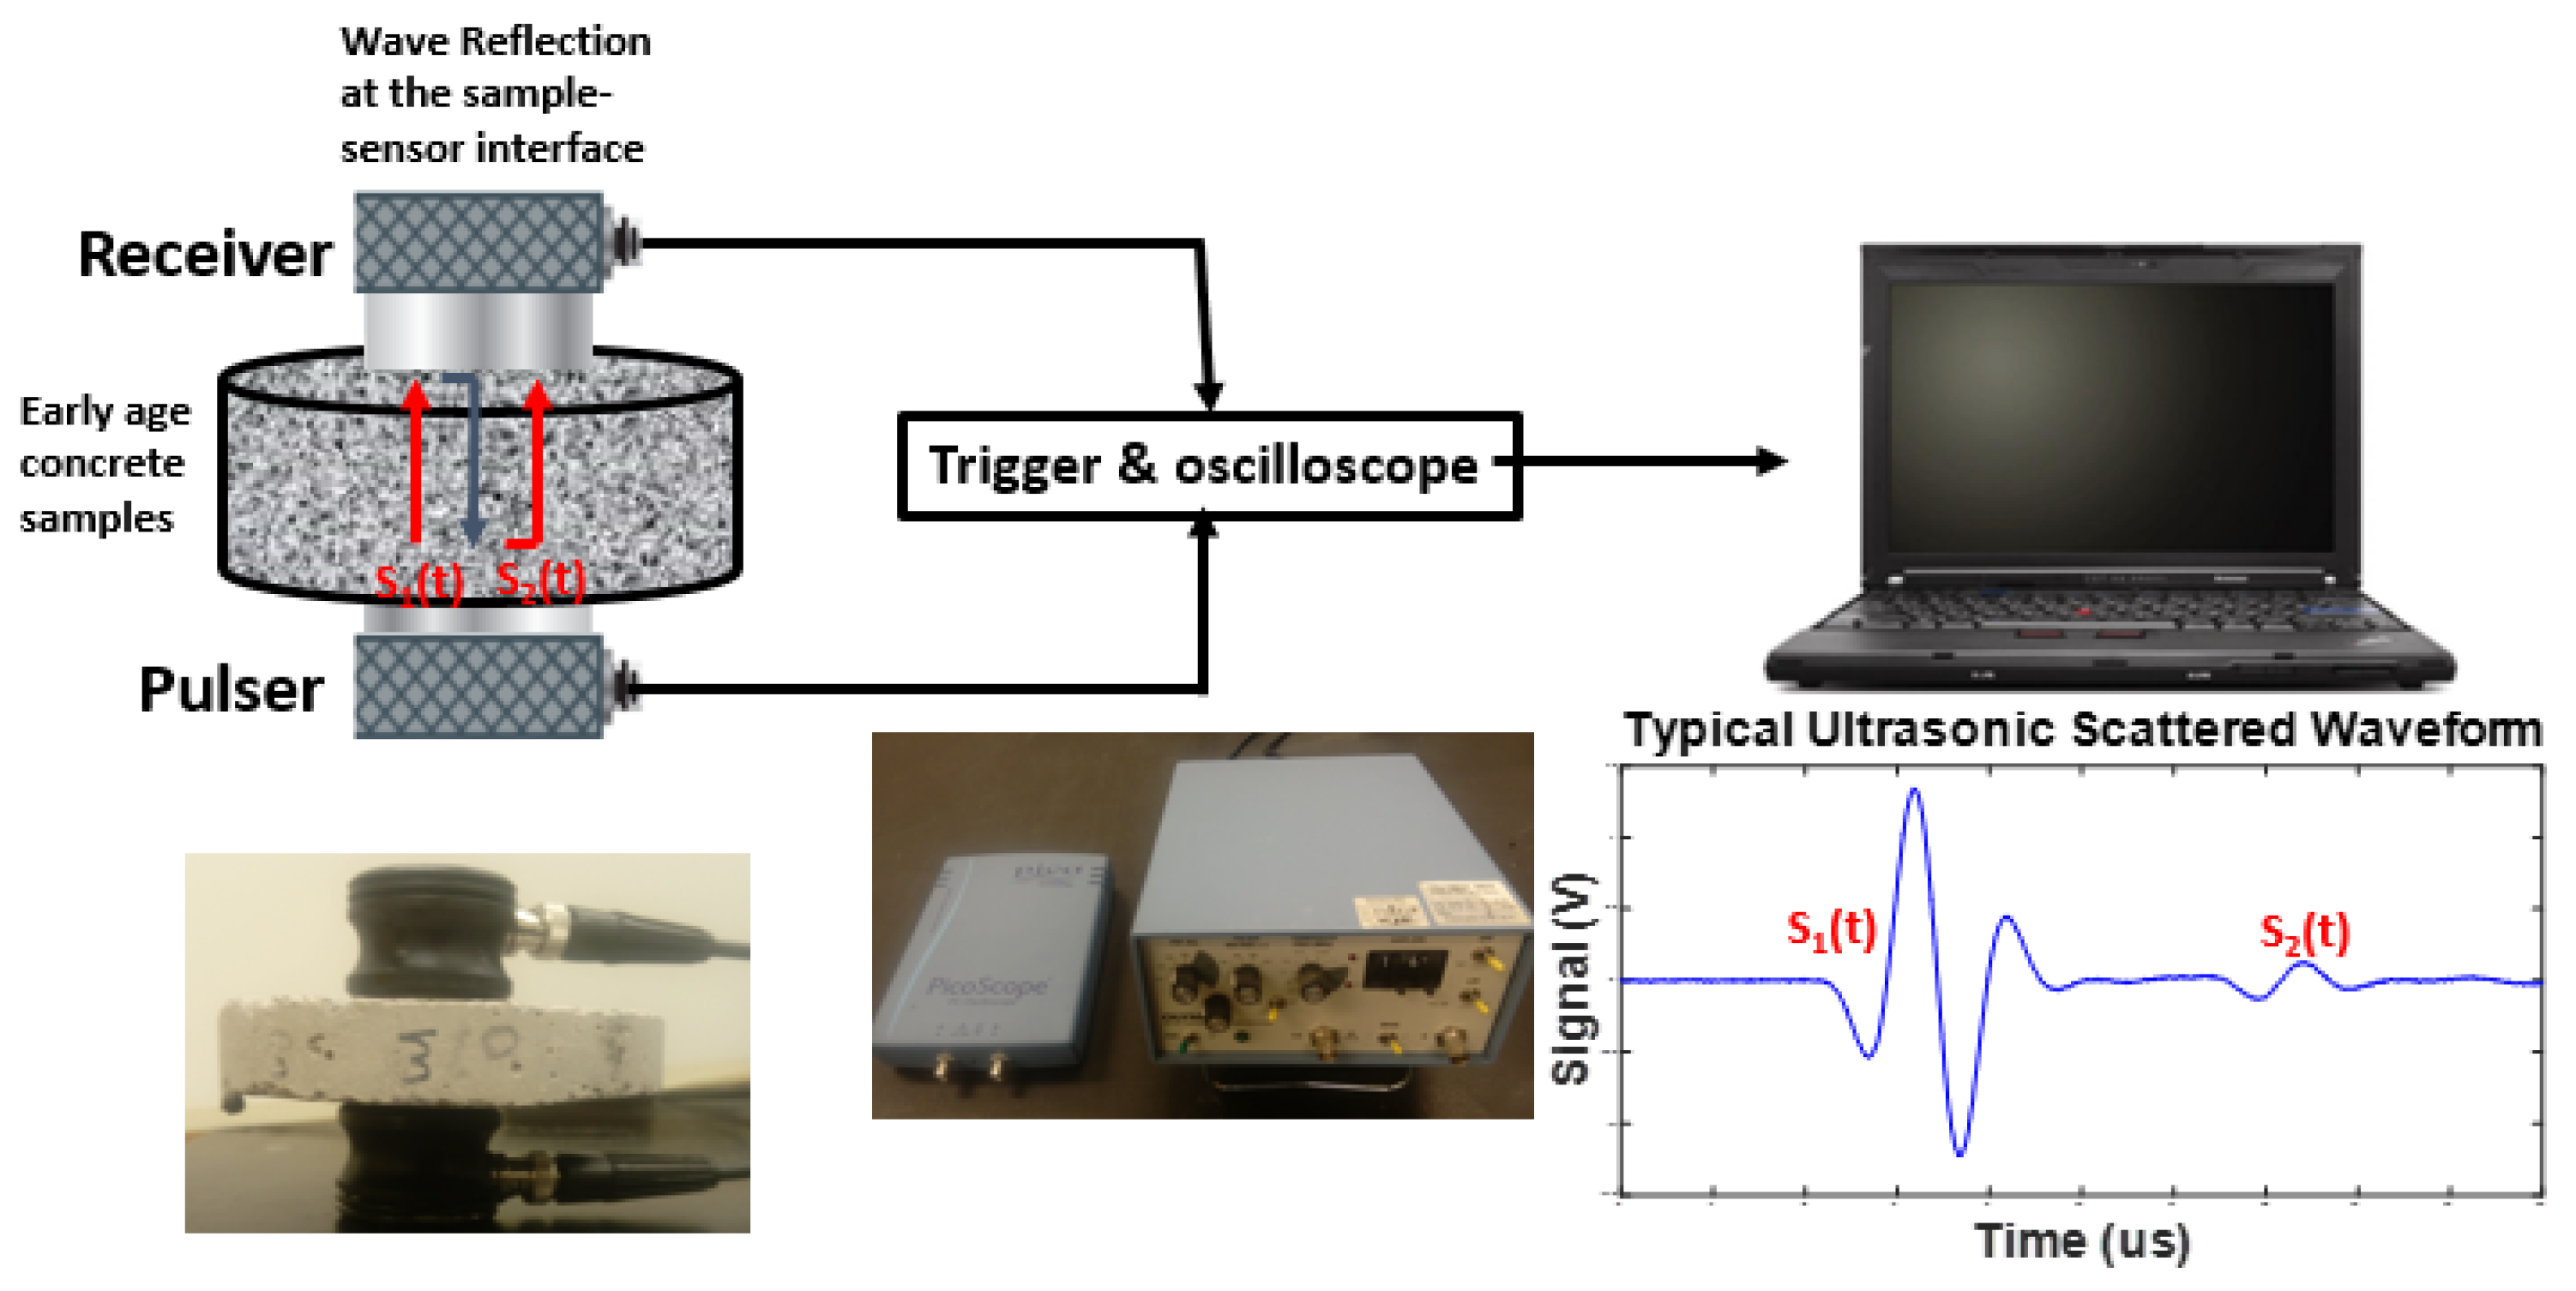
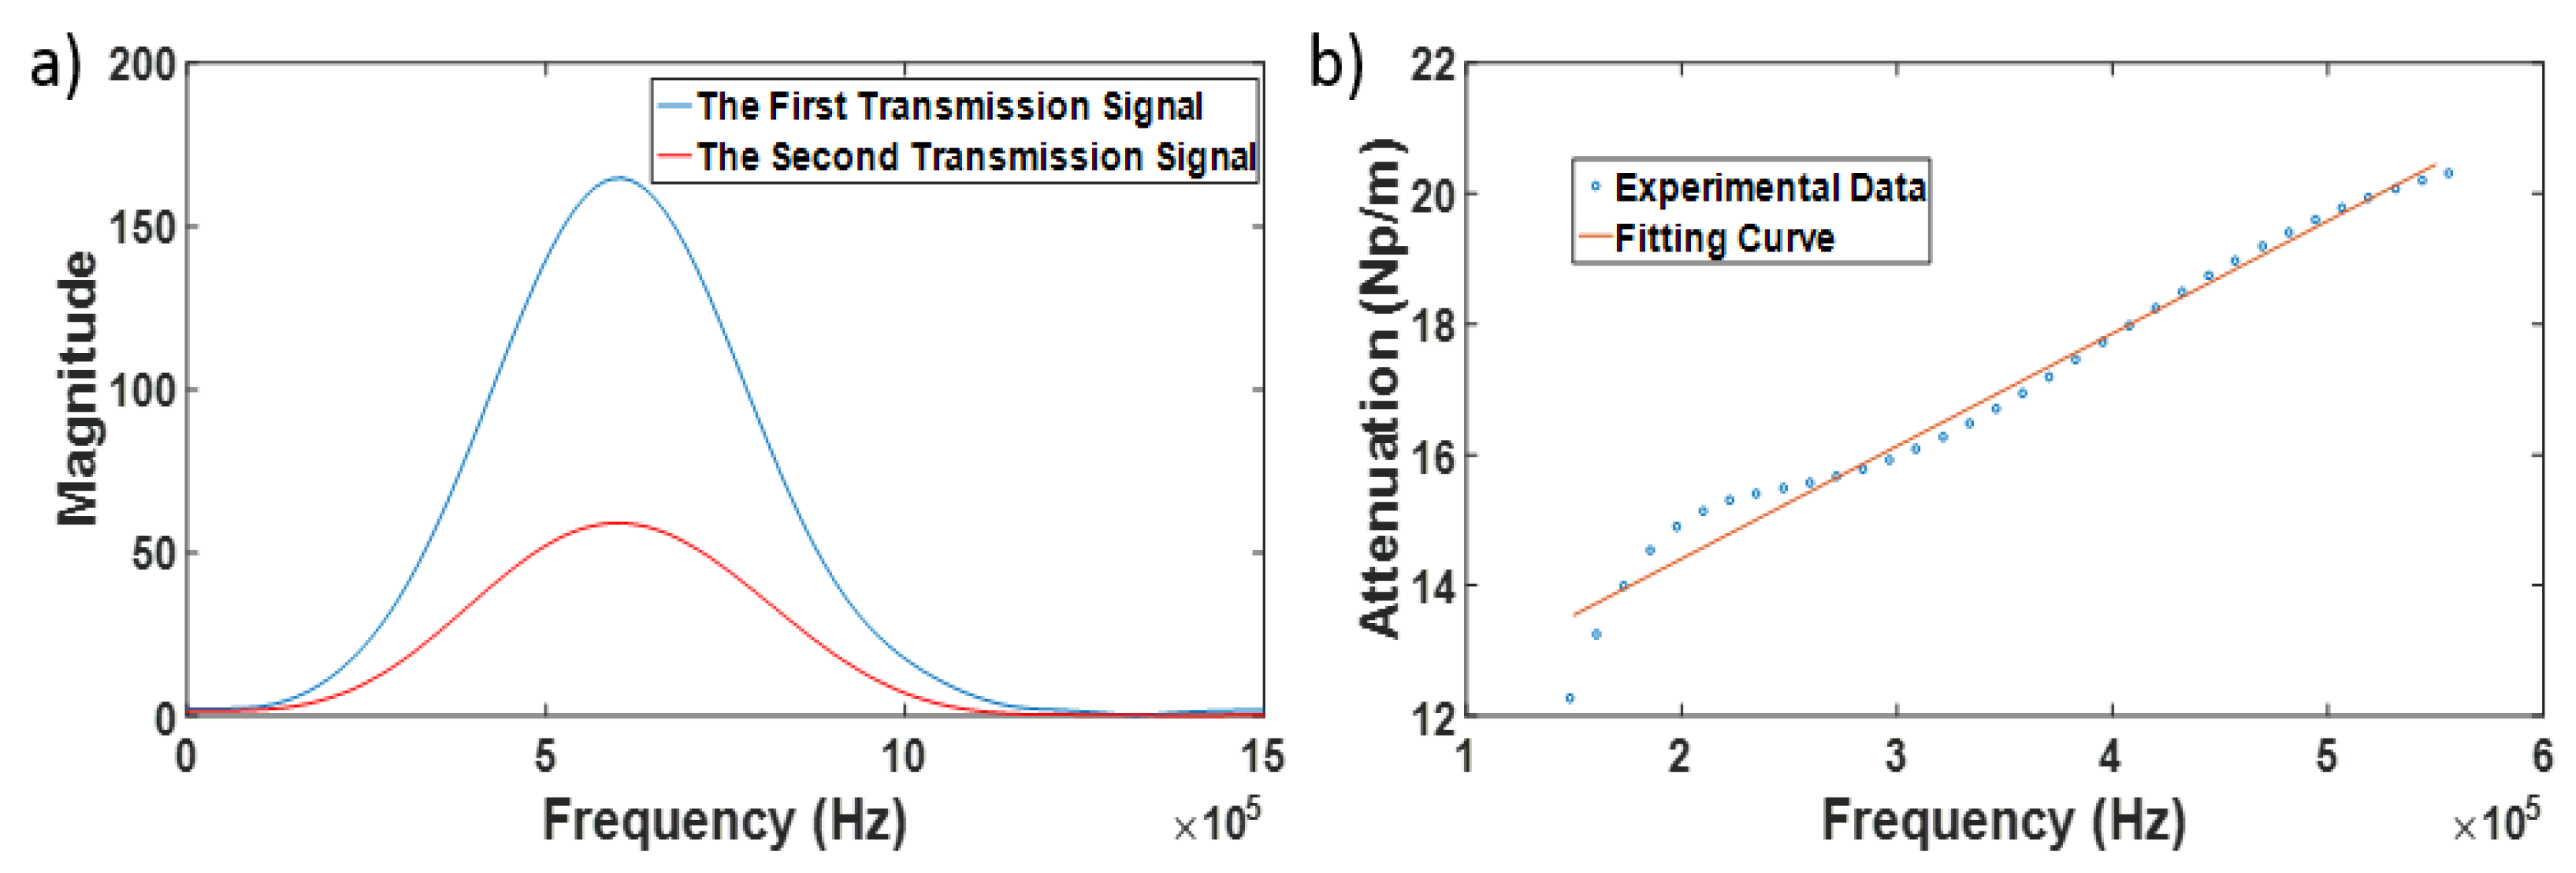
2.2. Experimental Setup and Experimental Attenuation Measurement

The basic setup for ultrasonic scattering measurement is demonstrated in Figure 1. The two Olympus 5077 transducers (Olympus Co., Center Valley, PA, USA) are located on the opposite sides of the concrete specimen (Prepared by the authors in Benedict Lab, Houghton, MI, USA) as the pulser and receiver separately. The couplant B2 from Olympus (Center Valley, PA, USA) was also used to mitigate the coupling effect between the specimen surface and ultrasonic transducers. The ultrasonic wave centered at 500 kHz frequency is applied in this study, which is appropriate for the detection of the air voids and has been used in the concrete study by different researchers [29,30]. Ultrasonic waves generated by the excitation voltage can transmit through the specimen and keep being reflected at the transducer–specimen interface. The wave signal captured by the receiver transducer is recorded by an oscilloscope (Olympus Co., Center Valley, PA, USA) and displayed on a computer (Dell Co., Round Rock, TX, USA). Particularly, the first two transmission waves S1(t) and S2(t), as shown in Figure 1, are used for the experimental attenuation calculation.
The first and second transmission waves referred to as S1 and S2 were first converted from the time domain to the frequency domain by Fast Fourier Transform on MATLAB (R2015a, MathWorks Co., Natick, MA, USA), as shown in Figure 2. It is clear that the amplitude of S2 is significantly reduced along the whole frequency range compared to the first transmission wave S1. The experimental attenuation is estimated from Equation (10) proposed by Sears [31]. The irrelevant attenuation caused by the wave diffraction was eliminated by using the diffraction correlations as shown in Equation (10).
α ( f ) = 1 2 d [ ln ( s 1 ( f ) s 2 ( f ) ) ln ( D ( s ; d ) D ( s ; 3 d ) ) ]
where α ( f ) is the experimental attenuation of the specimen, which is expressed with wave frequency f ; d is the specimen thickness; and s 1 ( f ) and s 2 ( f ) are the first and second transmission waves respectively. D ( s ; d ) and D ( s ; 3 d ) are proposed by Rogers and Buren [32], which are the simplified closed-form expressions for the diffraction correction.
Before the investigation of ultrasonic attenuation on the concrete specimen, the attenuation measurement from the ultrasonic test setup was validated with a thin polymethylmethacrylate sample. The sample was placed between the “pulser” and “receiver” transducers, and the couplant was also used to reduce the coupling effect. The first and second transmission waves were recorded and converted to the frequency spectrum with Fourier transformation for attenuation calculation. The attenuation was calculated with Equation (10) and the measurement results are shown in Figure 3. The relationship between ultrasonic attenuation and wave frequency is demonstrated by the fitting curve of y = 1.725 × 10 5 × x + 10.958 , where x and y represent the wave frequency (Hz) and wave attenuation (Np/m), respectively. The transmission speed can also be measured based on the arrival time of the first transmission signal and the sample thickness. The measured transmission speed is 2717 m/s; the corresponding attenuation per wavelength can then be calculated as 0.0469 NP. The results are close to the measured values (2782 m/s and 0.045 NP) in reference [10], and the published values (2750 m/s and 0.041 NP) in reference [33], which demonstrate the accuracy of attenuation measurement from this system.

2.3. Inverse Analysis to Determine Air Void Distribution Functions

According to Equation (1), the total theoretical attenuation includes the viscoelastic property of cement paste and the obstacle effect of the aggregate and air voids. The cement paste prepared with the same water/cement ratio was measured with the same method as shown in Figure 1. The corresponding cement paste attenuation was used as the viscoelastic matrix attenuation α a , f as shown in Equation (1). Based on Equation (6), the attenuation generated by the aggregate can be calculated with the designed aggregate gradation. Then, the total theoretical attenuation can be determined and compared with the experimental attenuation estimated from Equation (10). The air voids’ size distribution parameters can be obtained by achieving the minimum error between experimental and theoretical attenuations.

3. Ultrasonic Measurement of Air Void Distribution in Early-Age Concrete

3.1. Sample Preparation and Early-Age Property Measurement

Three different types of concrete samples were prepared based on the ASTM C192/C192M-16a [34] during this study. To focus on the influence of the air entrainment agent on the air void structure, the samples were prepared with the same mix design but different air entrainment agent dosages. MasterAir AE 200 type air entrainment agent (BASF Co., Florham Park, NJ, USA) was chosen in this study. The detailed mix design for three types of concrete are shown in Table 1. The volume percentage of size three-quarters (19 mm), one-half (12.5 mm), three-eighths (9.5 mm), No. 4 (4.75 mm), No. 8 (2.36 mm) and No. 16 (1.18 mm) coarse aggregate are 5%, 25%, 25%, 20%, 16% and 9% respectively. Particularly, the fine aggregates belong to the No. 8 (2.36 mm) sieve size. After mixing, the specific gravity of each sample was measured and used for the air void volume fraction calculation based on the ASTM C138 [35]. Then, the fresh concrete was placed into cylinder molds (Humboldt Mfg. Co., Elgin, IL, USA) with 10.16 cm (4 in) diameter and 20.32 cm (8 in) height. After demolding at 24 h, the concrete samples were submerged into water and cured at room temperature for 28 days. Before the tests at each curing age, the samples were first air dried for 12 h to remove the extra water. Besides the ultrasonic scattering measurement, the compressive strength and electrical resistivity tests were also conducted at Day 3, 7 and 28. The compressive strength test was conducted based on the ASTM C39/C39M-16 [36] standard. The bulk electrical resistivity of the concrete sample was measured with the Rcon2 [37] equipment from Giatec Scientific Co. (Ottawa, ON, Canada). Considering the transmission ability of the ultrasonic wave, the concrete cylinder was cut with a diamond saw to obtain slices of around 2.54 cm (1 in) in height for measurement. The selection of thickness partly depended on the penetration ability of the ultrasonic source; the first two signals will not overlap with each other at the thickness of 2.54 cm.

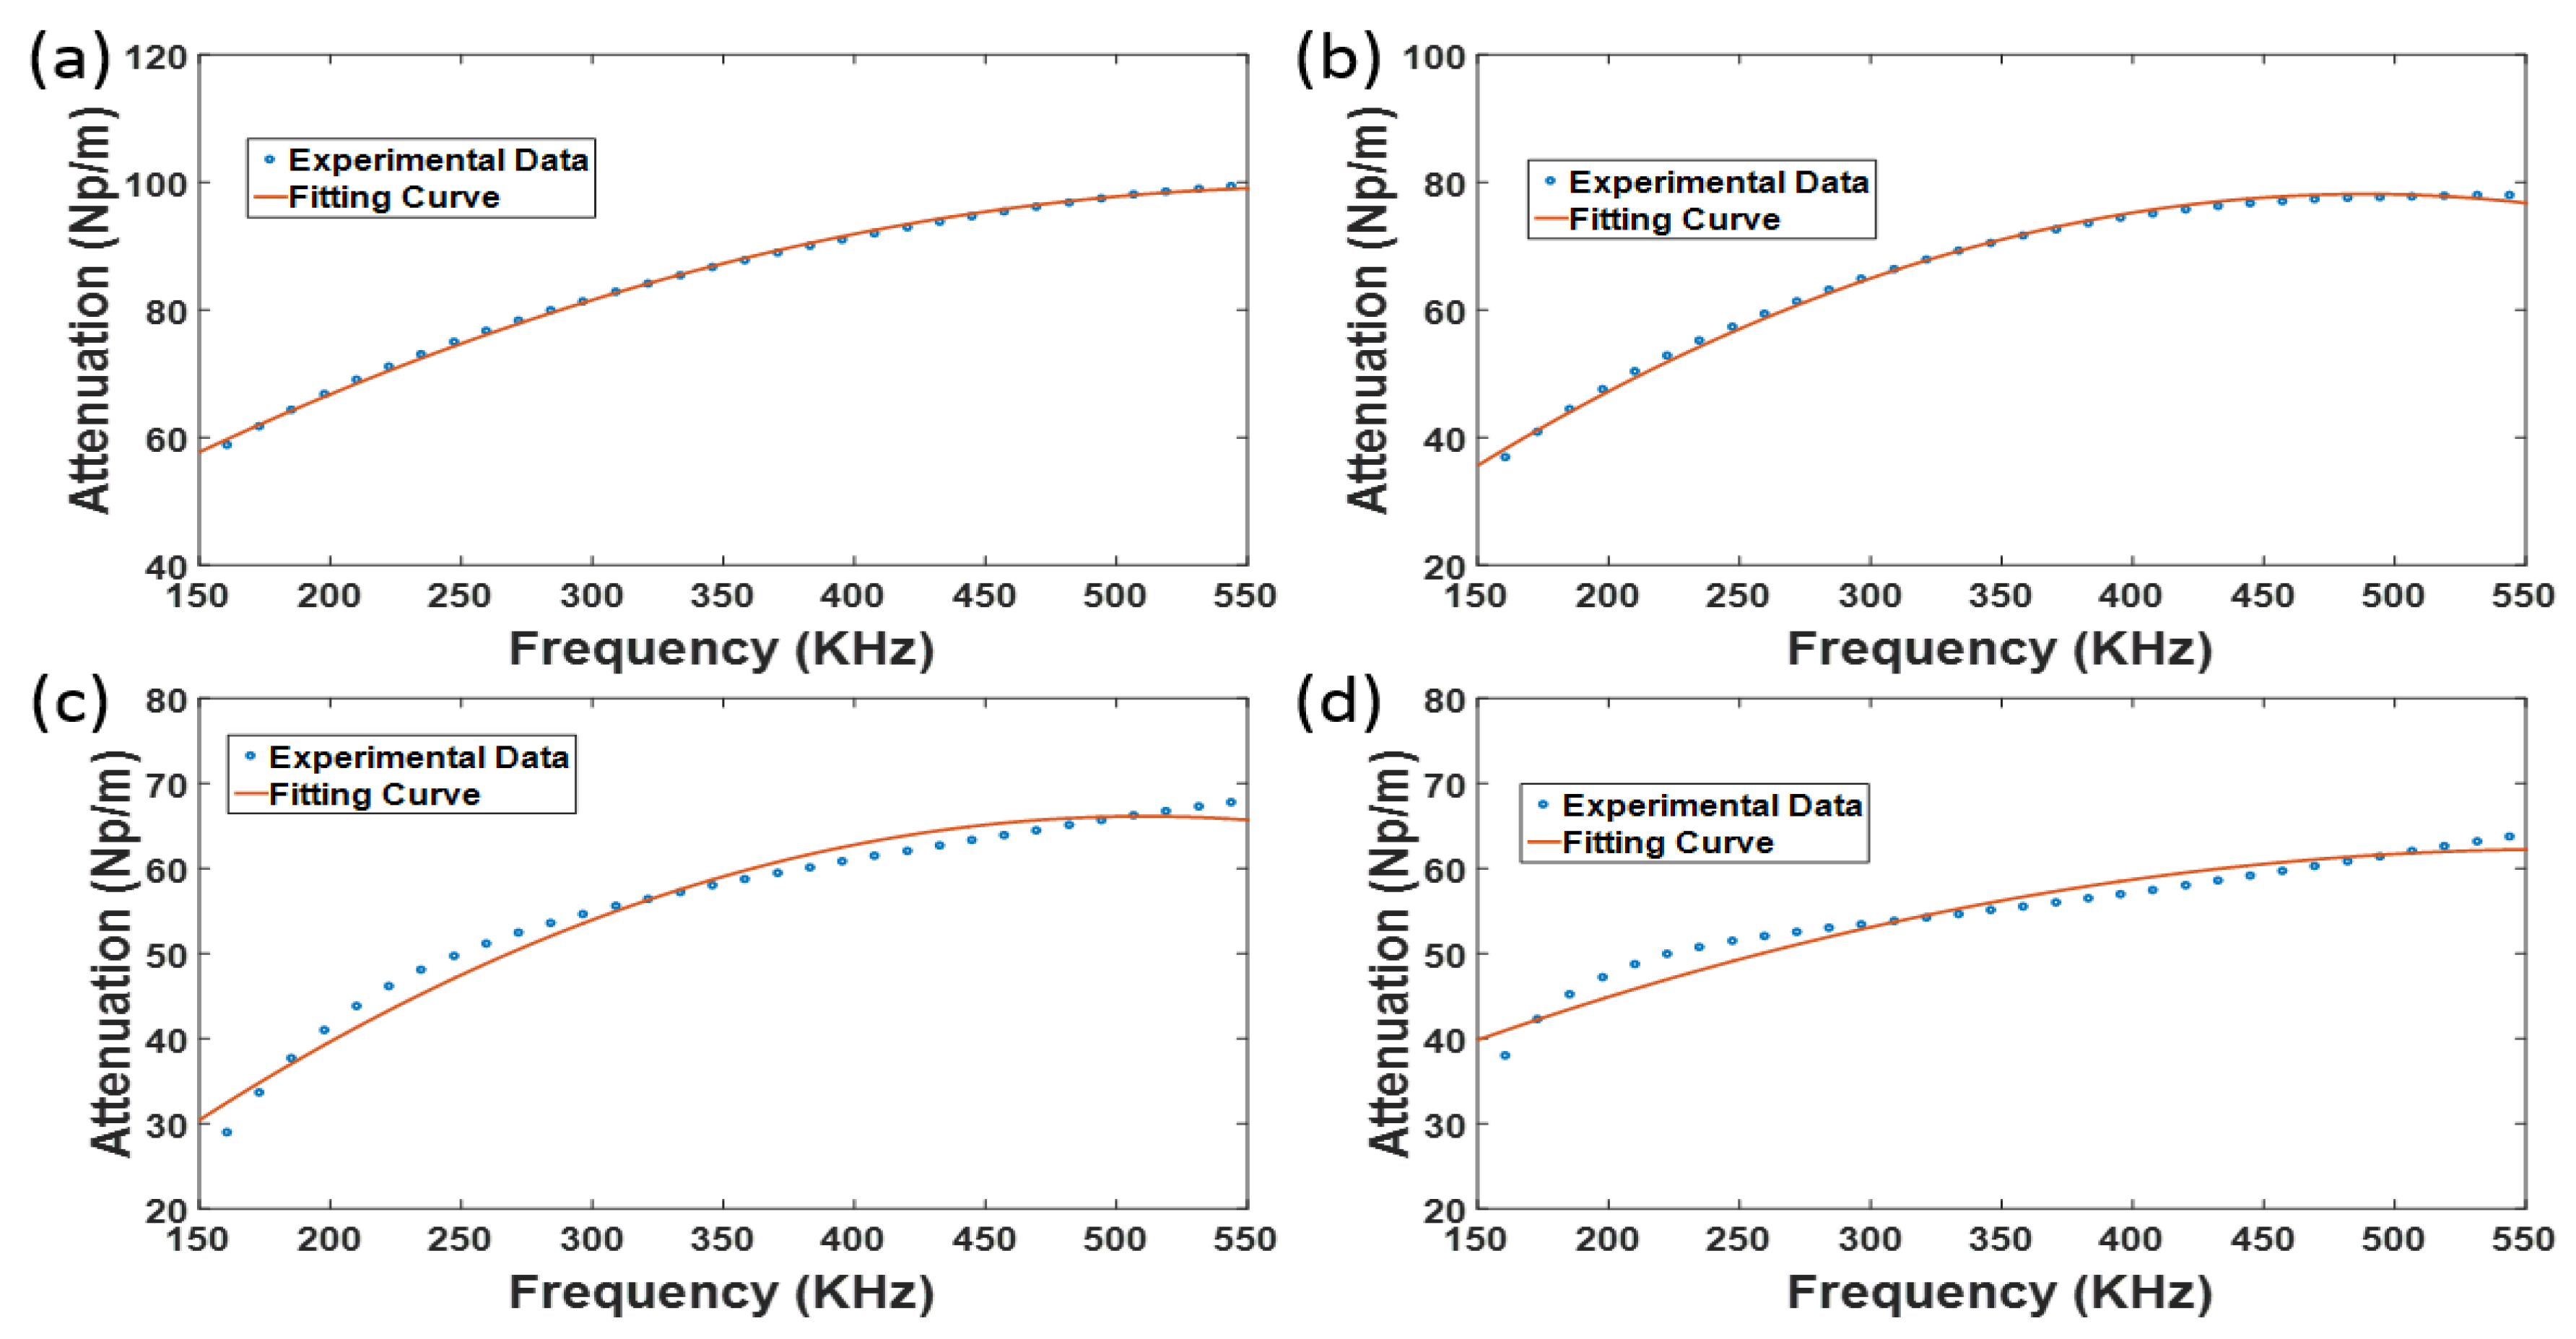
3.2. Attenuation Measurement of Cement Paste for Different Ages

As mentioned before, the ultrasonic attenuation of the cement paste first needs to be determined as attenuation for the corresponding viscoelastic matrix in concrete, especially during the early ages. The cement paste samples with the same water/cement ratio (0.45) as concrete samples were separately prepared and no air entrainment agent was added during preparation. Then, the air voids in the separately prepared cement paste are mainly capillary pores due to cement hydration. The attenuation of cement paste is mainly generated from its viscoelastic property, and the contribution from the capillary air void structure is limited. The air void structure of the separately prepared cement paste and that of the cement paste in concrete is different, as the air void structure in concrete can be further affected by the added air entrainment agent, air voids entrapped by the aggregate, and the existence of the Interfacial Transition Zone (ITZ) area. Also, due to the relatively small volume fraction (around 25%) of cement paste inside concrete, the influence of the intrinsic capillary air void content of the cement paste on the concrete air void structure is further limited. The influence of the entrained air voids, entrapped air voids, and the air voids in the ITZ area on the ultrasonic attenuation, are all considered during the measurement in this study.
The cement paste properties are highly impacted by the hydration process. In this study, the ultrasonic scattering measurement was conducted at Day 1, 3, 7, 14, and 28 for both the cement paste and concrete specimen. The calculated cement paste attenuation on the frequency domain based on Equation (10) is shown in Figure 4. A parabolic equation was then used for the curve fitting between the attenuation and corresponding frequency. The fitted equations are depicted as Equations (11)–(14). These fitted equations served as the background attenuation for further inverse analysis of the characteristics of concrete air voids. As the center attenuation used in this study is 500 kHz, the signal is more stable during the range of [150, 550] kHz and this range was applied for the further analysis. It can be observed from Figure 3 that the attenuation of the cement paste matrix decreased with the curing age on the whole frequency domain.
α a , f = 222.8110 e 6 × f 2 + 259.3297 e 3 × f + 23.8052
α a , f = 371.3589 e 6 × f 2 + 362.8550 e 3 × f 10.4897
α a , f = 275.0380 e 6 × f 2 + 280.7362 e 3 × f 5.5200
α a , f = 129.7629 e 6 × f 2 + 146.8296 e 3 × f + 20.7148
where f is the frequency range (KHz) and α a , f is the attenuation (Np/m).

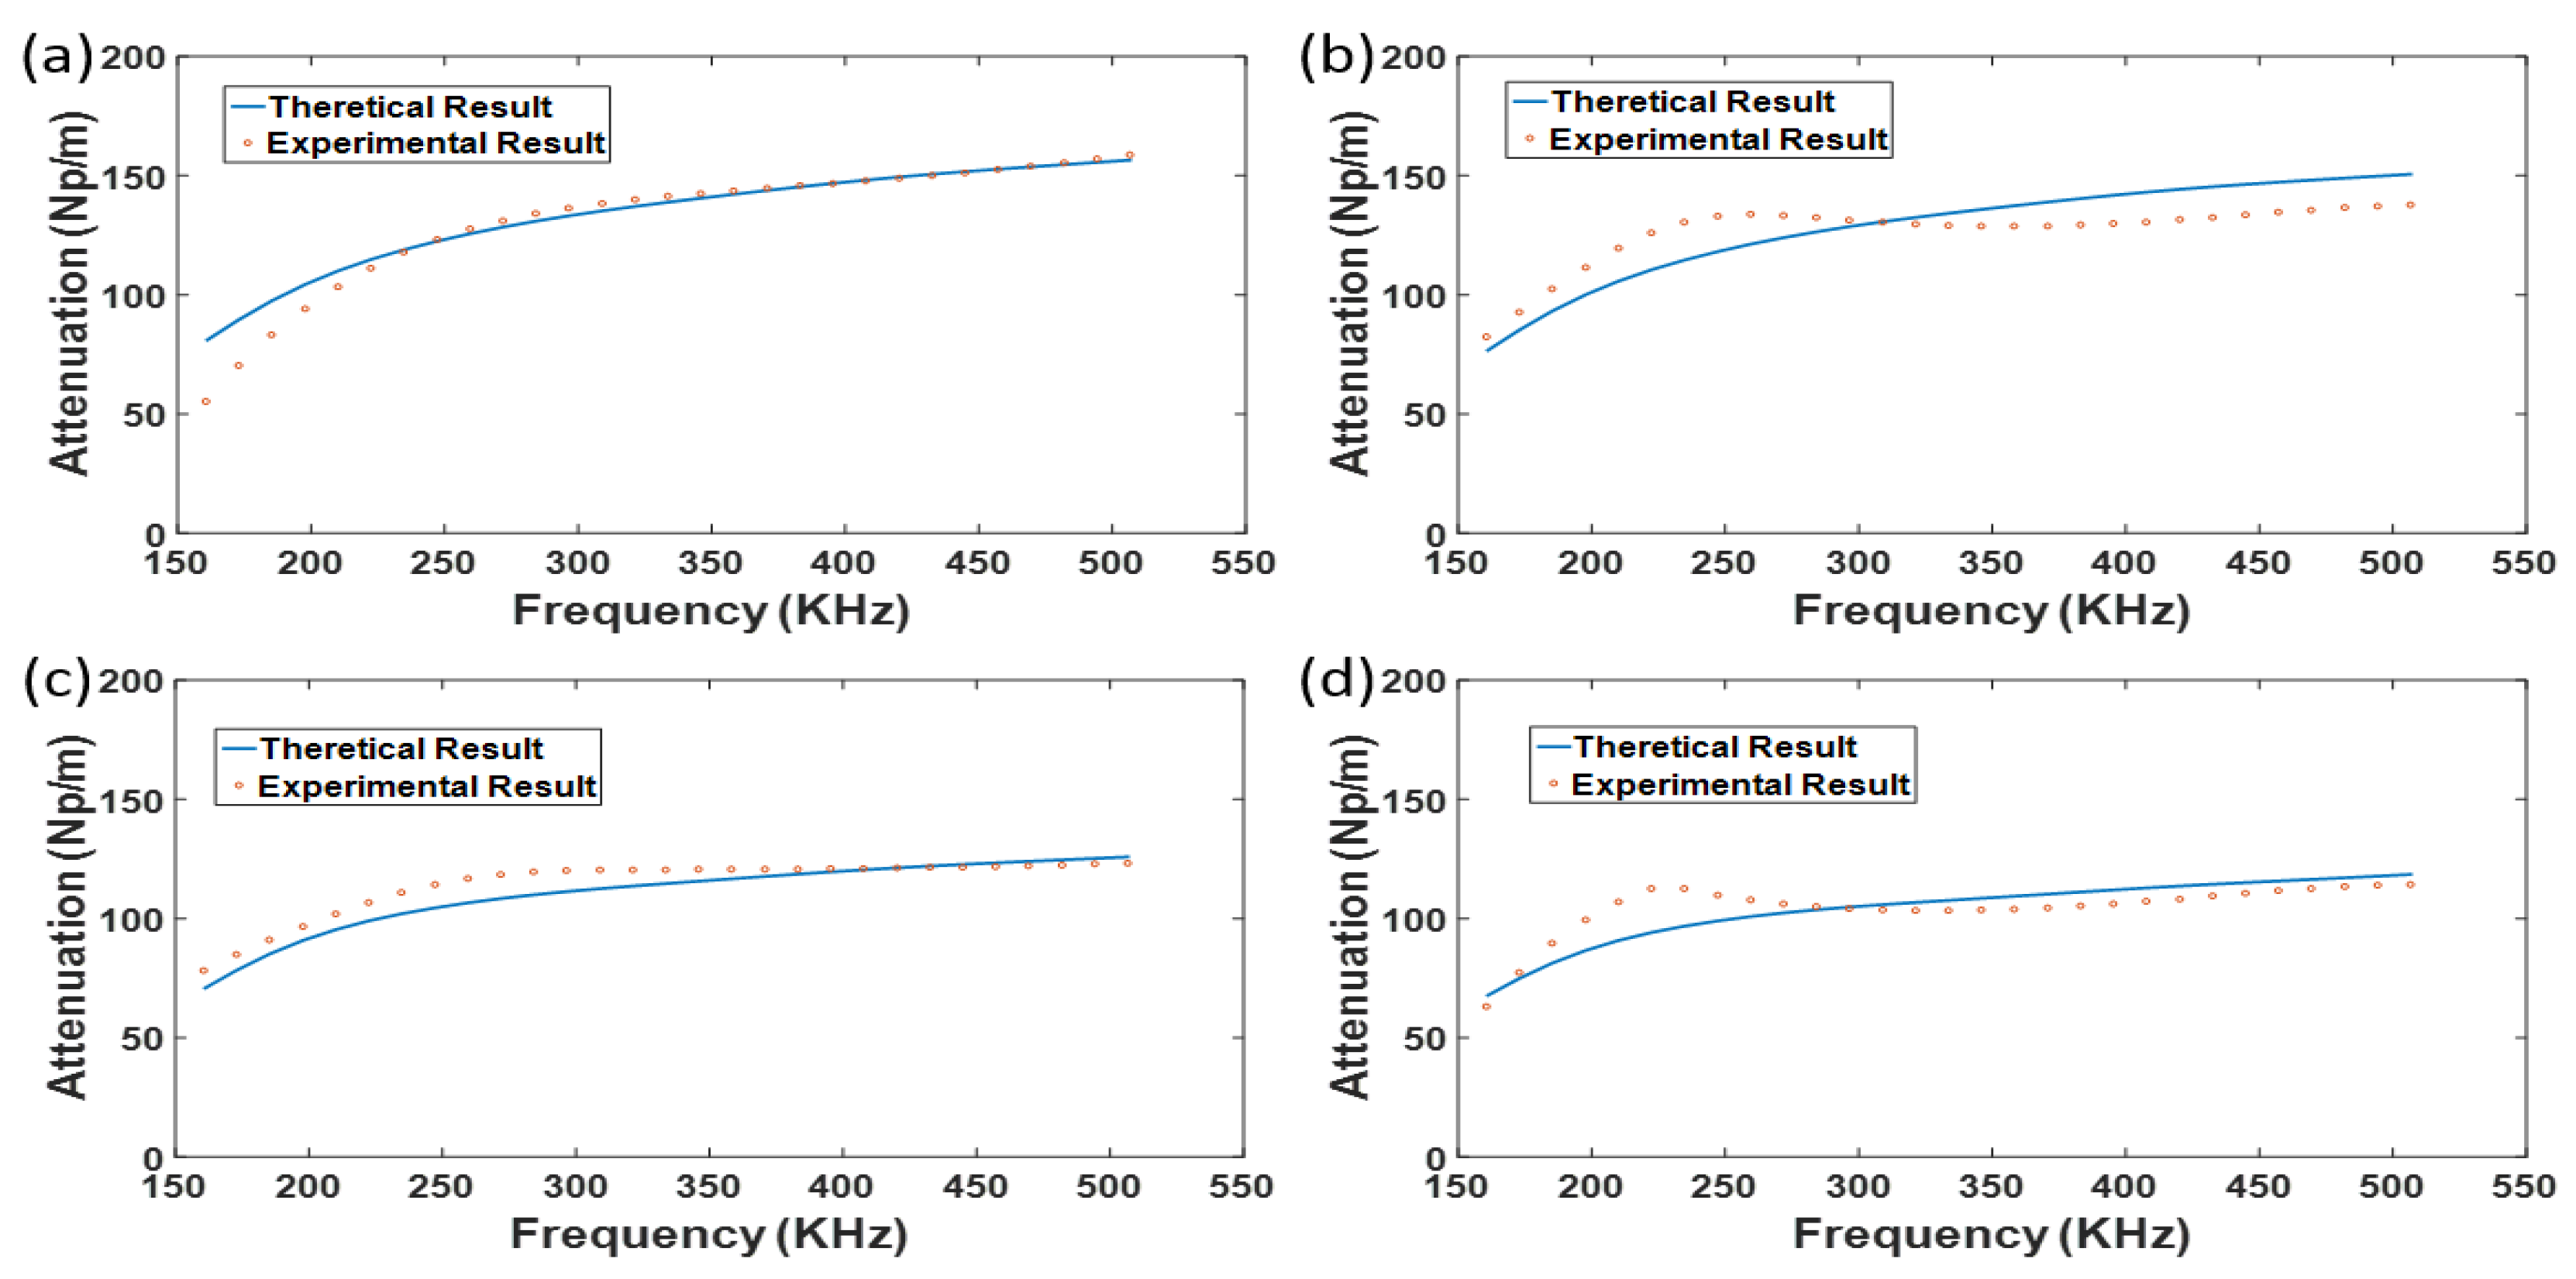
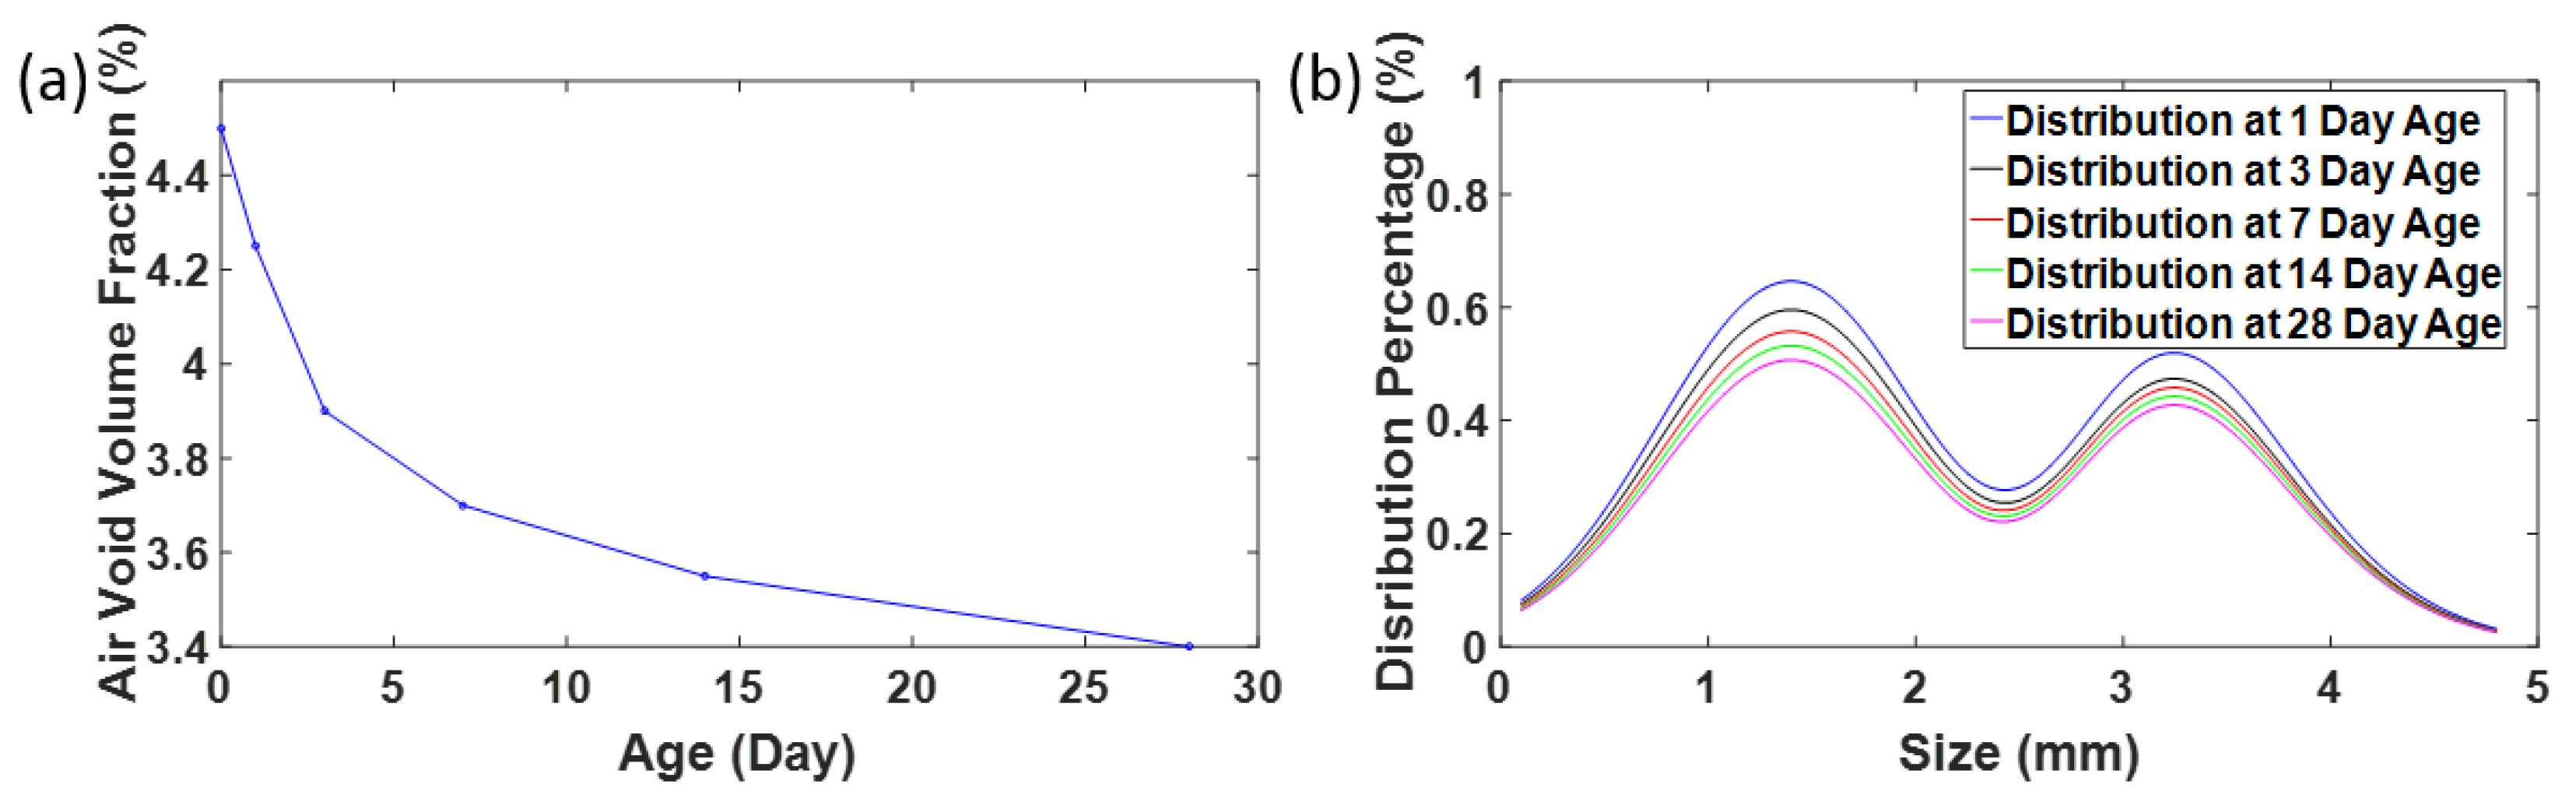
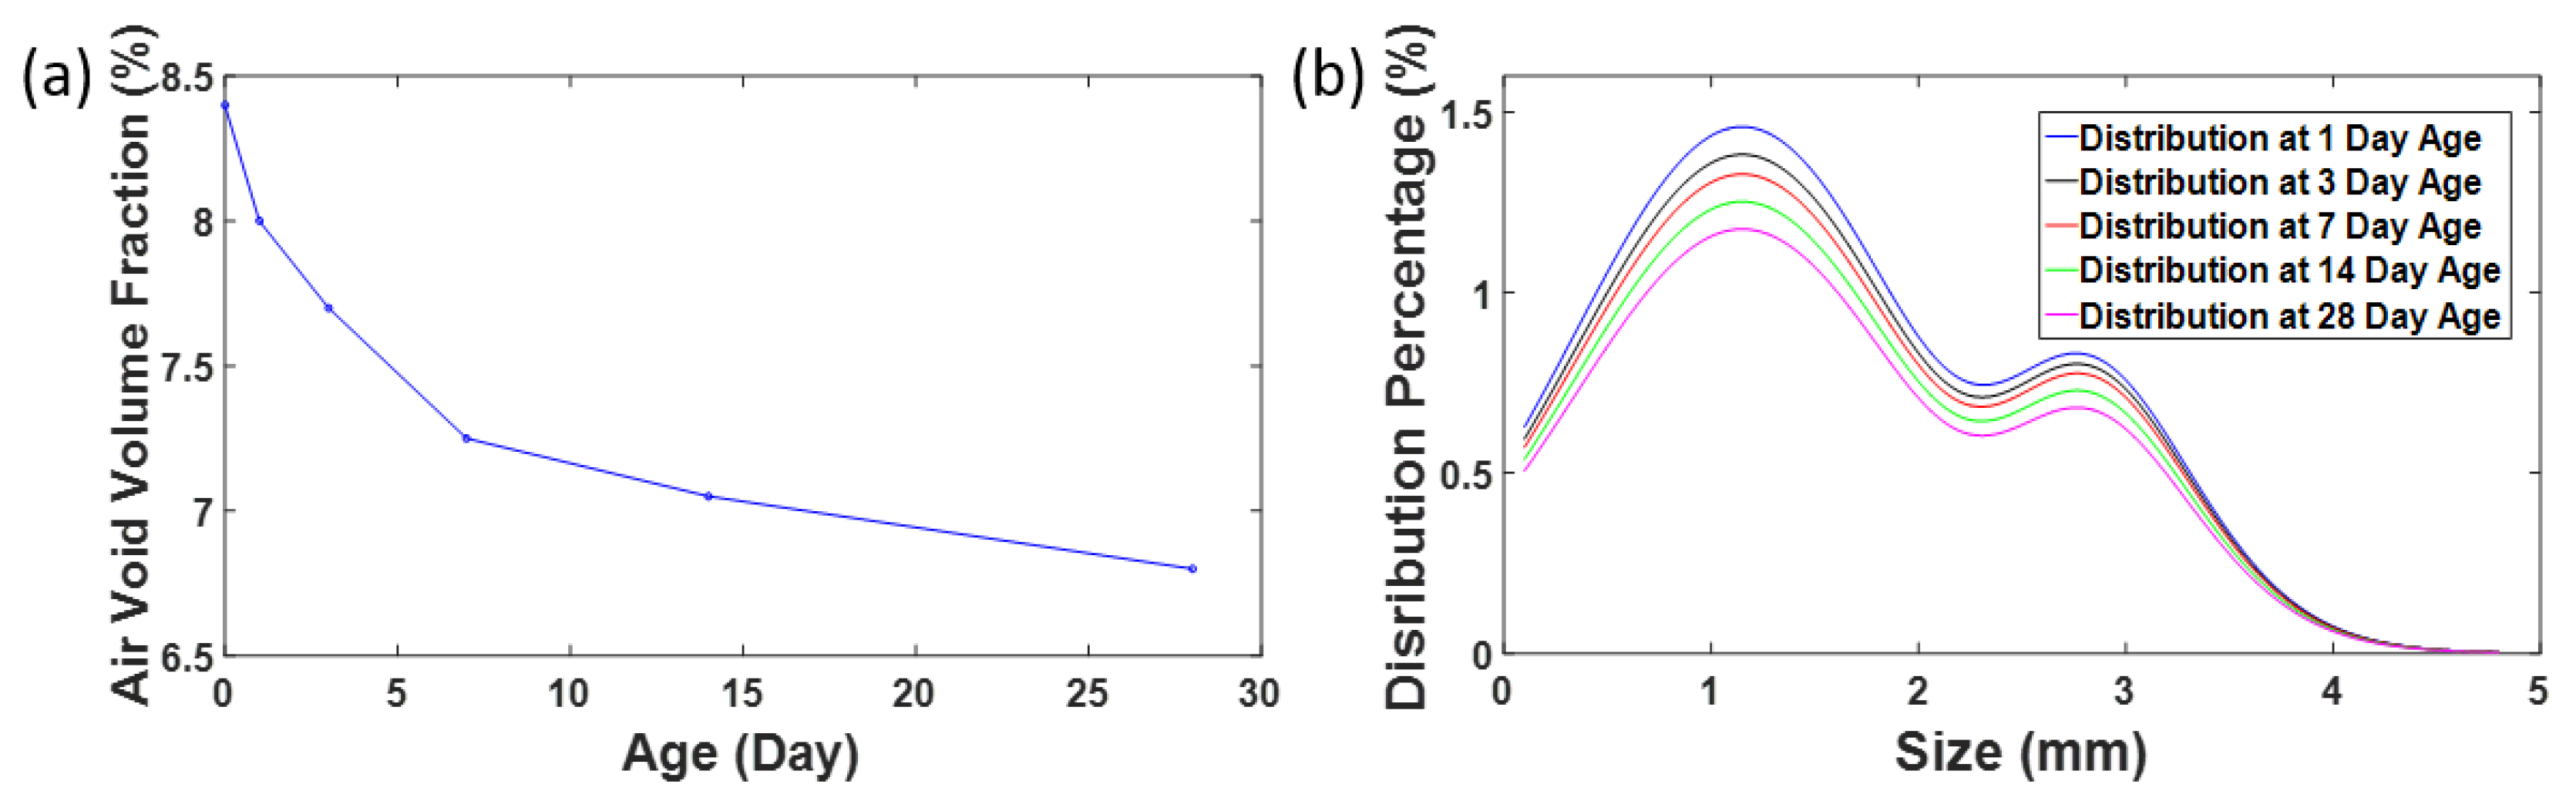
3.3. Determination of Air Void Distribution at Early Stages

The inverse analysis was conducted on MATLAB code by comparing the theoretical attenuation and experimental attenuation estimated based on Equations (1) and (10) respectively. The fitted attenuation equations for cement paste shown in Section 3.2 were applied as the background attenuation α a , f . The attenuation generated by the aggregate were calculated with Equation (3), depending on the designed aggregate gradation. Based on the description equation for the air void size distribution shown as Equation (4), the attenuation generated by air voids can also be determined with Equation (9). Combining all these three parts, the total theoretical attenuation can be determined and compared with the experimental attenuation determined with the methods mentioned in Section 2.2. Three parameters need to be determined for both the small and large air void size distribution: the volume fraction, average size, and the corresponding standard deviation. The air void size distribution parameters can be obtained by achieving the minimum error between experimental and theoretical attenuation.
The comparison between the experimental and theoretical attenuation in the frequency domain for Sample Type 1 was demonstrated in Figure 5, where (a), (b), (c) and (d) depict the comparison at Day 1, 3, 7, and 14 respectively. The corresponding inversed air void size distribution and volume fraction were shown in Figure 6, where (a) and (b) represent the change of the air void volume fraction and evolution of air void size distribution with curing ages. Particularly, the air void volume fraction at Day 0 (fresh stage) was measured by the ASTM C138 test, which is in good agreement with the ultrasonic scattering measurement results.
Similar to the inverse analysis methods used for Sample Type 1, the inverse analysis results were conducted for Sample Types 2 and 3 separately. The changes of air void volume fractions with curing ages are represented in Figure 7a and Figure 8a. Similar to the results shown in Figure 6a, the decreasing trend of the air void volume fraction was observed for all these three samples. Particularly, the air void volume fraction change after Day 14 is much slower compared to the volume change during the first 14 days. The corresponding air void size distribution evolution for Sample Types 2 and 3 are shown in Figure 7b and Figure 8b respectively. The results demonstrate that the volume fraction of both small and large air voids decrease with the curing ages. As mentioned above, the air void volume fraction was observed to decrease with curing age. This phenomenon is in accordance with the results that the air void volume fraction can decrease during hydration age [38], especially on the ITZ area. It is also clear that the decreasing rate of the air void volume fraction declines with the curing age, which is in accordance with the cement hydration speed [39].

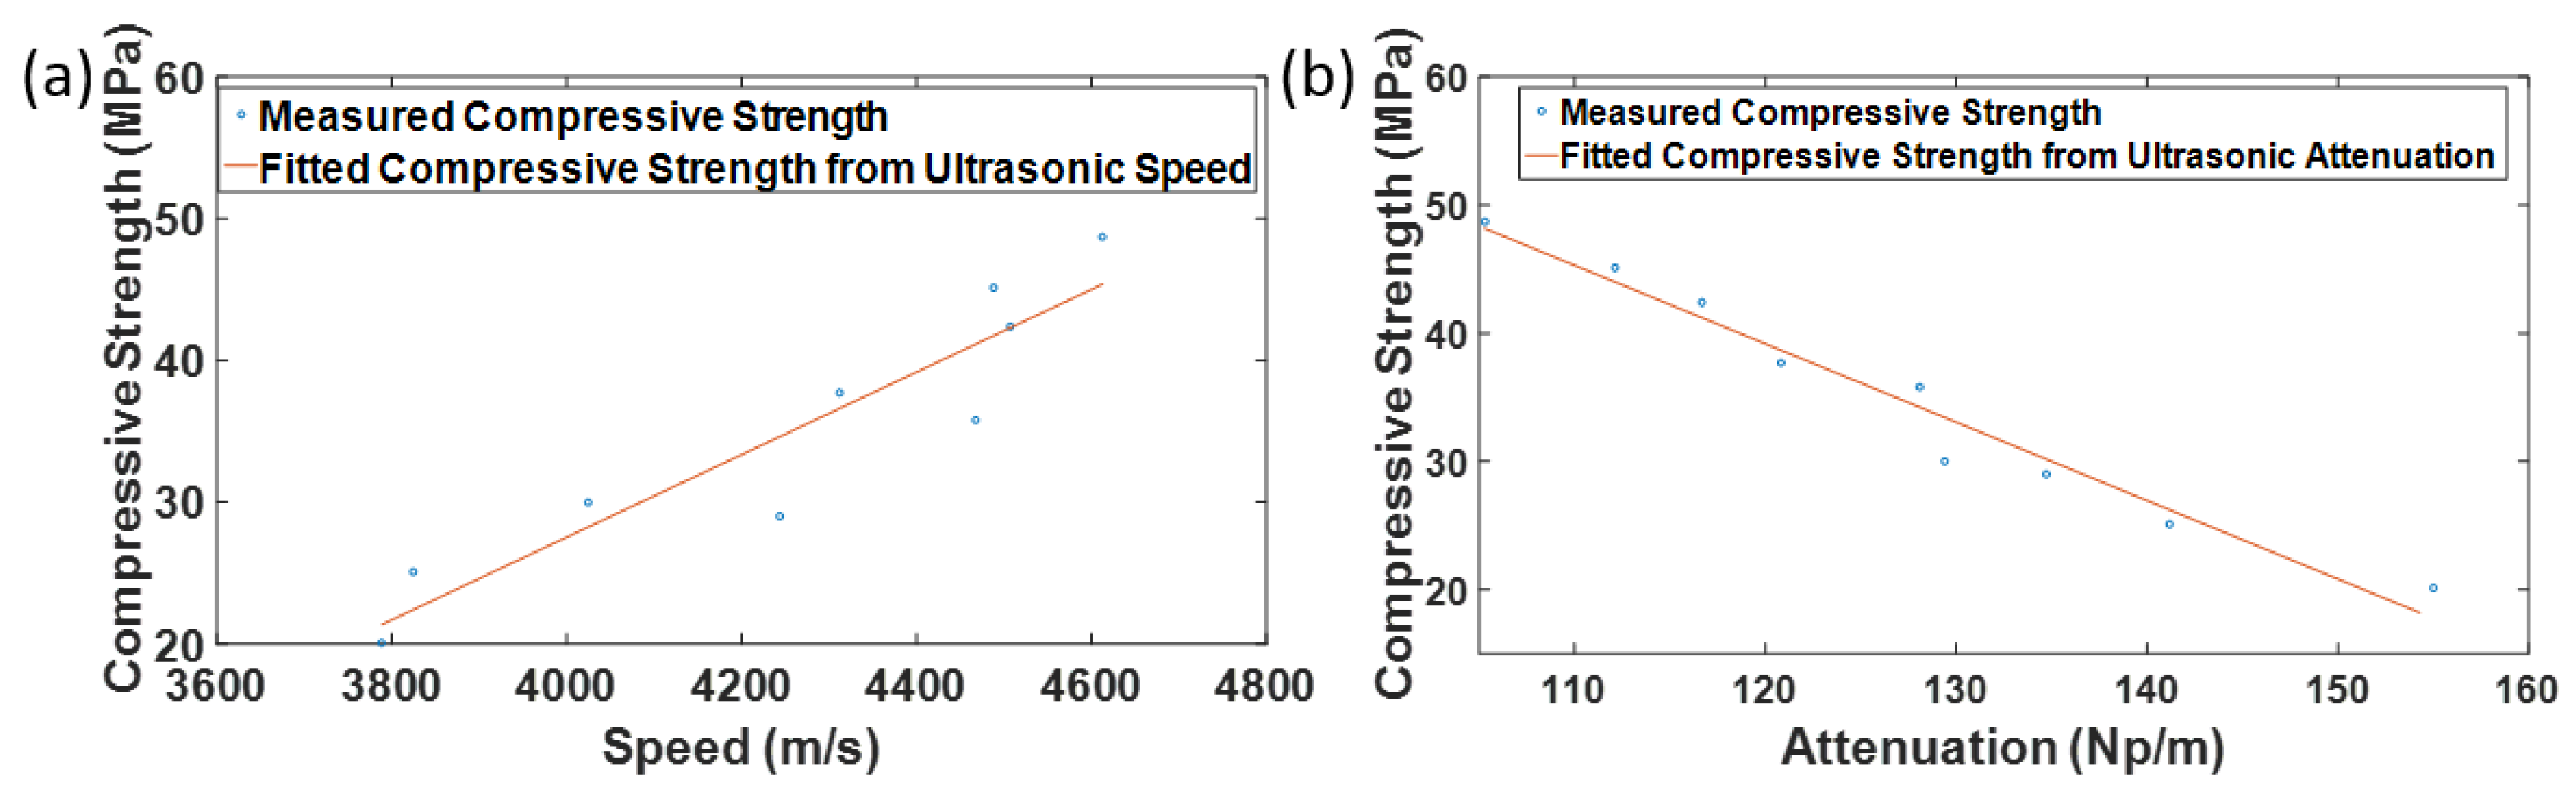
3.4. The Correlation between Compressive Strength and Utlrasonic Parameter

Besides the analysis of air void volume shrinkage, the compressive strength gain during early age can also be possibly investigated with ultrasonic parameters. The cement hydration process can lead to the increase in concrete stiffness and the decline of viscosity [39]. The rising concrete stiffness means higher transmission speed. The decreasing viscosity can also generate a drop in cement attenuation, as demonstrated in Figure 3. In addition, the shrinkage of the air void volume fraction, as depicted in Figure 6, Figure 7 and Figure 8, can also lead to higher transmission speed and lower attenuation. Hence, the ultrasonic transmission speed and attenuation are in positive and negative correlations with the compressive strength during the concrete early-age. The ultrasonic transmission speed is determined with the arrival time of Signal S1(t) and the sample thickness. The calculated ultrasonic transmission speeds are shown in Table 2. Similar to the study [21], this study also applied the peak value ratios for the strength gain prediction. As shown in Figure 2, the peak value of both the first and second transmission waves are located around 500 kHz. Hence, the ultrasonic attenuation value at 500 kHz was chosen to represent the change of attenuation with time, as depicted in Table 2.
The compressive strength analysis, applied to the measured results of all three sample types, was applied for the correlation analysis to better demonstrate the relationship between ultrasonic parameters and the strength gain during early stages. The relationship between compressive strength with ultrasonic speed and attenuation is demonstrated in Figure 9a,b respectively. Both of these correlations were evaluated with the linear fitting, and the fitted results are demonstrated as Equations (15) and (16), respectively. The corresponding correlation coefficient between the fitted and measured results are 93.23% and 98.20%, respectively, which demonstrate that the change of ultrasonic attenuation is in stronger linear correlation with the strength gain during early stages.
f c = 0.0291 × v p 88.96
where f c is the compressive strength (MPa) and v p is the ultrasonic transmission speed (m/s).
f c = 0.61 × α a , f + 112.59
where α a , f is the ultrasonic attenuation (Np/m).

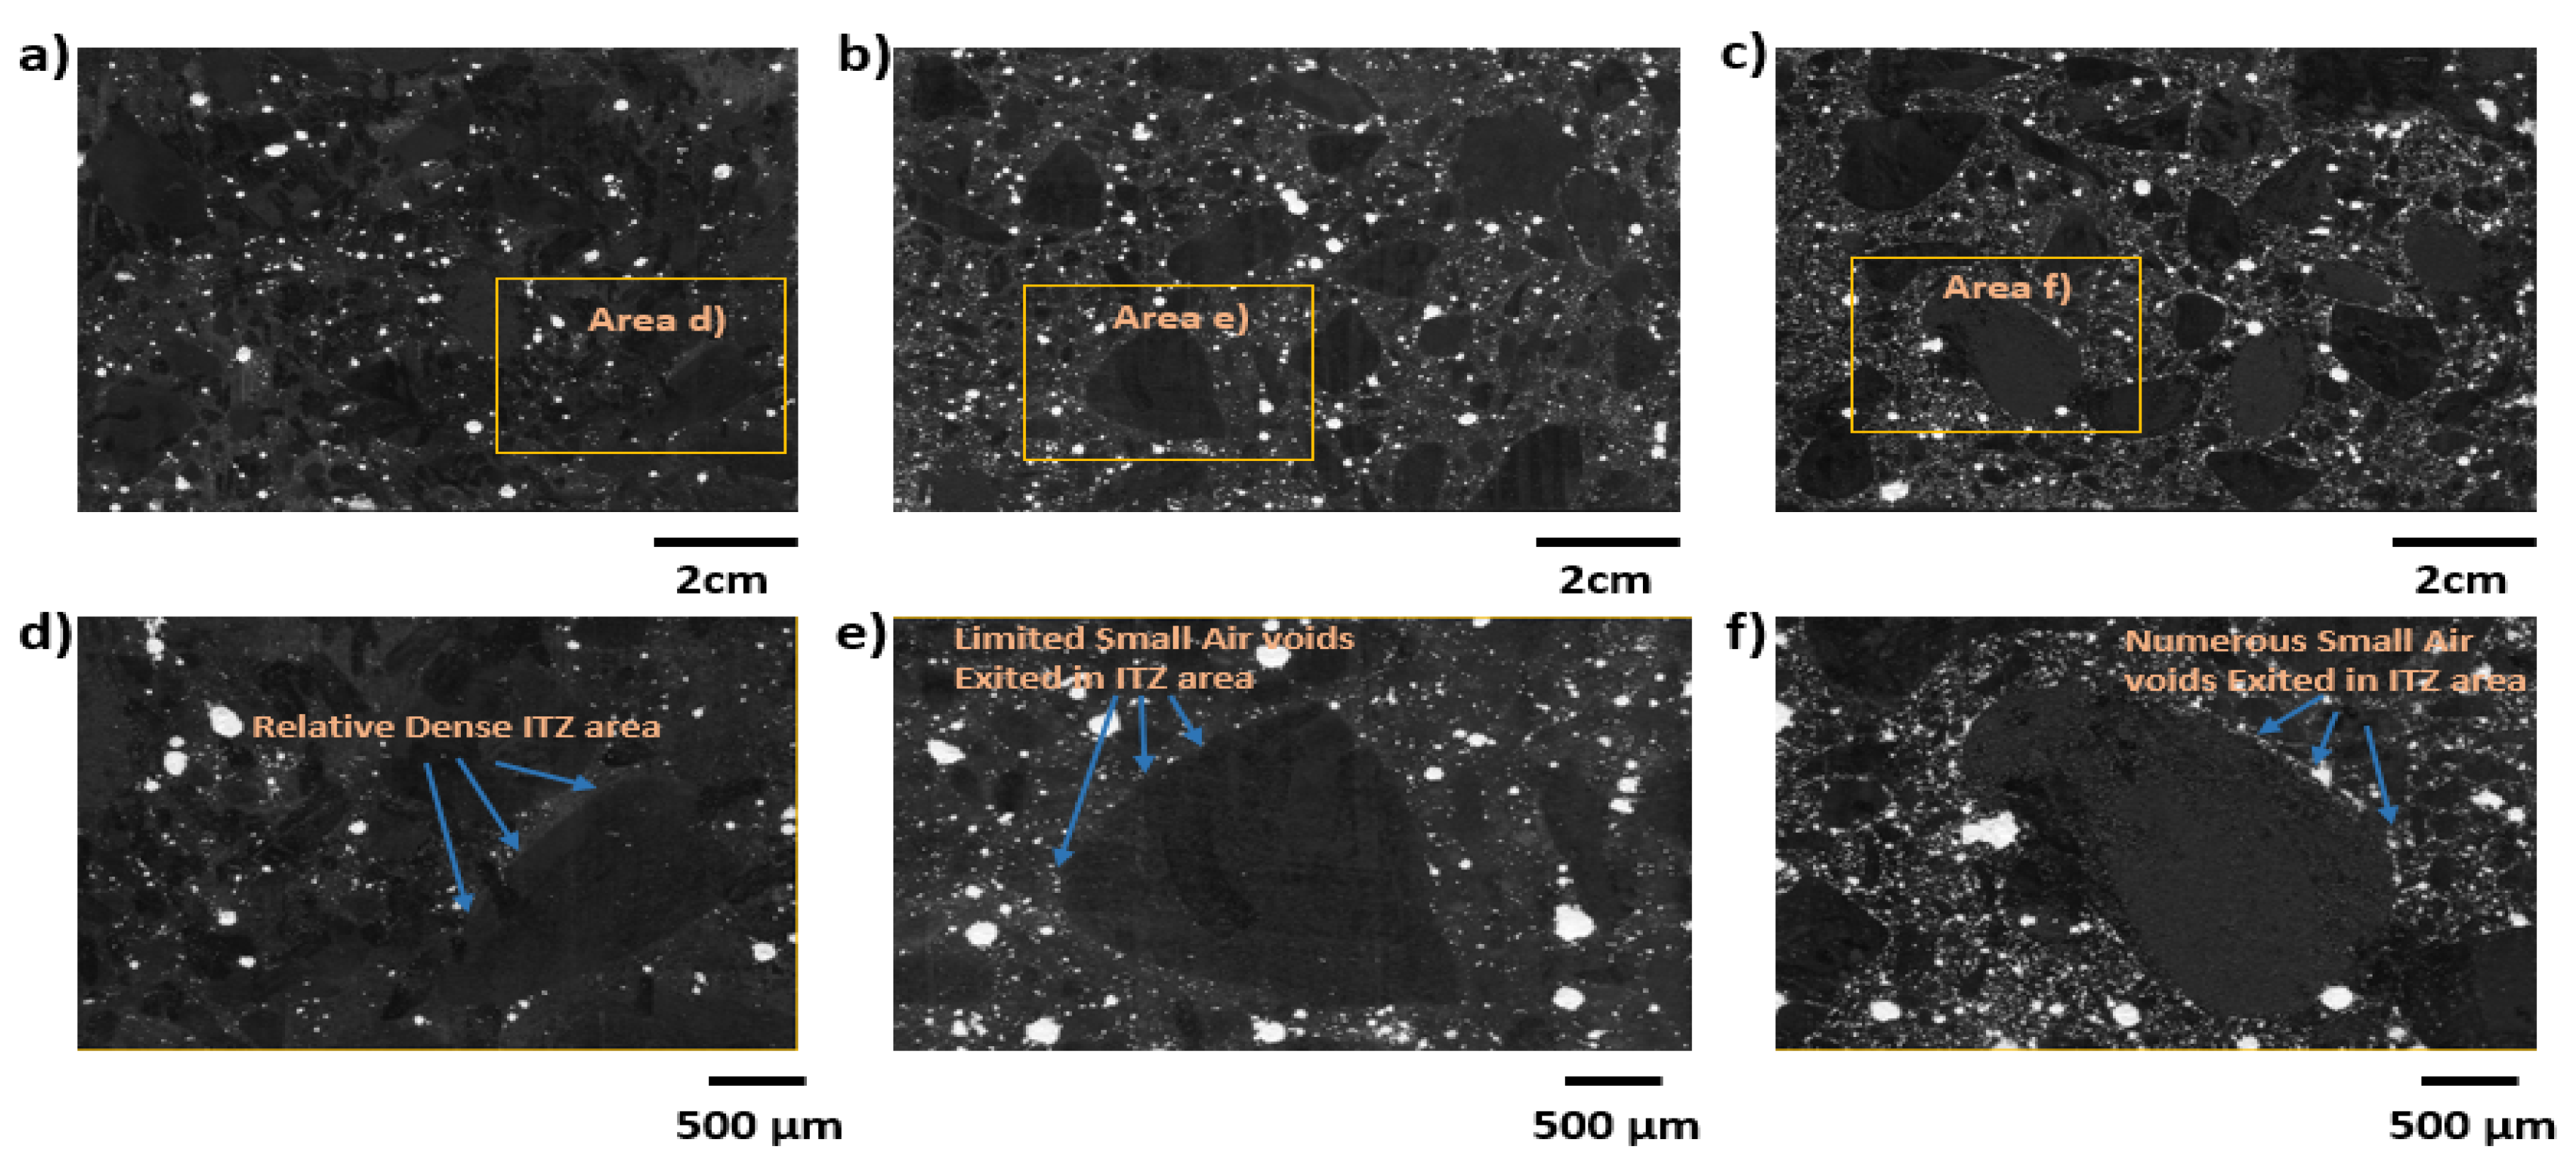
3.5. The Correlation between Transport Property and Air Void Structure

The back-calculation results demonstrate that the air void content can decrease with the curing age. The shrinkage of air voids can affect the transport ability of concrete. In this study, the transport property was evaluated with the electrical resistivity measurement; the measured results are shown in Table 2. It is clear that the electrical resistivity increases with the curing age for all three sample types. The raising of electrical resistivity can be generated from the decreasing of ion concentration in pore solution and the decline of concrete connectivity. Based on reference [40], the ion concentrations in concrete pore solution become relatively stable after Day 7. Hence the obvious increase in electrical resistivity from Day 7–28 can be mainly generated from the declining connectivity. This result is in accordance with the air void shrinkage during the curing age, as shown in Figure 6, Figure 7 and Figure 8. In addition, the electrical resistivity can also increase with the air entrainment agent dosage as shown in Table 2. This result demonstrates that the small air voids generated by the added air entrainment agent are mainly isolated in the cement matrix. The small air voids can serve as an insulator [24], and reduce the conductivity of concrete.

4. The Air Void Size Distribution and Dynamic Modulus Analysis of the Hardened Stage

In this study, the estimated air void size distribution based on ultrasonic scattering measurement was compared with the ASTM C457 results for verification at the hardened stage. Further studies on the prediction of the dynamic modulus of hardened concrete were also conducted.

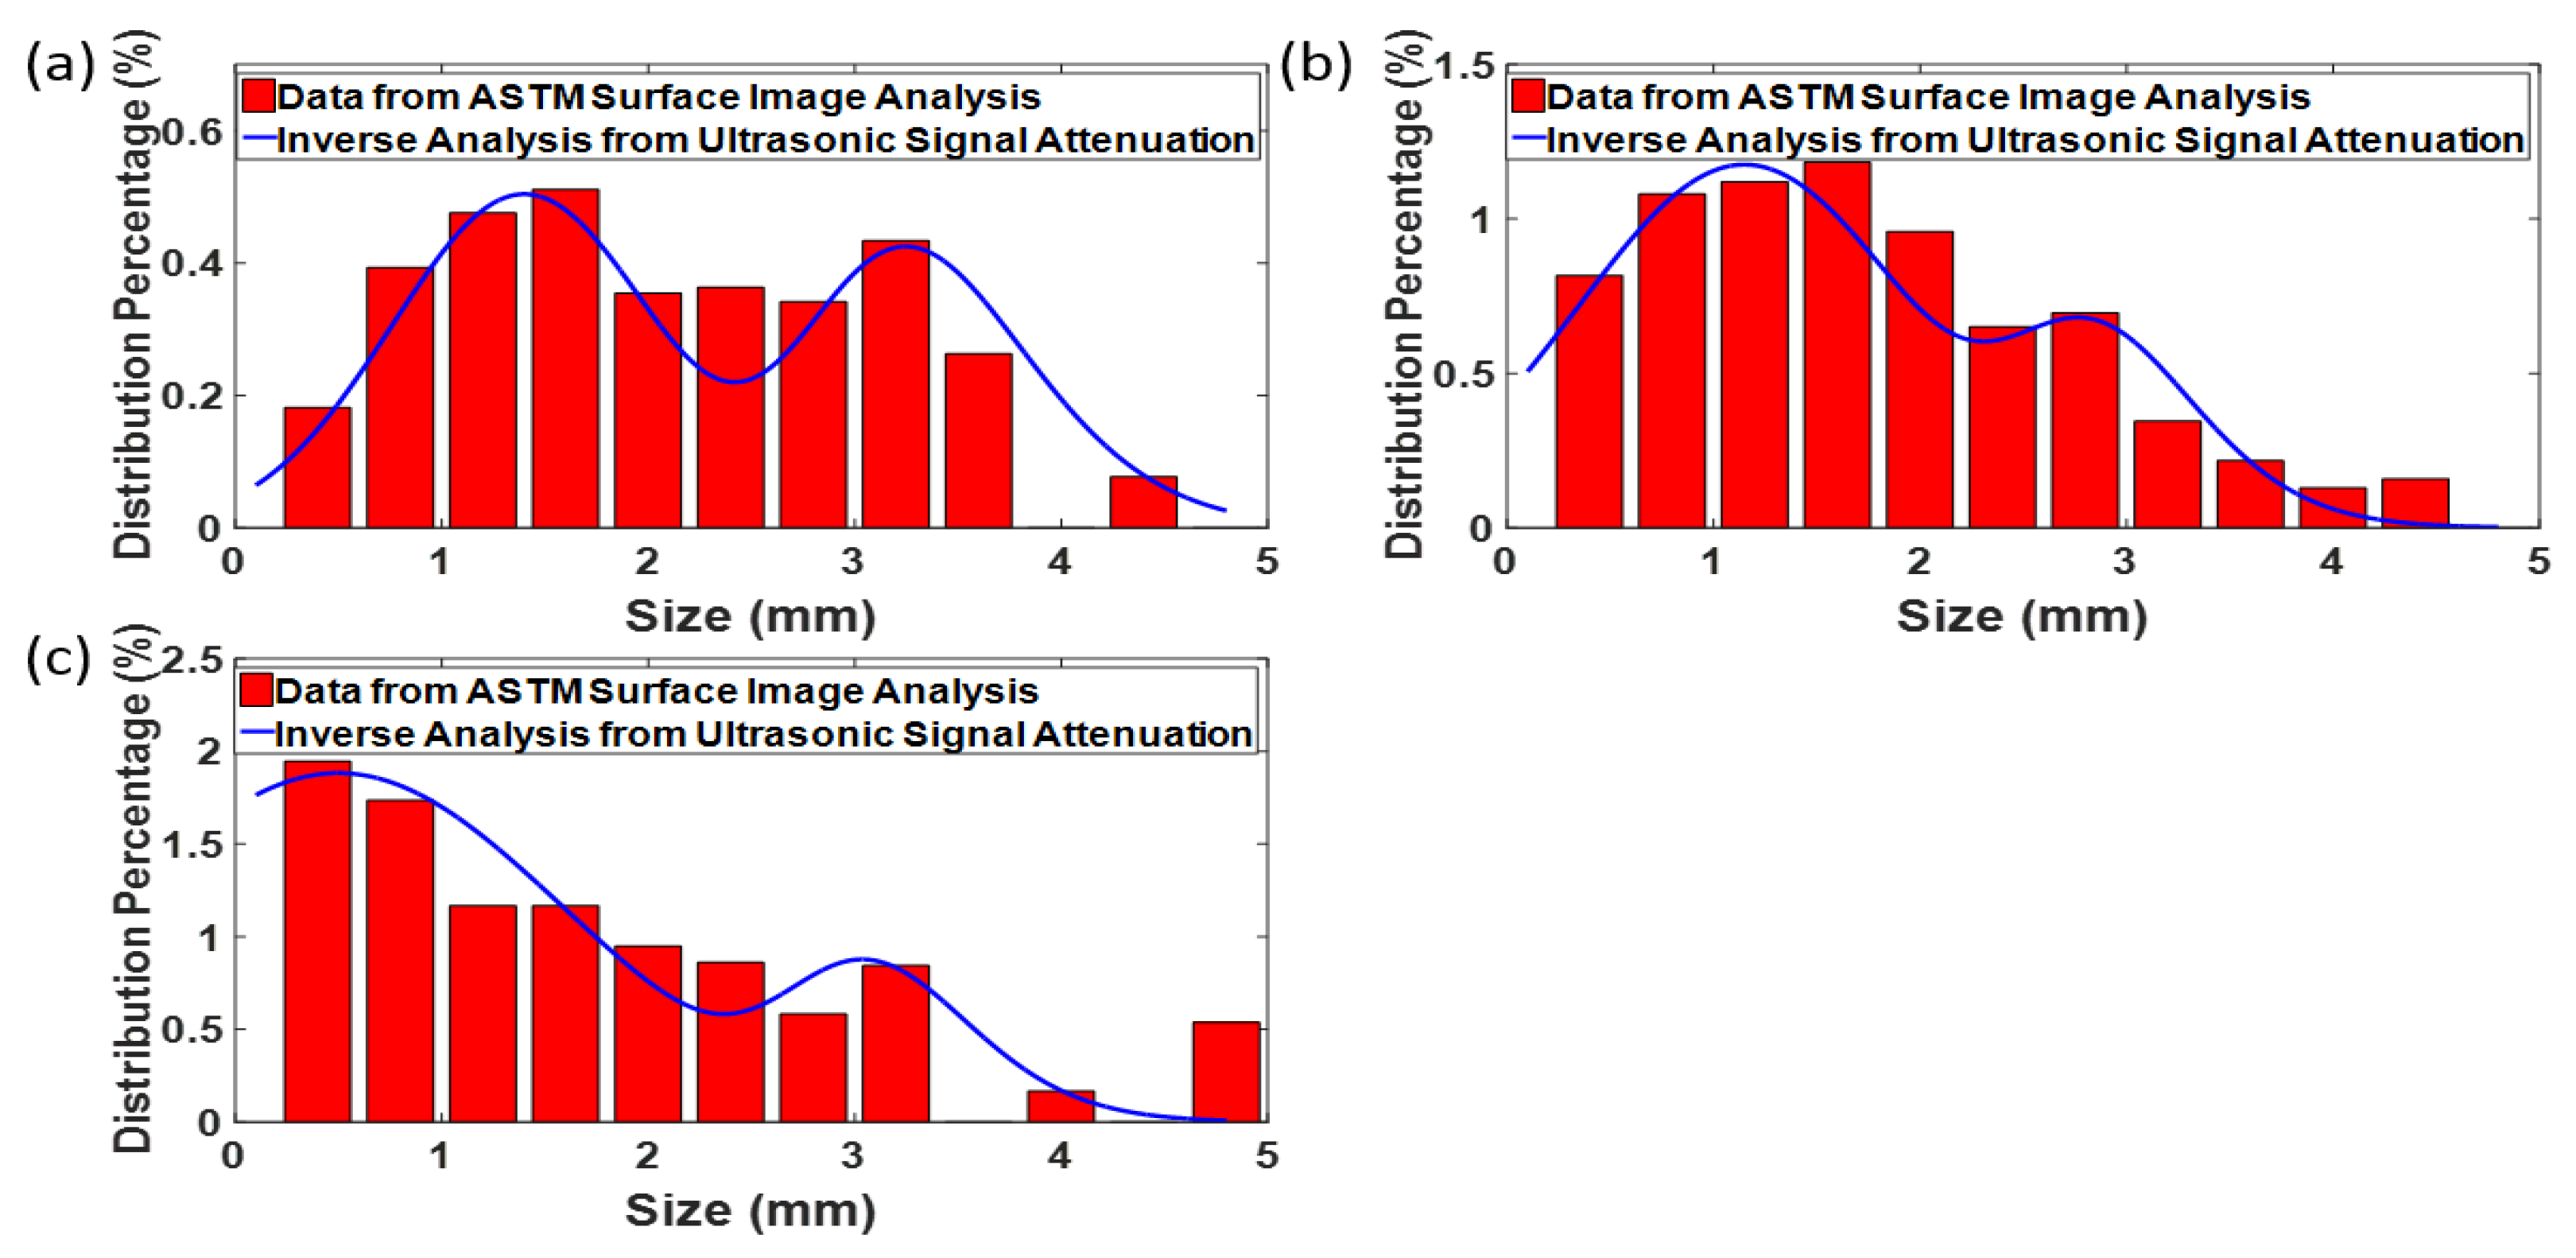
4.1. Compare Measured Air Void Size Distribution with ASTM C457 at Hardened Stages

The obtained air void size distribution and volume fraction from the ultrasonic scattering measurement were further compared with the ASTM C457 test on Day 28. The ASTM C457 tests were conducted with the flatbed scanning methods [41]. The cylinder samples were cut into slabs (7.62 cm (3 in) × 10.16 cm (4 in)) and the surface was carefully polished with grinder. The surfaces were then painted with black marker pen and powdered with calcium silicate. The prepared samples are shown in Figure 10. After processing, the white spots represent air voids existing in concrete specimens. Comparing these three samples, it is clear that the whitened areas increase with the added air entrainment agent dosage. To obtain the size distribution and volume fraction of air voids, the prepared samples were scanned and analyzed with the BubbleCounter [41] embedded in ImageJ software [42].
The comparison between the ultrasonic scattering measurement results and the ASTM C457 results is shown in Figure 11a–c, respectively. The corresponding correlation coefficients on the whole size range are 88.86%, 96.88%, and 90.75% for Samples 1–3 separately. The distribution parameters are shown in Table 3. It is clear that the average size and standard deviation for the small air voids decrease and increase respectively with the air entrainment agent content. The air void fraction obtained with ultrasonic scattering techniques is around 3.4%, 6.8%, and 10.0% for Samples 2–4, which are very close to the ASTM C 457 measured values of 3.4%, 6.9%, and 10.1% for tested samples. The size distribution of the small air voids (0.1–1.2 mm) are shown in Figure 12, where a–c represent the non-entrained concrete (Sample Type 1), entrained concrete with regular entrainment dosage (Sample Type 2), and entrained concrete with double entrainment dosage (Sample Type 3), respectively. On the range of small air voids, the correlation coefficient between the ultrasonic scattering measurement results and ASTM C457 measured results are 93.98%, 93.75%, and 71.33%, for Sample Type 1, 2, and 3, respectively. The closeness of both the size distributions curve and volume fraction between these two results demonstrates the feasibility of the ultrasonic scattering measurement method.
As shown in these figures, the volume fractions of both small air voids and large air voids decrease with the curing age. Particularly, a peak shift from about 1.2 mm to about 0.3 mm can be observed for small air void distribution from Sample Type 1 to Type 3. In contrast, the peaks of the large air void distribution are relatively stable among these three samples. Also, the volume fraction of small air voids increases significantly with the added air entrainment agent, while the volume fraction of the large air voids is almost the same among these three samples. These differences indicate that almost all of the air voids introduced by AE 200 air entrainment agent are smaller than 1.2 mm.

4.2. Analysis of Compressive Strength Loss and Air Void Content

As shown in Table 2, the added air entrainment agent can lead to obvious compressive strength loss. Compared to the Type 1 sample, the compressive strength of Types 2 and 3 samples decrease by 7.39% and 38.40%, respectively. In addition, the air void content of Types 2 and 3 Samples increase by 3.4% and 6.6% separately, as compared to the Type 1 sample. Hence, for every 1% increase in air void content, the compressive strength decreases by 2.17% and 5.82% for Types 2 and 3 samples, respectively. It is reported that the compressive strength loss rate was in the range of [2%, 6%] for a 1% increase in air void content [26]. Though the strength loss rate of Types 2 and 3 samples are both in this range, the loss rate of the Type 3 sample is still much higher than the value of the Type 2 sample. Hence, the correlation between compressive strength and air void content cannot be simply treated as a linear relationship. It is considered that the air void distribution can affect the compressive strength, and not only the air void content.
In particular, the distributions of small air voids along the ITZ area are demonstrated in Figure 10d–f for Type 1, 2, and 3 samples, respectively. It is clear that the ITZ area of the Type 1 sample is relatively dense and small air voids can seldom be detected. Similarly, only limited small air voids can be found in the ITZ area of the Type 2 sample, as shown in Figure 10e. For the Type 3 sample, numerous small air voids can be found along the ITZ area as depicted in Figure 10f. The existence of small air voids in the ITZ area can lead to a weaker bonding strength between the cement paste and aggregate, which can be the main reason for the severe strength loss in sample Type 3. This finding demonstrates that clustered air voids can play an important role for the compressive strength loss.

4.3. Dynamic Modulus Analysis with Ultrasonic Parameters on Hardened Samples

The dynamic Young’s modulus of elasticity was usually applied to evaluate the freeze-thaw durability of concrete [43,44], which can be determined with the resonance frequency based on ASTM C215-14 [45]. During the resonant frequency tests, the concrete sample supported by the soft plastic materials was struck with an impactor at the center of one end of the surface, while the resultant signal was captured by an accelerator on the opposite site. The resonant frequency was then determined with the captured signal, after which the dynamic modulus can be calculated. In this study, the dynamic modulus was determined with the longitudinal resonance frequency as shown in Equation (17).
E D y n a m i c = D × M × n 2 ,   D = 5.093 ( L d 2 )   for a cylinder and   4 ( L b t ) for a prism .
where E D y n a m i c is the Young’s dynamic modulus of elasticity; M is the concrete mass; n is the measured resonant frequency; L is the sample length; d is the cylinder diameter; b and t are the cross-section dimensions of the concrete beam.
The determination of the dynamic modulus with resonance frequency is based on empirical equations as shown in Equation (17). The dynamic modulus can also be calculated with the sound speed through a theoretical equation [20,46] as shown in Equation (18).
E p = ( 1 + ϑ ) ( 1 2 ϑ ) ( 1 ϑ ) v p 2 ρ c o n c r e t e
where E p is the concrete dynamic Young’s modulus; ϑ is the dynamic Poisson’s ratio of concrete; v p is the longitudinal transverse speed of concrete; ρ c o n c r e t e is the mass density of concrete samples.
The dynamic Poisson’s ratio of concrete is in the range of [0.21, 0.28] based on reference [20]. Similarly, the average dynamic Poisson’s ratio was determined as 0.24 in reference [47]. Hence, the Poisson’s ratio chosen as 0.24 is used in this study. The longitudinal ultrasonic wave speed is determined based on the arrival time of signal S1(t) and the sample thickness. The mass density is obtained as the sample mass/volume ratio. The longitudinal dynamic modulus can then be determined with Equation (18). The analyzed dynamic modulus based on Equation (18) was then compared with the measured results from ASTM C215 in Table 4. The relative error between the predicted and measured results are all within 5%, which demonstrate the feasibility of this method.

5. Conclusions

This study analyzed the change of the air void structure and concrete property during the early stage. The ultrasonic scattering method was applied to measure the air void size distribution and to analyze the properties of both early-age and hardened concrete. The results were favorably compared with the ASTM C457 test results for validation. Based on the measured results, the change of the air void structure during the early age, and its relationship to concrete transport ability and the compressive strength were also analyzed.
During the early stages, the decreasing trend of the cement paste attenuation can be observed with the curing ages. The air void volume fraction obtained from the ultrasonic scattering measurement was found to decrease in both the small and large air void range with the curing ages. These phenomena are caused by the change in cement paste volume during the continuous hydration process. The results obtained from the ultrasonic scattering measurement were further verified with the ASTM C 457 test results on Day 28. The correlation coefficient between the ultrasonic scattering back-calculated values and the ASTM C457 measured results on the whole size range are 88.86%, 96.88%, and 90.75%, for Sample Types 1–3, respectively. The relatively high correlation coefficients further indicate the feasibility of the ultrasonic scattering measurement methods.
The electrical resistivity of concrete samples was found to increase with the curing age, which is in accordance with the air void shrinkage during the hydration process. In addition, the correlation between ultrasonic parameters and compressive strength was evaluated. The dynamic modulus was analyzed with the ultrasonic transmission speed, and the results are in good agreement (within 5% error) with the resonance-measured results. The relationship between the air void content and strength loss was also analyzed. The clustered air voids along the ITZ area can cause more severe compressive strength loss.
This paper provides an ultrasonic scattering method to measure the air void size distribution and volume fraction during both early-age and hardened stages. The correlation between concrete properties and ultrasonic parameters was also analyzed. Thus, the ultrasonic techniques can be further developed to measure concrete air void evolution and property development during early stages for concrete construction inspection.

Acknowledgments

The authors would like to acknowledge the Michigan Tech Transportation Institute Initiative Fund program for partial financial support. The first author acknowledges the financial support from China Scholarship Council under No. 201406370141. The authors would like to thank Gerald Anzalone at Michigan Technological University for assistance in the ASTM C457 air void measurement.

Author Contributions

Qingli Dai and Shuaicheng Guo conceived and designed the experiments; Shuaicheng Guo and Xiao Sun performed the experiments and analyzed the data; Ye Sun, Zhen Liu and Shuaicheng Guo contributed the analysis tools; Shuaicheng Guo and Qingli Dai wrote the paper.

Conflicts of Interest

The authors declare no conflict of interest.

References

  1. Sturrup, V.; Vecchio, F.; Caratin, H. Pulse Velocity as a Measure of Concrete Compressive Strength. Spec. Publ. 1984, 82, 201–228. [Google Scholar]
  2. Du, L.; Folliard, K.J. Mechanisms of air entrainment in concrete. Cem. Concr. Res. 2005, 35, 1463–1471. [Google Scholar] [CrossRef]
  3. Hansen, T.C. Influence of aggregate and voids on modulus of elasticity of concrete, cement mortar, and cement paste. Am. Concr. Inst. J. Proc. 1965, 62, 193–216. [Google Scholar]
  4. Kearsley, E.; Wainwright, P. Porosity and permeability of foamed concrete. Cem. Concr. Res. 2001, 31, 805–812. [Google Scholar] [CrossRef]
  5. Cordon, W.A. Freezing and Thawing of Concrete-Mechanisms and Control; American Concrete Institute: Farmington Hills, MI, USA, 1966. [Google Scholar]
  6. Zhang, Y.; Zhang, W.; She, W.; Ma, L.; Zhu, W. Ultrasound monitoring of setting and hardening process of ultra-high performance cementitious materials. NDT E Int. 2012, 47, 177–184. [Google Scholar]
  7. Zhu, J.; Kee, S.H.; Han, D.; Tsai, Y.T. Effects of air voids on ultrasonic wave propagation in early age cement pastes. Cem. Concr. Res. 2011, 41, 872–881. [Google Scholar] [CrossRef]
  8. Liu, Z.; Zhang, Y.; Jiang, Q.; Sun, G.; Zhang, W. In situ continuously monitoring the early age microstructure evolution of cementitious materials using ultrasonic measurement. Constr. Build. Mater. 2011, 25, 3998–4005. [Google Scholar] [CrossRef]
  9. Lai, W.; Wang, Y.H.; Kou, S.C.; Poon, C.S. Dispersion of ultrasonic guided surface wave by honeycomb in early-aged concrete. NDT E Int. 2013, 57, 7–16. [Google Scholar]
  10. Punurai, W.; Jarzynski, J.; Qu, J.; Kurtis, K.E.; Jacobs, L.J. Characterization of entrained air voids in cement paste with scattered ultrasound. NDT E Int. 2006, 39, 514–524. [Google Scholar]
  11. ASTM C457/C457M-12. Standard Test Method for Microscopical Determination of Parameters of the Air-Void System in Hardened Concrete; ASTM International: West Conshohocken, PA, USA, 2012. [Google Scholar]
  12. Sun, Y.; Yu, X.B.; Liu, Z.; Liu, Y.; Tao, J. Advanced ultrasonic technology for freezing damage prevention of concrete pavement. Int. J. Pavement Res. Technol. 2013, 6, 86–92. [Google Scholar]
  13. Yim, H.J.; Kim, J.H.; Bang, Y.L.; Kwak, H.G. Air voids size distribution determined by ultrasonic attenuation. Constr. Build. Mater. 2013, 47, 502–510. [Google Scholar] [CrossRef]
  14. Roney, R.K. The Influence of Metal Grain Structure on the Attenuation of an Ultrasonic Acoustic Wave; California Institute of Technology: Pasadena, CA, USA, 1950. [Google Scholar]
  15. Guo, S.; Dai, Q.; Sun, X.; Sun, Y. Ultrasonic scattering measurement of air void size distribution in hardened concrete samples. Constr. Build. Mater 2016, 113, 415–422. [Google Scholar] [CrossRef]
  16. Boumiz, A.; Vernet, C.; Tenoudji, F.C. Mechanical properties of cement pastes and mortars at early ages: Evolution with time and degree of hydration. Adv. Cem. Based Mater. 1996, 3, 94–106. [Google Scholar] [CrossRef]
  17. Carette, J.; Staquet, S. Monitoring the setting process of mortars by ultrasonic P and S-wave transmission velocity measurement. Constr. Build. Mater 2015, 94, 196–208. [Google Scholar] [CrossRef]
  18. Carette, J.; Staquet, S. Monitoring the setting process of eco-binders by ultrasonic P-wave and S-wave transmission velocity measurement: Mortar vs. concrete. Constr. Build. Mater 2016, 110, 32–41. [Google Scholar] [CrossRef]
  19. Subramaniam, K.V.; Shaw, C.K.; Subramaniam, K.V. Ultrasonic technique for monitoring concrete strength gain at early age. Mater. J. 2002, 99, 458–462. [Google Scholar]
  20. Qixian, L.; Bungey, J. Using compression wave ultrasonic transducers to measure the velocity of surface waves and hence determine dynamic modulus of elasticity for concrete. Constr. Build. Mater 1996, 10, 237–242. [Google Scholar] [CrossRef]
  21. Trtnik, G.; Gams, M. Ultrasonic assessment of initial compressive strength gain of cement based materials. Cem. Concr. Res. 2015, 67, 148–155. [Google Scholar] [CrossRef]
  22. Carette, J.; Staquet, S. Monitoring and modelling the early age and hardening behaviour of eco-concrete through continuous non-destructive measurements: Part II. Mechanical behaviour. Cem. Concr. Compos. 2016, 73, 1–9. [Google Scholar] [CrossRef]
  23. Neville, A.M. Properties of Concrete; Longman Group UK Limited: Harlow, UK, 1995. [Google Scholar]
  24. Wong, H.; Pappas, A.M.; Zimmerman, R.W.; Buenfeld, N.R. Effect of entrained air voids on the microstructure and mass transport properties of concrete. Cem. Concr. Res. 2011, 41, 1067–1077. [Google Scholar] [CrossRef]
  25. Gutmann, P.F. Bubble characteristics as they pertain to compressive strength and freeze-thaw durability. MRS Proc. 1987, 114, 128–130. [Google Scholar]
  26. Vosahlik, J.; Riding, K.; Esmaeily, A.; Billinger, A.; Mcleod, H. Effects of Air Void Clustering on Concrete Compressive Strength. ACI Mater. J. 2016, 113, 759–767. [Google Scholar] [CrossRef]
  27. Hover, K.C. Some recent problems with air-entrained concrete. Cement. Concr. Aggreg. 1989, 11, 67–72. [Google Scholar]
  28. Ying, C.; Truell, R. Scattering of a plane longitudinal wave by a spherical obstacle in an isotropically elastic solid. J. Appl. Phys. 1956, 27, 1086–1097. [Google Scholar] [CrossRef]
  29. Demčenko, A.; Visser, H.; Akkerman, R. Ultrasonic measurements of undamaged concrete layer thickness in a deteriorated concrete structure. NDT E Int. 2016, 77, 63–72. [Google Scholar]
  30. Larose, E.; Hall, S. Monitoring stress related velocity variation in concrete with a 2 × 10⁻⁵ relative resolution using diffuse ultrasound. J. Acoust. Soc. Am. 2009, 125, 1853–1856. [Google Scholar] [CrossRef] [PubMed]
  31. Sears, F.M.; Bonner, B.P. Ultrasonic attenuation measurement by spectral ratios utilizing signal processing techniques. IEEE Trans. Geosci. Remote Sens. 1981, 2, 95–99. [Google Scholar] [CrossRef]
  32. Rogers, P.H.; van Buren, A.L. An exact expression for the Lommel-diffraction correction integral. J. Acoust. Soc. Am. 1974, 55, 724–728. [Google Scholar] [CrossRef]
  33. Cheeke, J.D.N. Fundamentals and Applications of Ultrasonic Waves; CRC Press: New York, NY, USA, 2012. [Google Scholar]
  34. ASTM C192/C192M-16a. Standard Practice for Making and Curing Concrete Test Specimens in the Laboratory; ASTM International: West Conshohocken, PA, USA, 2016. [Google Scholar]
  35. ASTM C138/C138M-16a. Standard Test Method for Density (Unit Weight), Yield, and Air Content (Gravimetric) of Concrete; ASTM International: West Conshohocken, PA, USA, 2016. [Google Scholar]
  36. ASTM C39/C39M-16. Standard Test Method for Compressive Strength of Cylindrical Concrete Specimens; ASTM International: West Conshohocken, PA, USA, 2016. [Google Scholar]
  37. Giatec Scientific Inc. RCON2 User Manual; Giatec Scientific Inc.: Ottawa, ON, Canada, 2016. [Google Scholar]
  38. Scrivener, K.L.; Crumbie, A.K.; Laugesen, P. The interfacial transition zone (ITZ) between cement paste and aggregate in concrete. Interface Sci. 2004, 12, 411–421. [Google Scholar] [CrossRef]
  39. Mehta, P.K. Concrete. Structure, Properties and Materials; Prentice-Hall: Englewood Cliffs, NJ, USA, 1986. [Google Scholar]
  40. Vollpracht, A.; Lothenbach, B.; Snellings, R.; Haufe, J. The pore solution of blended cements: A review. Mater. Struct. 2016, 49, 3341–3367. [Google Scholar] [CrossRef]
  41. Peterson, K.K.W.; Anzalone, G.C.; Nezami, S.; Oh, C.Y.S.; Lu, H. Robust Test of the Flatbed Scanner for Air-Void Characterization in Hardened Concrete. Evaluation 2016, 44, 1–16. [Google Scholar] [CrossRef]
  42. Schneider, C.A.; Rasband, W.S.; Eliceiri, K.W. NIH Image to ImageJ: 25 years of image analysis. Nat. Methods 2012, 9, 671–675. [Google Scholar] [CrossRef] [PubMed]
  43. Martins, L.; Vasconcelos, G.; Lourenço, P.B.; Palha, C. Influence of the Freeze-Thaw Cycles on the Physical and Mechanical Properties of Granites. J. Mater. Civ. Eng. 2015, 28, 04015201. [Google Scholar] [CrossRef]
  44. ASTM C666/C666M-15. Standard Test Method for Resistance of Concrete to Rapid Freezing and Thawing; ASTM International: West Conshohocken, PA, USA, 2015. [Google Scholar]
  45. ASTM C215-14. Standard Test Method for Fundamental Transverse, Longitudinal, and Torsional Resonant Frequencies of Concrete Specimens; ASTM International: West Conshohocken, PA, USA, 2014. [Google Scholar]
  46. Kinsler, L.E.; Frey, A.R.; Coppens, A.B.; Sanders, J.V. Fundamentals of acoustics. In Fundamentals of Acoustics, 4th ed.; Kinsler, L.E., Frey, A.R., Coppens, A.B., James, V., Sanders, J.V., Eds.; Wiley-VCH: Weinheim, Germany, 1999; p. 560. [Google Scholar]
  47. Teller, L. Elastic properties. Signif. Tests Prop. Concr. Concr. Aggreg. 1956, 169, 94. [Google Scholar]
Figure 1. Demonstration of the ultrasonic scattering measurement of air void size distribution in concrete samples.
Applsci 07 00290 g001
Figure 2. Magnitude spectrum of the cement paste sample ultrasonic results.
Applsci 07 00290 g002
Figure 3. The attenuation measurement results with a polymethylmethacrylate material sample. (a) The magnitude spectrum of the first and second transmission wave after Fourier transformation; (b) The curve fitting based on the experimentally measured ultrasonic attenuation.
Applsci 07 00290 g003
Figure 4. The curve fitting of the early-age cement paste attenuation with frequency. (a) Curve fitting at Day 1; (b) Curve fitting at Day 3; (c) Curve fitting at Day 7; (d) Curve fitting at Day 14.
Applsci 07 00290 g004
Figure 5. The comparison between theoretical and experimental attenuation during early stages (a) The comparison at Day 1; (b) The comparison at Day 3; (c) The comparison at Day 7; (d) The comparison at Day 14.
Applsci 07 00290 g005
Figure 6. Air voids evolution for Sample Type 1. (a) The change of air void content with curing age measured with ultrasonic scattering (at early stages Days 1–28) and the ASTM C138 (Day 0); (b) Air void size distribution evolution with curing time.
Applsci 07 00290 g006
Figure 7. Air voids evolution for Sample Type 2. (a) The change of air void content with curing age measured with ultrasonic scattering (at early stages Day 1–28) and the ASTM C138 (Day 0); (b) Air void size distribution evolution with curing time.
Applsci 07 00290 g007
Figure 8. Air voids evolution for Sample Type 3. (a) Comparison of the air void content measurement with ultrasonic scattering (at early stages Day 1–28) and the ASTM C138 (Day 0); (b) Air void size distribution evolution with curing time.
Applsci 07 00290 g008
Figure 9. The comparison between the fitted and measured compressive strength. (a) The fit between the compressive strength and ultrasonic speed; (b) The fit between compressive strength and ultrasonic attenuation.
Applsci 07 00290 g009
Figure 10. Scanned pattern of concrete slabs from the ASTM (American Society for Testing and Materials) C457 Test. (a) The scanned results of Sample Type 1; (b) The scanned results of Sample Type 2; (c) The scanned results of Sample Type 3d; (d) The demonstration of the Interfacial Transition Zone (ITZ) area (Area d)) in Sample Type 1; (e) The demonstration of the ITZ area (Area e)) in Sample Type 2; (f) The demonstration of the ITZ area (Area f)) in Sample Type 3.
Applsci 07 00290 g010
Figure 11. Comparison between the air void size distribution measurement with ultrasonic scattering and ASTM C 457 methods. (a) The comparison for Sample Type 1; (b) The comparison for Sample Type 2; (c) The comparison for Sample Type 3.
Applsci 07 00290 g011
Figure 12. Comparison of the air void size distribution in the small size range. (a) The comparison of the experimental result and the theoretical result on the small-size air voids range for Sample Type 1; (b) The comparison of the experimental result and the theoretical result on the small-size air voids range for Sample Type 2; (c) The comparison of the experimental result and the theoretical result on the small-size air voids range for Sample Type 3.
Applsci 07 00290 g012
Table 1. Lab concrete mixture proportional design for early-age concrete studies.
SampleCement Content (kg/m3)Coarse Aggregates (kg/m3)Fine Aggregates (kg/m3)Water (kg/m3)Glass Particle (kg/m3)Design w/cAir entrainment Agent (mL/m3)
Type 1334.6
(sg * = 3.15)
1110.7
(sg = 2.75)
666.4
(sg = 2.65)
148.474.0
(sg = 2.5)
0.450
Type 2334.6
(sg = 3.15)
1110.7
(sg = 2.75)
666.4
(sg = 2.65)
148.474.0
(sg = 2.5)
0.45167.5
Type 3334.6
(sg = 3.15)
1110.7
(sg = 2.75)
666.4
(sg = 2.65)
148.474.0
(sg = 2.5)
0.45335.0
* sg is short for specific gravity.
Table 2. Properties of concrete samples during the early stages.
SampleCompressive Strength (MPa)Ultrasonic Transmission Speed (m/s)Ultrasonic Transmission Attenuation at 500 KHz (Np/m)Electrical Resistivity (Ω·m)
Day 3Day 7Day 28Day 3Day 7Day 28Day 3Day 7Day 28Day 3Day 7Day 28
Type 135.842.448.74468.24507.84612.9128.1116.7105.347.351.257.3
Type 229.037.745.14243.94311.74488.4134.7120.8112.149.154.675.1
Type 320.125.130.03788.93824.14024.2155.0141.2129.447.587.6116.5
Table 3. Inverse analysis of parameters for combined distributions.
SampleSmall Air VoidsLarge Air VoidsTotal air Void Content (%) ϕ
Volume Fraction (%) ϕ 1 Average Size(mm) μnormStandard Deviation σnormVolume Fraction (%) ϕ 2 Average Size(mm) μ l o g n o r m Standard Deviation σ log n o r m
Sample Type 121.26.3 × 10−41.43.23 × 10−73.4
Sample Type 25.40.88 × 10−41.42.82 × 10−76.8
Sample Type 38.60.31.1 × 10−31.43.02 × 10−710.0
Table 4. Properties of concrete samples during the early stages .
SampleMass Density at Hardened Stage (kg/m3)Ultrasonic Transmission Speed (m/s)Predicted Dynamic Modulus (GPa)Measured Dynamic Modulus (GPa)Relative Errors (%)
Type 12.304612.941.543.34.2%
Type 22.234488.439.237.51.6%
Type 32.164024.231.631.70.3%

