
Infrared Spectroscopy for Studying Structure and Aging Effects in Rhamnolipid Biosurfactants


1
Technische Thermodynamik and MAPEX Center for Materials and Processes, Universität Bremen, Badgasteiner Straße 1, 28215 Bremen, Germany
2
School of Engineering, University of Aberdeen, Fraser Noble Building, Aberdeen AB24 3UE, UK
3
Erlangen Graduate in Advanced Optical Technologies (SAOT), Friedrich-Alexander-Universität Erlangen-Nürnberg, 91054 Erlangen, Germany
4
School of Chemical Engineering and Analytical Science, The University of Manchester, Manchester M13 9PL, UK
5
Department of Biological and Agricultural Engineering, Faculty of Engineering, Universiti Putra Malaysia, Serdang 43400, Malaysia
*
Author to whom correspondence should be addressed.
Appl. Sci. 2017, 7(5), 533; https://0-doi-org.brum.beds.ac.uk/10.3390/app7050533
Submission received: 23 April 2017
/
Revised: 18 May 2017
/
Accepted: 19 May 2017
/
Published: 22 May 2017
(This article belongs to the Special Issue Optics and Spectroscopy for Fluid Characterization)
Abstract
:Biosurfactants are produced by microorganisms and represent amphiphilic compounds with polar and non-polar moieties; hence they can be used to stabilize emulsions, e.g., in the cosmetic and food sectors. Their structure and its changes when exposed to light and elevated temperature are yet to be fully understood. In this study, we demonstrate that attenuated total reflection infrared (ATR-IR) spectroscopy is a useful tool for the analysis of biosurfactants, using rhamnolipids produced by fermentation as an example. A key feature is that the analytical method does not require sample preparation despite the high viscosity of the purified natural product.
1. Introduction
Surface-active compounds that are produced by microorganisms are commonly referred to as biosurfactants [1]. Biosurfactants have been experiencing an ever-increasing interest in recent years because they have many potential commercial applications, e.g., in the food, personal care, and pharmaceutical sectors. Moreover, they have a number of advantageous properties including their low toxicity and biodegradability.
Rhamnolipids are a type of glycolipid biosurfactants. They consist of a glycosyl head group in terms of a rhamnose moiety and a fatty acid tail. Rhamnolipids are commonly produced by various strains of the microorganism Pseudomonas aeruginosa [2], a Gram-negative, rod-shaped bacterium. The type of rhamnolipid produced depends on the culture conditions, carbon source used, and the microbial strain [3]. The two main types of rhamnolipids are mono-rhamnolipids and di-rhamnolipids, which contain one or two rhamnose units, respectively.
The analysis of rhamnolipids is commonly done off-line using chromatographic and mass spectrometric methods [4,5]. These methods require sampling and, in addition, often sample preparation. Therefore, they are not suitable for in-line or on-line monitoring of the production process, or to do rapid screening of the final product. The fast analysis with minimal sample preparation is a major challenge here, but it could revolutionize the production and quality control of biosurfactants. Vibrational spectroscopy in terms of infrared (IR) and Raman spectroscopy can be a solution [6,7,8]. Especially IR spectroscopy, when performed in attenuated-total reflection (ATR) mode, seems to be a good option as it can be applied to opaque samples. In ATR-IR spectroscopy, the infrared radiation is propagating in a material with a refractive index (often referred to as internal reflection element, IRE) that is higher than that of the sample. Consequently, the radiation can undergo total internal reflection at the sample/IRE interface. Due to the light-matter-interaction in the evanescent field, the reflected radiation carries information about the absorption spectrum [9]. The penetration depth of the evanescent field in the sample is typically of the order of one micrometer [10,11].
To date, only a few studies reporting the application of vibrational spectroscopy to rhamnolipids have been published. Li et al. [12] applied IR spectroscopy together with a variety of analytical methods to a rhamnolipid-layered double hydroxide (RL-LDH) nanocomposite material. They aimed at a comprehensive characterization of the material and at unravelling how the rhamnolipid anions are introduced into the interlayers of LDH. ATR-IR spectroscopy for the qualitative identification of rhamnolipids produced in fermentation processes has been reported as well [13,14,15,16,17,18,19].
The present study aims at testing the potential of ATR-IR for the structural analysis and the investigation of aging effects of rhamnolipids. For this purpose, rhamnolipids have been produced and purified. IR spectroscopic analysis was performed after the purification process and after five months of storage, during which the samples were kept at room temperature.
2. Materials and Methods
The rhamnolipid samples were produced by Pseudomonas aeruginosa PAO1 which was supplied by Ulster University (Coleraine, Northern Ireland) from their collection. To purify the product, solid phase extraction (SPE) was used in normal phase mode using silica as the sorbent. A detailed description of the production and processing can be found in a recent article [20]. Five different runs resulted in five different samples. Due to the production in a biological process, the chemical composition of the samples varies. The samples were initially analyzed after the purification and a second time after keeping them at room temperature for five months. The second series of measurements was carried to test whether or not any signs of aging and deterioration can be observed in the spectra.
ATR-IR spectra were acquired on an Agilent Cary 630 (Agilent Technologies, Santa Clara, CA, USA) equipped with a diamond ATR unit (1 reflection, 45°). The range 4000–650 cm−1 was recorded with a nominal resolution of 2 cm−1. To obtain an appropriate signal-to-noise ratio, 16 scans were averaged for each sample. The rhamnolipids had a high viscosity and are sticky. Prior to each measurement, the diamond crystal was cleaned using 2-propanol, ethanol, and acetone. Three measurements of individual samples taken from the five products obtained in different runs of the bioreactor were carried out to check the reproducibility and potential inhomogeneities. The differences observed were negligible and the spectra shown later represent the average of the three acquisitions.
3. Results
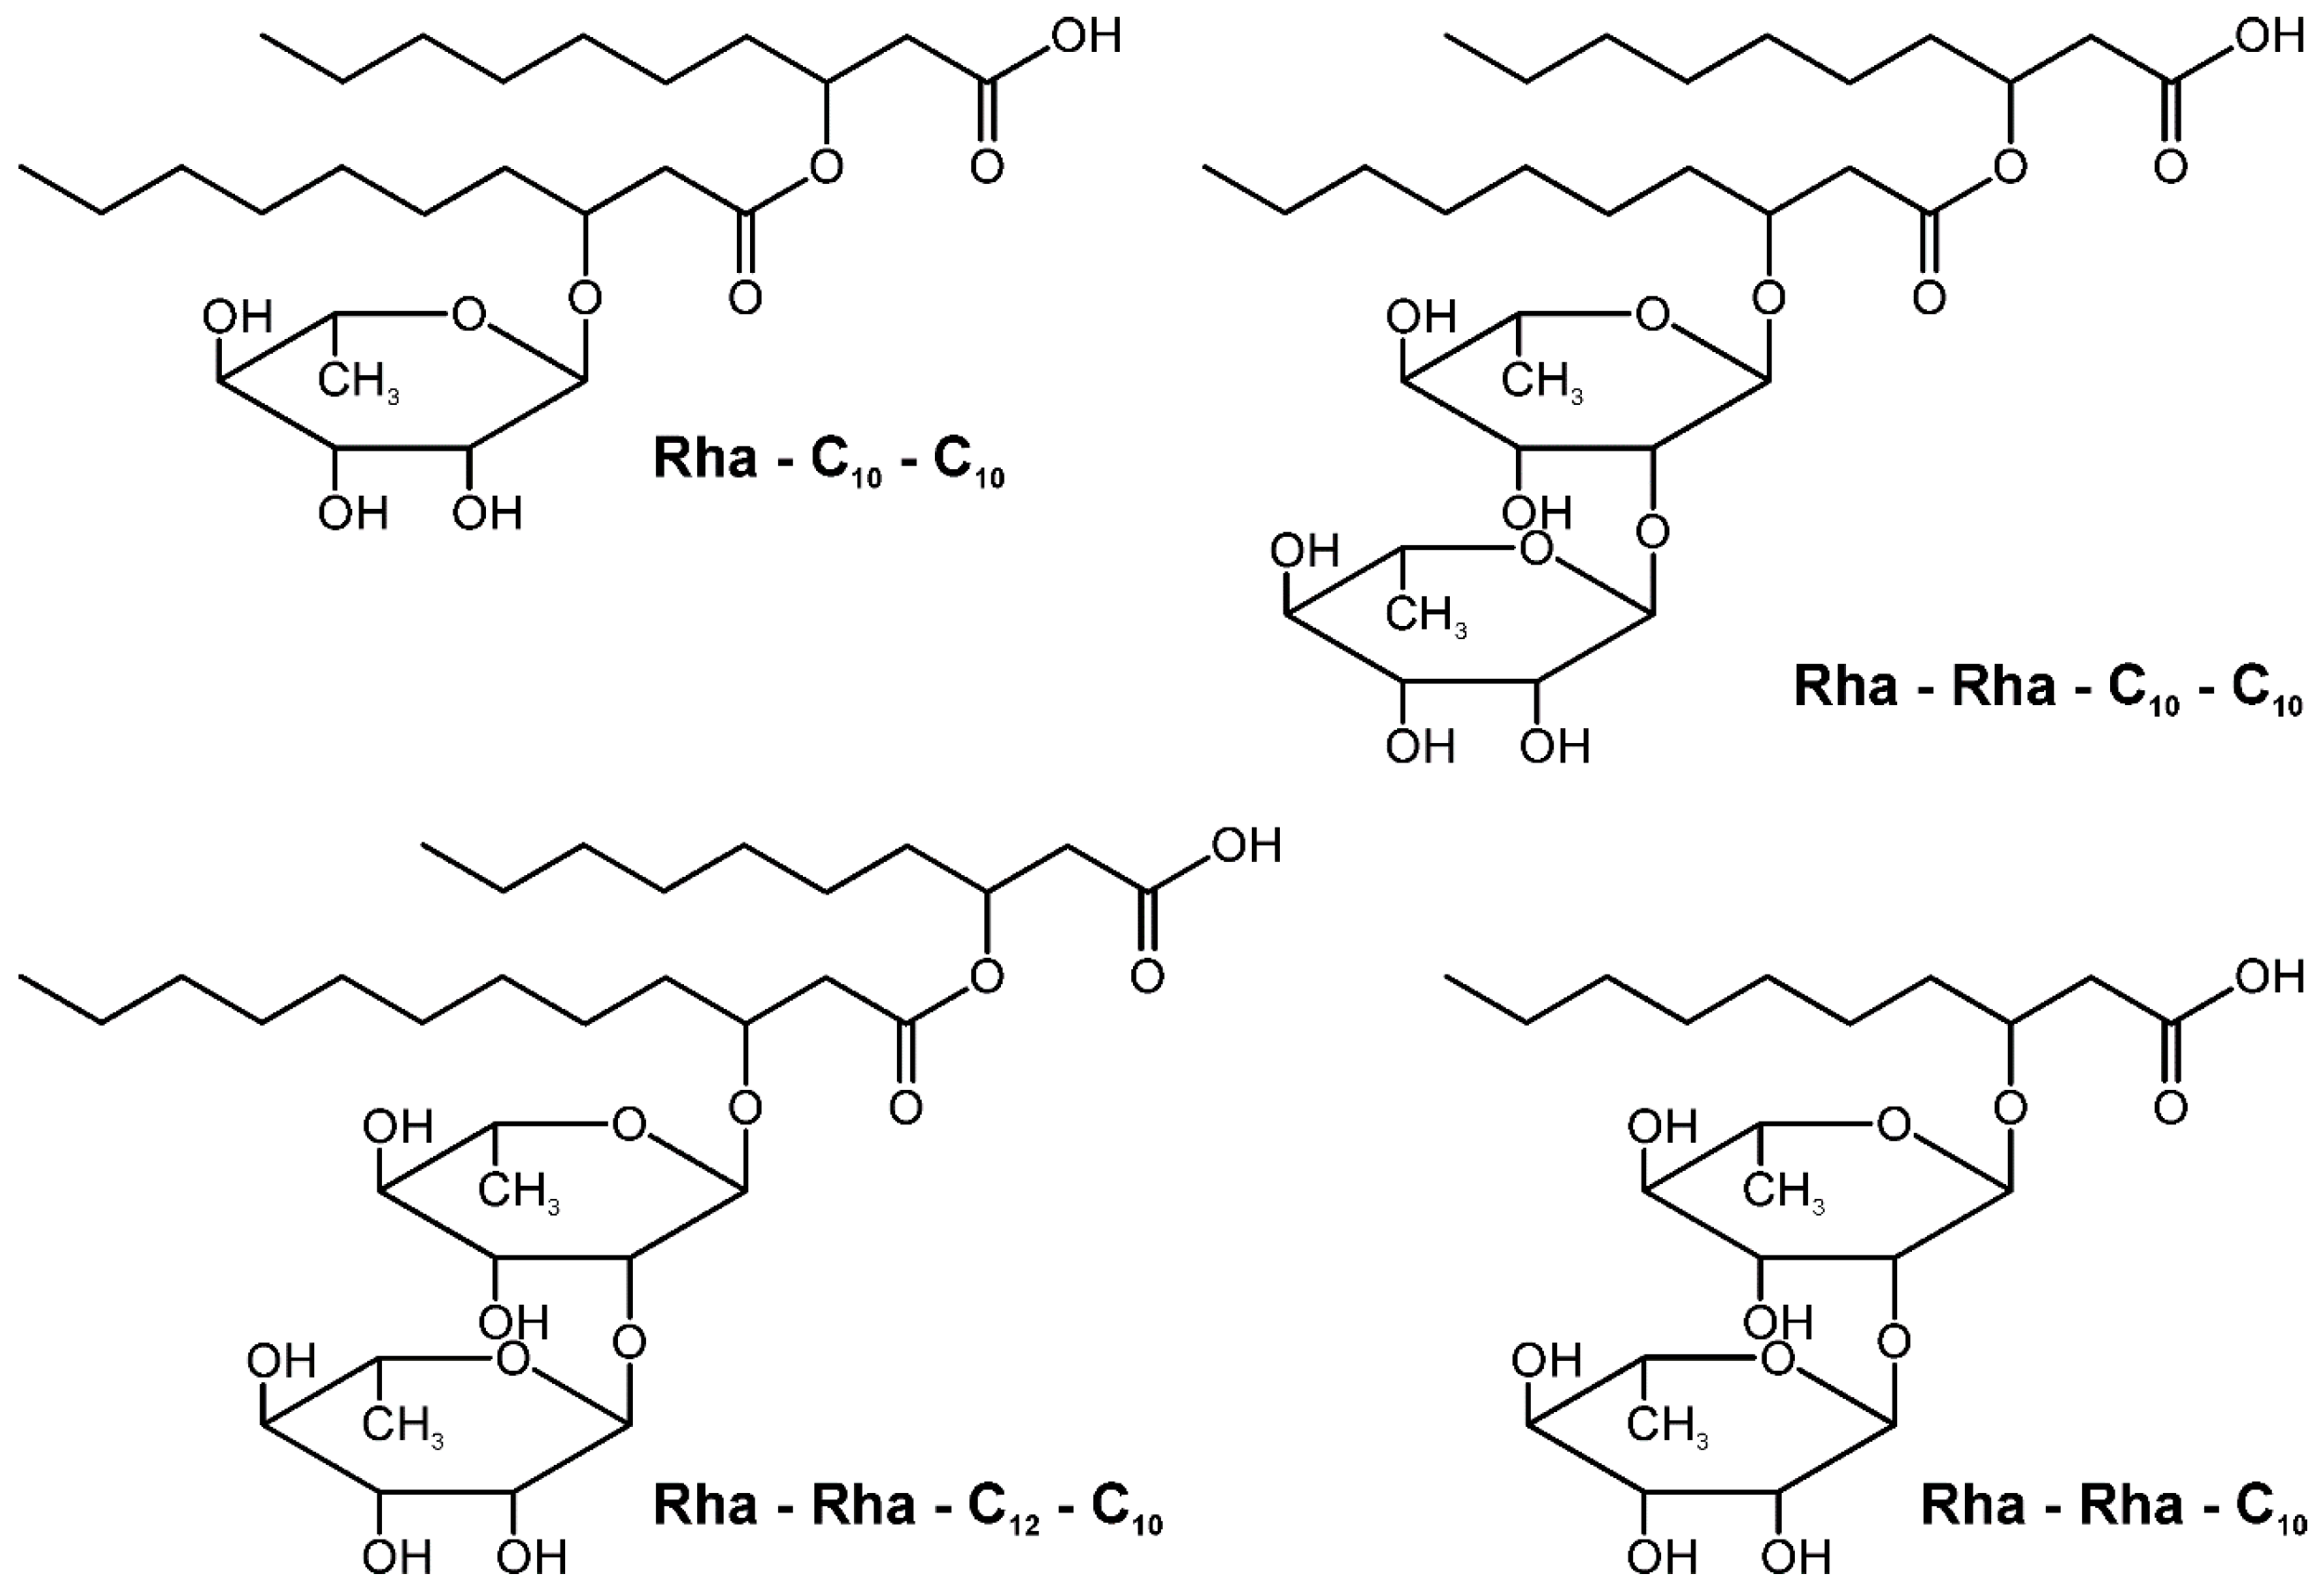
As natural products, rhamnolipids are a class of compounds rather than a pure substance. Key characteristics of a sample are the number of rhamnose and carboxylic acid/ester units. Figure 1 illustrates the structures of four common compounds contained in a rhamnolipid biosurfactant. The most common rhamnolipids comprise of one or two rhamnose units and one or two fatty acid chains with C10 or C12 chain length. The distinction between mono- and di-rhamnolipids is the most important task for an analytical tool [21,22].
Figure 2 displays the spectra of the five different samples obtained from different fermentation experiments. Note that the diamond crystal has very low transmission between 1900 and 2300 cm−1; hence, the spectra exhibit experimental artifacts rather than meaningful signatures in this range. Most of the rest of the spectrum can be interpreted in a straightforward manner and Table 1 summarizes the observed signatures. The broad band between 3700 and 3100 cm−1 is due to O–H stretching vibrations. The range 3100–2700 cm−1 contains the C–H stretching modes. The fingerprint region, i.e., below 1750 cm−1, is very rich in information. At 1707 cm−1 the C=O stretching mode of the carboxylic acid groups can be found. The high-wavenumber wing of this band shows a shoulder bands at ~1740 cm−1, which can be attributed to C=O stretching of the ester groups. At lower wavenumbers, the C–H bending; C–C and C–O stretching; and a multitude of rocking, scissoring, wagging, and twisting modes can be found. A detailed assignment is rather complicated as all these modes can be overlapping with each other, and hence the assignment in Table 1 is a tentative one. However, as aforesaid, the main task is to distinguish between the different classes of compounds. Therefore, we focus on the differences of the spectra.
The spectra of the five samples suggest that there are two groups of spectra exhibiting significant similarities: (1) R1 and R2; and (2) R3, R4, and R5. This visual observation has been confirmed by a principal component analysis. Four features highlighting spectral differences are marked by arrows in Figure 2. The most distinguishable signatures that are present only or at least significantly stronger in R1 and R2 can be found at 1592, 1484, 1380, 1241, and 850 cm−1. The band at 1592 cm−1 is likely due to the anti-symmetric stretching of deprotonated carboxylate groups. While R1 and R2 exhibit a distinct peak, there are weak shoulder bands at this position. The same observation is made at 1380 cm−1, which can be attributed to the corresponding symmetric mode. The other bands that appear differently for R1 and R2 and R3–5 are related with CH deformation vibrations and hence it is difficult to assign them unambiguously to specific structural differences without involving further analytical techniques.
Further differences between R1 and R2 and R3–5 are found at high wavenumber. The O–H stretching band around 3300 cm−1 is stronger in R3–5. The latter indicates that the R1 and R2 samples contain a lower number of rhamnose units. Probably, mono-rhamnolipids are dominating here while di-rhamnolipids are mainly present in R3–5. The presence of mainly di-rhamnolipids was also suggested by reference measurements with mass spectrometry, see Table 2. The enhanced IR signatures at around 1600 and 1240 cm−1 in the R1 and R2 samples can be attributed to ester groups indicating that these samples contain more fatty acids than R3–5. Hence, we can conclude that the IR spectrum is a suitable indicator of the structure and of the number of rhamnose units.
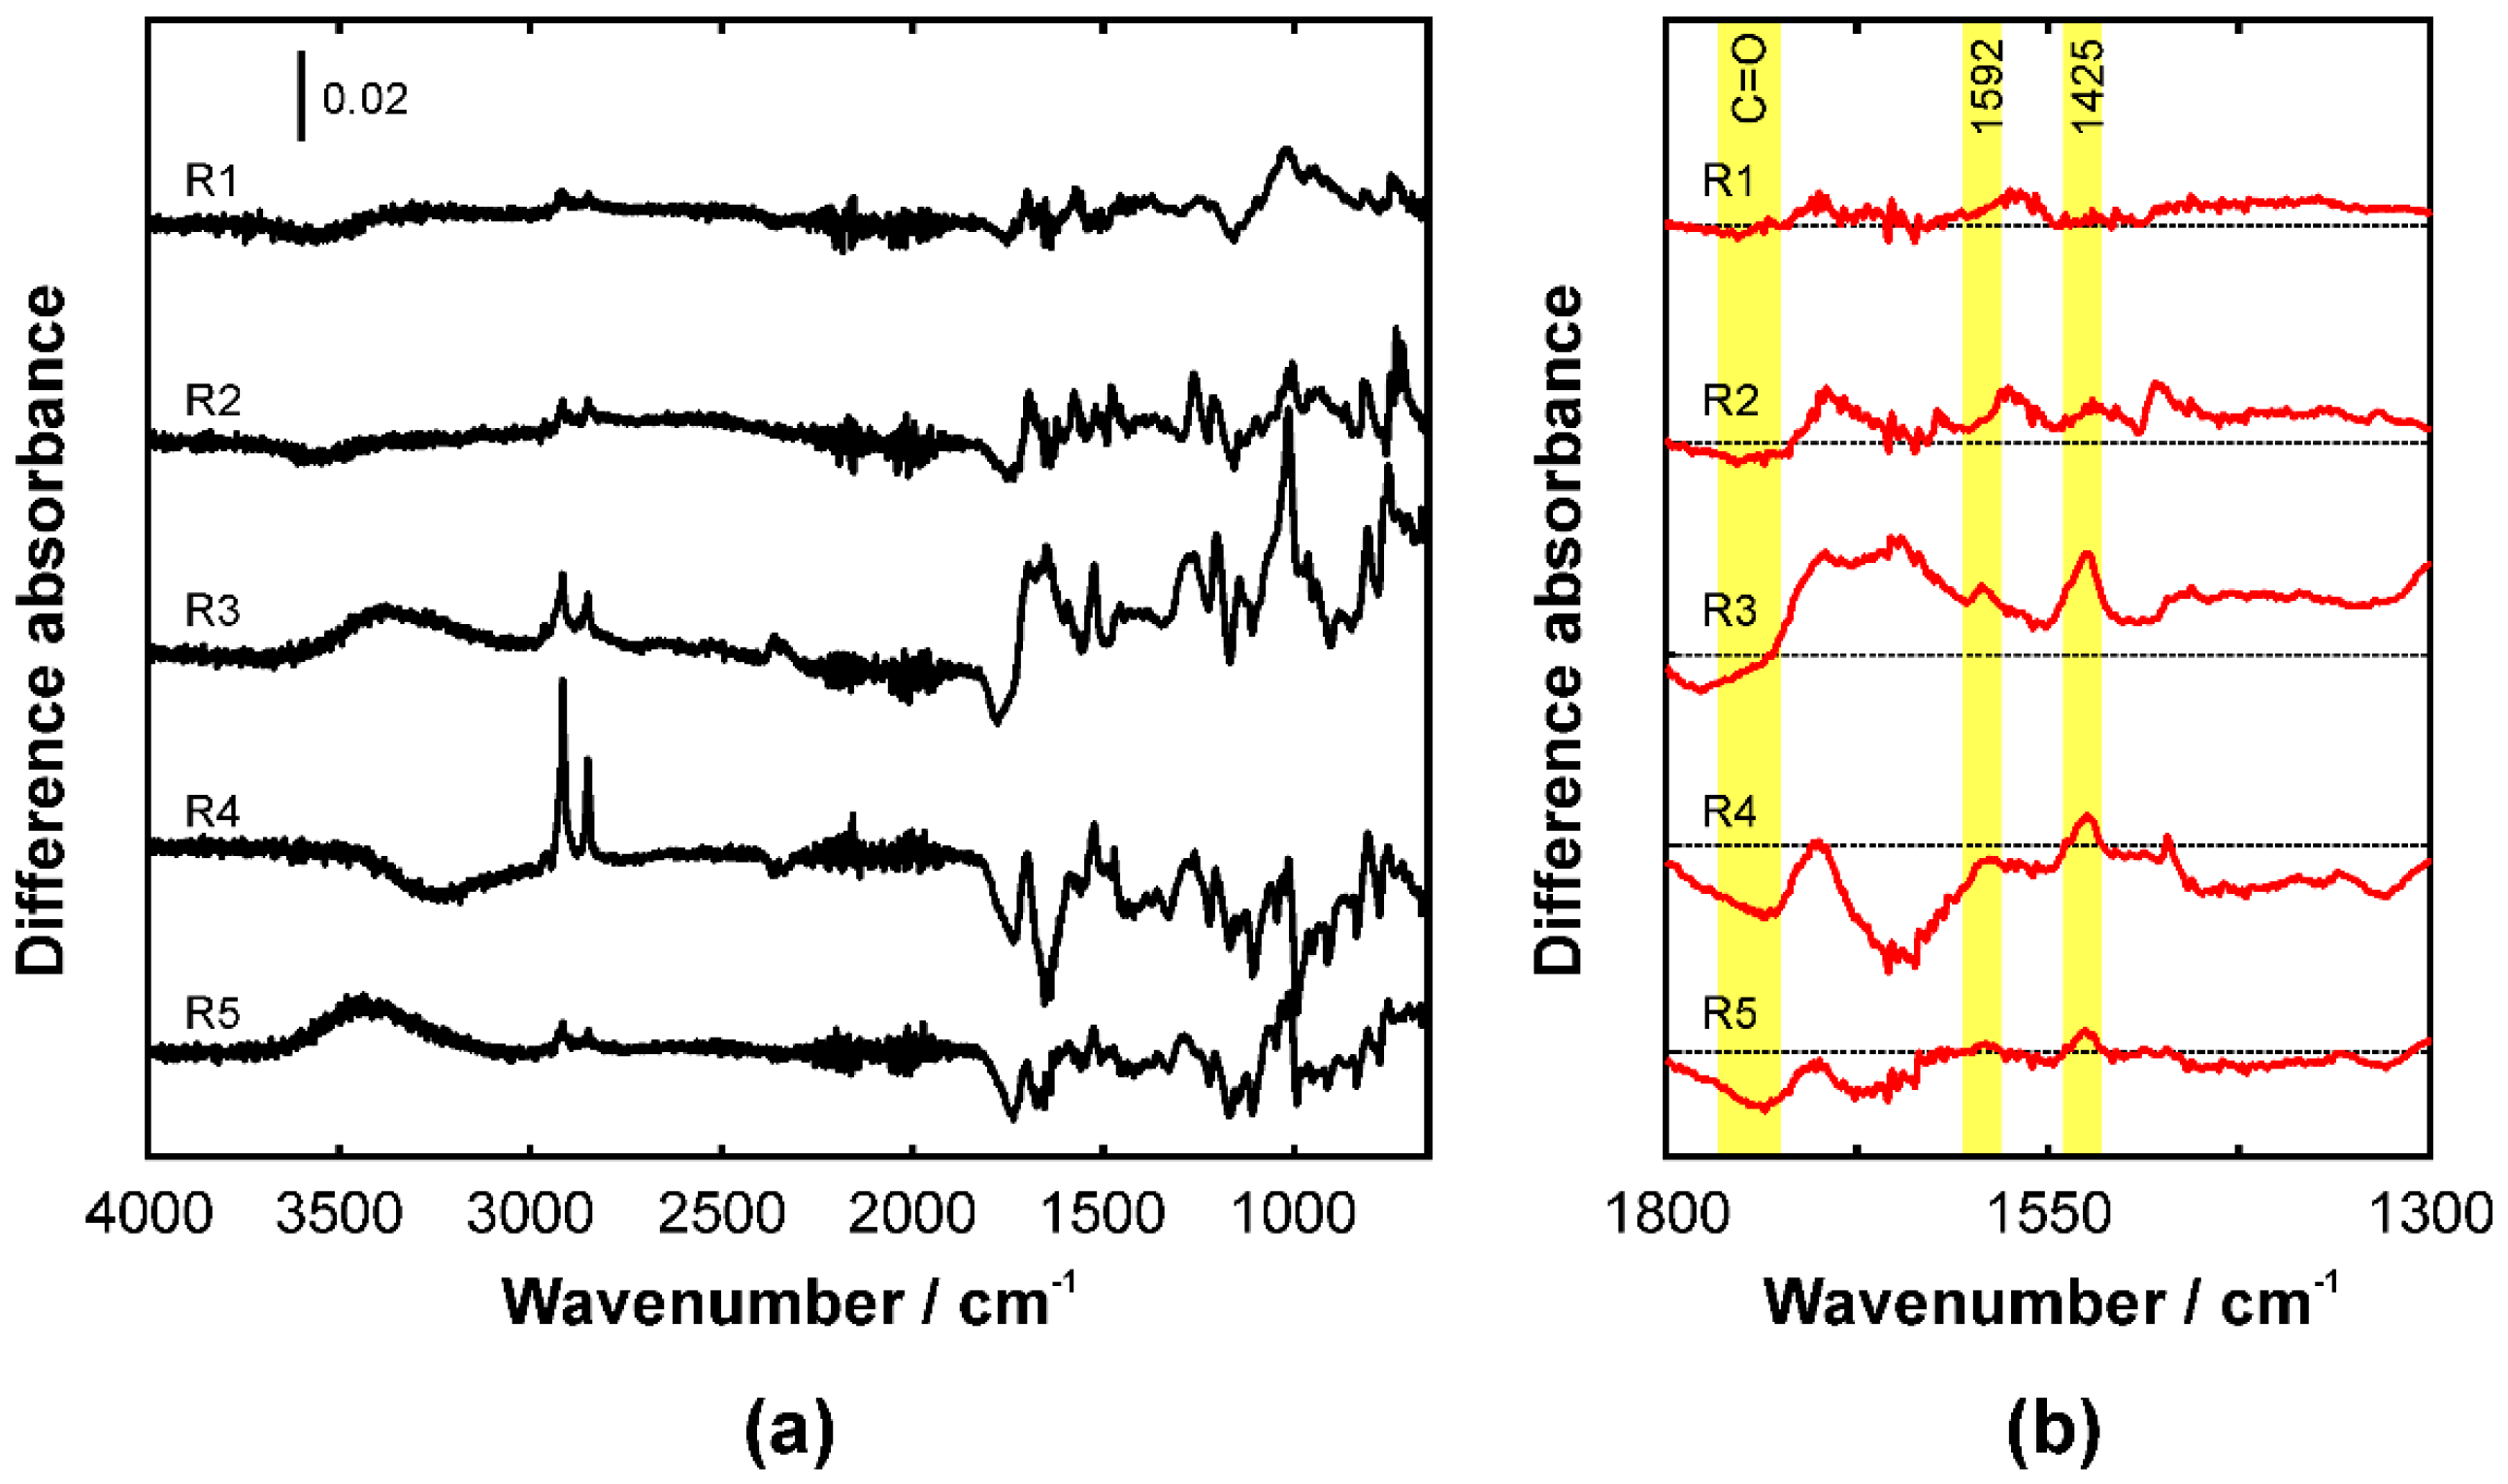
In order to analyze whether or not ATR-IR spectroscopy can be used to study aging effects as well, a second set of spectra was recorded after five months. During this period, the samples were kept at room temperature (298 K) but in darkness to avoid additional effects due to photo bleaching. Figure 3 shows the difference spectra between the initial and aged samples. Consequently, positive contributions mean that the signature reduced in absorbance over time; negative contributions mean the opposite.
As there are clear changes in the spectra, it can be concluded that aging takes place. On the other hand, there are only a few signatures in the difference spectra that are similar in all five cases, e.g., the positive double peak in the CH stretching region. The initial spectra exhibit four main peaks in this range: 2954, 2924, 2871, and 2854 cm−1. The two peaks in the difference spectra are at 2915 and 2850 cm−1. The 2954 and 2924 cm−1 peaks can be assigned to the anti-symmetric stretching modes of the CH3 and CH2 groups, respectively. The peaks at 2871 and 2854 cm−1 are due to the corresponding symmetric modes. The observed behavior indicates a decrease in the number of CH2 groups. The dissociation of the fatty acid chains can explain this. Further support for the hypothesis that the fatty acid part of the rhamnolipids is mainly affected during the aging is provided by the negative contribution around 1700 cm−1. In this region, the C=O stretching modes of the ester groups can be found. The spectra suggest that these groups are increasing during aging. This could be interpreted in terms of an ongoing esterification reaction. Unravelling the detailed mechanisms, however, would require further analysis and additional methods. This is beyond the scope of the present study.
4. Conclusions
In this study, the application of infrared spectroscopy to rhamnolipid biosurfactants has been demonstrated. Five samples of rhamnolipids have been produced by fermentation and purified prior to the IR analysis. The IR spectra indicate that some samples are dominated by mono- and other by di-rhamnolipids. Moreover, measurements of the samples after five months of aging at room temperature indicate systematic changes in the chemical structure. These changes are mainly attributed to vibrational signatures of the fatty acid groups. In conclusion, our study shows that IR spectroscopy is capable of analyzing the chemical structure of biosurfactants and monitoring their aging. Future work in our labs will focus on systematic investigations of the aging effects to unravel the detailed molecular mechanisms. For this purpose, single compound reference samples will be analyzed during treatment with heat and ultraviolet radiation.
Acknowledgments
Johannes Kiefer gratefully acknowledges support from Deutsche Forschungsgemeinschaft (DFG) through grant KI1396/4-1. Mohd Nazren Radzuan gratefully acknowledges financial support from the Ministry of Education, Malaysia and the Department of Biological and Agricultural Engineering, Universiti Putra Malaysia under “Hadiah Skim Latihan IPTA (SLAI)”. The authors wish to thank Ibrahim M. Banat at Ulster University for supplying the microbial strain used in this study and Reynard Spiess at the Manchester Institute of Biotechnology, University of Manchester for assistance with mass spectroscopy.
Author Contributions
Mohd Nazren Radzuan and James Winterburn conceived and designed the fermentation experiments; Mohd Nazren Radzuan performed the experiments; Johannes Kiefer conceived and designed the IR experiments; Johannes Kiefer performed the IR experiments; Johannes Kiefer analyzed the IR data. All authors contributed to data interpretation and preparation of manuscript with Johannes Kiefer putting together the first draft.
Conflicts of Interest
The authors declare no conflict of interest. The founding sponsors had no role in the design of the study; in the collection, analyses, or interpretation of data; in the writing of the manuscript, or in the decision to publish the results.
References
- Abdel-Mawgoud, A.M.; Lépine, F.; Déziel, E. Rhamnolipids: Diversity of structures, microbial origins and roles. Appl. Microbiol. Biotechnol. 2010, 86, 1323–1336. [Google Scholar] [CrossRef] [PubMed]
- Henkel, M.; Müller, M.M.; Kügler, J.H.; Lovaglio, R.B.; Contiero, J.; Syldatk, C.; Hausmann, R. Rhamnolipids as biosurfactants from renewable resources: Concepts for next-generation rhamnolipid production. Process. Biochem. 2012, 47, 1207–1219. [Google Scholar] [CrossRef]
- Silva, S.N.R.L.; Farias, C.B.B.; Rufino, R.D.; Luna, J.M.; Sarubbo, L.A. Glycerol as substrate for the production of biosurfactant by Pseudomonas aeruginosa UCP0992. Colloids Surf. B 2010, 79, 174–183. [Google Scholar] [CrossRef] [PubMed]
- Behrens, B.; Helmer, P.O.; Tiso, T.; Blank, L.M.; Hayen, H. Rhamnolipid biosurfactant analysis using on-line turbulent flow chromatography-liquid chromatography-tandem mass spectrometry. J. Chromatogr. A 2016, 1465, 90–97. [Google Scholar] [CrossRef] [PubMed]
- Behrens, B.; Engelen, J.; Tiso, T.; Blank, L.M.; Hayen, H. Characterization of rhamnolipids by liquid chromatography/mass spectrometry after solid-phase extraction. Anal. Bioanal. Chem. 2016, 408, 2505–2514. [Google Scholar] [CrossRef] [PubMed]
- Noack, K.; Eskofier, B.; Kiefer, J.; Dilk, C.; Bilow, G.; Schirmer, M.; Buchholz, R.; Leipertz, A. Combined shifted-excitation Raman difference spectroscopy and support vector regression for monitoring the algal production of complex polysaccharides. Analyst 2013, 138, 5639–5646. [Google Scholar] [CrossRef] [PubMed]
- Koch, C.; Posch, A.E.; Herwig, C.; Lendl, B. Comparison of Fiber Optic and Conduit Attenuated Total Reflection (ATR) Fourier Transform Infrared (FT-IR) Setup for In-Line Fermentation Monitoring. Appl. Spectrosc. 2016, 70, 1965–1973. [Google Scholar] [CrossRef] [PubMed]
- Zhao, L.; Fu, H.Y.; Zhou, W.C.; Hu, W.S. Advances in process monitoring tools for cell culture bioprocesses. Eng. Life Sci. 2015, 15, 459–468. [Google Scholar] [CrossRef]
- Griffiths, P.R.; De Haseth, J.A. Fourier Transform Infrared Spectrometry, 2nd ed.; Wiley: New York, NY, USA, 2007. [Google Scholar]
- Kiefer, J.; Frank, K.; Schuchmann, H.P. Attenuated total reflection infrared (ATR-IR) spectroscopy of a water-in-oil emulsion. Appl. Spectrosc. 2011, 65, 1024–1028. [Google Scholar] [CrossRef] [PubMed]
- Averett, L.A.; Griffiths, P.R. Effective path length in attenuated total reflection spectroscopy. Anal. Chem. 2008, 80, 3045–3049. [Google Scholar] [CrossRef] [PubMed]
- Li, Y.; Bi, H.Y.; Jin, Y.S. Facile preparation of rhamnolipid-layered double hydroxide nanocomposite for simultaneous adsorption of p-cresol and copper ions from water. Chem. Eng. J. 2017, 308, 78–88. [Google Scholar] [CrossRef]
- Lahkar, J.; Borah, S.N.; Deka, S.; Ahmed, G. Biosurfactant of Pseudomonas aeruginosa JS29 against Alternaria solani: The causal organism of early blight of tomato. Biocontrol 2015, 60, 401–411. [Google Scholar] [CrossRef]
- Antoniou, E.; Fodelianakis, S.; Korkakaki, E.; Kalogerakis, N. Biosurfactant production from marine hydrocarbon-degrading consortia and pure bacterial strains using crude oil as carbon source. Front. Microbiol. 2015, 6, 274. [Google Scholar] [CrossRef] [PubMed]
- Zhao, F.; Zhang, J.; Shi, R.J.; Han, S.Q.; Ma, F.; Zhang, Y. Production of biosurfactant by a Pseudomonas aeruginosa isolate and its applicability to in situ microbial enhanced oil recovery under anoxic conditions. RSC Adv. 2015, 5, 36044–36050. [Google Scholar] [CrossRef]
- Moussa, T.A.A.; Mohamed, M.S.; Samak, N. Production and characterization of di-rhamnolipid produced by Pseudomonas aeruginosa TMN. Braz. J. Chem. Eng. 2014, 31, 867–880. [Google Scholar] [CrossRef]
- Singh, A.K.; Cameotra, S.S. Rhamnolipids Production by Multi-metal-Resistant and Plant-Growth-Promoting Rhizobacteria. Appl. Biochem. Biotechnol. 2013, 170, 1038–1056. [Google Scholar] [CrossRef] [PubMed]
- Raheb, J.; Hajipour, M.J. The Characterization of Biosurfactant Production Related to Energy Consumption of Biodesulfurization in Pseudomonas aeruginosa ATCC9027. Energy Sources A 2012, 34, 1391–1399. [Google Scholar] [CrossRef]
- Arutchelvi, J.; Doble, M. Characterization of glycolipid biosurfactant from Pseudomonas aeruginosa CPCL isolated from petroleum-contaminated soil. Lett. Appl. Microbiol. 2010, 51, 75–82. [Google Scholar] [CrossRef] [PubMed]
- Radzuan, M.N.; Banat, I.M.; Winterburn, J. Production and characterization of rhamnolipid using palm oil agricultural refinery waste. Bioresour. Technol. 2017, 225, 99–105. [Google Scholar] [CrossRef] [PubMed]
- Liu, J.F.; Wu, G.; Yang, S.Z.; Mu, B.Z. Structural characterization of rhamnolipid produced by Pseudonomas aeruginosa strain FIN2 isolated from oil reservoir water. World J. Microbiol. Biotechnol. 2014, 30, 1473–1484. [Google Scholar] [CrossRef] [PubMed]
- George, S.; Jayachandran, K. Analysis of Rhamnolipid Biosurfactants Produced Through Submerged Fermentation Using Orange Fruit Peelings as Sole Carbon Source. Appl. Biochem. Biotechnol. 2009, 158, 694–705. [Google Scholar] [CrossRef] [PubMed]
Figure 1.
Chemical structures of four typical rhamnolipid compounds.

Figure 2.
IR spectra of the five rhamnolipid samples. The arrows mark spectral position where significant changes can be observed.
Figure 2.
IR spectra of the five rhamnolipid samples. The arrows mark spectral position where significant changes can be observed.

Figure 3.
(a) Difference spectra of the initial and aged rhamnolipid samples; (b) zoomed in region between 1300 and 1800 cm−1.
Figure 3.
(a) Difference spectra of the initial and aged rhamnolipid samples; (b) zoomed in region between 1300 and 1800 cm−1.


Table 1.
Center wavenumbers of observed IR peaks in cm−1 and their tentative assignment. Some of the bands in the fingerprint region are not assigned due to possible ambiguity. s = shoulder, sym = symmetric, asym = anti-symmetric, str = stretching, bend = bending, sciss = scissoring, wag = wagging, rock = rocking.
| R1 | R2 | R3 | R4 | R5 | Assignment |
|---|---|---|---|---|---|
| ν/cm−1 | |||||
| 3274 | 3274 | 3288 | 3288 | 3285 | OH str |
| 2954s | 2954s | 2954s | 2954s | 2954s | CH3 asym str |
| 2926 | 2926 | 2926 | 2927s | 2926 | CH2 asym str |
| - | - | - | 2916 | - | CH2 asym str |
| 2871s | 2871s | 2871s | 2871s | 2871s | CH3 sym str |
| 2855 | 2855 | 2855 | 2850 | 2855 | CH2 sym str |
| 1740s | 1740s | 1740s | 1740s | 1740s | C=O str ester |
| 1707 | 1707 | 1707 | 1707 | 1707 | C=O str acid |
| 1669 | 1669 | 1647 | 1647 | 1647 | OH bend (residual water) |
| 1592 | 1592 | 1590s | 1591s | 1591s | COO asym str |
| 1527 | 1527 | 1527 | 1527 | 1527 | Residual CHCl3 |
| 1484 | 1484 | 1484s | - | - | Residual HCCl3 |
| 1442 | 1442 | 1442 | 1442 | 1442 | CH2 sciss |
| 1380 | 1380 | 1380s | 1380s | 1380s | COO sym str |
| 1292 | 1292 | 1297s | 1301s | 1301 | CH2 wag, COH bend |
| 1276s | 1277 | 1277 | 1274 | 1273 | CH2 wag, COH bend |
| 1241 | 1242 | 1242s | 1242s | 1242s | |
| 1214 | 1214 | 1207 | 1206 | 1206 | Residual CHCl3 |
| 1155 | 1155 | 1155 | 1156 | 1156 | CH rock |
| 1120 | 1120 | 1121 | 1121 | 1121 | CO str, CH rock |
| 1032 | 1032 | 1031 | 1031 | 1031 | CO str |
| 981 | 981 | 983 | 983 | 983 | |
| 964 | 964 | 965 | 965 | 966 | |
| 954s | 954s | - | - | - | |
| 918 | 918 | 917 | 917 | 918 | |
| 849 | 849 | 849 | 850s | 850s | |
| 818 | 818 | 818s | 818s | 818s | |
| 809 | 809 | 809 | 809 | 809 | |
| 752 | 753 | 755 | 756 | 756 | residual CHCl3 |
| - | 735s | - | - | - | CH rock |
| 724s | 723s | 724 | 724 | 724 | CH rock |
| 700 | 701 | 701 | 701 | 701 | CH rock |
Table 2.
Main peaks from the MS analysis and assignment.
| Rhamnolipid | m/z Value | Relative Intensity | Molecule Structure |
|---|---|---|---|
| Mono-rhamnolipid | 503 | 15 | Rha-C10-C10 |
| Di-rhamnolipid | 479 | 33 | Rha-Rha-C10 |
| 649 | 100 | Rha-Rha-C10-C10 | |
| 677 | 14 | Rha-Rha-C12-C10 |
© 2017 by the authors. Licensee MDPI, Basel, Switzerland. This article is an open access article distributed under the terms and conditions of the Creative Commons Attribution (CC BY) license (http://creativecommons.org/licenses/by/4.0/).
Share and Cite
MDPI and ACS Style
Kiefer, J.; Radzuan, M.N.; Winterburn, J. Infrared Spectroscopy for Studying Structure and Aging Effects in Rhamnolipid Biosurfactants. Appl. Sci. 2017, 7, 533. https://0-doi-org.brum.beds.ac.uk/10.3390/app7050533
AMA Style
Kiefer J, Radzuan MN, Winterburn J. Infrared Spectroscopy for Studying Structure and Aging Effects in Rhamnolipid Biosurfactants. Applied Sciences. 2017; 7(5):533. https://0-doi-org.brum.beds.ac.uk/10.3390/app7050533
Chicago/Turabian StyleKiefer, Johannes, Mohd Nazren Radzuan, and James Winterburn. 2017. "Infrared Spectroscopy for Studying Structure and Aging Effects in Rhamnolipid Biosurfactants" Applied Sciences 7, no. 5: 533. https://0-doi-org.brum.beds.ac.uk/10.3390/app7050533
Note that from the first issue of 2016, this journal uses article numbers instead of page numbers. See further details here.