1. Introduction
1.1. Motivation
In conventional power systems, almost 20% of the generation assets exist to meet the peak electrical demand only, which occurs within 5% of the total time [
1]. In order to deal with the peak demand problem in a more cost-effective way, demand response (DR) programs that enable various peak load management strategies have gained increasing interest over the last few years. These programs have recently concentrated on residential implementations in particular, since 20–40% of electric energy is consumed by residential consumers in most developed and developing countries [
2,
3]. In this regard, home energy management (HEM) systems play a vital role in improving the effectiveness of DR programs. These systems enable householders to participate in DR programs easily by manually or automatically controlling the appliances regarding different parameters such as electricity prices and end-user preferences [
4,
5].
The commonly used DR methods are classified into two groups in the literature: pricing-based programs (e.g., dynamic pricing) and incentive-based programs (e.g., direct load control (DLC)). The latter group, which is based on controlling the appliances of consumers in predefined time periods, is generally considered to be a more effective tool for alleviating the peak demand [
6]. However, the effectiveness of these methods is significantly influenced by the number of consumers to be involved in DR programs. Therefore, different types of incentives, such as free or very cheap electric energy at nights or weekends, or guaranteed payments are proposed to residential consumers in order to increase their willingness to be enrolled in a DR program and be involved in DR events. These incentives have contributed to the more widespread adoption of DR programs in certain countries and regions; however, on the contrary, the incentives have fallen short of targets and expectations in various regions due to several reasons such as: (i) already very low electricity prices in some areas enabled by generally high renewable energy generation in certain periods; (ii) the lack of information provided to the consumers about their consumption and the resulting costs; (iii) deficiencies and delays in informing all the end-users about the starting time of upcoming DR events before an adequate amount of time; and (iv) the concerns of the consumers about their comfort level. For the purpose of convincing more end-users to become a part of peak load management actions, various tools have been used in both the literature and real-world applications. For instance, the benefits of DR programs on the sustainability of energy and environment have been explained in more detail to end-users by mentioning their positive effects on environmental problems and future energy costs to improve their willingness. Among these efforts, the technologies which aim to inform the end-users about the DR events in a simple way—to provide all the relevant information to them in real time, and then to make a scheduling by asking about their decision and preferences—have shown quite promising results recently.
Based on the favorable effects of interactions with the consumers on the effectiveness of DR programs, utilities and system operators have started to make use of such tools more widely. Some utilities have taken advantage of text messages to inform the consumers in an easy and fast way and to prevent spending the time when responding to the DR event invitation. Besides, some of them have preferred dedicated websites for related communications to provide relatively higher amounts of information with visual materials. These tools enable the consumers to participate in DR events easily and whenever they are convenient, and also allow utilities to observe consumer decisions in real time.
1.2. Relevant Background
DR applications have been extensively studied in the literature; a detailed survey on practical evidence for DR concepts can be found in [
7]. While the early studies have generally considered the technical aspects such as effectiveness and applicability of these programs, the recent studies have started to focus on the active participation of consumers by providing them various options so that their comfort level is not affected so much, which aims to increase their willingness to participate in DR programs. With this objective, developing user interfaces has come into prominence as these tools considerably increase the ease of applicability of DR programs from the perspective of end-users. As one of these tools, a HEM graphical user interface (GUI) was proposed by Pipattanasomporn et al. [
8] in order for consumers to monitor their detailed consumption values, comfort preferences and the defined demand limit. Ozturk et al. [
9] introduced a mobile phone-based management system which controls the appliances in a smart home considering time-of-use (ToU) electricity rates taken from a utility company. Fernandes et al. [
10] presented a user interface module that is capable of communicating with modern operating systems such as Windows and Android. For smart campuses consisting of controllable loads, local renewable energy generation units, and a storage system, an energy management approach allowing DR interactions with utilities was presented in [
11], considering feedback on user comfort collected from consumers via a mobile app compatible with iPhone operating system (iOS) and Android. Khamphanchai et al. [
12] developed an operating system with a mobile interface which monitors and controls different loads for reducing the energy consumption of commercial buildings in DR applications. The role and potential benefits of smart phone apps that can be used in smart homes were evaluated in detail in [
13].
There are also several DR oriented web- and mobile-based platforms developed by different companies. Intelen, as a service provider to system operators, developed a DiG module for enhancing the DR penetration ratio among the service area of its clients both in web and mobile versions [
14]. Silver Spring Networks [
15], also a service provider, provided a mobile thermostat app and updated a demand optimizer demand response management system application. Transpower in New Zealand [
16], South California Edison in USA [
17], etc., as system operators also developed mobile apps for DR services to their customers to enable easier use and higher penetration of DR solutions.
1.3. Content and Contribution of the Study
One of the most important motivations of the proposed study is to develop a user-centric and user-friendly tool for consumers to facilitate their participation process to the DR events, and hence to exploit the DR potential for residential end-users. With this objective, the interface has been developed so that it only requires smart phones to operate. Considering the fact that the number of smart phone users worldwide is over two billion today, using these ubiquitous devices for DR programs can be probably pointed out as the most effective way compared to the interfaces presented in the previous literature studies and real-world applications which use computers, tablets, smart screens and specific commercial devices for end-user interactions.
None of the studies mentioned above or not referred to here considered dual sides of the DR application, namely the system operator side and the end-user side. Most of the given examples concentrated on solely the easier integration of non-expert end-users via easy-to-use mobile, etc. applications. However, to the best knowledge of the authors, none of the existing studies in the literature or in the current industry dealt in detail with the interface requirements of the system operator that should interact with the responses from all the end-user DR-driven mobile, etc. applications and might also have the capability to make or at least offer effective decisions on behalf of or to the system operator.
Besides, none of the end-user oriented DR applications considered a dual interaction with the system operator and the possible HEM unit of the end-user. As the penetration of HEM systems is likely to increase with the higher levels of investment from the industry, such applications should also work interactively with such HEM systems apart from following the commands of or sending simple replies to a system operator.
Therefore, this study tends to be the first in the literature in terms of bringing ‘conceptual novelties’, rather than ’technical contributions’, in interactions between the system operator and end-user and bridging the system operator and decision making units (e.g., HEM systems) of end-user premises.
1.4. Organization of the Paper
The remainder of the paper is organized as follows: the overview of the proposed concept is provided in
Section 2. The detailed structure and specifications of the interface are presented in
Section 3. The applicability of the proposed concept is validated in
Section 4 with a case study. Lastly, the conclusions are given in
Section 5.
2. Overview of the Proposed Concept
The proposed concept provides detailed information about the individual and total consumption values of appliances to end-users in real time for increasing their knowledge and awareness of their energy consumption, and hence for changing their consumption behaviors. The interface also provides essential and tailored information about the planned DR events to both end-users and system operators. Due to its real time interaction ability, the system operators can observe the decisions of all end-users on the same screen immediately after their choices and then can take an action accordingly. For the purpose of better explaining the concept of the adopted structure, its general scheme is illustrated in
Figure 1.
As shown in
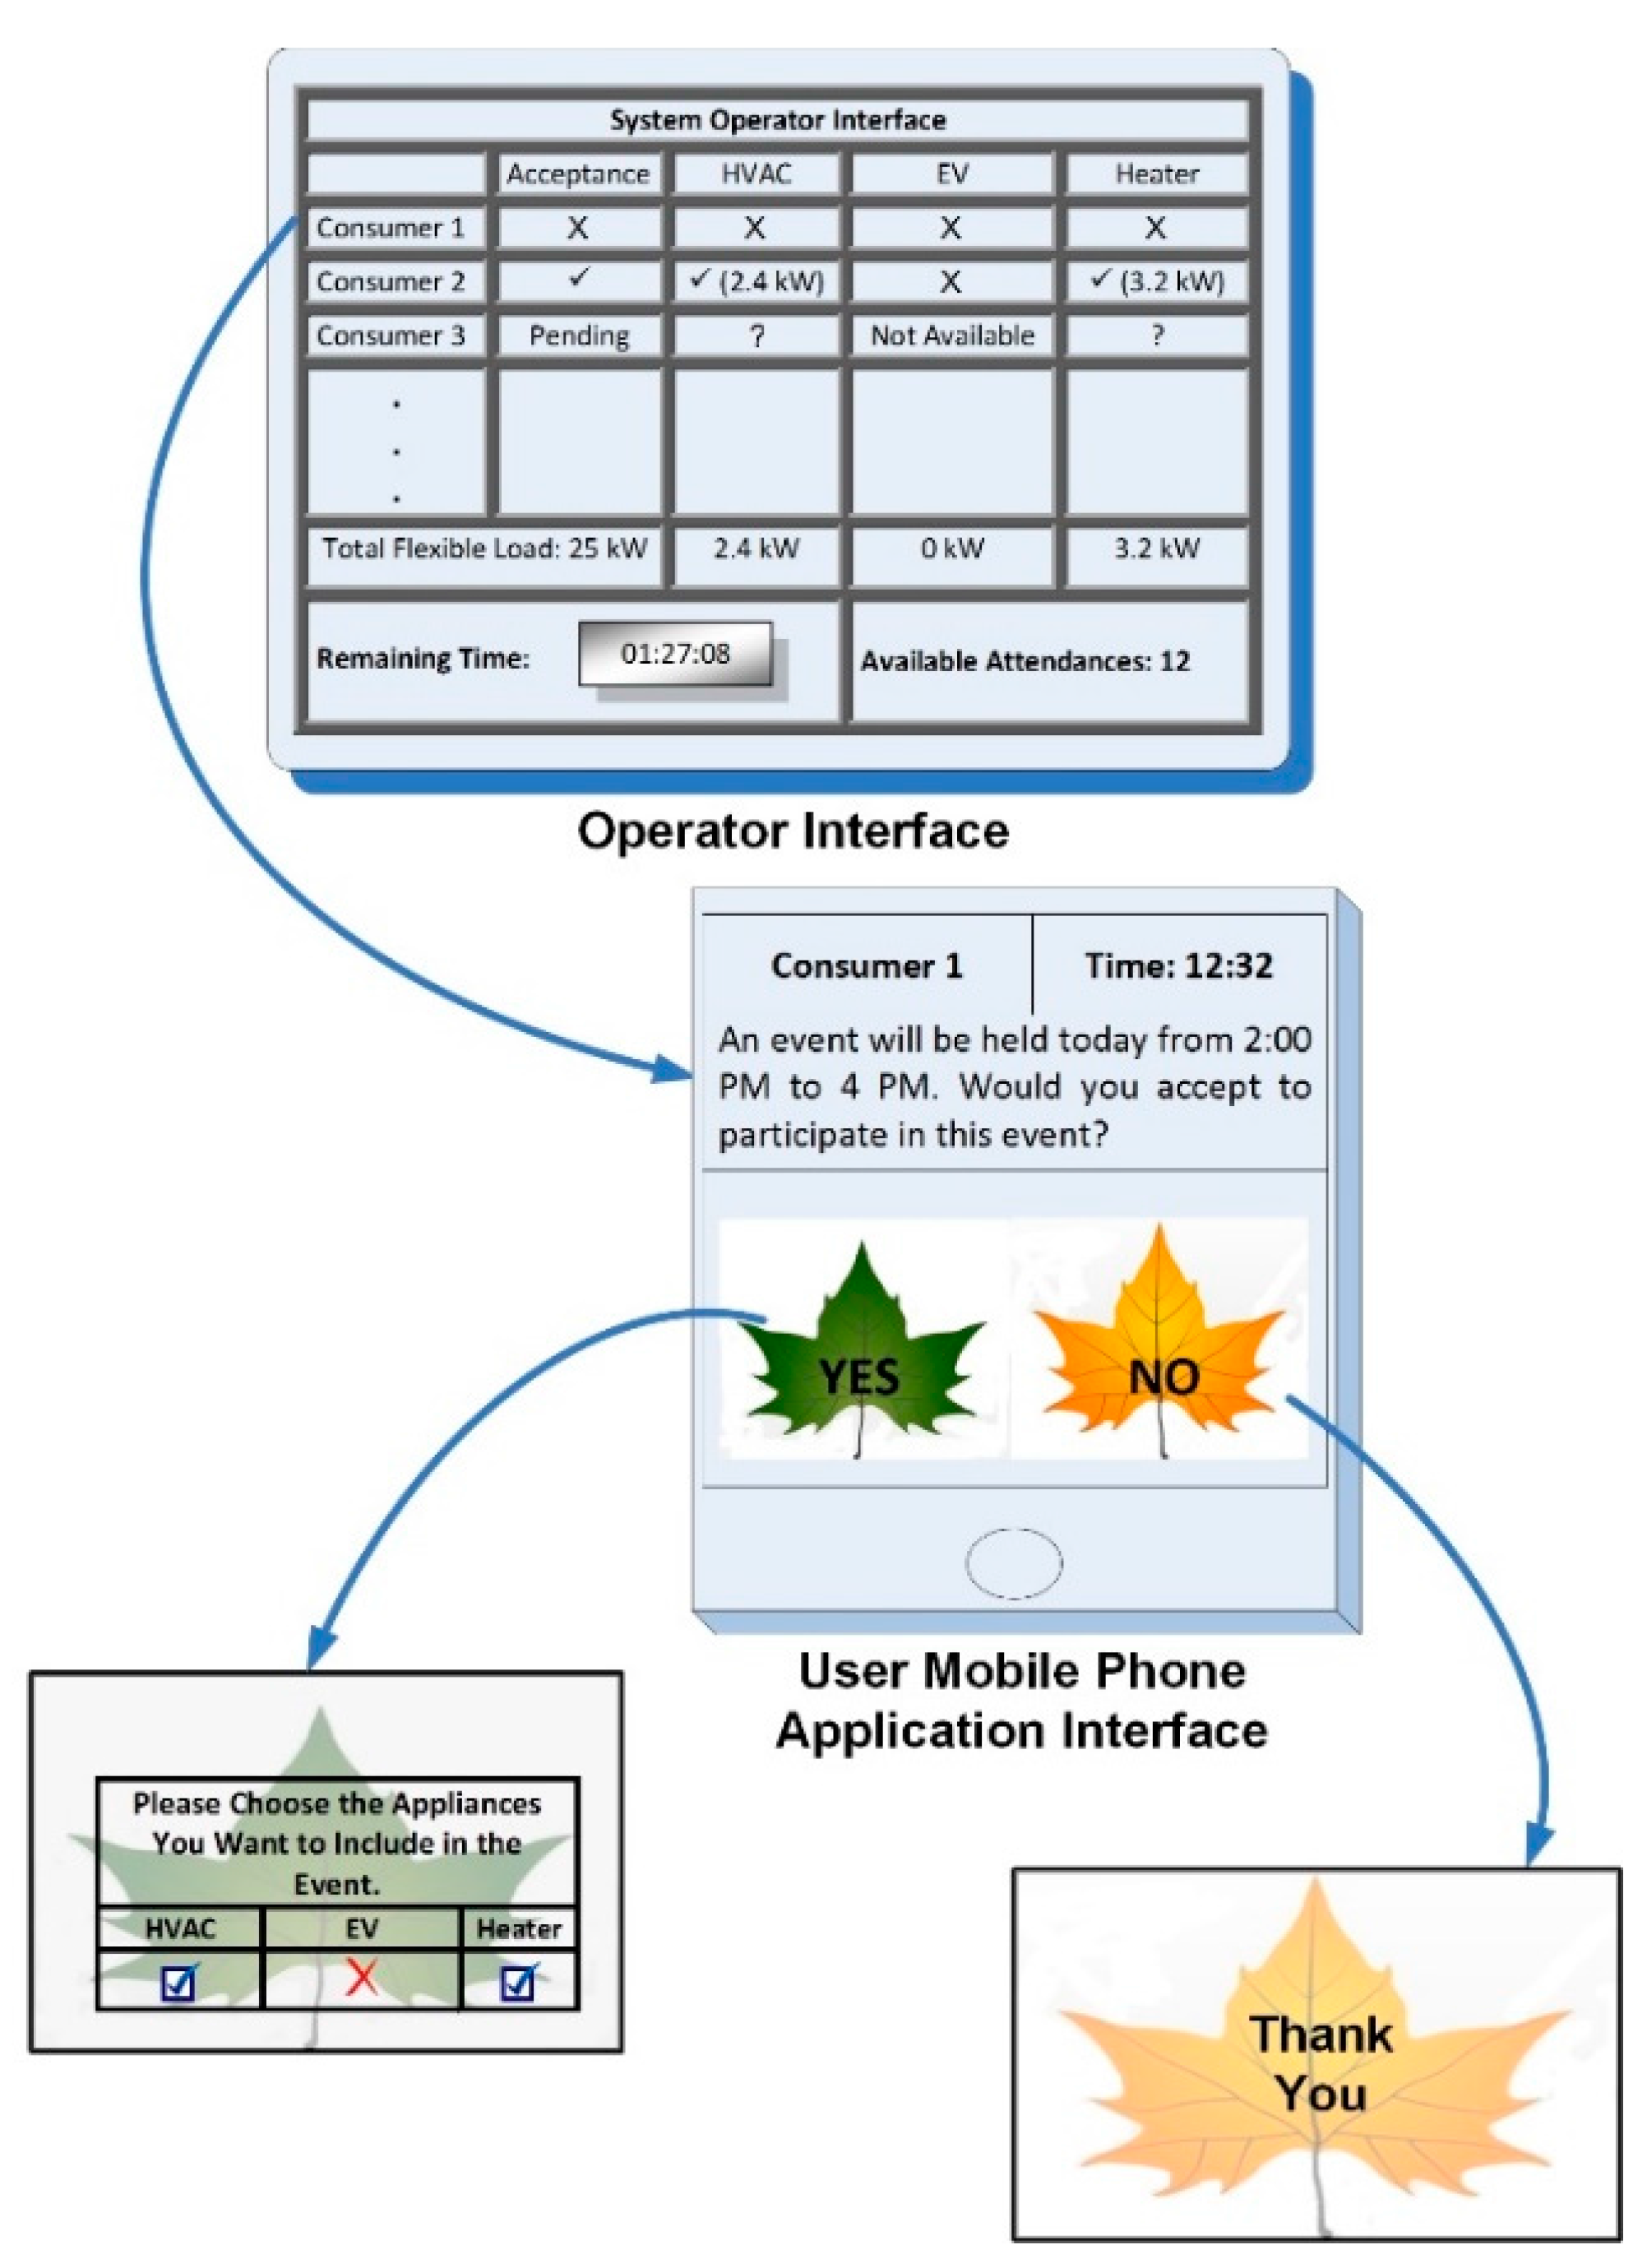
Figure 1, a two-way information flow or an information exchange is performed between the system operator and end-users. The system operator sends DR event signals to the end-users to request their availability and make the optimum energy management plan depending on the responses received from them. As stated in the previous section, this communication is carried out through a mobile application, which is the most straightforward and logical way among the other possibilities. The basic concept of the proposed mobile application for end-users can be seen from
Figure 2.
In the proposed user-side interface, first, the specifications of the planned DR event such as its starting and ending times are sent to the end-users and then the convenience of each end-user is demanded. For the ones that accept to participate in the DR event, the appliances to be involved in the program are requested. The responses of all the end-users are then immediately transmitted to the interface developed for the system operator. The interface specific to system operator also includes some other required information such as the total flexible load and the remaining time for the DR event. Based on the remaining time, a few periodic reminder notifications are sent to the end-users that have not responded the invitations yet. It is noted that an automatic response is also available for end-users for predefined appliances and/or periods.
When the DR event starts, the system operator controls some or all of the appliances allowed, depending on the required demand reduction during the related period. The appliances are mostly controlled by switching operations (i.e., ON/OFF control); however, the thermostatically controllable loads (TCLs) such as heating, ventilation and air conditioning (HVAC) units and water heaters can also be controlled via smart thermostats.
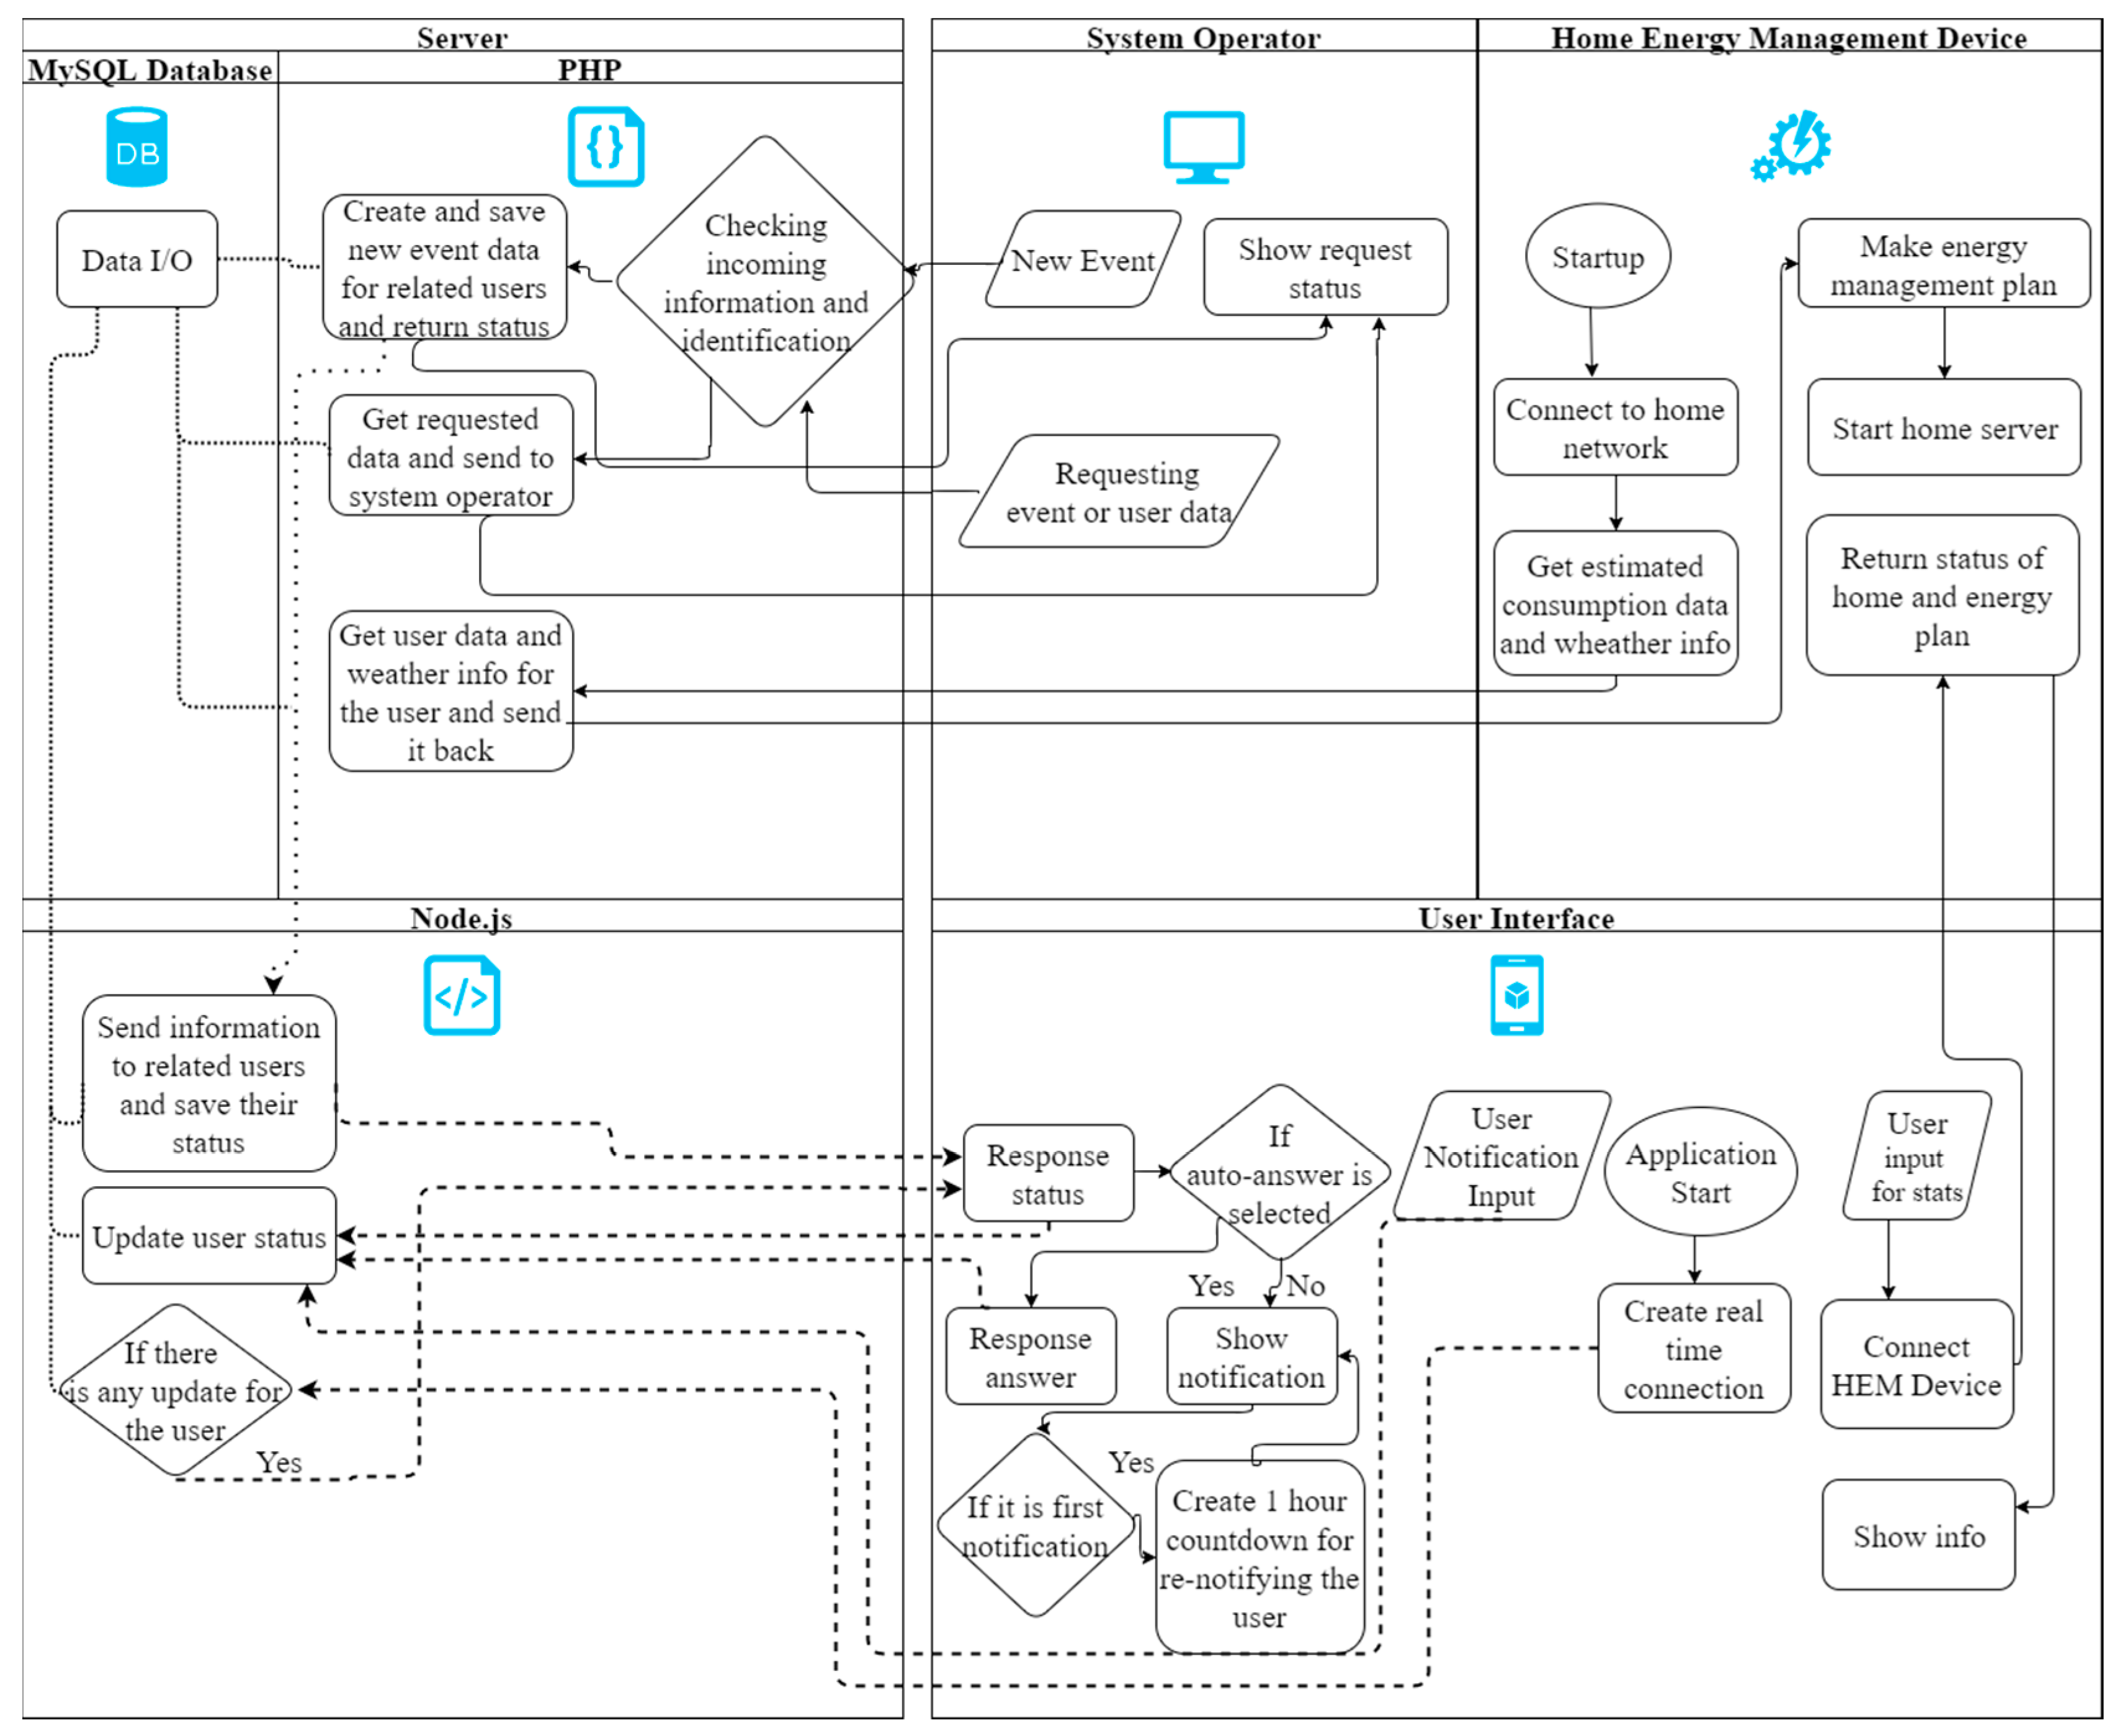
In order to better explain the procedure followed in the study, the main steps of the proposed concept are presented in
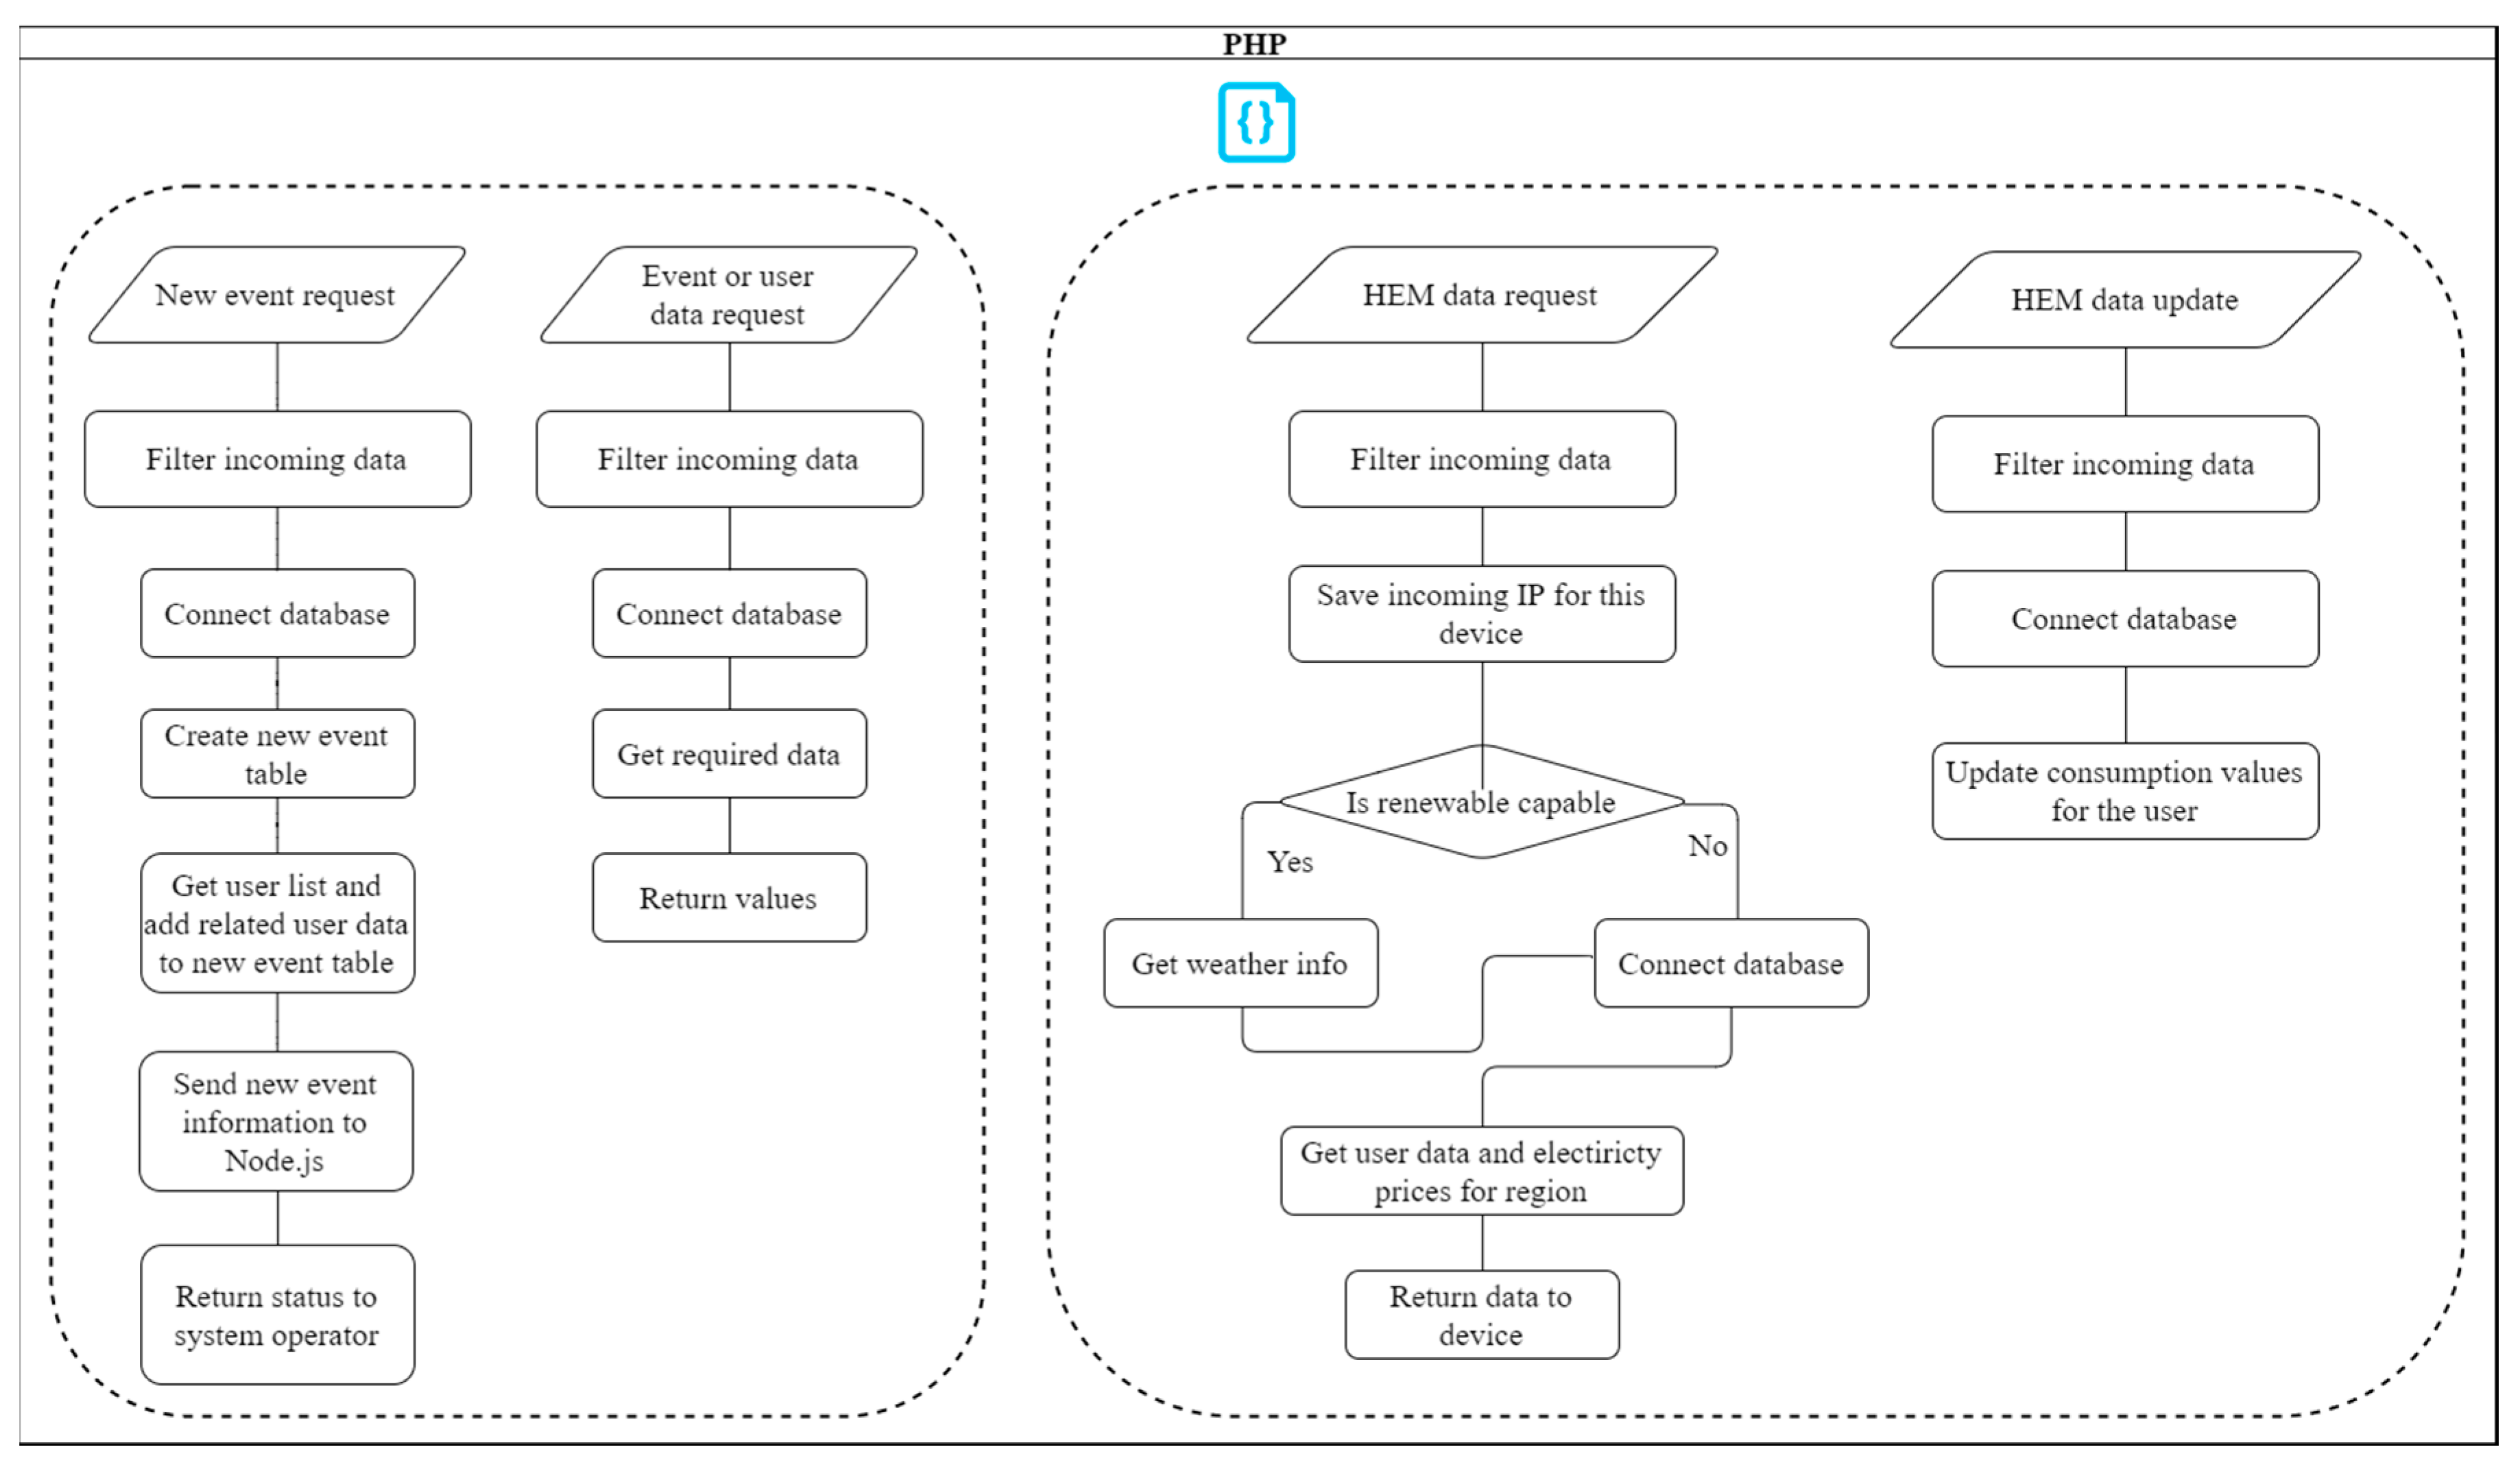
Figure 3. The whole process can be described more clearly by dividing it into six subsystems. In the first block showing the first subsystem, MySQL database (version 5.7.18, 2017), which can be accessible from the main server only, store events and user data. In the second block named as hypertext preprocessor (PHP), system operator can create new event and view user data as well as events data from a dedicated program at the system operator side, as shown in
Figure 4. It should be noted that only the system operator has the permission to reach these pages and requests from other users are ignored. At the user side, HEM devices are capable of receiving the consumption forecasts and weather information, and of making optimum energy management plans. In the subsequent block shown in
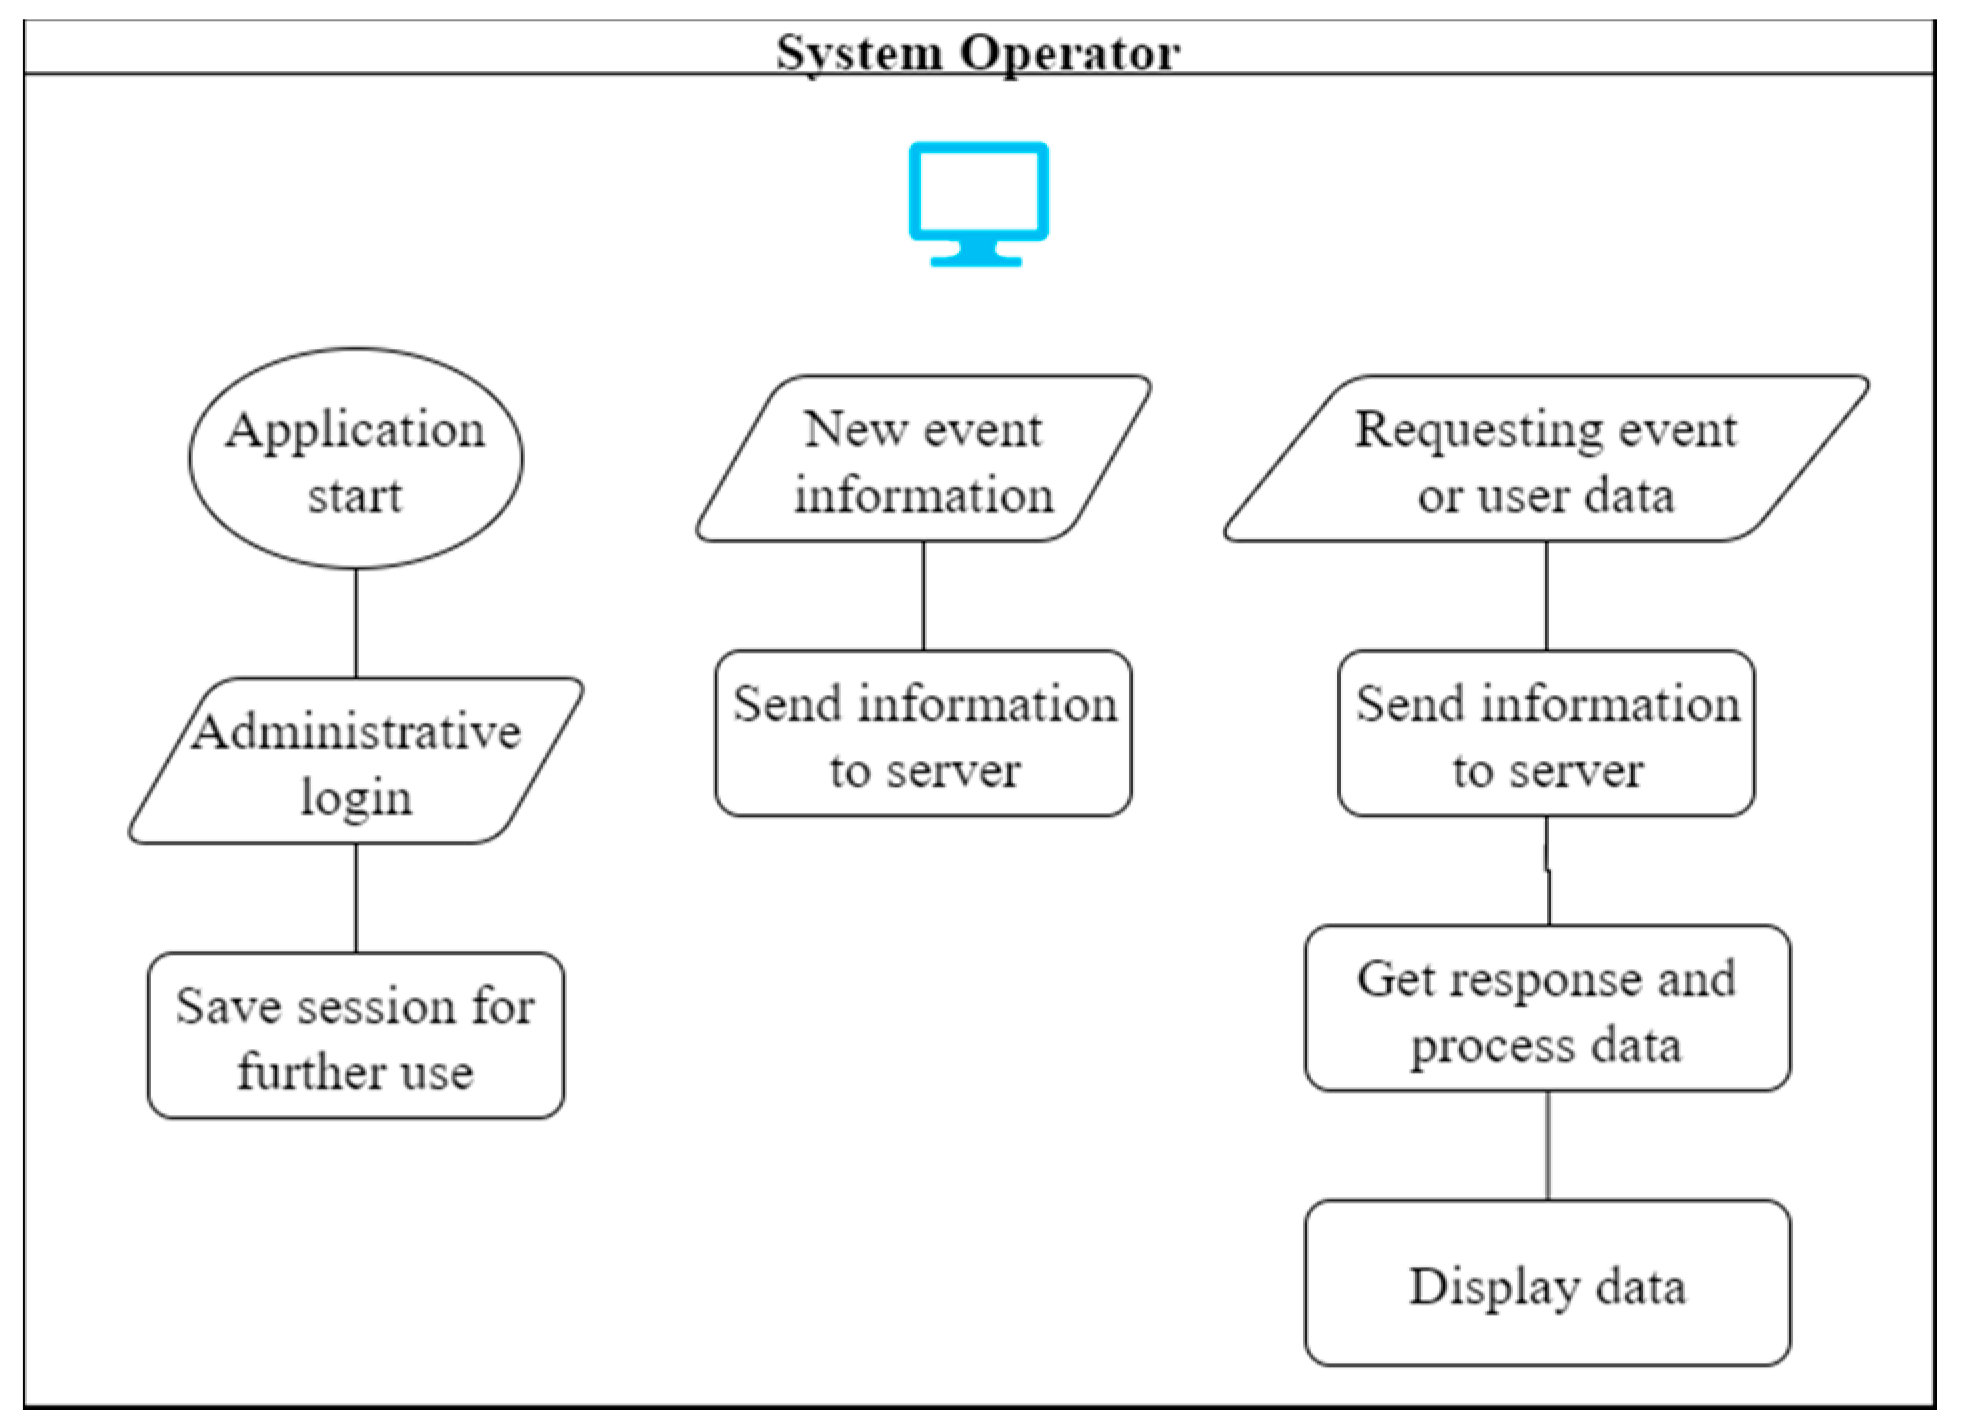
Figure 5, the system operator can create a new event, and determine where, when and how long it will be. Furthermore, the administrator can review event data and user data dynamically.
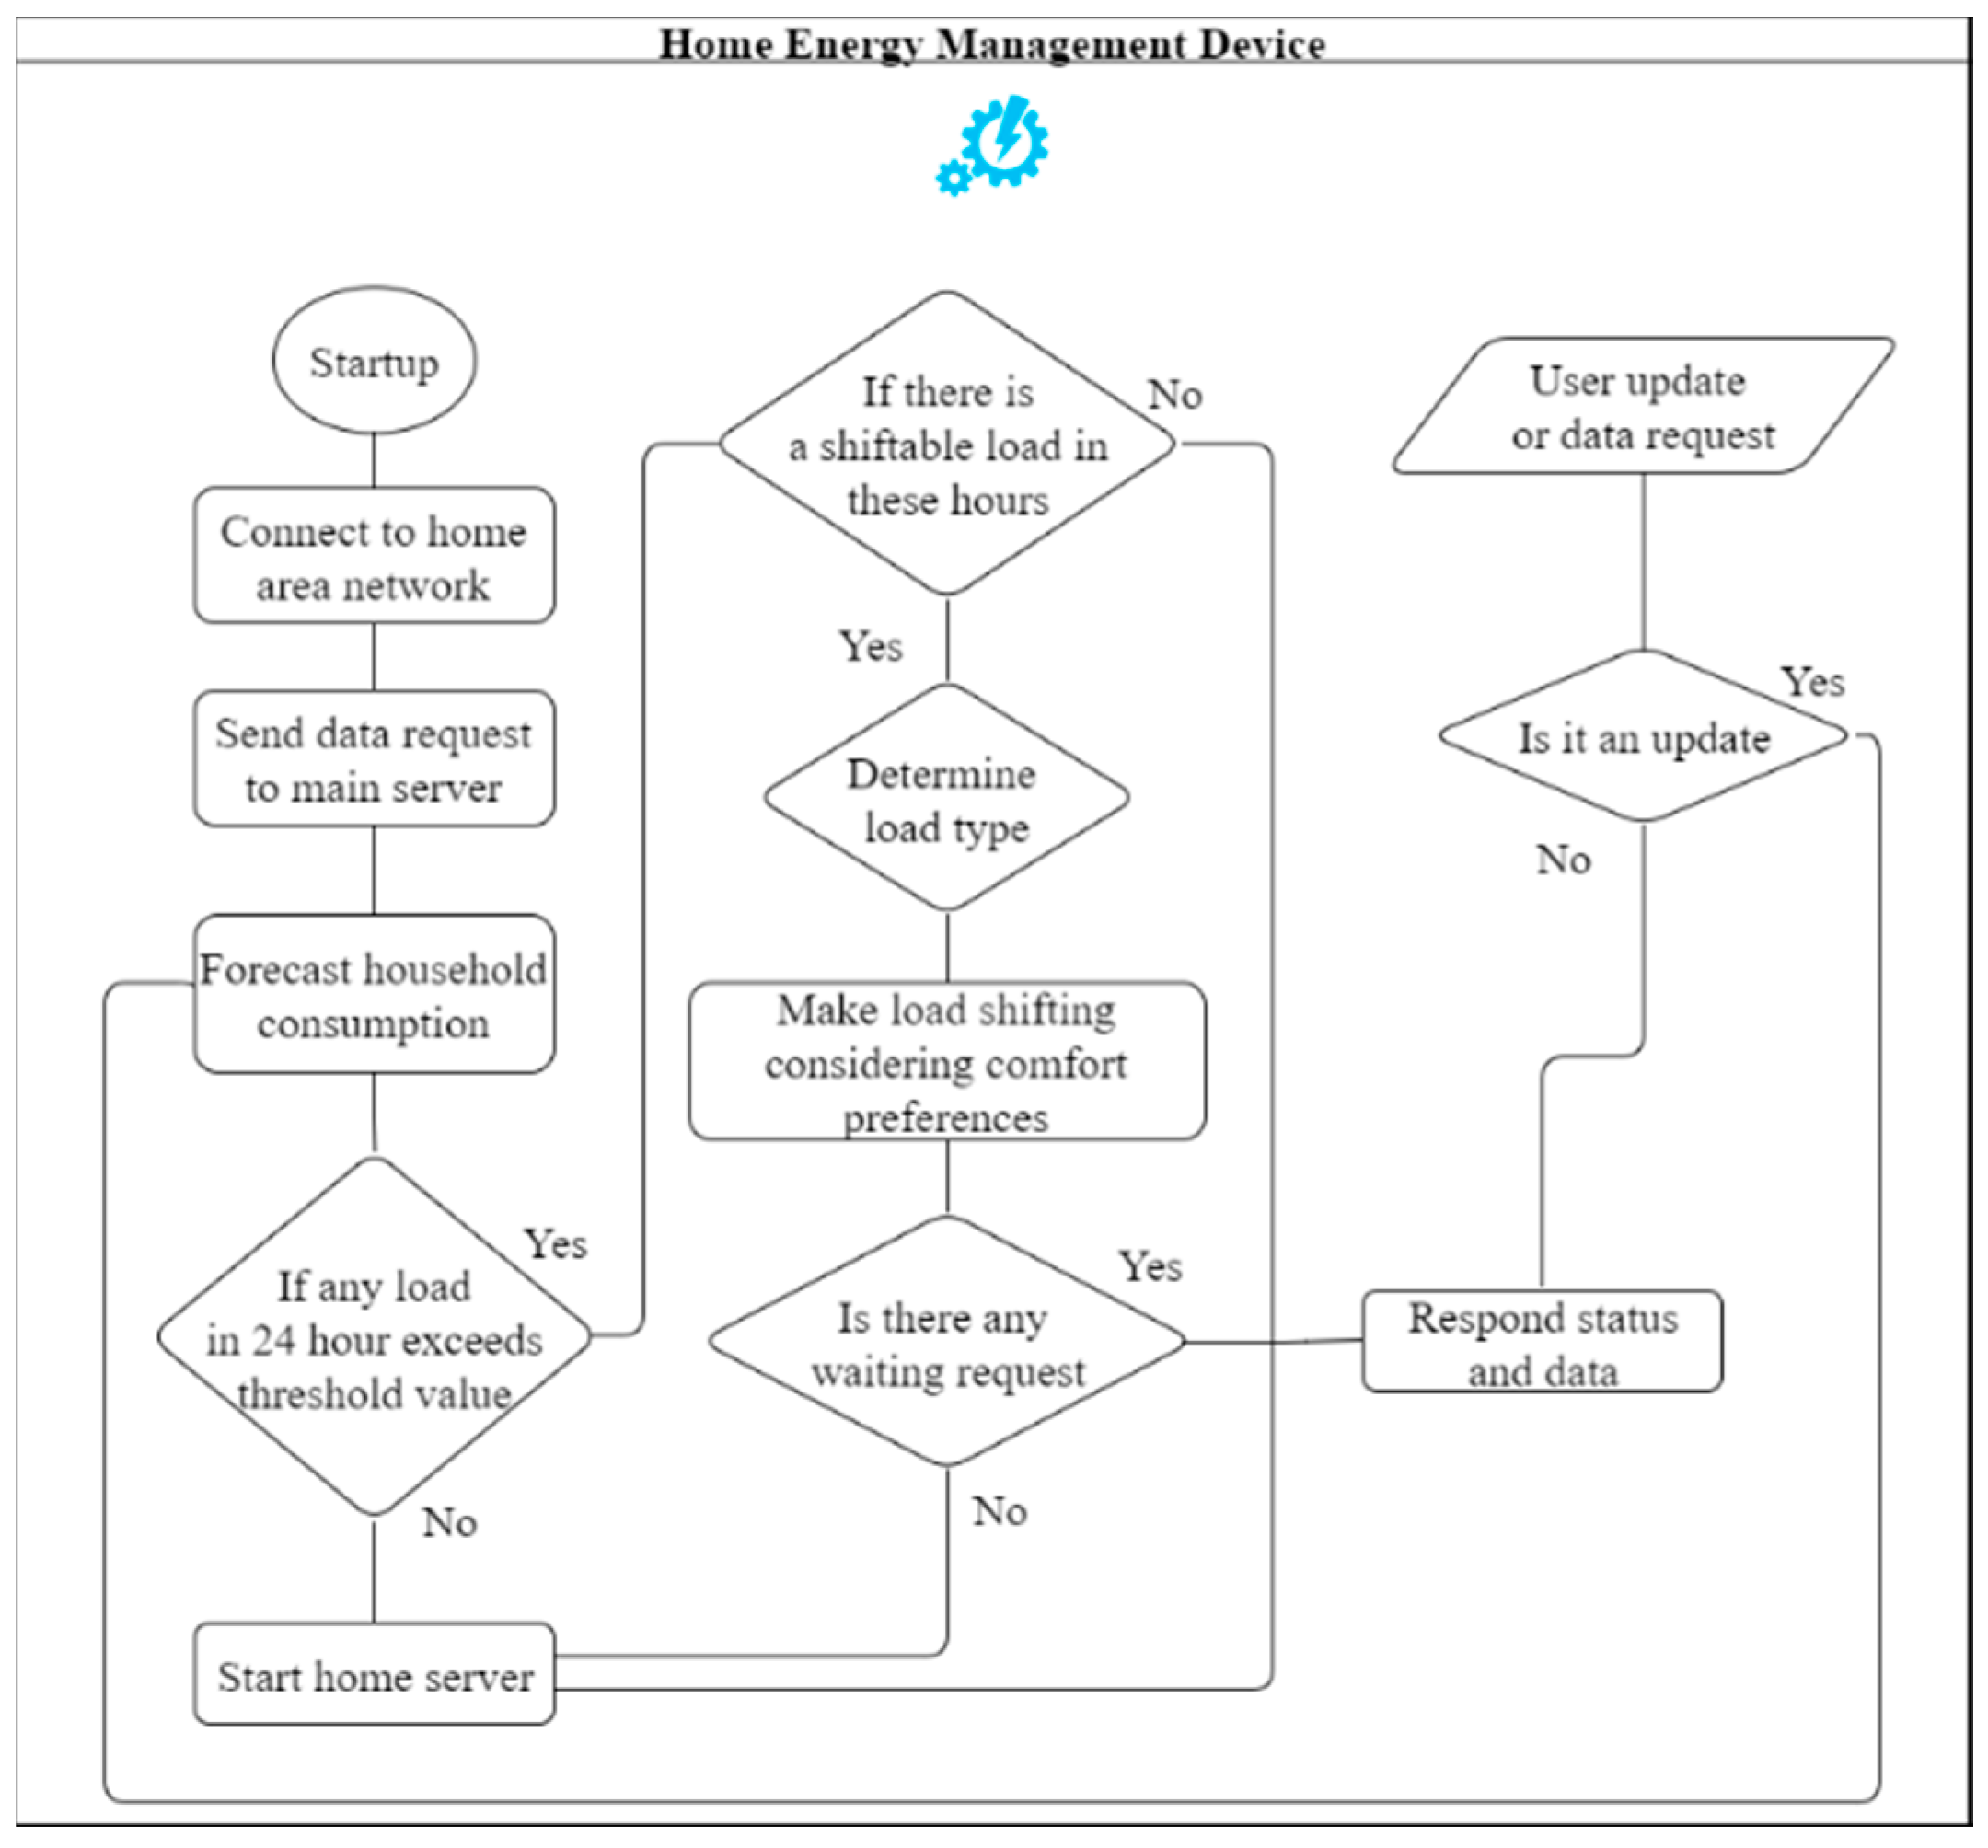
As seen from
Figure 6, the home energy management module, which is an embedded device with internet connection, is capable of controlling electrical appliances such as the air conditioner, washing machine, dishwasher, etc. via smart plugs. The proposed module also allows end-users to review the status and consumption of the appliances through internet connection or mobile devices. The node block shown in
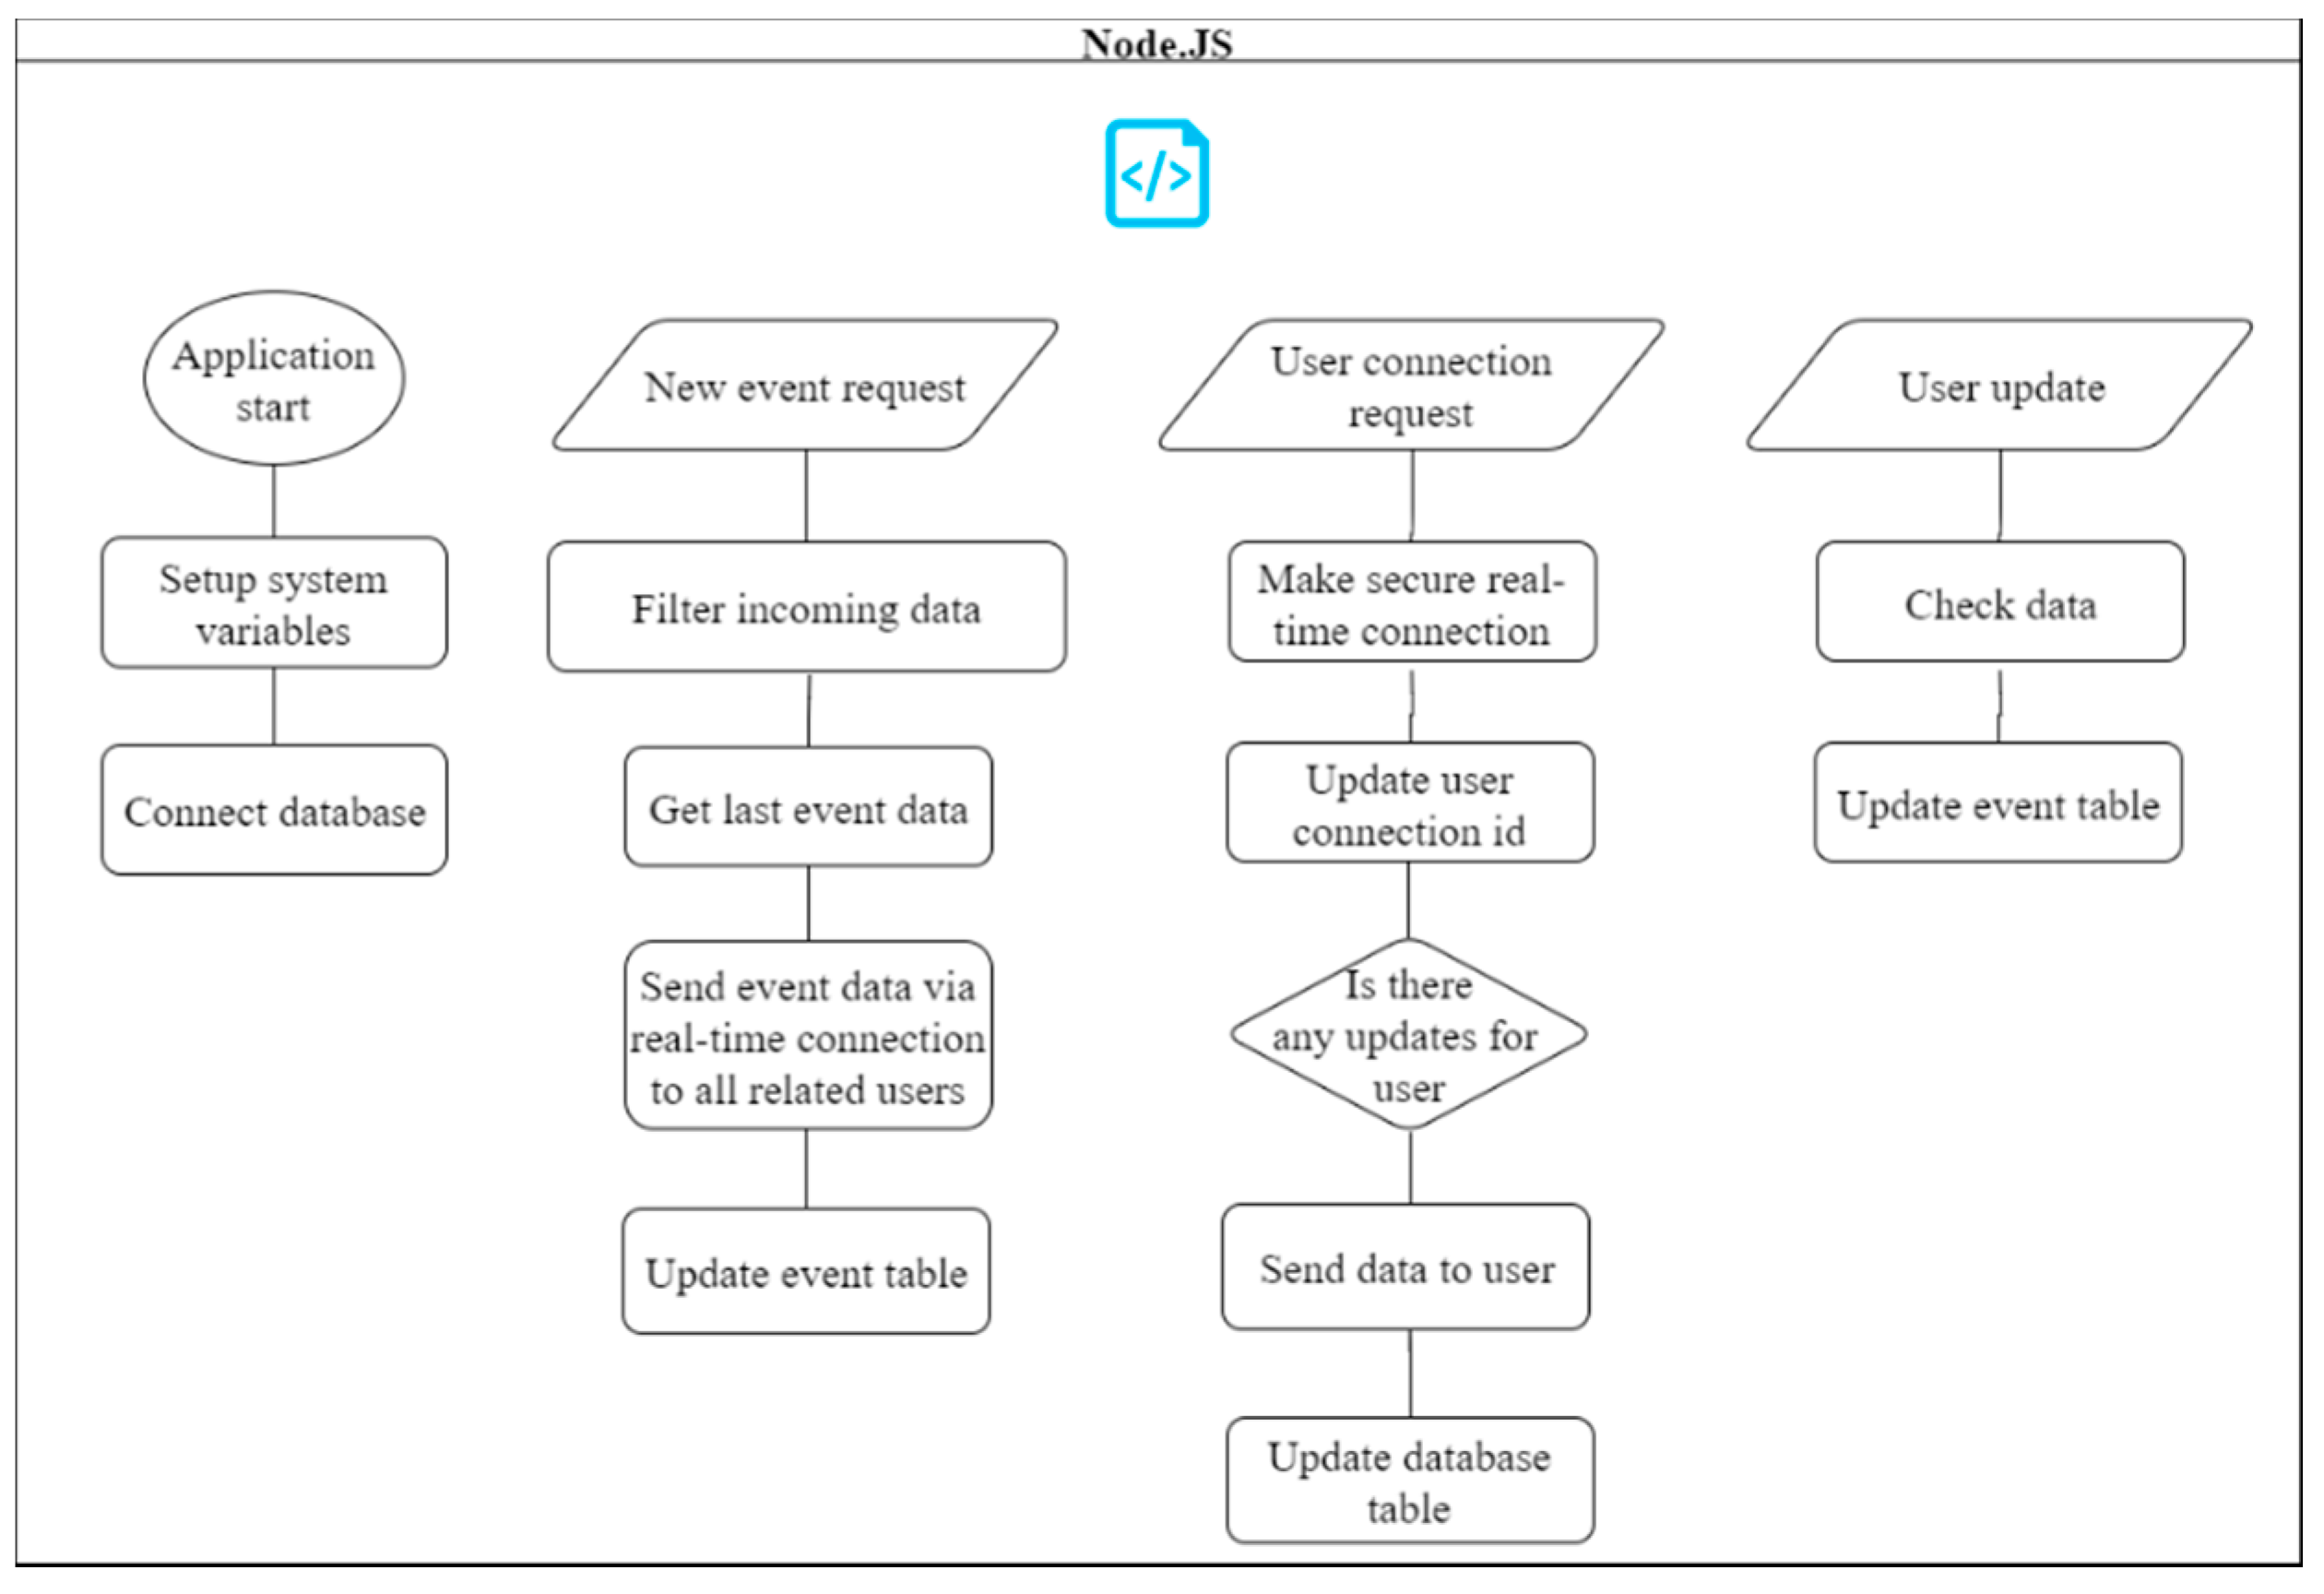
Figure 7 is mainly used for secure and real-time two way connection between user mobile phones and the server. At the same time, the system can send an update at any time without user requests. In the last block presented in
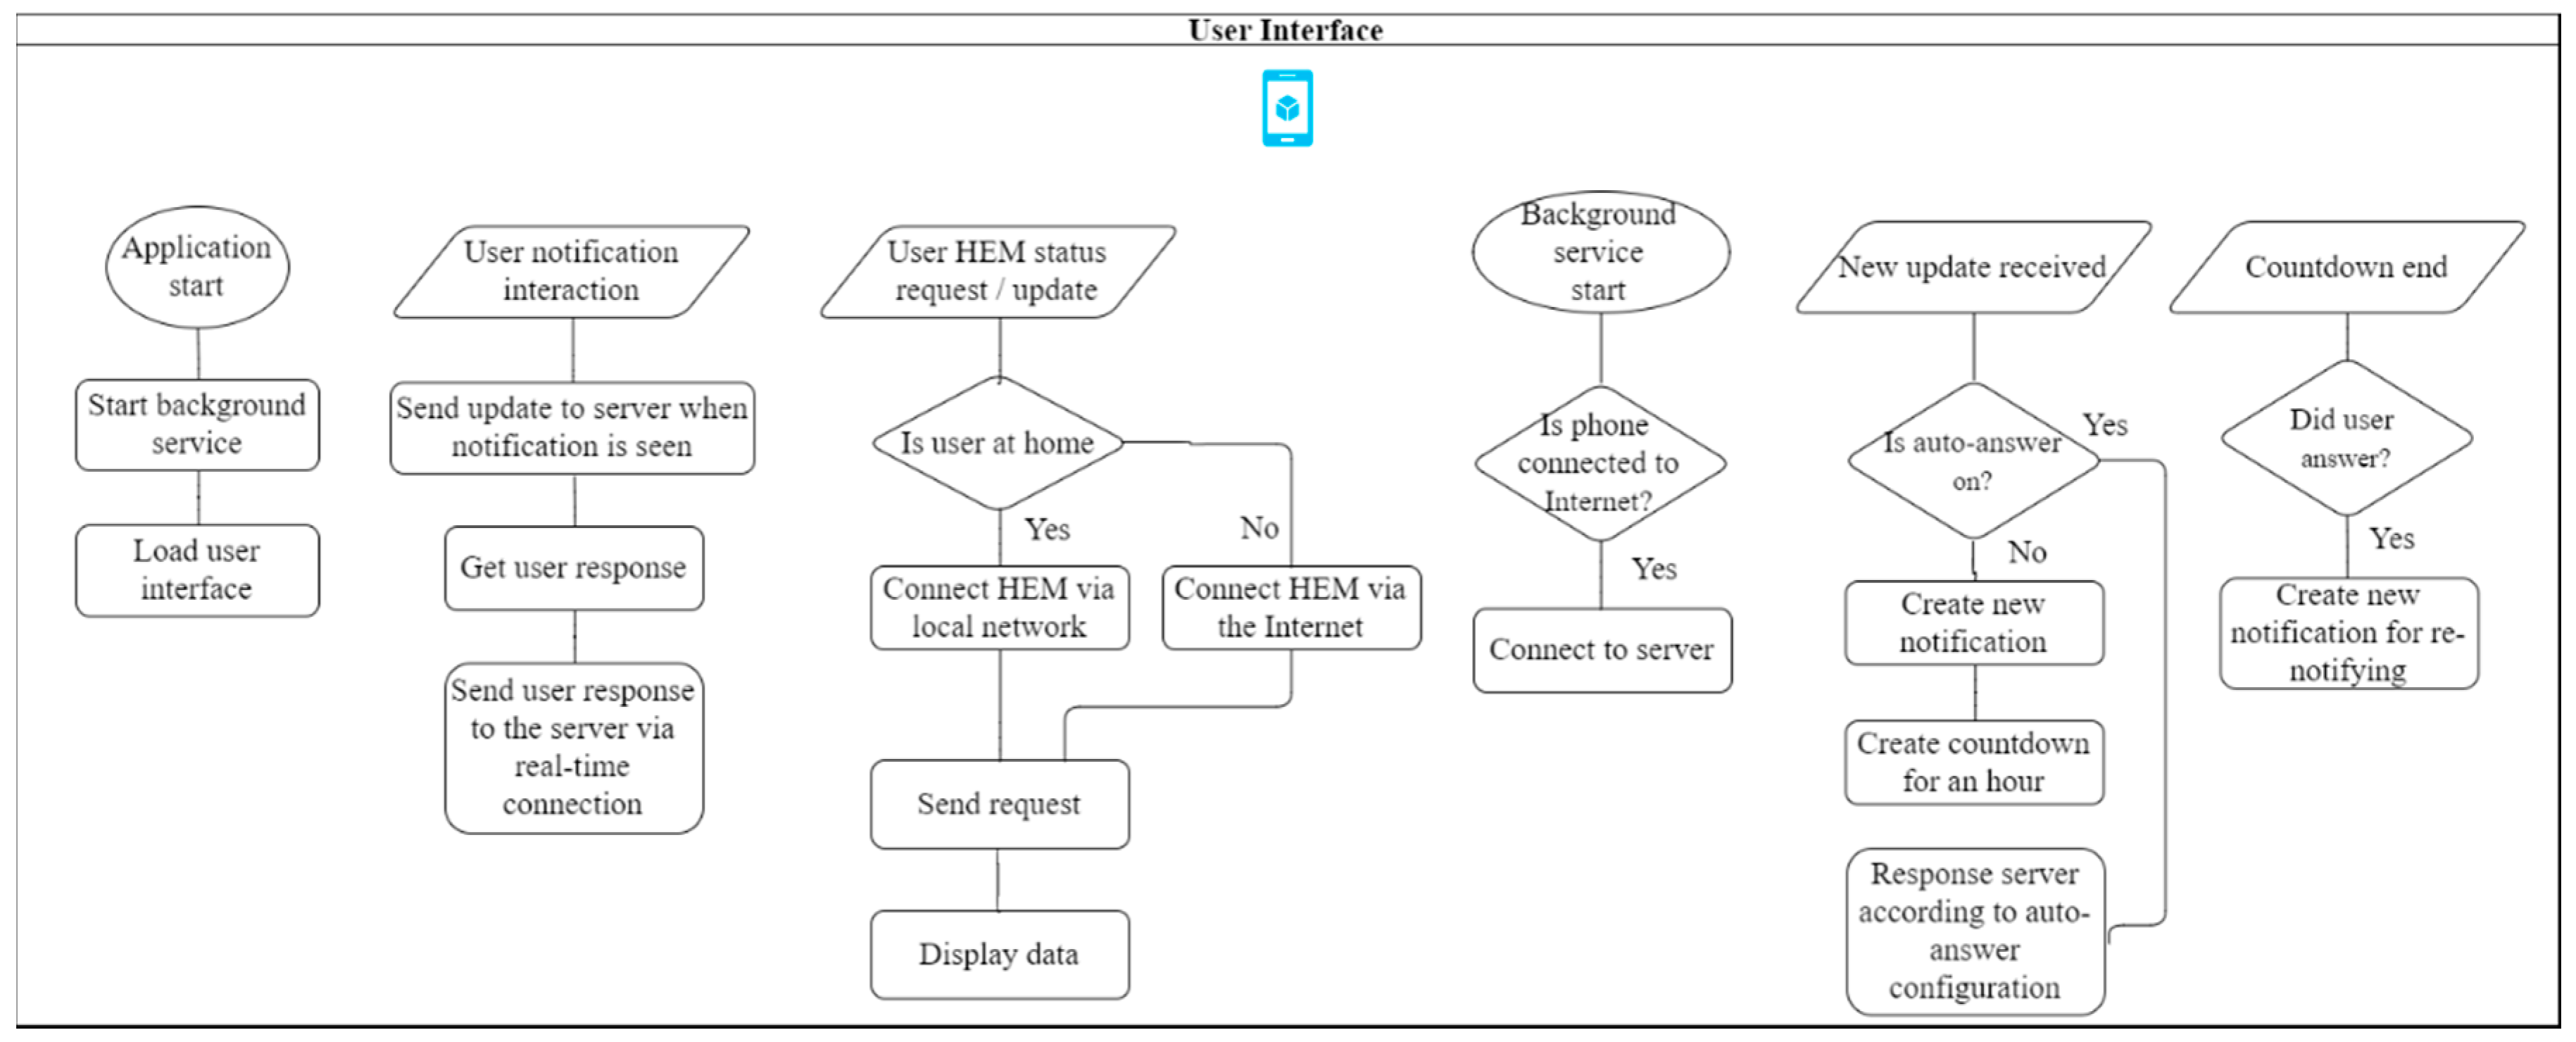
Figure 8, the user interface, which is a mobile application, allows users to receive updates about demand response events, configure HEM module behavior and view current or past household data. Moreover, the developed application receives updates automatically with the background service and real-time connection.
3. Presentation of Developed Interface
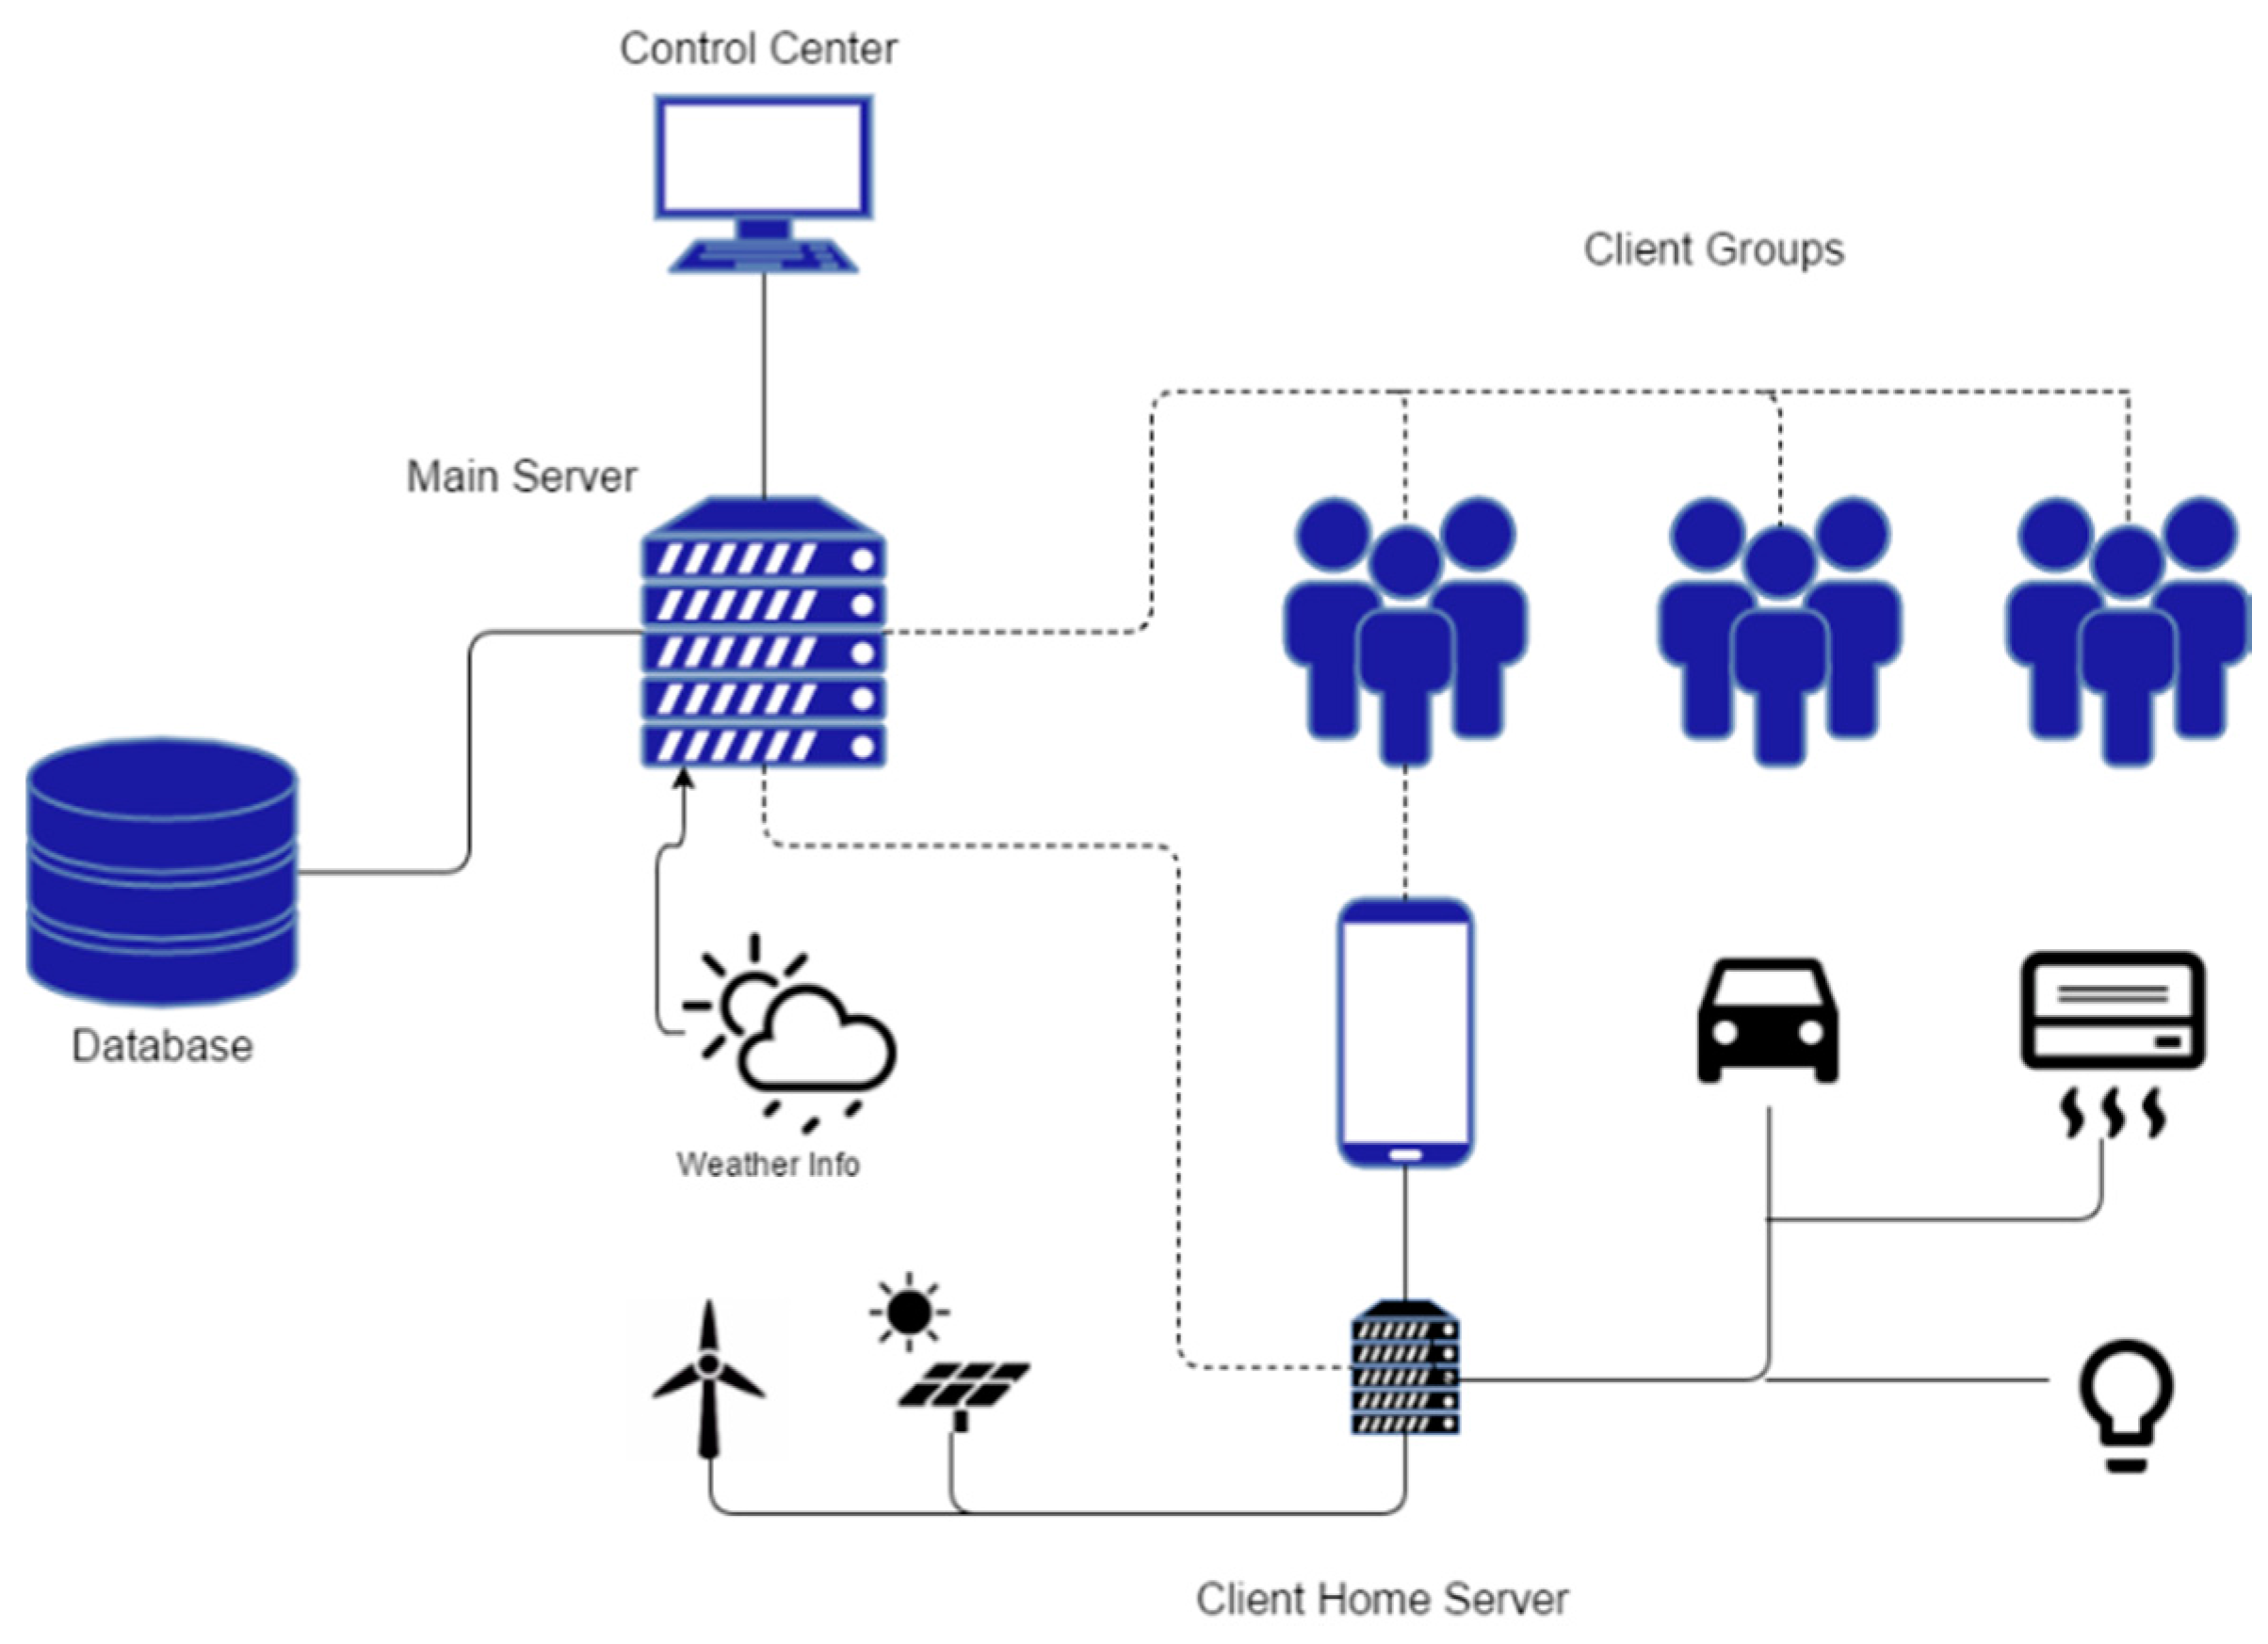
The general procedure of the proposed strategy is shown in
Figure 9. According to the proposed structure, the decisions for DR events such as initiating or canceling them are realized in control centers. These centers also track the electricity energy consumption and weather conditions, and perform electric demand forecasts for future periods using the data collected. It has also the capability of controlling the energy flow from the residential houses to the grid. The database, which is another essential component in the proposed system structure, stores the amounts of consumption and generation (if any) of end-users, the information about DR event participation and existing price values. As seen from
Figure 9, the main server provides the two-way information flow between the mobile devices of end-users, the HEM units in the houses, control center and database through an internet connection. The HEM module (or client home server), which is connected to the available appliances in the houses, end-user mobile phones and local renewable energy generation units (if any), enables end-users to control their appliances. The module also makes energy management plans depending on electricity prices, weather information and end-user preferences, and sends the demand values to the main server periodically.
As seen from
Figure 9, when a new event is created, the management algorithm sends the related information to the main server, which is responsible for checking databases, creating new events and logging them to the database. The new event information is then forwarded to the consumer groups. This notification is received by the consumers via their mobile phone connected to internet or will be received once the connection is available.
As stated in the previous section, different interfaces are used for the system operator and end user. These interfaces are analyzed in this section individually as the system operator interface, the end-user mobile phone-based interface, and HEM interface.
In the study, a decentralized approach is followed in the designing process, in which the end-users have their own dedicated servers with the artificial intelligence. All the end-user servers have real-time connections with the main server for sharing power consumption and production (if any) data, weather information, and other relevant data. Hence, these servers can control smart appliances, as shown in
Figure 3 with the parts colored in black. Moreover, the end-users might determine their own power profiles.
3.1. The System Operator Interface
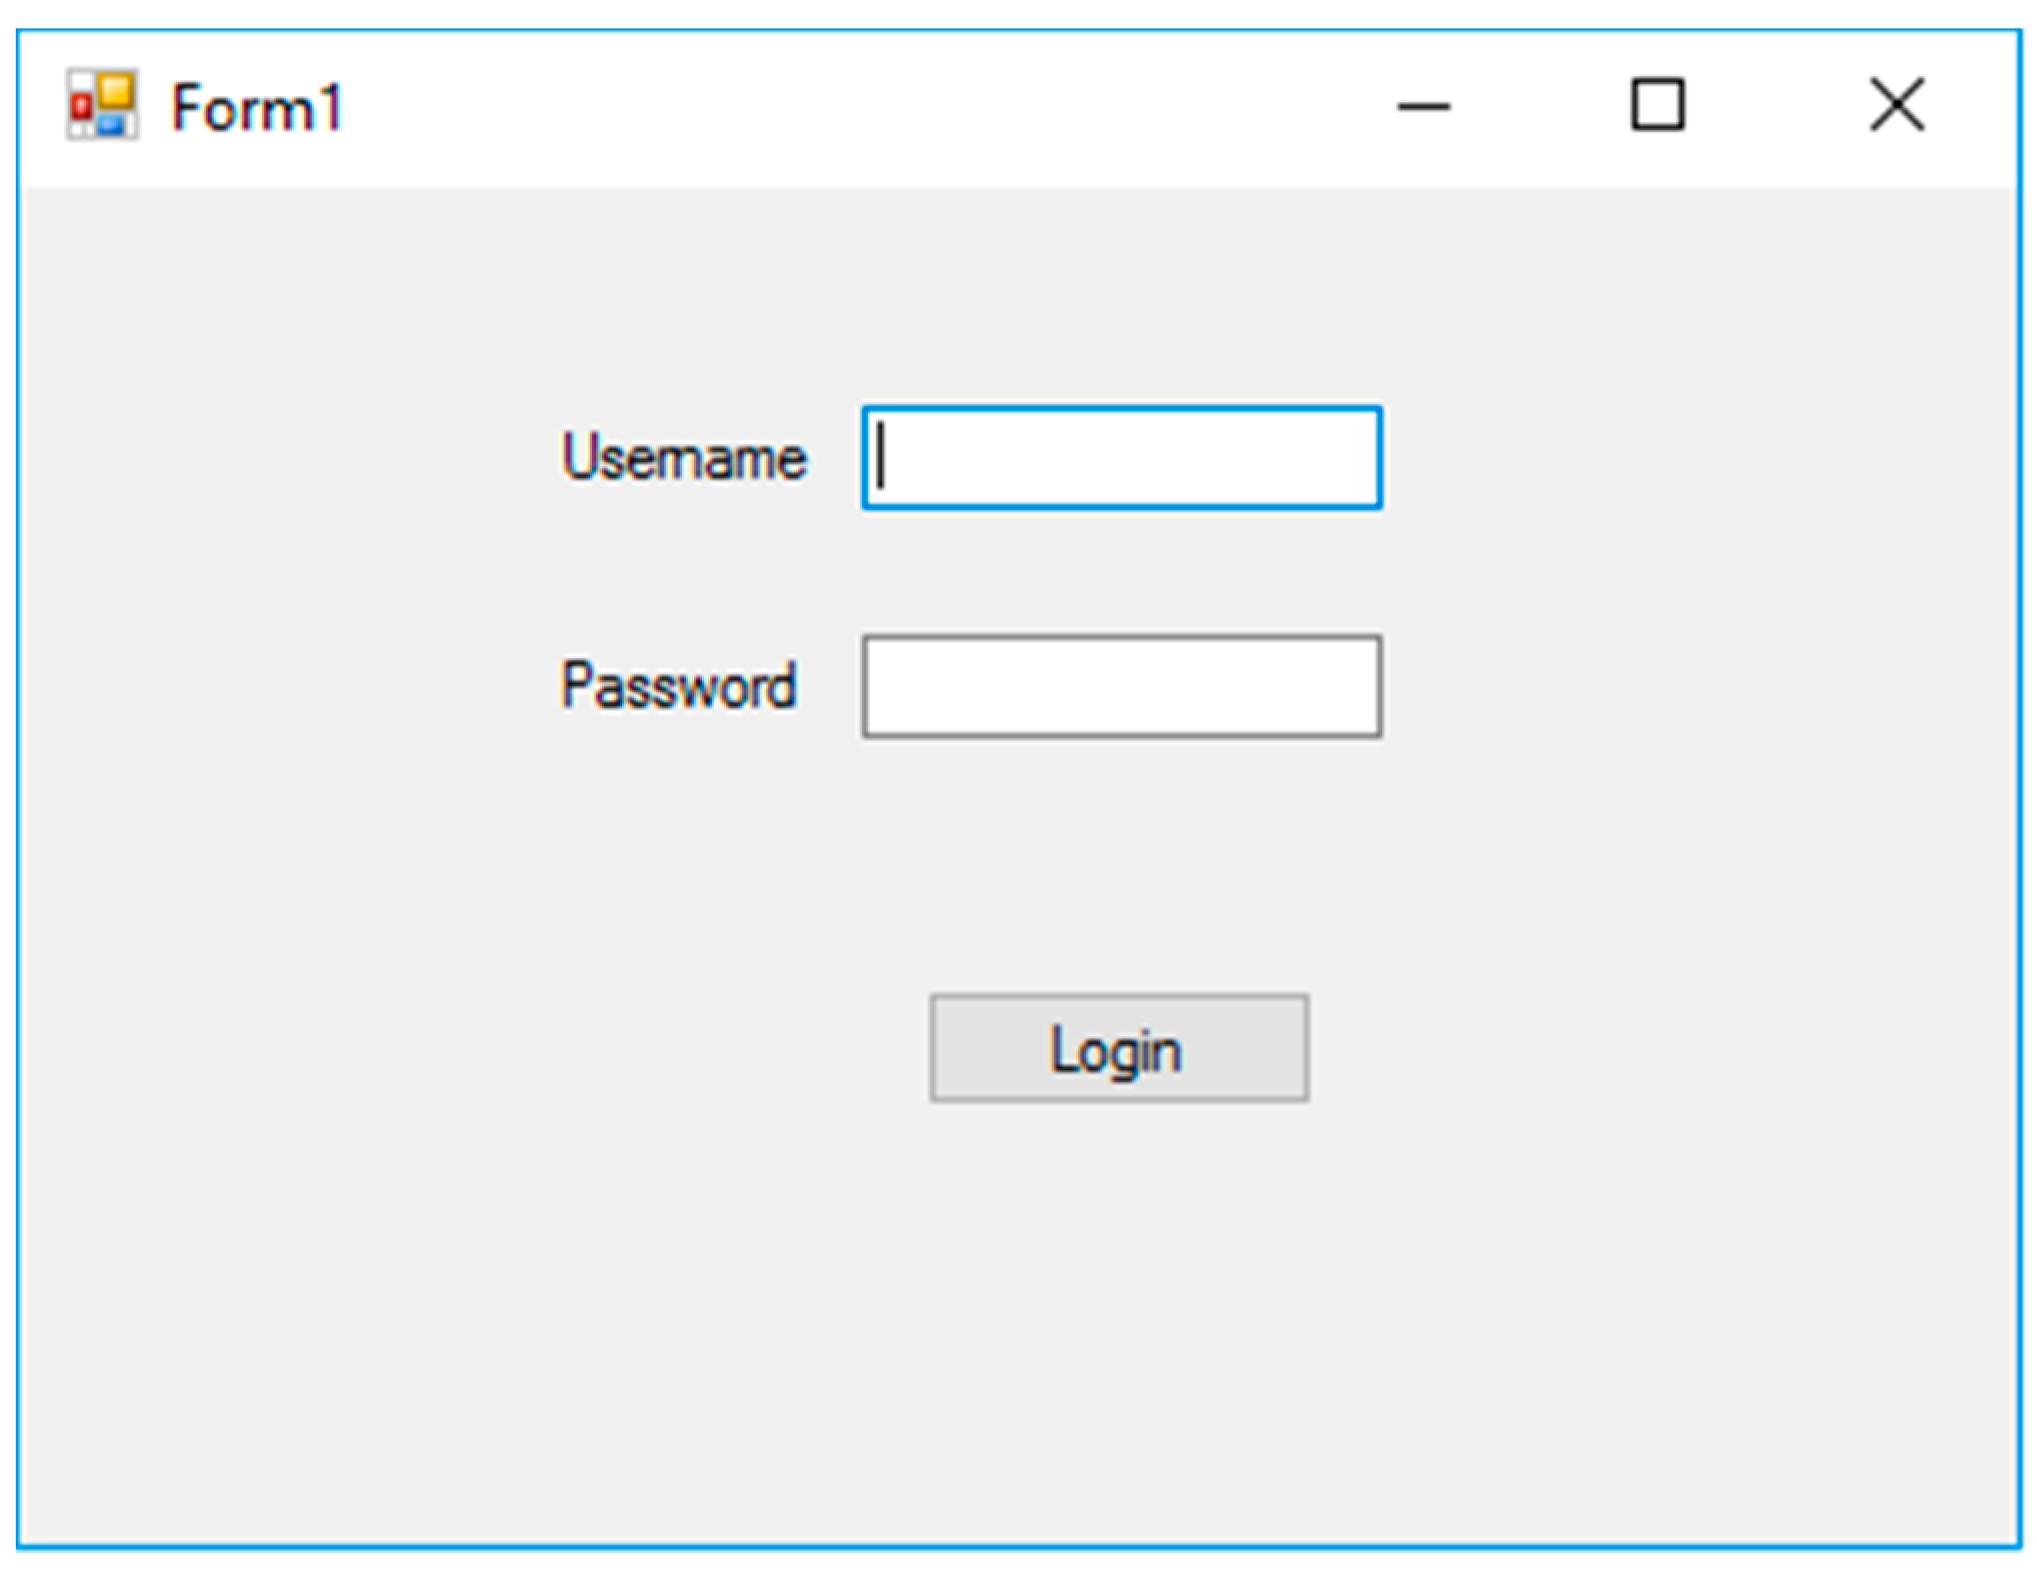
The system operator interface is developed as a desktop application. The logging screen of the interface is shown in
Figure 10, where the username and password are secured with md5 encoding. It should be noted that secure sockets layer (SSL)-certified connection might be also used in all data transfer for more secure data transfer.
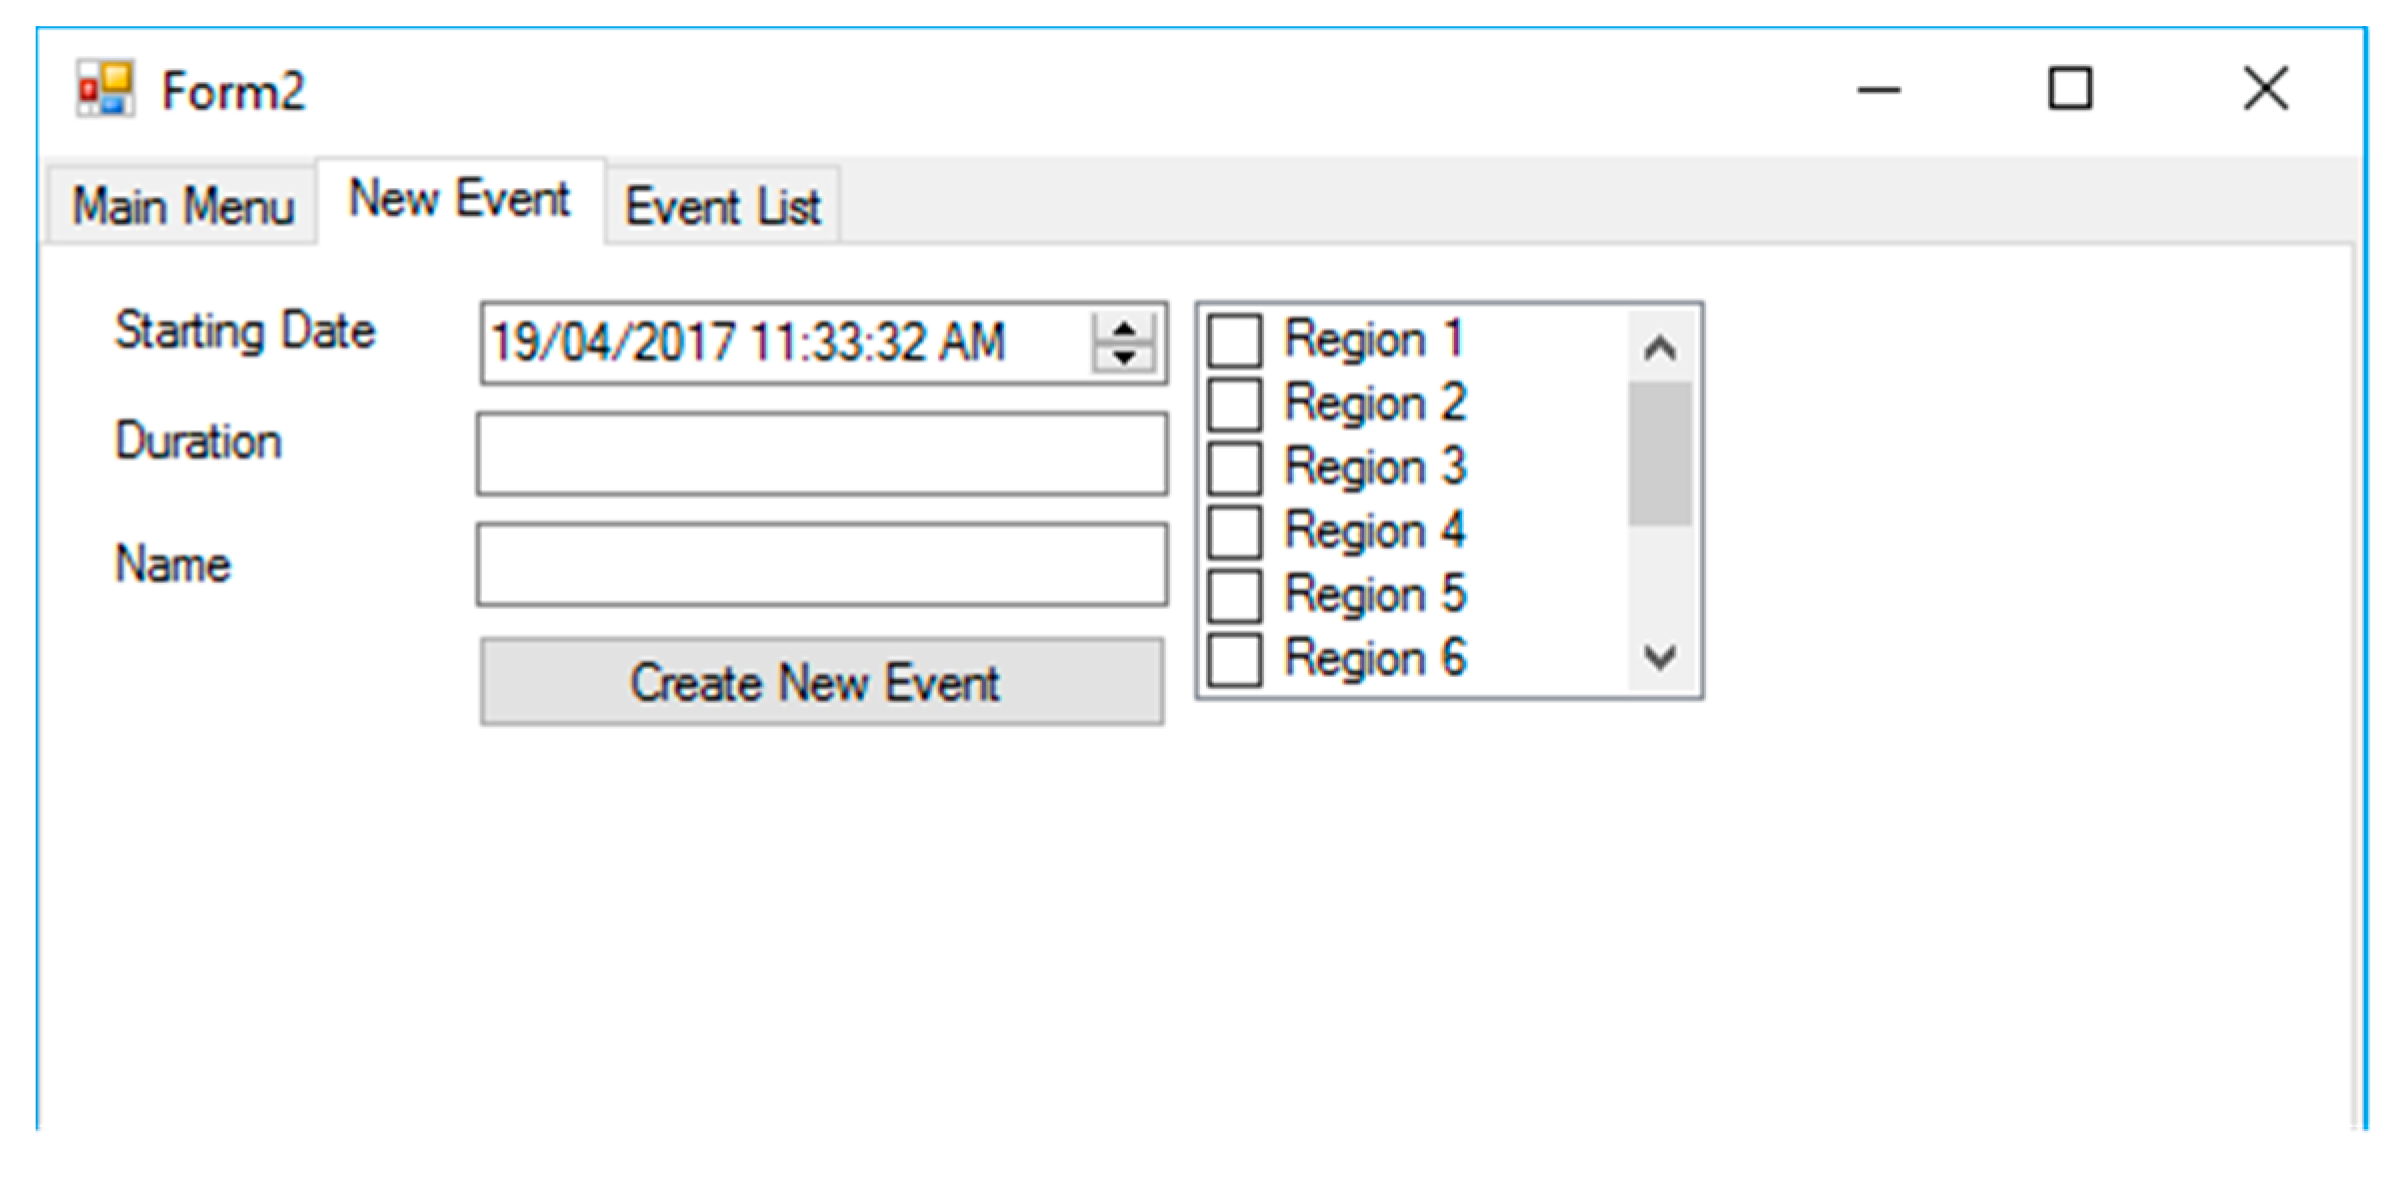
A separate menu is provided in order for the system operator to create DR events, as shown in
Figure 11. The proposed structure enables the system operator to realize different DR applications for different end user clusters within neighboring regions. The total duration of the DR application is defined in seconds, which enables a more exact timing for the DR event.
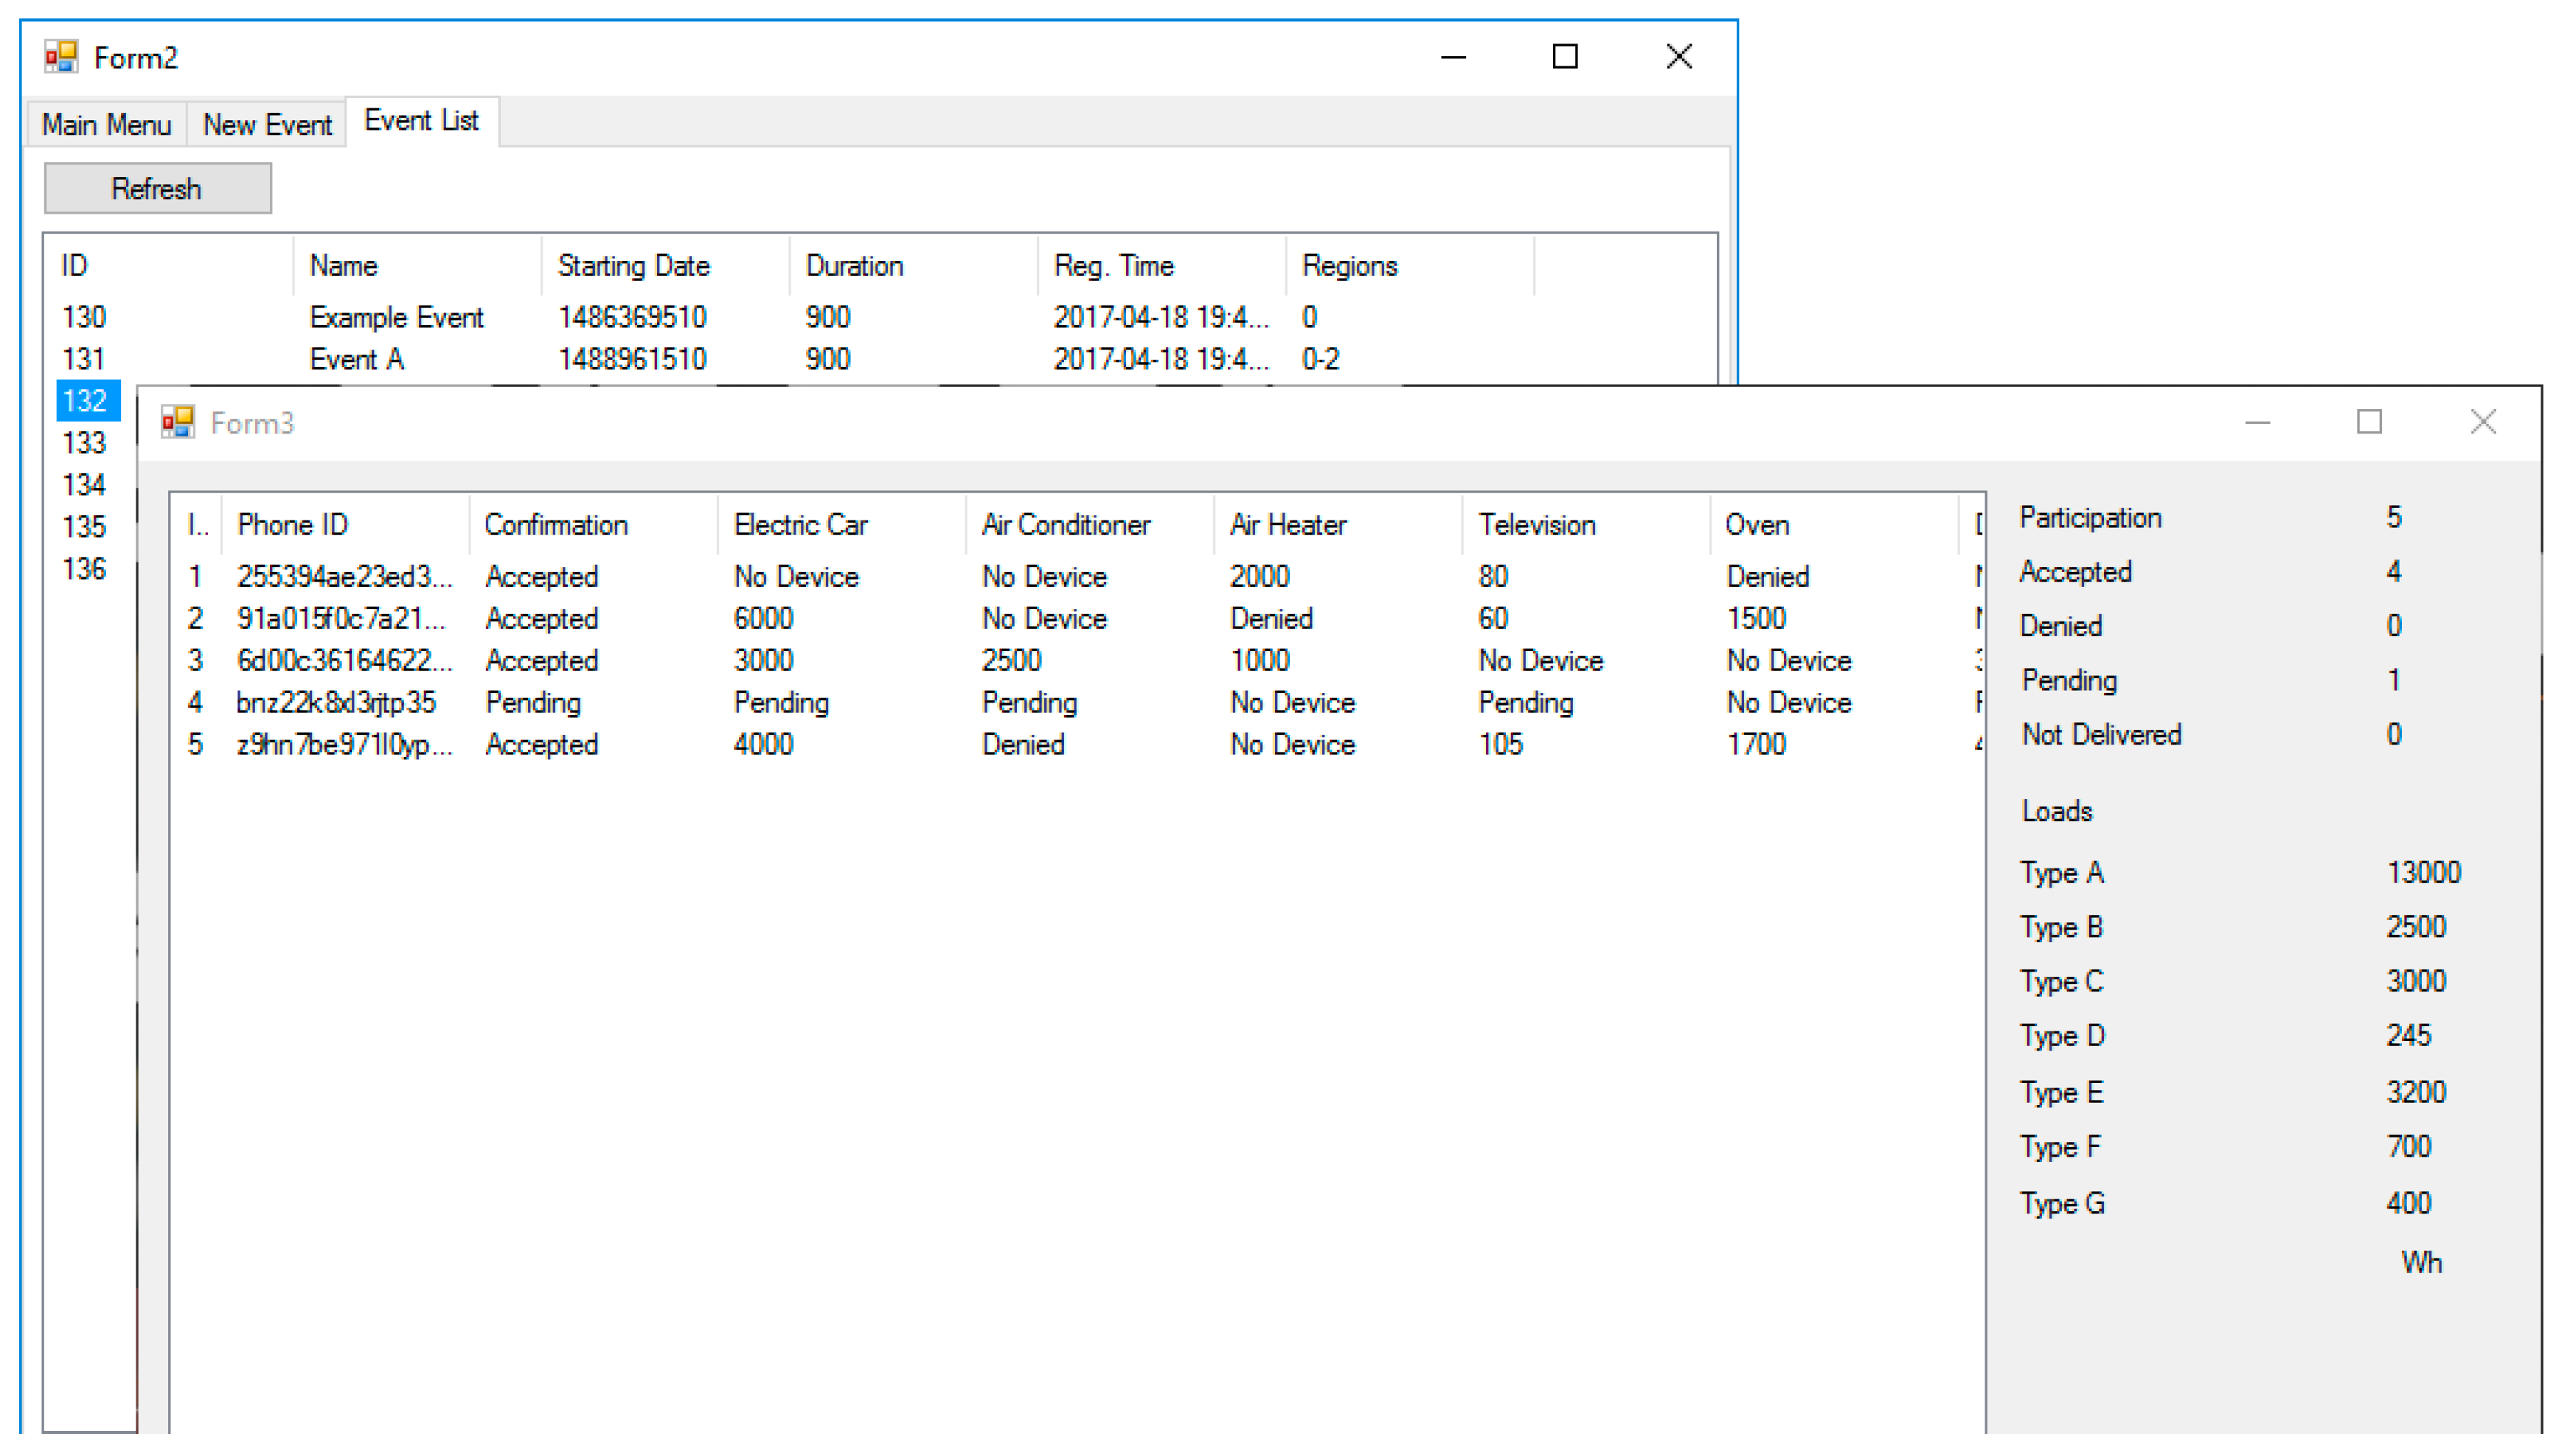
Another tab named as event list is also available, as shown in
Figure 12 for monitoring and analyzing all the previous and current events found in the database. This list provides all the required information about the end-users related to the event such as confirmation status, the end user appliances that can be used during the DR event, aggregated flexible power, and participation ratio of certain or all consumers.
3.2. The End-User Mobile Phone Interface
As mentioned before, a mobile-phone based user interface is developed in this study with the aim of facilitating the participation of end-users in DR events. The interface enables end-users to respond to DR event invitations in a simple yet effective way. Furthermore, a HEM algorithm is also integrated into the proposed user interface in order to reduce the energy-related costs by controlling the appliances in residential buildings manually or automatically. These two features belonging to the user-side interface are elucidated in the following subsections.
3.2.1. The End-User Mobile Phone Interface for DR Events
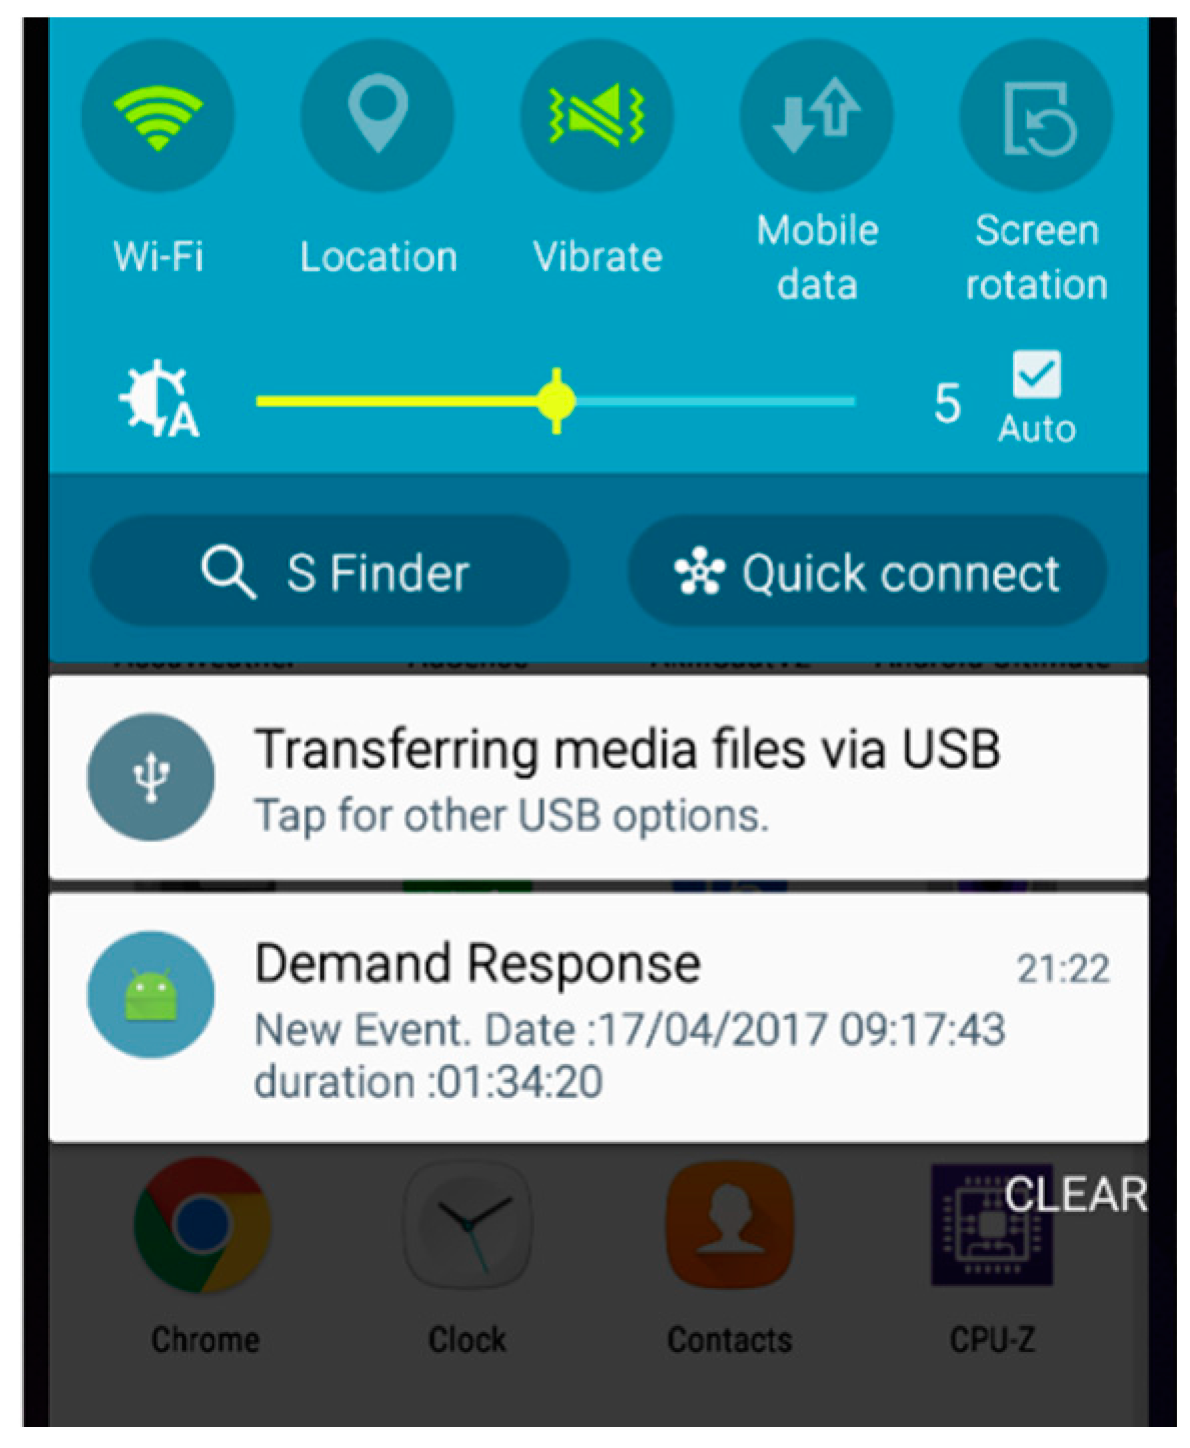
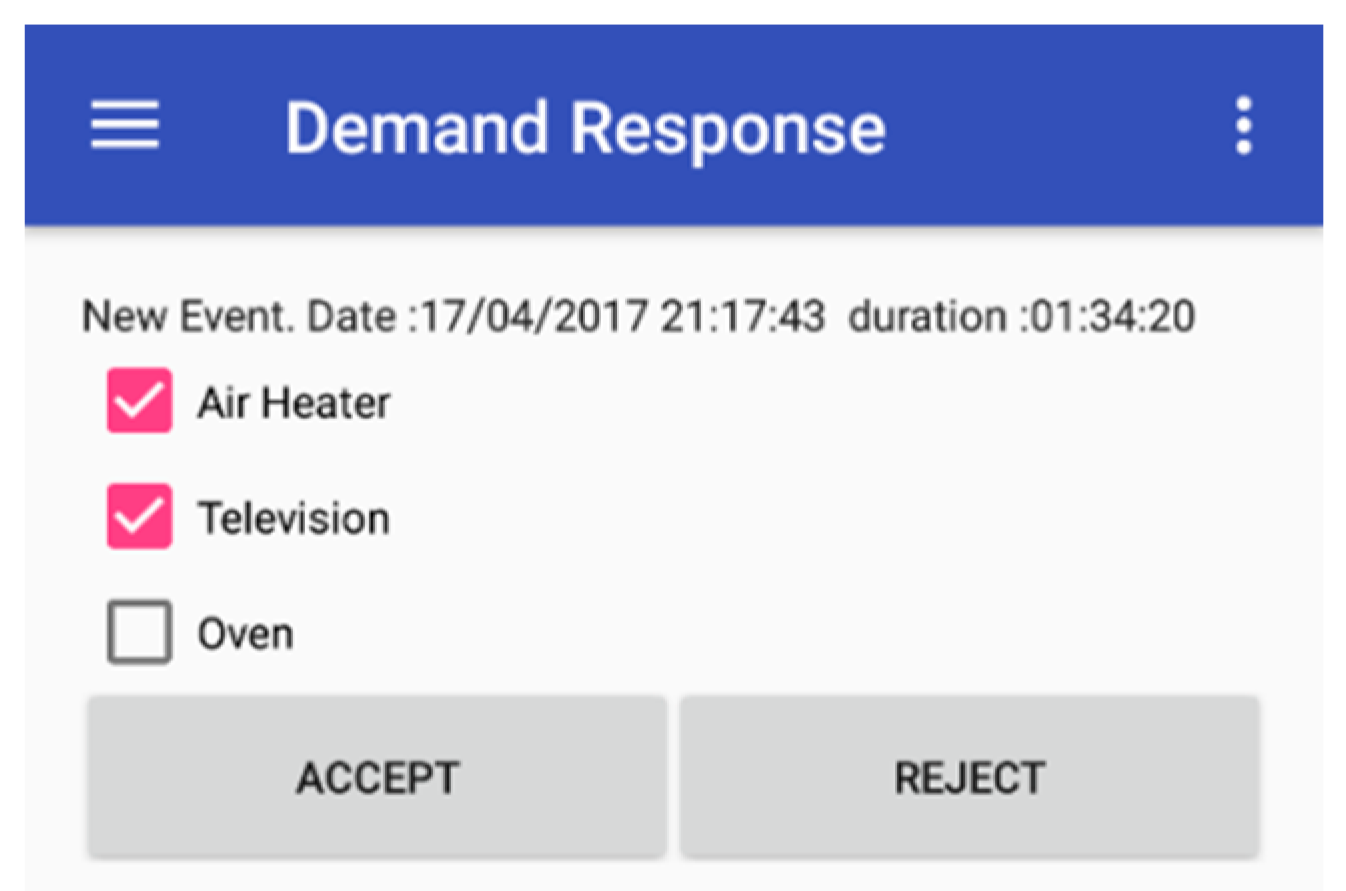
Together with the creation of a DR event, all the contracted end users receive notifications which include the relevant information about the planned event, as shown in
Figure 13. The system also checks any update through the internet connection. By clicking the received message, a list of the contracted appliances owned by the end user is shown on the screen, as seen in
Figure 14. In this case, the end-user has three options: to decline to participate in the event, to allow all the available appliances to be controlled by the system operator during the DR event or to choose some of them only. It should be noted that the screen can be easily upgraded with further information consisting of total power, participant ratio and potential monetary and carbon emission savings, etc.
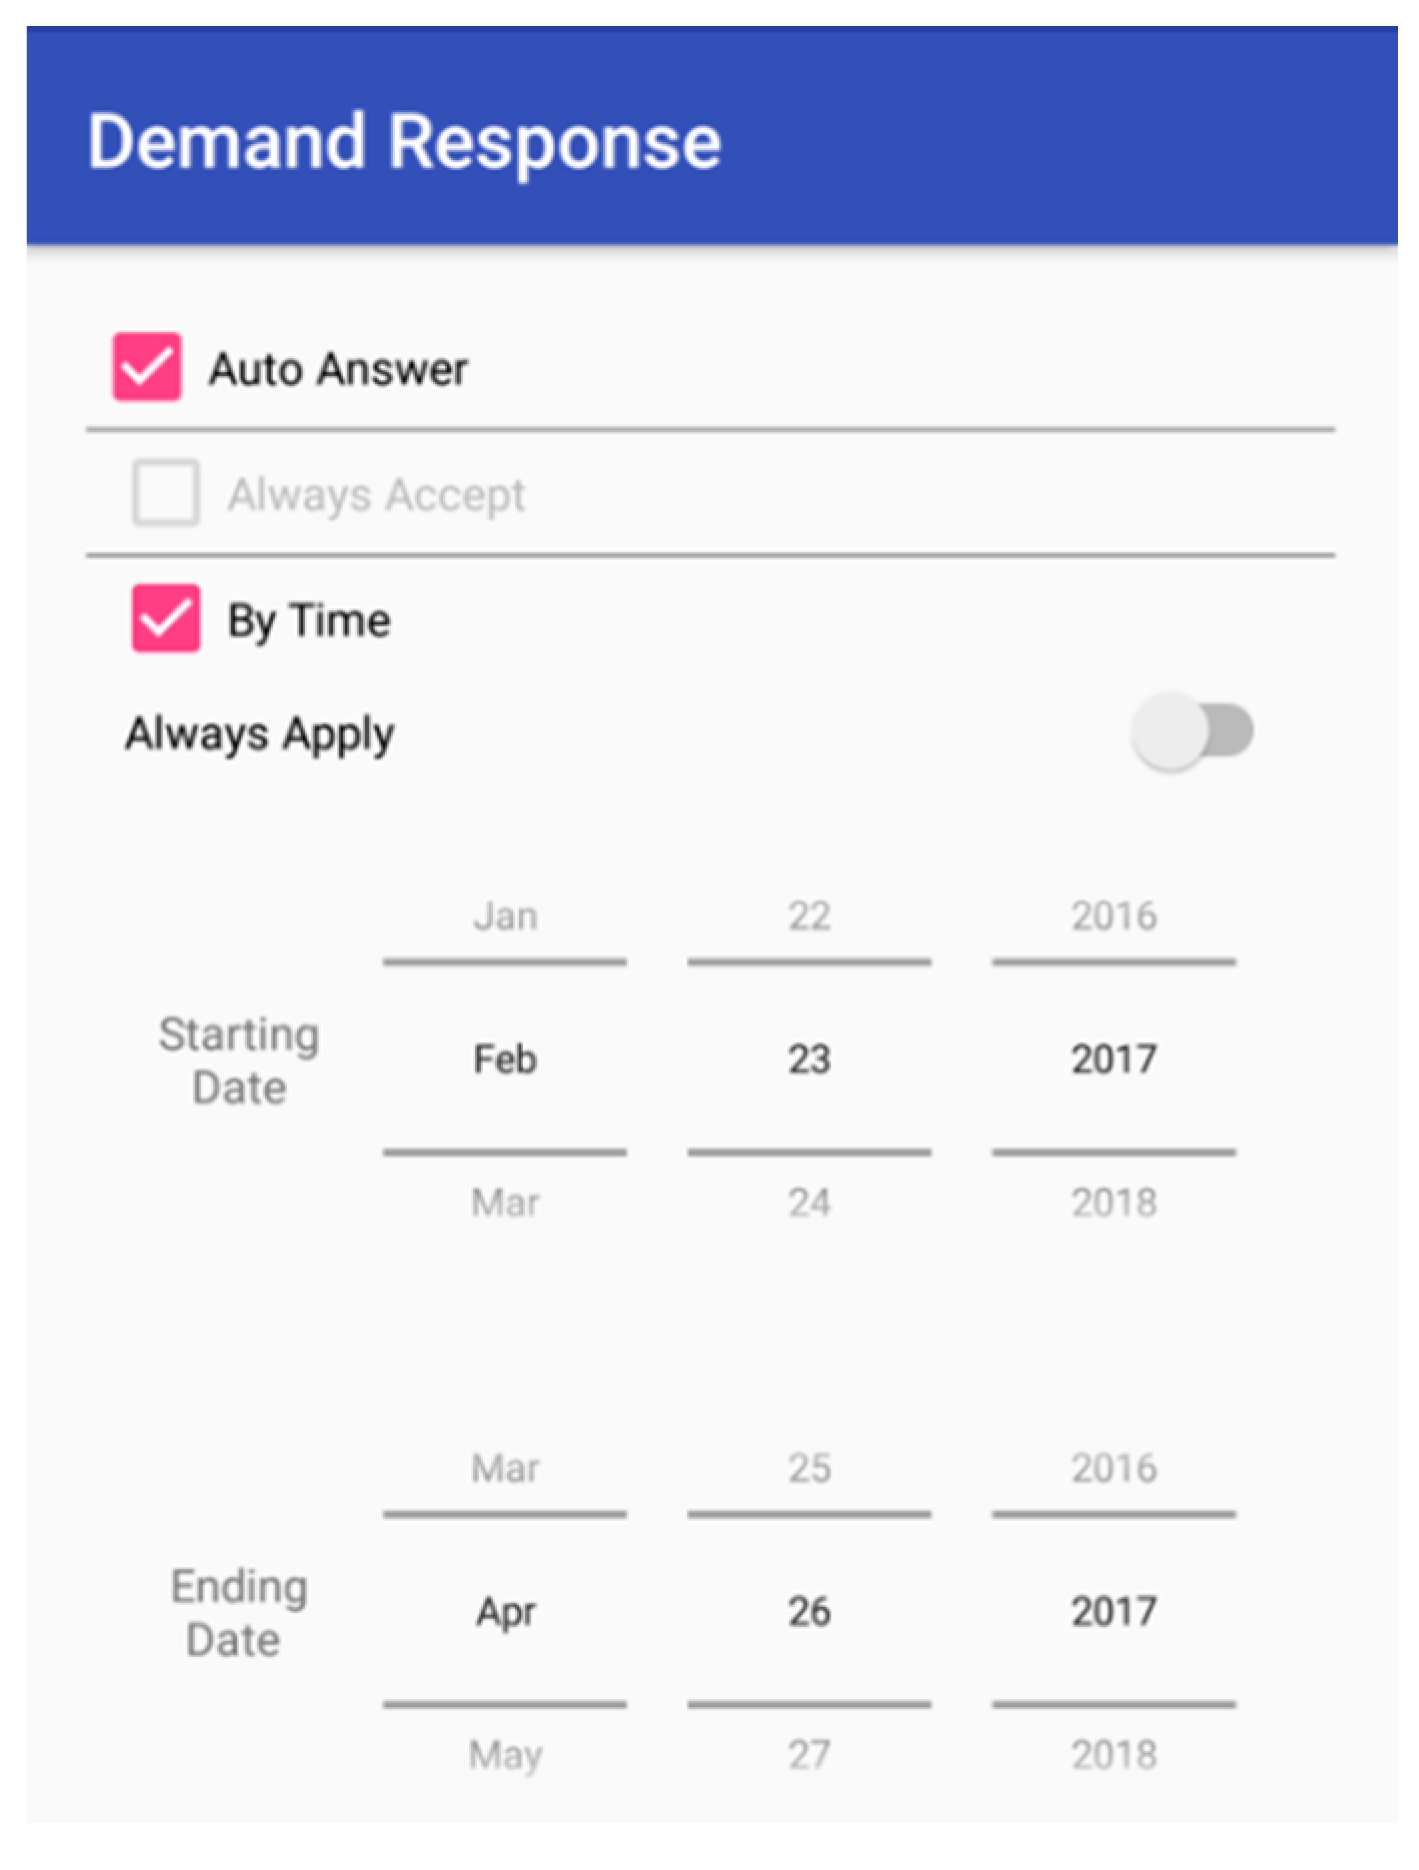
In order to minimize the waste of time that is likely to be faced during response processes, an automatic reply option is also available for certain types of appliances and/or time periods based on end-user preferences, as shown in
Figure 15. This menu enables end-users to automatically accept or decline DR events within the predefined time periods without receiving any notification.
3.2.2. The End-User Mobile Phone Interface for HEM System
The main target of HEM system is to defer the working hours of some appliances taking into account various criteria such as hourly energy pricing, user comfort preferences and desired power threshold limit value. For higher efficiency, the HEM module has the capability of updating its existing power plan based on the changes in energy prices or consumer preferences.
The proposed HEM interface can be effectively used for monitoring the power consumption of the appliances in detail and therefore controlling the appliances for energy and cost savings. It should be however noted that the energy management plan of the appliances is re-arranged with the incoming signal from the system operator at the starting times of DR events.
The proposed HEM interface controls the appliances through a module including an ARM Development board (Tiva C 1294XL), which is an easily accessible, cheap and energy-efficient tool. In the proposed structure, HEM module is connected to home network and accesses internet via Ethernet. Therefore, any smart appliance connected to the home network can communicate with HEM unit. Also, the appliances in the house can be connected to HEM module easily using various communication protocol thanks to its connection flexibility. In other words, HEM units can be configurable to use any device which uses wireless communication such as Bluetooth, Xbee or any wired communication such as controller area network (CAN), universal asynchronous receiver/transmitter (UART), serial peripheral interface (SPI), and inter-integrated circuit (I2C).
The proposed interface also has other features. For instance, end-users can view a summary of daily energy consumption through the link between the app and HEM unit. It is also possible for HEM unit to collect data of each connected device, to see the stored data and to intervene the working of appliances. Furthermore, the proposed module sends planned and realized consumption values to the main server at the end of each day, which might be valuable for estimating the possible future power consumption. Lastly, in addition to the power consuming units, the HEM module has also the ability to monitor or control the status of local generation units such as a wind turbine and photovoltaic (PV) panel, as well as of a storage system.
4. Case Study
The applicability of the proposed user interface has been investigated on a real smart home including various appliances with smart plugs, residential renewable energy generation units, and different communication and control technologies [
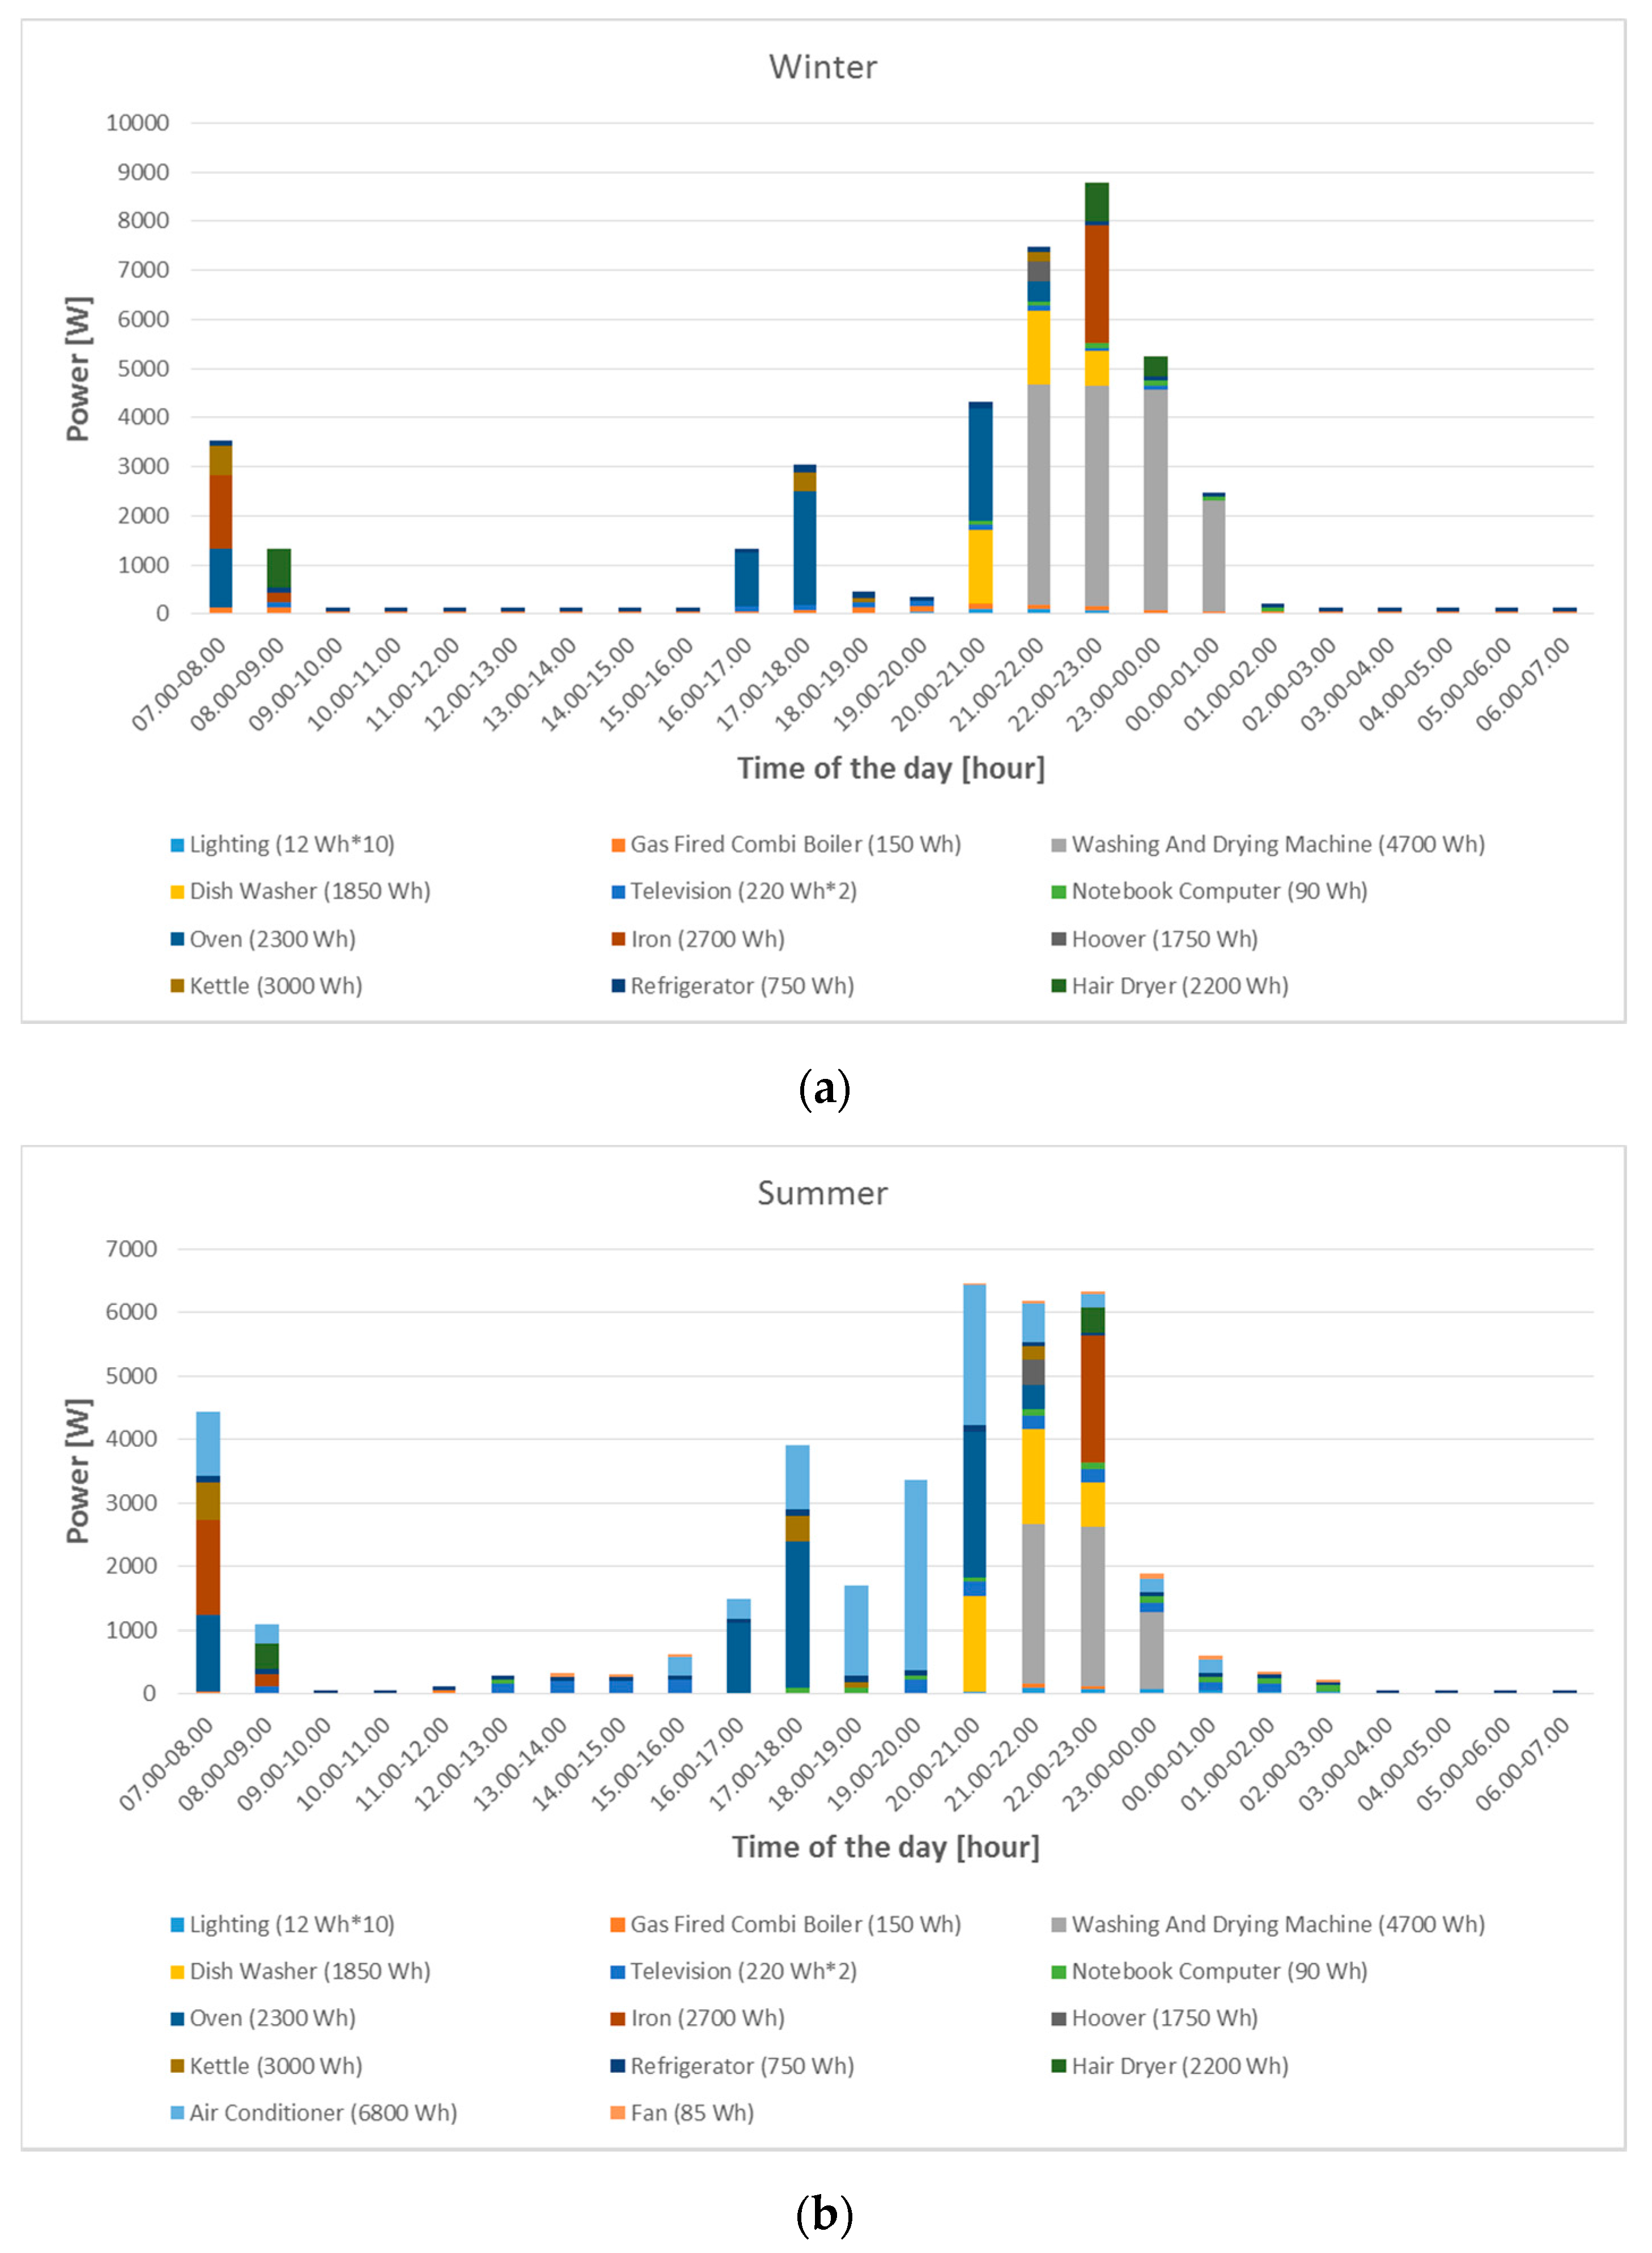
18]. As a case study, two different daily load scenarios representing the weekday load profiles of a four-people family in two seasons, winter and summer, have been considered in the application. The working periods and hourly energy consumption values of the appliances are shown in
Figure 16. For simplicity, the working periods are assumed to be one hour for all the appliances.
In the simulation studies, it is aimed to improve the cost savings by shifting the working periods of certain appliances. It should be noted that the summer data is considered only for brevity and that the price values are based on the time-of-use (ToU) rates adopted in Turkey electricity marketing, which is a three tariff system for domestic end-users, namely, the day rate (06:00 to 17:00), peak (17:00 to 22:00) and off-peak (22:00 to 06:00).
In order to provide a cost saving compared to a usual consumption profile, it is assumed that the working period of certain appliances such as washing machine and dishwasher is deferred to the off-peak times based on electricity price and the preferences of the end-user. For the thermostatically controllable loads (TCLs), the smart thermostats are controlled for the changes in the set temperature, resulting in a reduction in the energy consumed. Also, the consumption of some loads such as electric vehicles (EVs) are controlled partially by limiting their power for a certain period.
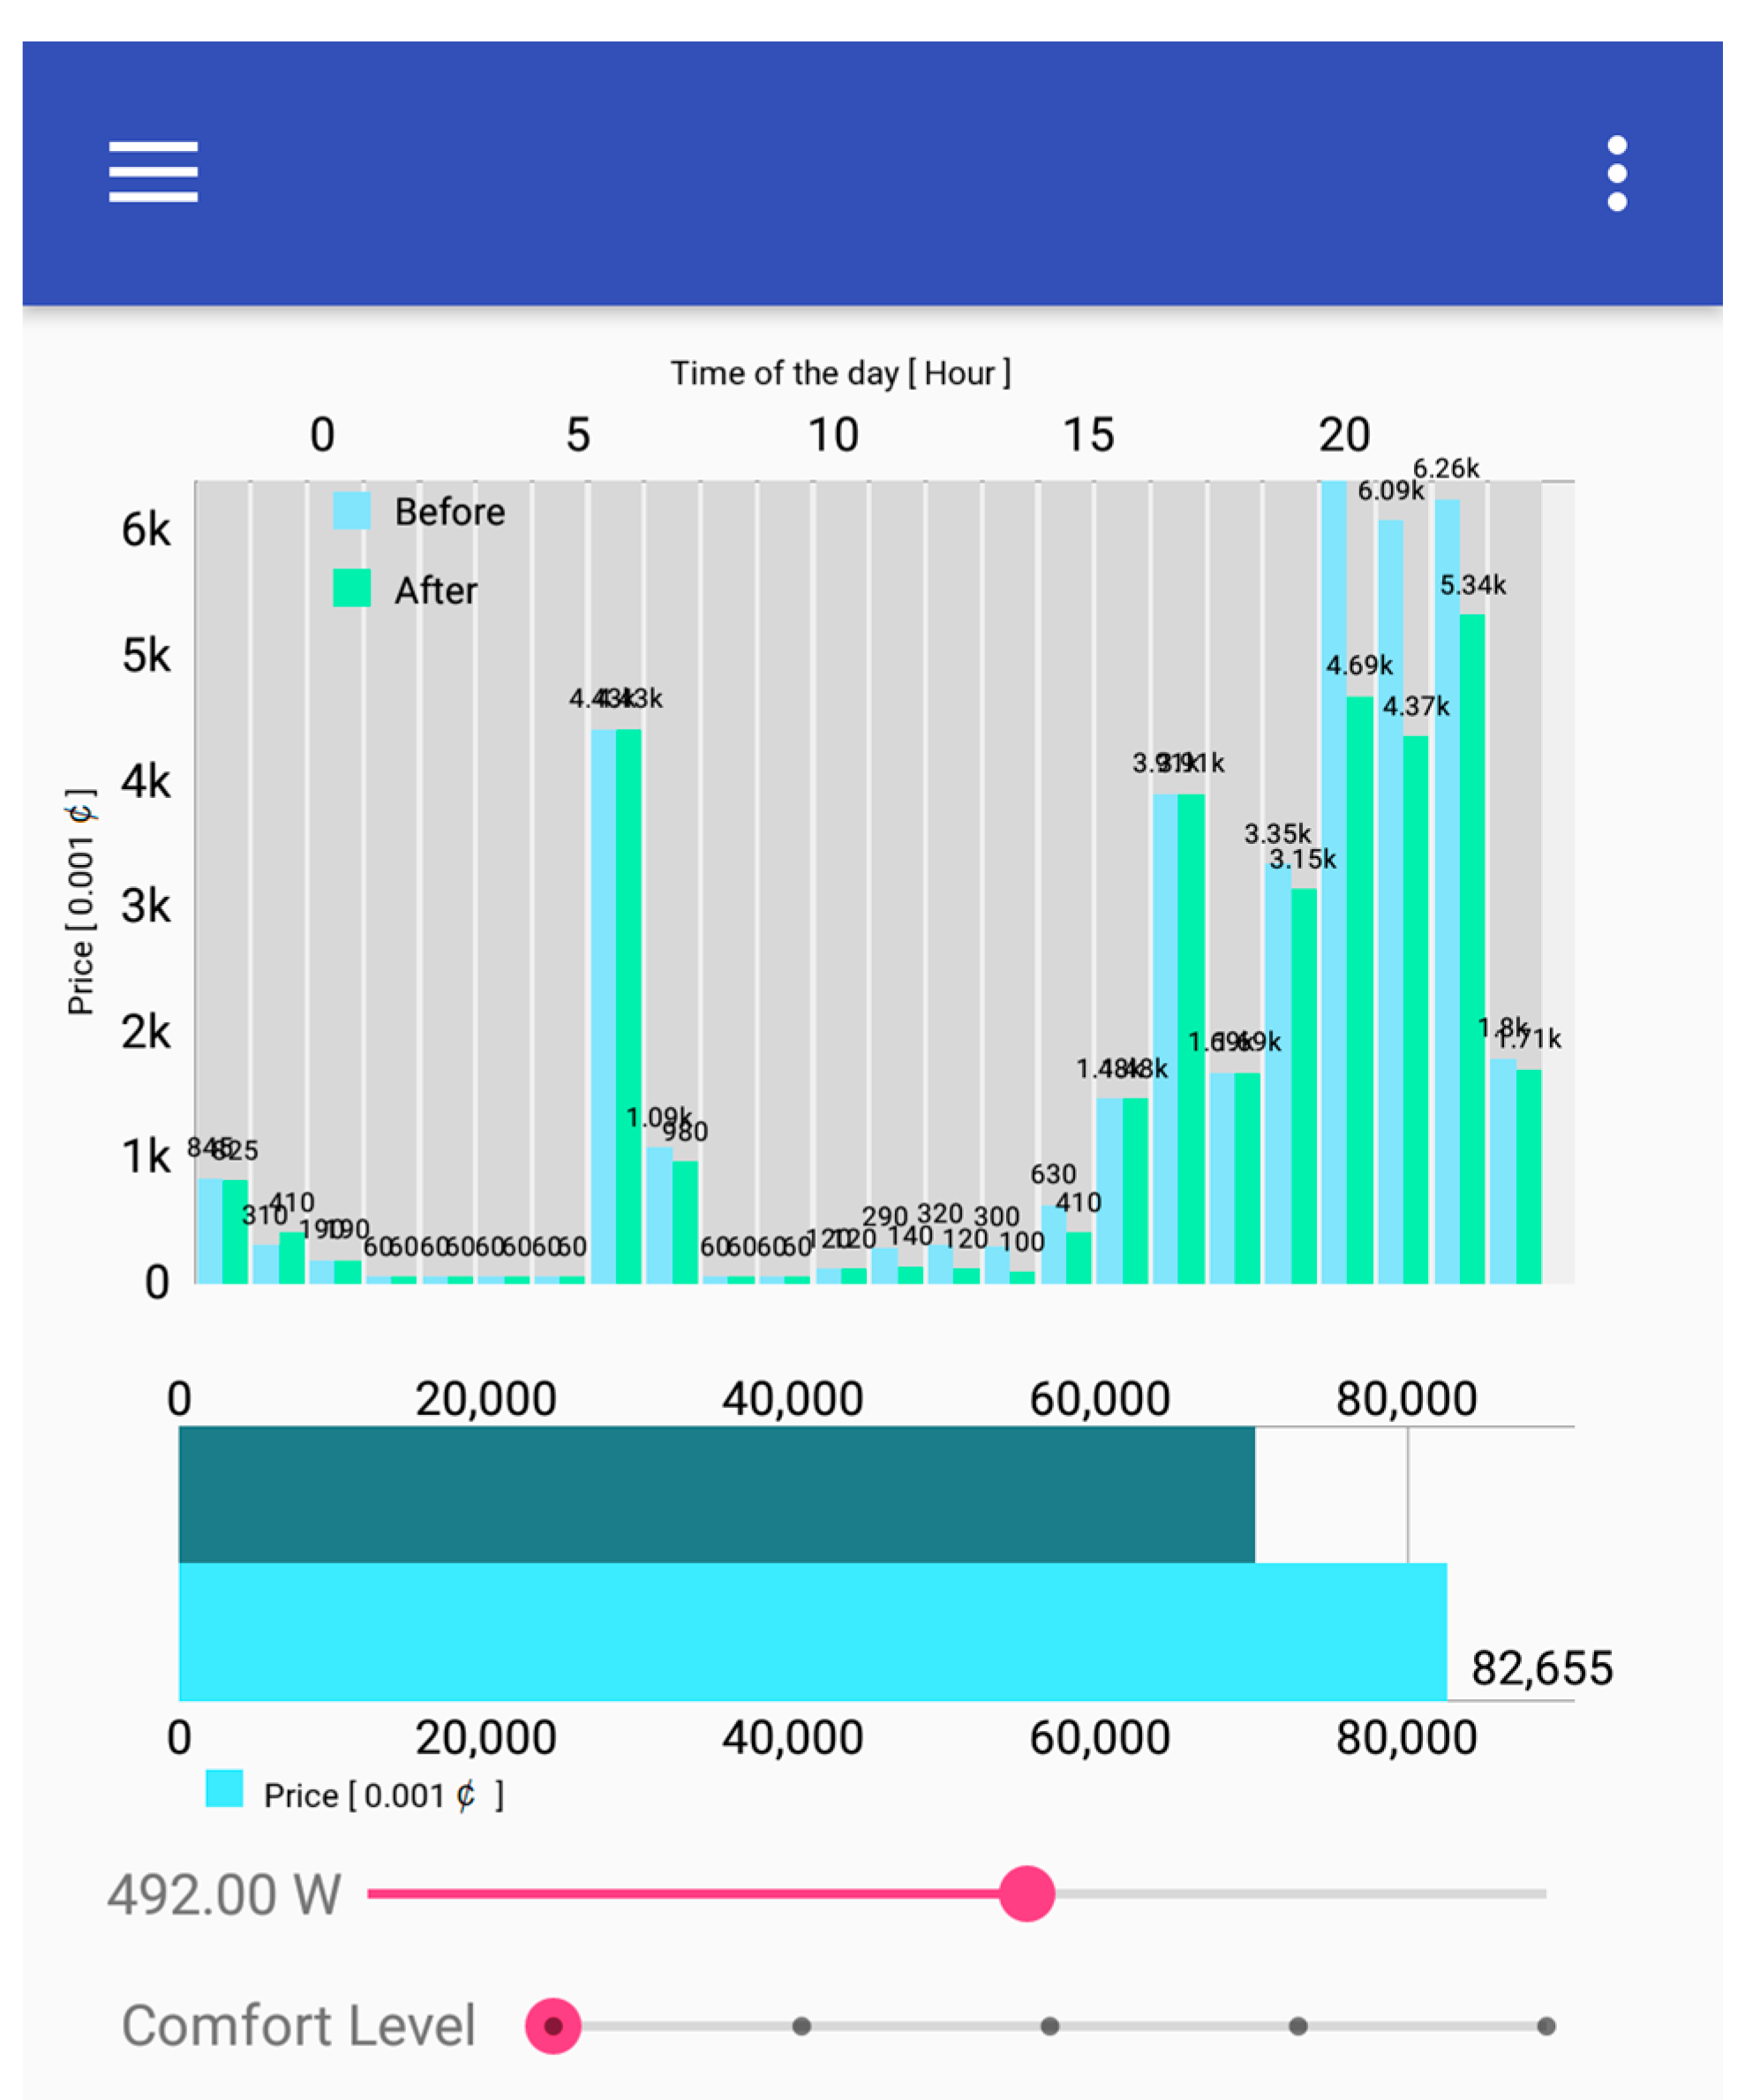
The cost of the energy consumed by the appliances with and without the proposed management algorithm is shown on the upper side of
Figure 17, where the blue bar and the green bar represent the hourly costs before and after applying the management algorithm, respectively. The graphic on the lower side in
Figure 11 illustrates the total daily costs for each case for the user-defined preferences shown at the bottom. It is also noted that threshold energy limit and comfort preference can be changed easily by end-users regarding their preferences and priorities. Moreover, it should be stated that the mentioned improvement is the result of benefiting from a HEM unit and the role of the end-user interface here is just to create an easy-to-use access point to the HEM system for non-expert end-users.
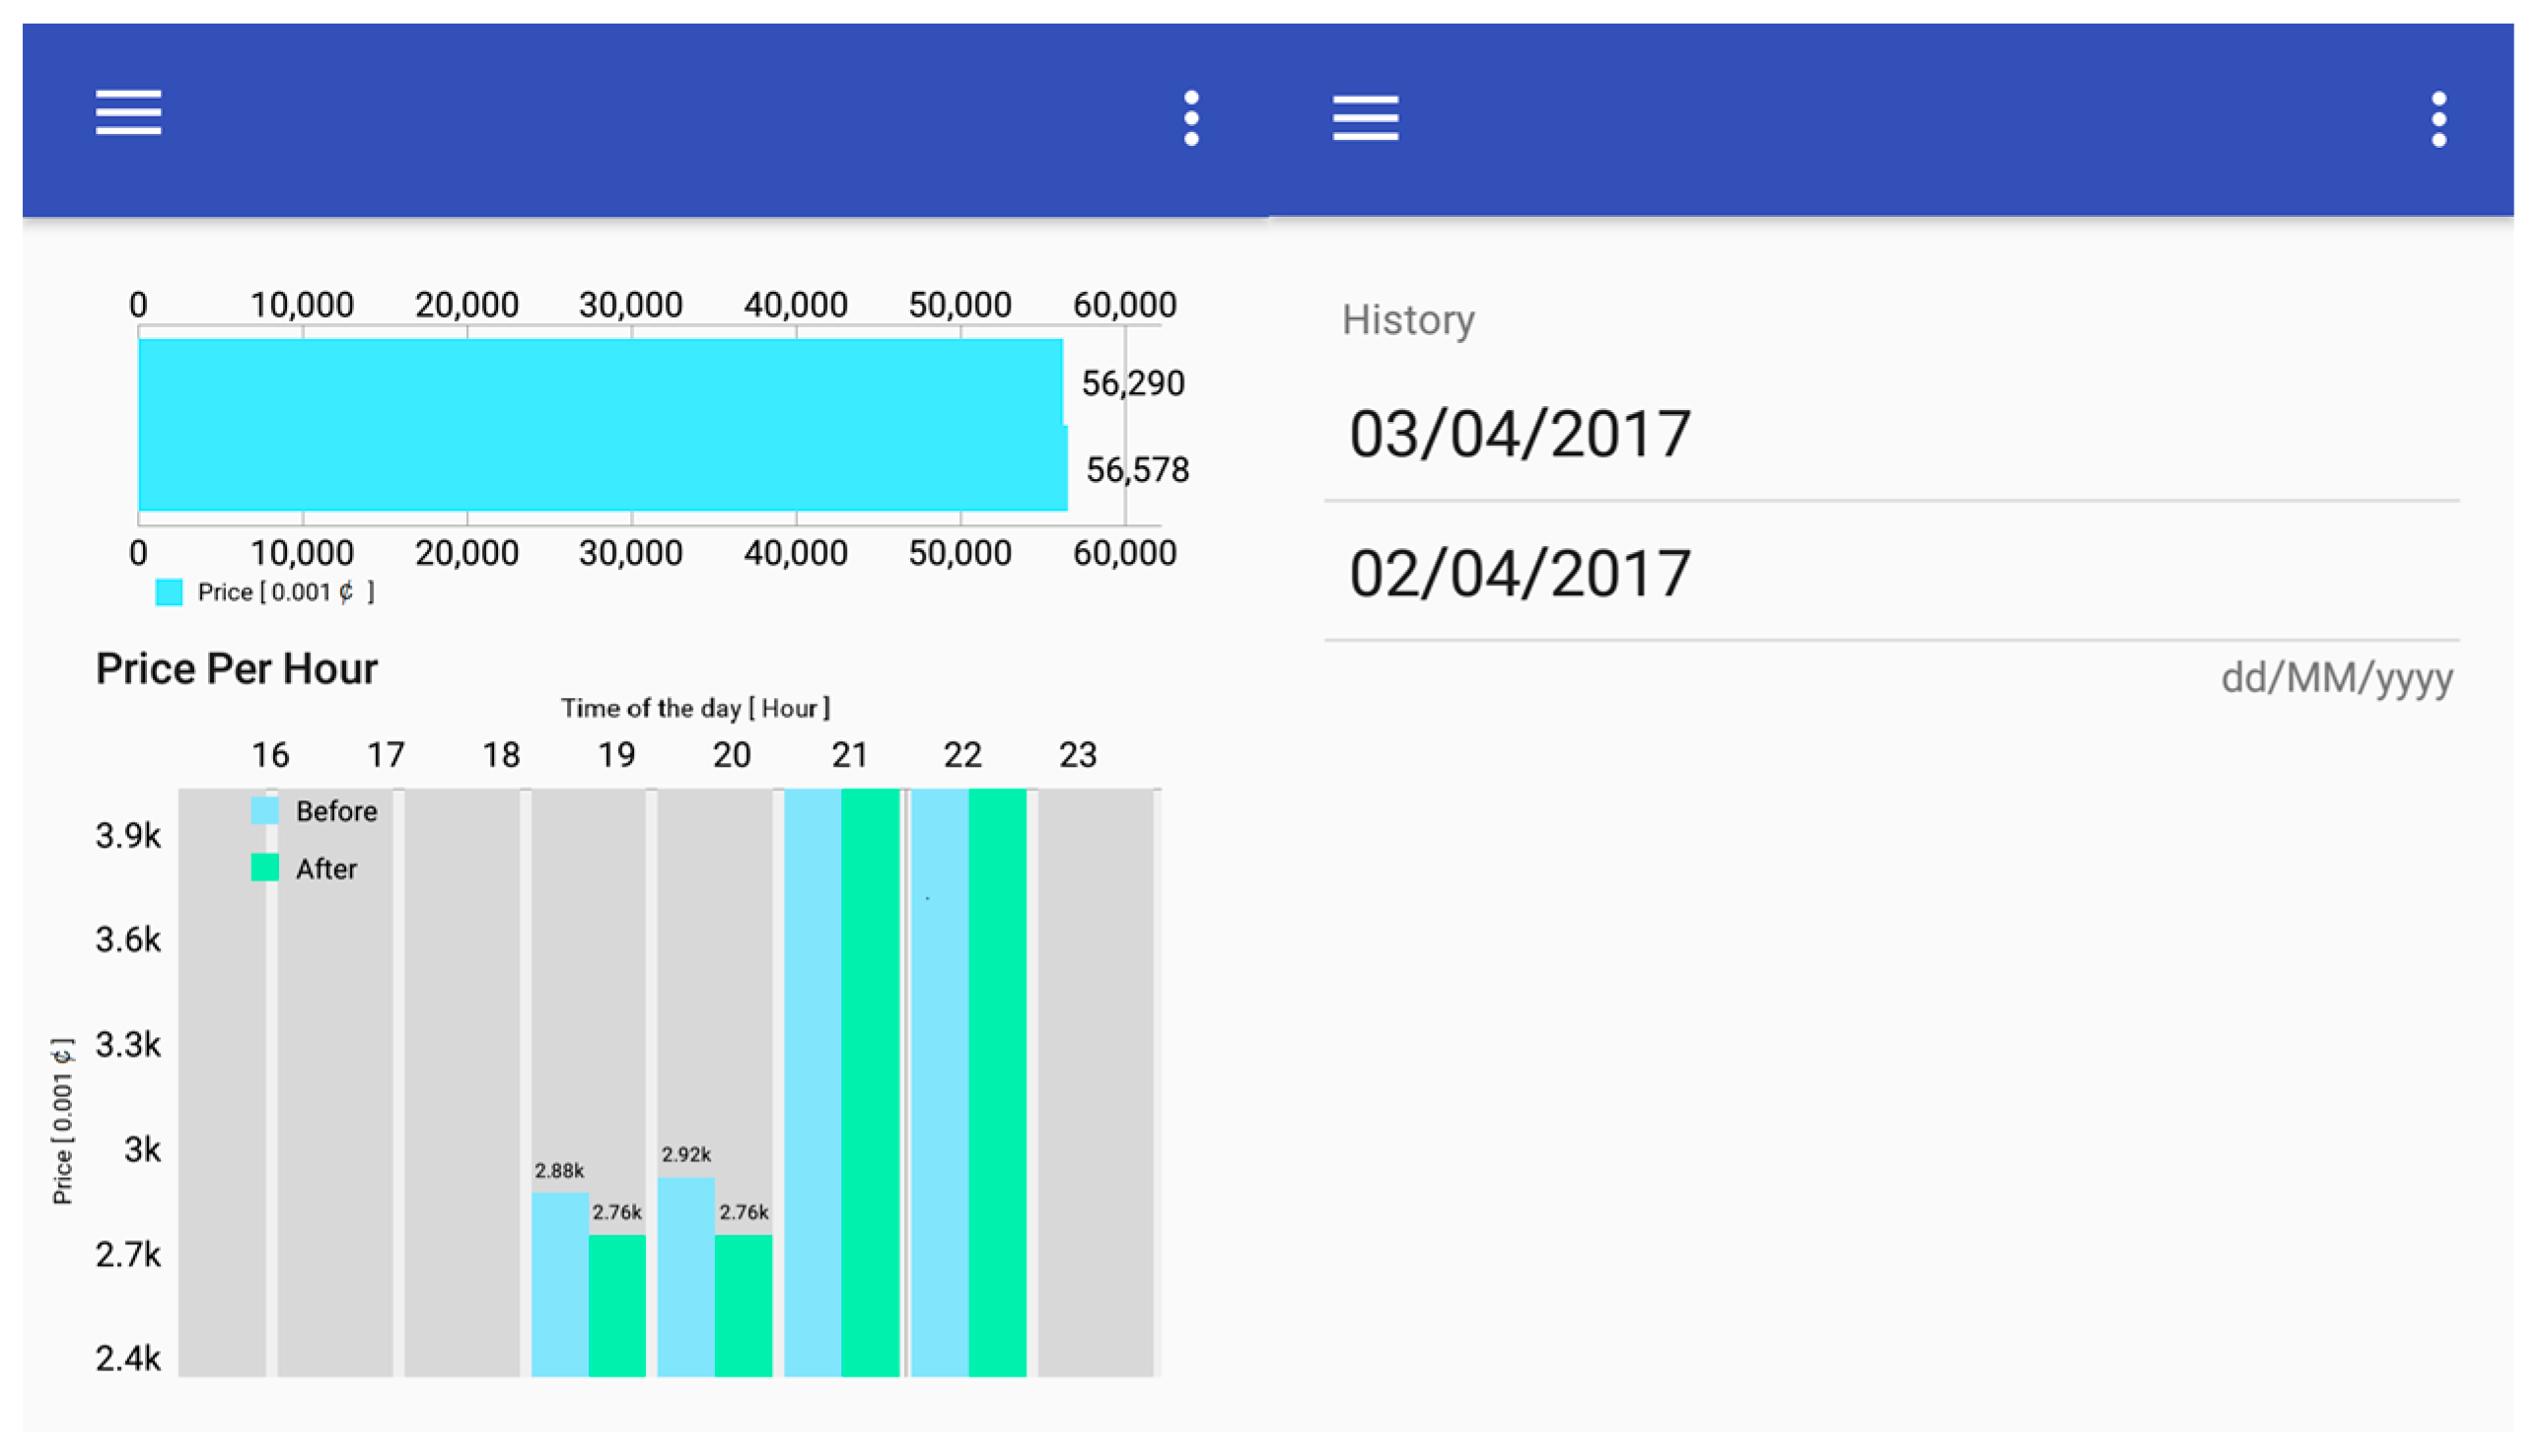
It should be noted that an energy threshold value, which is 492 Wh for this case, as seen from
Figure 17, has been employed for deciding the deferring actions. Based on their preferences, the end-users can easily change this value using the developed interface. It is also possible to monitor the historical energy consumption and the related costs on a history screen with the mobile application, as shown in
Figure 18.
As such smart grid vision enabling solutions requiring a high amount of bi-directional data flow become more widespread, it is evident that the electric power system in general will have possible vulnerabilities for any kind of possible cyber-attacks. Therefore, the cybersecurity concept becomes prominent for the continuity of effective electric power system operation by overcoming the mentioned possible vulnerabilities. Here, the objectives of cybersecurity as confidentiality, integrity, and availability (the so-called CIA triad) are taken into account for the assessment of vulnerabilities in different parts of electric power systems and then to find solutions also by prioritizing the vulnerabilities by their possible risky outcomes [
19]. Several useful real-world examples of cybersecurity threats in smarter electric power system structures are given in [
20].
Specifically for the end-users enrolled in such DR programs, the cybersecurity as well as the privacy of their own data (consumption habits, personal information such as identity number, address details, monetary status, etc.) are very likely to prevent wider participation in such DR programs. Therefore, apart from existing and developing cybersecurity solutions, not just in the electric power industry but in overall computerized technological sectors, specific privacy-preserving DR schemes have also been proposed [
21]. In this study, an md5 coding to improve the data security has been implemented; however, cybersecurity and data privacy can be the topics of different studies specifically oriented in such areas.
5. Concluding Remarks
In this study, a two-sided interface is proposed for both the system operator and end-users to improve the participation of end-users in DR programs. The structures and specifications of the system operator and end-user interfaces are explained in detail and their advantages over the similar tools are presented.
The main contributions of this study are as follows:
The interface is developed for both the system operator and end-user sides by taking their mutual benefits into account.
The interface provides the system operator with all the essential and detailed information about the status of end-users in real time, so that an efficient and timely scheduling is realized to prevent the unfavorable effects of peak power demands.
The user-driven mobile phone-based interface has the capability of increasing the awareness of end-users and thus their participation, compared to the tools with complicated and time-consuming decision-making processes.
In addition to enabling the interactions with the system operator, the versatile interface has the ability to be used as an access point to a HEM system that can control appliances and show their visualized historical measurements to end-users.
The proposed interface also allows to receive the notifications and then to participate in the DR event through mobile internet.
The proposed interface has a compact and modular structure; in other words, it allows including any controllable appliance into the interface.
As a future study, storage systems can be included in the system for exploiting the residential renewable energy potential and for improving the efficiency of the proposed structure by storing the energy at low-cost periods and using it later at peak-demand periods. Furthermore, an advanced forecasting tool can be integrated into the proposed structure for better matching the consumption and generation values.
Acknowledgments
This work was supported by FEDER funds through COMPETE 2020 and by Portuguese funds through FCT, under Projects. SAICT-PAC/0004/2015-POCI-01-0145-FEDER-016434, POCI-01-0145-FEDER-006961, UID/EEA/50014/2013, UID/CEC/50021/2013, UID/EMS/00151/2013, and SFRH/BPD/103744/2014, and by The Scientific and Technological Research Council of Turkey (TUBITAK) under Project Grant Number 116E115. Also, the research leading to these results has received funding from the EU Seventh Framework Programme FP7/2007-2013 under grant agreement No. 309048.
Author Contributions
Barış Yener mainly contributed by realizing the relevant implementations regarding the interfaces and HEMS integration. Akın Taşcıkaraoğlu and Ozan Erdinç provided the main idea, wrote the main parts of the paper and coordinated the overall study. Mustafa Baysal and Joao P. S. Catalao contributed by overall technical suggestions through the research steps and also contributed to the writing of the final research paper.
Conflicts of Interest
The authors declare no conflict of interest
References
- Gonen, T. Electrical Machines with MATLAB; CRC Press: Boca Raton, FL, USA, 2011. [Google Scholar]
- Erdinç, O.; Taşcıkaraoğlu, A.; Paterakis, N.G.; Eren, Y.; Catalão, J.P.S. End-User Comfort Oriented Day-Ahead Planning for Responsive Residential HVAC Demand Aggregation Considering Weather Forecasts. IEEE Trans. Smart Grid 2017, 8, 362–372. [Google Scholar] [CrossRef]
- Molina-Garcia, A.; Kessler, M.; Fuentes, J.A.; Gomez-Lazaro, E. Probabilistic Characterization of Thermostatically Controlled Loads to Model the Impact of Demand Response Programs. IEEE Trans. Power Syst. 2011, 26, 241–251. [Google Scholar] [CrossRef]
- Zhang, D.; Li, S.; Sun, M.; O’Neill, Z. An Optimal and Learning-Based Demand Response and Home Energy Management System. IEEE Trans. Smart Grid 2016, 7, 1790–1801. [Google Scholar] [CrossRef]
- Paterakis, N.G.; Taşcıkaraoğlu, A.; Erdinç, O.; Bakirtzis, A.G.; Catalão, J.P.S. Assessment of Demand-Response-Driven Load Pattern Elasticity Using a Combined Approach for Smart Households. IEEE Trans. Ind. Inf. 2016, 12, 1529–1539. [Google Scholar] [CrossRef]
- Zhang, W.; Lian, J.; Chang, C.Y.; Kalsi, K. Aggregated modeling and control of air conditioning loads for demand response. IEEE Trans. Power Syst. 2013, 28, 4655–4664. [Google Scholar] [CrossRef]
- Paterakis, N.G.; Erdinc, O.; Catalao, J.P.S. An overview of demand response: Key-elements and international experience. Renew. Sustain. Energy Rev. 2017, 69, 871–891. [Google Scholar] [CrossRef]
- Pipattanasomporn, M.; Kuzlu, M.; Rahman, S. An algorithm for intelligent home energy management and demand response analysis. IEEE Trans. Smart Grid 2012, 3, 2166–2173. [Google Scholar] [CrossRef]
- Ozturk, Y.; Jha, P.; Kumar, S.; Lee, G. A personalized home energy management system for residential demand response. In Proceedings of the Fourth International Conference on Power Engineering, Energy and Electrical Drives (POWERENG), Istanbul, Turkey, 13–17 May 2013; pp. 1241–1246. [Google Scholar]
- Fernandes, F.; Morais, H.; Vale, Z.; Ramos, C. Dynamic load management in a smart home to participate in demand response events. Energy Build. 2014, 82, 592–606. [Google Scholar] [CrossRef]
- Barbato, A.; Bolchini, C.; Geronazzo, A.; Quintarelli, E.; Palamarciuc, A.; Pitì, A.; Rottondi, C.; Verticale, G. Energy Optimization and Management of Demand Response Interactions in a Smart Campus. Energies 2016, 9, 398. [Google Scholar] [CrossRef]
- Khamphanchai, W.; Saha, A.; Rathinavel, K.; Kuzlu, M.; Pipattanasomporn, M.; Rahman, S.; Akyol, B.; Haack, J. Conceptual architecture of building energy management open source software (BEMOSS). In Proceedings of the Innovative Smart Grid Technologies Conference Europe (ISGT-Europe), Istanbul, Turkey, 1–6 October 2014. [Google Scholar]
- Moreno-Munoz, A.; Bellido-Outeirino, F.J.; Siano, P.; Gomez-Nieto, M.A. Mobile social media for smart grids customer engagement: Emerging trends and challenges. Renew. Sustain. Energy Rev. 2016, 53, 1611–1616. [Google Scholar] [CrossRef]
- Intelen—DiG Solutions. Available online: https://intelen.com/us/solutions/dig.html (accessed on 29 May 2017).
- Silver Spring Networks—Mobile Thermostat App and Updated Demand Optimizer Demand Response Management System Application. Available online: https://www.silverspringnet.com/article/in-the-news/mobile-thermostat-app-and-updated-demand-optimizer-demand-response-management-system-application (accessed on 29 May 2017).
- Transpower—Demand Response Mobile App. Available online: https://www.transpower.co.nz/keeping-you-connected/demand-response/demand-response-mobile-app (accessed on 29 May 2017).
- South California Edison—Demand Response Mobile App. Available online: https://www.sce.com/wps/portal/home/business/savings-incentives/demand-response/demand-response-mobile-app (accessed on 29 May 2017).
- Tascikaraoglu, A.; Uzunoglu, M.; Tanrioven, M.; Boynuegri, A.R.; Elma, O. Smart grid-ready concept of a smart home prototype: A demonstration project in YTU. In Proceedings of the 4th International Conference on Power Engineering, Energy and Electrical Drives, Istanbul, Turkey, 13–17 May 2013; pp. 1568–1573. [Google Scholar]
- Gellings, CW. The Smart Grid: Enabling Energy Efficiency and Demand Response; CRC Press: Boca Raton, FL, USA, 2009. [Google Scholar]
- Flick, T.; Morehouse, J. Securing the Smart Grid; Elsevier: Burlington, MA, USA, 2011. [Google Scholar]
- Li, H.; Lin, X.; Yang, H.; Liang, X.; Lu, R.; Shen, X. EPPDR: An Efficient Privacy-Preserving Demand Response Scheme with Adaptive Key Evolution in Smart Grid. IEEE Trans. Parallel Distrib. Syst. 2014, 25, 2053–2064. [Google Scholar] [CrossRef]
© 2017 by the authors. Licensee MDPI, Basel, Switzerland. This article is an open access article distributed under the terms and conditions of the Creative Commons Attribution (CC BY) license (http://creativecommons.org/licenses/by/4.0/).


