Article

Characterizing Flow-Induced Vibrations of Fuel Assemblies for Future Liquid Metal Cooled Nuclear Reactors Using Quasi-Distributed Fibre-Optic Sensors

1
Department of Applied Physics and Photonics (TONA), Vrije Universiteit Brussel, Brussels Photonics (B-PHOT), Pleinlaan 2, 1050 Brussels, Belgium
2
Flanders Make, Oude Diestersebaan 133, 3920 Lommel, Belgium
3
Belgian Nuclear Research Centre (SCK•CEN), Boeretang 200, 2400 Mol, Belgium
*
Author to whom correspondence should be addressed.
Submission received: 1 August 2017 / Revised: 16 August 2017 / Accepted: 19 August 2017 / Published: 22 August 2017
(This article belongs to the Special Issue Distributed Optical Fiber Sensors)

Abstract

:
Excessive vibration of nuclear reactor components, such as the heat exchanger or the fuel assembly should be avoided as these can compromise the lifetime of these components and potentially lead to safety hazards. This issue is particularly relevant to new reactor designs that use liquid metal coolants. However, identifying adequate sensors or techniques that can be successfully applied to record the vibrations of the components in a flow of liquid metal at elevated temperatures is very challenging. In this paper, we demonstrate the precise measurements of the vibrations of a very representative mock-up of a fuel assembly in a lead-bismuth eutectic cooled installation using quasi-distributed fibre Bragg grating (FBG) based sensors. The unique properties of these sensors, in combination with a dedicated integration and mounting approach, allows for accounting of the severe geometrical constraints and allows characterizing the vibration of the fuel assembly elements under nominal operation conditions. To that aim, we instrumented a single fuel pin within the fuel assembly with 84 FBGs, and conducted spectral measurements with an acquisition rate of up to 5000 measurements per second, enabling the monitoring of local strains of a few με. These measurements provide the information required to assess vibration-related safety hazards.

1. Introduction

The ability to carry out vibration measurements has become crucial in the safety assessment of many types of engineering structures and components [1]. Damage caused by excessive vibration is well-known as a potential cause of structural failure. Actual vibration measurement results are often used to validate calculations and numerical models during the design phase, with the ultimate aim to verify that the expected lifetime of the as-built structure complies with the anticipated operational life, or useful lifetime of the designed structure [2].
In some situations, the structure or component under evaluation is difficult to reach or exposed to a harsh environment (such as high temperatures). In addition, the design can aim to limit the vibrations, and thus make them difficult to pick up. The rise of more intricate and more sensitive vibration sensors, such as optical fibre based sensors have contributed to the advancements in vibration measurements in such situations [3,4,5,6].
In this work we report on such a safety study that is part of extensive research activities conducted with the aim to develop and commission MYRRHA, which is a prototype nuclear reactor belonging to the so-called fourth generation [7,8], and which is currently being designed at the Belgian Nuclear Research Centre (SCK•CEN). MYRRHA will be an accelerator driven and spallation source based reactor, cooled with a molten lead-bismuth eutectic (LBE) alloy (Figure 1). As in any nuclear reactor, the vibration levels of reactor internals must be kept within certain limits. The research presented in this paper has been undertaken with the objective to provide valuable input for a safety study of the MYRRHA fuel assembly, specifically by studying the flow-induced vibration (Figure 1). In nuclear reactors, flow-induced vibrations are generally the result of the reactor coolant interacting with flexible reactor internals [9,10,11]. These internals are typically fuel pins, shielding plates, or heat exchanger tubes. In this paper, we focus on the fuel pins in the fuel assembly. Knowledge and understanding of the fuel pin vibrations is critical to assess the possibility of occurrence of failure modes corresponding to mechanical wear, such as fretting or fatigue. Regardless of where these vibrations take place in the reactor, they are always undesirable and often unexpected. Therefore, a thorough analysis of flow-induced vibration of the fuel pins is a crucial aspect of the design cycle in view of assessing the lifetime of reactor internals and ensuring safe operation of these reactors.
Different vibration sensors or techniques are available to carry out such measurements [12,13,14,15]. However, we had to work in liquid LBE, which has a density of more than 10 times that of water, is corrosive and opaque [16]. In addition, to meet the requirements of the nuclear reactor, the LBE is heated to 200–400 °C, whilst flowing at a speed close to 1.7 m/s in the fuel assembly [7,8]. This shortens the list of potentially adequate sensors or techniques. Piezoelectric sensors, for example, would suffer from electrode corrosion or require bulky protective packaging. In our application, the spacing between the individual fuel pins is limited to a few millimetres, which leaves little room to install vibration sensors. Furthermore, and in order to obtain reliable vibration readings, the sensors should not affect the flow of LBE. The sensors should therefore have very small dimensions. This led us to select optical fibre Bragg grating (FBG) based sensors, which we had previously validated for this specific environment, as described in [5,17].
The remainder of this paper is structured as follows. Section 2 describes the experimental test facility and test section, as well as how the optical fibres sensors have been mounted. In addition, Section 2 explains the validation of the mounting of the fibre sensors and discusses the egress of the fibres out of the installation. Section 3 deals with the experimental results and discusses how these relate to the operational modes of the loop. Section 4 closes our paper with a summary and conclusions.

2. The Experimental Platform

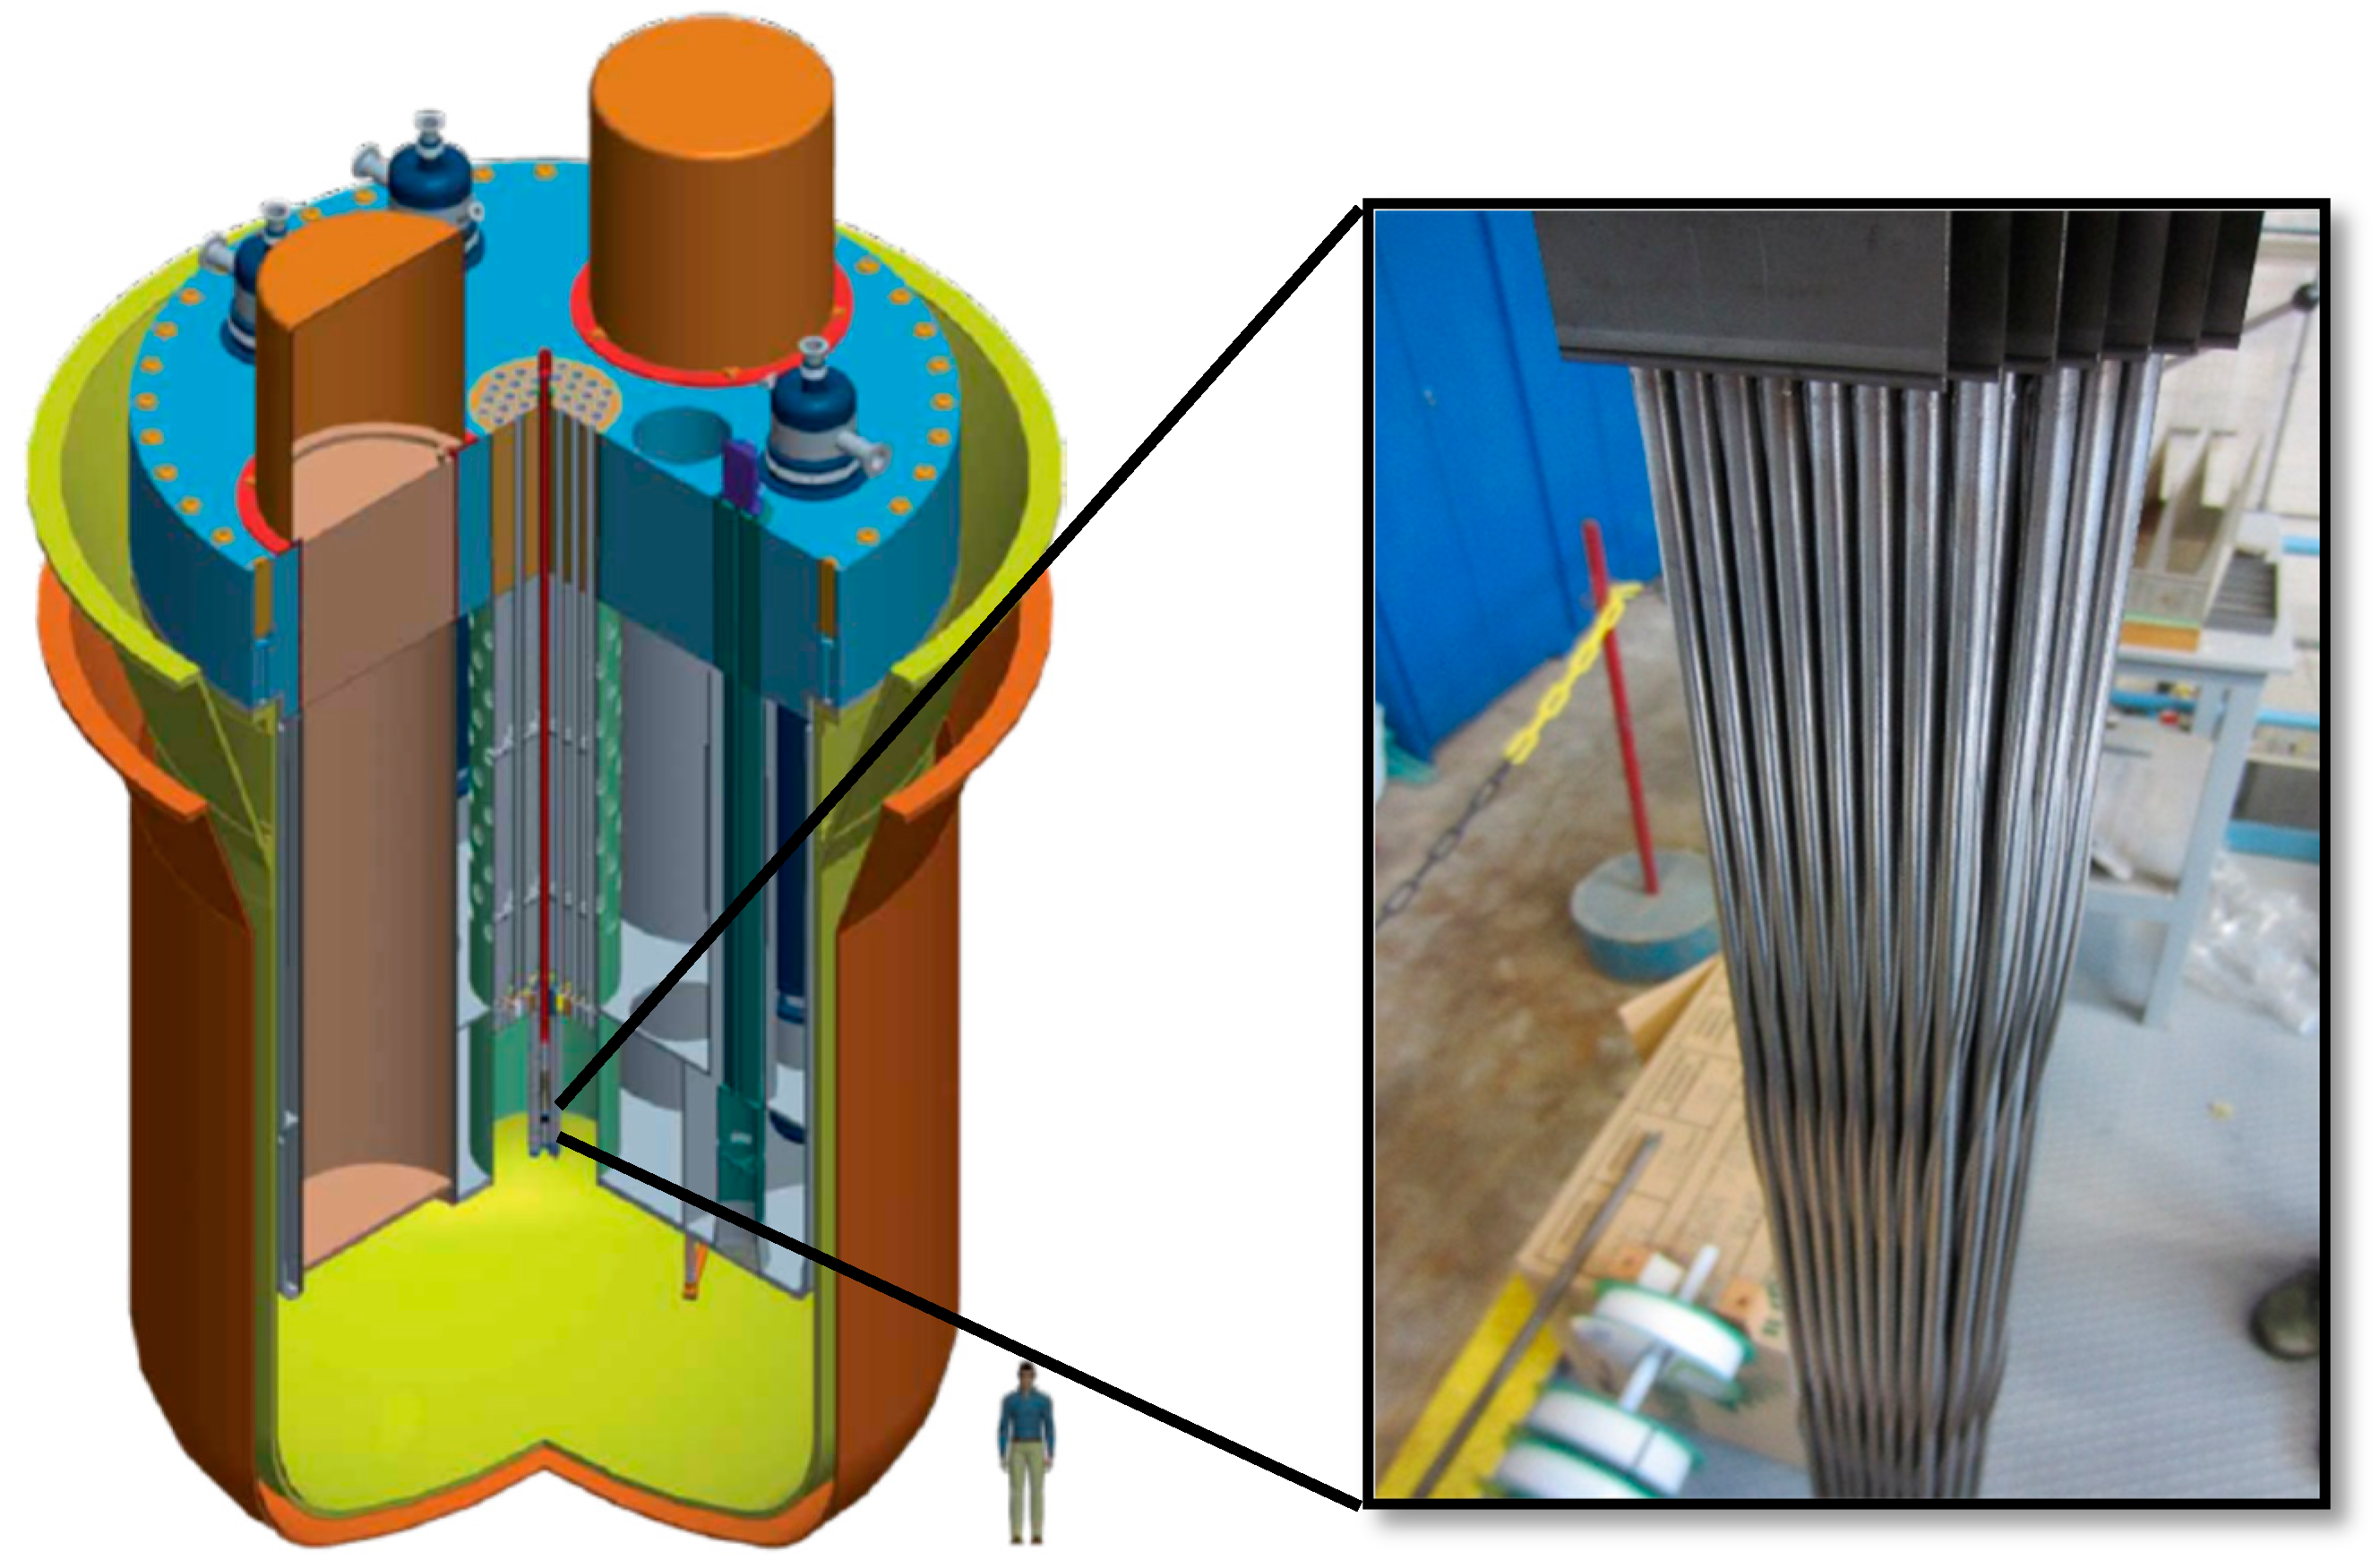
2.1. Test Facility and Test Section

To assess the vibrations in a full-scale LBE cooled replica of the MYRRHA fuel assembly, we have used an experimental test facility that allows for characterizing the hydraulic and hydrodynamic behaviour of various full-scale MYRRHA components in LBE [18,19]. An isometric view of the facility, with a height exceeding 7 m, is shown in Figure 2 (left). The set-up is an isothermal closed loop that can circulate LBE at a constant temperature. The maximum LBE temperature is 400 °C. The LBE is circulated by a vertical shaft sump type centrifugal pump via a cartridge filter vessel and through an air-cooler, sized to remove only the fluidic heating power from the pump. LBE flow rates up to 36 m3/h can be achieved, which is sufficient to cover the nominal flow rate through one MYRRHA fuel assembly. A vortex flowmeter measures the total volumetric flow rate entering the test section. For the experiments described in this paper, a full-scale mockup of the MYRRHA fuel assembly was installed into the vertical test section. The vertical test section in the set-up is representative of a single MYRRHA section at full height, with the LBE flowing upwards like in MYRRHA. To reduce the influence of piping loop components and to facilitate a fully developed flow at the inlet of the test section, an inlet box was installed at the bottom of the test section. A photograph of a part of the facility above the ground level is shown in Figure 2 (right). Overall the test facility allows experimenting with a very realistic mock-up of a full-sized fuel assembly with LBE temperatures and flow rates comparable to the situation in MYRRHA, whilst minimizing the influence of piping loop components. Note that the measurements in the loop are conducted in the absence of nuclear fission and associated nuclear radiation. Since the goal of the experiments was to evaluate the fuel assembly vibrations, the effect of nuclear radiation can be considered secondary in the context of this paper. In addition, irradiation induced swelling of the fuel assembly would lead to a reduction of the spatial tolerances and effectively closing gaps thereby possibly reducing the flow-induced vibrations.

2.2. Manufacturing and Mounting of the Instrumented Fuel Assembly

The manufactured fuel assembly consists of a hexagonal bundle of 127 cylindrical fuel elements, surrounded by a hexagonal shroud or wrapper, and mounted on 13 support plate rails at the fuel assembly inlet. These support rails run horizontal over the fuel assembly and are shown in Figure 3. Each rail can slightly rotate about its mounting, allowing for some translation at the fuel pin inlet. The individual fuel pins are unrestrained along the length of the fuel assembly, but helical wire-spacers with a diameter of 1.8 mm wound around the outer surface of each fuel pin with a pitch of 265 mm keeps them separated from one another. The fuel pins were made of stainless steel cylindrical hollow tubes (made from 316 L steel) with an outer diameter of 6.55 mm, and a length of 1400 mm. In this manner, the geometry, restriction, and support of the manufactured fuel assembly matched the MYRRHA design. In addition, we filled each pin with representative internals, such as the gas plenum, a spring to accommodate the thermal expansion of the internals with respect to the fuel pin, and fuel pellet dummies. The resulting fuel pin weight was close to 900 g.
Due to the limited space between the individual fuel pins (only 1.8 mm) and the anticipated small vibration amplitudes, optical fibre sensors are one of the very few options to measure vibrations in the fuel assembly. In our previous work [5,17,20] we demonstrated that FBGs are sufficiently sensitive to record the fuel assembly vibrations and that their useful time in a LBE environment is sufficient to carry out meaningful measurements. We shortly recall that a FBG consists of a periodic variation of the refractive index of the core of the optical fibre and is characterized by a resonance optical wavelength at which it reflects light, referred to as the Bragg wavelength λB [21,22]. Tracing the position of λB as a function of time allows using the FBG as a sensor since the resonance wavelength changes with applied mechanical strain or changes in temperature. In this work, we took advantage of the multiplexing capabilities of FBGs, meaning that multiple FBGs can be combined into a single optical fibre to conduct quasi-distributed measurements. This feature was particularly useful when instrumenting the fuel pins with a high sensor density, which was desired to resolve fuel pin length-dependent phenomena, such as variations of the vibration amplitudes and associated strain levels along the fuel pin.

2.3. Instrumentation of Fuel Pin and Validation

In order to conduct reliable measurements on the surface of the individual fuel pins in the fuel assembly, the optical fibres with FBGs need to be adequately mounted. To do so, we followed the procedure as described in detail in [5]. We inserted the optical fibres in a groove that was machined in the fuel pin surface. Owing to the small dimensions of the optical fibre (diameter of only 200 μm), we could limit the size of the groove to approximately 300 μm whilst fully embedding the optical fibres in the fuel pin wall. To avoid issues with respect to the interpretation of the vibration data, we opted to manufacture the groove parallel with the fuel pin axis. Once inserted in the grooves, the optical fibres were fixed and protected with a high temperature ceramic alumina adhesive (Resbond 989) that can sustain temperatures well beyond 1000 °C. The mounting method has also been graphically represented in Figure 4 (left).
The FBGs are commercially available UV-written draw tower gratings (DTGs), which are known to feature excellent strength and fatigue characteristics [4,23,24]. The former property is especially important during thermal cycles (and shocks) where we encountered corresponding strains as high as 0.5–1% due to thermal expansion. The higher yield strength of DTGs is also particularly important during the installation of the fuel pins in the complex experiments: as they feature a higher strength than the conventional re-coated FBGs, they are less likely to fail during installation and use.
An important issue when mounting FBGs in this manner is to avoid distortion of the spectrum resulting from non-uniform strain being applied to the FBG. In addition, the mounting of the FBG in a groove with an adhesive that typically shrinks during curing can induce birefringence. In order to avoid such issues we inserted the FBGs in a small glass capillary (see also Figure 4 (left) and we used a dedicated wavelength shift determination technique, i.e., the phase correlation method, as described in more detail in [25,26,27] as well.
We instrumented the central fuel pin with 4 optical fibres using the integration scheme as explained above, as graphically represented in Figure 4 (right). We mounted the fibres on 4 sides of the fuel pin so that 2 fibres are essentially sensitive to strain corresponding to bending moments parallel with the support rails, and the 2 other fibres to bending moments perpendicular to the support rails. Each fibre contained 21 FBGs, of which 20 FBGs were distributed uniformly over the fuel pin length. The last FBG, used as a reference, was not inserted into a groove on the fuel pin, but located inside of a stainless steel capillary (as explained in Section 2.4) close to the egress point of the fibre on the fuel pin. In total, 84 FBGs were introduced in the central fuel pin. We chose the Bragg wavelengths or resonance wavelengths of the FBGs so as to fit within the spectral bandwidth of the optical source used in the FBG interrogator (detailed in Section 2.4), and so as to feature a sufficiently large separation of the Bragg wavelengths λB (of at least 3 nm) to accommodate for spectral distortion [5,17] whilst maximizing the number of FBGs in the fuel assembly.
To validate the mounting procedure, we inspected several properties of the 84 reflection spectra of the FBGs at different phases of the mounting procedure. We recorded the spectra with a laser swept interrogation system with a spectral resolution of 8 pm, and we evaluated 3 main properties. First, we determined how many of the 84 FBGs could still be interrogated in a dependable manner after mounting. Second, we compared the Bragg wavelengths λB with those determined when the fibres were unmounted and thus not strained. Third, we determined two characteristics of each reflection spectrum to indicate the level of distortion of the spectrum. These two characteristics were the full width at half maximum (FWHM) and the so-called unbalance (UNB) defined as
F W H M =   λ +   λ
U N B = | ( λ + λ B ) ( λ B λ ) |
where λ+ and λ are the wavelengths for which the peak power is halved. Thus, the FWHM provides information about the width of the reflection peak, whilst the UNB measures the asymmetry. Note that we did not evaluate the reflectivity of the FBGs with each mounting step as this can vary significantly due to, for example, output power variations of the light source or dust on the fibre connector. The experimental results of the validation are summarized in Table 1. No FBGs were lost during the mounting on the fuel pin and installing in the test section and test facility, even when filling with LBE at elevated temperatures. We observed that the mean wavelength shifts after mounting on the fuel pin corresponded to a small compression of the FBG due to the shrinkage during curing of the adhesive. Moreover, the mean wavelength shift after installation in the heated test facility was on the order of 4.7 nm which is close to 0.4% strain, which confirms the need to allow for sufficient wavelength separation between the successive DTGs. Note that the spread of the wavelength shift is about 4 times the average value after mounting, which was the result of the wire spacer wrapped around the fuel pin exerting forces on the fuel pin that are non-homogeneous throughout the pin’s length. The high density of FBGs and the 4 fibres on the same fuel pin even allowed for the determination of the pitch of the wire spacer (equal to 265 mm) based on the variation of the Bragg wavelength shifts. The same is true for the spread of the wavelength shifts as determined after installation in the heated and filled test facility, which also illustrates the need for sufficient wavelength spacing between the FBGs. Finally, we observed that the FWHM and the UNB were only slightly increased by the mounting and installation. These results indicate the validity of the mounting procedure in the fuel pin and the installation in the test facility.

2.4. Egress of Optical Fibres and Interrogation

The Bragg gratings are measured in reflection and therefore the optical fibres require only a single end-connection to the data acquisition equipment (consisting of a light source and a detector) located out of the test facility. To that end, we guided the fibres from the fuel pin through small 1 mm outer diameter stainless steel tubes, which were then loosely inserted into 4 mm outer diameter tubes, which served as feedthrough to the loop exterior. So as not to affect (or as little as possible) the movement of the fuel pins because of instrumentation, we designed the set-up such that the clearance of this insertion is nearly double the allowed fuel pin movement from the fixation at the rails. We represented this alignment set-up in Figure 5. The 4 mm diameter tubes are then guided through a series of grids to maintain their relative position and continue up to the outside of the LBE loop at the top flange where a welded Swagelok connection keeps the tubes in place and seals the feedthrough. To simplify the installation of the grids and flanges, each tube had a different length. Above the top flange, we sealed the egress of the optical fibres out of the steel tubes with a UV-curable glue (NOA61), which exhibits excellent adhesion properties to steel and silica. We tested this sealing method, for 1 mm inner diameters and 4 mm outer diameter, up to 10 bar of overpressure and in a vacuum. We observed that even during a rapid increase from room temperature up to 650 °C at more than 5 °C/min, no measurable leakage was detected using a commercial He-gas based leak tester. During the commissioning of the test facility with the instrumented fuel assembly installed, we also pressure tested the set-up while heated up to 4 bar, which is well above the expected operational pressure.
We acquired the spectra of the FBGs using a commercially available FBG-Scan 808D [28], which is a high-speed FBG sensor interrogation unit. The interrogation of the FBG in this device is based on a spectrometer and involves a diffraction grating and light sensor array. Since no moving components or tuning of optical parameters such as the light source wavelength are required, very stable measurements can be conducted with this device. The latter was required for the vibration measurements since the expected wavelength fluctuation was small (as illustrated in [20,29]) and signal degradation due to the environment is expected to occur (as explained in more detail in [5,17]). As explained earlier, we accommodated for this degradation in the interrogation by using a more intricate phase-correlation based wavelength shift detection technique to analyse the acquired FBG spectra, and to calculate λB [25,26,27]. This approach allowed for achieving the best trade-off between signal-to-noise ratio and calculation speed even if the FBG spectra become distorted. Owing to the use of the phase-correlation based approach and to the temperature controlled environment (explained in Section 2.1), we were able to record Bragg wavelength shifts as small as 0.25 pm, corresponding to a local strain level difference of about 0.2 με. We recorded the reflection spectra of the FBGs with an acquisition rate of up to 5 kHz which is well beyond the highest expected observable frequency of vibration [29]. To the best of our knowledge, no other (quasi)-distributed measurement technique can attain these sampling speeds.

3. Assessment of Flow-Induced Vibration of Fuel Assembly

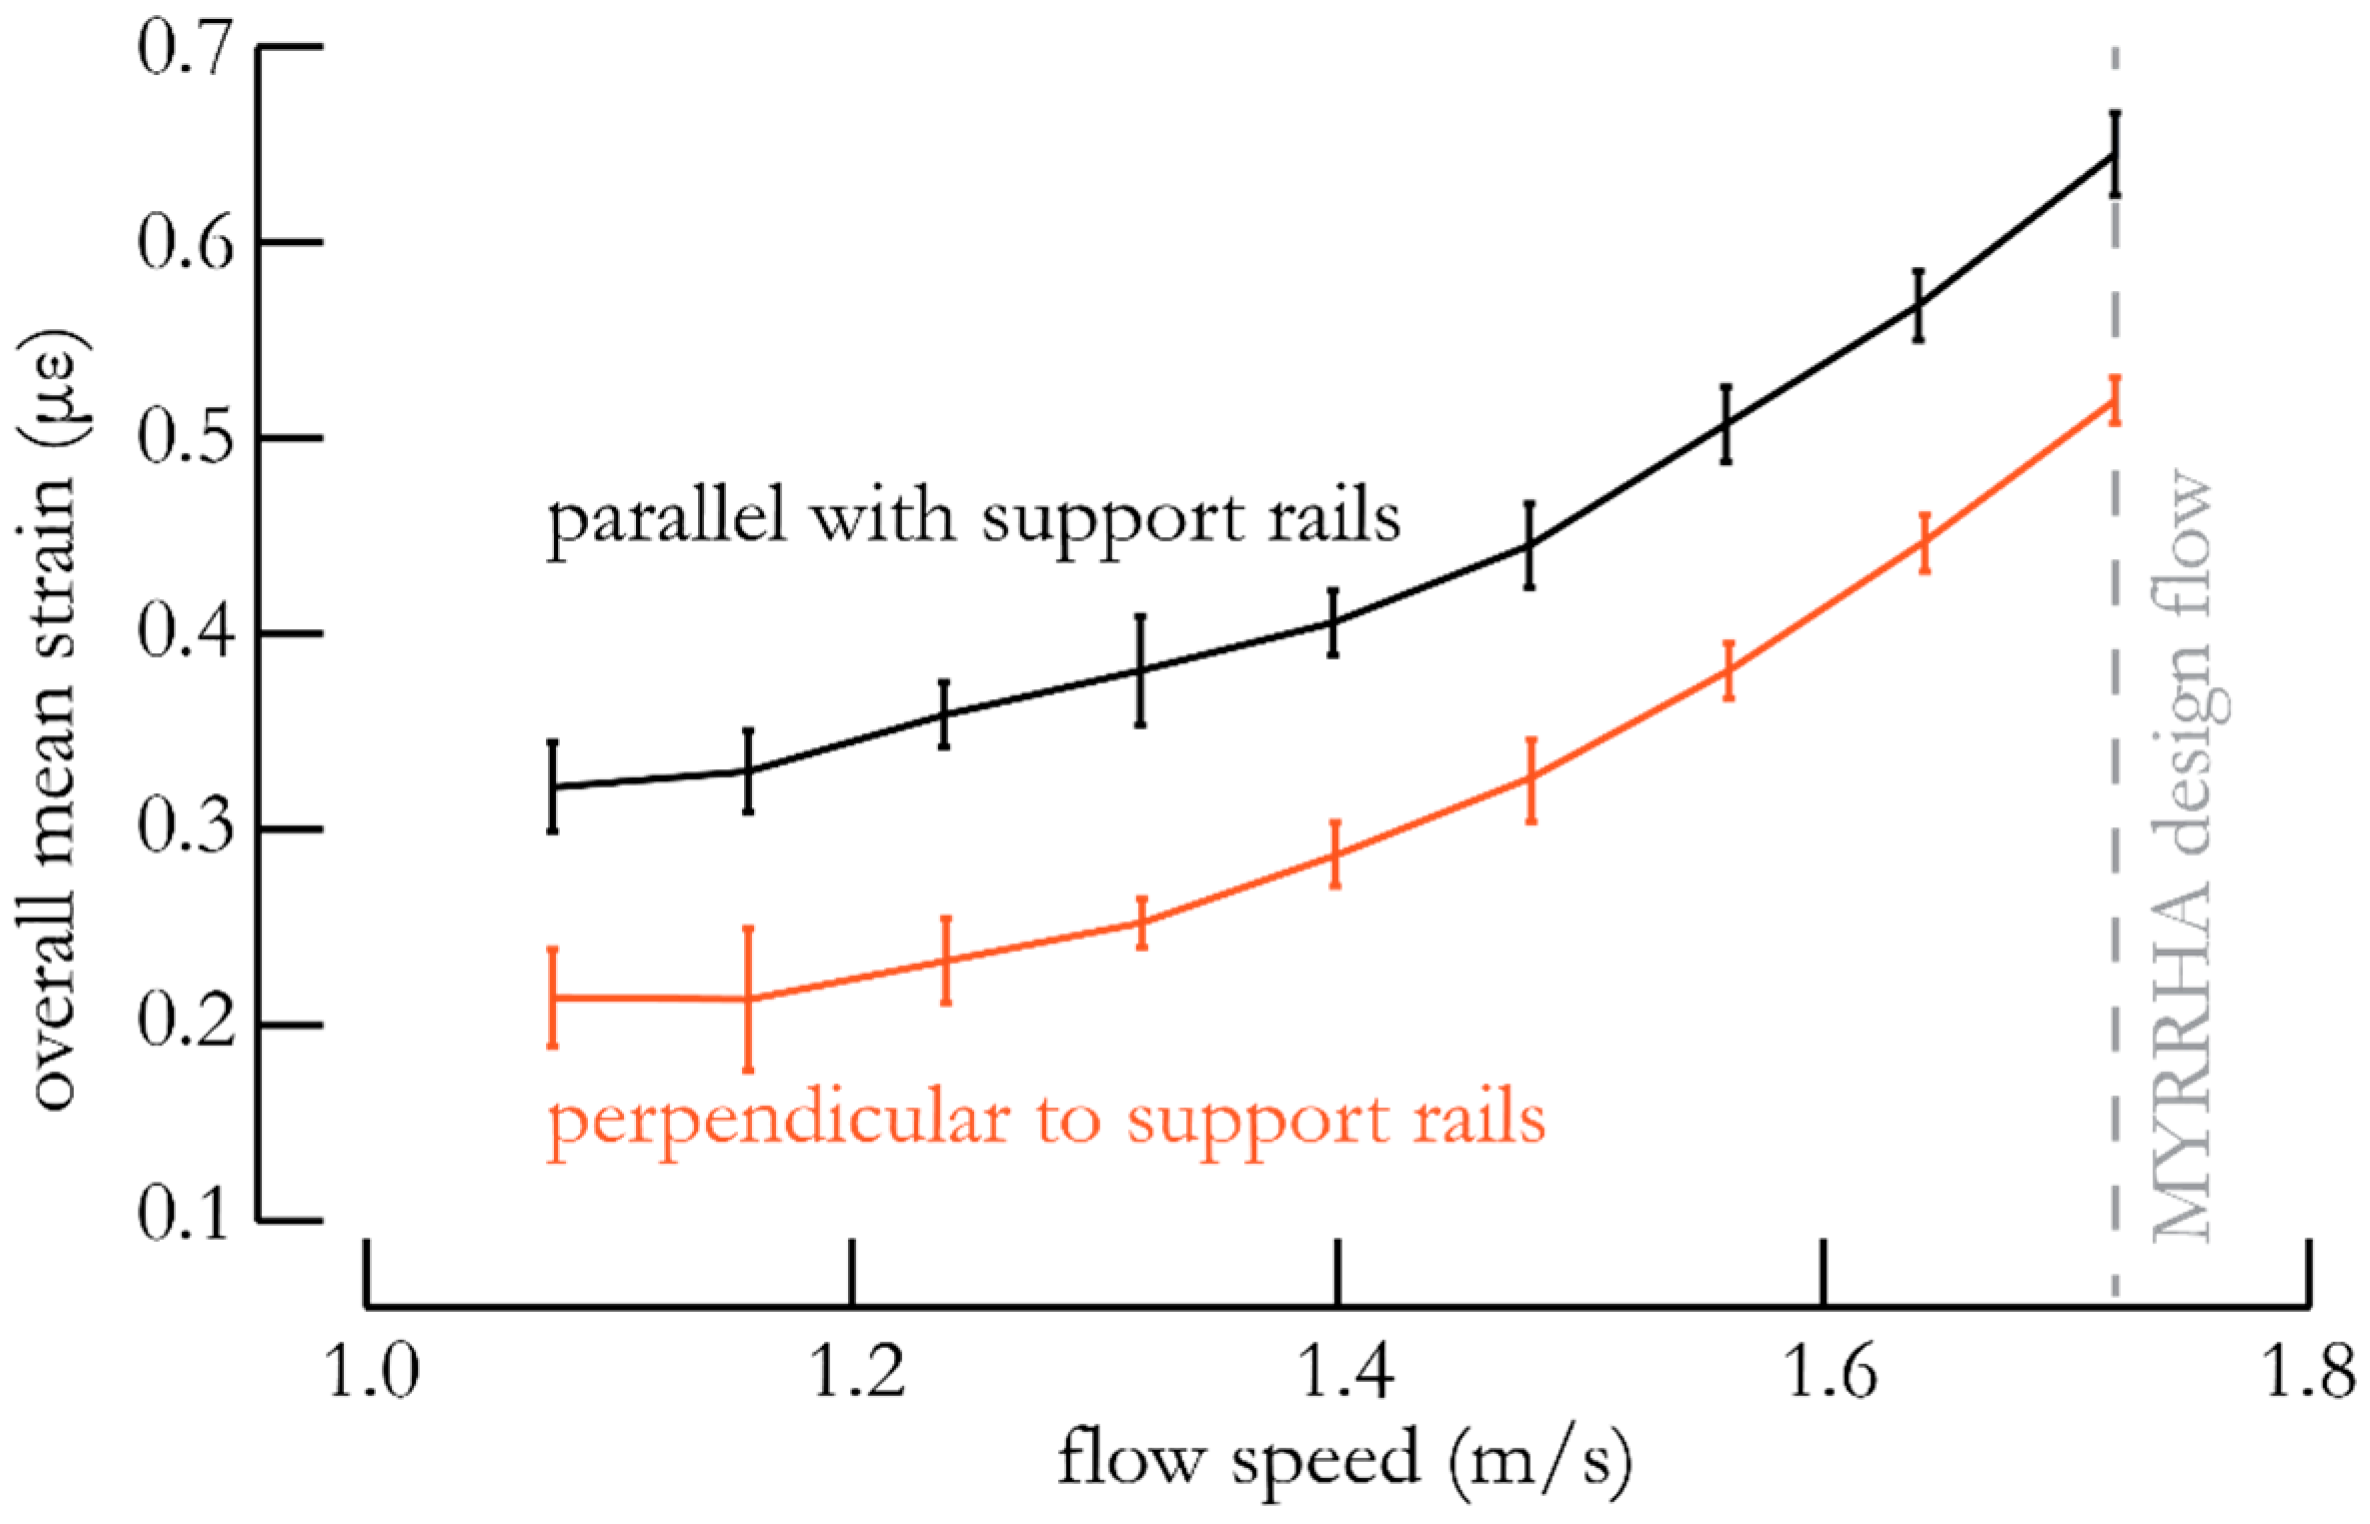
3.1. Vibration Amplitude of the Fuel Assembly During Various Flow Conditions

The foremost important quantity required to assess potential safety hazards related to the fuel assembly vibration is the vibration amplitude [30,31]. During the operation of a nuclear reactor, many different operational conditions can occur in the coolant flow of a fuel assembly corresponding to different coolant flow velocities. These operational conditions should be investigated when studying the flow-induced vibration as the vibration amplitude in every condition can differ significantly. It is important to note that all references to vibration amplitude in this paper imply amplitudes of strain, rather than displacement since we measured the dynamic strain using the FBGs on the surface of the fuel pin in varying LBE flow rates. In addition, we have not elaborated on the frequencies associated with the vibration as the complex interaction of the densely packed fuel pins in the assembly will yield a set of overlapping frequency bands as illustrated in [11,29]. The detailed analysis of this phenomenon is beyond the scope of the results reported in this paper. All experiments were performed at a constant LBE temperature of approximately 200 °C, as determined with thermocouples placed on the test section exterior wall. The measurement procedure was as follows. We increased the flow velocity in the test section in discrete steps from 1.08 m/s, up to the nominal flow velocity of 1.72 m/s (average flow velocity in the fuel assembly). For each flow condition, we allowed for the air-cooler to adapt to the new situation and to stabilize around a new steady-state. This also ensured that the flow was fully developed in the entire test facility. At each flow velocity, we determined the averaged vibration amplitude for all FBGs on the instrumented central fuel pin in the fuel assembly. We summarize the outcome of this sequence in Figure 6, which illustrates the average strain values with standard deviations as measured with all the FBGs, as a function of the average LBE flow velocity in the fuel assembly bundle. In addition, we observed a clear distinction between the vibration amplitudes corresponding to the directions parallel with and perpendicular to the support rails. The amplitudes were obtained by processing the measurements with a high-pass filter to obtain the rms value of the strain component. This high-pass filtering was essentially done to detrend the data. When increasing the flow velocity, we observed a corresponding increase in the vibration amplitude. It is important to note that during the experimental phase, the temperature fluctuations were also monitored with thermocouples, and were smaller than 0.2 °C across the test section. For LBE coolant flow velocities as anticipated in MYRRHA (equal to 1.72 m/s), we observed an average vibration amplitude just below 0.7 με for the direction parallel with the support rails, and just over 0.5 με for the direction perpendicular to the support rails. At the lowest tested flow velocity of 1.1 m/s, we measured vibration amplitudes close to 0.3 με and 0.2 με, respectively, i.e., close to the limits of what we could detect. An important remark here is that the mean strain measured by a single FBG at a certain location can be up to twice the above mentioned overall mean strain values. This is further discussed in the subsequent Section 3.2. In any case, it is clear from these results that the vibration amplitudes (in terms of strain) of the fuel pins in a realistic mock-up of the MYRRHA fuel assembly are very small and will not be associated with vibration induced damage, as this would typically require amplitudes of at least 2 orders of magnitude more. Despite the challenging environment and small vibration levels, we were still able to record the Bragg wavelength shifts owing to our integration and interrogation scheme (explained in Section 2).

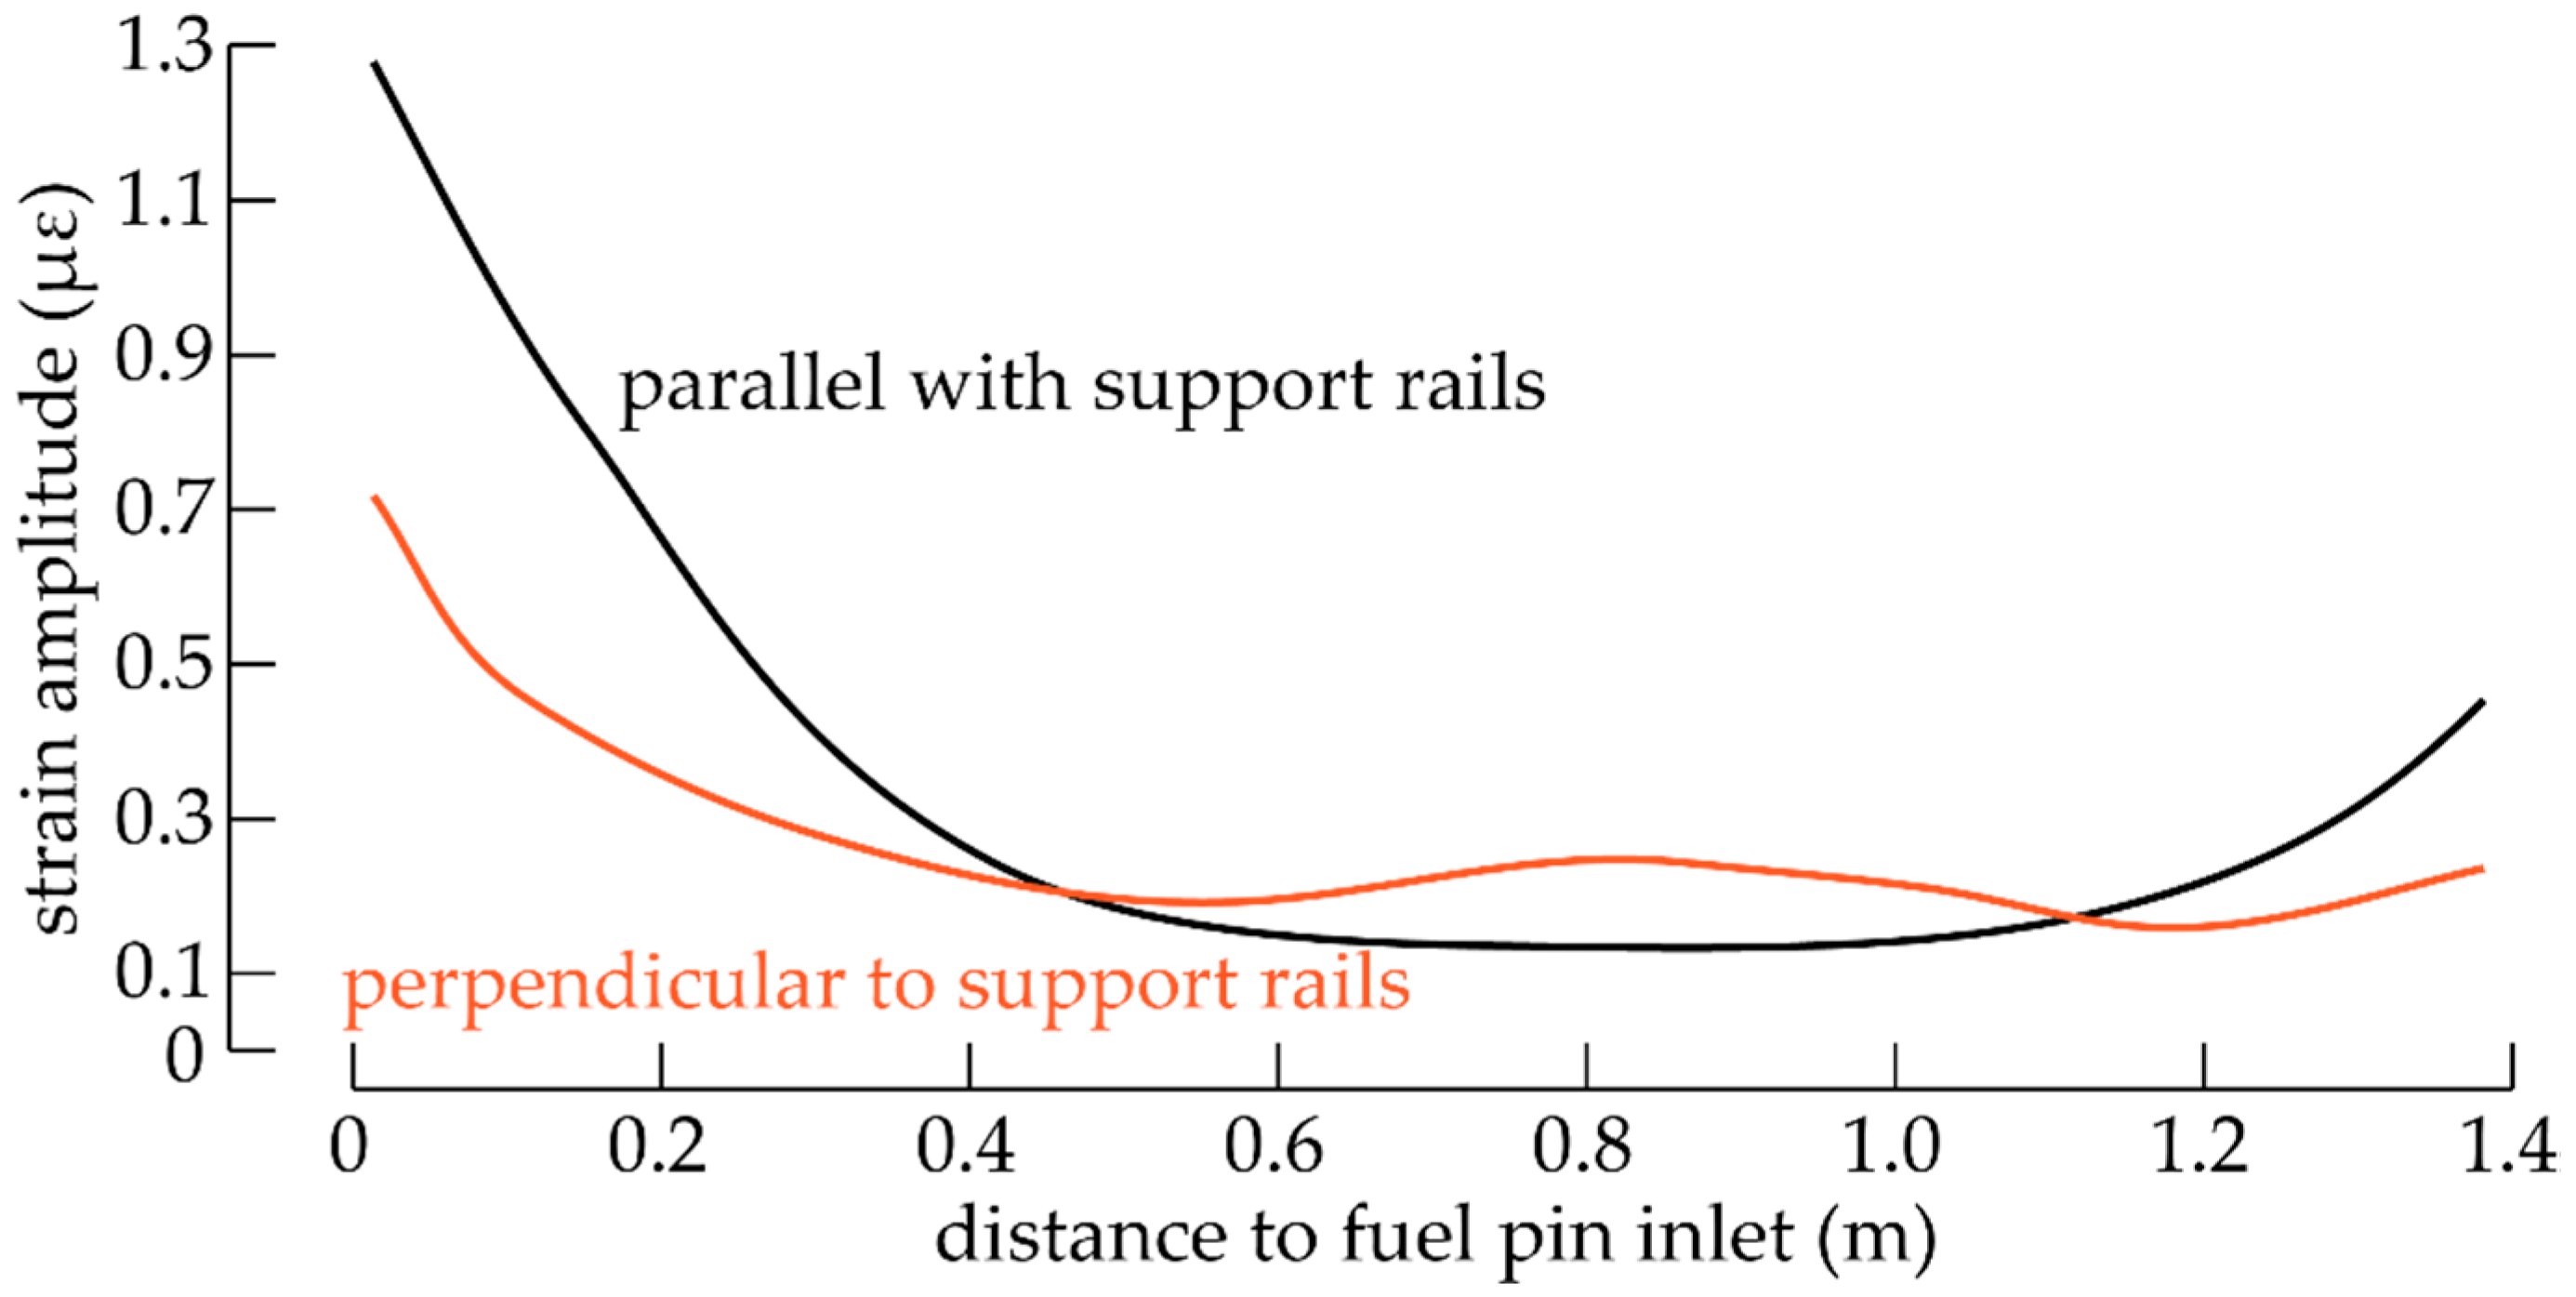
3.2. Strain Along Fuel Pin Length and Vibration Statistics

Next, we assessed the strain along the fuel pin length and evaluated the vibration statistics. In Figure 7, we show the trend of the strain amplitude along the central fuel pin. Recall that near the inlet, the fuel pin is supported, whilst the other extremity is free to move. Therefore, we observed the highest strain amplitude near the inlet and a decreasing trend in the amplitude towards the outlet. In the figure, we again show the rms strain amplitude determined with the 21 FBGs on the central fuel pin in the direction perpendicular to the support rails, as well as parallel with the support rails. We found that the trend of the vibration amplitude along the fuel pin in the direction parallel to the support rails essentially resembles the second bending mode of a classical cantilevered beam whilst in the perpendicular direction the trend follows the third bending mode of such a cantilevered beam. The slightly different trend of the two directions of motion can be the result of the different support conditions of the fuel pin at the fuel assembly inlet. A modal analysis could confirm if these trends indeed correspond to the respective bending modes. These trends are not significantly influenced by the flow velocity, except for the amplitude as illustrated in the previous section. In order to estimate the displacements associated with the measured strains we approximated the fuel pins as cantilevered beams, and applied discretized classical beam theory to formulate strain-data-dependent displacement equations of the fuel pins (according to the study described in [32]). From these equations, and taking only bending moments into account, we estimated the mean displacement to be 33.8 μm in the direction parallel with the support rails, and 20.9 μm in the perpendicular direction. These values are in line with those previously determined in [29].
Mean values of the vibration amplitudes are useful but they do not describe the entire vibration signal. Moreover, absolute values of the vibration amplitude at a certain time are not meaningful since the fuel pin excitation is due to forces from turbulent flow, which is a random phenomenon. Given this random nature of the turbulent forces and the central limit theorem, we expect the average dynamic strain of the fuel pin to adhere to a normal or Gaussian distribution. To evaluate the entire vibration, we have to determine the distribution and nature of the vibration. In Figure 8, we show a histogram of the average measured strains on the fuel pins in the direction parallel with the support rails (i.e., averaged over 40 FBGs), and at nominal MYRRHA flow speed (i.e., 1.72 m/s). It is clear from the distribution that excursions exceeding on average 2 με very rarely occur. More specifically, 99.9% of the measured average strains are below 2 με. The spread or standard deviation of the distribution corresponds to what we determined for the mean strain amplitude in Figure 6. A very similar histogram can be constructed for the direction perpendicular to the support rails. Finally, to evaluate the Gaussian nature of the distribution, we determined the kurtosis, or the so-called fourth central moment, which should be equal to 3 for a Gaussian distribution. We calculated that the kurtosis of the histogram in Figure 8 equals 3.03, thus illustrating the Gaussian nature of the distribution. These results provide information on the location of the highest strain on the fuel pin, as well as on the frequency of excursions with a higher amplitude.

4. Summary and Conclusions

In this paper we presented the experimental investigation of the flow-induced vibrations in a realistic mock-up of the fuel assembly of MYRRHA. The mechanical integrity of the fuel assembly may be impacted as a result of, for example, fretting wear or mechanical fatigue. We conducted the experimental analysis on a full-scale mock-up fuel assembly in a closed-loop LBE experimental test facility at a temperature of 200 °C, and at LBE flow rates that are representative for MYRRHA. The analysis relies on quasi-distributed vibration measurements that were conducted on the central fuel pin in the fuel assembly using densely multiplexed FBGs that were surface mounted in a groove in the fuel pin cladding. We have designed and built an adequate test facility to mimic the environment in MYRRHA, and developed a mounting method that allowed integrating the FBGs strain sensors in the fuel assembly with minimal intrusiveness. We validated the latter by inspecting the reflection spectra of the 84 integrated FBGs during different stages of installation and showed that nearly all of the sensors retained excellent spectral characteristics, even when installed in the heated and filled test facility.
The instrumented fuel assembly allowed for characterizing the vibration of the fuel assembly with a sufficiently high precision. In particular, the precise measurements allowed us to reliably estimate the vibration amplitudes of the fuel assembly. In addition, we studied the fluctuation of the vibrations with flow speed. We observed that the measured vibration amplitudes are very small owing to the proper design of the fuel pins and test facility. For LBE coolant flow velocities, as anticipated in MYRRHA (equal to 1.72 m/s), we observed an average vibration amplitude just below 0.7 με for the direction parallel with the support rails and just over 0.5 με for the direction perpendicular to the support rails. Note that owing to the non-irradiated experimental fuel assembly described in this paper, spatial tolerances are expected to be at their largest. Irradiation induced swelling of the fuel pins would lead to closing gaps and thereby possibly reducing the flow-induced vibration.
In addition, we could assess the strain along the length of the fuel pin using the mounted quasi-distributed FBG sensors. We found that the trend of the vibration amplitude along the fuel pin slightly differs depending on the direction of movement. The trend essentially resembles the second bending mode of a classical cantilevered beam along the support rails, whilst in the perpendicular direction, the trend follows the third bending mode. We believe that the difference can be attributed to the different fuel pin support conditions in both directions. We also provided a more complete description of the vibration by evaluating the distribution of the measured strains, which should adhere to a Gaussian distribution given the nature of the excitation forces. We found that the average strain excursions exceeding 2 με occur less than 0.1% of the time and that the kurtosis of the distribution was nearly equal to 3, illustrating the Gaussian nature of the vibration.
To close, owing to the unique properties of FBG based sensors, we were able to obtain fuel pin vibration characteristics that are important to assess structural degradation resulting from fretting wear or mechanical fatigue, and that provide important feedback to the designers of the MYRRHA fuel assembly. The quasi-distributed optical fibre based sensor measurements allowed confirming that the vibration amplitudes (in terms of strain) of the fuel pins in a realistic mock-up of the MYRRHA fuel assembly are very small and should not lead to vibration-induced damage. In addition, we were able to locate the position on the fuel pin where the highest strain occurs, and determine the unlikelihood of large amplitude vibration excursions.

Acknowledgments

This work was partially supported by the Research and Innovation Action MYRTE—MYRRHA Research and Transmutation Endeavour, co-funded by the European Union H2020 program under grant agreement No 662186. VUB B-PHOT acknowledges the Marie Sklodowska Curie Action—Innovative Training Network FINESSE, funded by the European Union H2020 program under grant agreement No 722509, as well as VUB’s Methusalem Programme and the Hercules Foundation Flanders. Thomas Geernaert is post-doctoral fellow of the FWO—Research Foundation-Flanders.

Author Contributions

All authors helped in conceiving the experiments. Ben De Pauw and Kennedy Graham designed and performed the experiments. At the same time Ben De Pauw and Kennedy Graham wrote the main part of the paper. Katrien Van Tichelen, Thomas Geernaert, Hugo Thienpont and Francis Berghmans contributed in interpreting the results, revising and writing of the paper.

Conflicts of Interest

The authors declare no conflict of interest.

References

  1. Doebling, S.W.; Farrar, C.R.; Prime, M.B. A summary review of vibration-based damage identification methods. Shock Vib. Dig 1998, 30, 91–105. [Google Scholar] [CrossRef]
  2. Deodatis, G.; Ellingwood, B.; Frangopol, D. Safety, Reliability, Risk and Life-Cycle Performance of Structures and Infrastructures, 1st ed.; CRC Press: Boca Raton, FL, USA, 2013. [Google Scholar]
  3. Juergens, J.; Adamovsky, G.; Morscher, G.; Park, B.; Floyd, B.; Corporation, A.; Park, F. Thermal Evaluation of Fiber Bragg Gratings at Extreme Temperatures. In Proceedings of the 43rd AIAA Aerospace Sciences Meeting and Exhibit, Reno, NV, USA, 10–13 January 2005. [Google Scholar]
  4. Mihailov, S.J. Fiber Bragg grating sensors for harsh environments. Sensors 2012, 12, 1898–1918. [Google Scholar] [CrossRef] [PubMed]
  5. De Pauw, B.; Lamberti, A.; Rezayat, A.; Ertveldt, J.; Vanlanduit, S.; Van Tichelen, K.; Geernaert, T.; Berghmans, F. Signal-to-noise ratio evaluation of fibre Bragg gratings for dynamic strain sensing at elevated temperatures in a liquid metal environment. J. Light. Technol. 2015, 33, 1–8. [Google Scholar] [CrossRef]
  6. Cusano, A.; Cutolo, A.; Albert, J. Fiber Bragg Grating Sensors: Recent Advancements, Industrial Applications and Market Exploitation; Bentham Science Publishers: Sharjah, UAE, 2011. [Google Scholar]
  7. Aït Abderrahim, H.; Baeten, P.; De Bruyn, D.; Fernandez, R. MYRRHA—A multi-purpose fast spectrum research reactor. Energy Convers. Manag. 2012, 63, 4–10. [Google Scholar] [CrossRef]
  8. De Bruyn, D.; Aït Abderrahim, H.; Baeten, P.; Fernandez, R. MYRRHA, the Multi-purpose Hybrid Research Reactor for High-Tech Applications. In Proceedings of the ICAPP 2011 “Performance & Flexibility: The Power of Innovation”, Paris, France, 2–5 May 2011; pp. 472–478. [Google Scholar]
  9. Blevins, R.D. Flow-induced vibration in nuclear reactors: A review. Prog. Nucl. Energy 1979, 4, 25–49. [Google Scholar] [CrossRef]
  10. Kaneko, S.; Nakamura, T.; Inada, F.; Industry, E.P.; Kato, M. FIV Classifications and Lessons from Practical Experences; Academic Press: Cambridge, MA, USA, 2014. [Google Scholar]
  11. Paidoussis, M.P. Fluid-Structure Interactions—Slender Structures and Axial Flow, 2nd ed.; Elsevier Academic Press: Montreal, QC, Canada, 2004. [Google Scholar]
  12. Prakash, V.; Thirumalai, M.; Prabhakar, R.; Vaidyanathan, G. Assessment of flow induced vibration in a sodium–Sodium heat exchanger. Nucl. Eng. Des. 2009, 239, 169–179. [Google Scholar] [CrossRef]
  13. Pettigrew, M.J. The behaviour of weldable strain gauges under nuclear reactor core conditions. Nucl. Eng. Des. 2013, 263, 350–361. [Google Scholar] [CrossRef]
  14. Bhattacharya, A.; Yu, S.D. An experimental investigation of effects of angular misalignment on flow-induced vibration of simulated CANDU fuel bundles. Nucl. Eng. Des. 2012, 250, 294–307. [Google Scholar] [CrossRef]
  15. Wu, L.; Lu, D.; Liu, Y. Experimental Investigation on Flow-Induced Vibration of Fuel Rods in Supercritical Water Loop. Sci. Technol. Nucl. Install. 2014, 1, 9. [Google Scholar] [CrossRef]
  16. OECD/NEA association. Handbook on Lead-Bismuth Eutectic Alloy and Lead Properties, Materials Compatibility, Thermal-Hydraulics and Technologies; OECD Publishing: Paris, France, 2007. [Google Scholar]
  17. De Pauw, B.; Lamberti, A.; Vanlanduit, S.; Van Tichelen, K.; Geernaert, T.; Berghmans, F. Signal-to-noise ratio evaluation with draw tower fibre Bragg gratings (DTGs) for dynamic strain sensing at elevated temperatures and corrosive environment. In Proceedings of the 23rd International Conference on Optical Fibre Sensors, Santander, Spain, 2–6 June 2014; pp. 18–21. [Google Scholar]
  18. Van Tichelen, K.; Greco, M.; Kennedy, G.; Mirelli, F. COMPLOT and E-SCAPE: Facilities for Liquid-Metal, Pool-Type Thermal Hydraulic Investigations and their Associated R & D Program in the Frame of the MYRRHA Project. Preceedings of the 10th International Topical Meeting on Nuclear Thermal Hydraulics, Operation and Safety (NUTHOS-10), Tokyo, Japan, 14–18 December 2014; pp. 1–13. [Google Scholar]
  19. Kennedy, G.; Van Tichelen, K.; Greco, M. Experimental investigation of the pressure loss characteristics of the full-scale MYRRHA fuel bundle in the COMPLOT LBE facility. In Proceedings of the 16th International Meeting on Nuclear Reactor Thermal-Hydraulics (NURETH-16), Chicago, IL, USA, 30 August–5 September 2015; pp. 61–73. [Google Scholar]
  20. De Pauw, B.; Vanlanduit, S.; Van Tichelen, K.; Geernaert, T.; Chah, K.; Berghmans, F. Benchmarking of deformation and vibration measurement techniques for nuclear fuel pins. Measurement 2013, 46, 3647–3653. [Google Scholar] [CrossRef]
  21. Othonos, A.; Kalli, K. Fiber Bragg Gratings: Fundamentals and Application in Telecommunications and Sensing; Artech House: London, UK, 1999. [Google Scholar]
  22. Kashyap, R. Fibre Bragg Gratings; Academic Press: San Diego, CA, USA, 1999. [Google Scholar]
  23. FBGS International. Available online: http://www.fbgs.com/technology/dtg-technology/ (accessed on 23 June 2017).
  24. Johnson, D. Draw-tower process creates high-quality FBG arrays. Laser Focus World 2012, 10, 53–56. [Google Scholar]
  25. Lamberti, A.; Vanlanduit, S.; De Pauw, B.; Berghmans, F. A novel fast phase correlation algorithm for peak wavelength detection of fiber Bragg grating sensors. Opt. Express 2014, 22, 7099–7112. [Google Scholar] [CrossRef] [PubMed]
  26. Lamberti, A.; Vanlanduit, S.; De Pauw, B.; Berghmans, F. Peak detection in fiber Bragg grating using a fast phase correlation algorithm. Proc. SPIE 2014, 9141, 91410Y. [Google Scholar]
  27. Lamberti, A.; Vanlanduit, S.; De Pauw, B.; Berghmans, F. Influence of Fiber Bragg Grating Spectrum Degradation on the Performance of Sensor Interrogation Algorithms. Sensors 2014, 14, 24258–24277. [Google Scholar] [CrossRef] [PubMed]
  28. FBGS International. Available online: http://www.fbgs.com/products/measurement-devices/overview/ (accessed on 23 June 2017).
  29. De Pauw, B.; Lamberti, A.; Ertveldt, J.; Rezayat, A.; Van Tichelen, K.; Vanlanduit, S.; Berghmans, F. Vibration monitoring using fibre optic sensors in a lead-bismuth eutectic cooled nuclear fuel assembly. Sensors 2016, 16, 571. [Google Scholar] [CrossRef] [PubMed]
  30. Miner, M.A. Cumulative damage in fatigue. J. Appl. Mech. 1945, 12, 159–164. [Google Scholar]
  31. Mohany, A.; Hassan, M. Modelling of fuel bundle vibration and the associated fretting wear in a CANDU fuel channel. Nucl. Eng. Des. 2013, 264, 214–222. [Google Scholar] [CrossRef]
  32. Ko, W.L.; Richards, W.L.; Van Tran, T. Displacement Theories for In-Flight Deformed Shape Predictions of Aerospace Structures; NASA/TP: Edwards, CA, USA, 2007.
Figure 1. Concept drawing of MYRRHA with a replica of the fuel assembly (inset).
Applsci 07 00864 g001
Figure 2. (Left) Isometric view of the experimental test facility in which the flow induced vibrations of a full-scale lead-bismuth eutectic (LBE) cooled fuel assembly were tested. (Right) A photograph of part of the facility above ground-level.
Applsci 07 00864 g002
Figure 3. Concept drawing and photograph of the fuel assembly inlet.
Applsci 07 00864 g003
Figure 4. (Left) Scheme of an optical fibre with draw tower gratings (DTGs) embedded in a small groove on the surface of the pin. (Right) The location of the instrumented fuel pin with 4 fibres (represented by the red dots) containing in total 84 FBGs.
Applsci 07 00864 g004
Figure 5. Illustration of the alignment set-up designed to avoid affecting the vibration due to the egress of the optical fibre and its guide capillary. Note that for sake of readability, the figure is not to scale.
Applsci 07 00864 g005
Figure 6. The measured vibration amplitude (with standard deviations) of the fuel assembly (averaged over all fuel pins) for the different evaluated flow velocities.
Applsci 07 00864 g006
Figure 7. The trend of the rms vibration amplitude (in terms of strain) measured with the different FBGs located on the central fuel pin in the two perpendicular directions with respect to the support rails.
Applsci 07 00864 g007
Figure 8. The histogram of the vibration (in terms of strain) gives a more complete view of the fuel pin vibration. Average strain amplitude exceeding 2 με rarely occurs at MYRRHA nominal flow speeds.
Applsci 07 00864 g008
Table 1. Validation of the mounting procedure at 3 different phases.
StatusUnmounted FBGs (At Room Temperature)Mounted on Fuel Pin (At Room Temperature)Installed in Heated Test Section Filled With LBE
representative spectrum Applsci 07 00864 i001
FBGs observed848484
mean ΔλB0 ± 0 nm−0.124 nm ± 0.439 nm4.686 nm ± 0.877 nm
FWHM0.133 nm ± 0.022 nm0.144 nm ± 0.020 nm0.173 nm ± 0.053 nm
UNB0.011 nm ± 0.009 nm0.003 nm ± 0.006 nm0.010 nm ± 0.045 nm

