Article

Pore Solution pH for the Corrosion Initiation of Rebars Embedded in Concrete under a Long-Term Natural Carbonation Reaction

College of Civil Engineering, Xi’an University of Architecture & Technology, 13 Yanta Road, Xi’an 710055, China
*
Author to whom correspondence should be addressed.
Submission received: 16 December 2017 / Revised: 12 January 2018 / Accepted: 15 January 2018 / Published: 17 January 2018
(This article belongs to the Section Materials Science and Engineering)

Abstract

:

Featured Application

The work presented in this paper is suitable for application to the evaluation of existing reinforced concrete structures in buildings, brides, and tunnels.

Abstract

This paper presents an in-situ inspection and experimental investigation on the pore solution pH of concrete cover for the corrosion initiation of rebars under a long-term natural carbonation reaction. A 77-year-old steel mill was inspected, and 35 concrete column cover samples were collected to test the pH of the pore solution and phase compositions layer by layer. The variation in pH and phase compositions of the concrete along the cover depth was studied. The in-situ inspection results indicate that the rebar embedded in concrete had begun to corrode when the carbonation depth was almost less than one-third of the cover depth. The corrosion initiation of rebars embedded in concrete can occur when the pH is between 11.3 and 12.1. The pore solution pH test results and X-ray diffraction (XRD) analysis indicated that there is a semi-carbonated zone between the fully carbonated zone and the rebar. The pH of a fully carbonated zone is in a range of 8.0–9.5, and the pH of a semi-carbonated zone is between 9.5 and 12.1.

1. Introduction

Corrosion induced by carbonation is the primary reason for the deterioration of concrete structures exposure to an atmospheric environment [1,2,3,4,5] and non-optimum environments [6,7,8]. The pH of Portland cement concrete is usually in the range of 12.5 to 13.8 [9,10,11,12,13,14]. Under this high alkalinity environment, the rebar surface can form a passive film that prevents the rebar from corroding. The pH of concrete decreases due to the carbonation reaction; furthermore, this process can accelerate the destabilization of the passive film on the rebar [15]. Once pH decreases to around 9.0–9.5, the rebar will begin to corrode due to the passive film breakdown [16,17,18,19,20,21]. Therefore, pH is a major concern for the corrosion initiation of rebars embedded in concrete.
It is very important to measure the pH of concrete, and several methods have been developed for measuring pH values of concrete, such as the in-situ leaching method [22,23], the ex-situ leaching method [24,25], the halochromic sensor method [26,27], and the expression method [28,29]. There is general agreement that the expression method is the most reliable test procedure available for acquiring the pH of concrete.
Much work has focused on the prediction model of the corrosion initiation period of rebars under atmospheric environments. A corrosion initiation period model has been proposed, in which a carbonation front penetrates the depth of concrete cover the corrosion of rebars initiated [30,31]. The traditional carbonation-induced corrosion mechanism employs the carbonation depth to indirectly reflect the corrosion status of rebars. Carbonation depth is usually measured with a phenolphthalein indicator, which is a fast and convenient method [2]. However, the indicator only indicates a pH range of 8.0–9.8 [17]. Thus, it provides limited information regarding the actual carbonation status of concrete. Moreover, it cannot explain how the rebar becomes corroded when the carbonation front has not reached the surface of the rebar [30]. Therefore, it is urgent to study the relationship between the pore solution pH of concrete and the corrosion status of rebars embedded in concrete.
To study the effect of pore solution pH on rebar corrosion initiated by carbonation, several methods are frequently employed, such as a simulated concrete pore solution, an accelerated carbonation test, and natural carbonation. A simulated concrete pore solution is frequently used to study the corrosion initiation of rebars for a short experimental period in spite of its limitations [32,33,34]. Carbonation tests show that the pH of uncarbonated concrete is in the range of 12.5 and 13.8 [13,35,36,37]. However, the pore solution pH under accelerated carbonation is significantly lower than that at natural CO2 concentrations, leading to underestimations of the service life of structures [37,38]. There is a small amount of data that is available under accelerated exposure conditions in controlled environments [9,39,40,41]. The pore solution pH of cover concrete is one of the most important parameters that can be used in the service life prediction of structures; however, only a few actual concrete pore solution pH tests have been conducted on reinforced concrete structures exposed to long-term natural environmental conditions.
This paper presents an in-situ inspection and experimental investigation on the pore solution pH of cover concrete for corrosion initiation of rebars embedded in concrete under a long-term carbonation reaction. An old steel mill was inspected, and concrete cover samples were collected to test the pH of the concrete pore solution and phase compositions layer by layer. Pore solution was extracted from discrete depths of the in-situ concrete cover samples by cutting the specimens into slices. Concrete strength was determined with drilled cylinder specimens, which was drilled out from the same location of samples. The XRD analysis was used to determine the mineral composition of concrete cover samples layer by layer. The critical pH for corrosion initiation of rebars embedded in concrete is reported, and the pH boundary of a semi-carbonated zone is determined.

2. Experimental Section

2.1. In-Situ Inspection

To establish a more reasonable rebar corrosion initiation condition, the carbonation process of concrete and the corrosion status of rebars in existing structures should be known. In addition, the variation in pH values and phase compositions of different cover concrete depths must be determined.
An in-situ durability inspection was conducted on the former Chongqing Steel Mill in Chongqing, China. The mill is a reinforced concrete frame structure, and its total area is about 34,723 m2. A random sampling inspection was carried out on the reinforced concrete columns in Plant A for 30 years of service (the isothermal furnace workshop), Plant B for 52 years of service (finishing workshop), and Plant C for 77 years of service (steel rolling workshop).
The reinforced concrete columns were inspected according to the requirements of the Chinese standard for durability assessment of concrete structures (CECS 220-2007). The inspection of reinforced concrete columns included the following steps:
  • Visual inspection: The appearance of each column was inspected, and the maximum width of cracked concrete cover was measured.
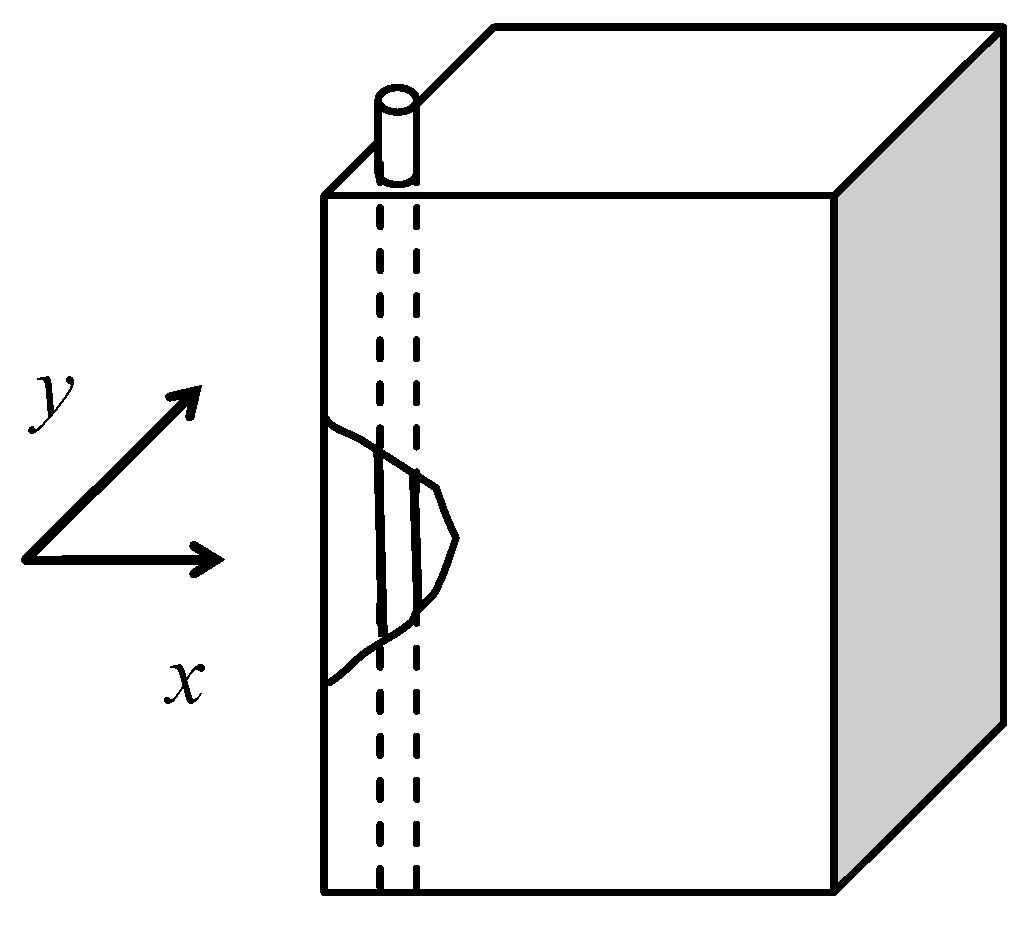
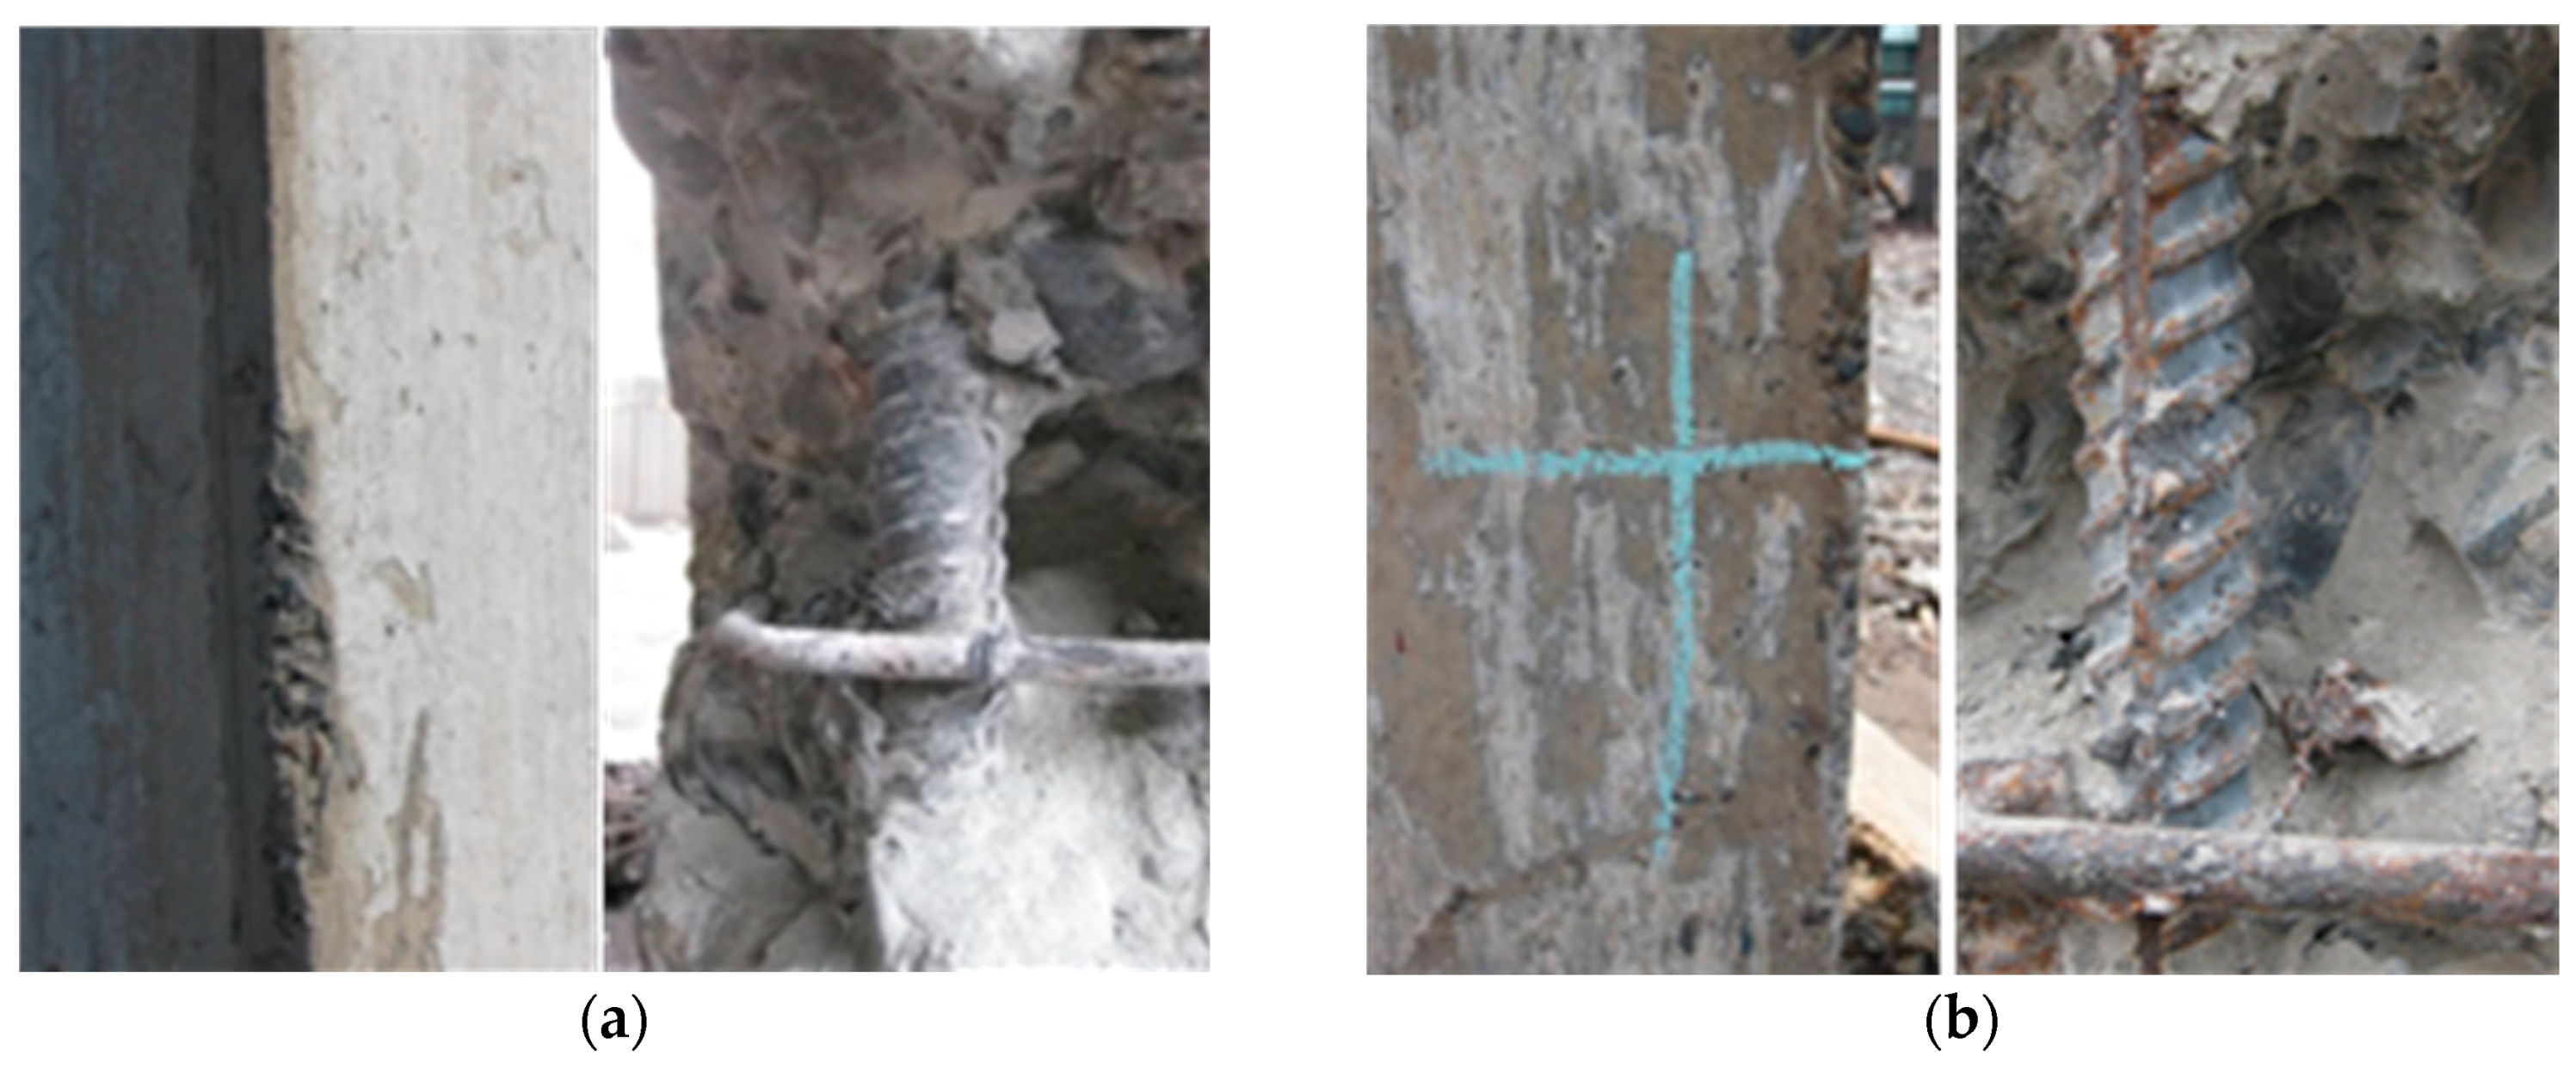
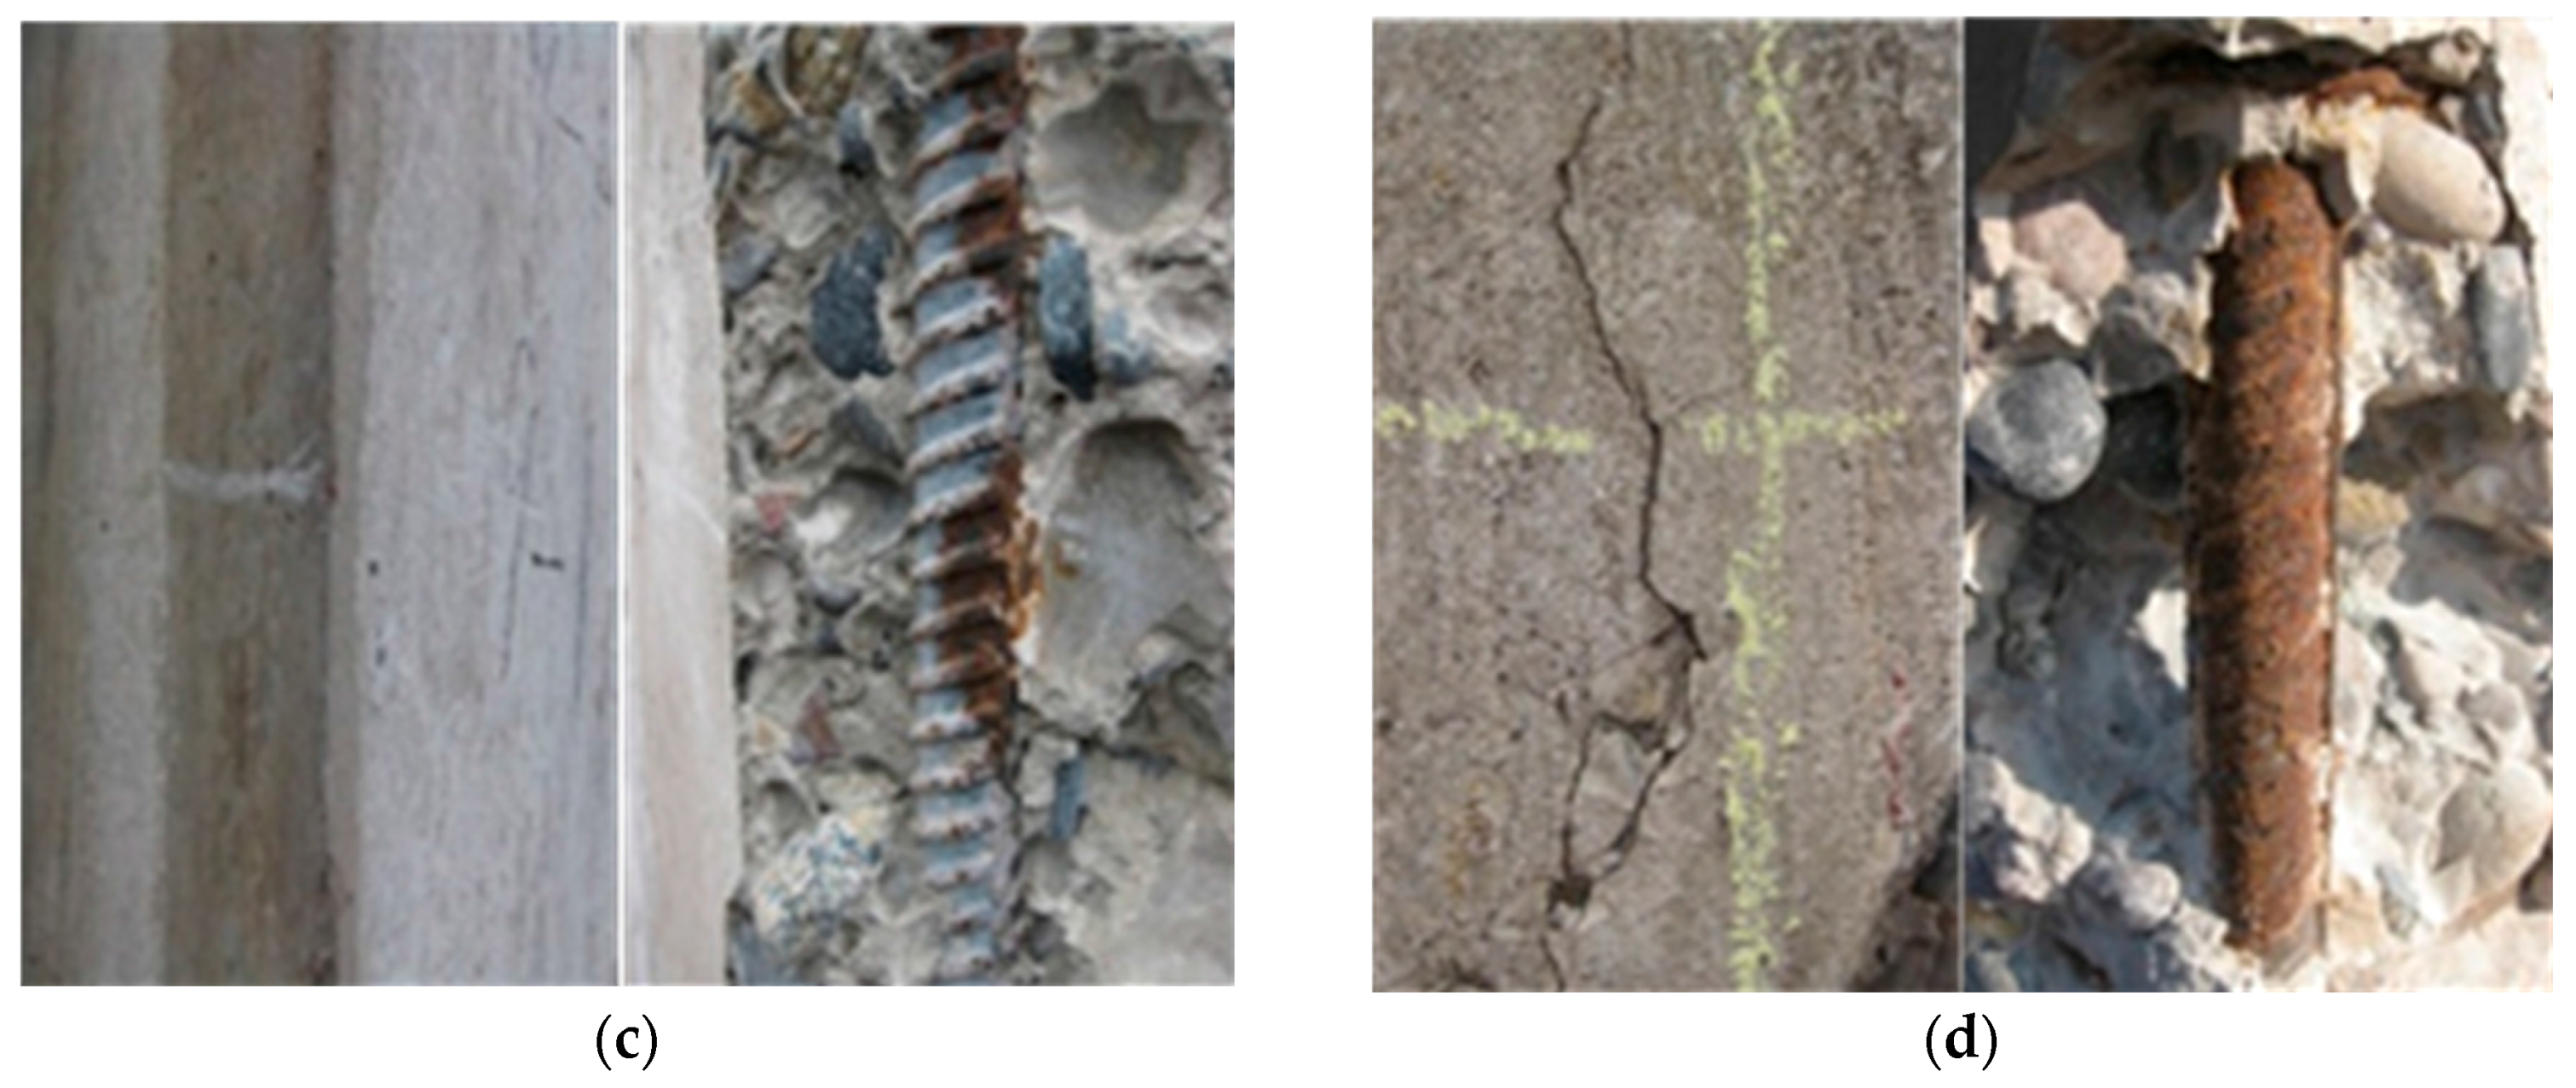
  • Samples of concrete cover: An electric hammer was used to drill the cover concrete from the corner of the rectangular columns until the rebar is exposed, as shown in Figure 1. Then the concrete cover samples were sealed instantly with a vacuum bag to isolate from the air.
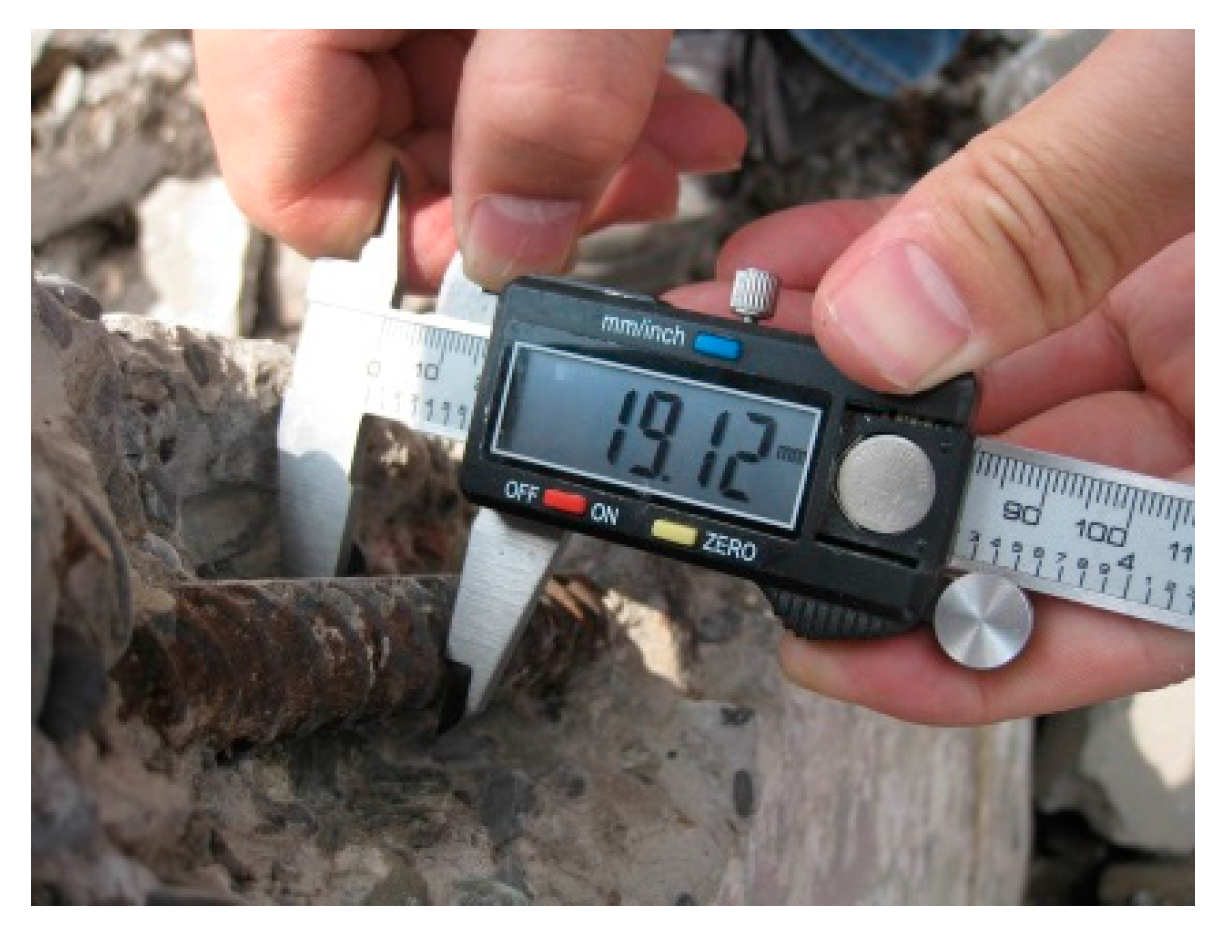
  • Cover depths measurement: As Figure 2 shows, a digital Vernier caliper with an accuracy of 0.01 mm was used to measure depth of the cover, while the corrosion status of the rebar was recorded with a high resolution digital camera.
  • Testing the depth of carbonation: Carbonation depth was measured by spraying a 1% solution of phenolphthalein in ethanol to the fresh concrete surface. Each specimen was measured at three points and the average value was calculated as the value of each measurement.
  • Samples of drilled concrete core: Cylinder specimens were drilled out from each column where concrete cover samples were collected.

2.2. Test Method and Procedure

2.2.1. Compression Test

A total of 35 samples of drilled concrete core were tested. The specimens were prepared according to the requirements of the Chinese technical specifications for testing concrete strength with the drilled core method (JGJ/T 384-2016). Each tested cylinder specimen had a 100 mm diameter and a 100 mm height.

2.2.2. Pore Solution pH of Concrete Cover

The experimental program consisted of testing the pH of 108 concrete slices from 35 cover concrete samples. To test the pH value of the concrete cover layer by layer, the first step was to prepare the concrete pore solution. The expression method, which is the most widely recognized technique for acquiring pore solution, was adopted to extract the pore solution of the concrete cover [10,17,28].
A concrete pore solution expression apparatus was designed and manufactured, as shown in Figure 3. The expression device consists of a hollow steel cylinder where concrete particles are contained. A piston, which is located on the top of the concrete particles inside the hollow cylinder, and a base plate has fluid drainage channels for gathering the extracted concrete pore solution. As the concrete particles are compressed, pore fluid is forced into a circular channel and then goes through fluid drainage channels drilled in the base plate.
The pH measurement of the concrete cover pore solutions included the following procedures:
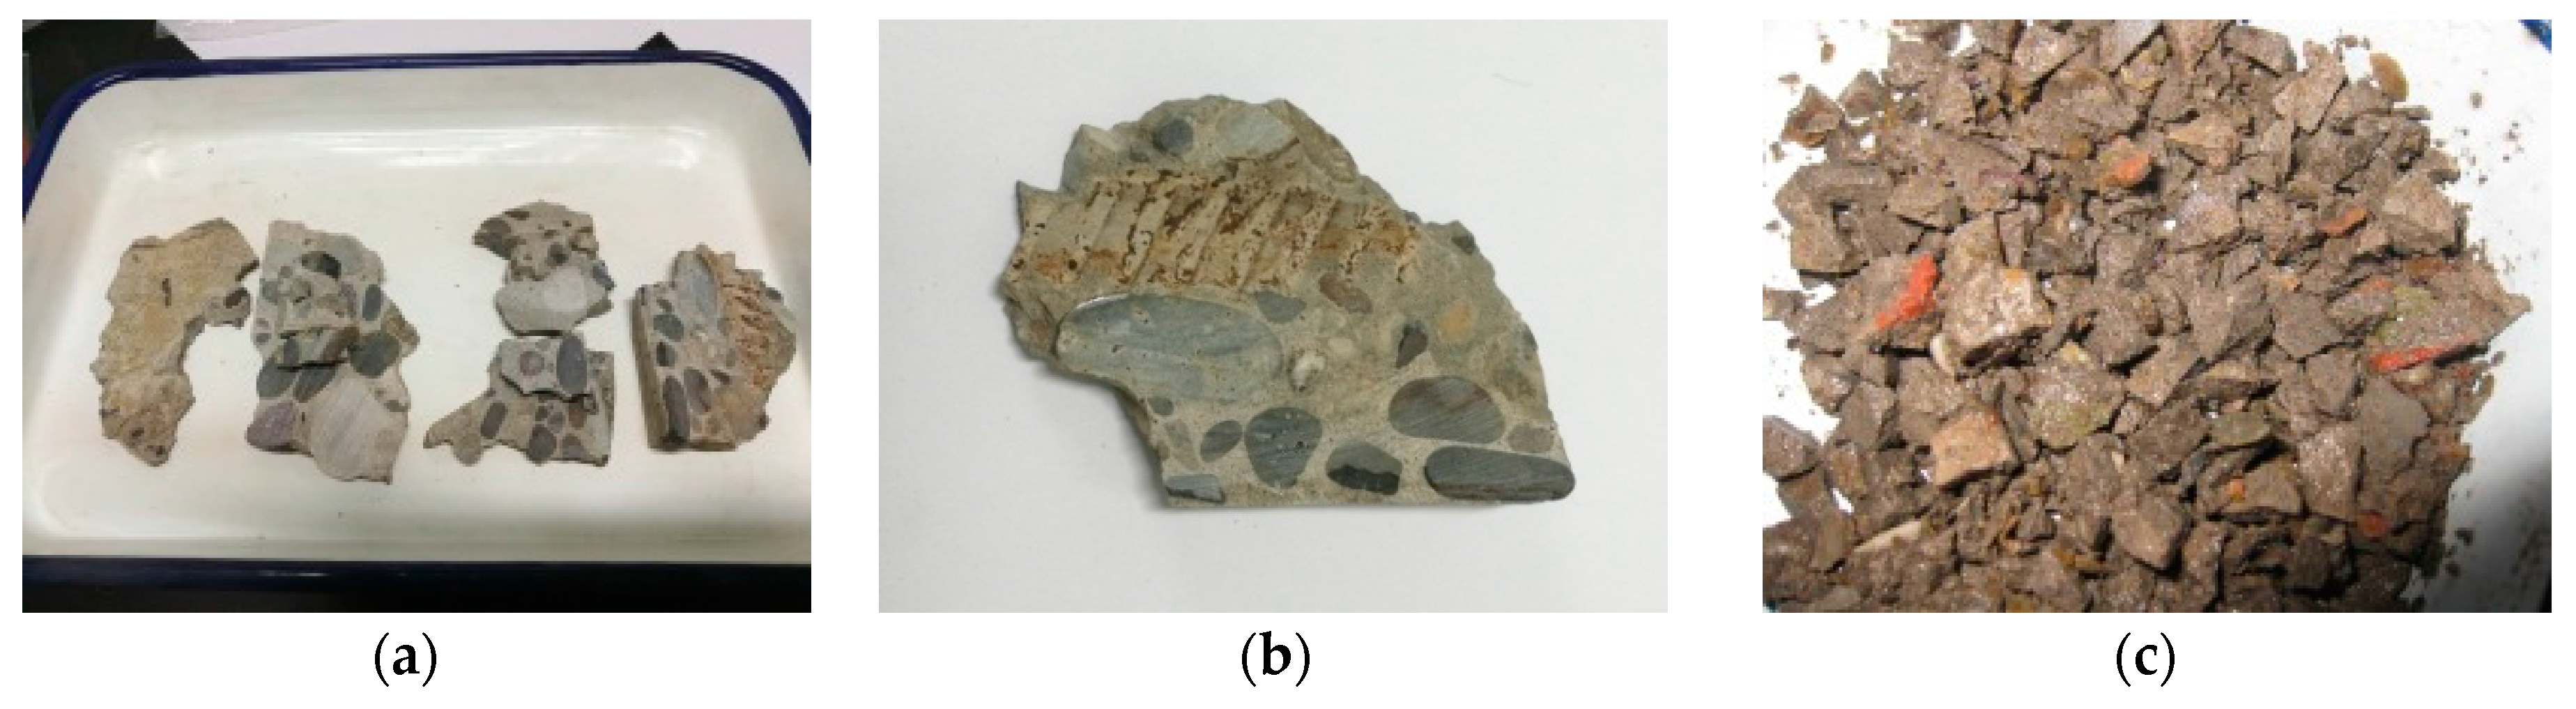
  • Samples of concrete cover cutting and drying. Thirty-five concrete cover samples were cut from the outer surface at intervals of 7 mm along the depth of carbonation with a precision saw using water cooling. Because the sizes of the drilled concrete cover samples were different, the number of slices for different concrete cover samples were either 3 or 4. Thus, 108 7-mm-thick slices were obtained from the concrete cover samples, e.g., 0–7, 9–16, 18–25, and 27–34 mm. After the concrete slices were cut, they were dried in an oven at 60 °C for 8 h, as shown in Figure 4a,b.
  • Samples pre-conditioning. The dried concrete cover slices were crushed into a powder with a maximum particle size of 5 mm, and the coarse aggregates were removed. The particles were then saturated with distilled water spraying, as shown in Figure 4c.
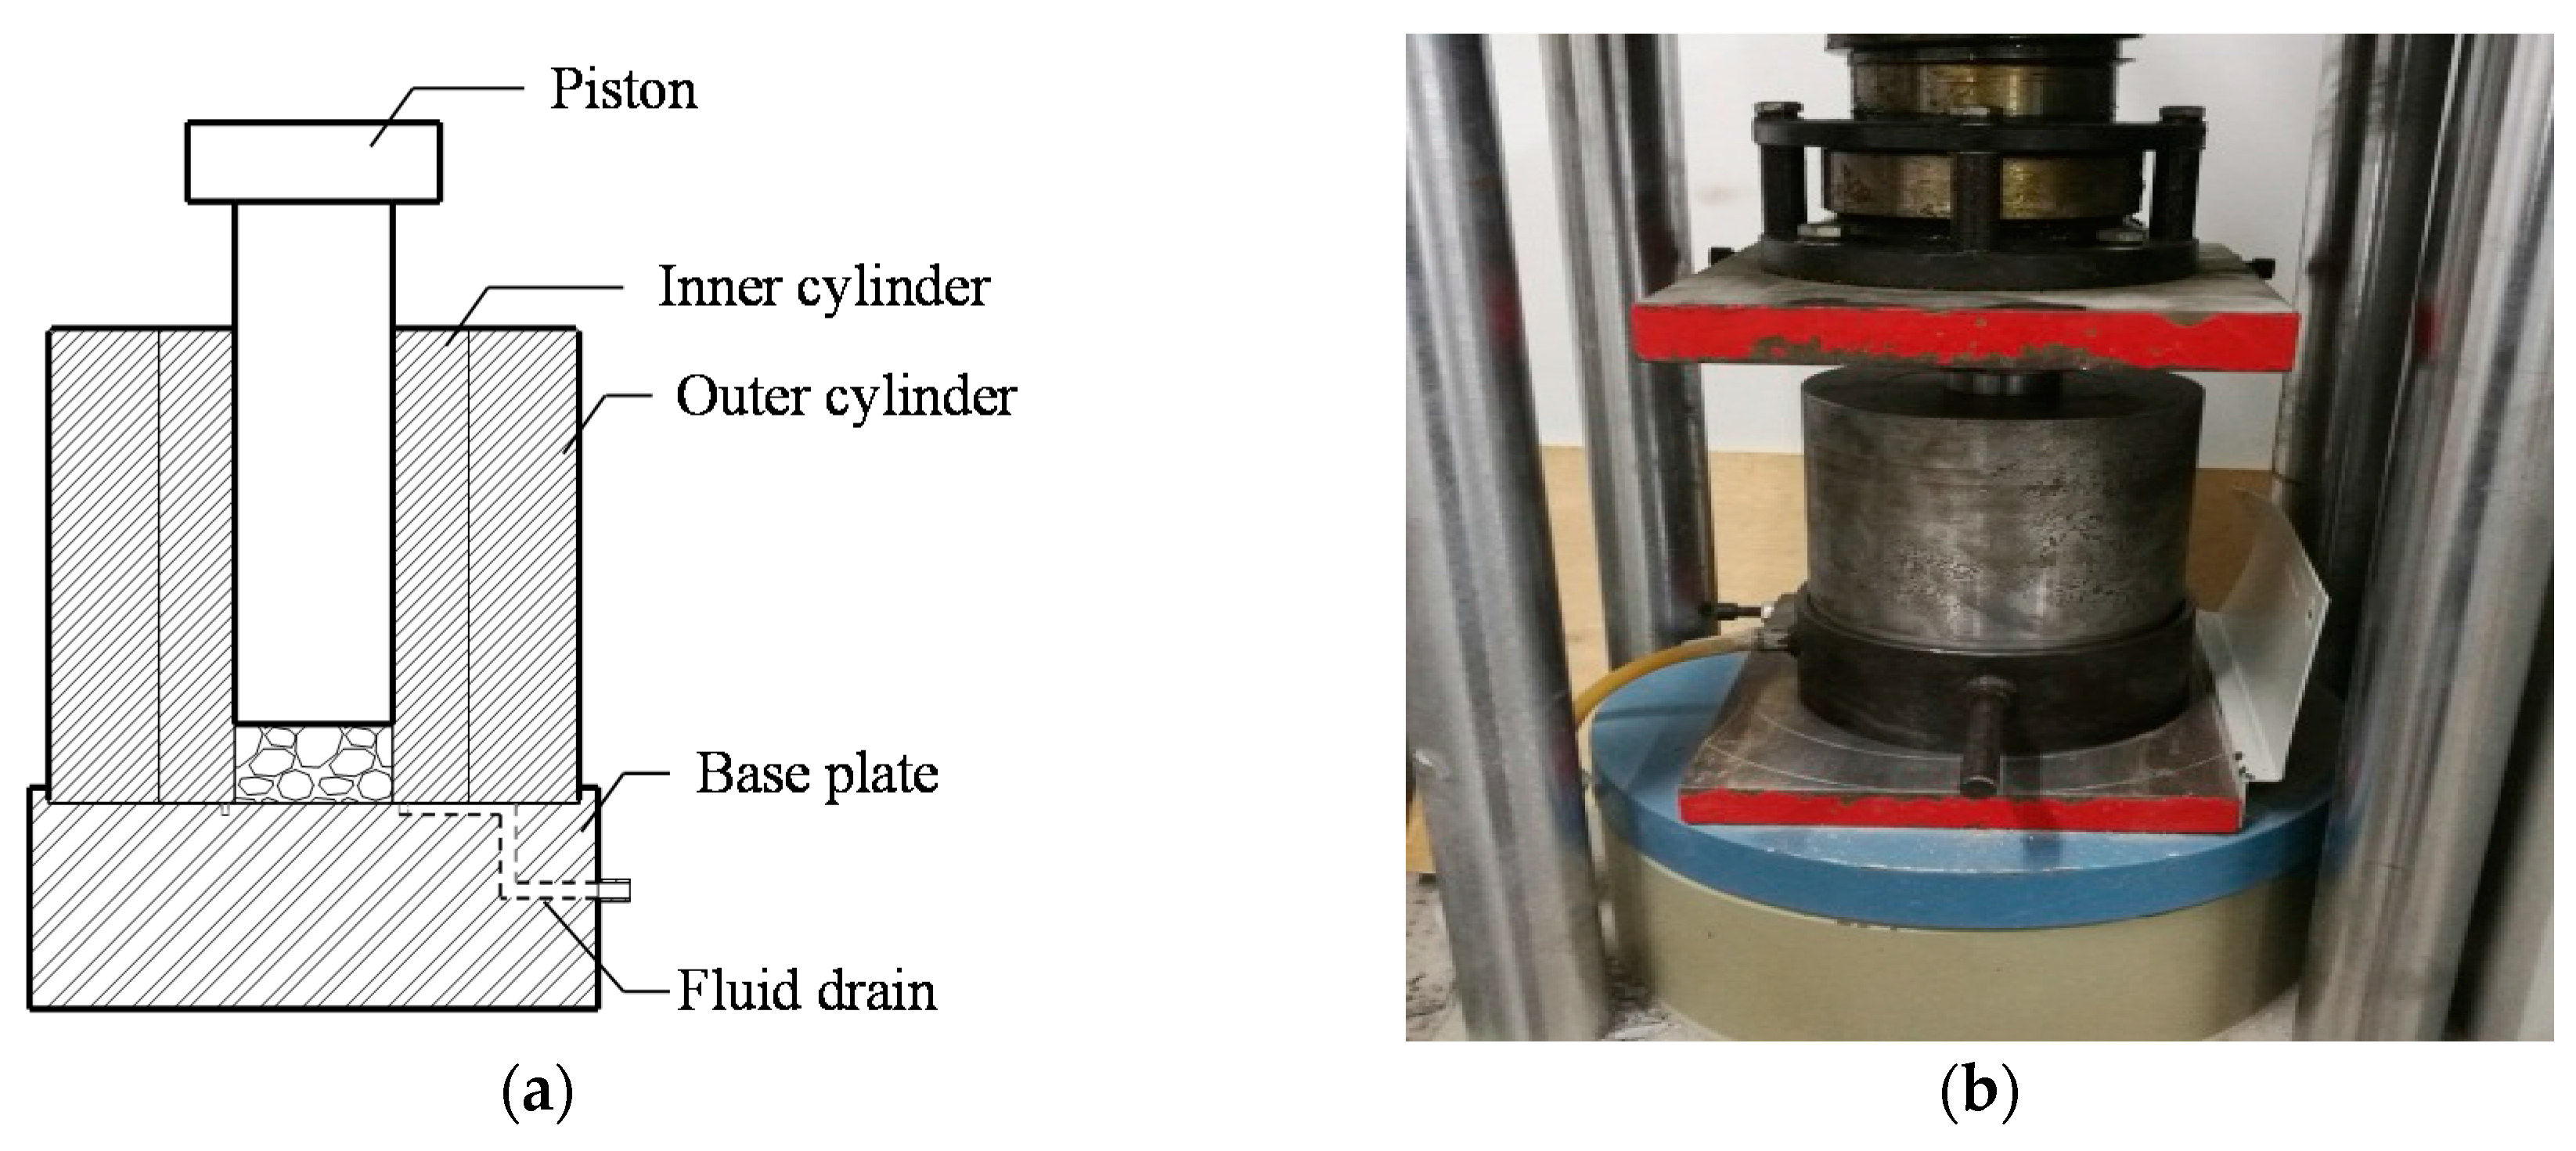
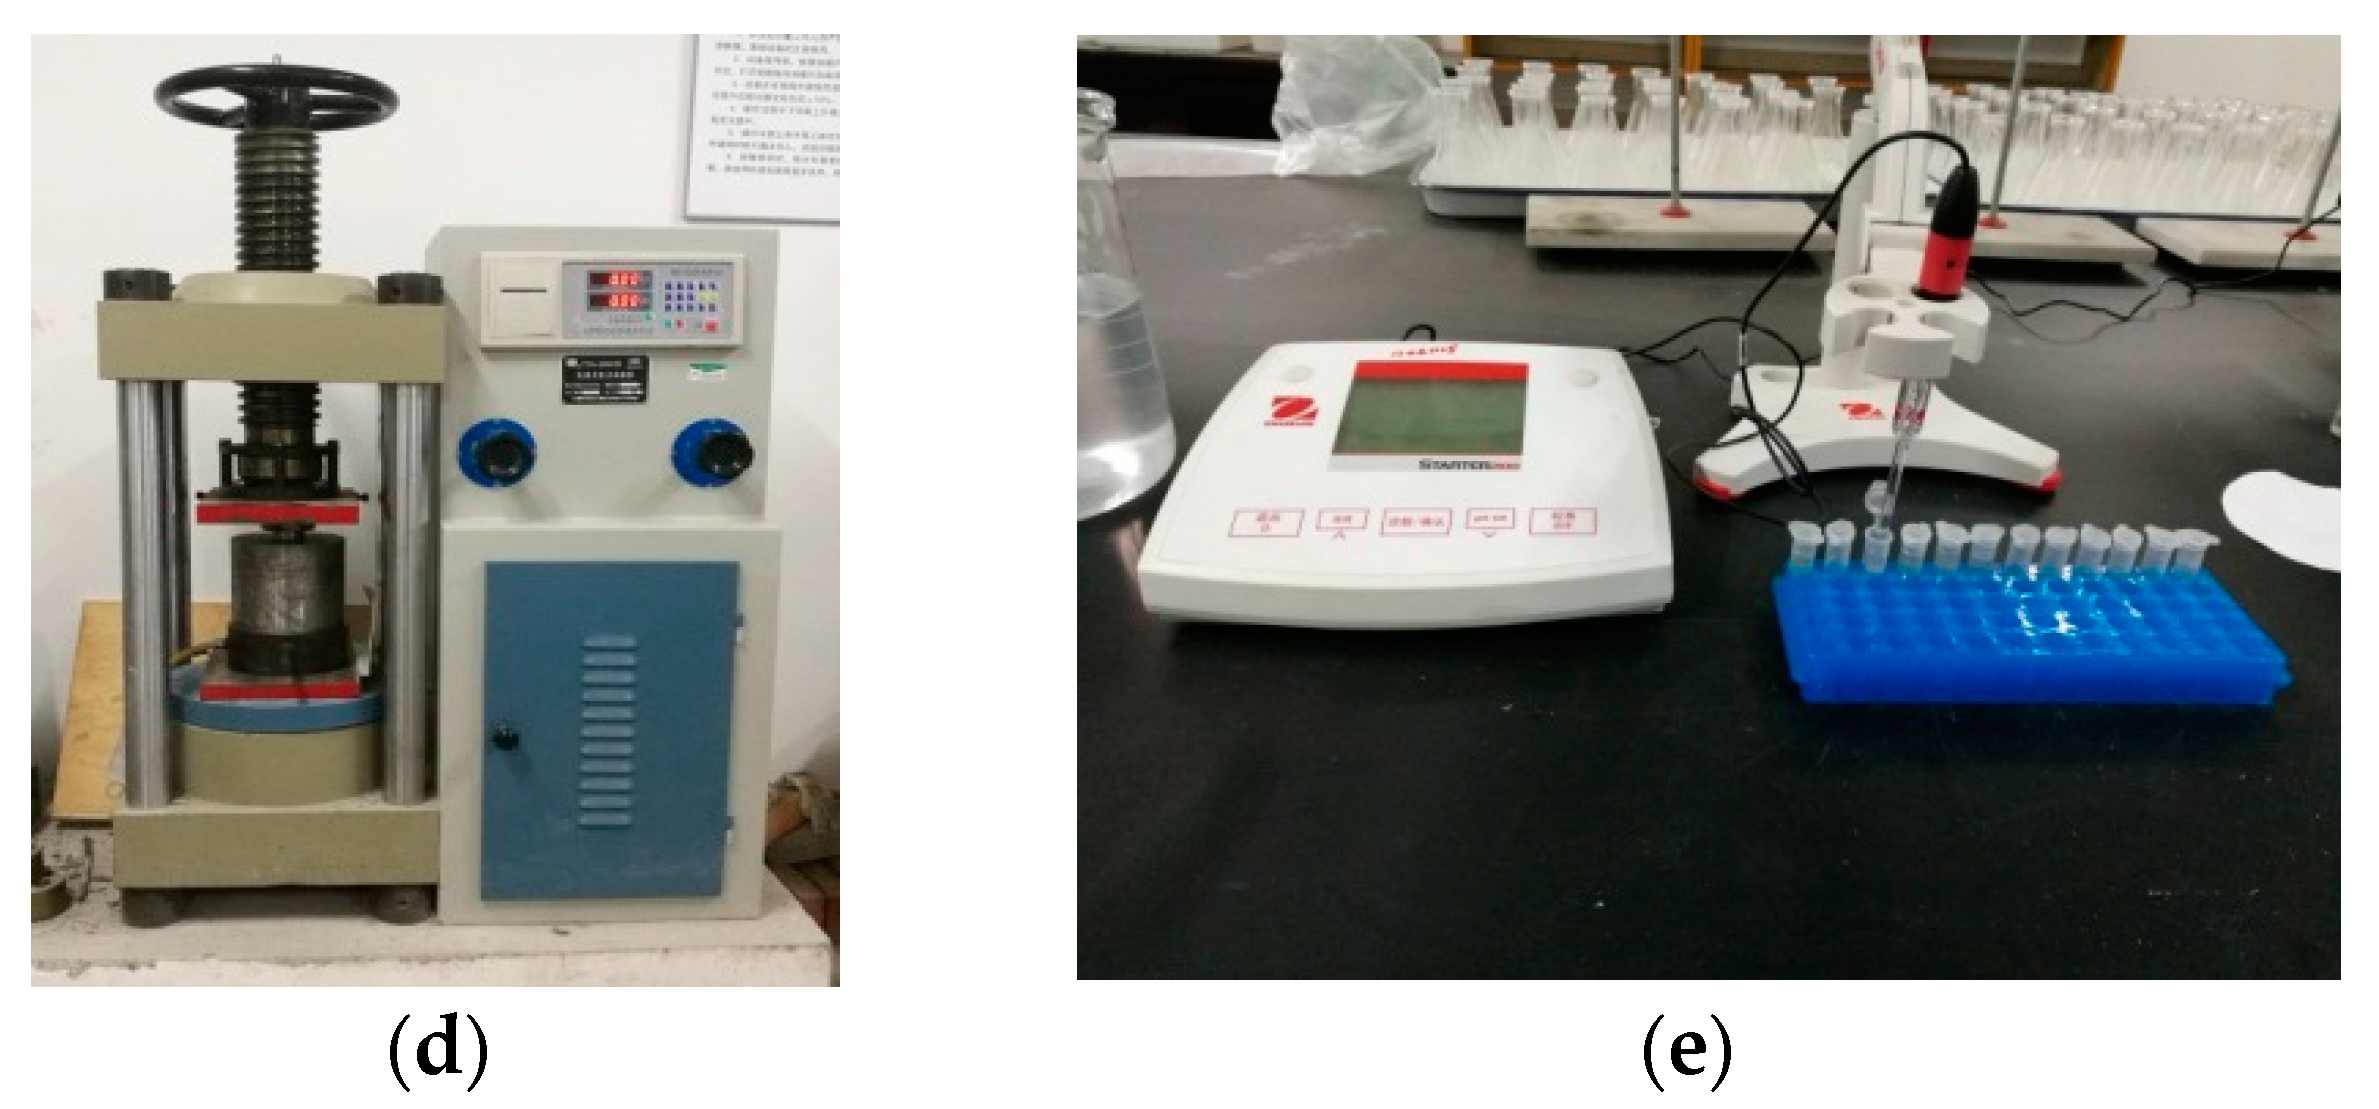
  • Concrete pore solutions extraction. Approximately 20–30 g of the saturated particles were placed into the cavity of the hollow cylinder of the concrete pore solution expression device. The extraction tests were conducted at ambient temperature using a servo-hydraulic testing system, as shown in Figure 4d. Pressure was applied to the piston using a maximum pressure of 610 MPa in pressing the concrete particles with a mean rate increase of 2 kN/s. After the maximum pressure is reached, it was held for 10 min until no more pore solutions could be obtained. The pore solution was collected in a centrifuge tube. A minimum volume of 2–3 mL of pore solutions added to carry out pH measurements.
  • pH measurements. The pH of the expressed pore solution was measured directly with a pH meter and a micro combination pH electrode, as shown in Figure 4e. This electrode was designed to measure in the pH = 0–14 range. Before performing the pH measurements, the pH electrode system was calibrated by two standard buffer solutions. The pH measurements were conducted at an ambient temperature within a range of 20–25 °C. The calibrated micro-combination pH electrode remained in the solution until the pH value was constant.

2.2.3. X-ray Diffraction (XRD) Measurements

The XRD analysis was used to determine the phase compositions of the cover concrete samples layer by layer. At the time of sampling preparation in the pH measurement tests, a few pieces of samples were taken from each cover concrete slice. The samples were first pulverized in ethanol by an agate mortar and passed through an 80 μm sieve for vacuum filtrating. The powder was dried in an oven at 60 °C for 8 h. A PANalytical Empyrean system was employed using a Cu Kα source to obtain experimental XRD patterns of the power, scanning from 5 to 70° at a rate of 2° per minute.

3. Results and Discussions

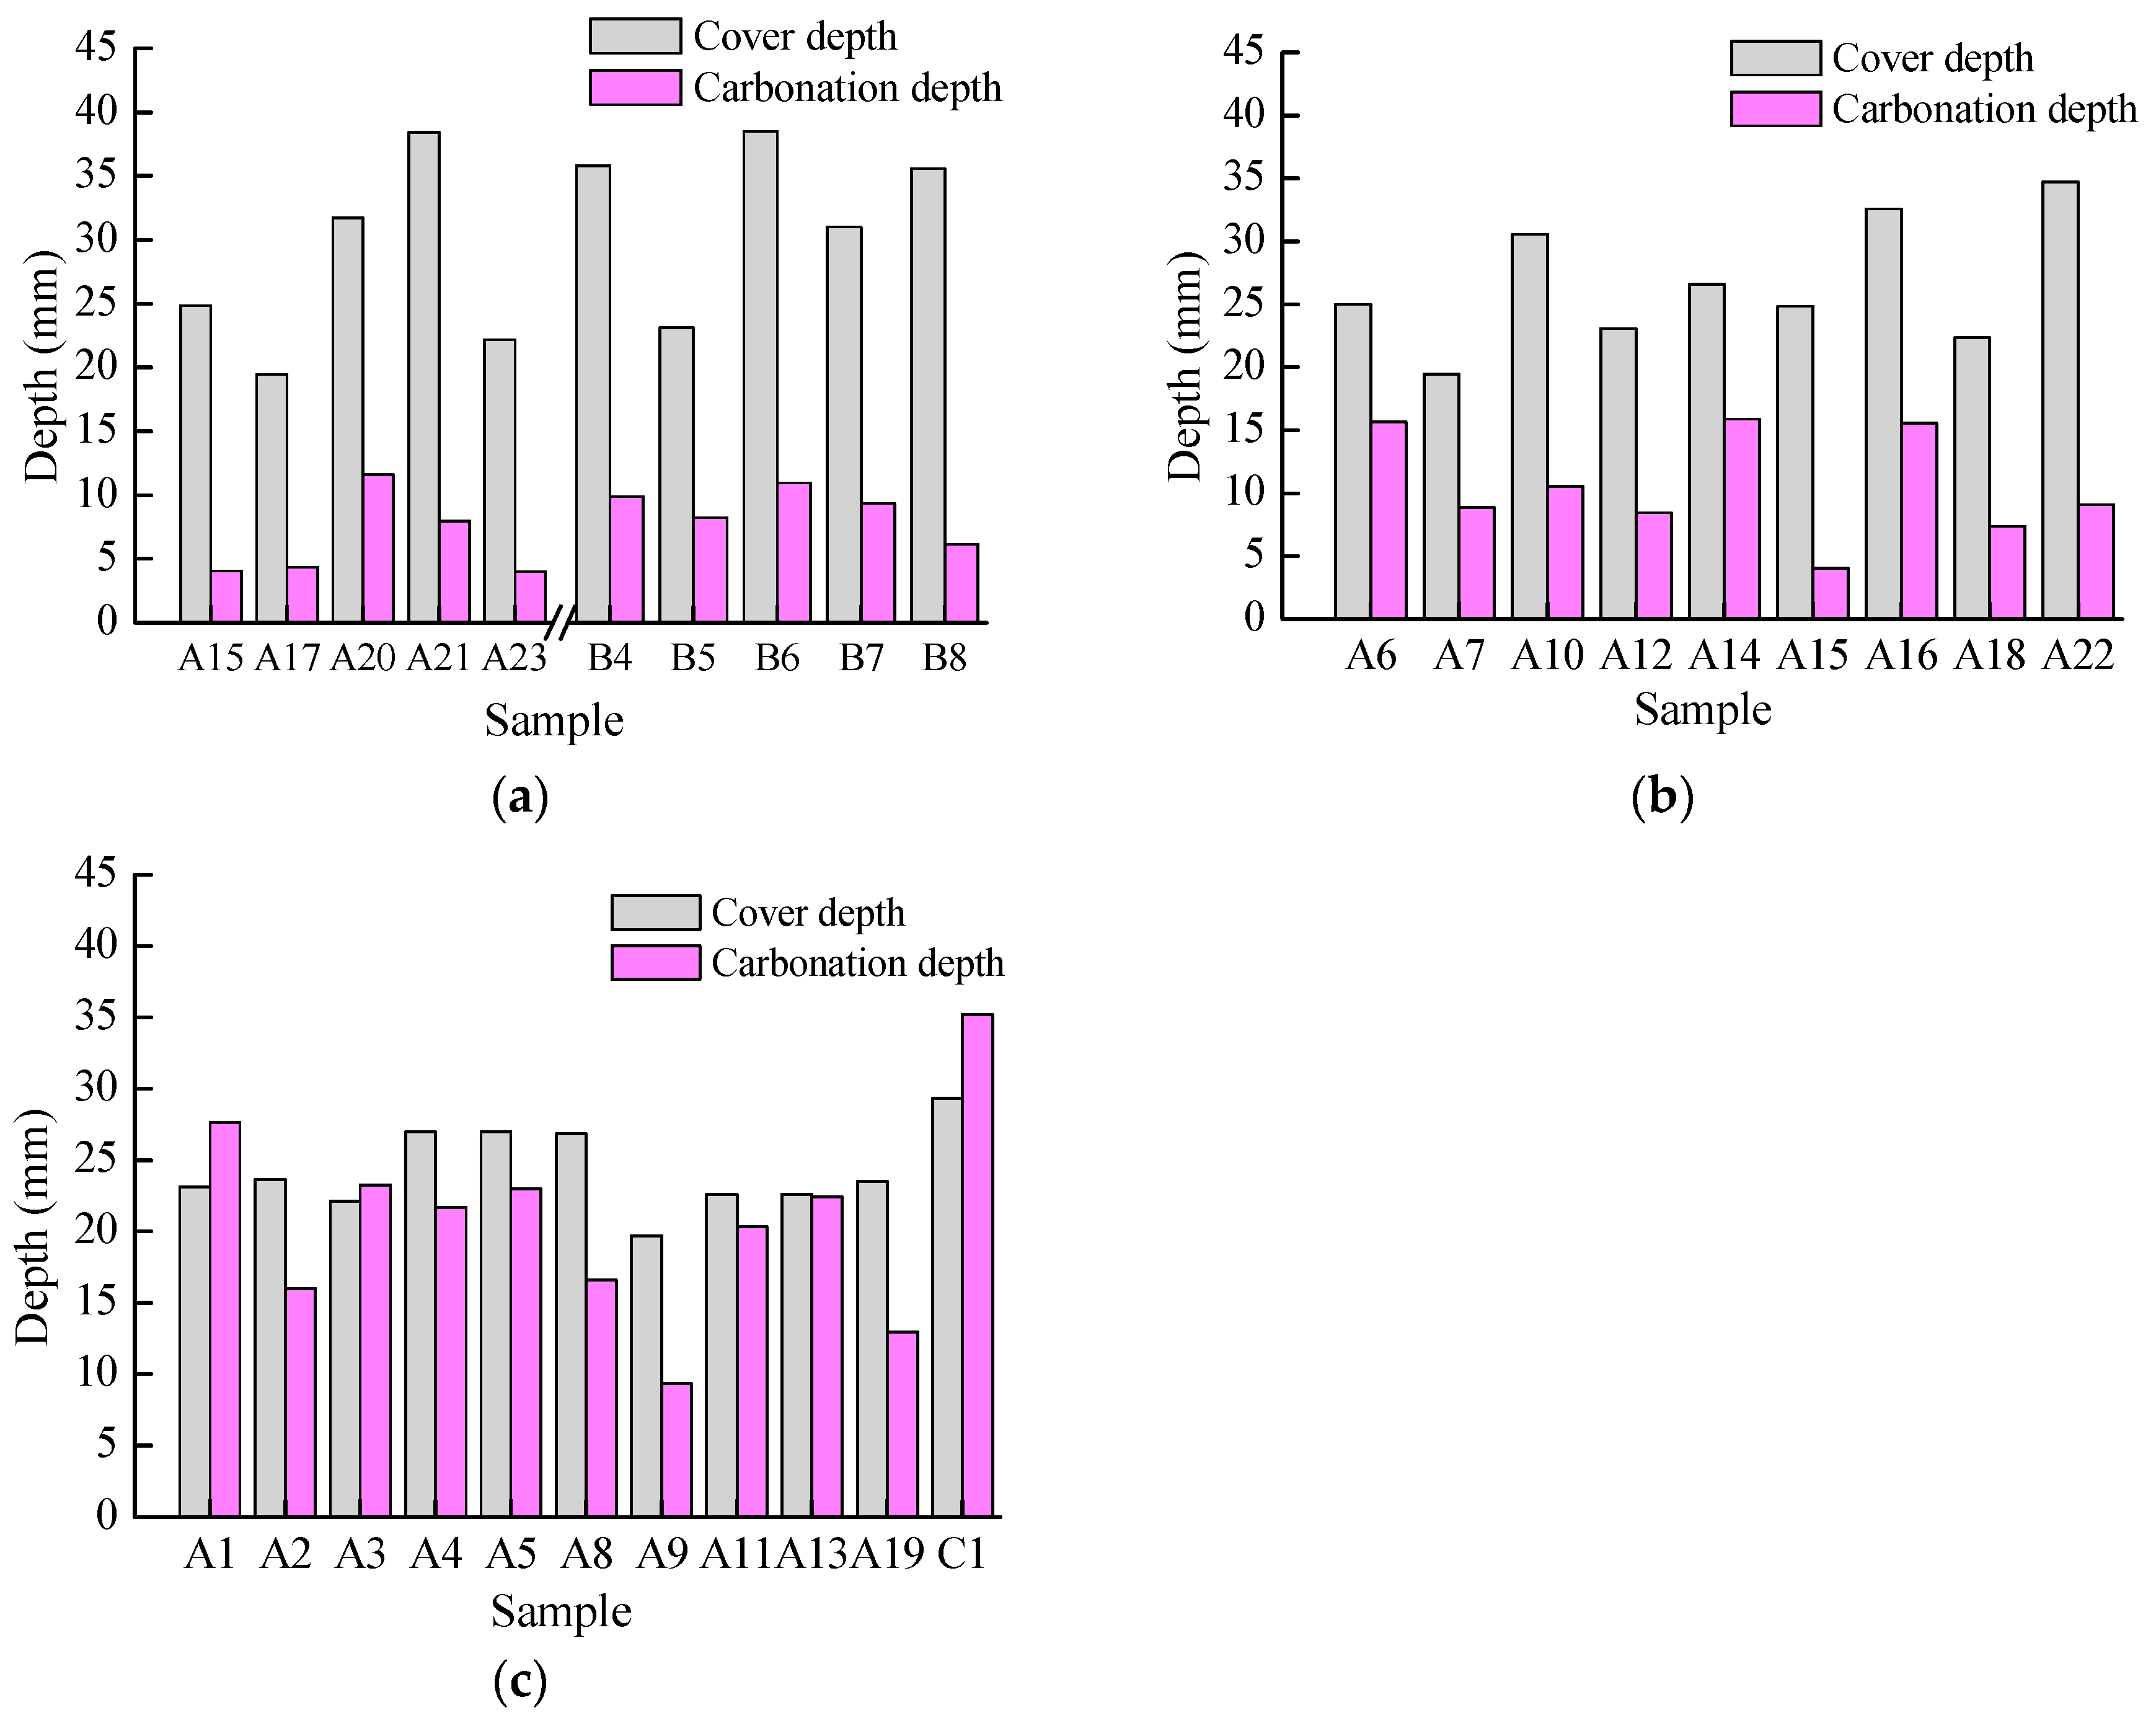
3.1. In-Situ Test Results

Table 1 shows the in-situ test results of 35 reinforced concrete columns where the samples of concrete cover were drilled, including the column cross-sections, depth of cover, depth of carbonation, maximum crack width (wmax) induced by corrosion, and corrosion status of embedded rebars.
The in-situ test results indicated that there are four typical states in reinforced concrete columns. The first status, shown in Figure 5a, has no corrosion-induced cracks and the rebar is uncorroded as well; thus, this status is uncracked and uncorroded. Figure 5b reveals no corrosion-induced cracks with only the transverse ribs and longitudinal ribs corroded; this status is uncracked and minor corrosion. Figure 5c shows that both the transverse/longitudinal ribs to be corroded. The rebar surfaces between the ribs are also corroded; thus, this status is uncracked with moderate corrosion. Figure 5d shows corrosion-induced cracks and the surface of the rebar being completely exfoliated due to corrosion. This status is cracked and severe corrosion.

3.2. Results of Strength Tests

Results of concrete strength tests are shown in Table 1. It can be found that the compressive strength of the uncracked samples with minor corrosion and moderate corrosion varied widely from 40.5 to 58.3 MPa and 42.4 to 57.1 MPa, respectively. The cracked samples with severe corrosion varied from 42.5 to 58.0 MPa.

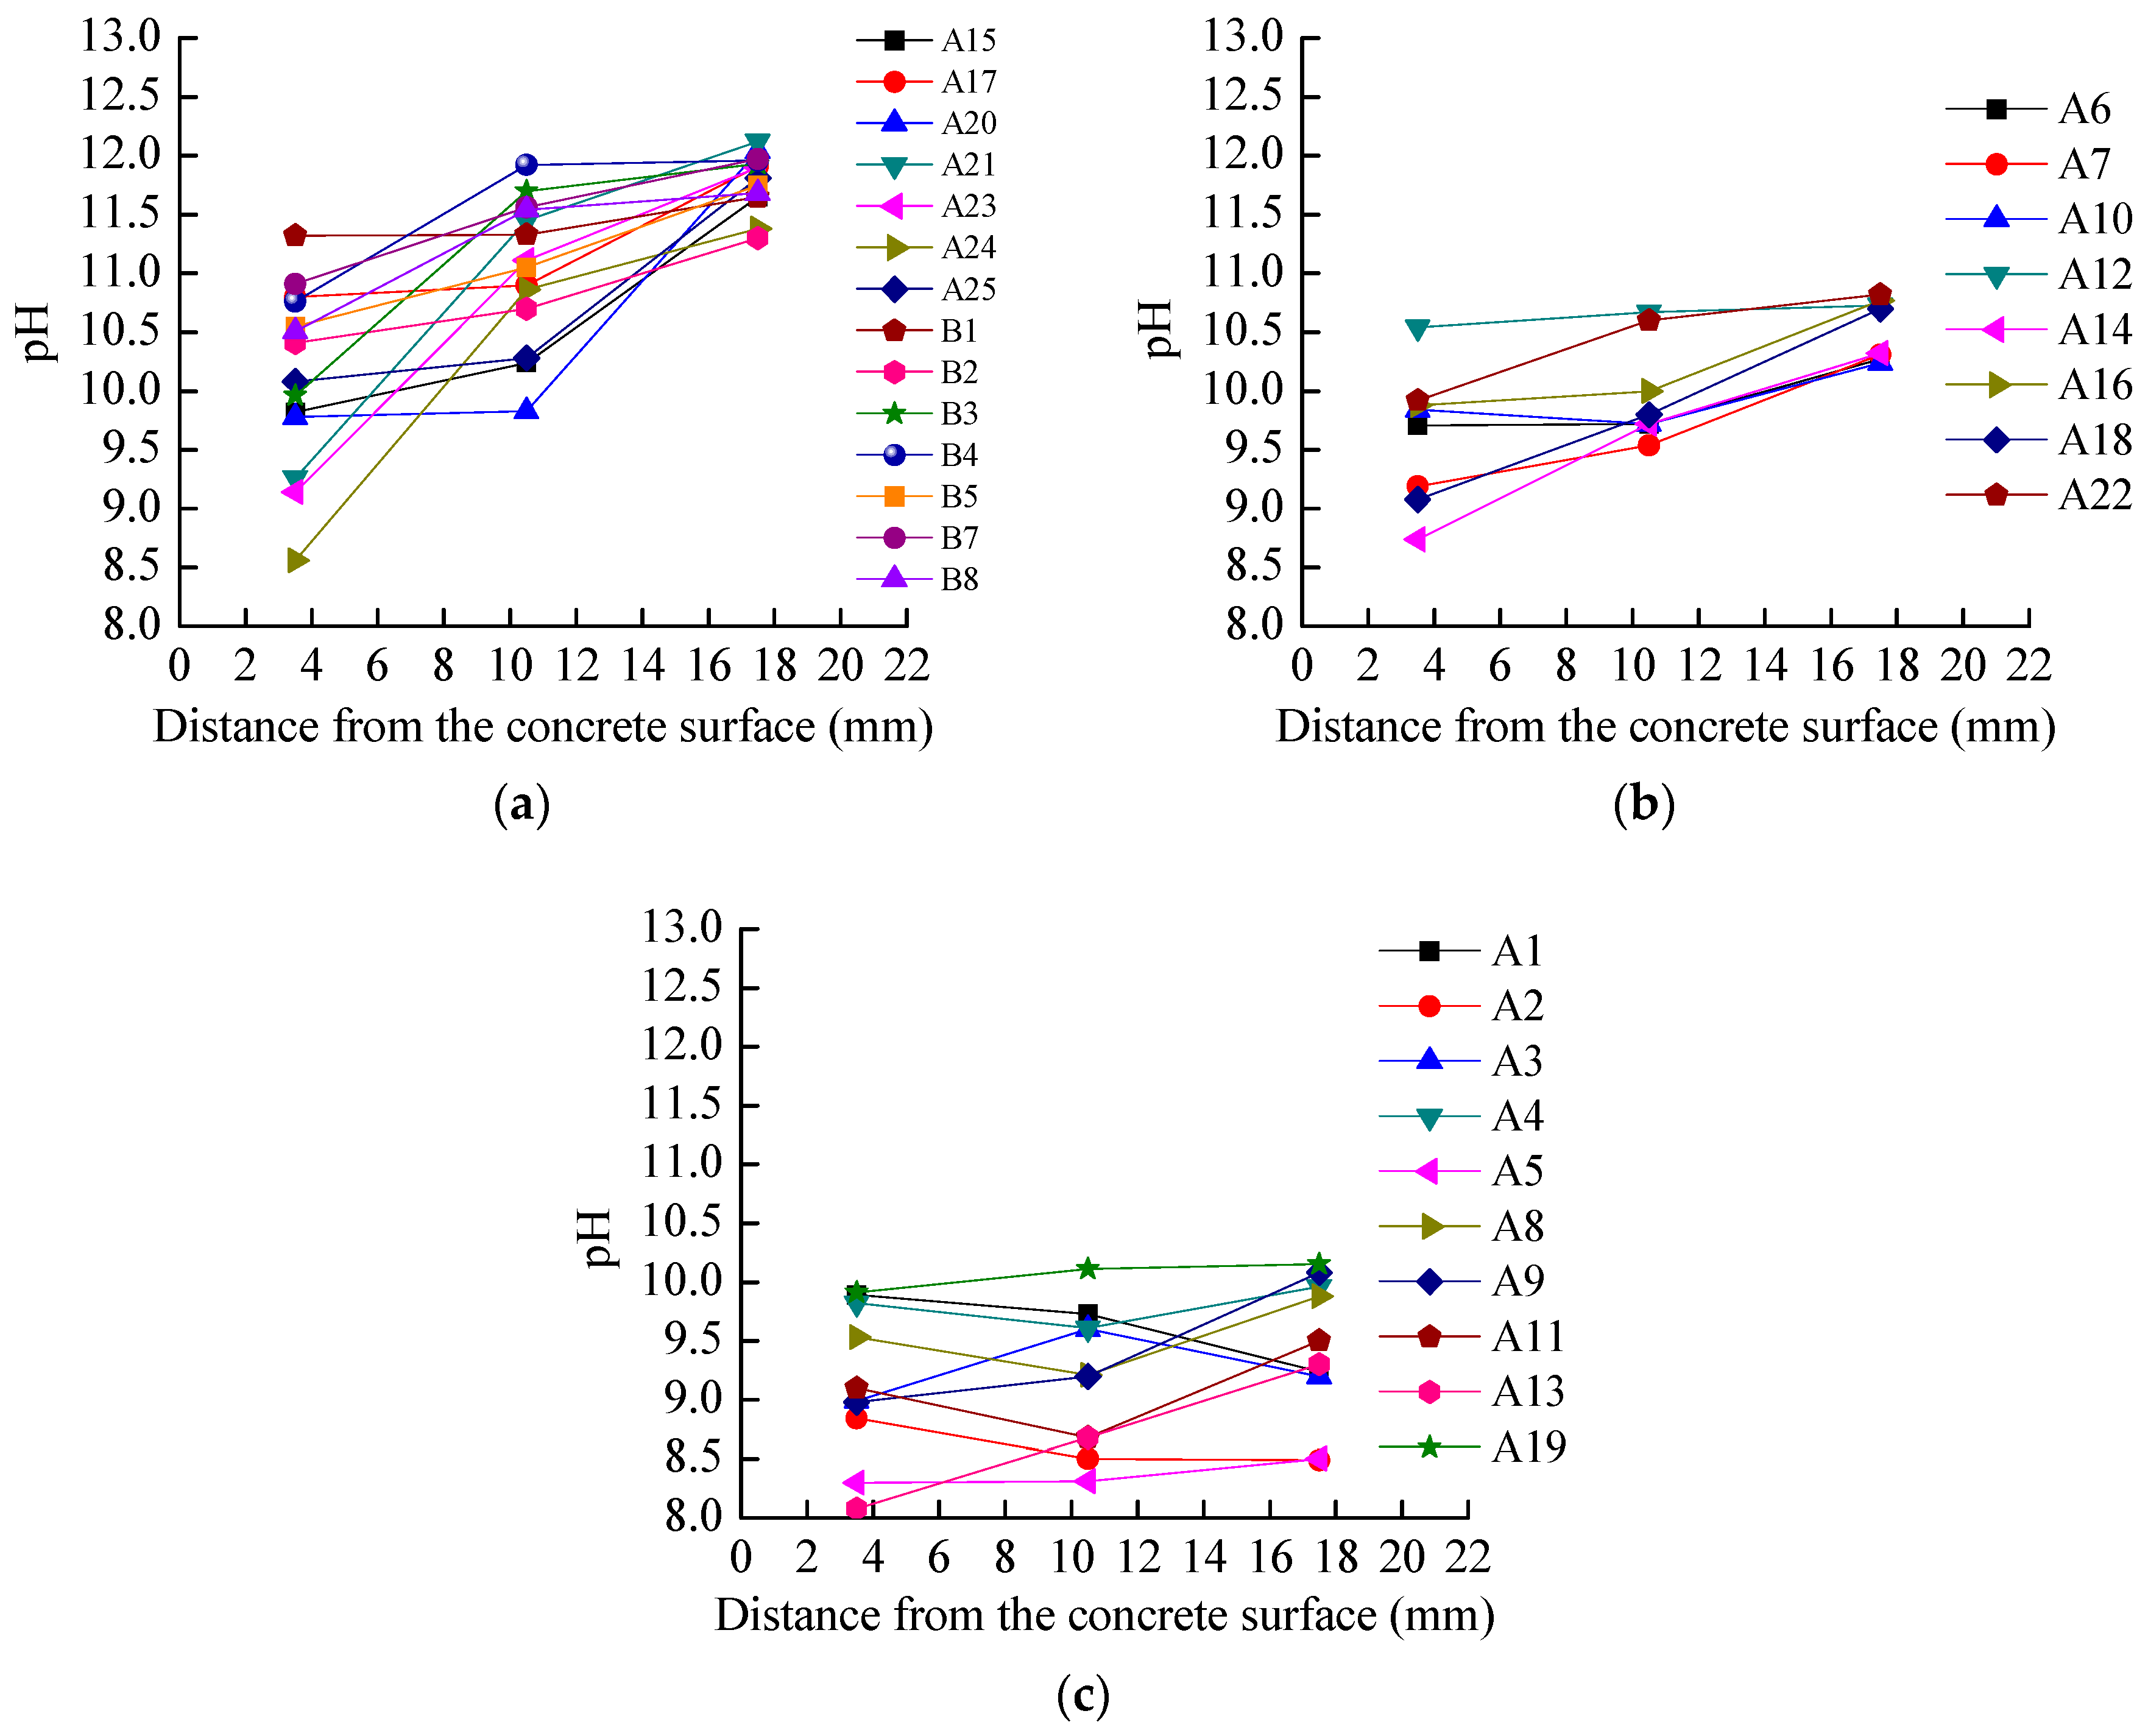
3.3. Variation in pH along the Depth of Cover

Variation in pH along the cover depth for uncracked samples with minor corrosion is shown in Figure 6a. The pH along the cover depth ranged from 8.5 to 12.1. The pH values at depths of 3.5 mm, 10.5 mm, and 17.5 mm from the concrete surface were in ranges of 8.5–11.3, 9.5–11.9, and 11.3–12.1, respectively.
It was found that pH increases with the increase in depth, as shown in Figure 6. Figure 7a shows that the full carbonation depth is much less than one-third of the cover depth. This indicates that the proportion of semi-carbonated and uncarbonated zones is higher. Based on the carbonation mechanism, carbon dioxide diffused from outside to inside of the concrete and carbonated with the alkaline substance. The carbonation reaction resulted in an increase in the content of calcium carbonate CaCO3 and a reduction of calcium hydroxide Ca(OH)2 from the concrete surface to the inside. Thus, carbonated products alter the pH of the concrete pore solution; CaCO3 reduces the pH value, and Ca(OH)2 increases the pH values.
Variation in pH along the cover depth for uncracked samples with moderate corrosion is shown in Figure 6b. The pH along the cover depth was between 8.7 and 10.8. The pH values at depths of 3.5 mm, 10.5 mm and 17.5 mm from the concrete surface were in ranges of 8.7–10.5, 9.5–10.6, and 10.2–10.8, respectively. Compared with the minor corrosion samples, the pH of moderate corrosion samples reduced significantly at the same depth and varied in a narrower range.
Figure 7b shows that the full-carbonation depth was much less than one-half of the cover depth. This indicates that the proportion of fully carbonated zone increases with the corrosion degree. This result agrees with findings obtained with the pH test.
Variation in pH along the cover depth for cracked samples with severe corrosion is shown in Figure 6c. The pH of the concrete solution along the cover was between 8.0 and 10.0. The pH at depths of 3.5 mm, 10.5 mm and 17.5 mm from the concrete surface were in ranges of 8.0–9.5, 8.5–10.0, and 9.0–10.0, respectively. Compared with the uncracked samples, the pH of cracked samples reduced significantly at the same depth.
Figure 6c also shows that the pH of cracked samples with severe corrosion slightly changed along the cover depth, and its value fluctuated at pH = 9.0. This is because corrosion-induced cracks along the rebar provide a convenient channel for the diffusion of carbon dioxide; thus, a steady stream of carbon dioxide accelerates the carbonation process of the cover concrete for cracked samples. Figure 6c confirms this, showing where the carbonation depth of the cracked sample exceeds or is close to the cover depth. Thus, the cover is completely carbonized, allowing little variation in pH to occur along the cover depth.

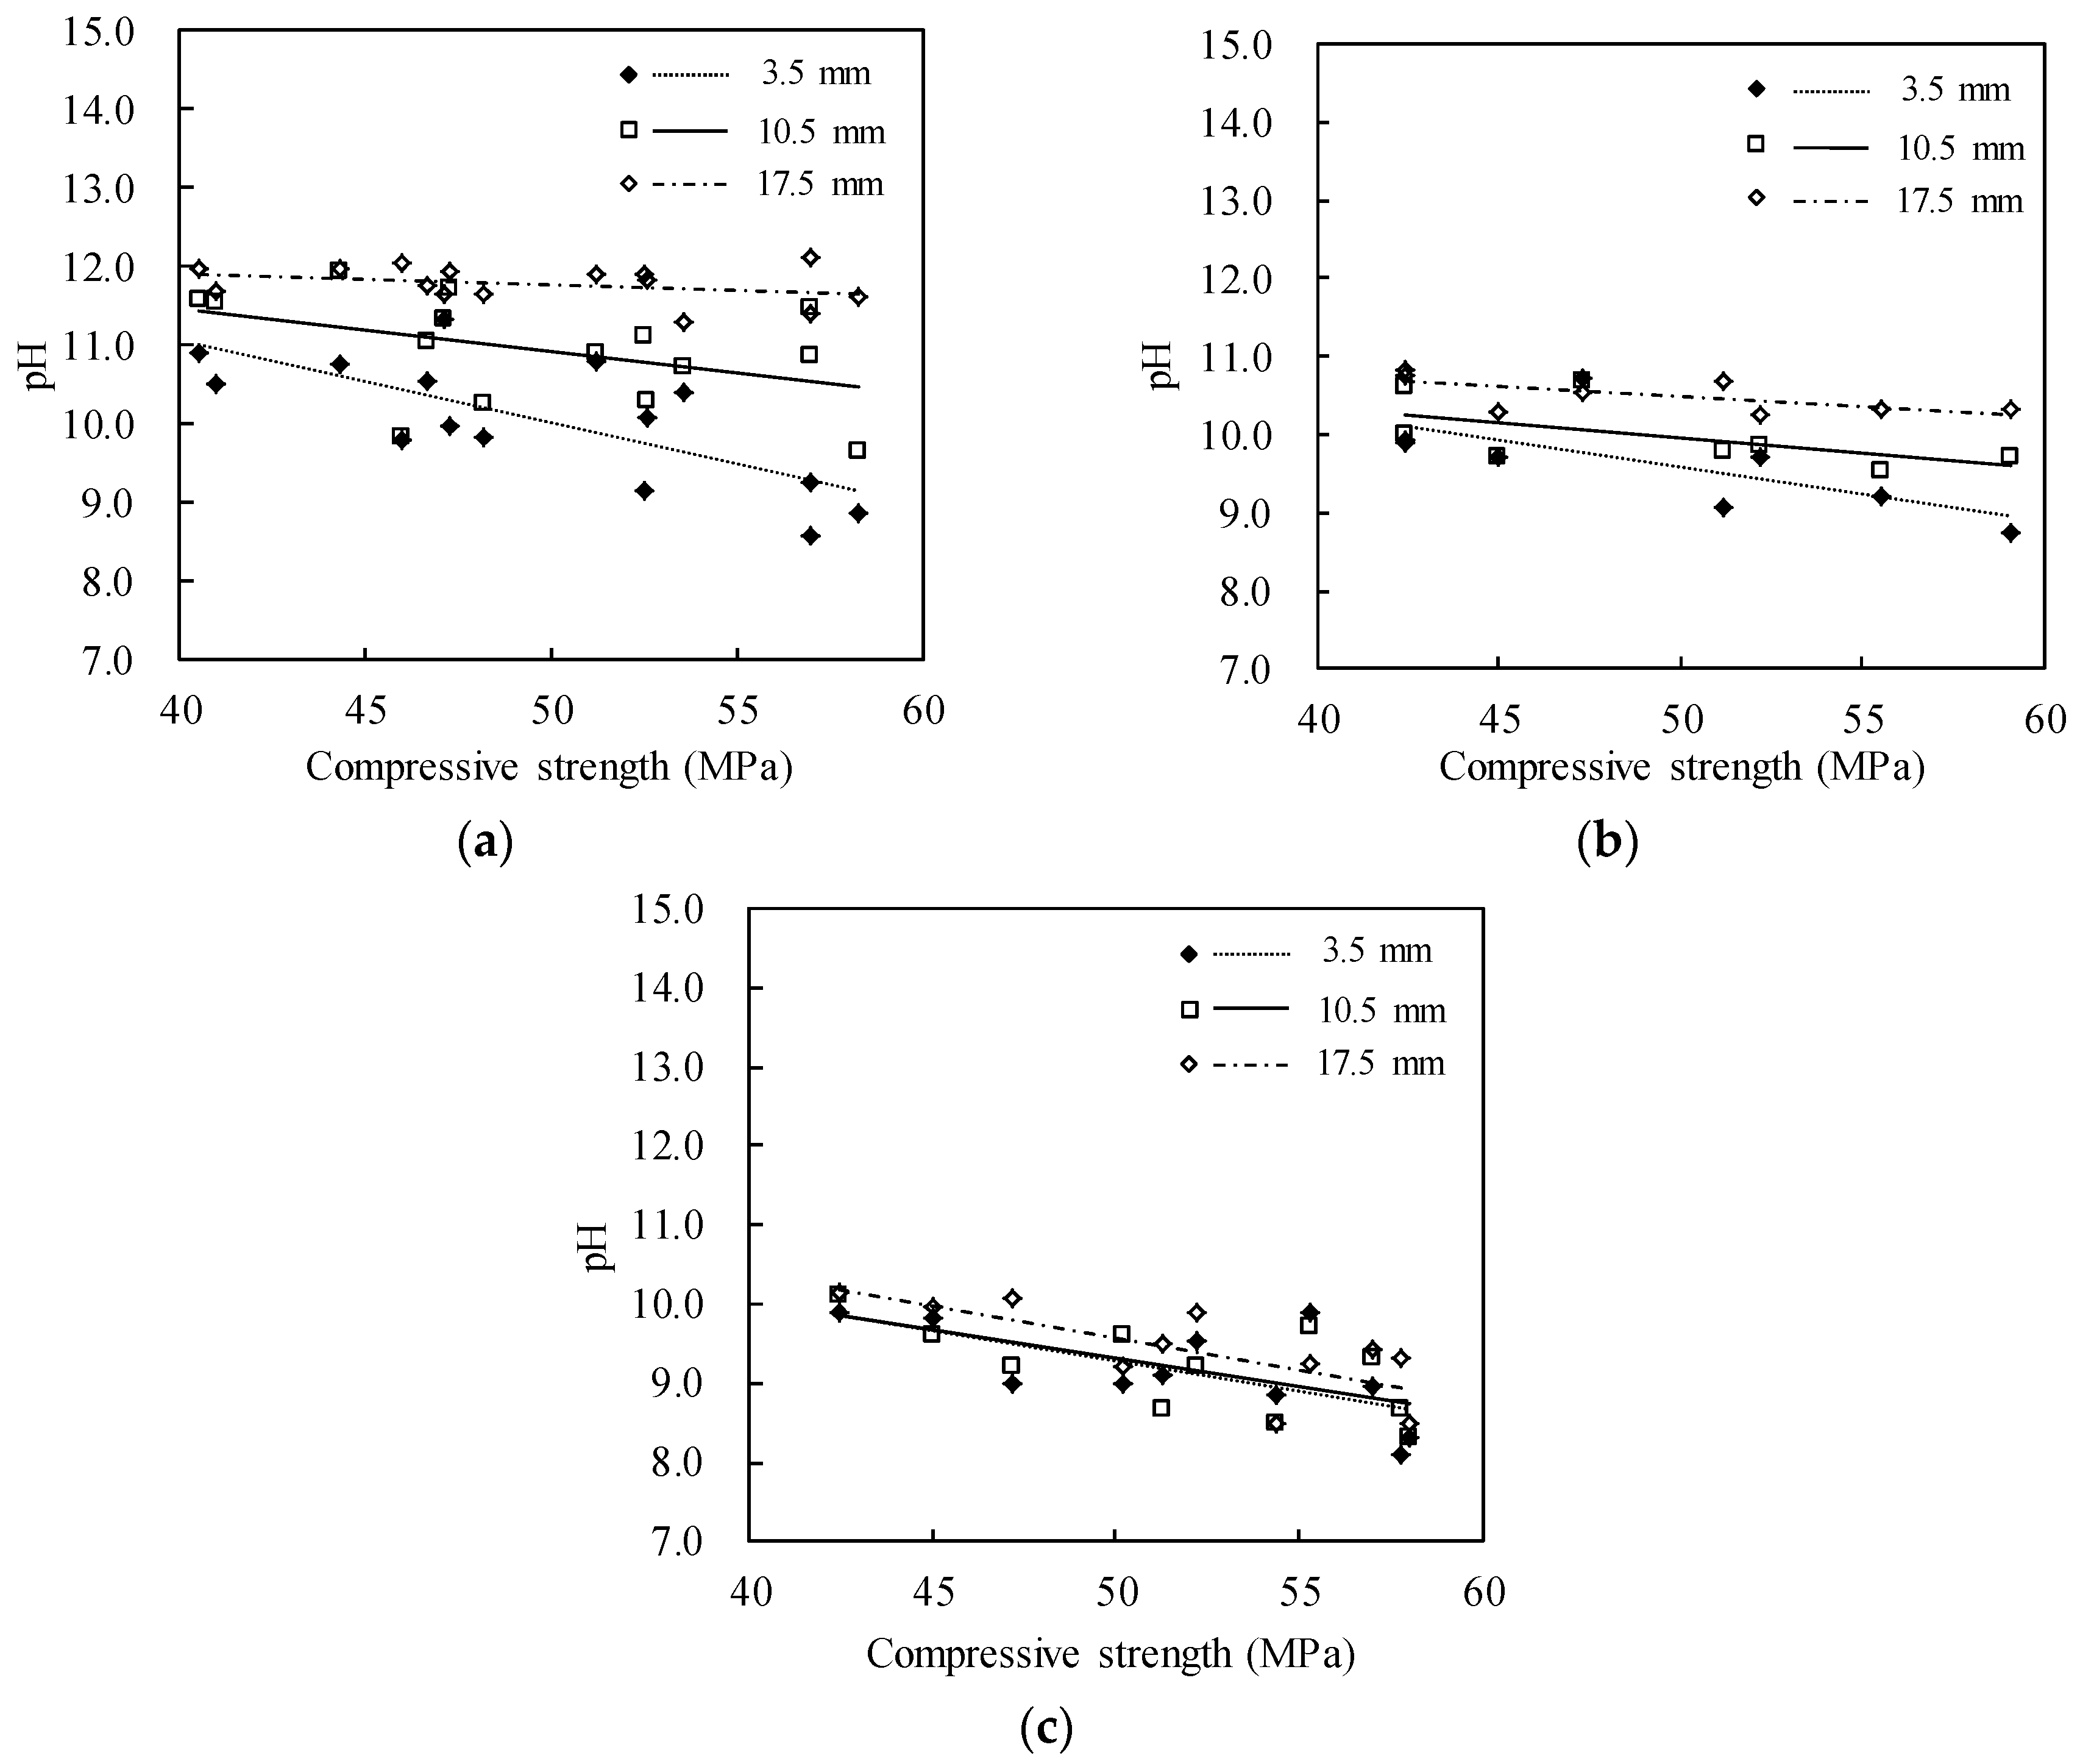
3.4. Variation in pH with Concrete Compressive Strength

Figure 8 presents the variation in pH with concrete compressive strength. It was found that the pH values decrease with the increase in compressive strength at different depths. This is likely because, with the increase in strength, the porosity of the concrete decreases, and the diffusion rate of carbon dioxide in the concrete pore also decreases. This phenomenon was also observed in carbonation tests of concrete prepared from an accelerated corrosion process [24]. As a result, carbonation reaction of high-strength concrete is more adequate, and the pH of the concrete is low at the same depth.

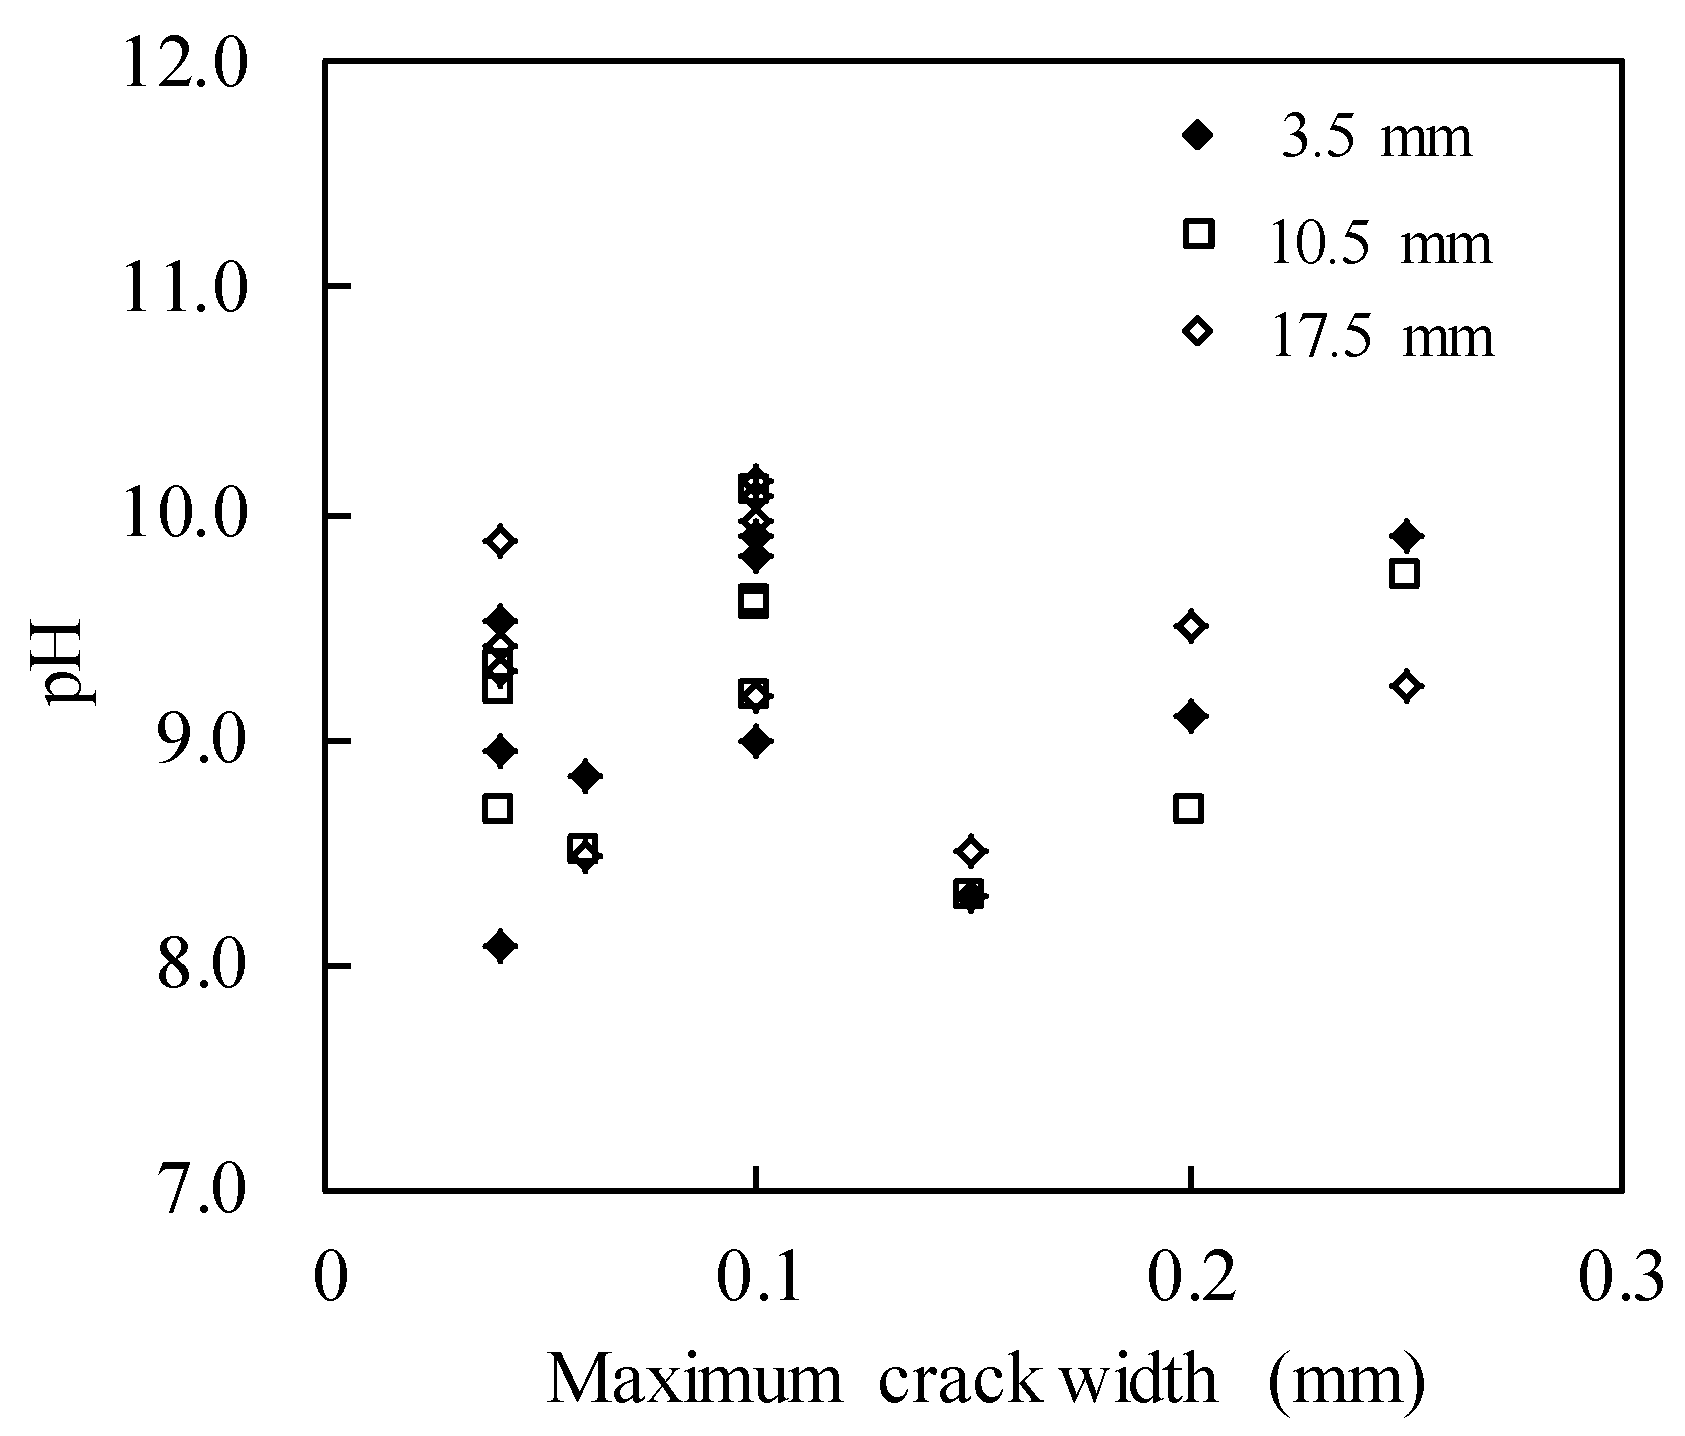
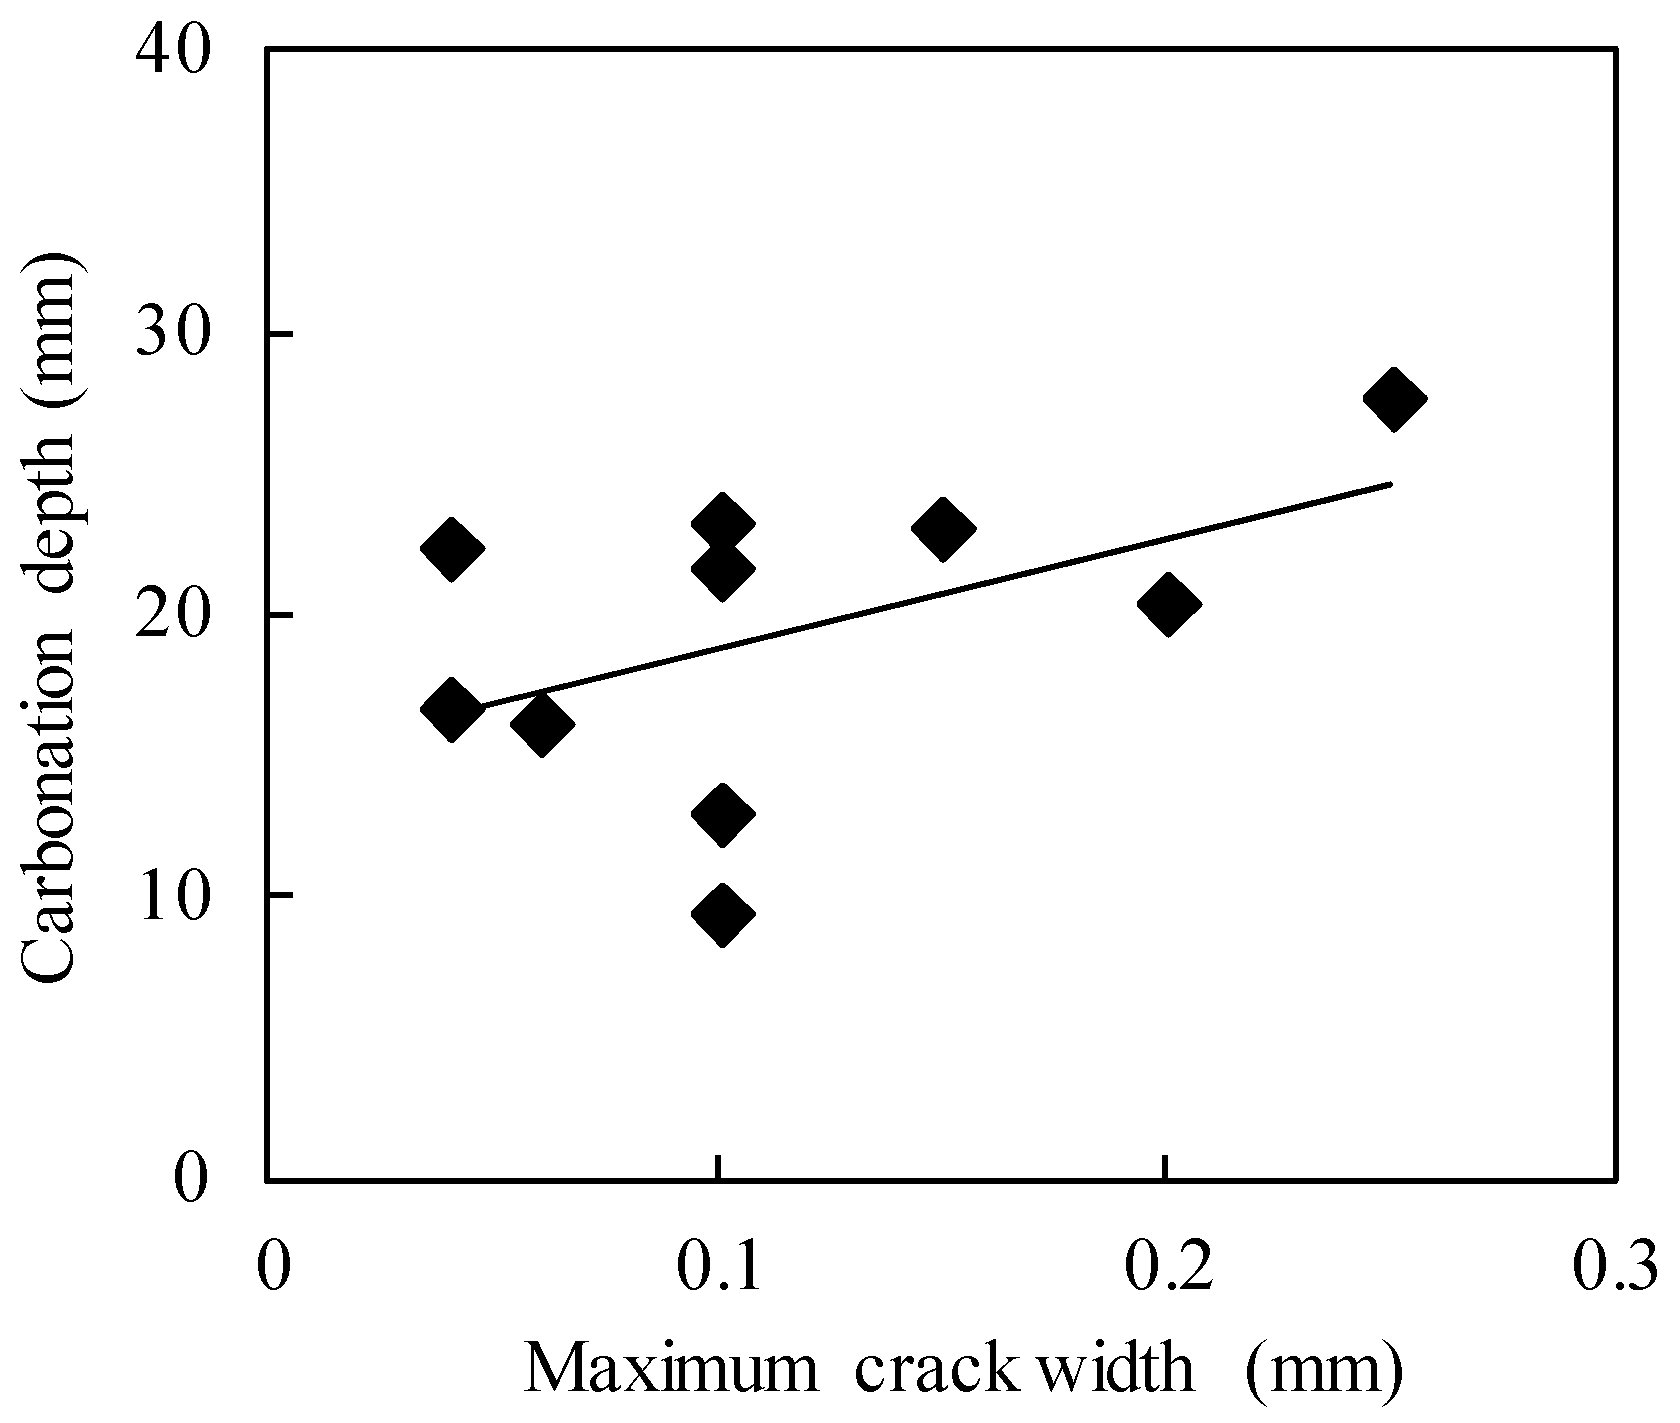
3.5. Variation in pH with Crack Width
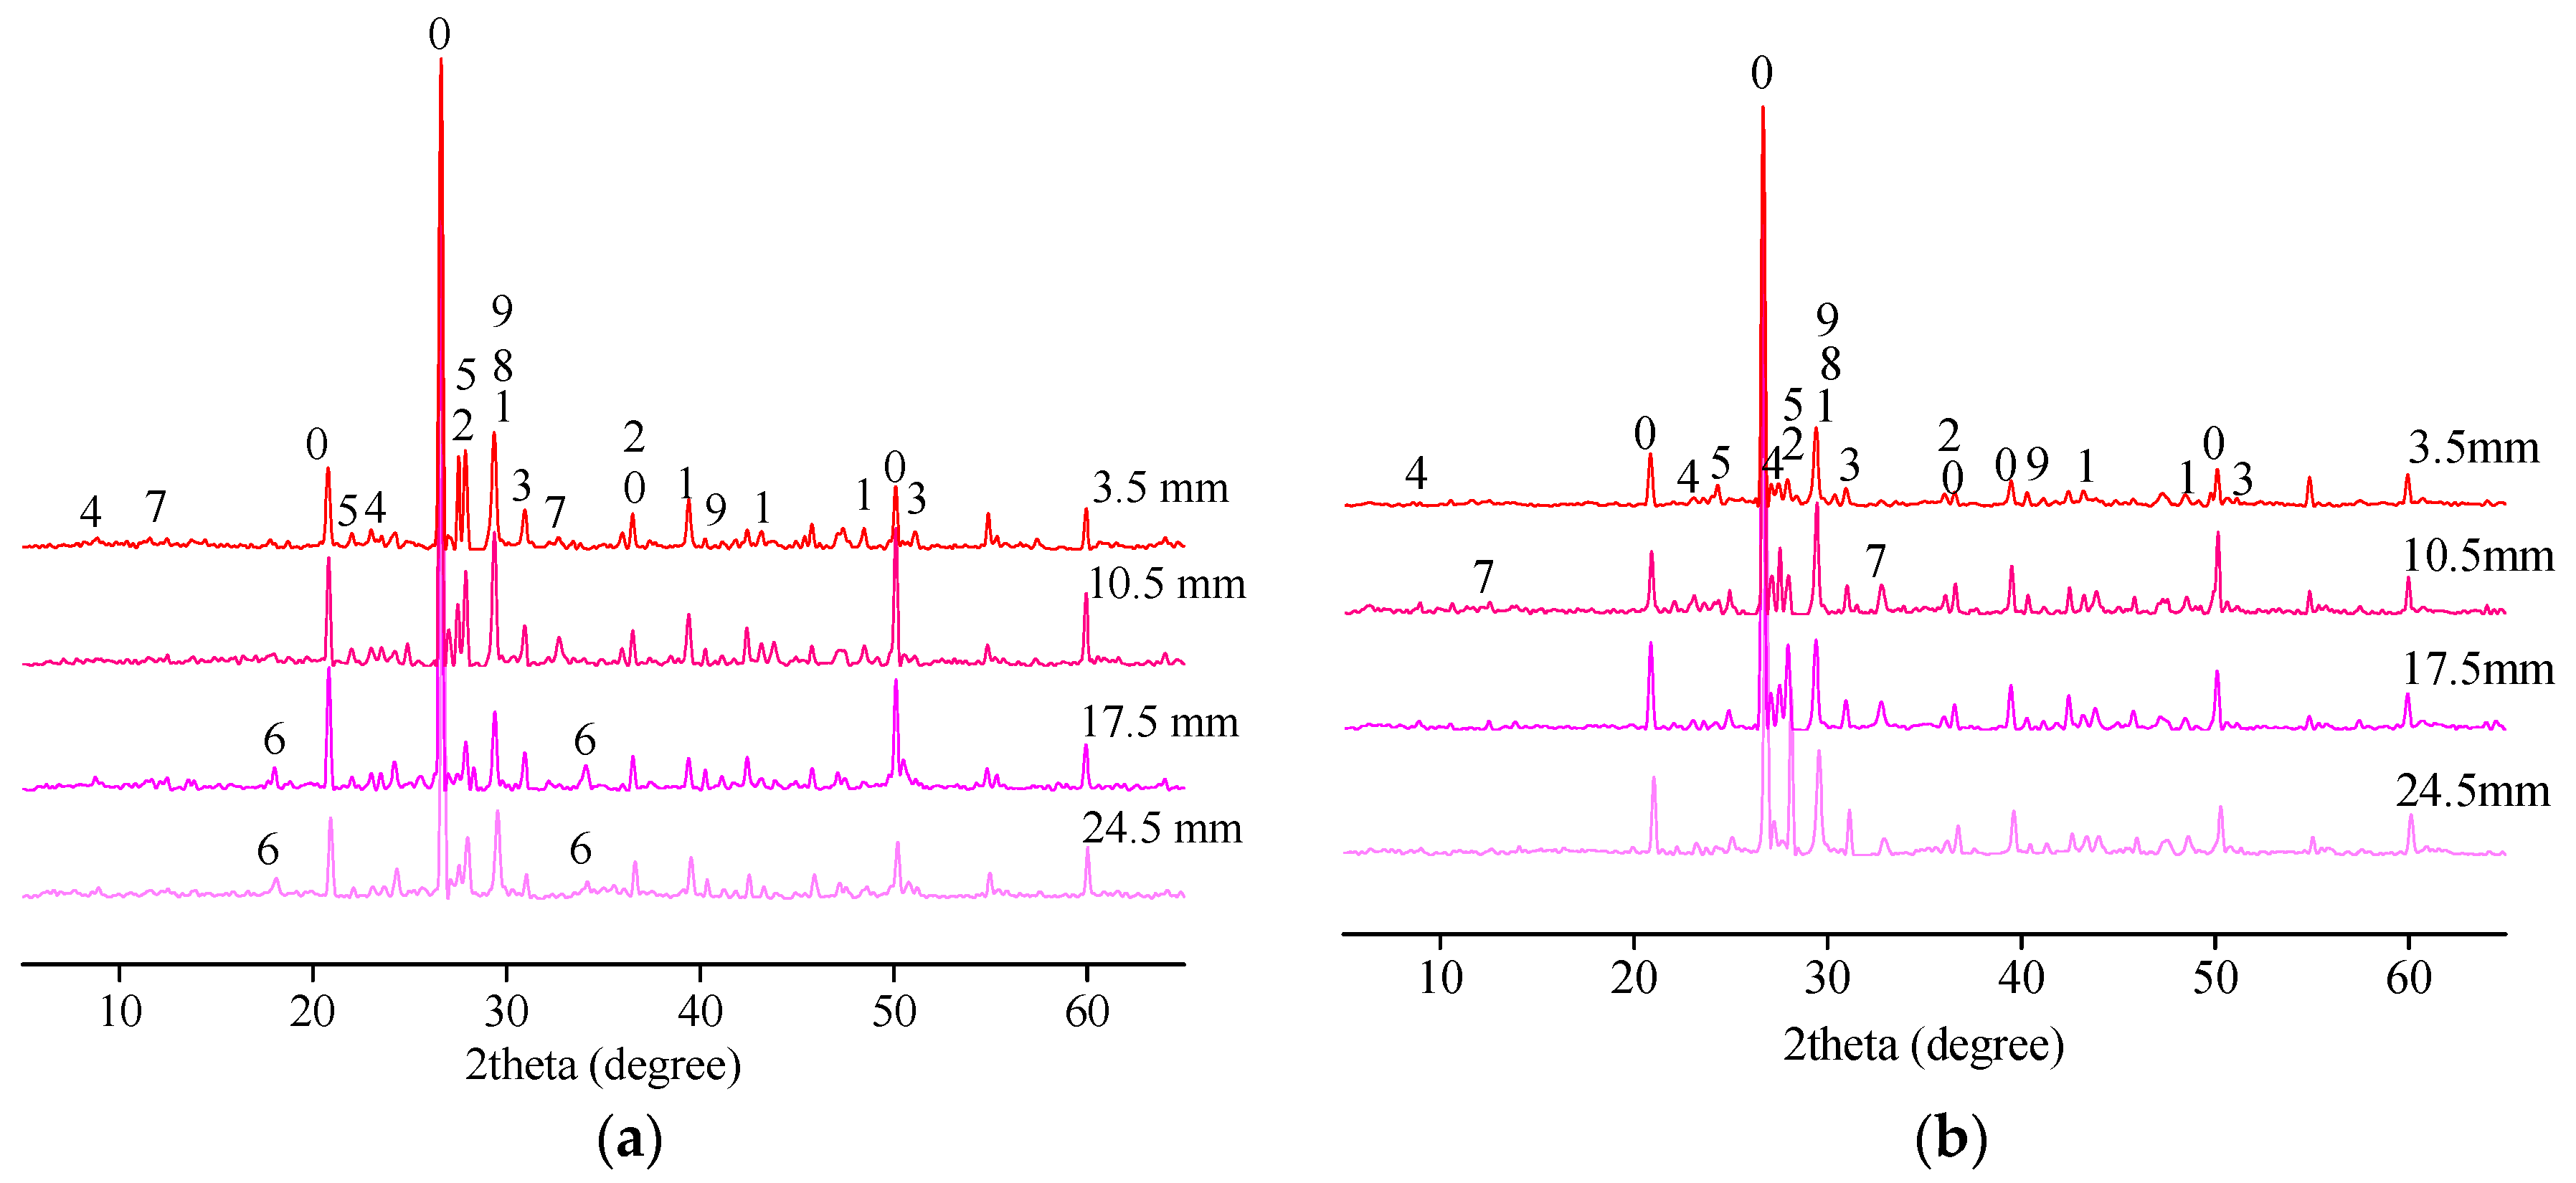
The test results showed that pH was not sensitive to the maximum crack widths at different depths, as shown in Figure 9. Therefore, it is assumed that crack widths have little effect on the variations in pH.
The variation in carbonation depth with maximum crack widths is shown in Figure 10. It can be seen that the carbonation depth increases linearly with increases in maximum crack width. This is because, with the increase in crack widths, the diffusion rate of carbon dioxide in the concrete increases, which results in deeper and rapid penetration of carbonation. This is in agreement with previous test results [24,42,43].

3.6. XRD Analysis

The variation in XRD patterns along the cover depth for uncracked samples with minor and moderate corrosion is similar. Therefore, only the XRD patterns of Sample B6 are shown. For the same reason, only the XRD patterns of a cracked sample with severe corrosion, Sample C1, are given.
The XRD patterns of the samples at different depths are shown in Figure 11. The results indicate that the main phase compositions included quartz, CaCO3, scolecite, dolomite, ettringite, albite, Ca(OH)2, CSH gel, C3S, and C2S.
The XRD patterns of the uncracked Sample B6 at different depths are shown in Figure 11a. No diffraction peaks are shown in Ca(OH)2 at depths of 3.5 mm and 10.5 mm. The corresponding pH values are 8.86 and 9.66. This indicates that carbon dioxide diffusion into the concrete had been fully reacted with Ca(OH)2 to form CaCO3 in the depth of 0–10.5 mm. It can be found that the full carbonation depth determined by the pH was almost equal to the full carbonation depth (10.95 mm) tested with phenolphthalein. The in-situ test results corresponded well with findings obtained by pH tests and XRD analysis.
Weakened Ca(OH)2 peaks began to appear at a depth of 17.5 mm, and the corresponding pH was 11.6. When the depth was greater than 17.5 mm, the diffraction peaks of Ca(OH)2 became higher, and the pH increased to 12.0 at a depth of 24.5 mm. The carbonation depth 10.95 mm of Sample B6 was much smaller than the cover depth 38.49 mm, as shown in Table 1. However, the in-situ test results indicate that the rebar exhibited minor corrosion, as shown in Figure 5b. This indicates that the rebars had begun to corrode when the carbonation depth failed to reach the surface of the rebar; moreover, a semi-carbonated zone existed between the fully carbonated zone and the rebar.
The XRD patterns of the cracked Sample C1 at different depths are shown in Figure 11b. The diffraction peaks of Ca(OH)2 are no longer visible at different depths. The pH at depths of 3.5 mm, 10.5 mm, 17.5 mm, and 24.5 mm are 9.41, 8.94, 9.33, and 9.50, respectively. This indicates that the full carbonation depth had exceeded the cover depth. Thus, the fully carbonated zone determined by the pH was consistent with the in-situ inspection results. The carbonation depth (35.22 mm) of Sample C1 is greater than the cover depth (29.35 mm), as shown in Table 1. The in-situ test results indicate that the rebar exhibits a severe corrosion, as shown in Figure 5d. It could be found that when pH is in a range of 9.0–9.5, the concrete is fully carbonated.

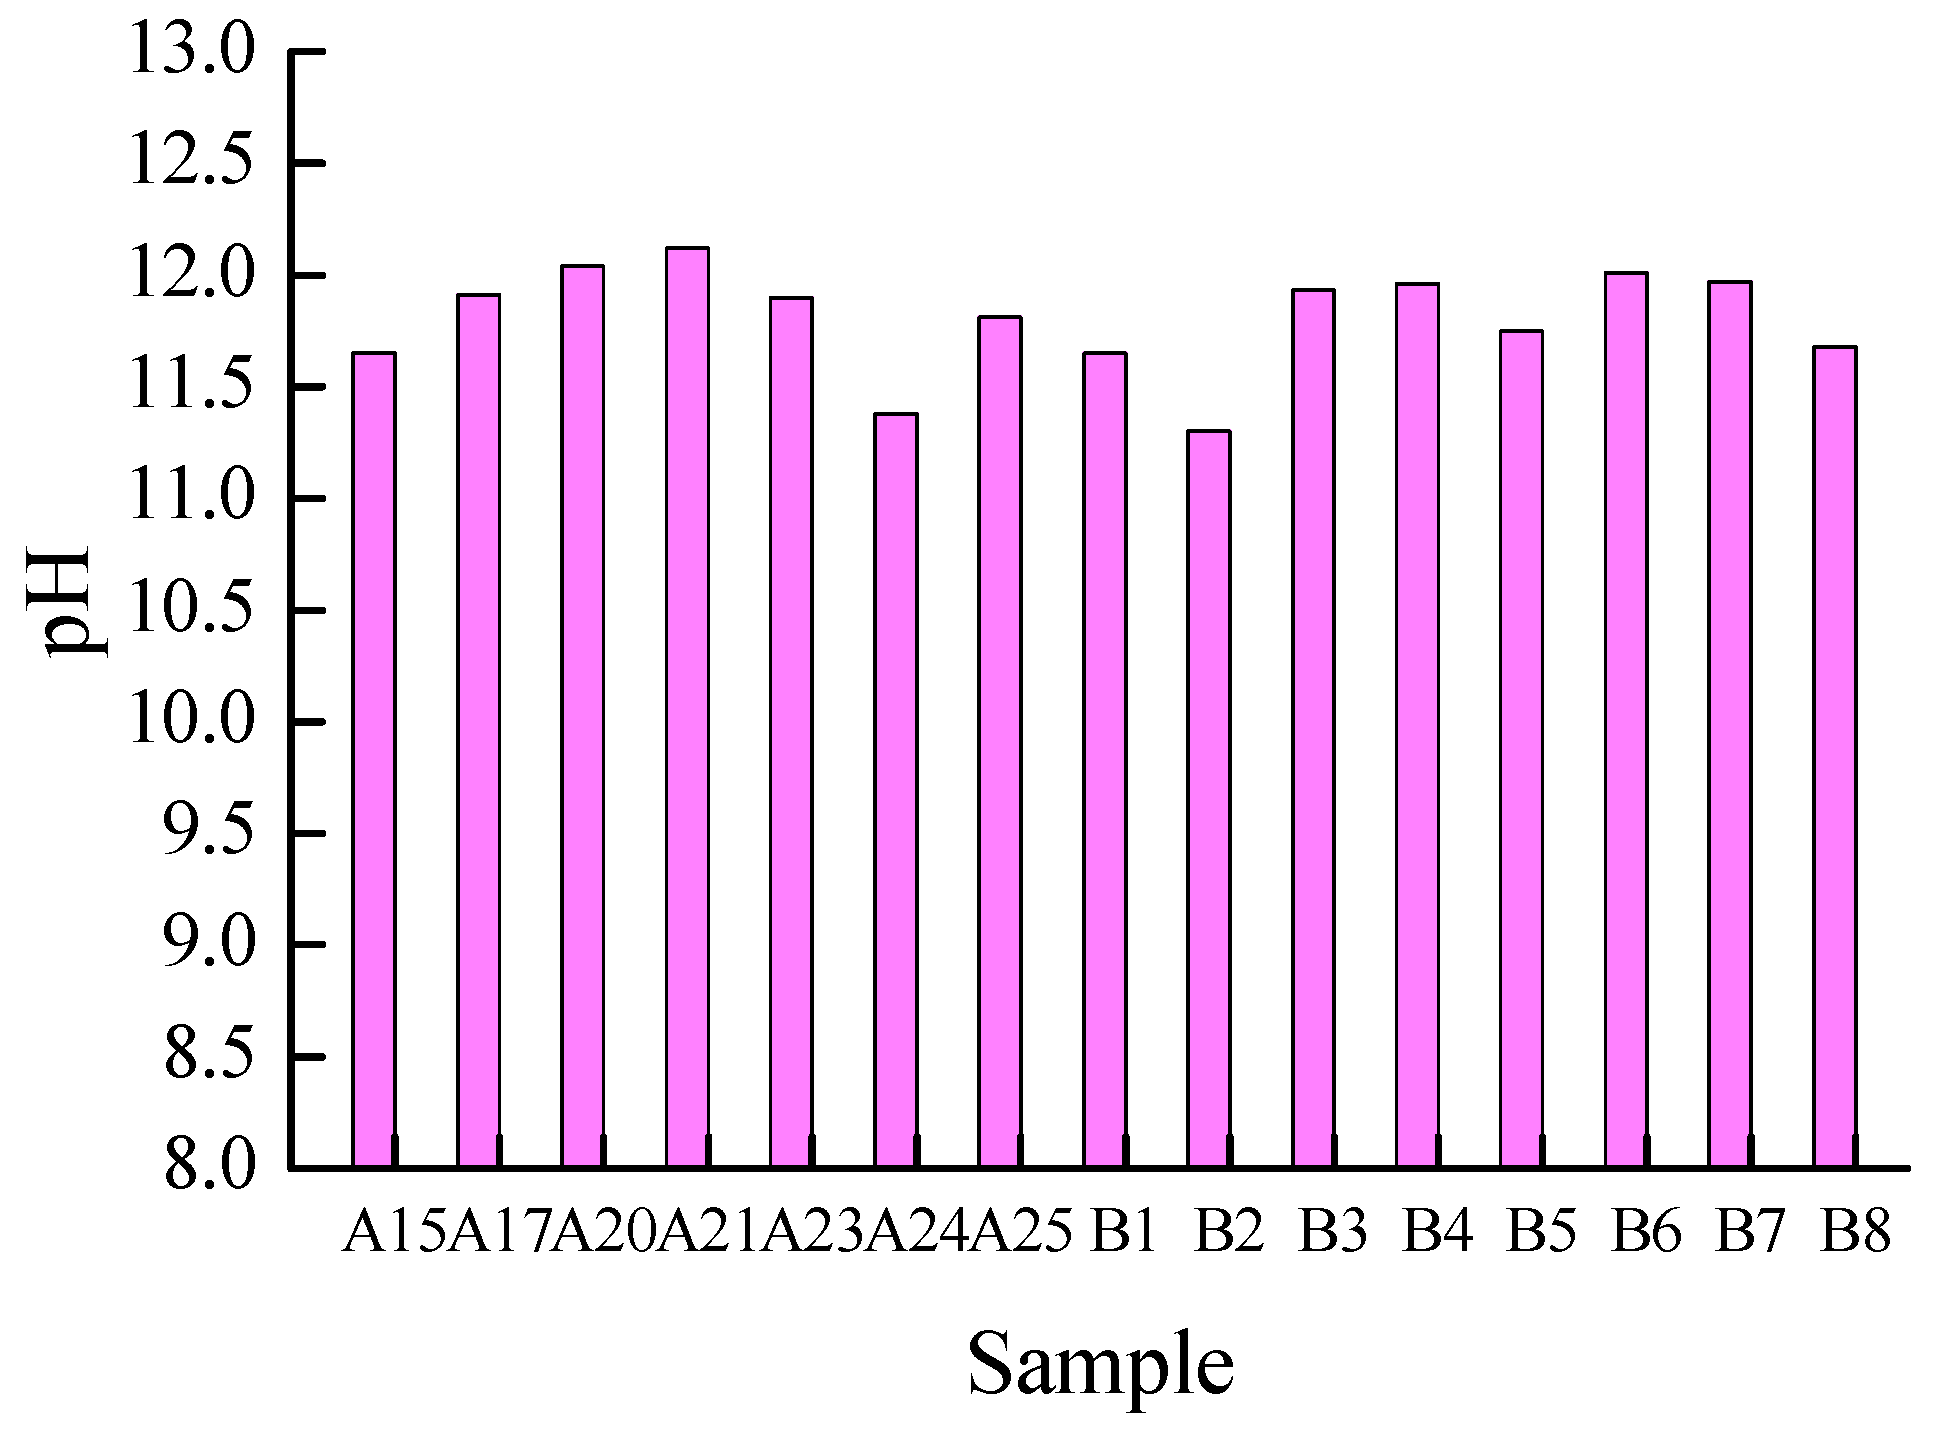
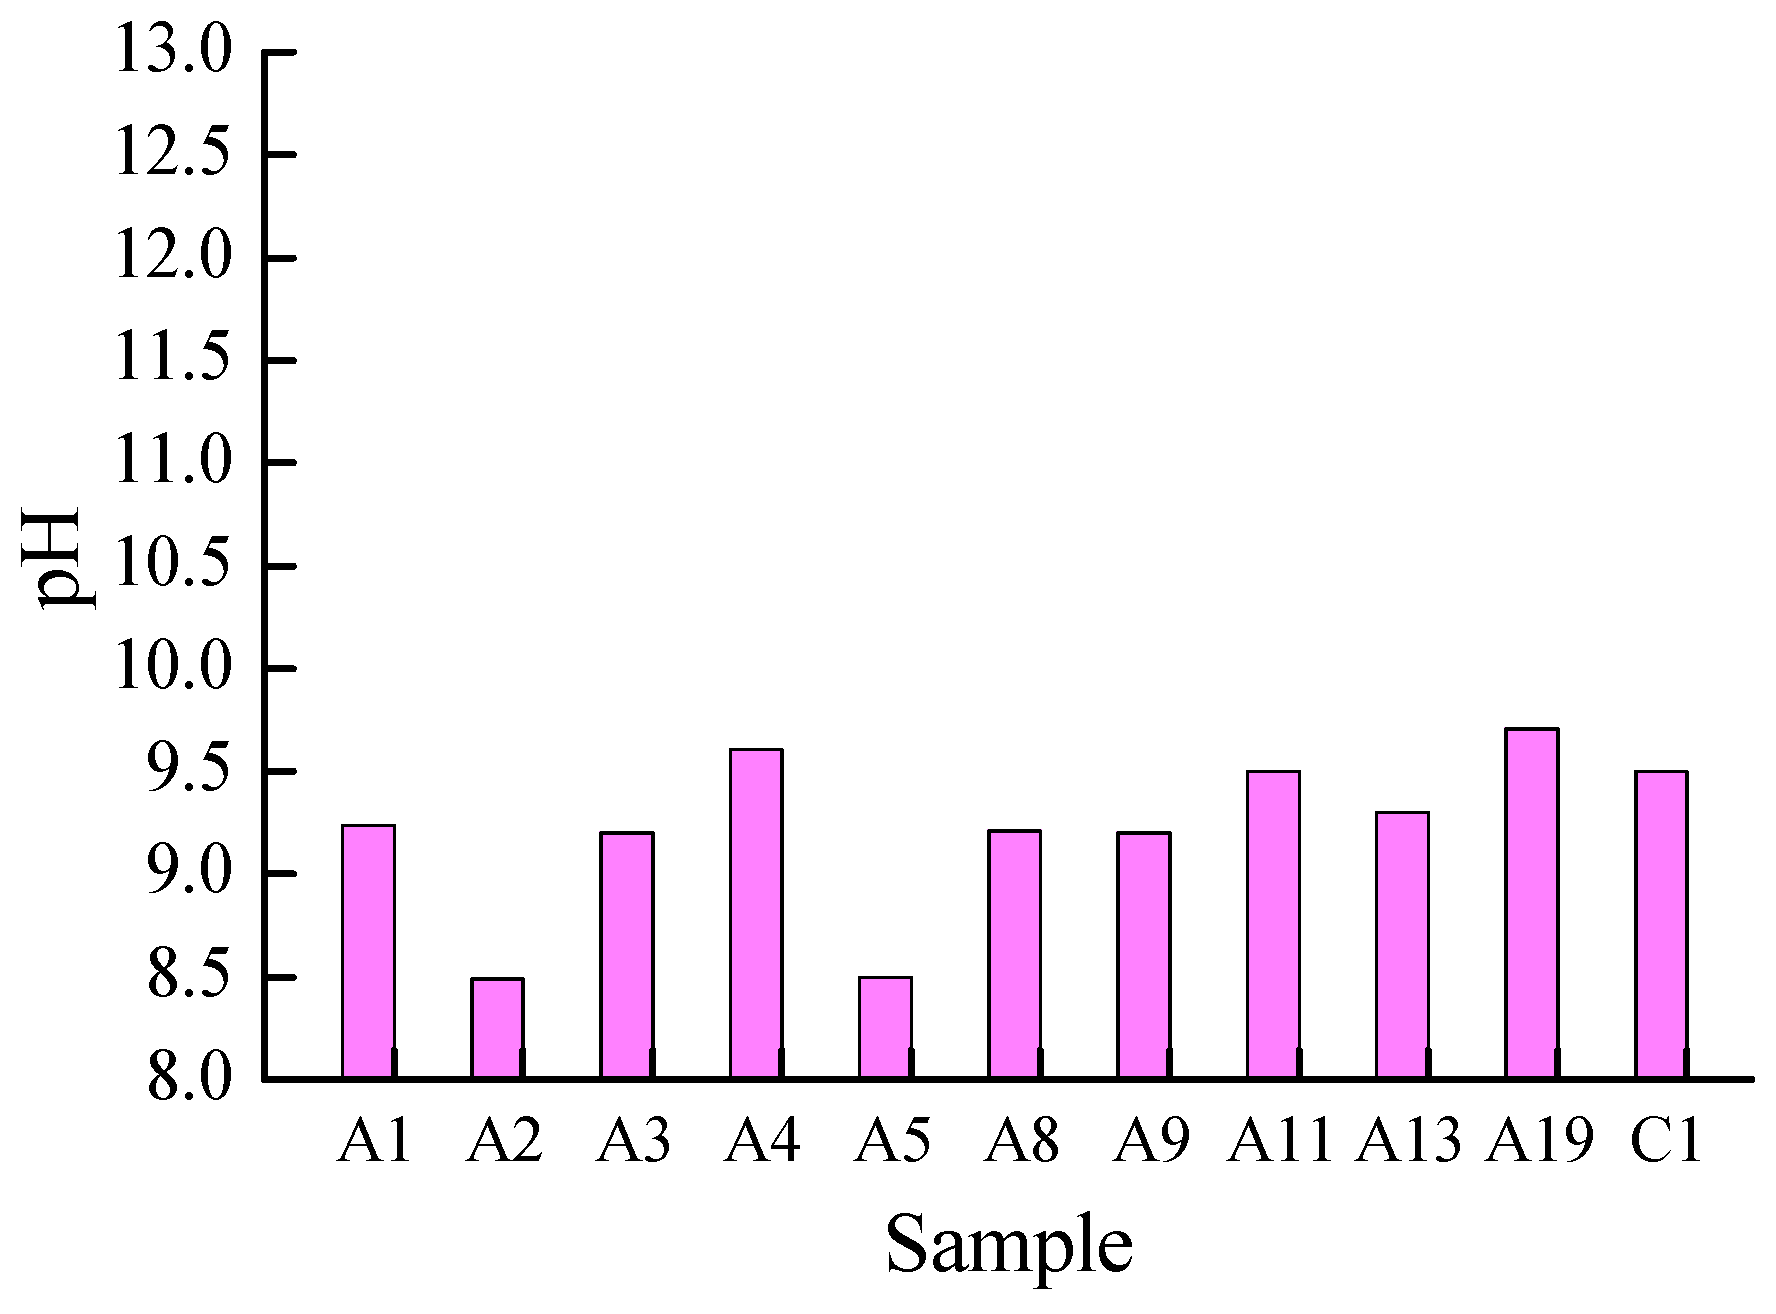
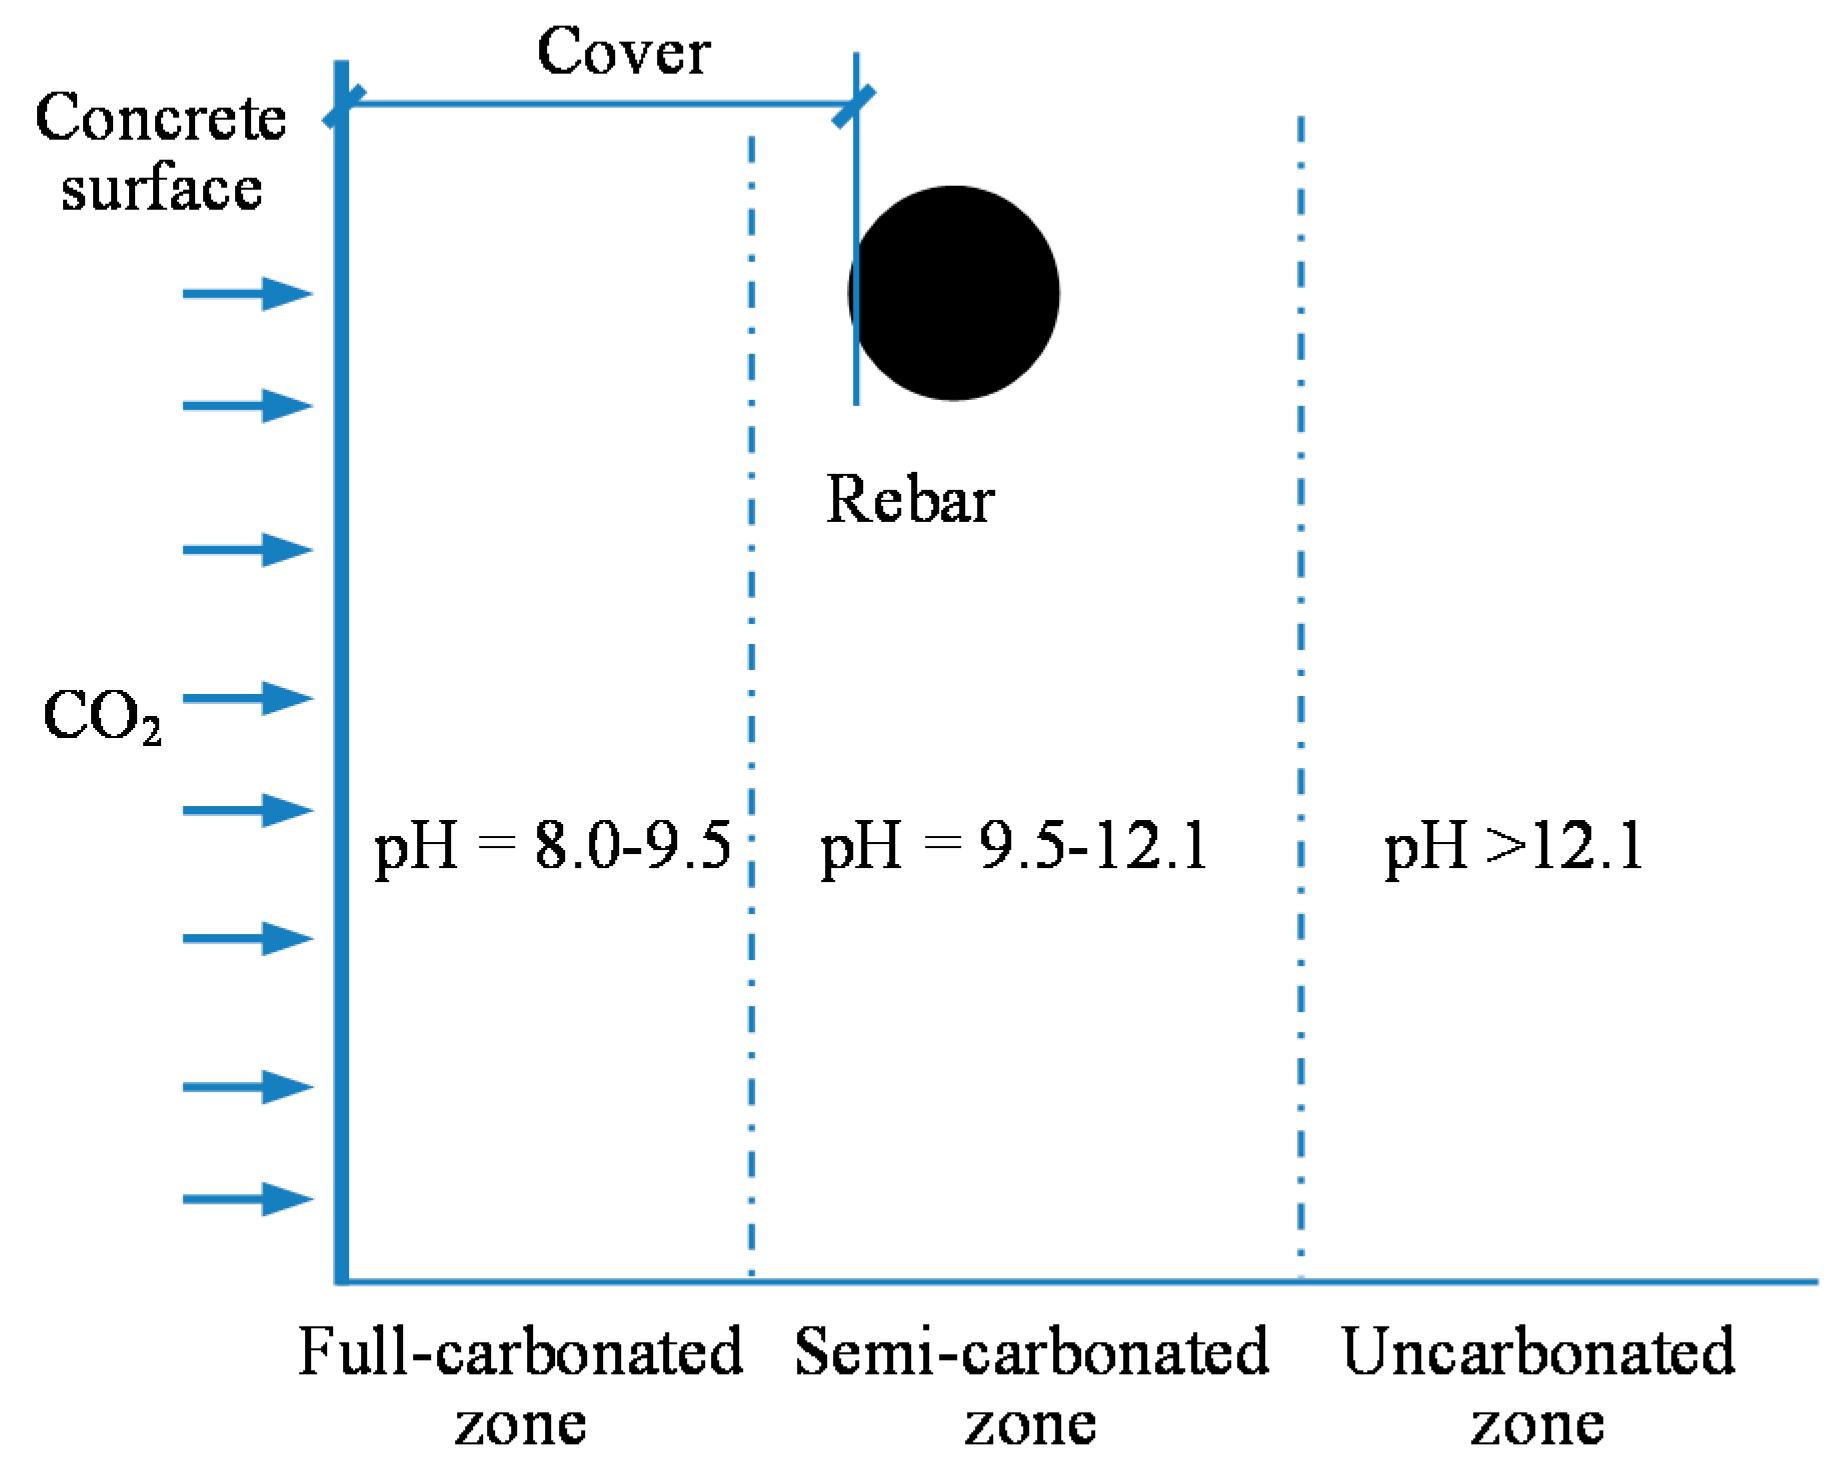
3.7. The pH of Concrete Cover for Corrosion Initiation

The corrosion initiation of the rebar started from the corrosion of the ribs because the carbonation front is always the first to reach the surface of the rib. In this paper, it is argued that the corrosion initiation of the rebar does not show corrosion-induced cracks on the cover, and only the transverse/longitudinal ribs of rebars corroded (Figure 5b). Thus, the pH around a rebar is the pH value for corrosion initiation of rebars embedded in concrete, i.e., the pH of Sample B6 is 12.01.
To determine the pH of concrete cover for the corrosion initiation of rebars embedded in concrete, the same method of analysis as that of Sample B6 in Section 3.3 was used to analyze other uncracked samples with minor corrosion. A combination analysis of in-situ inspection results, the pore solution pH test results, and XRD results were considered. It was found that the corrosion initiation of rebars embedded in concrete can occur when the pH is in the range of 11.3–12.1, as shown in Figure 12.
To obtain the critical pH of the fully carbonated zone, the same analysis procedure as that completed for Sample C1 in Section 3.3 was used to analyze other cracked samples with severe corrosion. The concrete is fully carbonated when the pH value has a pH of 8.0–9.5, as shown in Figure 13. This is in agreement with previous test results [19,44].
The in-situ inspection results indicate that the rebar would begin to corrode when the carbonation depth failed to reach its surface. Variation in pH value in the carbonated concrete cover is shown in Figure 14. The pore solution pH test results and XRD analysis indicate that a semi-carbonated zone exists between the fully carbonated zone and the uncarbonated zone. The semi-carbonated phenomenon is due to the carbonation reaction rate of concrete being lower than the rate of carbon dioxide diffusion.
The pH at the interface of fully carbonated and semi-carbonated zones is considered to be the lower limit of the semi-carbonated zone, and the pH value at the rebar is in the upper pH value limit. Thus, the boundary of the semi-carbonated zone is at pH values ranging from 9.5 to 12.1. This is a little higher than the previous test results from an accelerated carbonation process [45], and its pH of the semi-carbonated zone is in the range of 9.0 and 11.5. This is most likely due to the higher carbonation rates by using a higher carbon dioxide concentration and controlled environment parameters (i.e., temperature, relative humidity (RH)) of accelerated carbonation on concrete [1]. As a result, the currently used carbonation coefficients of concrete in the evaluation of existing buildings, which are mostly established based on experimental results using an accelerated carbonation process, may be overestimated and not suitable for application to naturally carbonated reinforced concrete structures.

4. Conclusions

The in-situ inspection results indicate that the rebar embedded in concrete had begun to corrode when the carbonation depth was almost less than one-third of the cover depth. The initiation of corrosion of rebars embedded in concrete can occur when the pH values was in the range of 11.3–12.1.
The pore solution pH test results and XRD analysis indicate that there is a semi-carbonated zone between the fully carbonated zone and the rebar in the corrosion process induced by carbonation. The pH value of the fully carbonated zone has a pH of 8.0–9.5, and almost no Ca(OH)2 is in the concrete cover. The pH value of the semi-carbonated zone is in the range of 9.5–12.1, and the concrete cover contains both Ca(OH)2 and CaCO3.
The pH values decrease with the increase in concrete compressive strength. Crack widths have little effect on the variations in pH. The carbonation depth increases linearly with increases in crack width.

Acknowledgments

This research project was financially supported by the National Key Research and Development Program of China (Grant No. 2016YFC0701304), the China Postdoctoral Science Foundation (Grant No. 2016M602940XB), the Program for Innovative Research Team in University of Ministry of Education of China (Grant No. IRT17R84), the Program for Scientific Research of Shaanxi Provincial Department of Education (17JK0454), and the Young Scholars Program of Xi’an University of Architecture and Technology (QN1710).

Author Contributions

Ditao Niu and Xiguang Liu conceived and designed the experiments; Xingchen Li and Yao Lv performed the experiments; Xiguang Liu and Qiang Fu analyzed the data; Xiguang Liu wrote the paper.

Conflicts of Interest

The authors declare no conflict of interest.

References

  1. Ashraf, W. Carbonation of cement-based materials: Challenges and opportunities. Constr. Build. Mater. 2016, 120, 558–570. [Google Scholar] [CrossRef]
  2. Ortega, J.; Sánchez, I.; Cabeza, M.; Climent, M. Short-term behavior of slag concretes exposed to a real in situ mediterranean climate environment. Materials 2017, 10, 915. [Google Scholar] [CrossRef] [PubMed]
  3. Chalee, W.; Ausapanit, P.; Jaturapitakkul, C. Utilization of fly ash concrete in marine environment for long term design life analysis. Mater. Des. 2010, 31, 1242–1249. [Google Scholar] [CrossRef]
  4. Ortega, J.; Esteban, M.; Sánchez, I.; Climent, M. Performance of sustainable fly ash and slag cement mortars exposed to simulated and real in situ mediterranean conditions along 90 warm season days. Materials 2017, 10, 1254. [Google Scholar] [CrossRef] [PubMed]
  5. Thomas, M.D.A.; Matthews, J.D. Performance of pfa concrete in a marine environment 10-year results. Cem. Concr. Compos. 2004, 26, 5–20. [Google Scholar] [CrossRef]
  6. Ganjian, E.; Pouya, H.S. The effect of Persian Gulf tidal zone exposure on durability of mixes containing silica fume and blast furnace slag. Constr. Build. Mater. 2009, 23, 644–652. [Google Scholar] [CrossRef]
  7. Ramezanianpour, A.A.; Malhotra, V.M. Effect of curing on the compressive strength, resistance to chloride-ion penetration and porosity of concretes incorporating slag, fly ash or silica fume. Cem. Concr. Compos. 1995, 17, 125–133. [Google Scholar] [CrossRef]
  8. Kim, J.; Han, S.H.; Song, Y.C. Effect of temperature and aging on the mechanical properties of concrete. Cem. Concr. Res. 2002, 32, 1087–1094. [Google Scholar] [CrossRef]
  9. Poupard, O.; L’Hostis, V.; Catinaud, S.; Petre-Lazar, I. Corrosion damage diagnosis of a reinforced concrete beam after 40 years natural exposure in marine environment. Cem. Concr. Res. 2006, 36, 504–520. [Google Scholar] [CrossRef]
  10. Vollpracht, A.; Lothenbach, B.; Snellings, R.; Haufe, J. The pore solution of blended cements: A review. Mater. Struct. 2016, 49, 3341–3367. [Google Scholar] [CrossRef]
  11. Behnood, A.; Van Tittelboom, K.; De Belie, N. Methods for measuring pH in concrete: A review. Constr. Build. Mater. 2016, 105, 176–188. [Google Scholar] [CrossRef]
  12. Plusquellec, G.; Geiker, M.R.; Lindgård, J.; Duchesne, J.; Fournier, B.; De Weerdt, K. Determination of the pH and the free alkali metal content in the pore solution of concrete: Review and experimental comparison. Cem. Concr. Res. 2017, 96, 13–26. [Google Scholar] [CrossRef]
  13. Han, J.; Liu, W.; Wang, S.; Geert, D.S.; Sun, W.; Liang, Y. Carbonation reaction and microstructural changes of metro-tunnel segment concrete coupled with static and fatigue load. J. Mater. Civ. Eng. 2017, 29, 1–11. [Google Scholar] [CrossRef]
  14. Fu, C.; Jin, N.; Ye, H.; Jin, X.; Dai, W. Corrosion characteristics of a 4-year naturally corroded reinforced concrete beam with load-induced transverse cracks. Corros. Sci. 2017, 117, 11–23. [Google Scholar] [CrossRef]
  15. Marques, P.F.; Costa, A. Service life of RC structures: Carbonation induced corrosion. Prescriptive vs. performance-based methodologies. Constr. Build. Mater. 2010, 24, 258–265. [Google Scholar] [CrossRef]
  16. Neves, R.; Branco, F.; de Brito, J. Field assessment of the relationship between natural and accelerated concrete carbonation resistance. Cem. Concr. Compos. 2013, 41, 9–15. [Google Scholar] [CrossRef]
  17. McPolin, D.O.; Basheer, P.A.; Long, A.E. Carbonation and ph in mortars manufactured with supplementary cementitious materials. J. Mater. Civ. Eng. 2009, 21, 217–225. [Google Scholar] [CrossRef]
  18. Pu, Q.; Jiang, L.; Xu, J.; Chu, H.; Xu, Y.; Zhang, Y. Evolution of pH and chemical composition of pore solution in carbonated concrete. Constr. Build. Mater. 2012, 28, 519–524. [Google Scholar] [CrossRef]
  19. Ji, Y.; Wu, M.; Ding, B.; Liu, F.; Gao, F. The experimental investigation of width of semi-carbonation zone in carbonated concrete. Constr. Build. Mater. 2014, 65, 67–75. [Google Scholar] [CrossRef]
  20. Sufian Badar, M.; Kupwade-Patil, K.; Bernal, S.A.; Provis, J.L.; Allouche, E.N. Corrosion of steel bars induced by accelerated carbonation in low and high calcium fly ash geopolymer concretes. Constr. Build. Mater. 2014, 61, 79–89. [Google Scholar] [CrossRef]
  21. Climent, M.A.; Gutiérrez, C. Proof by UV-visible modulated reflectance spectroscopy of the breakdown by carbonation of the passivating layer on iron in alkaline solution. Surf. Sci. 1995, 330, L651–L656. [Google Scholar] [CrossRef]
  22. Sagüés, A.A.; Moreno, E.I.; Andrade, C. Evolution of pH during in-situ leaching in small concrete cavities. Cem. Concr. Res. 1997, 27, 1747–1759. [Google Scholar] [CrossRef]
  23. Li, L.; Sagüés, A.A.; Poor, N. In situ leaching investigation of pH and nitrite concentration in concrete pore solution. Cem. Concr. Res. 1999, 29, 315–321. [Google Scholar] [CrossRef]
  24. Räsänen, V.; Penttala, V. The pH measurement of concrete and smoothing mortar using a concrete powder suspension. Cem. Concr. Res. 2004, 34, 813–820. [Google Scholar] [CrossRef]
  25. Li, L.; Nam, J.; Hartt, W.H. Ex situ leaching measurement of concrete alkalinity. Cem. Concr. Res. 2005, 35, 277–283. [Google Scholar] [CrossRef]
  26. Liu, E.; Ghandehari, M.; Brückner, C.; Khalil, G.; Worlinsky, J.; Jin, W.; Sidelev, A.; Hyland, M.A. Mapping high pH levels in hydrated calcium silicates. Cem. Concr. Res. 2017, 95, 232–239. [Google Scholar] [CrossRef]
  27. Nguyen, T.H.; Venugopala, T.; Chen, S.; Sun, T.; Grattan, K.T.V.; Taylor, S.E.; Muhammed Basheer, P.A.; Long, A.E. Fluorescence based fibre optic pH sensor for the pH 10–13 range suitable for corrosion monitoring in concrete structures. Sens. Actuators B Chem. 2014, 191, 498–507. [Google Scholar] [CrossRef]
  28. Buckley, L.J.; Carter, M.A.; Wilson, M.A.; Scantlebury, J.D. Methods of obtaining pore solution from cement pastes and mortars for chloride analysis. Cem. Concr. Res. 2007, 37, 1544–1550. [Google Scholar] [CrossRef]
  29. Cyr, M.; Rivard, P.; Labrecque, F.; Daidié, A. High-pressure device for fluid extraction from porous materials: Application to cement-based materials. J. Am. Ceram. Soc. 2008, 91, 2653–2658. [Google Scholar] [CrossRef]
  30. Parrott, L.J. A study of carbonation-induced corrosion. Mag. Concr. Res. 1994, 46, 23–28. [Google Scholar] [CrossRef]
  31. Köliö, A.; Pakkala, T.A.; Hohti, H.; Laukkarinen, A.; Lahdensivu, J.; Mattila, J.; Pentti, M. The corrosion rate in reinforced concrete facades exposed to outdoor environment. Mater. Struct. 2017, 50, 1–16. [Google Scholar] [CrossRef]
  32. Valcarce, M.B.; Vázquez, M. Carbon steel passivity examined in solutions with a low degree of carbonation: The effect of chloride and nitrite ions. Mater. Chem. Phys. 2009, 115, 313–321. [Google Scholar] [CrossRef]
  33. Liu, R.; Jiang, L.; Xu, J.; Xiong, C.; Song, Z. Influence of carbonation on chloride-induced reinforcement corrosion in simulated concrete pore solutions. Constr. Build. Mater. 2014, 56, 16–20. [Google Scholar] [CrossRef]
  34. Liu, M.; Cheng, X.; Li, X.; Jin, Z.; Liu, H. Corrosion behavior of Cr modified HRB400 steel rebar in simulated concrete pore solution. Constr. Build. Mater. 2015, 93, 884–890. [Google Scholar] [CrossRef]
  35. McPolin, D.O.; Basheer, P.A.; Long, A.E.; Grattan, K.T.; Sun, T. New test method to obtain pH profiles due to carbonation of concretes containing supplementary cementitious materials. J. Mater. Civ. Eng. 2007, 19, 936–946. [Google Scholar] [CrossRef]
  36. Da Silva, F.G.; Helene, P.; Castro-Borges, P.; Liborio, J.B. Sources of variations when comparing concrete carbonation results. J. Mater. Civ. Eng. 2009, 21, 333–342. [Google Scholar] [CrossRef]
  37. Bernal, S.A.; Provis, J.L.; Brice, D.G.; Kilcullen, A.; Duxson, P.; van Deventer, J.S.J. Accelerated carbonation testing of alkali-activated binders significantly underestimates service life: The role of pore solution chemistry. Cem. Concr. Res. 2012, 42, 1317–1326. [Google Scholar] [CrossRef]
  38. Bernal, S.A.; Provis, J.L.; Mejía De Gutiérrez, R.; van Deventer, J.S.J. Accelerated carbonation testing of alkali-activated slag/metakaolin blended concretes: Effect of exposure conditions. Mater. Struct. 2015, 48, 653–669. [Google Scholar] [CrossRef]
  39. Bernal, S.A.; San Nicolas, R.; Provis, J.L.; Mejía De Gutiérrez, R.; van Deventer, J.S.J. Natural carbonation of aged alkali-activated slag concretes. Mater. Struct. 2014, 47, 693–707. [Google Scholar] [CrossRef]
  40. Xu, H.; Provis, J.L.; van Deventer, J.S.J.; Krivenko, P.V. Characterization of aged slag concretes. ACI Mater. J. 2008, 105, 131–139. [Google Scholar]
  41. Pasupathy, K.; Berndt, M.; Castel, A.; Sanjayan, J.; Pathmanathan, R. Carbonation of a blended slag-fly ash geopolymer concrete in field conditions after 8 years. Constr. Build. Mater. 2016, 125, 661–669. [Google Scholar] [CrossRef]
  42. Sullivan-Green, L.; Hime, W.; Dowding, C. Accelerated protocol for measurement of carbonation through a crack surface. Cem. Concr. Res. 2007, 37, 916–923. [Google Scholar] [CrossRef]
  43. Han, J.; Liu, W.; Wang, S.; Du, D.; Xu, F.; Li, W.; De Schutter, G. Effects of crack and ITZ and aggregate on car-bonation penetration based on 3D micro X-ray CT microstructure evolution. Constr. Build. Mater. 2016, 128, 256–271. [Google Scholar] [CrossRef]
  44. Alahmad, S.; Toumi, A.; Verdier, J.; François, R. Effect of crack opening on carbon dioxide penetration in cracked mortar samples. Mater. Struct. 2009, 42, 559–566. [Google Scholar] [CrossRef]
  45. Chang, C.; Chen, J. The experimental investigation of concrete carbonation depth. Cem. Concr. Res. 2006, 36, 1760–1767. [Google Scholar] [CrossRef]
Figure 1. Schematic diagram of drilling samples of cover concrete.
Applsci 08 00128 g001
Figure 2. Cover depths measurement.
Applsci 08 00128 g002
Figure 3. Concrete pore solution expression apparatus: (a) schematic diagram; (b) extraction on a compression testing machine.
Applsci 08 00128 g003
Figure 4. pH measurement procedure of cover concrete pore solutions: (a) sample of cover concrete after cutting; (b) concrete slices after drying; (c) water spraying; (d) concrete pore solutions expression; (e) pH measurement.
Applsci 08 00128 g004aApplsci 08 00128 g004b
Figure 5. States of columns before and after breaking: (a) uncracked with uncorroded (Sample C2); (b) uncracked with minor corrosion (Sample B6); (c) uncracked with moderate corrosion (Sample A22); (d) cracked with severe corrosion (Sample C1).
Applsci 08 00128 g005aApplsci 08 00128 g005b
Figure 6. Variation in pH along the cover depth: (a) uncracked samples with minor corrosion; (b) uncracked samples with moderate corrosion; (c) cracked samples with severe corrosion.
Applsci 08 00128 g006
Figure 7. Cover depth and carbonation depth: (a) uncracked samples with minor corrosion; (b) uncracked samples with moderate corrosion; (c) cracked samples with severe corrosion.
Applsci 08 00128 g007
Figure 8. Variation in pH with concrete compressive strength: (a) uncracked samples with minor corrosion; (b) uncracked samples with moderate corrosion; (c) cracked samples with severe corrosion.
Applsci 08 00128 g008
Figure 9. Variation in pH with maximum crack width of cracked samples.
Applsci 08 00128 g009
Figure 10. Variation in carbonation depth with maximum crack width.
Applsci 08 00128 g010
Figure 11. XRD patterns of the cover concrete samples at different depths. (a) Sample B6; (b) Sample C1. 0—quartz; 1—CaCO3; 2—scolecite; 3—dolomite; 4—ettringite; 5—albite; 6—Ca(OH)2; 7—CSH gel; 8—C3S; 9—C2S.
Applsci 08 00128 g011
Figure 12. pH for corrosion initiation of rebars embedded in concrete.
Applsci 08 00128 g012
Figure 13. pH of fully carbonated concrete.
Applsci 08 00128 g013
Figure 14. Variation in pH value in the carbonated concrete cover.
Applsci 08 00128 g014
Table 1. In-situ test results of reinforced concrete columns.
Cover SampleCover Depth (mm)Carbonation Depth (mm)Compressive Strength (MPa)wmax (mm)Corrosion Status of Rebars
A123.1427.6455.30.25severe corrosion
A223.6416.0254.40.06severe corrosion
A322.1223.2750.20.10severe corrosion
A427.0021.6745.00.10severe corrosion
A527.0023.0058.00.15severe corrosion
A625.0015.6745.00.00moderate corrosion
A719.468.8555.50.00moderate corrosion
A826.8616.6252.20.04severe corrosion
A919.699.3347.20.10severe corrosion
A1030.5510.5452.20.00moderate corrosion
A1122.5820.3451.30.20severe corrosion
A1223.098.4747.30.00moderate corrosion
A1322.6122.4057.80.04severe corrosion
A1426.5815.9157.10.00moderate corrosion
A1524.854.0348.20.00minor corrosion
A1632.5715.5742.40.00moderate corrosion
A1719.474.3350.20.00minor corrosion
A1822.367.3851.20.00moderate corrosion
A1923.5412.9642.50.10severe corrosion
A2031.7111.5946.00.00minor corrosion
A2138.427.9657.00.00minor corrosion
A2234.719.0842.40.00moderate corrosion
A2322.194.0152.50.00minor corrosion
A2440.8619.1457.00.00minor corrosion
A2534.6515.8452.60.00minor corrosion
B131.176.0247.10.00minor corrosion
B231.497.0353.60.00minor corrosion
B328.308.4447.30.00minor corrosion
B435.809.8944.30.00minor corrosion
B523.118.2446.70.00minor corrosion
B638.4910.9558.30.00minor corrosion
B731.029.3640.50.00minor corrosion
B835.566.1241.00.00minor corrosion
C129.3535.2257.00.04severe corrosion
C228.973.2353.50.00uncorroded

