Article

Experimental Investigation on Seismic Behavior of Steel Truss-RC Column Hybrid Structure with Steel Diagonal Braces

1
School of Civil Engineering, Chang’an University, Xi’an 710061, China
2
School of Civil Engineering, Xi’an University of Science and Technology, Xi’an 710054, China
3
School of Civil Engineering, Xi’an University of Architecture and Technology, Xi’an 710055, China
4
School of Civil Engineering, Chongqing University, Chongqing 400044, China
*
Author to whom correspondence should be addressed.
Submission received: 6 December 2017 / Revised: 8 January 2018 / Accepted: 15 January 2018 / Published: 18 January 2018
(This article belongs to the Section Acoustics and Vibrations)

Abstract

:
This paper aims to provide an experimental support on seismic performance evaluation of the steel braced truss-RC (reinforced concrete) column hybrid structure, which could be applied as the air-cooled supporting structural system in large-capacity thermal power plants located in strong earthquake prone regions. A series of pseudo-dynamic tests (PDTs) and quasi-static tests (QSTs) were performed on a 1/8-scaled sub-structure. The dynamic characteristics, lateral deformation patterns, deterioration behavior, hysteretic behavior and failure mechanisms were investigated. Test results showed that the first vibration mode is torsion, which is caused by the small torsional stiffness of this kind of hybrid structure. The lateral deformation shape is shear mode, and the drift ratio of the structure above the corbel is significantly less than that of the column below the corbel. Earthquake energy is mainly dissipated by the RC pipe columns where cracks mainly occurred at the bottom of column and lower part of corbel. The failure mechanisms were identified indicating that the steel braces improved the global stiffness and modified the load transfer mechanism. This study affirms that the steel braced truss-RC column hybrid structure has the sufficient ductility and good energy dissipation capacity to satisfy the design requirements in high seismic regions.

Graphical Abstract

1. Introduction

Steel-concrete hybrid structures obtained through the combination of structural components made of reinforced concrete, steel and composite steel-concrete have been investigated much in the past two decades [1,2,3]. Through scientific hybridization with different components, more efficient, economical and flexible seismic resistant structural systems can be created. This paper focuses on a peculiar steel-concrete hybrid structure, namely steel truss-RC column hybrid structure, which is a supporting structure to house air-cooled condenser (ACC) in the thermal power plant (TPP). It has been identified as a type of structure suitable for the application of water-saving ACC technology to TPPs. For this kind of structure, the lower parts are an array of large-scale thin-walled RC pipe columns, used to support the upper sub-structures and industrial facilities. The height of column is about 40 ~ 50 m, the diameter is about 4 m, while the thickness of the column is only about 0.4 m. A space steel truss about 4 ~ 8 m-height is supported by the columns, and a range of large-diameter (about 9 m) draught fans are installed inside the space steel truss. On the steel truss platform, a series of metal A-shaped brackets above 10 m-height rest to support the huge-mass industrial units (e.g., air-cooled condensers, exhaust ducts) with approximately 10,000 tons in weight. Despite more or less symmetric floor planning in both horizontal directions, the stiffness and mass are usually unevenly distributed in the vertical direction due to the peculiar characteristics of structural components and industrial requirements. Past studies mainly focused on the ACC technology including experimental investigation, numerical simulation and optimization [4,5,6,7,8,9]. However, the supporting structure of the ACC system was addressed rarely.
In order to apply ACC technology in China, it is necessary to investigate the seismic behavior of the supporting structure for ACC systems because most of the coal-rich but water-shortage areas in China are often located in high seismic regions. In recent years, experimental and numerical investigations on the seismic performance of this supporting structure has been conducted, and the research results showed that the steel truss-RC column hybrid structure is a seismic resistant structural system which can be applied in earthquake prone zones [10,11]. However, with the increasing of unit capacity of TPPs, the height and span of platform will be much larger, and the load gets much heavier. The traditional structural type barely satisfy the seismic demand in high intensity seismic regions. It is urgent to propose a new supporting structure for the ACC system which should have more ductile seismic capacity.
Steel braces have been identified as one kind of effective components to improve the seismic capacity of steel, RC and some other structures [12,13,14,15]. In these references, a new supporting structure consisting of steel truss-RC column with steel diagonal braces referred to be as steel braced truss-RC column hybrid structure is proposed, as shown in Figure 1. In this study, a range of pseudo-dynamic tests (PDTs) and quasi-static tests (QSTs) on a 1/8 scaled sub-structure were conducted to evaluate the seismic performance of the steel braced truss-RC column hybrid structural system. The influences of steel diagonal braces on failure mechanisms were also investigated. This study is expected to explicitly support the seismic design of the steel truss-RC column hybrid structure with steel diagonal braces.

2. Experimental Program

2.1. Prototype Building and Scaled Sub-Structure

The prototype building is assumed to be located in a high seismic zone with a 8-degree seismic design intensity in China. The corresponding design peak ground acceleration (PGA) value of the design earthquake with a 10% probability of exceedance in 50 years equals to 0.20 g. The site condition is site-class 2. According to the China seismic design code [16], the structure should satisfy the seismic demands under three seismic hazard levels, namely, minor earthquake with 63.3% probability of exceedance in 50 years (Level 1), moderate earthquake with 10% probability of exceedance in 50 years (Level 2) and major earthquake with 2% probability of exceedance in 50 years (Level 3). The structure should keep elastic under the minor earthquake (Level 1), should not collapse under the major earthquake (Level 3), and should be in use after repairment under the moderate earthquake (Level 2). The corresponding peak ground acceleration (PGA) values of the minor earthquake and major earthquake are 0.10 g and 0.40 g, respectively. The main dimensions of the building are shown in Table 1.
A sub-structure was selected from the prototype building to fabricate the scaled specimen, as shown in Figure 2. Due to restraint of the laboratory space, the scale factor for length was determined as 1/8. Table 2 shows the typical scale factors for the specimen, which were obtained by the principle of dimensional analysis [17]. Additional masses were added on the A-type brackets by 12 pieces of concrete slabs to accommodate the vertical loads which were generated by the large industrial facilities.

2.2. Test Specimen and Setup

Figure 3 shows the column layout, fabricated specimen and elevation view of the specimen with loading facilities, respectively. As shown in Figure 3c, two hydraulic actuators were fixed to the reaction wall at the middle part of steel truss platform (6.563 m) and the top of A-shaped bracket (8.106 m), respectively. Displacement meters (e.g., DM-1) were laterally installed at the top of A-shaped bracket, middle part of steel truss, corbel, middle part of column and ground beam to record the lateral displacements.
Figure 4 shows sketches of construction measures of the brace-to-truss connection and the brace-to-column connection. Figure 5 shows the sectional properties and reinforcements of RC pipe columns. Fifteen 10-mm diameter longitudinal steel rebar evenly distributed in the annular section of column. 8-mm diameter steel rebar was selected as stirrups and they were distributed along the full height of column with 150-mm spacing. In order to avoid the failure of corbel ahead of the column body, reinforcement cage with a large amount of steel rebar was used to strengthen the corbel, as shown in Figure 5d.

2.3. Material Properties

The section dimensions and actual strengths of materials including the steel rebar, steel tubes and concrete are provided in Table 3. Q235 grade steel with the nominal yield strength of 235 MPa was used for the steel truss, A-shaped brackets and diagonal braces. C45 grade concrete with the nominal compressive cube strength of 45 MPa was used for the pipe columns. The average compressive strength of concrete was obtained through compressive test of concrete cubes with 150 mm in side length.

2.4. PDT and QST Programs

PDT method has been widely used to predict the seismic resistant capacity of structures subjected to earthquake waves. During the online PDT procedure, the Newmark-β method was adopted to calculate the input force provided by electro-hydraulic actuators. The dynamic equation can be expressed as follows:
M X + C X . + R = M a g
where ag is the input earthquake acceleration, M is the mass matric, C is the damping matrix, X and X . are respectively the acceleration response and velocity response, R is the restoring force obtained from the hydraulic actuators. The effect of damping on the seismic response can be ignored since the input velocity of PDT is very small. Therefore, the base shear force method is utilized to calculate the restoring force of the primary actuator as follows:
R i = ( F i u i F i ) V B
where VB is the base shear force, Fi is the exterior force applied at i-th floor, ui is the modal displacement at i-th floor. Figure 6 shows the schematic configuration on the framework employed in the PDTs.
The initial 8 s of El-Centro (NS) record was selected as the input ground motion for its ample spectral components and adaptability to the sites. The scaled duration and time interval of the ground motion were respectively 2.8 s and 0.0035 s, which were obtained by a time scaling factor of 1/ 8 for the original record. The specimen was subjected to a sequence of seven PGAs of 0.05, 0.10, 0.20, 0.30, 0.40, 0.60 and 0.80 g to simulate different seismic intensities. Besides, in order to investigate the changing rules of dynamic characteristics with the increase of PGA, free vibration with duration of 1.75 s was added for each loading case. Finally, each PGA level was loaded by 1300 steps (2.8 s) and subsequent 500 steps (1.75 s).
The loading capacities of the two actuators at top of A-shaped bracket and middle part of steel truss are both 1000 kN. The mass matrix of specimen at each position of the load actuator was derived as follows:
M = ( m 1 m 2 ) = ( 12470 16800 ) kg .
Dynamic characteristics tests were carried out through free vibrations before connecting the hydraulic actuators to the specimen. And the obtained first mode of natural vibration was used as the basic displacement mode as follows:
φ 1 = { 1 0.955 } T
The lower actuator located in the middle part of steel truss was set as the main control point, since the stiffness is larger than other positions. The loading ratio between the two actuators was set based on the first fundamental mode of specimen. It was derived by the first mode vibration and mass matrix as follows:
F = { F 1 : F 2 } = M × φ = { 1 : 1.28 }
After the final PDT case with PGA of 0.8 g, cyclic QST was conducted by controlling the amplitude of the roof displacements in cooperation with China specification for seismic test of building [18]. The loading ratio between the two actuators was same with PDTs. Figure 7 shows the cyclic loading protocol. First, each displacement level has one cycle at amplitude of 10, 20, 30, 40, 50, 60, 70 mm. Then, each displacement cycle was repeated three times at amplitude of 80, 90, 110, 130, 150, 170, 190 mm. The test is terminated when the lateral force decreased below 85% of the maximum load.

3. Experimental Results

3.1. Dynamic Characteristics

Dynamic characteristics were tested through free vibrations excited by the artificial pulse method. Table 4 provides the natural periods and the associated vibration modes. The first fundamental period was 0.319 s and the corresponding vibration mode was torsion, as shown in Figure 8. This was due to the special structural pattern, resulting in the small torsional stiffness. For this kind of hybrid structure, although the plan layouts are rather regular and symmetric, as shown in Figure 2, the stiffness and mass mainly distribute on the upper part of the structure in the vertical direction, easily generate the torsional effect. In addition, it was found that the torsion-translation period ratio (the ratio for the period of first torsion mode to that of first translation mode) is about 1.003, which was larger than 0.85. According to the Chinese seismic design code [16], the period ratio between the first torsional mode and the first translation mode should not be larger than 0.85 so as to prevent excessive structural torsion. This indicated that the torsion effect should not be neglected in the design of this kind of hybrid structure.

3.2. PDT Results

3.2.1. Hysteretic Curves and Drift Time History Responses

Figure 9 presents the hysteretic curves for the base shear force versus the roof drift ratio subjected to incremental PGAs. Figure 10 presents the roof drift ratio time-histories of the specimen subjected to the incremental PGAs. As shown in Figure 9, the initial and unloading stiffness of the specimen progressively decreased with the increase of PGA. Correspondingly, as shown in Figure 10, the occurring moment of peak drift response was delayed with the increase of PGA due to the stiffness deterioration.

3.2.2. Characteristic of Lateral Deformation

The overall lateral deformation mode and distribution characteristics of drift ratio along the structural height are important to the seismic behavior of the structural system. Figure 11a shows the maximum lateral displacement curves under different excitation. It can be found that the lateral deformation pattern of the specimen belongs to shear mode. Moreover, the figure clearly shows that the lateral displacement curve was divided into two significant part at the corbel (5.125 m). This was due to the rigid-upper-flexible-bottom characteristics of the vertical stiffness distribution condition that the stiffness of the upper part of the corbel is much larger that of the pipe columns.
Figure 11b shows the maximum drift ratio versus the specimen height. It was found that drift concentration of the specimen occurred on the column, where the peak of maximum drift ratio occurred at the height of corbel (5.125 m) after PGA came up to 0.30 g.

3.2.3. Deterioration Behavior

Strength and stiffness deterioration has fatal influence on the seismic capacity and collapse behavior of structural systems [19]. The secant stiffness Ki used to indicate the overall stiffness of the specimen is calculated by the following formula [20]:
K i = | + F i | + | F i | | + X i | + | X i |
where +Fi and −Fi are respectively the peak load under the i-th loading case of the PDTs in two opposite directions; +Xi and −Xi are respectively the displacement corresponding to the peak load under the i-th loading case of the PDTs in two opposite directions.
In order to evaluate the stiffness deterioration of the specimen with the increase of PGA, the relative stiffness ratio kre is defined as:
k re = K i K 1 × 100 %
where Ki is the secant stiffness of the specimen under each loading case of the PDTs calculated by Equation (6); K1 is the secant stiffness of the specimen under the first loading case when PGA equaled to 0.05 g. Specially, when PGA is 0.05 g, the relative stiffness ratio kre is 100%.
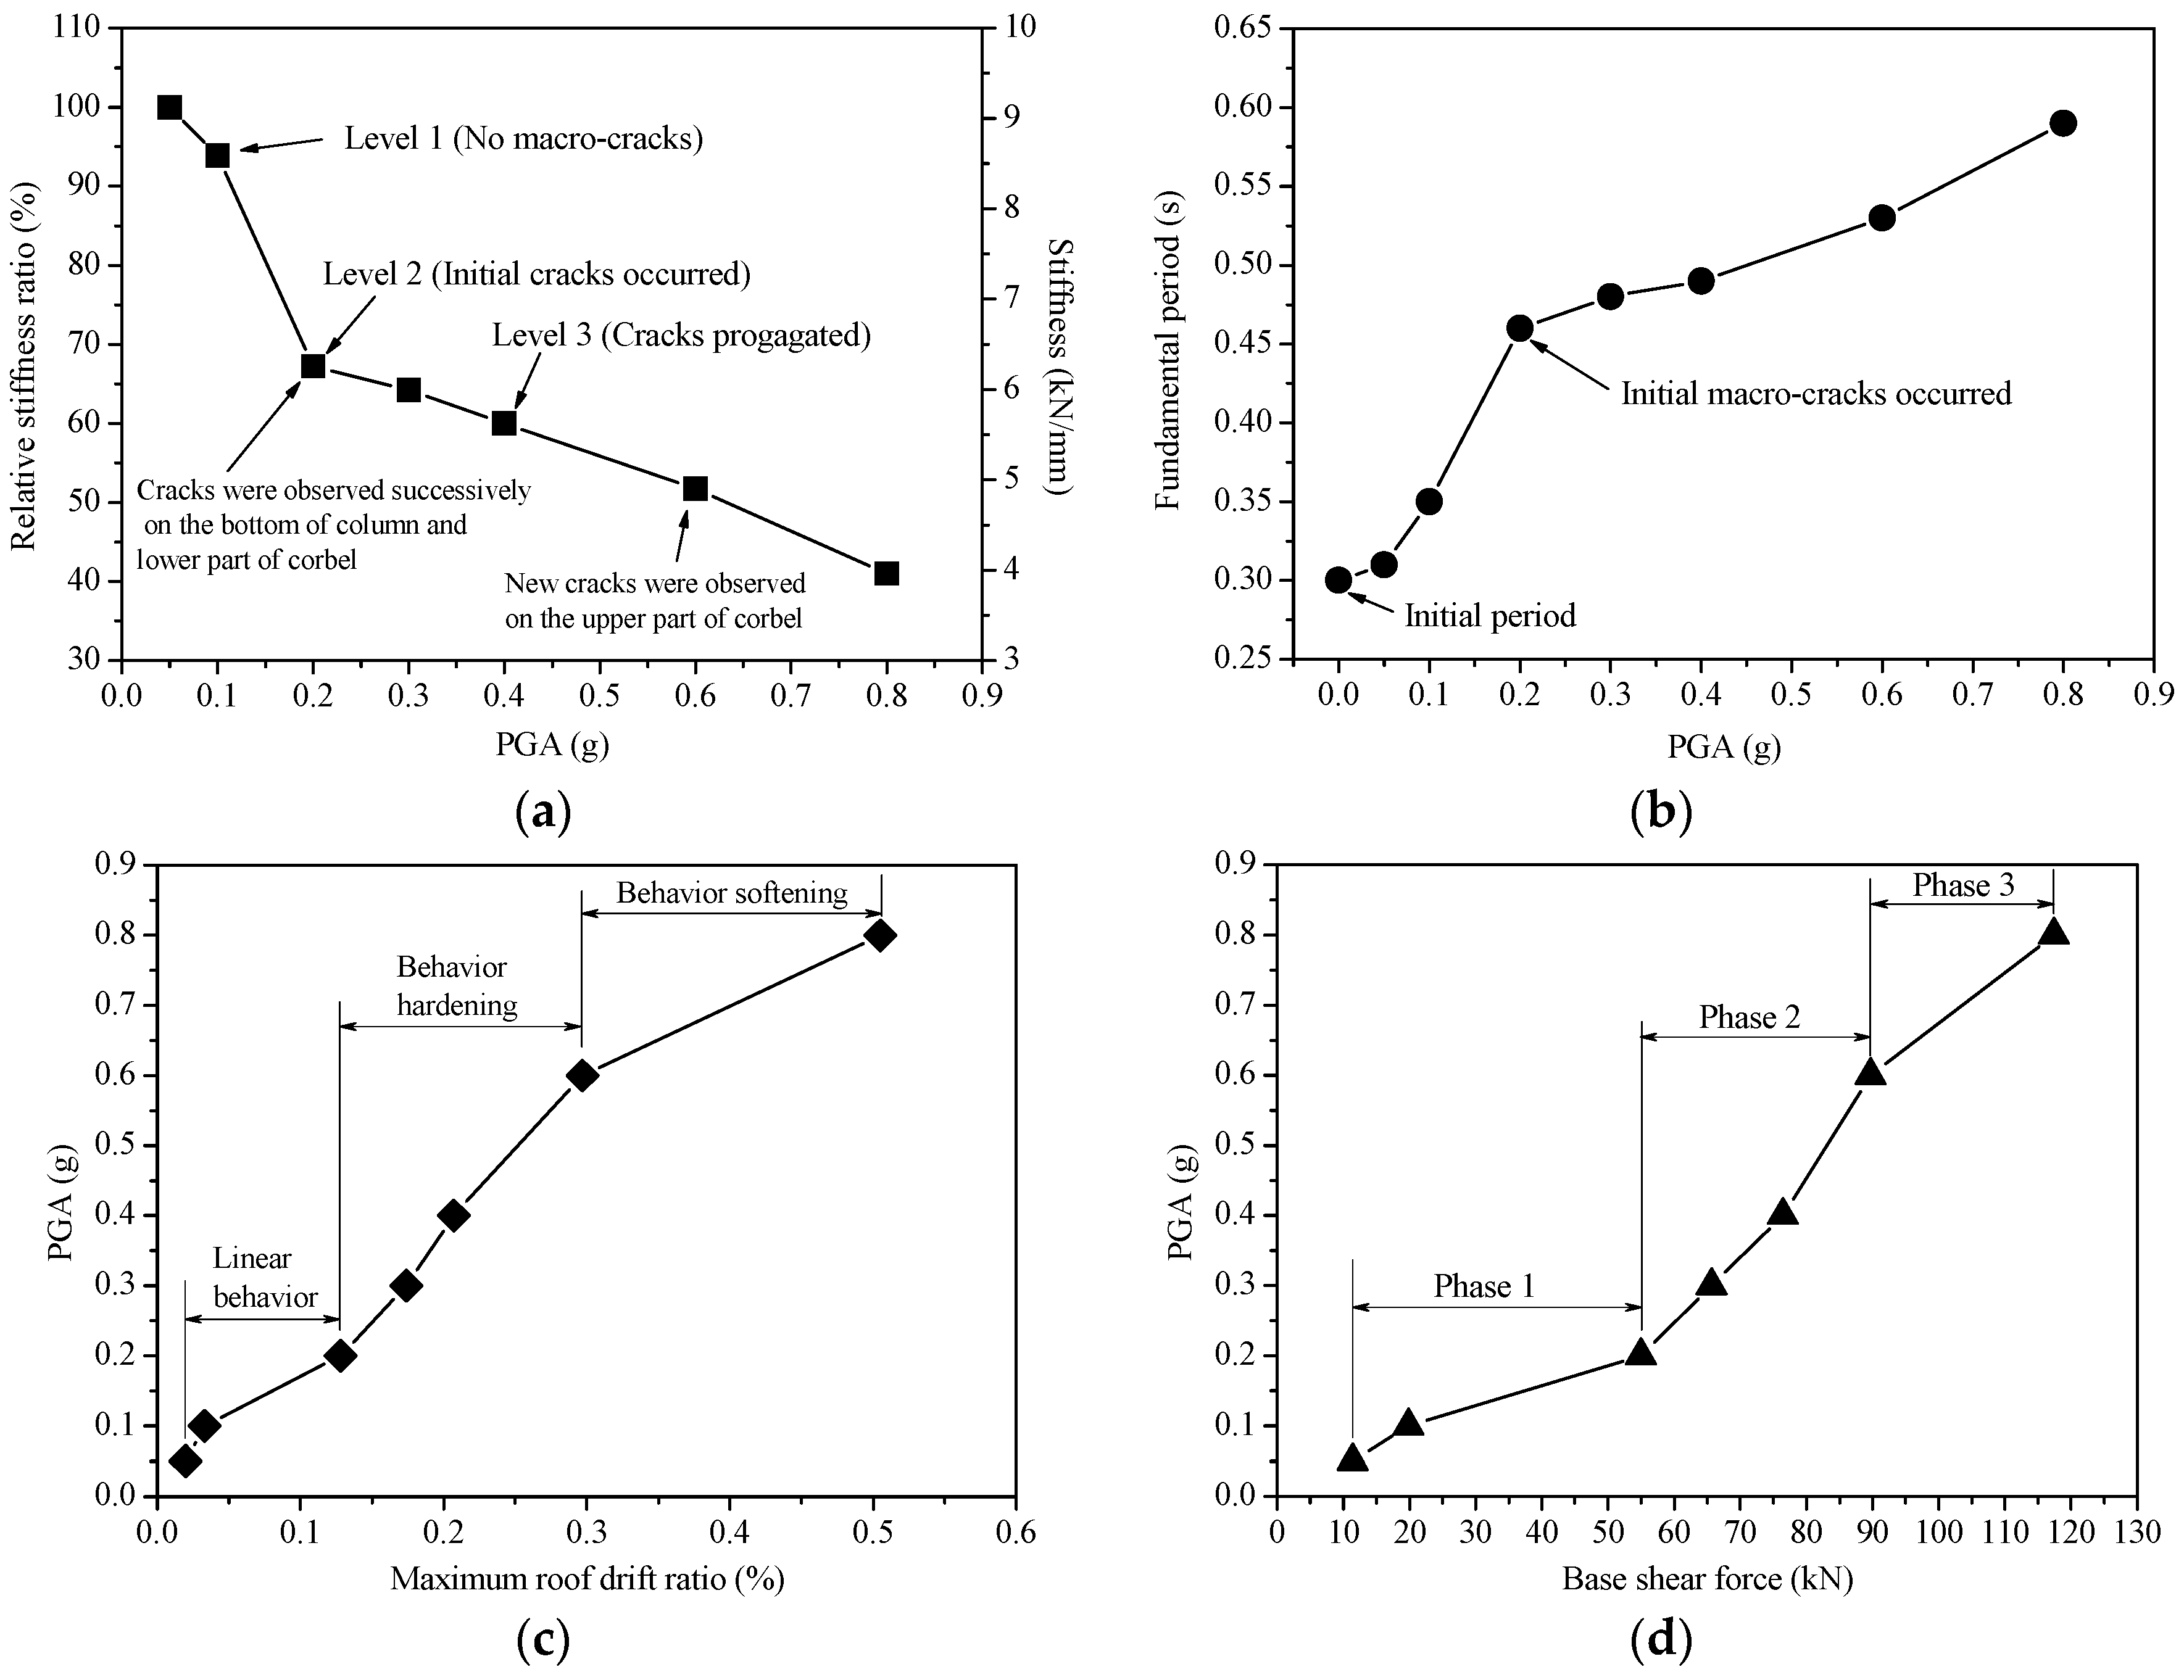
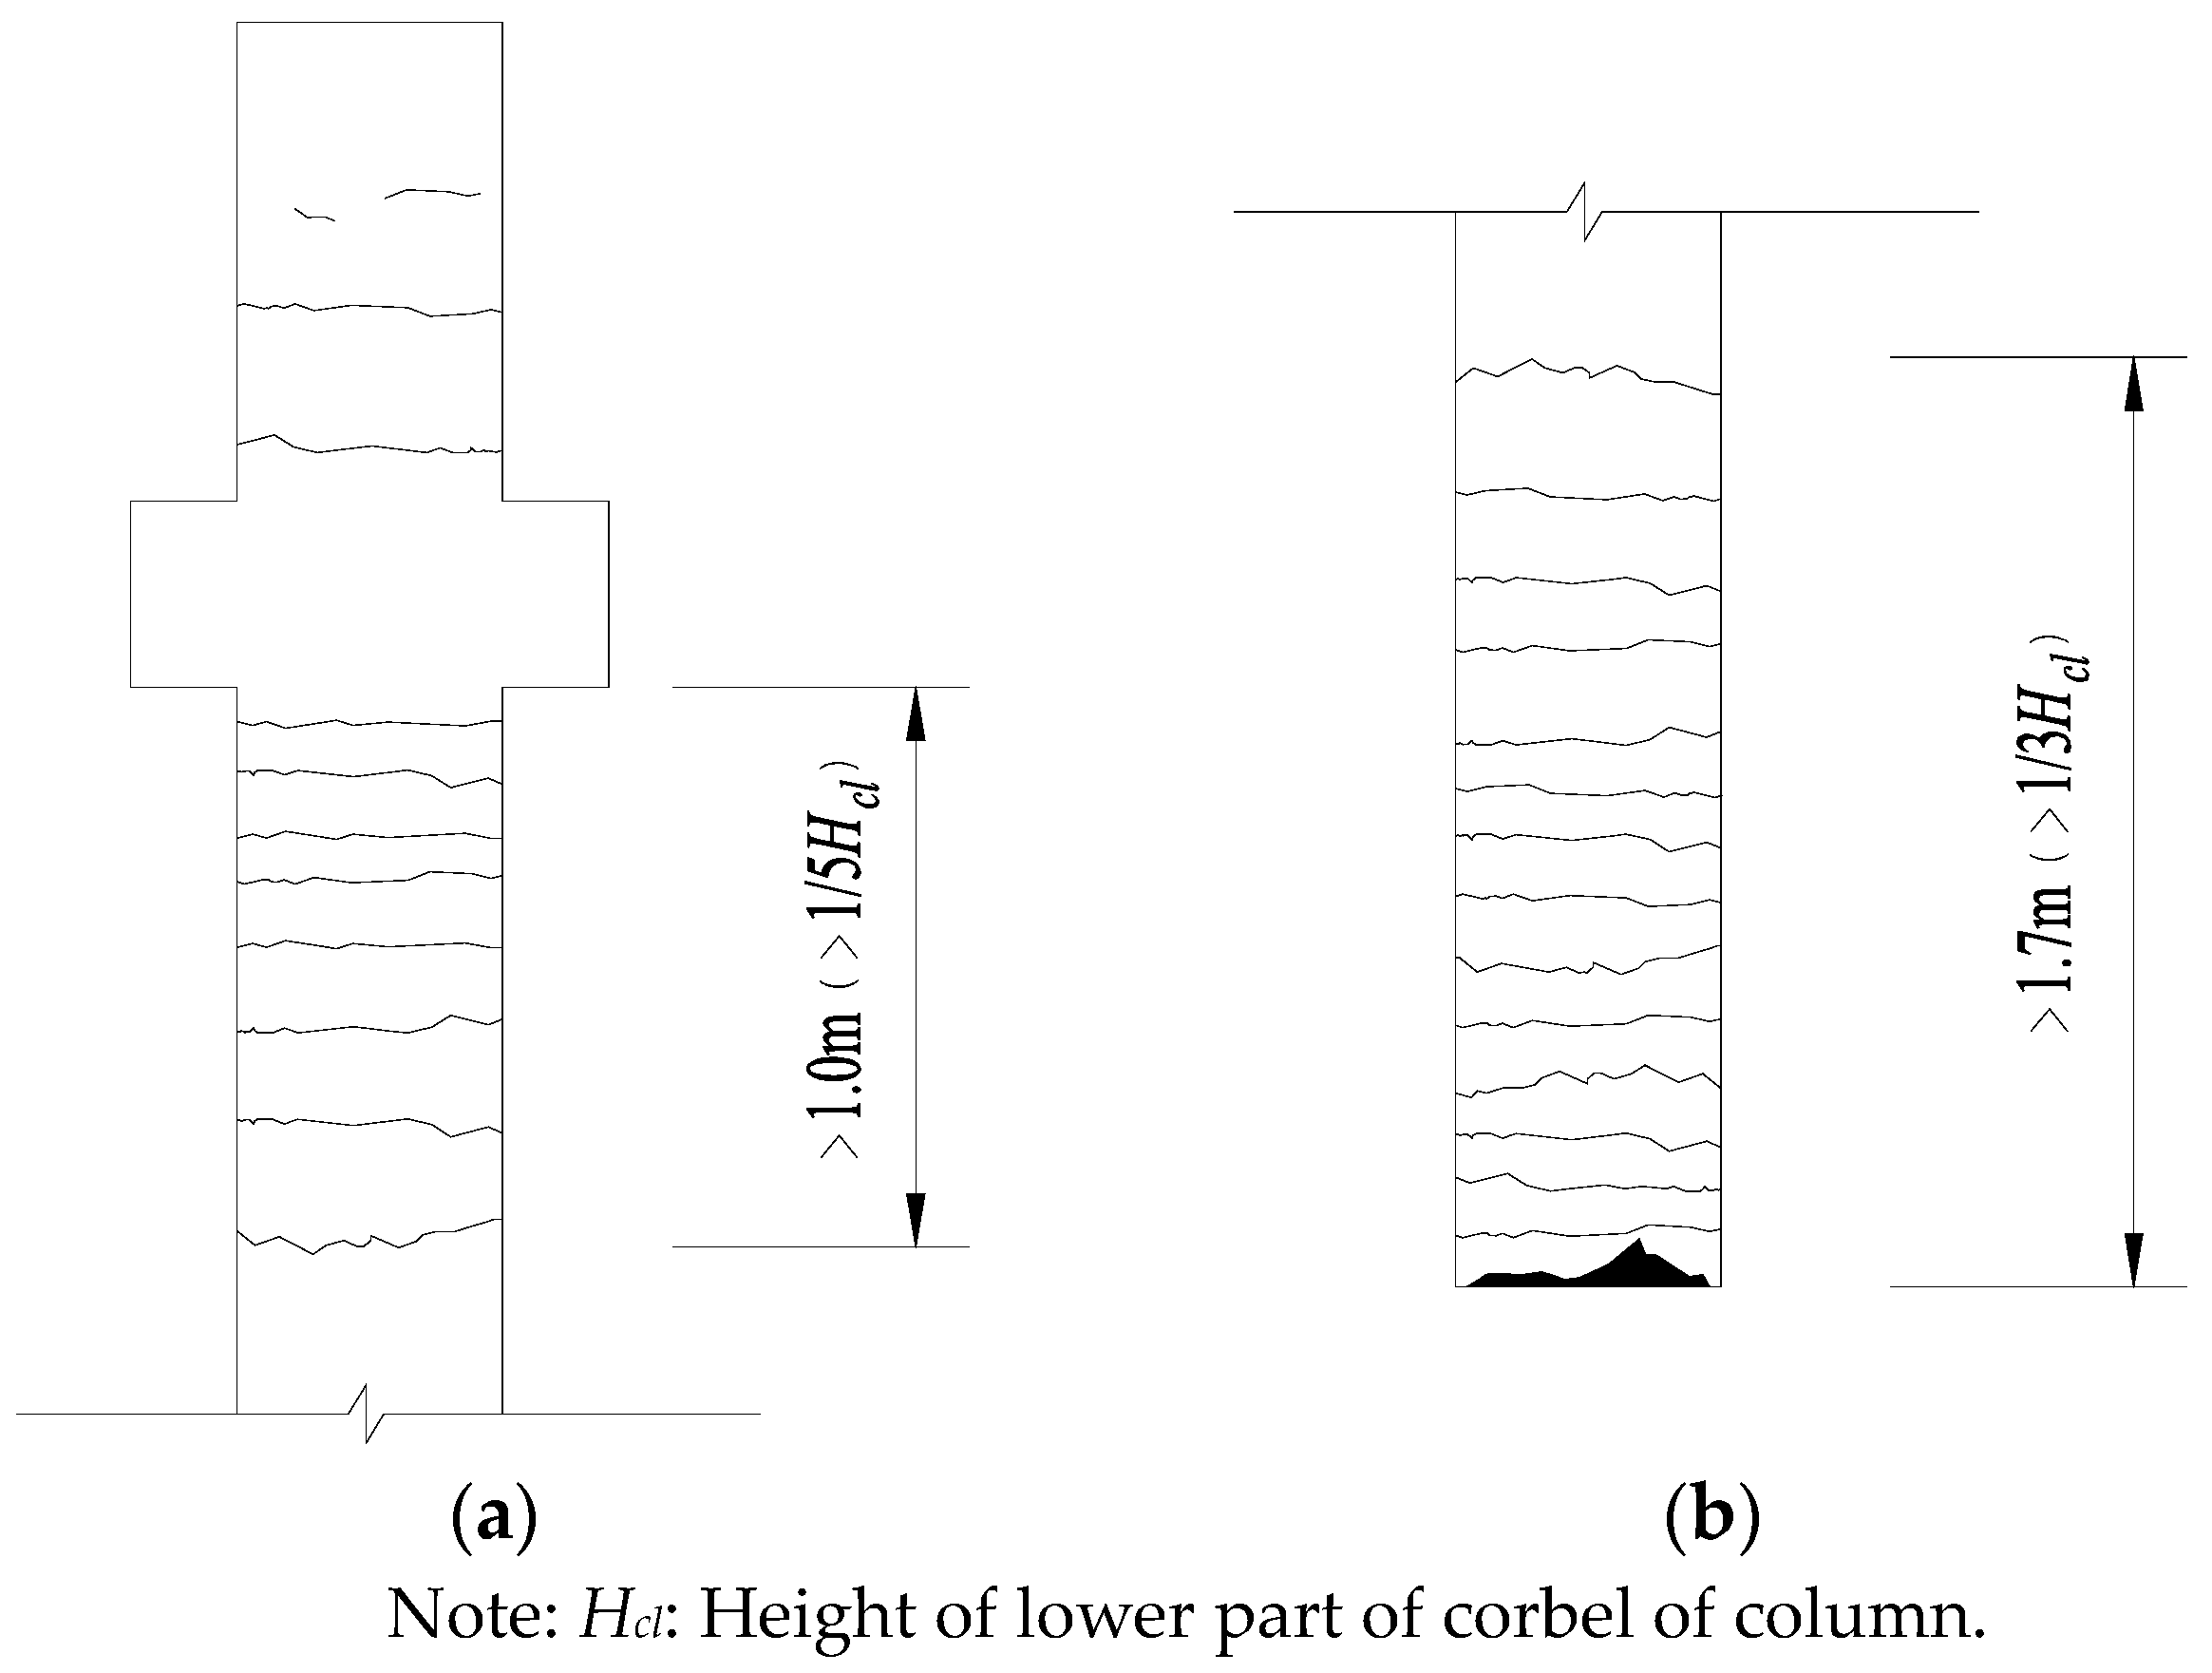
Figure 12a shows the stiffness and relative stiffness ratio of the specimen under different loading cases of the PDTs. It can be found that the specimen had obvious stiffness deterioration characteristics, occurring mainly within the PGA of 0.20 g. It resulted from the macro-cracks occurring and propagation on RC pipe columns. The experimental phenomenon indicated that when the PGA was equal to 0.20 g, the cracks firstly occurred on the bottom of RC pipe columns, and then with the increase of loading steps, cracks occurred on the lower part of the corbel of column. Compared with the specimen under the PGA of 0.05 g, the stiffness decreased about 32.8% when PGA equaled to 0.20 g. When PGA was greater than 0.20 g, the speed of stiffness deterioration then slowed. It was probably accounted for the crack propagation of the specimen. When the PGA came up 0.40 g which referred to the major earthquake having 2% probability in 50 years, the stiffness was about 60% of the initial stiffness. After PGA equaled to 0.80 g, the stiffness was about 41% of the initial stiffness. This indicated that this structure had a rather good stiffness performance.
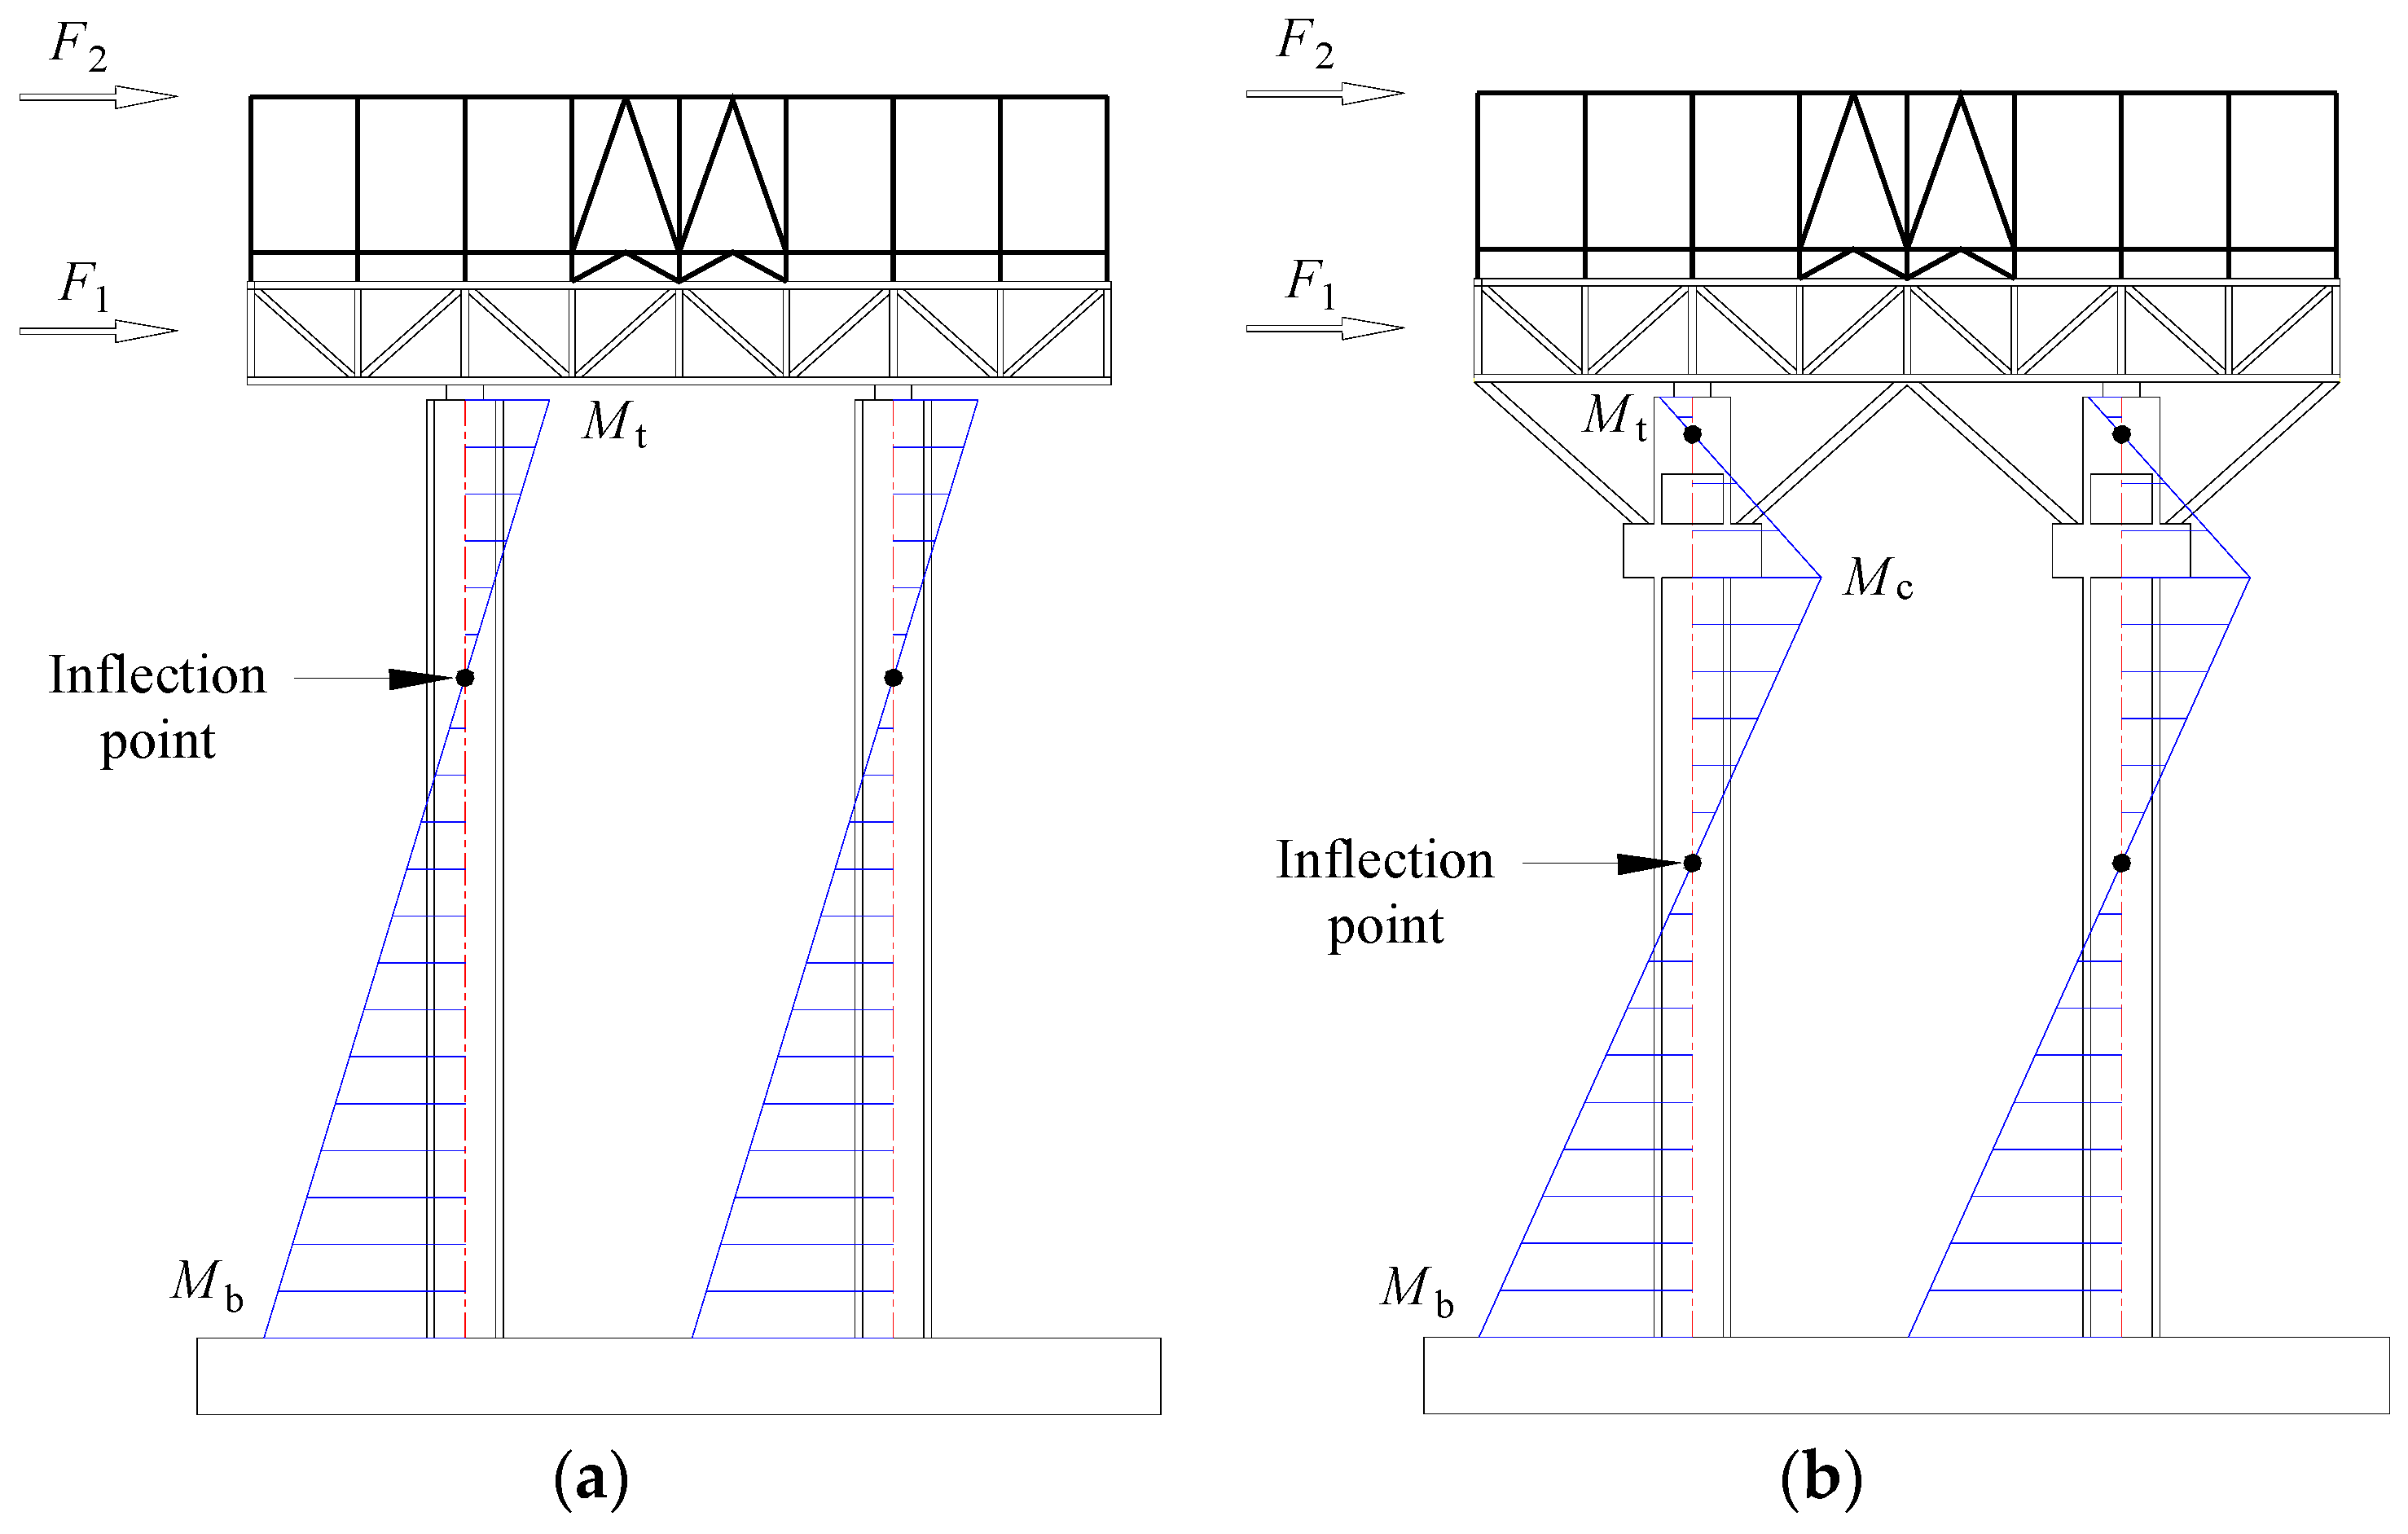
In addition, test results showed that steel diagonal braces nearly kept elastic during the loading process, correspondingly, the buckling of steel rebar, concrete crushing and slip are the key factors related to the stiffness deterioration for this kind of steel-concrete hybrid structure. This phenomenon coincided with the design expect, that is, most of earthquake energy would be dissipated by the columns while the steel diagonal braces should not failure or sustain severe damage ahead of the column. Because the steel diagonal braces are the key components to strengthen the structural integrity and improve the overall stiffness as the connection between the upper steel truss and the lower RC columns.
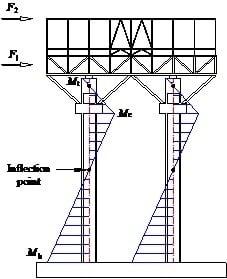
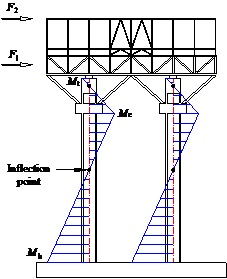
Figure 12b shows the changing situation of the fundamental period of specimen with increase of PGA. It was observed that inflection point where PGA was equal to 0.20 g occurred, due to the stiffness deterioration characteristics.
In order to investigate the deterioration characteristics of the specimen more comprehensively, a coefficient kdet was defined as [21]:
k det = Δ ( PGA ) Δ ( θ r , F b )
where Δ(PGA) is the increment of PGA, which is used to represent the intensity measure increment; θr and Fb are the maximum roof drift ratio and maximum base shear force, respectively; Δ(θr) and Δ(Fb) are respectively the increment of θr and Fb with the increase of PGA, which are used to represent the response measure increment.
Figure 12c,d shows the relationship between the maximum roof drift ratio and PGA, the relationship between the base shear force and PGA, respectively. The coefficient kdet can be reflected by the slope of the relationship curves. As shown in Figure 12c,d, three phases including linearity, slight hardening and softening were observed. The softening branch occurred when PGA was larger than 0.60 g, where the stiffness reduced to 51.7% of its initial value.

3.2.4. Cumulated Hysteresis Dissipated Energy

The cumulated hysteresis dissipated energy of the specimen is calculated by the formula as follows:
E h = 0 n 1 2 ( F i + 1 + F i ) ( X i + 1 X i )
where Fi+1 and Fi are the restoring force of the i+1th and i-th time point, respectively; Xi+1 and Xi are the corresponding displacements, respectively.
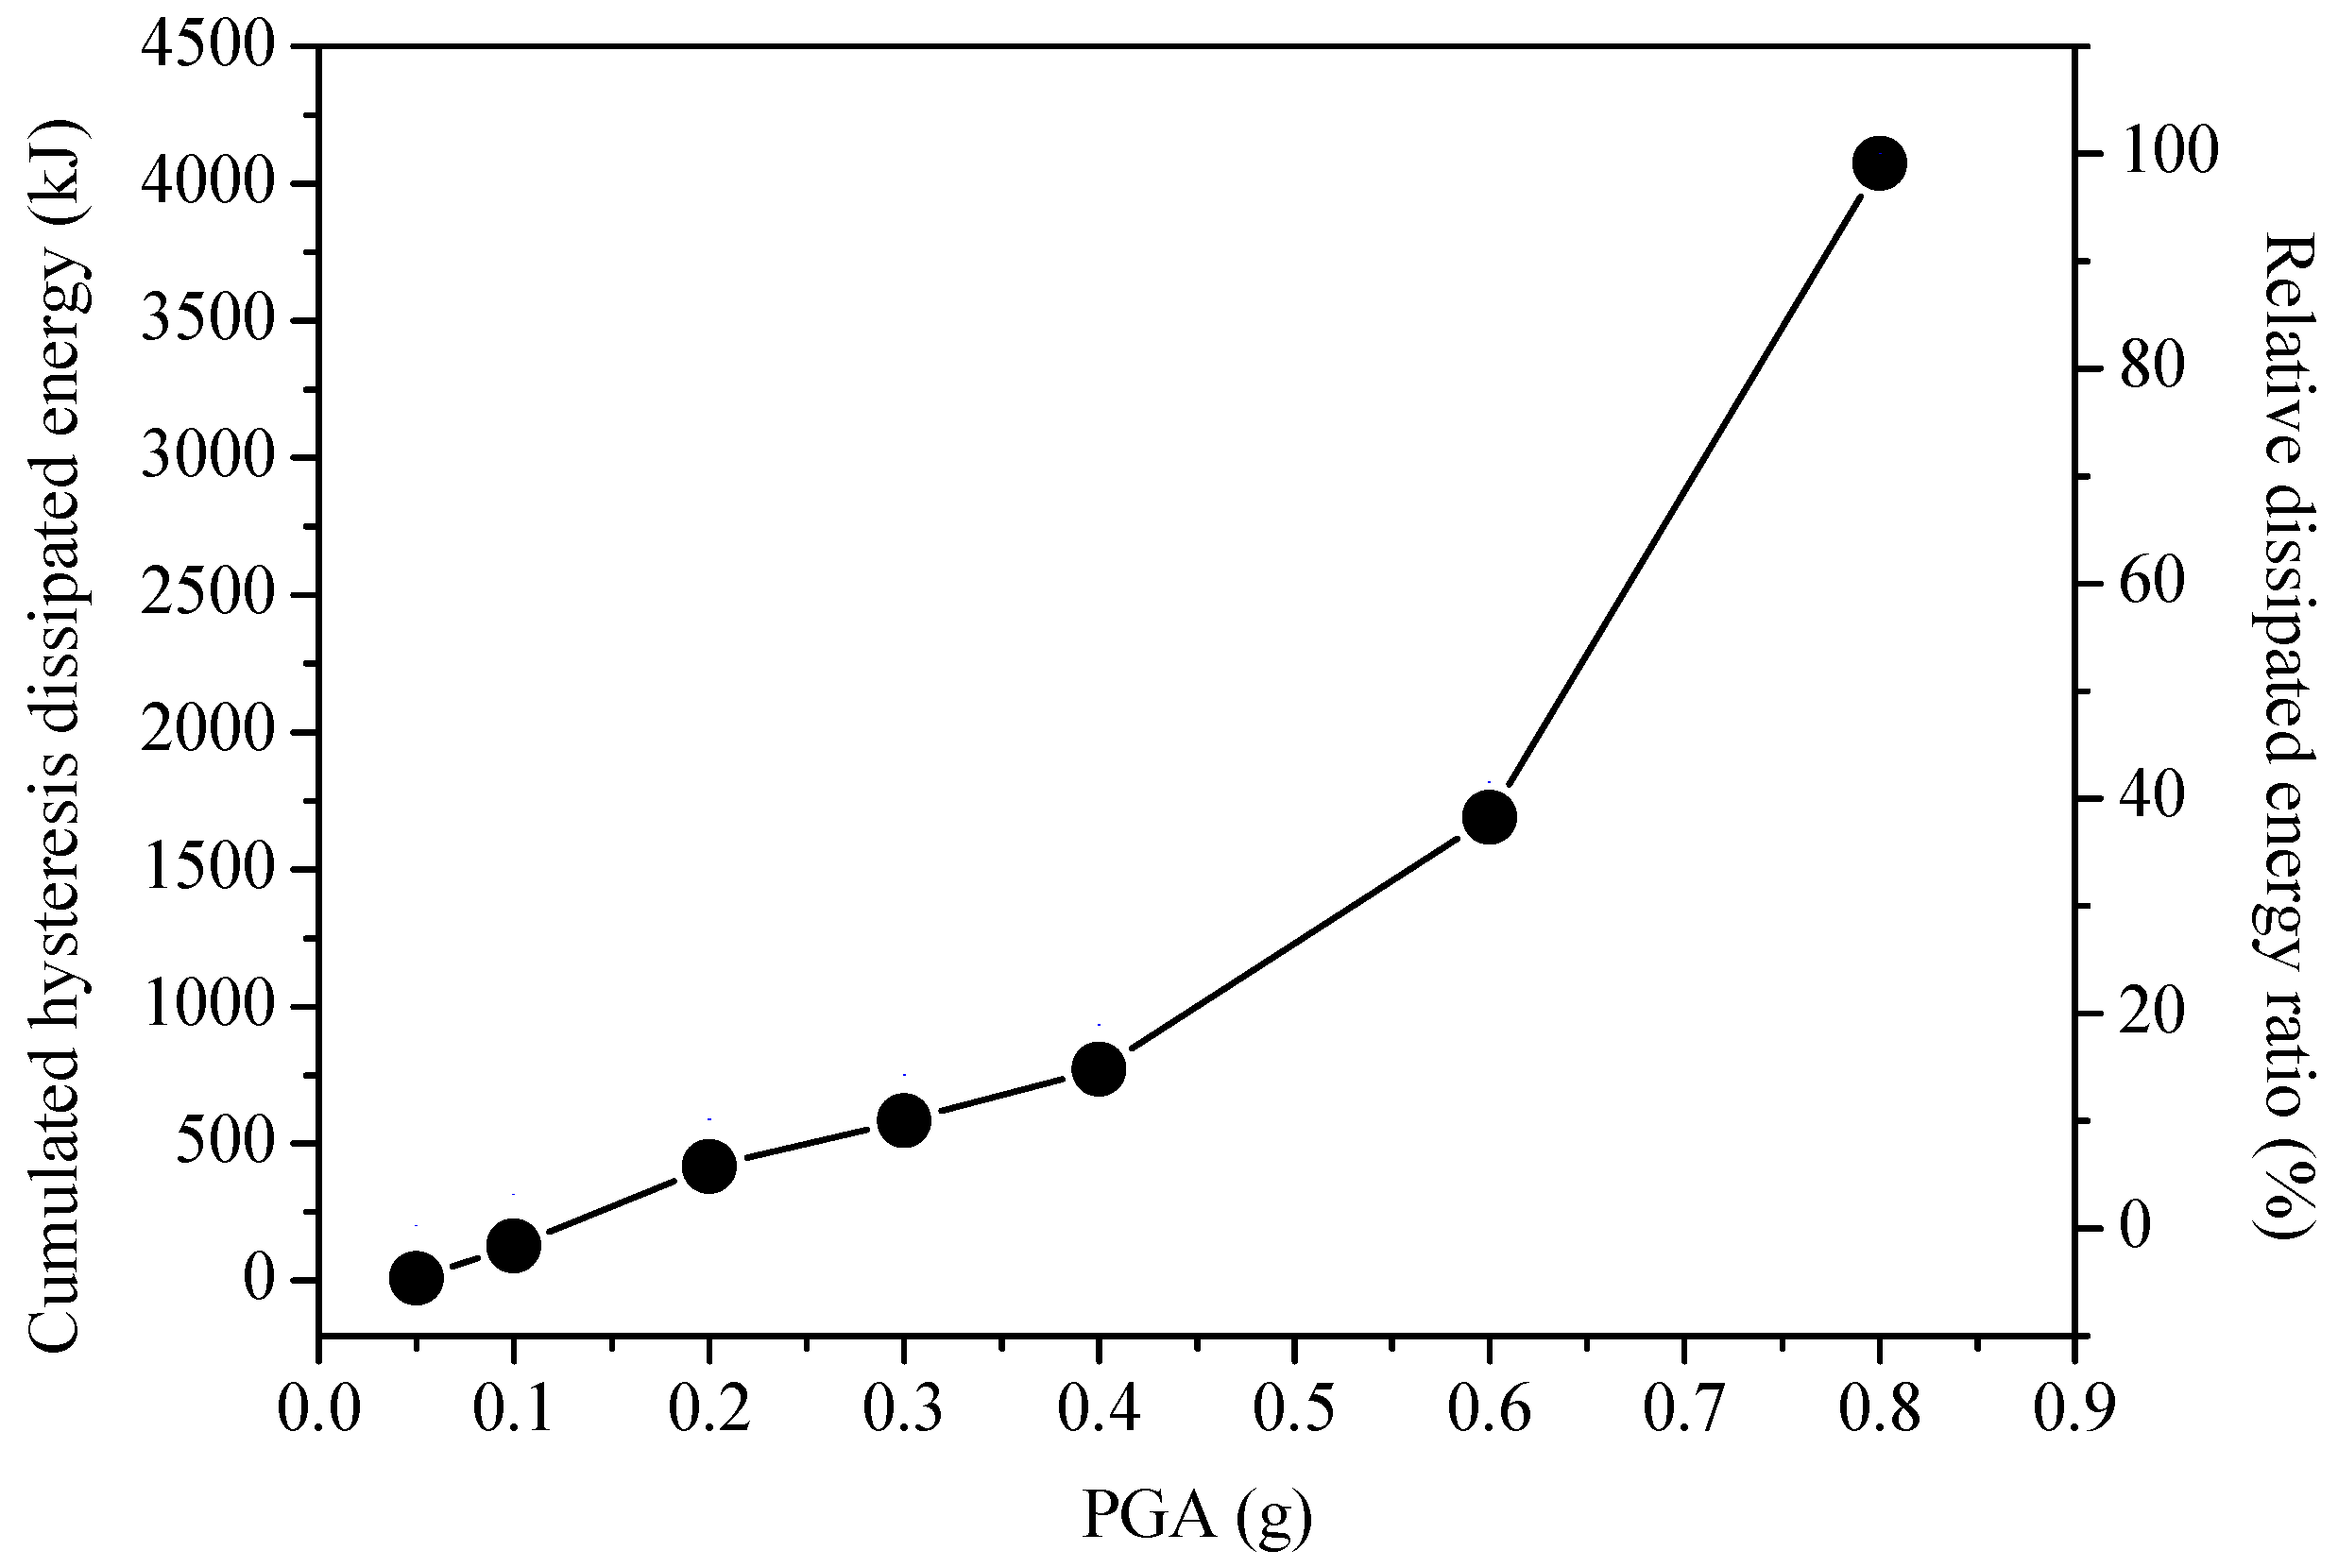
To reflect the energy dissipating degree of the specimen with the increase of PGA, the relative dissipated energy ratio is defined as the ratio between the cumulated hysteresis dissipated energy of the specimen under different loading cases of the PDTs calculated by Equation (9), equivalently the corresponding PGA is 0.05, 0.10, 0.20, 0.30, 0.40, 0.60, and 0.80 g, and the cumulated hysteresis dissipated energy of the specimen under the final loading case of PDTs (PGA = 0.8 g). Figure 13 shows the cumulated hysteresis dissipated energy (Eh) and the relative dissipated energy ratio of the specimen under different loading cases. It can be observed that the cumulated hysteresis dissipated energy Eh gradually increased along with the increase of PGA. And the growth rate of the cumulated hysteresis dissipated energy Eh increased significantly when PGA came up to 0.40 g, due to the more deterioration in stiffness and the larger plastic deformation. Before the PGA came up to 0.40 g, the relative dissipated energy ratio was only 19%.

3.3. QST Results

Through QSTs, hysteretic curves and skeleton curve for the base shear force versus roof lateral displacement (roof drift ratio) were obtained, as shown in Figure 14a. Figure 14b compares the hysteretic loops for three different drift levels. The hysteretic curves presented significant reversed S shape pattern with increase of drift. Ultimate load at the last cycle was 189.68 kN, decreasing to approximately 85% of peak load (223.71 kN). Table 5 lists the hysteretic characteristics of the specimen. The yield load and yield drift ratio of the specimen was determined using the general yield bending moment method [22]. The ductility factor is the fraction of ultimate drift to the yield drift. It can be found that the ductility factor could reach a value of 3.6. This ductility comes mostly from the RC pipe columns as a result of yielding in the reinforcing steel.

4. Failure Mechanisms and Design Recommendations

4.1. Damage Observation

During the PDTs, the specimen sustained slowly accumulative damage when subjected to the seven PGA levels. The initial cracks were observed on the bottom of column when PGA equaled to 0.20 g. During the same PGA condition but later loading steps (311th step), new cracks formed firstly on the lower part of corbel. When PGA increased to 0.60 g, new cracks were observed on the upper part of corbel. In general, cracks mainly concentrated on the columns while no damage was observed on the steel truss, A-type bracket and diagonal braces during the PDTs. And with increase of PGA, cracks formed and developed on the bottom of column, lower part of corbel and upper part of corbel gradually.
During the following QSTs, cracks on the columns further propagated and extended. Specimen yielded when the amplitude of control displacement added up to 50 mm. Spalling of concrete was observed on the base of column when the amplitude of control displacement equaled to 110 mm. When the amplitude of control displacement increased to 130 mm, the concrete at the base of column crushed severely and the welding slag of truss-to-column connection began to spall, as shown in Figure 15. Finally, after the first displacement cycle at the amplitude of 190 mm, the lateral load decreased to about 85% of the peak load, test was terminated. Figure 16 shows the crack distribution patterns of column after the tests. It was found that the cracks mainly occurred on the bottom of the column and lower part of the corbel. Besides, some cracks were observed on the upper part of the corbel.

4.2. Effect of the Steel Diagonal Braces

This section aims to reveal the mechanism of the cracks distribution patterns observed from the experiments and to discuss the efficiency of steel diagonal braces. For this kind of hybrid structure, due to the technological requirements in TPPs, steel truss and A-shaped brackets bear the important equipment and facilities directly, are expected to suffer negligible damage subjected to the earthquake. Accordingly, RC columns are expected to dissipate most of the earthquake energy. Figure 17a,b show the simplified analysis models of the structure without and with diagonal braces, respectively. As shown in Figure 17, the equivalent lateral loads to the experimental loading actions can be represented by F1 and F2. The bending moment distribution patterns of the column without and with diagonal braces under the lateral loads are presented in Figure 17a,b, respectively. Mb, Mc and Mt represent the bending moment of the base column, corbel and top column, respectively. It can be found that the moment distribution of the column was changed after setting the diagonal braces due to the change of action transfer mode. For the structure with diagonal braces, the moment mainly distributed in three areas including the bottom of column, lower part of the corbel and upper part of the corbel, which were same with the cracks distribution areas observed from the experiments. However, for the structure without diagonal braces, the moment mainly distributed in the bottom of column and the upper part of column. Accordingly, the increase of energy dissipating areas for the column by setting diagonal braces might improve the energy dissipation capacity of this hybrid structure. Furthermore, in order to avoid the sudden decrease of the overall stiffness and loss of the structural integrity might be caused by the failure of steel diagonal braces, the braces should be designed strong enough. On this basis, the seismic performance of this kind of hybrid structure can be improved effectively by the steel diagonal braces.

4.3. Design Recommendations

4.3.1. Calculation Method of Earthquake Action

As analysis above, the torsional stiffness of the structure is rather small, which is adverse to the seismic design. Besides, the periods of first three vibration modes are close with each other. Accordingly, the equivalent base shear method is not suitable to calculate the earthquake action of the steel truss-RC column hybrid structure. And the translation-torsion coupling earthquake action calculation method was recommended. In addition, in order to consider the adverse influence of the torsion, the calculated earthquake actions were suggested to be enlarged. Further analysis is, however, needed in order to obtain the specific amplified coefficient of the earthquake action.

4.3.2. Construction Measures

As analysis above, RC pipe column is the main energy dissipated component. In order to improve the energy dissipation capacity of columns, stirrup densification were recommended based on the cracks distribution areas of the columns, as shown in Table 6.

5. Conclusions

This paper investigated the seismic behavior and failure mechanism of a peculiar hybrid structure consisting of steel truss and RC pipe columns with steel diagonal braces through a series of PDTs and QSTs on a scaled specimen. The main findings can be summarized as follows:
(1)
Due to the special structural composition, resulting in the lower torsional stiffness, the first vibration mode was torsion and the corresponding fundamental period was 0.319 s. Besides, the periods of first three vibration modes are close with each other. The equivalent base shear method is not suitable to calculate the earthquake action. And the translation-torsion coupling earthquake action calculation method was recommended. In addition, in order to consider the adverse influence of the torsion, the calculated earthquake actions were suggested to be enlarged.
(2)
The lateral deformation mode of the steel truss-RC column hybrid structure with steel diagonal braces belongs to shear-type and the lateral displacement curve was divided into two significant part at the corbel because of the rigid-upper-flexible-bottom characteristics of vertical stiffness distribution condition that the stiffness of the upper part above the corbel is much larger than that of the pipe columns. The drift concentration mainly occurred on the column, where the peak of maximum drift ratio occurred at the height of corbel after PGA came up to 0.30 g.
(3)
Analysis of the stiffness deterioration demonstrated that the steel truss-RC column hybrid structure with steel diagonal braces had a rather good stiffness performance. When the PGA came up 0.40 g which referred to the major earthquake having 2% probability in 50 years, the stiffness was about 60% of the initial stiffness. After PGA equaled to 0.80 g, the stiffness was about 41% of the initial stiffness.
(4)
Damage observation showed that cracks mainly occurred two parts of columns including the bottom of column and the lower part of corbel. This was due to the setting of diagonal braces, resulting in the change of bending moment distribution pattern along the height of column. Overall, the new supporting structure consists of steel truss, RC pipes column with steel diagonal braces can satisfy the seismic demand under severe earthquakes.

Acknowledgments

Support for this research from the National Natural Science Foundation of China (NSFC, Grant No. 51708037), China Postdoctoral Science Foundation (Grant No. 2017M610616) and Shanxi Province Postdoctoral Science Foundation (Grant No. 2017BSHEDZZ111) is gratefully acknowledged.

Author Contributions

Bo Wang contributed to the study design, analysis of data and writing; Huijuan Dai contributed to the fabrication of specimen and acquisition of data; Tao Wu contributed to the design of experimental program; Guoliang Bai contributed to the conception of this paper; Yongtao Bao contributed to literature search and revision of this paper.

Conflicts of Interest

The authors declare no conflict of interest.

References

  1. Dall’Asta, A.; Leoni, G.; Morelli, F.; Salvatore, W.; Zona, A. An innovative seismic-resistant steel frame with reinforced concrete infill walls. Eng. Struct. 2017, 141, 144–158. [Google Scholar] [CrossRef]
  2. Hajjar, J.F. Composite steel and concrete structural systems for seismic engineering. J. Constr. Steel. Res. 2002, 58, 703–723. [Google Scholar] [CrossRef]
  3. Deierlein, G.G.; Noguchi, H. Overview of US-Japan research on the seismic design of composite reinforced concrete and steel moment frame structures. J. Struct. Eng. 2004, 130, 361–367. [Google Scholar] [CrossRef]
  4. Berrichon, J.D.; Louahlia-Gualous, H.; Bandelier, P.; Clement, P.; Bariteau, N. Experimental study of flooding phenomenon in a power plant refuex air-cooled condenser. Appl. Therm. Eng. 2015, 79, 214–224. [Google Scholar] [CrossRef]
  5. Borghei, L.; Khoshkho, R.H. Computational fluid dynamics simulation on a thermal power plant with air-cooled condenser. J. Power Energy 2012, 226, 837–884. [Google Scholar] [CrossRef]
  6. Bredell, J.R.; Kroger, D.G.; Thiart, G.D. Numerical investigation of fan performance in a forced draft air-cooled steam condenser. Appl. Therm. Eng. 2006, 26, 846–852. [Google Scholar] [CrossRef]
  7. Bustamante, J.G.; Rattner, A.S.; Garimella, S. Achieving near-water-cooled power plant performance with air-cooled condensers. Appl. Therm. Eng. 2015, 72, 1–10. [Google Scholar] [CrossRef]
  8. Odabaee, M.; Hooman, K. Application of metal foams in air-cooled condensers for geothermal power plants: An optimization study. Int. Commun. Heat Mass Transf. 2011, 38, 838–843. [Google Scholar] [CrossRef]
  9. O’Donovan, A.; Grimes, R. A theoretical and experimental investigation into the thermodynamic performance of a 50 MW power plant with a novel modular air-cooled condenser. Appl. Therm. Eng. 2014, 71, 119–129. [Google Scholar] [CrossRef]
  10. Bai, G.L.; Zhu, L.H.; Zhao, C.L.; Li, X. Model test on behavior of direct air cooled condenser support plat form under service load and earthquake action. J. Build. Struct. 2008, 10, 42–49. (In Chinese) [Google Scholar]
  11. Yao, Z.L.; Bai, G.L.; Dang, F.N.; Li, H.X. Study on seismic behavior of a steel truss-reinforced concrete column structure. J. Build. Struct. 2011, 32, 30–36. (In Chinese) [Google Scholar]
  12. Ozcelik, R.; Binici, B.; Kurc, O. Pseudo dynamic testing of an RC frame retrofitted with chevron braces. J. Earth Eng. 2012, 16, 515–539. [Google Scholar] [CrossRef]
  13. Qiao, S.F.; Han, X.L.; Zhou, K.M. Bracing configuration and seismic performance of reinforced concrete frame with brace. Struct. Des. Tall Spec. Build. 2017, 26. [Google Scholar] [CrossRef]
  14. Tantely, J.S.; Zheng, H. Seismic Collapse Margin of Steel Frame Structures with Symmetrically Placed Concentric Braces. Int. J. Steel Struct. 2017, 17, 969–982. [Google Scholar] [CrossRef]
  15. Li, M.H.; Lam, F.; Foschi, R.O. Seismic reliability analysis of diagonal-braced and structural-panel-sheathed wood shear walls. J. Struct. Eng. 2009, 135, 587–596. [Google Scholar] [CrossRef]
  16. Ministry of Construction of the People’s Republic of China. Code for Seismic Design of Buildings (GB 50011-2010); China Architecture and Building Press: Beijing, China, 2016. (In Chinese)
  17. Kumar, S.; Itoh, Y.; Saizuka, K.; Usami, T. Pseudo dynamic Testing of Scaled Models. J. Struct. Eng. 1997, 123, 524–526. [Google Scholar] [CrossRef]
  18. Ministry of Construction of the People’s Republic of China. Specification for Seismic Test of Buildings (JGJ101/T-2015); China Building Industry Press: Beijing, China, 2015. (In Chinese)
  19. Ibarra, L.F.; Medina, R.A.; Krawinkler, H. Hysteretic models that incorporate strength and stiffness deterioration. Earth. Eng. Struct. Dyn. 2005, 34, 1489–1511. [Google Scholar] [CrossRef]
  20. Wang, J.F.; Zhang, H.J. Seismic performance assessment of blind bolted steel-concrete composite joints based on pseudo-dynamic testing. Eng. Struct. 2017, 131, 192–206. [Google Scholar] [CrossRef]
  21. Bai, Y.T.; Bai, G.L. Pseudo-dynamic and quasi-static testing of an irregular steel concrete composite frame with wing walls. Int. J. Struct. Stab. Dyn. 2016, 16, 1450095. [Google Scholar] [CrossRef]
  22. Zhu, B.L. Seismic Tests for Structures; Seismological Press: Beijing, China, 1989. (In Chinese) [Google Scholar]
Figure 1. Sketch of supporting structure for air-cooled condenser (ACC) system with steel diagonal braces.
Applsci 08 00131 g001
Figure 2. Plan layouts of the prototype structure and selected sub-structure.
Applsci 08 00131 g002
Figure 3. Specimen and loading facilities: (a) column layout; (b) fabricated specimen and (c) elevation view of the specimen with loading facilities.
Applsci 08 00131 g003
Figure 4. Connection details: (a) brace-to-truss connection and (b) brace-to-column connection.
Applsci 08 00131 g004
Figure 5. Dimensions and steel arrangements details of pipe column: (a) cross section and reinforcements of column; (b) elevation view of reinforcements for corbel; (c) cutaway view of reinforcements for corbel and (d) photo of rebar cage for corbel.
Applsci 08 00131 g005
Figure 6. Schematic of pseudo-dynamic tests (PDT) procedure.
Applsci 08 00131 g006
Figure 7. Cyclic loading protocol of quasi-static tests (QST).
Applsci 08 00131 g007
Figure 8. First vibration mode of the specimen: (a) global torsion and (b) first mode shape.
Applsci 08 00131 g008
Figure 9. Roof drift ratio versus base shear force under PDTs.
Applsci 08 00131 g009
Figure 10. Roof drift ratio time-histories of the specimen under PDTs.
Applsci 08 00131 g010
Figure 11. Lateral deformation curves of the specimen under PDTs: (a) maximum lateral displacement and (b) maximum drift ratio.
Applsci 08 00131 g011
Figure 12. Deterioration behavior of the specimen under PDTs: (a) relative stiffness ratio and stiffness versus peak ground acceleration (PGA); (b) fundamental period versus PGA; (c) maximum roof drift ratio versus PGA and (d) maximum base shear force versus PGA.
Applsci 08 00131 g012
Figure 13. Cumulated hysteresis dissipated energy under PDTs.
Applsci 08 00131 g013
Figure 14. Hysteretic behavior of specimen: (a) hysteretic curves of base shear force versus roof displacement (drift ratio) and envelope response and (b) hysteretic loops at various displacement levels.
Applsci 08 00131 g014
Figure 15. Local failure modes of the specimen: (a) Crushing of concrete on the base column and (b) cracking of weld joint on the truss-to-column connection.
Applsci 08 00131 g015
Figure 16. Cracks distribution patterns of column: (a) upper part of column and (b) lower part of column.
Applsci 08 00131 g016
Figure 17. Simplified structural analysis models (a) without diagonal brace and (b) with diagonal brace.
Applsci 08 00131 g017
Table 1. Main dimensions of components.
ComponentQuantityValue
RC pipe columnColumn grid22.78 m × 22.36 m
Number25
Height50 m
External diameter4 m
Wall thickness0.4 m
Steel trussLength11.39 m
Width11.18 m
Height5 m
A-shaped bracketHeight11 m
Table 2. Typical scale factors of the model structure.
VariableEquationScale Factor
LengthSL1/8
Mass(SL)21/64
Time(SL)1/21/ 8
Force(SL)21/64
DisplacementSL1/8
AccelerationSF/SM1
StiffnessSL1/8
Table 3. Material strength test results.
MaterialPosition of SamplingSection (mm)Fy (MPa)Fu (MPa)
Steel rebarPipe columnStirrupφ8325435
Longitudinal rebarφ10532656
Steel tubes (square hollow section)TrussDiagonal web memberTop of column40 × 2.5432463
Other parts40 × 2.0380445
Vertical web member Top of column50 × 2.5400430
Other parts50 × 2.0382453
Chord member 50 × 2.5400430
A-shaped bracketHorizontal internal member30 × 1.5323403
Diagonal external member40 × 1.5375480
Diagonal brace70 × 3.5365420
ConcretePipe columnfcm = 42.3
Note: Top of column: represents the locations of web members which are on the top of column; Other parts: represent the locations of web members which are not on the top of column.
Table 4. Dynamic properties of the specimen.
ModePeriod (s)Vibration Mode
First mode0.319Torsion
Second mode0.318Y-direction translation
Third mode0.306X-direction translation
Table 5. Summary of QST results.
Yield Drift Ratio (%)Yield Load (kN)Peak Load (kN)Peak Drift Ratio (%)Ultimate Drift Ratio (%)Ductility Factor
0.65170.65223.711.612.333.60
Table 6. Stirrup densification recommendation.
LocationEncryption HeightStirrup DiameterStirrup Spacing
Base of column3.0d≥12 mm≤150 mm
Lower part of corbel1.0d
Upper part of corbel1.0d
Note: d is the external diameter of pipe column.

