Article

Different Soil Particle-Size Classification Systems for Calculating Volume Fractal Dimension—A Case Study of Pinus sylvestris var. Mongolica in Mu Us Sandy Land, China

1
College of Forestry, Shenyang Agricultural University, Shenyang 110866, China
2
Research Station of Liaohe-River Plain Forest Ecosystem, Chinese Forest Ecosystem Research Network, Shenyang Agricultural University, Shenyang 110866, China
3
Department of Architecture and Landscape Engineering, Dezhou Vocational and Technical College, Dezhou 253034, China
4
College of Forestry, Northeast Forestry University, Harbin 150040, China
5
The Research Institute of Forest Ecology, Environment and Protection, Chinese Academy of Forestry, Beijing 100091, China
*
Authors to whom correspondence should be addressed.
Submission received: 3 September 2018 / Revised: 29 September 2018 / Accepted: 7 October 2018 / Published: 10 October 2018
(This article belongs to the Special Issue Fractal Based Information Processing and Recognition)

Abstract

:
Characterizing changes in the soil particle-size distributions (PSD) are a major issue in environmental research because it has a great impact on soil properties, soil management, and desertification. To date, the use of soil volume fractal dimension (D) is a feasible approach to describe PSD, and its calculation is mainly dependent on subdivisions of clay, silt, sand fractions as well as different soil particle-size classification (PSC) systems. But few studies have developed appropriate research works on how PSC systems affect the calculations of D. Therefore, in this study, topsoil (0–5 cm) across nine forest density gradients of Pinus sylvestris var. mongolica plantations (MPPs) ranging from 900–2700 trees ha–1 were selected in the Mu Us sandy land, China. The D of soil was calculated by measuring soil PSD through fractal model and laser diffraction technique. The experimental results showed that: (1) The predominant PSD was distributed within the sand classification followed by clay and silt particle contents, which were far less prevalent in the study area. The general order of D values (Ds) was USDA (1993) > ISO14688 (2002) > ISSS (1929) > Katschinski (1957) > China (1987) > Blott & Pye (2012) PSC systems. (2) Ds were significantly positively related to the contents of clay and silt, and Ds were significantly negatively to the sand content. Ds were susceptible to the MPPs establishment and forest densities. (3) Ds of six PSC systems were significantly positive correlated, which indicated that they not only have difference, but also have close connection. (4) According to the fractal model and descriptions of soil fractions under different PSC systems, refining scales of clay and sand fractions could increase Ds, while the refining scale of silt fraction could decrease Ds. From the conclusions above, it is highly recommended that USDA (1993) and Blott & Pye (2012) PSC systems be used as reliable and practical PSC systems for describing and calculating D of soil PSD.

1. Introduction

The soil particle-size distributions (PSD) has a great influence on soil hydraulic properties such as water retention characteristics, saturated and unsaturated hydraulic conductivities, bulk density, permeability, porosity, thus it is known as the result of geological, chemical, and biological processes [1,2,3,4,5,6]. Characteristics of PSD has a good relationship with the changes of soil structure, which is affected by management practices, erosion and desertification [4,7,8,9,10,11,12,13]. Therefore, characterizing changes in the soil PSD is an inevitable issue in environmental research [1]. Quantity of studies have been carried out to estimate soil PSD, these approaches basically require the PSD to be quantified by parameters like average particle diameter, weight, and volume, etc. And the latest developments in the studies have focused on the extensively accepted descriptive tool of use of fractal geometry [14,15]. The way of fractal measures is to characterize PSDs with parameters that retain most information [9,16,17,18,19].
Fractal theory (fractal model) has been applied to soil systems and associated with fractal parameters has become crucial in understanding the dynamics of soil movement. Many scientists used fractal theory to estimate D of the PSD and discussed its pros and cons [5,20,21,22,23]. Recent studies on the various soil textures showed that D tend to increase with the clay content is increasing [18,24,25], and D decreased with the sand content is increasing [26,27]. Thus, the fractal analysis is sensitive to soil coarsening process, which related to the degree of soil desertification [16].
The size of an individual soil particle can be described and measured in different ways and various methods [28]. Till now, though numerous particle-size scales and classification systems have been presented and vary considerably between scientific disciplines and regions, but no unified terminology is used to reach agreement to describe the PSDs of soils [28]. The most scientists currently use a descriptive terminology for size classes proposed by Wentworth (1922), usually in combination with the ‘texture’ classification proposed by Folk (1954), or a variant of it [28,29], which were also adopted by Katschinski (1957) and China (1987) particle-size classification (PSC) systems. In the former PSC system, soil classification mainly focused on agropedology use [29,30], while forestry and urban soil characteristics were represented in the latter PSC system. The recent USDA (1993) (United States Department of Agriculture) provides a subdivision of the >2 mm fraction into fine, medium and coarse gravel, cobbles, stones and boulders. This PSC system is now adopted by United States and other scientists worldwide [18,19,31]. Albert Mauritz Atterberg who is European agricultural scientist decided to use an upper size limit of 2 mm for sand, with all size classes above and below that size assigned on scale to log10 (i.e., at 2000 μm, 630 μm, 200 μm, 63.0 μm, etc.). Such a class definition was adopted by ISSS (1929) known as “International Society of Soil Science” and ISO14688 (2002) referred as “International Organization for Standardization”. And the merit of this PSC system is set class boundary by using the number 6.3 instead of 6.0 to create more even classes’ spacing and almost true logarithmic scale [28,29]. Krumbein (1932, 1936) improved the scheme, which proposed by Udden (1898) and Wentworth (1922), suggested by using the formula −log2 ξ (ξ referred to the particle size in millimeters), size in phi (ϕ) units could be converted and obtained [29]. In 2012, Blott & Pye scholars revised the PSC system of Krumbein’s and according to this scheme, they provide more logical framework with limits defined at one ϕ intervals [28].
Different PSC systems may clearly result in the same soil texture being accounted to different ways for the relative different composition of soil sand, silt, and clay contents, and thus having potential effects on the calculation of D. Although analysis of soil PSD based on fractal geometry (model) has been well studied, as we known, seldom studies focus on the effect of different PSC systems on calculating D of soils. Estimating PSD should recognize and link differences in scaling properties of particle distributions by PSC systems with pedogenetic processes to interpret the potential of D as a representation of a PSD. Therefore, in our research, soil PSDs and the fractal dimensions of topsoil (0–5 cm) of 9 different forest densities of MPPs in Mu Us Sandy Land, China were chosen for analysis. Pinus sylvestris var. momgolica is naturally throughout the northern China with average altitudes of 1500 m, and have excellent resistance ability of drought and great survivability. The creation of MPPs was successful in combating desertification in Yulin City, Shaanxi Province, which is situated on the southern Mu Us Sandy Land since the mid-1950s [19]. Moreover, in these regions, frequent and intense wind erosion drastically changes soil PSD [32]. MPPs protect sand land surfaces, thus soil PSD and D would be affected and also vary with forest densities.
The purposes of this research were: (i) to take examples of MPPs to determine the differences of six PSC systems including China (1987), Katschinski (1957), USDA (1993), ISSS (1929), ISO14688 (2002), and Blott & Pye (2012) of characterizing the PSDs and calculate Ds; (ii) to examine the relationship between six PSC systems; (iii) to determine the sensitivities to the changes of D calculated by six PSC systems in order to discuss the applicability of these PSC systems.

2. Materials and Methods

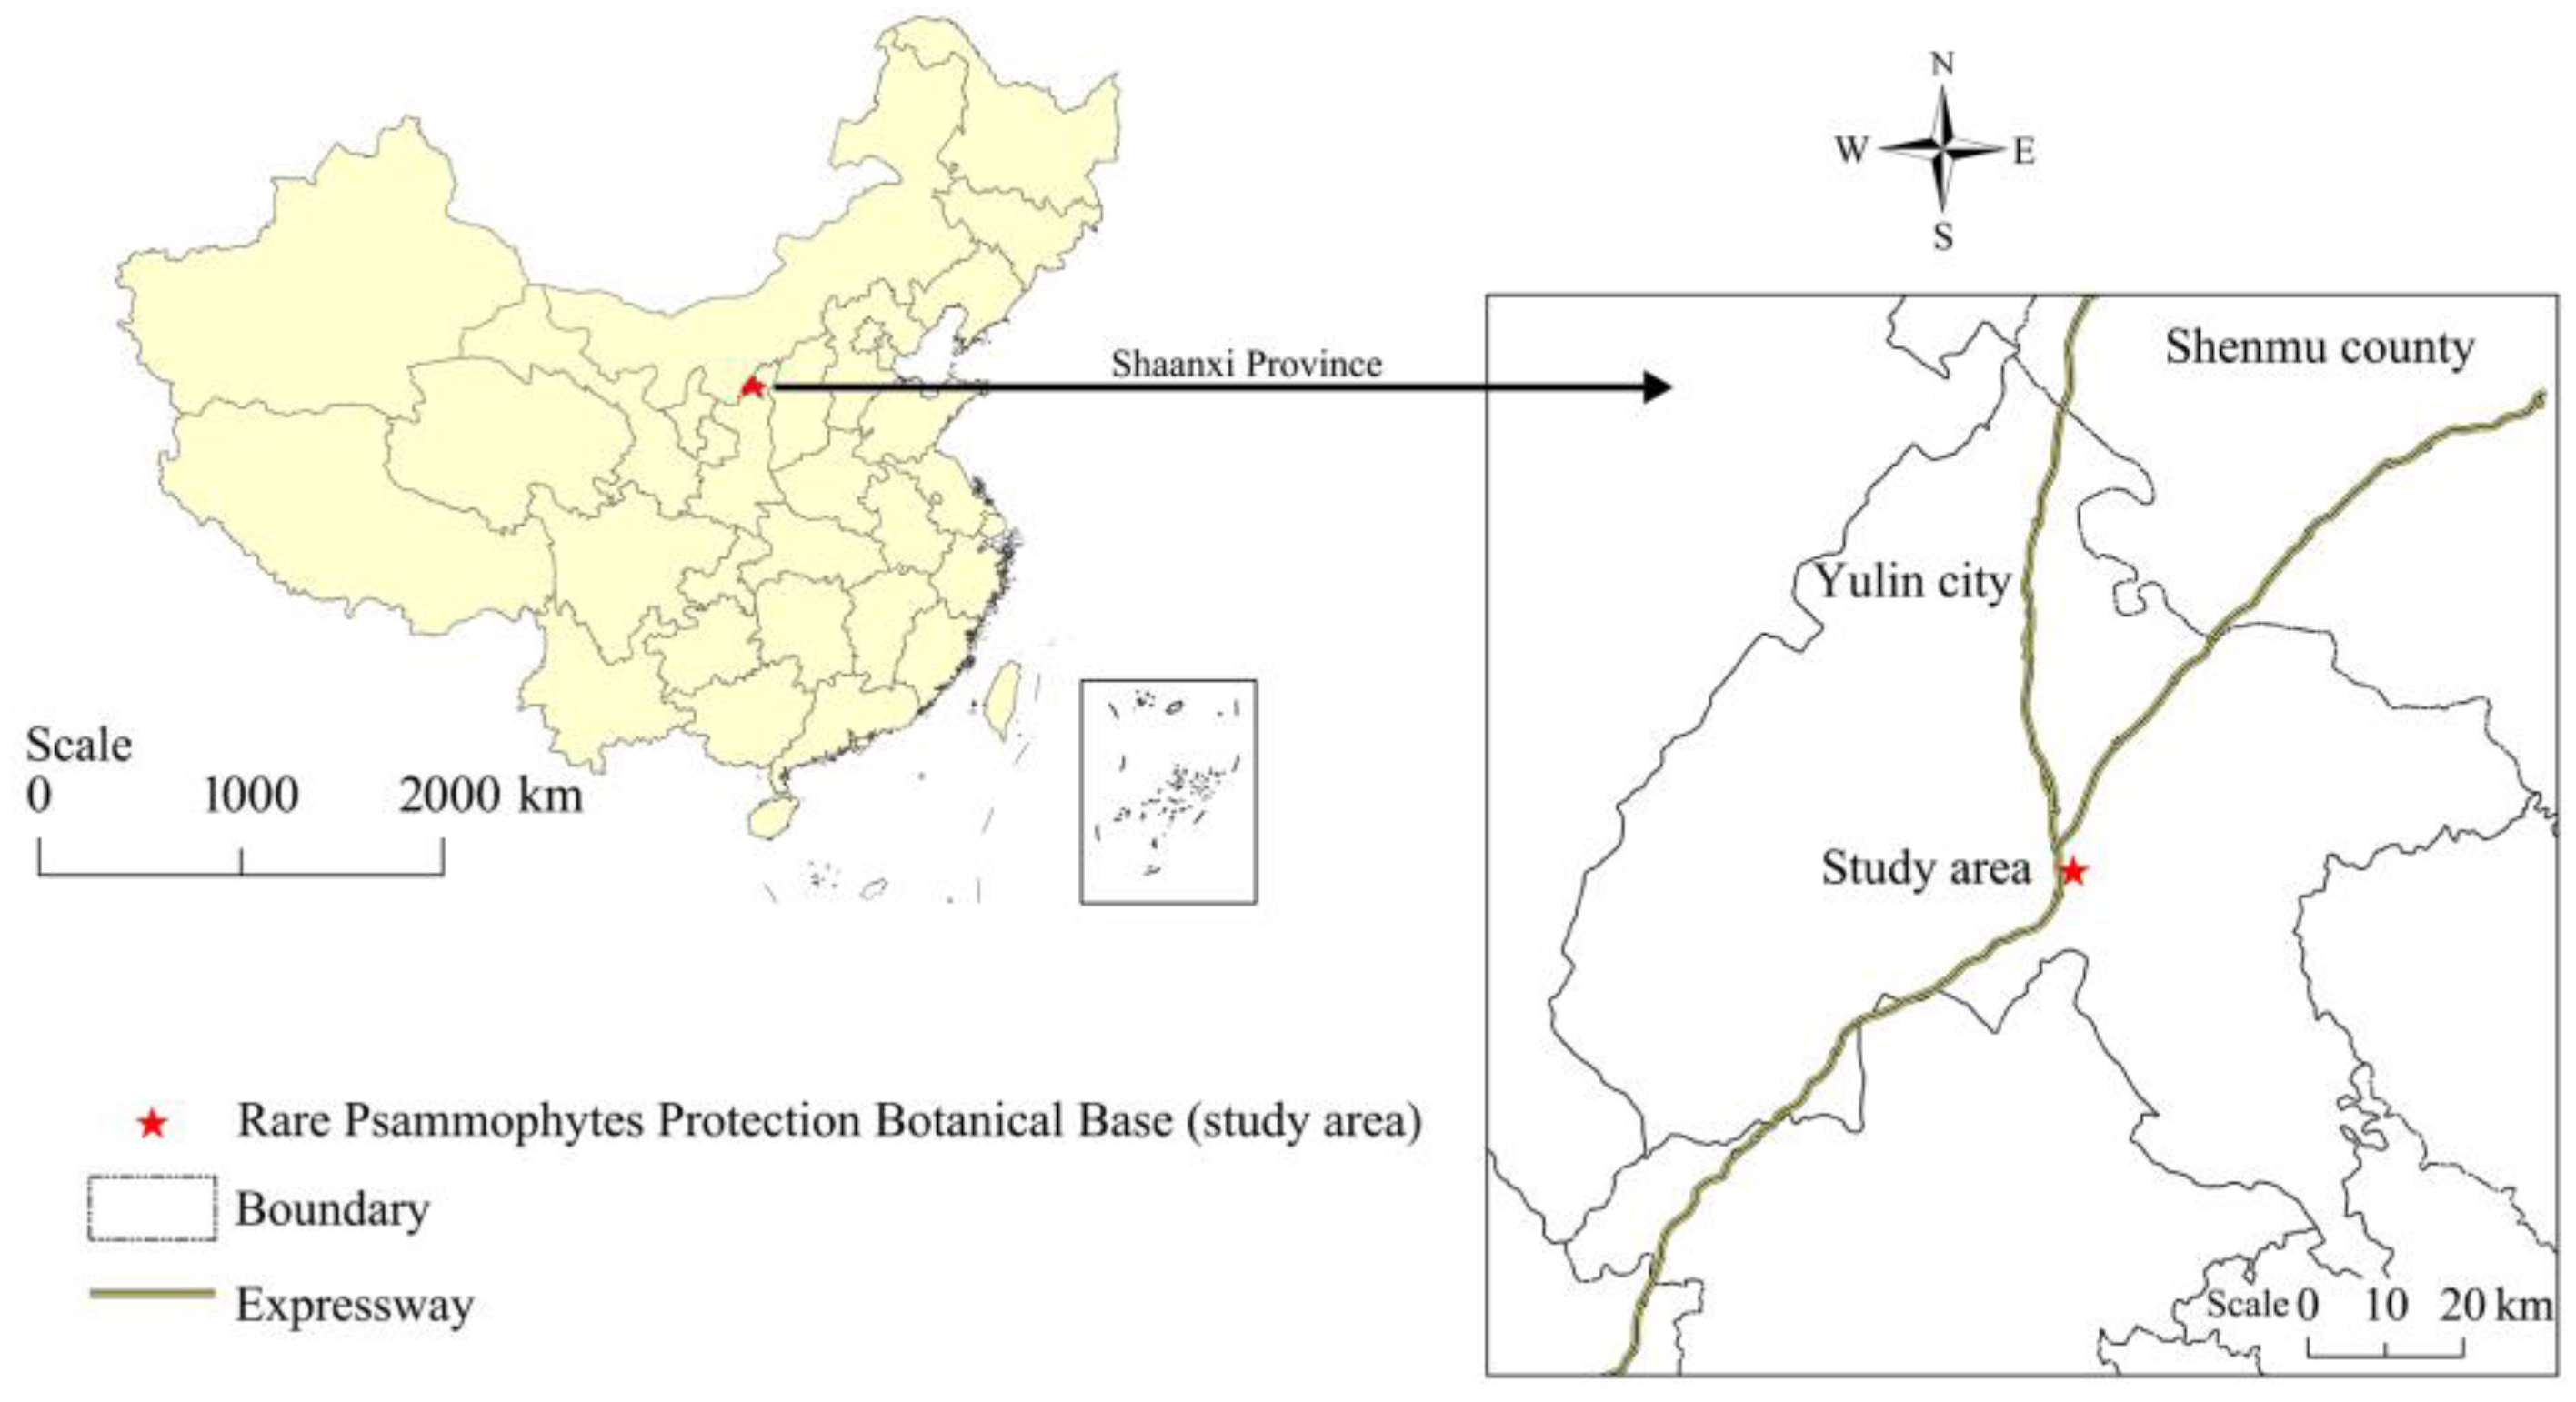
2.1. General Situations of Study Region

The study site lies in the Rare Psammophytes Protection Botanical Base which located in Mu Us Sandy Land, has a semi-arid continental monsoons climate (Figure 1). Average precipitation is 400 mm, annual mean temperature is 8.7 °C and mean evaporation is of 1950 mm [33]. The landscape is characterized by fixed sandy land, soil pH is 7.4 [18]. The natural vegetative cover consists mostly of low shrubs such as Caragana korshinskii and Hedysarum scoparium [19]. The enhanced surface warming in drylands can be explained by surface processes, which are suspected to soil erosion processes [19]. Thereby enabling MPPs to act as a barrier to soil and wind erosion, and have great impact on surface processes.

2.2. Sample Plots Investigation

This study was carried out from June to August 2013. A total of 9 MPPs sample plots of 20 m × 20 m with a stand density of 900–2700 trees·ha−1 were chosen, and initial planting time was in the year of 1989. These plots were intact and thus having no human impact and interference. Within these plots, the dominant vegetation species was P. sylvestris, and understory species comprised a sparse grass-shrub layer. General information of surveyed MPP plots is presented in Table 1. For each plot, 3 topsoil samples (as reduplicates) were collected at a depth of 0–5 cm (avoid the plot edge). Additionally, sampling positions were all on the flat tops of sand dunes to eliminate the effects of microphysiognomy. Soil samples were also collected in the uncovered sandy area referred as CK.

2.3. Soil Fractal Model Descriptions

To identify topsoil PSD information and fractal characteristics, all soil samples were treated following the procedures which were described in the references [8,10]. Soil PSD data was generated with a laser diffraction technique by using a Malvern Instrument MS 2000 (Malvern, UK) with a measurement range of 0.01–2000 μm and a margin of error of 2%.
Tyler & Wheatacraft (1992) [5] put forward a fractal model of PSD expressed with the relationship between the cumulative volume and particle-size of the soil, the calculation of singular fractal dimension D as follows (Equation (1)):
V ( r < R i ) V T = ( R i R max ) 3 D  
where r—soil particle-size, Ri—soil particle-size of grade i, Rmax—greatest value of soil particle-size, V(r < Ri)—volume of Ri more than soil particle-size, and VT—general volume of soil particles [34,35]. The measured data have linear relationships bewteen Lg value of (V/VT) and (Ri/Rmax) and carrying out linear regression analysis, the slope (k) is obtained, and D = 3 − k. The parameters of Lg value of (V/VT) and (Ri/Rmax), and D were used in this study.

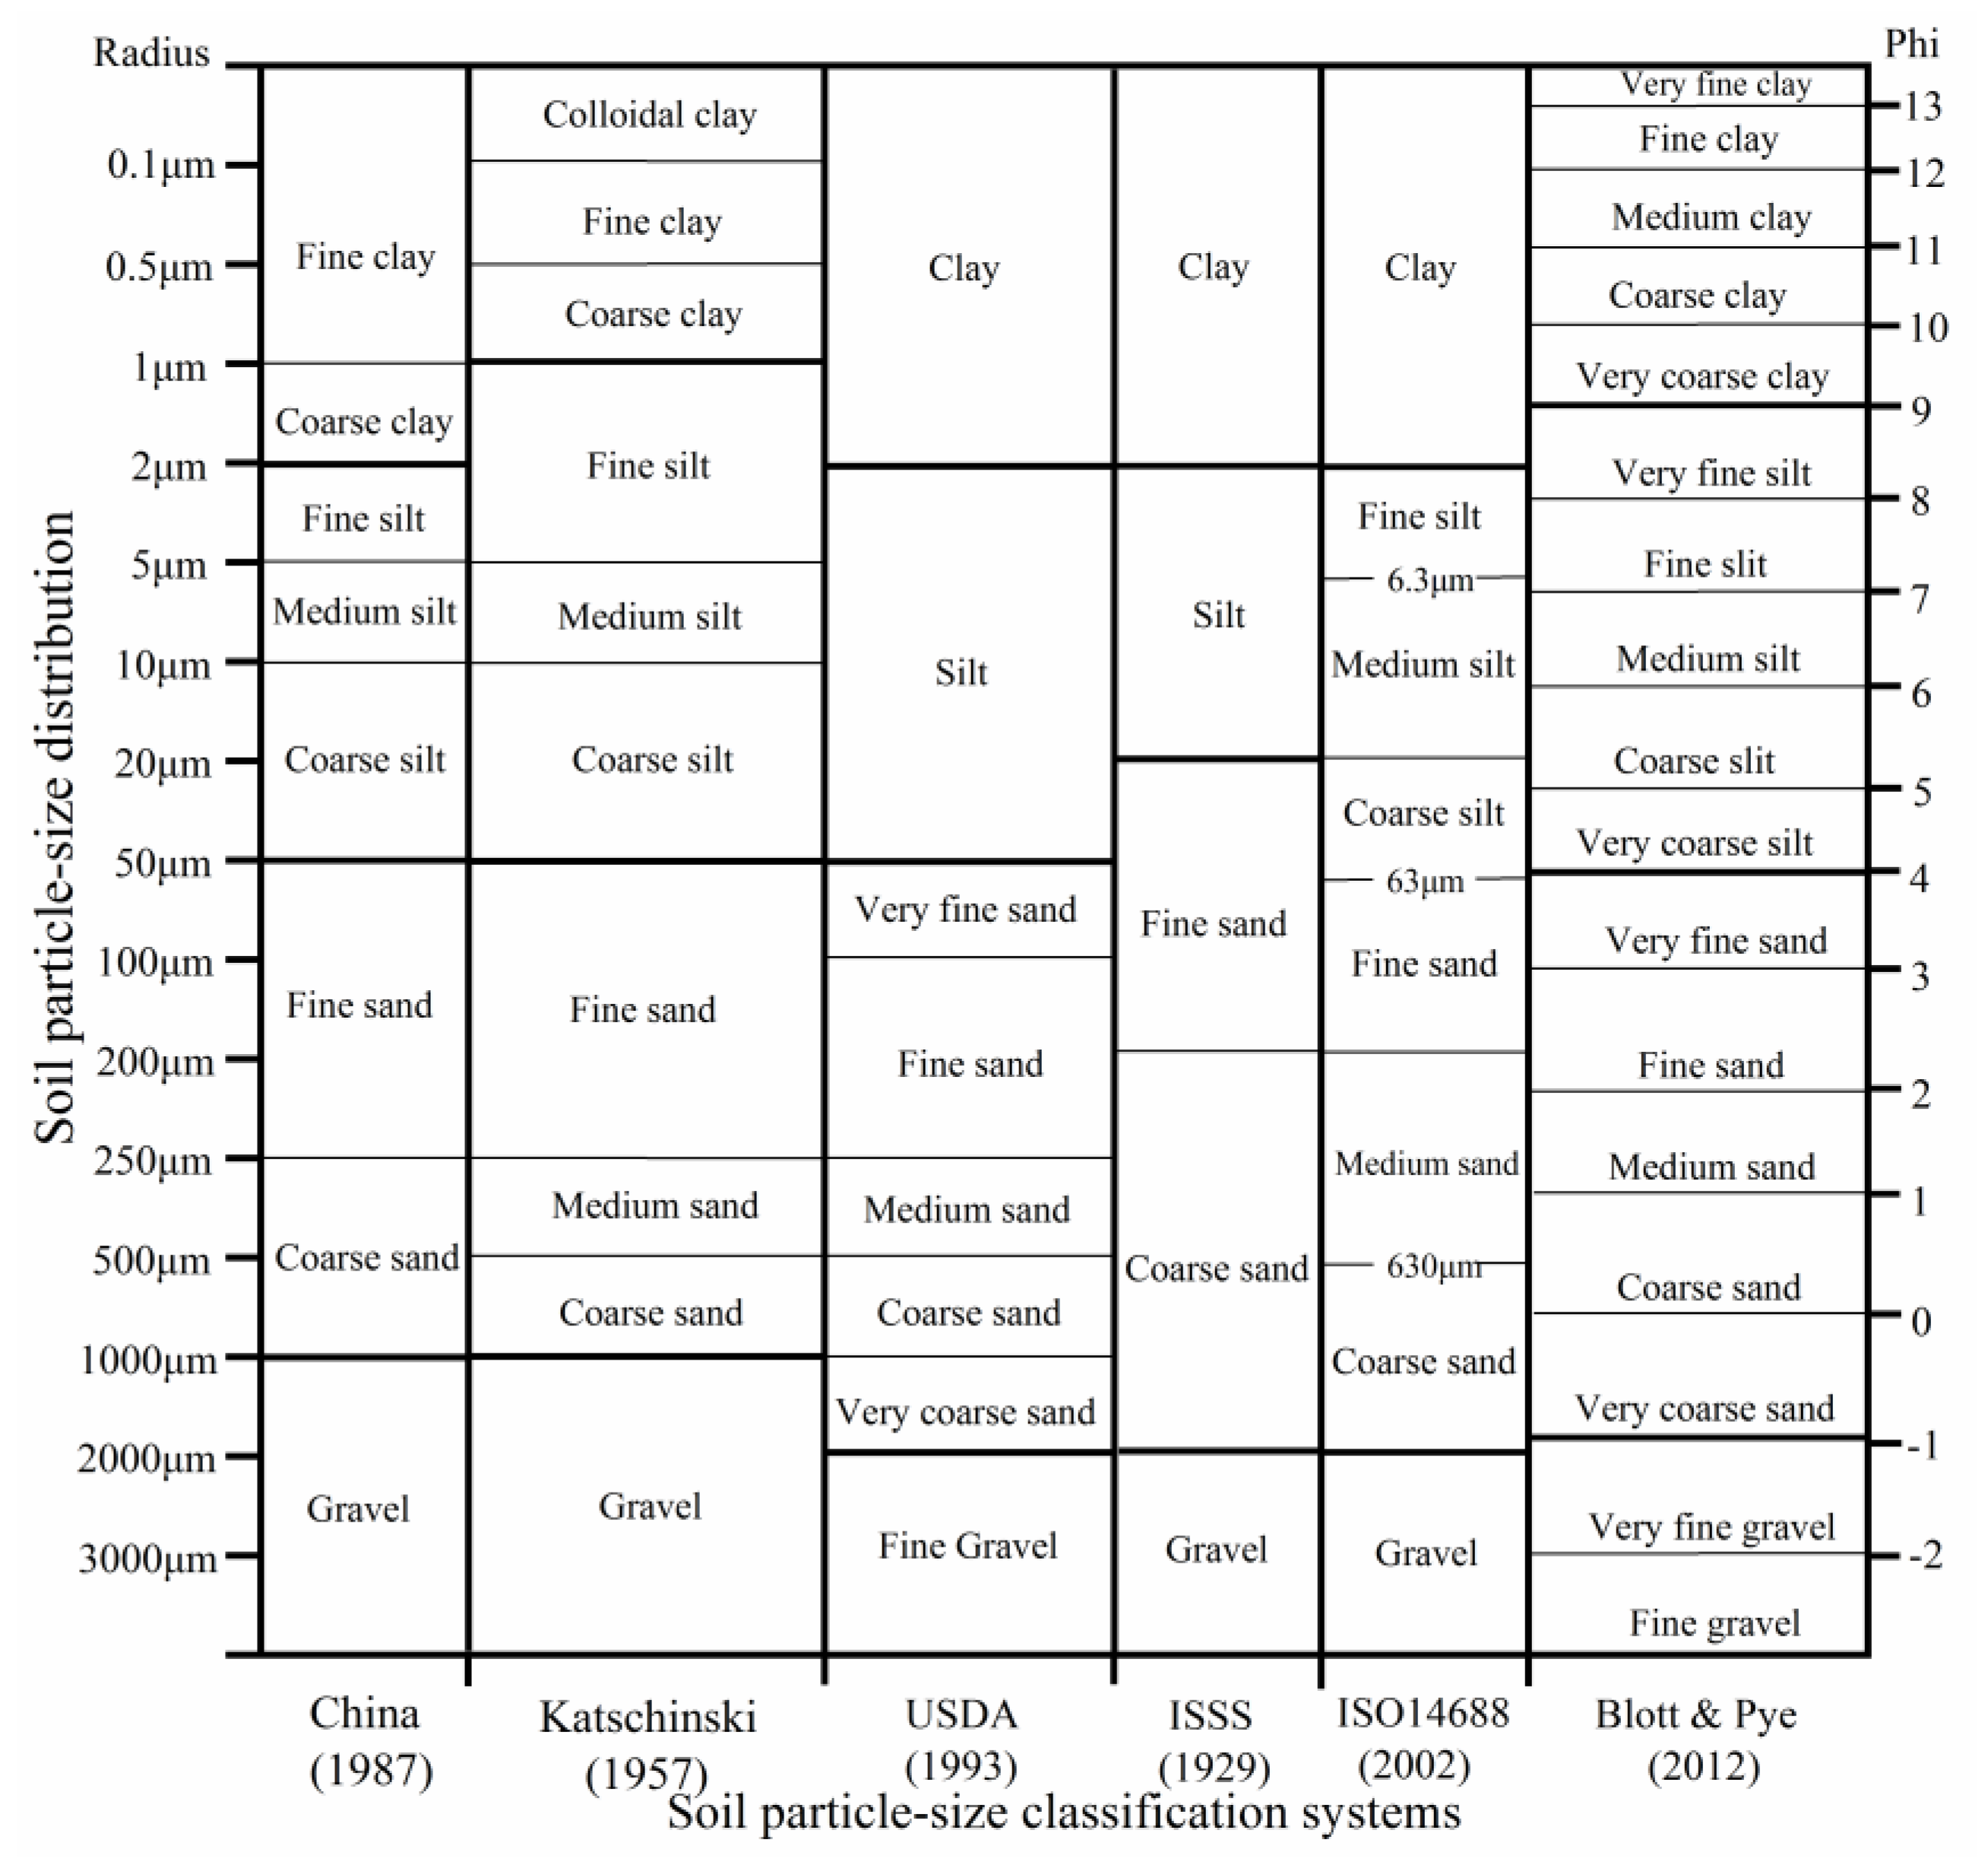
2.4. Particle-Size Scales and Terminology

The soil PSD outputs by using China (1987), Katschinski (1957), USDA (1993), ISSS (1929), ISO14688 (2002), and Blott & Pye (2012) PSC systems as follows (Figure 2).

2.5. Data Processing and Statistical Analysis

All data presented in the figures and tables are average values. The One-way analysis of variance procedures (ANOVA) and Duncan test (at p < 0.05) was used to compare means of soil PSD and Ds among surveyed plots represented by different capital letters. Pearson’s correlation coefficients, employing a 2-tailed test, were used to detect the relations between Ds under different PSC systems (at p < 0.01). Linear regression was used to identify the relations between Ds and soil particle fractions. Statistical analysis by using SPSS software version 21.0 (IBM Inc., Amok, NC, USA). Plotting was completed using OriginLab OriginPro 2018 software (OriginLab Inc., Northampton, MA, USA).

3. Results

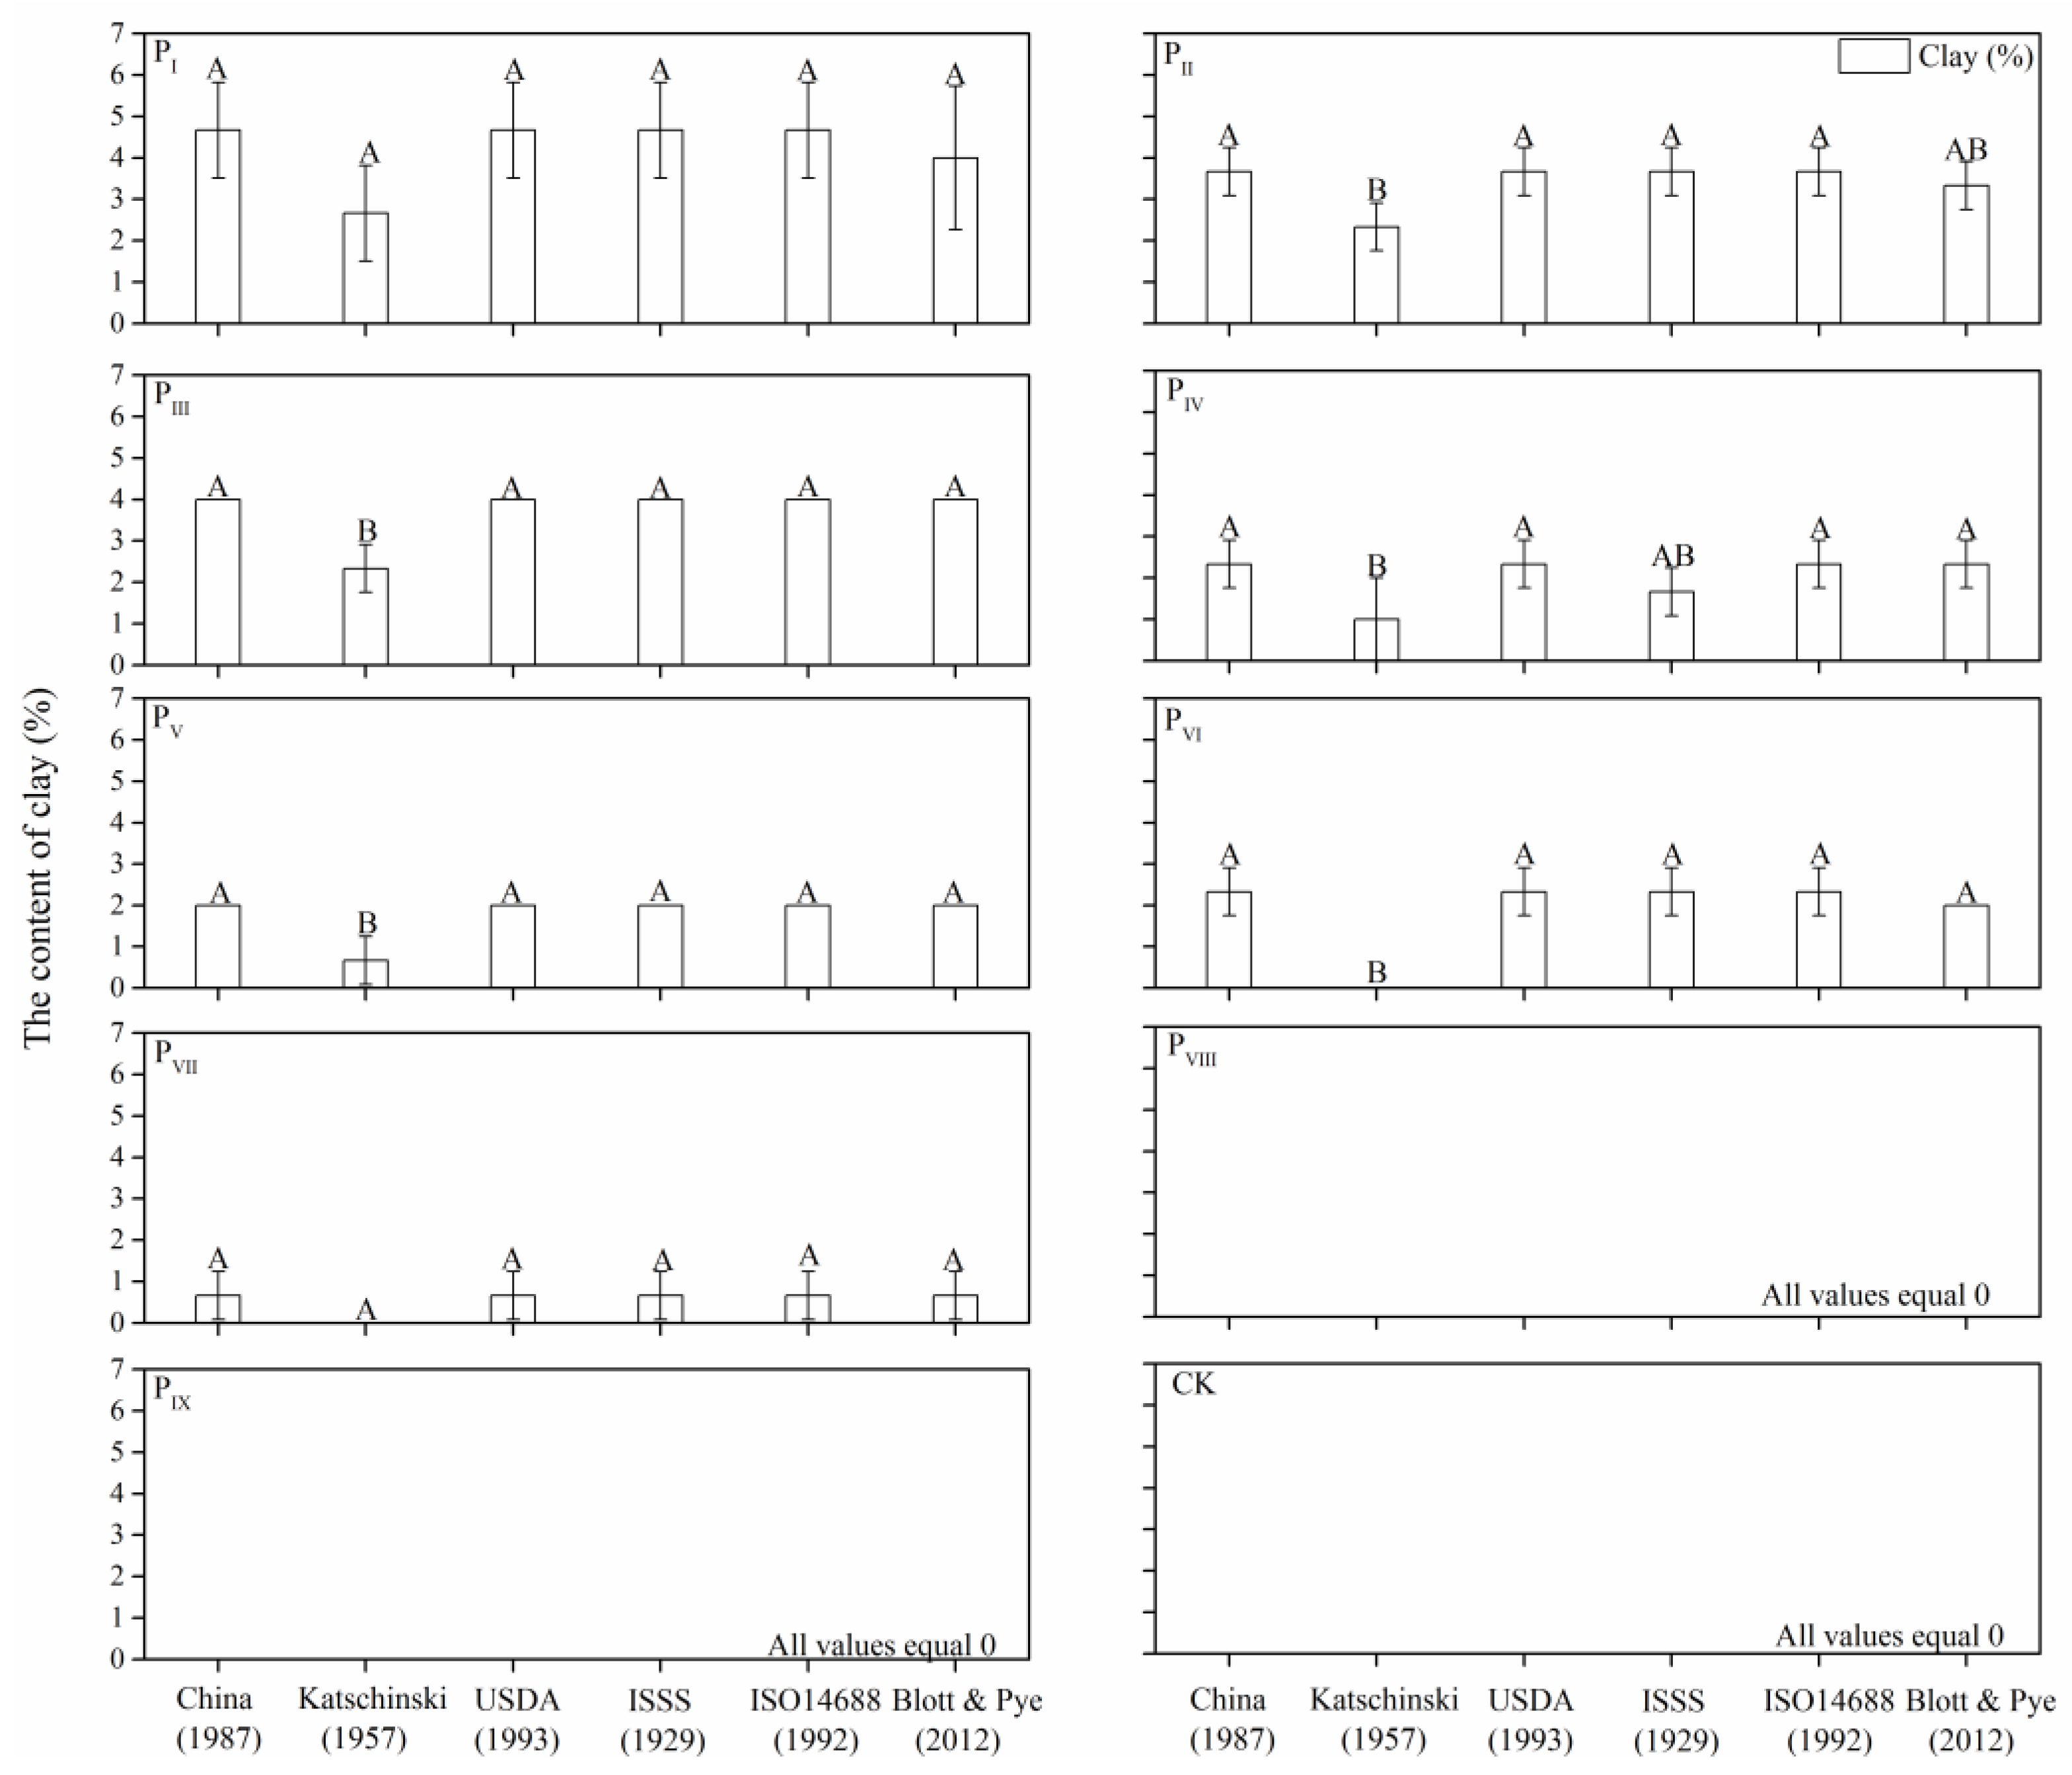
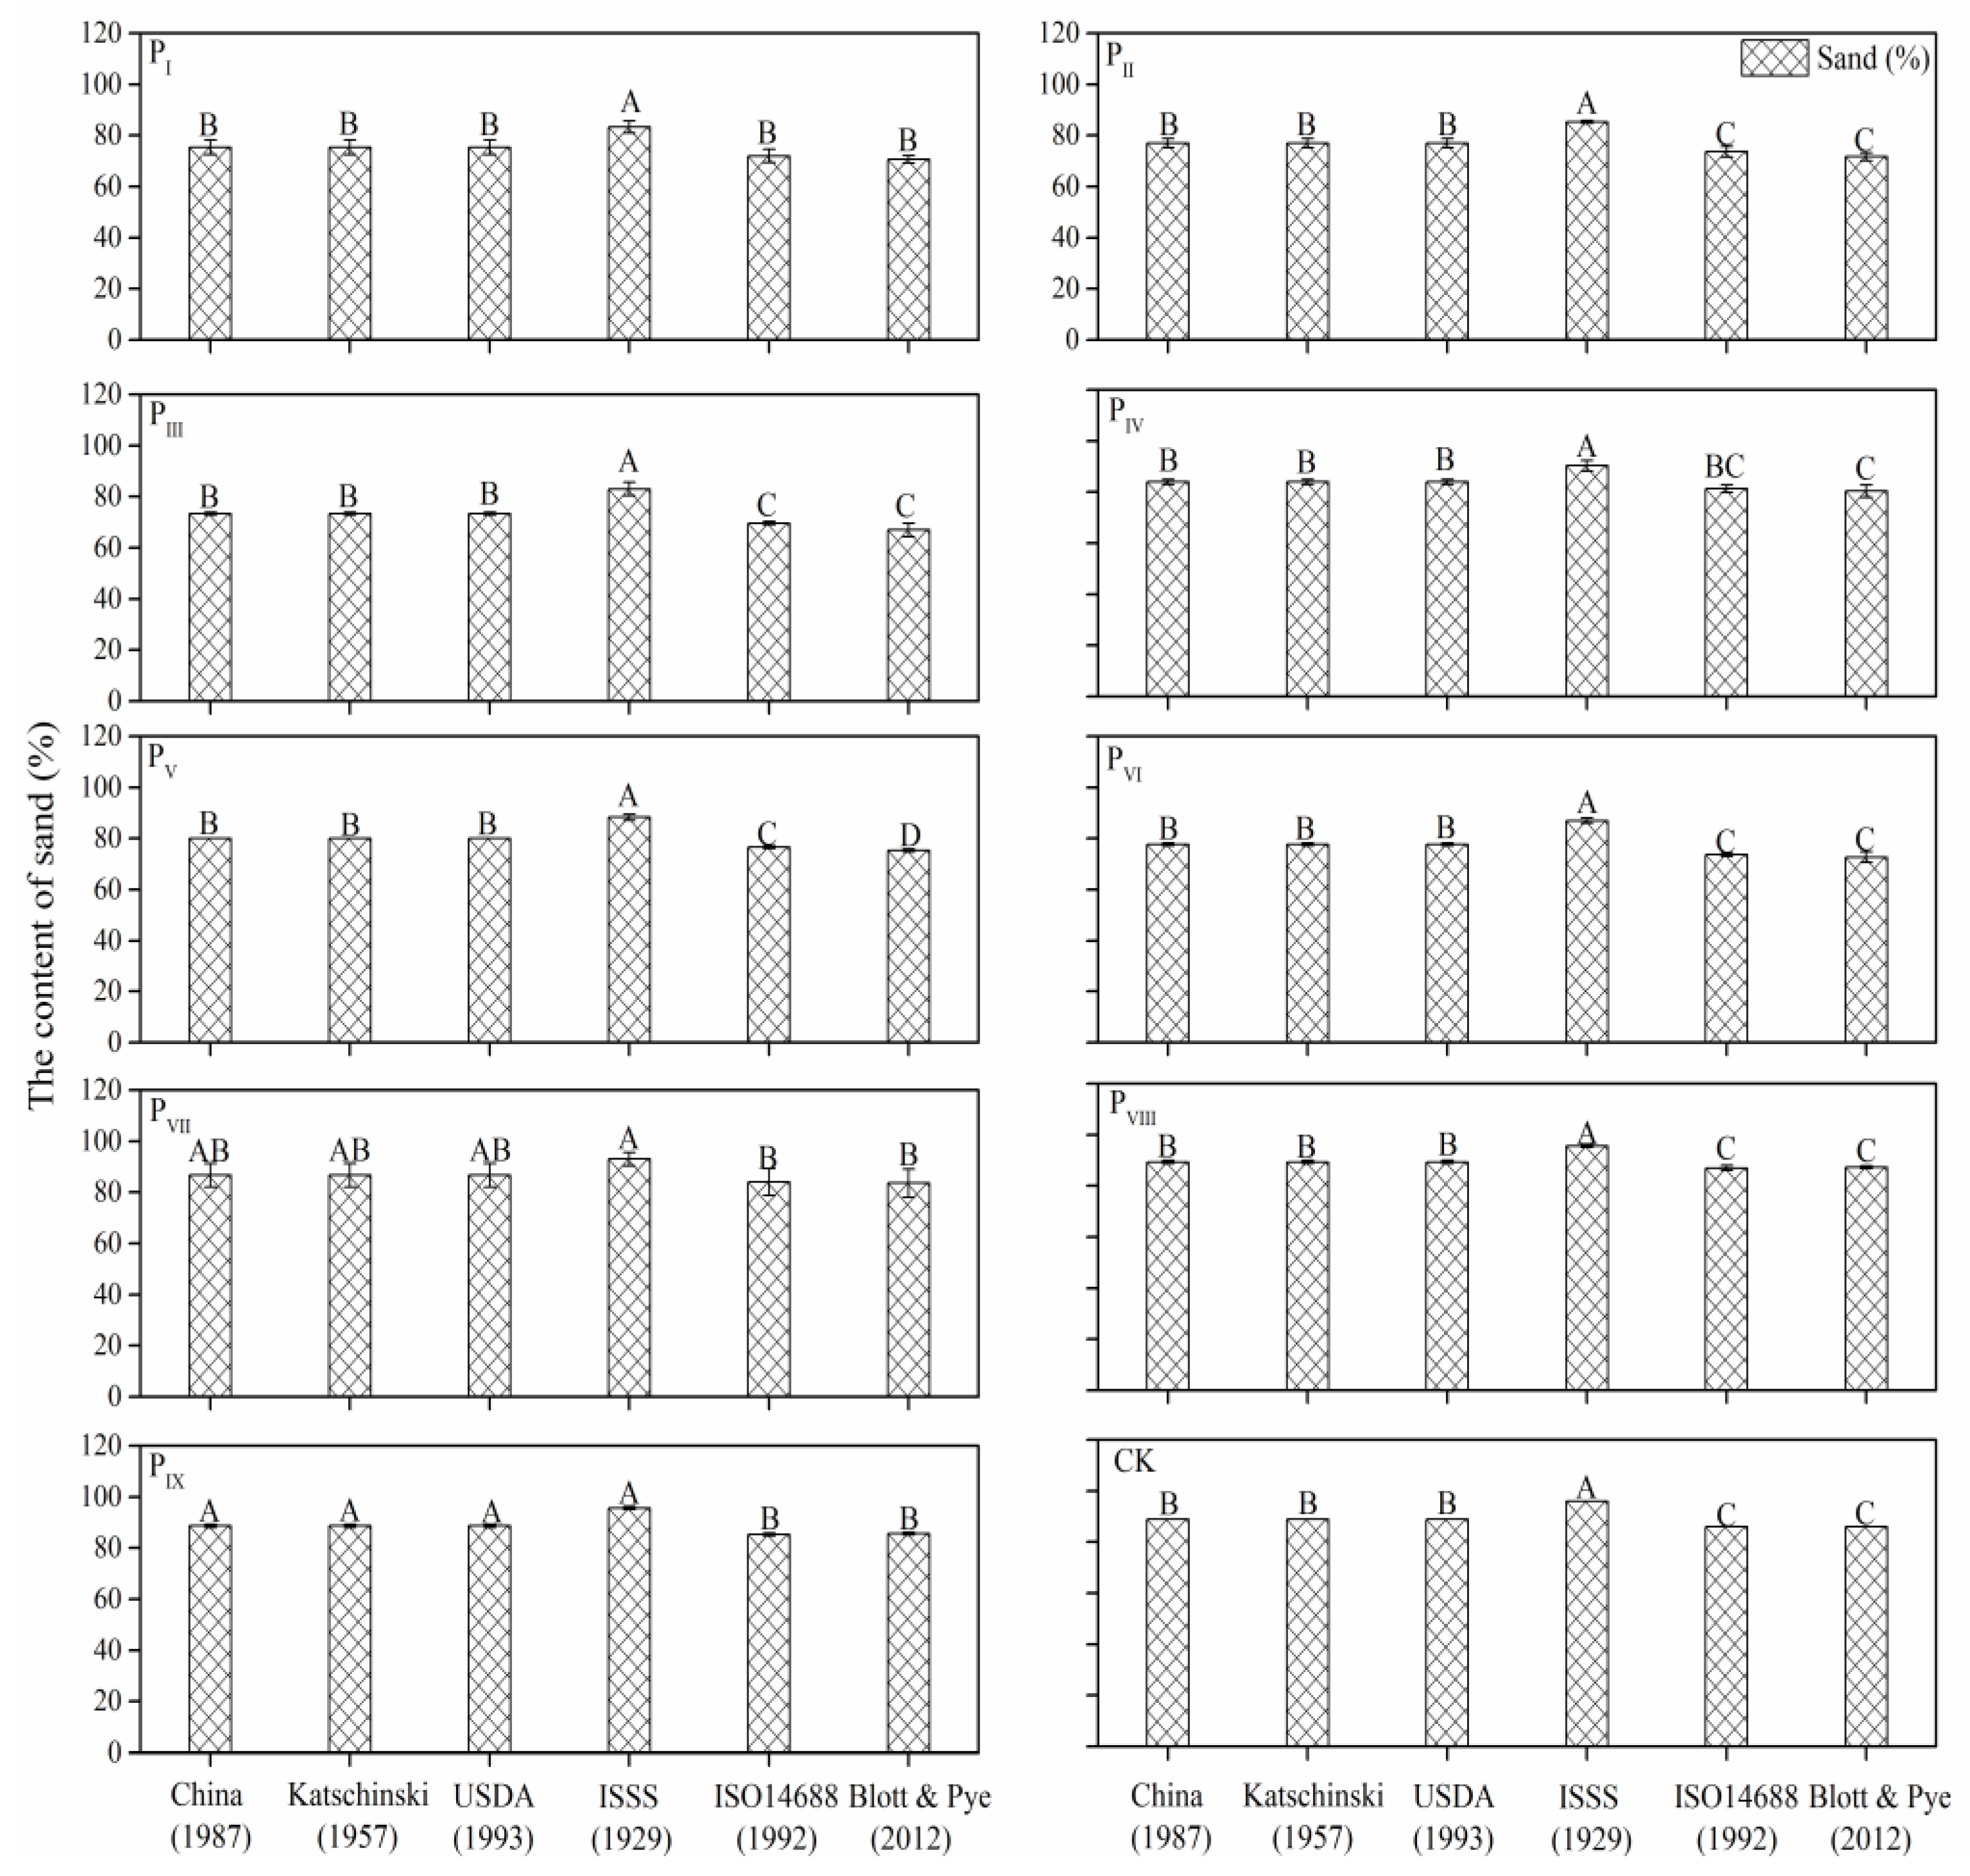
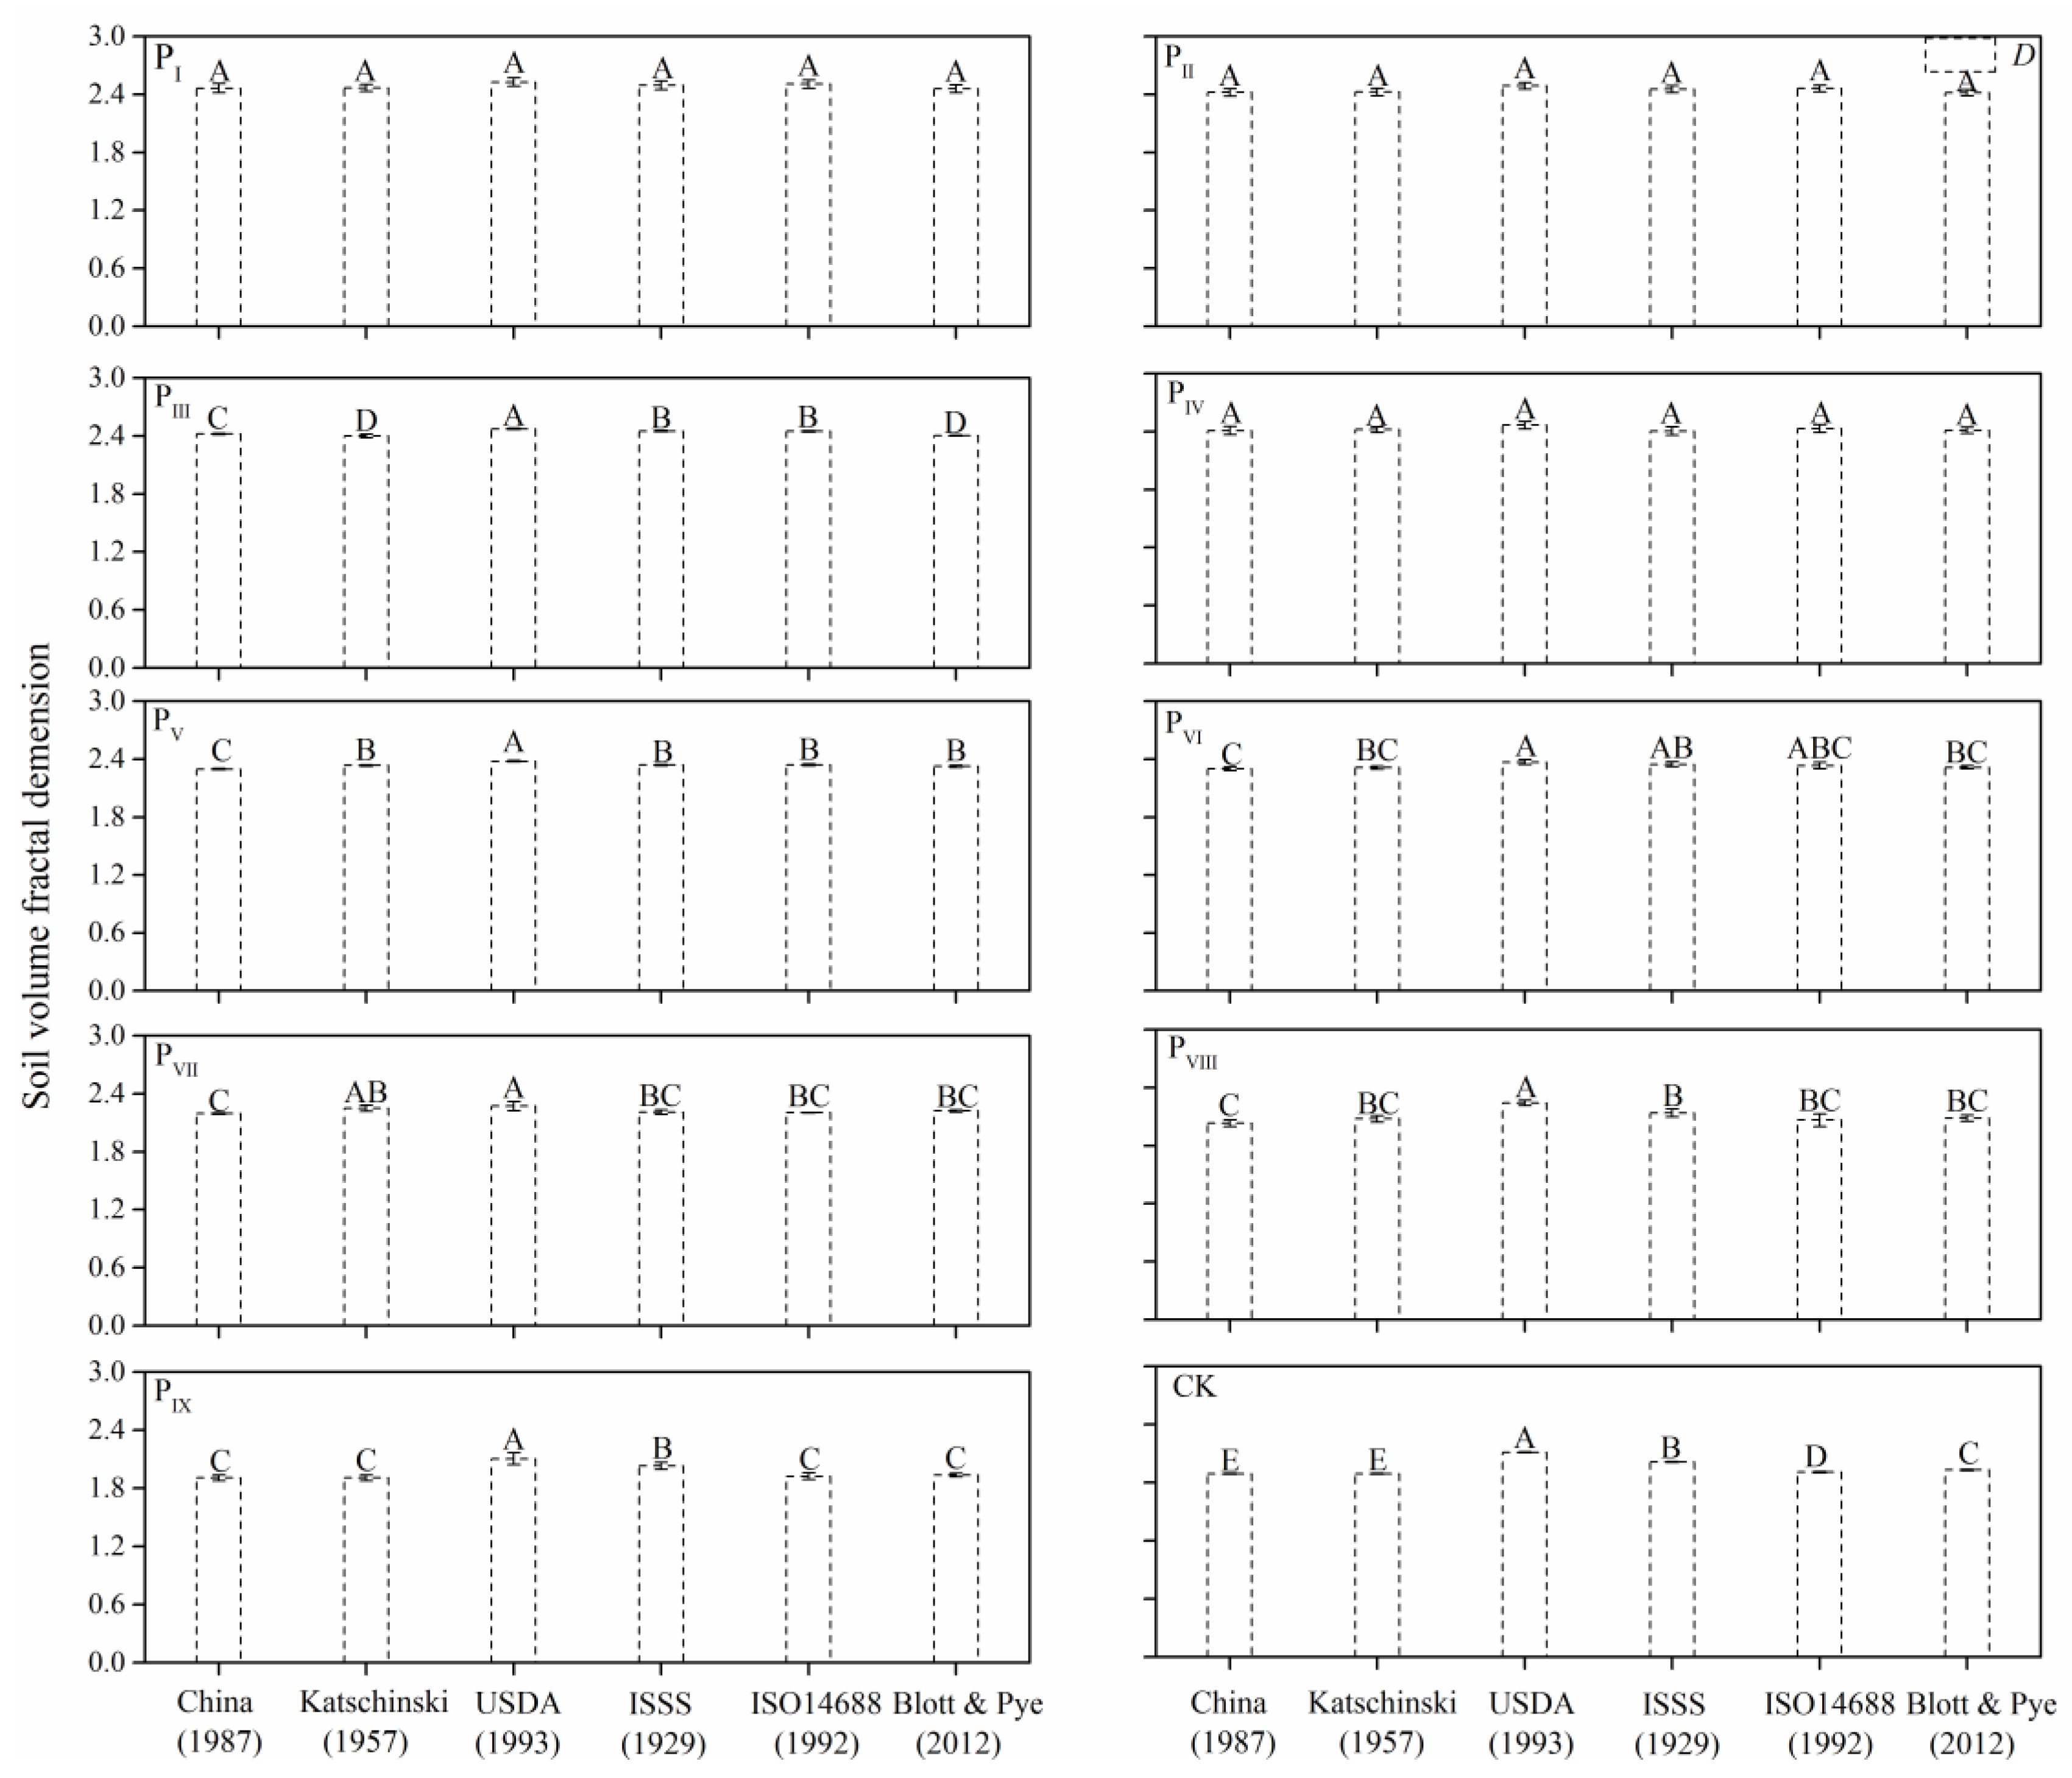
3.1. Soil PSD and Ds under Different PSC Systems

Soil PSD of surveyed plots under six PSC systems were classified (as shown in Figure 3, Figure 4 and Figure 5). In the surveyed plots, the prevailing soil PSC was the size of sand particles (>70.000%) followed by silt and clay (<4.000%) contents. Soil of this nature is classified as quartisamment (U.S. Soil Taxonomy), which is identified in semiarid regions of China.
Amount of variability as observed in PI and other plots. From PI (2700 trees·ha–1) to PIX (900 trees·ha–1), the content of clay and silt decreased, while sand content gradually increased with forest density. Compared with CK (0.000 ± 0.000%, 11.000 ± 0.000%, and 89.000 ± 0.000% for clay, silt, and sand contents under USDA (1993) PSC system), from PI (4.667 ± 1.155%, 20.000 ± 1.732%, and 75.333 ± 2.887%) to PIX (0.000 ± 0.000%, 11.333 ± 0.577%, and 88.667 ± 0.577%), clay contents were increased by 466.700% and 0.000%. Silt contents were increased by 81.819% and 3.0273%. Sand contents were decreased by 15.356% and 0.374%. Clay and silt content differed greatly between MPPs and CK.
Among clay, silt, and sand contents calculated by using six PSC systems, China (1987), USDA (1993), ISSS (1929), and ISO14688 (2002) PSC systems had the widest range of clay (I < 2.0 μm), while Katschinski (1957) and Blott & Pye (2012) had a relatively narrow range of clay (I < 1.0 μm and ϕ > 9.0). As shown in Figure 3, clay contents of six PSC systems varied greatly, especially in plots of PII, PIII, PIV, PV, and PVI (p < 0.05). The ISO14688 (2002) and Blott & Pye (2012) PSC systems had the widest range of silt (2 μm < I < 63 μm, 4.0 < ϕ < 9.0), while ISSS (2002) PSC system had a relatively narrow range of silt (2 μm < I < 20 μm) (Figure 4). There were significant differences between Blott & Pye (2012) and ISSS (1929) PSC systems in calculating silt contents of MPPs and CK plots (p < 0.05). Additionally, there were significant differences between China (1987), USDA (1993), and ISSS (1929) PSC systems in calculating silt contents in plots of PV and PVI (p < 0.05) (Figure 5). Accordingly, there were significant differences between ISSS (2002) and the other five PSC systems in calculating the content of sand fractions in surveyed plots (p < 0.05). The ISO14688 (2002) and Blott & Pye (2012) PSC systems had a relatively narrower range of sand. Moreover, there were obviously differences between these two PSC systems and other four PSC systems in calculating the content of sand fractions in plots of PII, PIII, PV, PVI, PVIII, and CK (p < 0.05).
Based on the results of soil PSD under different PSC systems, then to explore Ds calculated by different PSC systems. Ds calculated by China (1987), Katschinski (1957), USDA (1993), ISSS (1929), ISO14688 (2002), and Blott & Pye (2012) PSC systems covered a range from 1.897 to 2.519, 1.897 to 2.507, 2.0372 to 2.575, 2.00140 to 2.545, 1.895 to 2.554, and 1.918 to 2.504, respectively. The highest D was found in PI with clay and silt contents of 4.667 ± 1.155% and 20.000 ± 1.732% and sand content of 75.333 ± 2.887% (USDA (1993) PSC system). The lowest D value corresponded to CK with clay and silt contents of 0.000 ± 0.000% and 11.000 ± 0.000% and higher sand content (89.000 ± 0.000%) (Figure 3, Figure 4 and Figure 5). In addition, the general sequence of Ds is the following: USDA (1993) > ISO14688 (2002) > ISSS (1929) > Katschinski (1957) > China (1987) > Blott & Pye (2012) PSC systems (Figure 6).

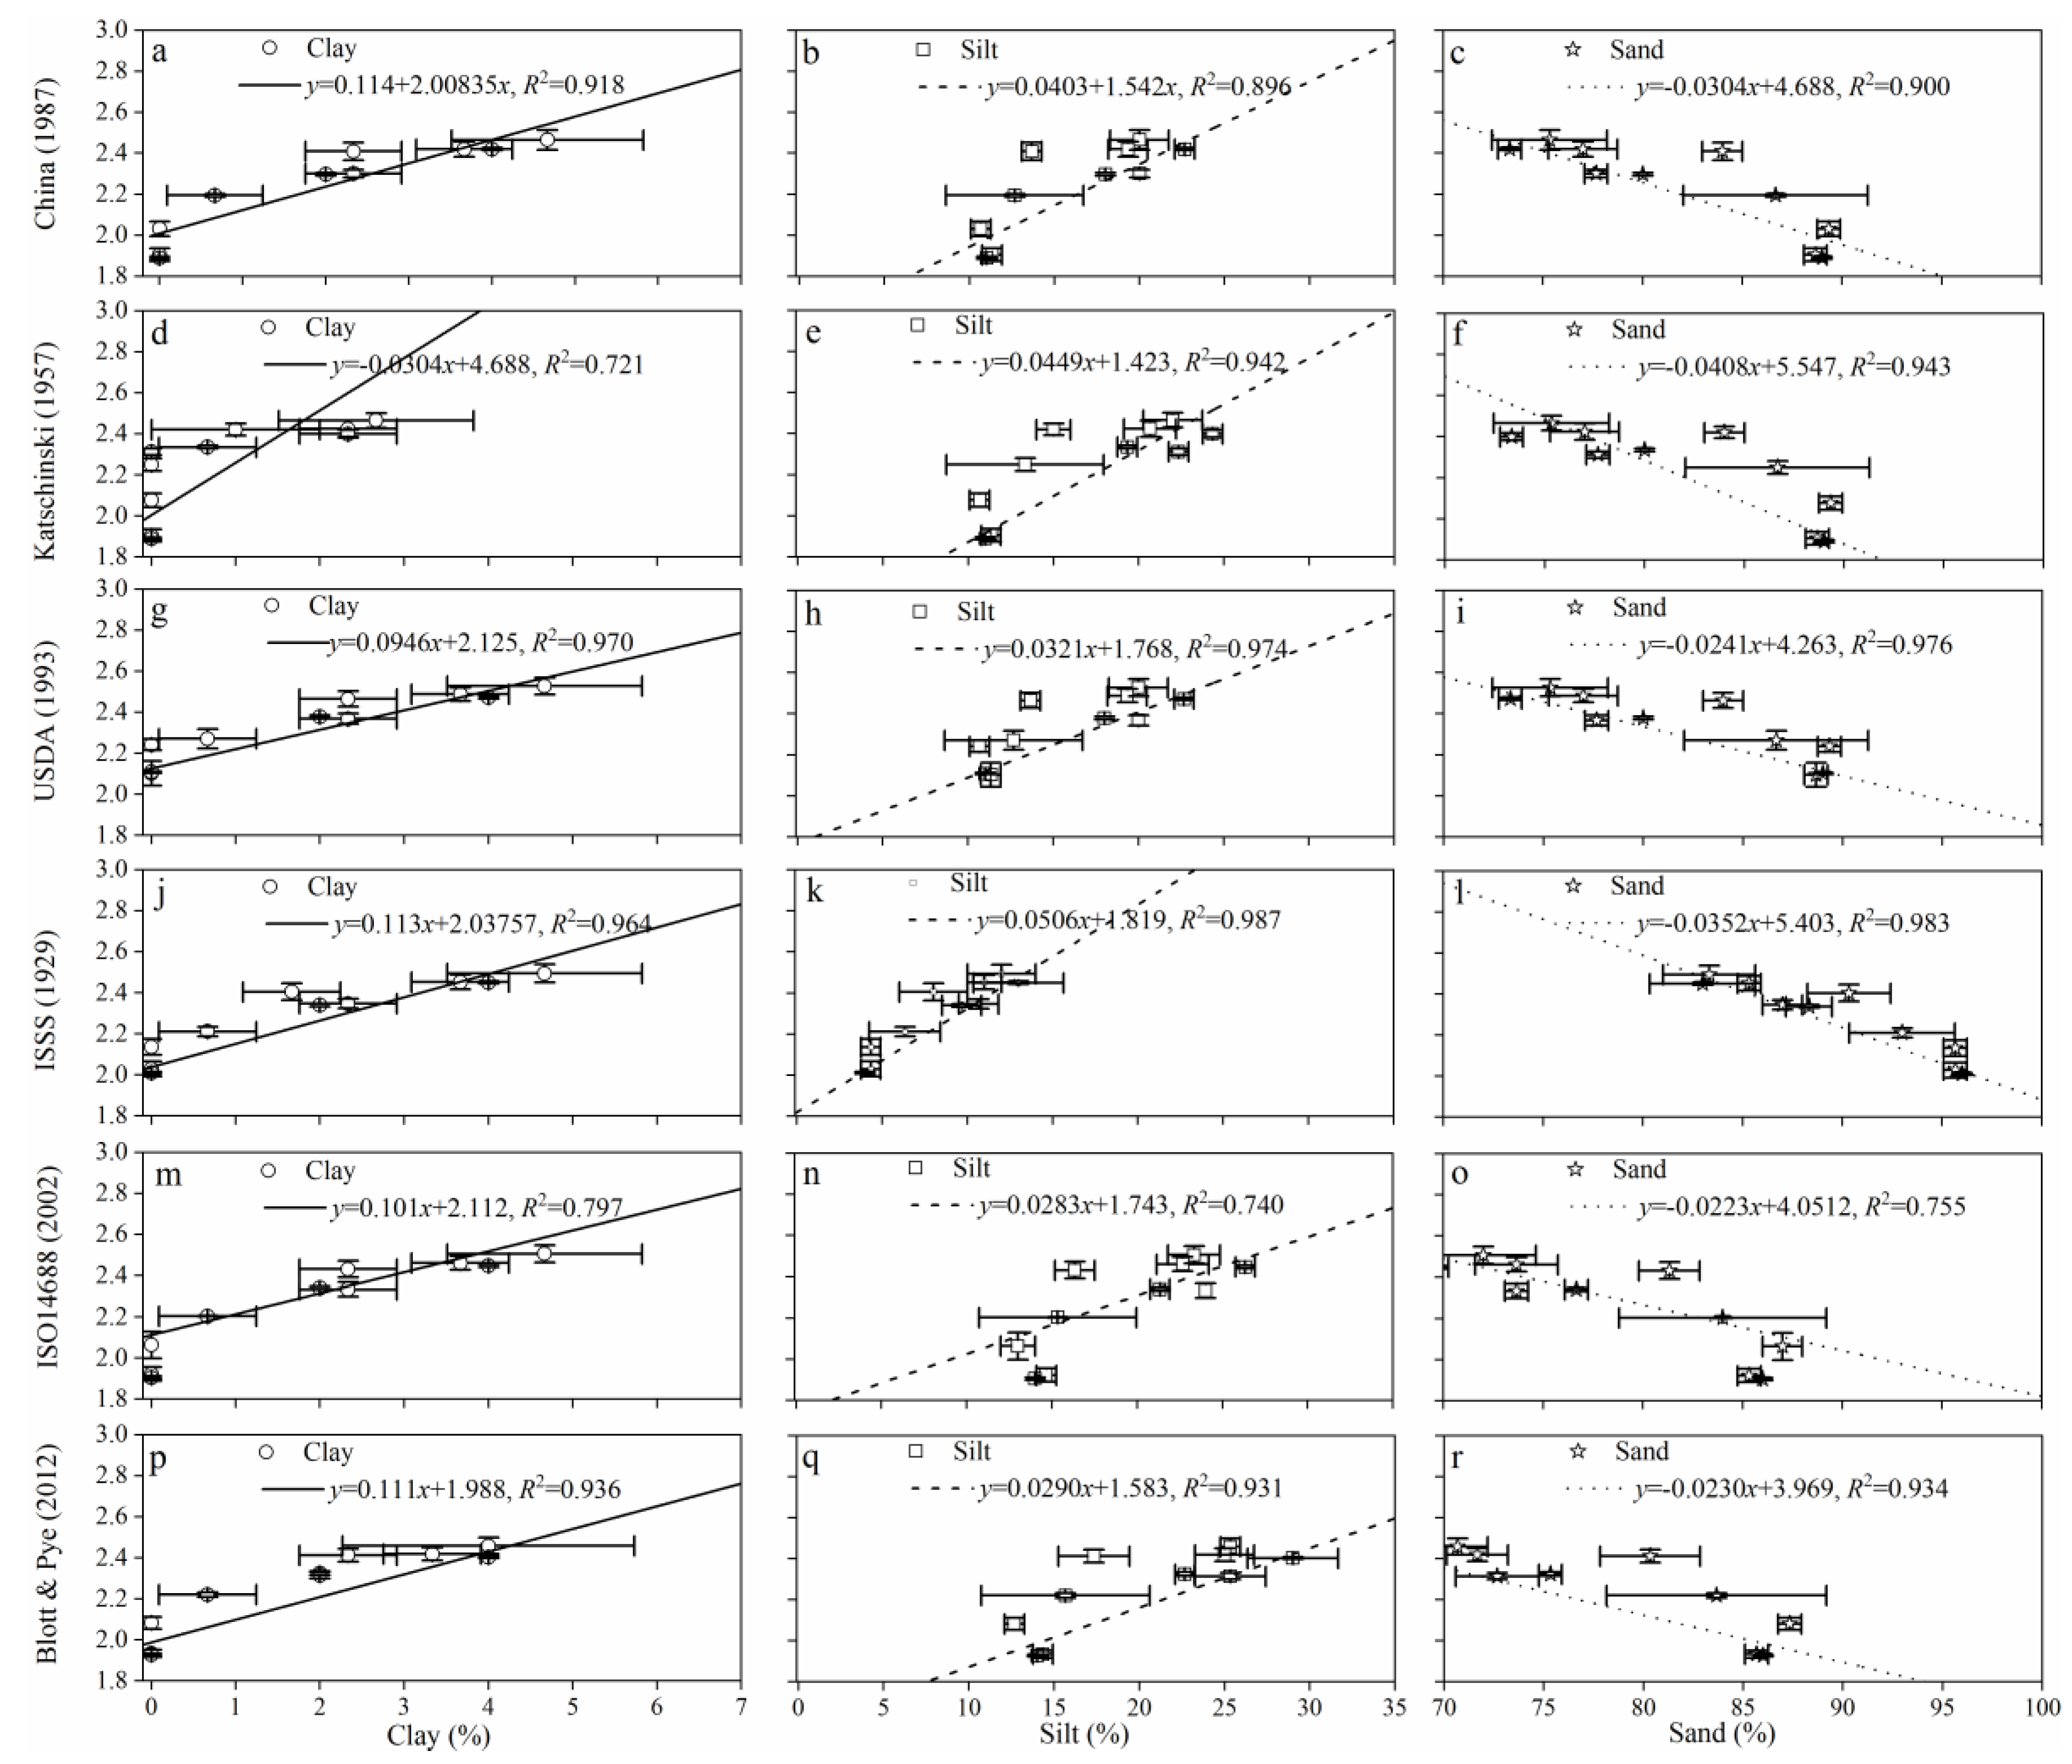
3.2. The Relations between Ds and PSD of Sample Contents under Different PSC Systems

The results of Soil PSD and Ds under different PSC systems were specified, and linear regression analysis was applied to identify correlations between Ds and PSD of sample contents (in Figure 7). Results indicated that a positive linear correlation existed between Ds and clay as well as silt contents with R2 range from 0.721 to 0.964 and 0.740 to 0.987. By contrast, Figure 7 showed a negative linear correlation between Ds and sand contents (R2 = 0.755–0.983). Among all the PSC systems, Ds calculated by China (1987), USDA (1993), ISSS (1929), and Blott & Pye (2012) had higher R2 values with soil PSD, while Ds calculated by Katschinski (1957) and ISO14688 (2002) had relatively lower R2 values with soil PSD.

3.3. Relationships between Soil Fractal Dimensions under Different PSC Systems

In order to compare these PSC systems, Pearson correlation method was applied. Soil D calculated by China (1987), Katschinski (1957), USDA (1993), ISSS (1929), ISO14688 (2002), and Blott & Pye (2012) PSC systems were strongly correlated (Table 2). Correlation coefficients were above 0.970 (p < 0.01), which means these six PSC systems were highly correlated.

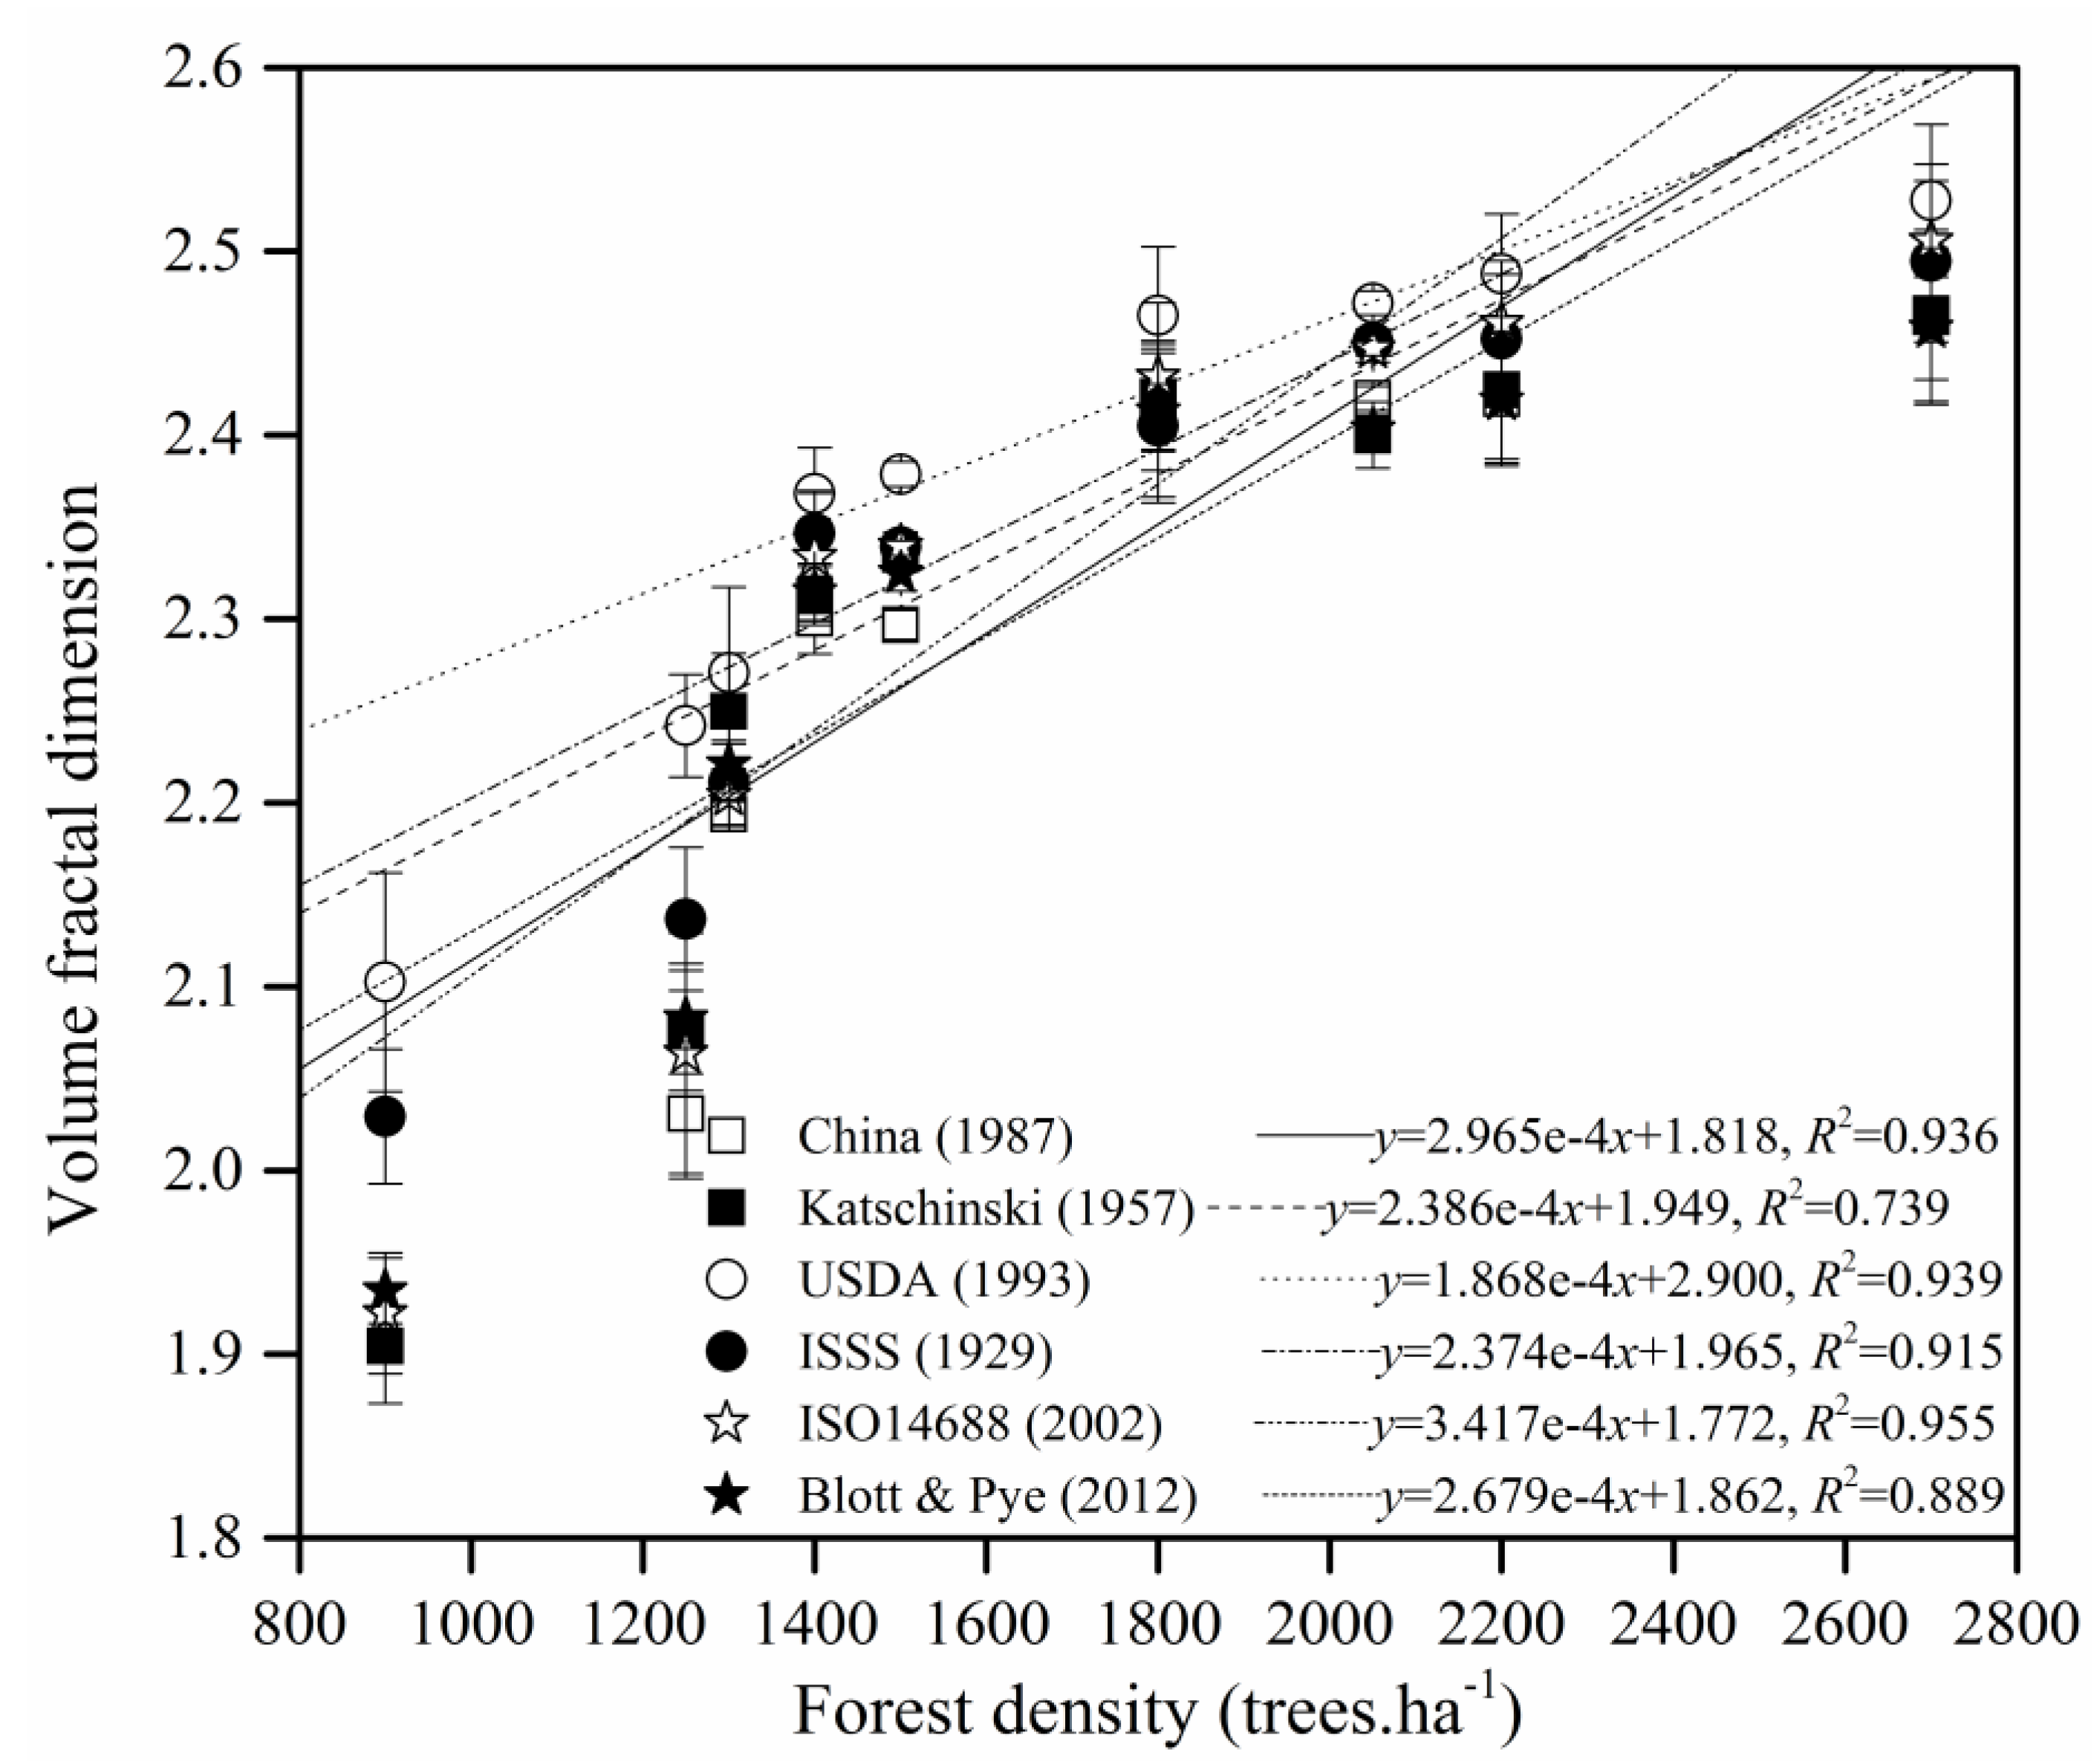
3.4. Relationships between Forest Densities and Soil Fractal Dimensions under Different PSC Systems

To test the application of six PSC system. Soil Ds of different forest densities of MPPs plots were taken as examples to apply the China (1987), Katschinski (1957), USDA (1993), ISSS (1929), ISO14688 (2002), and Blott & Pye (2012) PSC systems. As shown in Figure 8, Ds varied dramatically among surveyed plots or under different PSC systems, there was a clear tendency that Ds were greatly affected by the forest densities. The results showed that Ds is increasing with the increase of forest densities in sampling plots. A strong positive linear correlation was observed between Ds calculated by six PSC systems (R2 = 0.739–0.955). Ds calculated by Katschinski (1957) PSC systems had relatively weaker correlation with forest densities. However, R2 between the other five PSC system varied little.

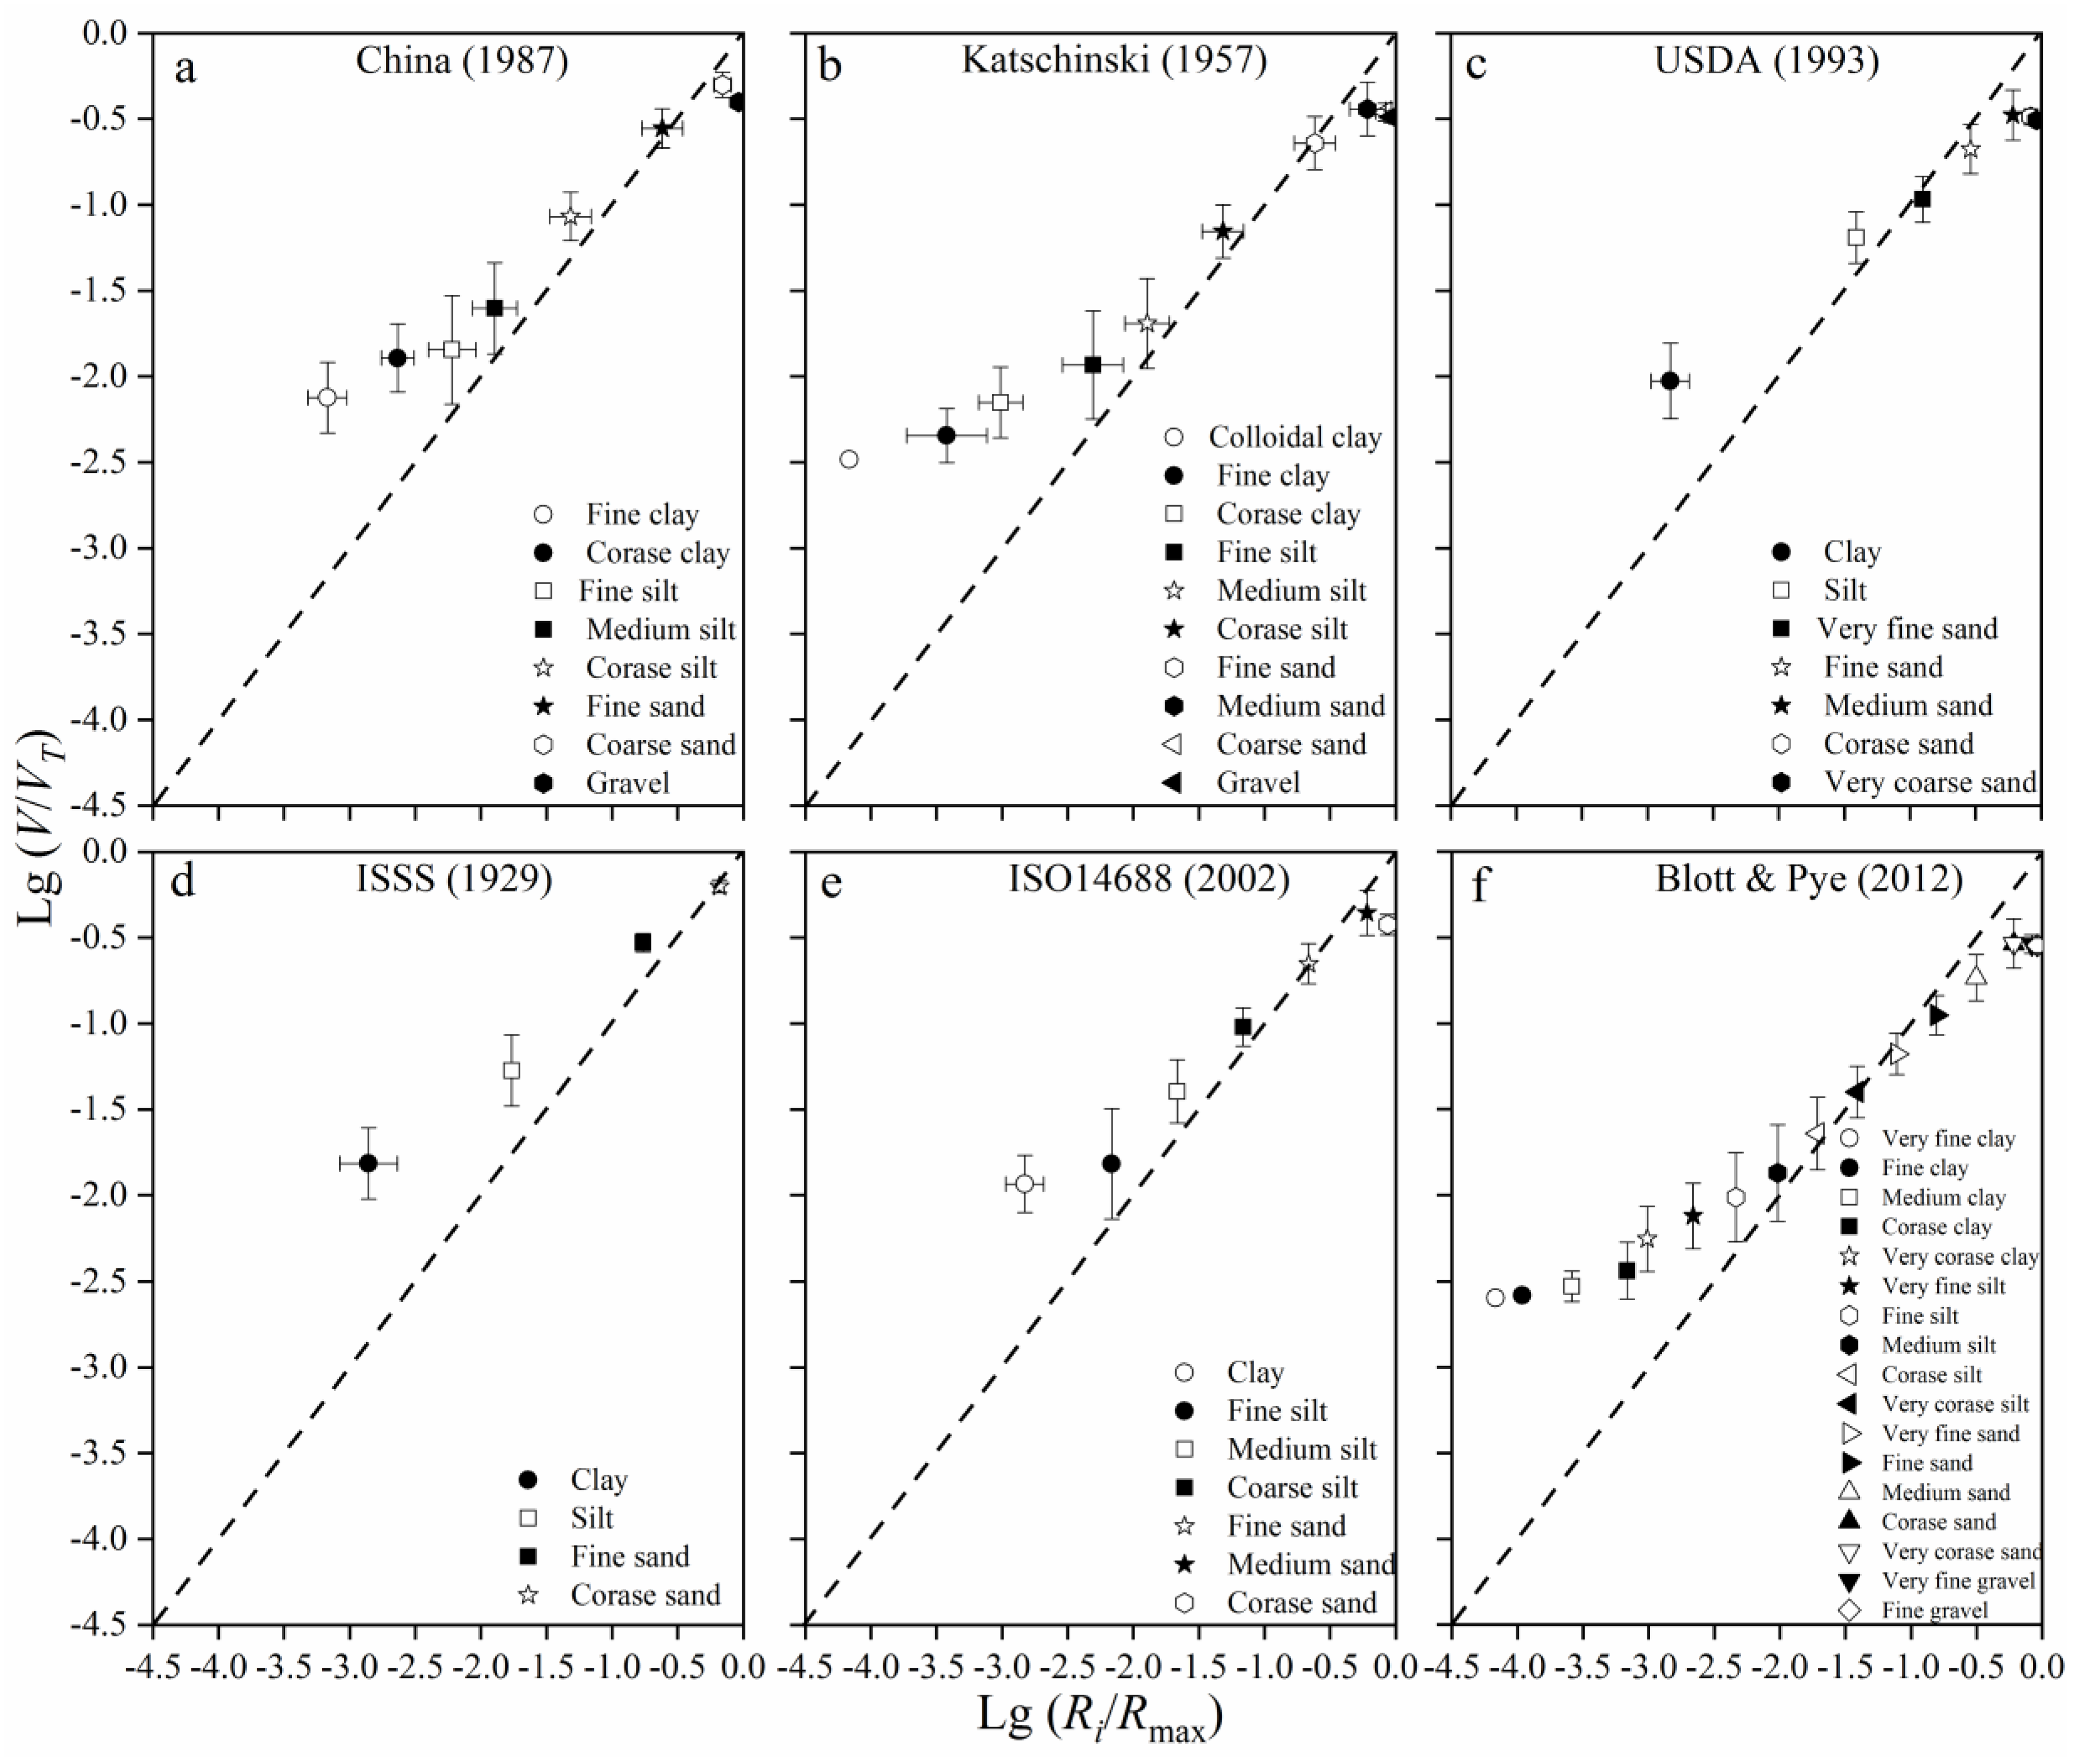
3.5. Sensitivities of Calculation of Soil Fractal Dimensions to Different Soil PSC

To further analyze the effects of PSC systems on calculating volume fractal dimensions, results of Lg (V/VT) and Lg (Ri/Rmax) change under different PSC systems were analyzed. The variation trend indicated that refining clay and sand scales could lower slope (k) of the regression equation, then Ds increased (in Figure 9). Accordingly, Ds decreased while silt scales were refined. Among all PSC systems, Blott & Pye (2012) PSC system contained the most information comparing to the other five PSC systems.

4. Discussion

The main approach for soil PSD analysis, textural triangle is limited by the arbitrary classification of PSD scales [36,37,38]. To date, there remains no general agreement about what PSD of sediments and other soils types attributes should be monitored and described based on different PSD scales and PSC systems, worldwide [28]. During our research, different PSD scales and descriptive terminologies including China (1987), Katschinski (1957), USDA (1993), ISSS (1929), ISO14688 (2002), and Blott & Pye (2012) PSC systems were selected. The China (1987), USDA (1993), ISO14688 (2002), and Blott & Pye (2012) PSC systems have almost the same range of clay, silt, and sand scales. However, Katschinski (1957) PSC system has a larger range of clay scale, while ISSS (1929) PSC system has a larger range of sand scale. Apparently, fully dividing the soil fractions like clay, silt, and sand could display the most information of integrated indicators and of soil property characteristics, but the existing schemes do not contribute to a completely true logical or sufficient basis for description and comparison of soil PSD. For example, Katschinski (1957) PSC system divides the <1 μm particle into colloidal, fine, and coarse clay fraction, while USDA (1993) PSC system divides the >50 μm particle into fraction into very fine, fine, medium, coarse and very coarse sand fraction. In this study, Blott & Pye (2012) PSC system is recommended due to its sufficient subdivisions of clay, silt, and sand classes.
Fractal method can be applied for various disciplines like soil science, computer science and network, etc. [39,40,41,42,43,44,45,46,47]. Fractal analysis associate with laser diffraction could provide opportunity of revealing soil information [13,38,40]. Recent studies showed the Ds increased with clay and silt fractions but decreased with sand fractions following a linear trend [32,41,43], and our research results agree with the mentioned studies above. Moreover, in the previous studies, topsoil profile of vegetation solutions could obviously prevent land desertification and thus the clay and silt contents would be increased, then it usually had higher Ds [8,44]. Since accumulative fine particles like clay and silt fractions can be rapidly eroded and lost than sand fraction [18,45]. In our study, anti-desertification solutions like MPPs establishment had a considerable effect in the increase of the clay and silt fractions, also with the forest densities of MPPs increased.
Though Ds calculated by China (1987), Katschinski (1957), USDA (1993), ISSS (1929), ISO14688 (2002), and Blott & Pye (2012) PSC systems varied differently, they were highly correlated with correlation coefficients above 0.970 (p < 0.01), and great strength of correlations between Ds and forest densities (p < 0.01). The PSD prediction has been used for comparing and converting texture measurements from diverse PSC systems [2,21,27]. For instance, in the Second National Soil Surveys of China, soil textures were measured by ISSS (1929) and Katschinski (1957) PSC systems, in which the conversion from ISSS and Katschinski’s to the widely used USDA (1993) PSC system [48,49]. In this study, PSD characteristics which are described by fractal method were investigated because of its simplicity and effectiveness to compare the different PSC systems. To our knowledge, a few studies have been performed with such the purpose. Therefore, the fractal method can provide a feasible way to describe the PSD and to convert the data or texture measurements from China (1987), Katschinski (1957), and ISSS (1929) schemes to the USDA (1993) and ISO14688 (2002) standards or vice versa.
Previous studies have found more clay and silt contents associated with higher fractal dimensions of PSD [1,35,36]. However, subdividing the clay, silt, and sand fractions more specifically could not simply increase or decrease D values. During our research, curve of Lg (V/VT) and Lg (Ri/Rmax) changes under different PSC systems indicated that refining clay and sand scales could lower slope (k) of regression equation, then Ds became larger. Such a tendency is more obvious in Katschinski (1957) and Blott & Pye (2012) PSC systems.
In conclusion, Ds of soil PSD could provide fully information related to desertification processes and anti-desertification methods. Thus, a general consensus is urgently needed to define the proper PSC system that can more adequately describe the PSD attributes of sediments and soils and thus estimate fractal dimensions of soil PSD. By comparing among all the PSC systems, the highest significant correlations between Ds and clay, silt, and sand fractions in USDA (1993) PSC system. Blott & Pye (2012) PSC system had the most complete information regarding the subdivision of PSD, and in both of these PSC systems, Ds were still sensitive to the desertification combating processes by MPPs establishment and associated forest densities. Thus, USDA (1993) and Blott & Pye (2012) PSC systems are recommended in estimating soil structure and calculating soil fractal dimensions to keep the consistency and enhance the comparability and applicability of the relevant research results.
Ecological systems are complex, soil fractal dimensions vary because scientists chose different PSC systems, it remains a challenge to examine soil PSD information with fractal methods under different PSC systems from a larger field-scale are needed. Besides, further studies should focus on the range of particle size correlated with Ds by using networks analysis or other methods.

5. Conclusions

To evaluate effects of different PSC systems on calculating D. Mongolian pine plantations composed of Pinus sylvestris var. mongolica were used. By comparing top (0–5 cm) soil PSD across nine forest densities of Pinus sylvestris var. mongolica ranging from 900–2700 trees ha–1 in the southern Mu Us Sandy Land, China. The differences as well as relationships among Soil PSD and D of soil PSD under China (1987), Katschinski (1957), USDA (1993), ISSS (1929), ISO14688 (2002), and Blott & Pye (2012) soil PSD classification systems were evaluated. The following conclusions were inferred from this study:
(1)
The major soil particle-size was distributed within the sand classification, which accounted for more than 90% of the total volume. Clay and silt particle contents were much less prevalent. Blott & Pye (2012) PSC system had sufficient subdivisions of soil fractions classes, while other schemes did not provide sufficient basis for description and comparison of soil PSD. The order of volume fractal dimensions was USDA (1993) > ISO14688 (2002) > ISSS (1929) > Katschinski (1957) > China (1987) > Blott & Pye (2012) PSC systems.
(2)
There were significant positive correlations between Ds and clay and silt fractions (R2 = 0.721–0.964 and 0.740–0.987, p < 0.01), and significant negative correlations between Ds and sand fraction (R2 = 0.755–0.983, p < 0.01) under six PSC systems.
(3)
There were significant positive correlations among PSC systems with correlation coefficients ranging from 0.977 to 0.998 (p < 0.01), which also indicated they have close connection.
(4)
Ds which were calculated by six PSC systems were sensitive to the desertification combating processes like MPPs establishment and forest densities by characterizing soil PSD and its variations. Compare to the other PSC systems, Ds calculated by Katschinski (1957) PSC systems had relatively weaker correlation with forest densities.
(5)
The variation of Lg (V/VT) and Lg (Ri/Rmax) curve under different PSC systems indicated that refining clay and sand scales could increase D values, while refining silt scales could reduce D values.
(6)
Taking soil PSD data, D values, and the observed correlations into consideration, USDA (1993) and Blott & Pye (2012) PSC systems should be highly recommend optional PSC systems for calculating volume fractal dimensions of PSD. For the former PSC system, Ds had the closest relationship with soil fractions, and latter PSC system had the most information of subdivision of soil fractions.
This research was limited by the multifractal analysis was overlooked to capture the intrinsic variability of soil PSD and fractal dimensions under different PSC systems in order to retain more detailed information. Therefore, future studies should deal with these limitations.

Author Contributions

J.D. conceived the experiments; J.D. completed the experiments; J.D., C.M. and H.Y. are responsible for managing and analyzing the data; J.D. is responsible for scientific paper writing.

Funding

This work was supported in part by the National Natural Science Foundation of China (31800609), Doctoral Scientific Research Foundation of Liaoning Province (20170520247), Shenyang Agricultural University Startup Foundation for Introduced Talents (the year of 2015), and CFERN & GENE Award Funds on Ecological Paper.

Conflicts of Interest

The authors declare no conflict of interest.

References

  1. Xia, D.; Deng, Y.; Wang, S.; Ding, S.; Cai, C. Fractal features of soil particle-size distribution of different weathering profiles of the collapsing gullies in the hilly granitic region, south China. Nat. Hazards 2015, 79, 455–478. [Google Scholar] [CrossRef]
  2. Laborczi, A.; Szatmári, G.; Takács, K.; Pásztor, L. Mapping of topsoil texture in hungary using classification trees. J. Maps 2016, 12, 999–1009. [Google Scholar] [CrossRef]
  3. Giménez, D.; Perfect, E.; Rawls, W.J.; Pachepsky, Y. Fractal models for predicting soil hydraulic properties: A review. Eng. Geol. 1997, 48, 161–183. [Google Scholar] [CrossRef]
  4. Montero, E.S. Rényi dimensions analysis of soil particle-size distributions. Ecol. Model. 2005, 182, 305–315. [Google Scholar] [CrossRef]
  5. Tyler, S.W.; Wheatcraft, S.W. Fractal scaling of soil particle-size distributions: Analysis and limitations. Soil Sci. Soc. Am. J. 1992, 56, 362–369. [Google Scholar] [CrossRef]
  6. Erguler, Z.A. A quantitative method of describing grain size distribution of soils and some examples for its applications. Bull. Eng. Geol. Environ. 2016, 75, 807–819. [Google Scholar] [CrossRef]
  7. Jin, Z.; Dong, Y.S.; Qi, Y.C.; Liu, W.G.; An, Z.S. Characterizing variations in soil particle-size distribution along a grass-desert shrub transition in the ordos plateau of inner mongolia, china. Land Degrad. Dev. 2013, 24, 141–146. [Google Scholar] [CrossRef]
  8. Wang, X.D.; Li, M.H.; Liu, S.Z.; Liu, G.C. Fractal characteristics of soils under different land-use patterns in the arid and semiarid regions of the Tibetan Plateau, China. Geoderma 2006, 134, 56–61. [Google Scholar] [CrossRef]
  9. Wang, D.; Fu, B.J.; Zhao, W.W.; Hu, H.F.; Wang, Y.F. Multifractal characteristics of soil particle size distribution under different land-use types on the loess plateau, china. Catena 2008, 72, 29–36. [Google Scholar] [CrossRef]
  10. Gui, D.W.; Lei, J.Q.; Zeng, F.J.; Mu, G.J.; Zhu, J.T.; Wang, H.; Zhang, Q. Characterizing variations in soil particle size distribution in oasis farmlands: A case study of the Cele Oasis. Math. Comput. Model. 2010, 51, 1306–1311. [Google Scholar] [CrossRef]
  11. Kravchenko, A.N.; Boast, C.W.; Bullock, D.G. Multifractal analysis of soil spatial variability. Agron. J. 1999, 91, 1033–1041. [Google Scholar] [CrossRef]
  12. Ahmadi, A.; Neyshabouri, M.R.; Rouhipour, H.; Asadi, H. Fractal dimension of soil aggregates as an index of soil erodibility. J. Hydrol. 2011, 400, 305–311. [Google Scholar] [CrossRef]
  13. Filgueira, R.R.; Pachepsky, Y.A.; Fournier, L.L.; Sarli, G.O.; Aragon, A. Comparison of fractal dimensions estimated from aggregate mass-size distribution and water retention scaling. Soil Sci. 1999, 164, 217–223. [Google Scholar] [CrossRef]
  14. Bashkin, M.; Stohlgren, T.J.; Otsuki, Y.; Lee, M.; Evangelista, P.; Belnap, J. Soil characteristics and plant exotic species invasions in the Grand Staircase-Escalante National Monument, Utah, USA. Appl. Soil Ecol. 2003, 22, 67–77. [Google Scholar] [CrossRef]
  15. Skaggs, T.H.; Arya, L.M.; Shouse, P.J.; Mohanty, B.P. Estimating particle-size distribution from limited soil texture data. Soil Sci. Soc. Am. J. 2001, 65, 1038–1044. [Google Scholar] [CrossRef]
  16. Su, Y.Z.; Zhao, H.L.; Zhao, W.Z.; Zhang, T.H. Fractal features of soil particle size distribution and the implication for indicating desertification. Geoderma 2004, 122, 43–49. [Google Scholar] [CrossRef]
  17. Filgueira, R.R.; Fournier, L.L.; Cerisola, C.I.; Gelati, P.; Garcia, M.G. Particle-size distribution in soils: A critical study of the fractal model validation. Geoderma 2006, 134, 327–334. [Google Scholar] [CrossRef]
  18. Gao, G.L.; Ding, G.D.; Wu, B.; Zhang, Y.Q.; Qin, S.G.; Zhao, Y.Y.; Bao, Y.F.; Liu, Y.D.; Wan, L.; Deng, J.F. Fractal scaling of particle size distribution and relationships with topsoil properties affected by biological soil crusts. PLoS ONE 2014, 9, e88559. [Google Scholar] [CrossRef] [PubMed]
  19. Deng, J.; Li, J.; Deng, G.; Zhu, H.; Zhang, R. Fractal scaling of particle-size distribution and associations with soil properties of Mongolian pine plantations in the Mu Us Desert, China. Sci. Rep. 2017, 7, 6742. [Google Scholar] [CrossRef] [PubMed]
  20. Perfect, E.; Kay, B.D. Fractal theory applied to soil aggregation. Soil Sci. Soc. Am. J. 1991, 55, 1552–1558. [Google Scholar] [CrossRef]
  21. Rasiah, V.; Kay, B.D.; Perfect, E. New mass-based model for estimating fractal dimensions of soil aggregates. Soil Sci. Soc. Am. J. 1993, 57, 891–895. [Google Scholar] [CrossRef]
  22. Pachepsky, Y.A.; Polubesova, T.A.; Hajnos, M.; Sokolowska, Z.; Józefaciuk, G. Fractal parameters of pore surface area as influenced by simulated soil degradation. Soil Sci. Soc. Am. J. 1995, 59, 68–75. [Google Scholar] [CrossRef]
  23. Pachepsky, Y.; Yakovchenko, V.; Rabenhorst, M.C.; Pooley, C.; Sikora, L.J. Fractal parameters of pore surfaces as derived from micromorphological data: Effect of long-term management practices. Geoderma 1996, 74. [Google Scholar] [CrossRef]
  24. Posadas, A.N.D.; Giménez, D.; Quiroz, R.; Protz, R. Multifractal characterization of soil pore spatial distributions. Soil Sci. Soc. Am. J. 2003, 67, 1361–1369. [Google Scholar] [CrossRef]
  25. Bird, N.; Díaz, M.C.; Saa, A.; Tarquis, A.M. Fractal and multifractal analysis of porescale images of soil. J. Hydrol. 2006, 322, 211–219. [Google Scholar] [CrossRef]
  26. Jia, X.H.; Li, X.R.; Zhang, J.G.; Zhang, Z.S. Analysis of spatial variability of the fractal dimension of soil particle size in Ammopiptanthus mongolicus’ desert habitat. Environ. Geol. 2009, 58, 953–962. [Google Scholar] [CrossRef]
  27. Minasny, B.; McBratney, A.B. The australian soil texture boomerang: A comparison of the Australian and USDA/FAO soil particle-size classification systems. Aust. J. Soil Res. 2001, 39, 1443–1451. [Google Scholar] [CrossRef]
  28. Blott, S.J.; Pye, K. Particle size scales and classification of sediment types based on particle size distributions: Review and recommended procedure. Sedimentology 2012, 59, 2071–2096. [Google Scholar] [CrossRef]
  29. Krasilnikov, P.; Martí, J.-J.I.; Arnold, R.; Shoba, S. Soil Terminology, Correlation, and Classification, 1st ed.; Earthscan: London, UK, 2009; pp. 47–328. ISBN 978-1-84407-683-3. [Google Scholar]
  30. Wahren, F.T.; Tarasiuk, M.; Mykhnovych, A.; Kit, M.; Feger, K.H.; Schwärzel, K. Estimation of spatially distributed soil information: Dealing with data shortages in the Western Bug Basin, Ukraine. Environ. Earth Sci. 2012, 65, 1501–1510. [Google Scholar] [CrossRef]
  31. Gao, G.L.; Ding, G.D.; Zhao, Y.Y.; Wu, B.; Zhang, Y.Q.; Guo, J.B.; Qin, S.G.; Bao, Y.F.; Yu, M.H.; Liu, Y.D. Characterization of soil particle size distribution with a fractal model in the desertified regions of Northern China. Acta Geophys. 2016, 61, 1–14. [Google Scholar] [CrossRef]
  32. Lobe, I.; Amelung, W.A.; Preez, C.C.D. Losses of carbon and nitrogen with prolonged arable cropping from sandy soils of the South African Highveld. Eur. J. Soil Sci. 2001, 52, 93–101. [Google Scholar] [CrossRef]
  33. Li, H.; Yang, X. Temperate dryland vegetation changes under a warming climate and strong human intervention—With a particular reference to the district Xilin Gol, Inner Mongolia, China. Catena 2014, 119, 9–20. [Google Scholar] [CrossRef]
  34. Zhong, W.; Yue, F.; Ciancio, A. Fractal behavior of particle size distribution in the rare earth tailings crushing process under high stress condition. Appl. Sci. 2018, 8, 1058. [Google Scholar] [CrossRef]
  35. Yu, J.; Lv, X.; Bin, M.; Wu, H.; Du, S.; Zhou, M.; Yang, Y.; Han, G. Fractal features of soil particle size distribution in newly formed wetlands in the Yellow River Delta. Sci. Rep. 2015, 5, 10540. [Google Scholar] [CrossRef] [PubMed] [Green Version]
  36. Xu, G.C.; Li, Z.B.; Li, P. Fractal features of soil particle-size distribution and total soil nitrogen distribution in a typical watershed in the source area of the middle Dan river, China. Catena 2013, 101, 17–23. [Google Scholar] [CrossRef]
  37. Liu, S.; Pan, Z.; Cheng, X. A Novel Fast Fractal image compression method based on distance clustering in high dimensional sphere surface. Fractals 2017, 25, 1740004. [Google Scholar] [CrossRef]
  38. Kabala, C.; Charzynski, P.; Świtoniak, M. Correlation between the polish soil classification (2011) and international soil classification system world reference base for soil resources (2015). Soil Sci. Ann. J. 2016, 67, 88–100. [Google Scholar] [CrossRef]
  39. Liu, S.; Cheng, X.; Fu, W. Numeric characteristics of generalized M-set with its asymptote. Appl. Math. Comput. 2014, 243, 767–774. [Google Scholar] [CrossRef]
  40. Zhao, S.W.; Jing, S.U.; Y, H.Y.; Liu, N.N.; Wu, J.S.; Shangguan, Z.P. A fractal method of estimating soil structure changes under different vegetations on Ziwuling mountains of the Loess Plateau, China. Agric. Sci. China 2006, 5, 530–538. [Google Scholar] [CrossRef]
  41. Perfect, E.; Kay, B.D. Applications of fractals in soil and tillage research: A review. Soil Tillage Res. 1995, 36. [Google Scholar] [CrossRef]
  42. Liu, S.; Fu, W.; He, L.; Zhou, J.; Ma, M. Distribution of primary additional errors in fractal encoding method. Multimed. Tools Appl. 2017, 76, 5787–5802. [Google Scholar] [CrossRef]
  43. Millán, H.; González-Posada, M.; Aguilar, M.; Domı́nguez, J.; Céspedes, L. On the fractal scaling of soil data. Particle-size distributions. Geoderma 2003, 117, 117–128. [Google Scholar] [CrossRef]
  44. Perfect, E.; Rasiah, V.; Kay, B.D. On the relation between number-size distributions and the fractal dimension of aggregates. Soil Sci. Soc. Am. J. 1993, 56, 555–565. [Google Scholar]
  45. Liu, X.; Zhang, G.C.; Heathman, G.C.; Wang, Y.Q.; Huang, C.H. Fractal features of soil particle-size distribution as affected by plant communities in the forested region of Mountain Yimeng, China. Geoderma 2009, 154, 123–130. [Google Scholar] [CrossRef]
  46. Liu, S.; Cheng, X.; Lan, C.; Fu, W.; Zhou, J.; Li, Q.; Gao, G. Fractal property of generalized M-set with rational number exponent. Appl. Math. Comput. 2013, 220, 668–675. [Google Scholar] [CrossRef]
  47. Magette, W.L.; Brinsfield, R.B.; Palmer, R.E.; Wood, J.D. Nutrient and sediment removal by vegetated filter strips. Trans. ASAE 1989, 32, 663–667. [Google Scholar] [CrossRef]
  48. Dai, Y.; Shangguan, W.; Duan, Q.; Liu, B.; Fu, S.; Niu, G. Development of a china dataset of soil hydraulic parameters using pedotransfer functions for land surface modeling. J. Hydrometeorol. 2013, 14, 869–887. [Google Scholar] [CrossRef]
  49. Shangguan, W.; Dai, Y.; Garcíagutiérrez, C.; Yuan, H. Particle-size distribution models for the conversion of Chinese data to FAO/USDA system. Sci. World J. 2014. [Google Scholar] [CrossRef] [PubMed]
Figure 1. Geographical position of research region.
Applsci 08 01872 g001
Figure 2. The China (1987), Katschinski (1957), USDA (1993), ISSS (1929), ISO14688 (2002), and Blott & Pye (2012) PSC systems that were used throughout the study.
Applsci 08 01872 g002
Figure 3. Clay contents of surveyed plots under six PSC systems. Vertical bars represent standard errors (n = 3). ANOVA with Duncan test was used with different letter in the same row are significantly different at the 0.05 level.
Applsci 08 01872 g003
Figure 4. Silt contents of surveyed plots under six PSC systems. ANOVA with Duncan test was used with different letter in the same row are significantly different at the 0.05 level.
Applsci 08 01872 g004
Figure 5. Sand contents of surveyed plots under six PSC systems. ANOVA with Duncan test was used with different letter in the same row are significantly different at the 0.05 level.
Applsci 08 01872 g005
Figure 6. Soil fractal dimensions of surveyed plots under six PSC systems. ANOVA with Duncan test was used with different letter in the same row are significantly different at the 0.05 level.
Applsci 08 01872 g006
Figure 7. The relations between Ds and PSD of sample contents under different PSC systems. Vertical and horizontal bars represent standard errors (n = 3). Linear regression analysis was applied and determination coefficients (R2) of the linear regressions are also shown. (a,d,g,j,m,p) present relations between Ds and clay of sample contents under China (1987), Katschinski (1957), USDA (1993), ISSS (1929), ISO14688 (2002), and Blott & Pye (2012) PSC systems, (b,e,h,k,n,q) present relations between Ds and silt of sample contents under different PSC systems, (c,f,i,o,r) present relations between Ds and sand of sample contents under different PSC systems.
Applsci 08 01872 g007
Figure 8. Relationships between Ds and forest density of MPPs. Linear regression analysis was applied. Determination coefficients (R2) of the linear regressions are also shown.
Applsci 08 01872 g008
Figure 9. Variations of Lg (V/VT) and Lg (Ri/Rmax) under different PSC systems. Dash line is 1:1 line. (a) presents China (1987) PSC system, (b) presents Katschinski (1957) PSC system, (c) presents USDA (1993) PSC system, (d) presents ISSS (1929) PSC system, (e) presents ISO14688 (2002) PSC system, (f) presents Blott & Pye (2012) PSC systems.
Applsci 08 01872 g009
Table 1. General information of surveyed MPP plots.
Plot NumberForest Density (trees·ha–1)Tree Height (H, m)Diameter at Breast Height (DBH, cm)H/DBHCanopy Density (%)Canopy Size (m)
PI27009.7911.290.87901.99
PII22008.8913.000.68803.12
PIII205010.3513.650.76762.50
PIV180010.2816.100.64655.28
PV150010.6214.510.73502.49
PVI14008.3013.180.63452.68
PVII130010.1615.170.67704.07
PVIII125012.0619.040.63754.06
PIX90010.2616.670.62654.19
Table 2. Pearson’s correlation coefficients among Ds under different PSC systems.
PSC SystemsChina (1987)Katschinski (1957)USDA (1993)ISSS (1929)ISO14688 (2002)Blott & Pye (2012)
China (1987)10.993 **0.983 **0.993 **0.998 **0.998 **
Katschinski (1957)0.993 **10.968 **0.977 **0.991 **0.997 **
USDA (1993)0.983 **0.968 **10.991 **0.985 **0.979 **
ISSS (1929)0.993 **0.977 **0.991 **10.995 **0.988 **
ISO14688 (2002)0.998 **0.991 **0.985 **0.995 **10.997 **
Blott & Pye (2012)0.998 **0.997 **0.979 **0.988 **0.997 **1
** Correlation is significant at the 0.01 level (2-tailed).

