1. Introduction
There is no doubt that the utilization of recycled aggregate concrete (RAC) has been the best way to resolve the problem of the increasing amount of construction and demolition (C&D) waste and further attain sustainable development. The improved environmental performance of recycled aggregate concrete (RAC) [
1,
2,
3] has led to research on recycled aggregate (RA) and RAC, a popular topic in the last decades [
4,
5,
6,
7]. Recycled coarse aggregate and recycled fine aggregate were both used in concrete to make full use of C&D wastes; meanwhile, the cementitious materials supplied, such as fly ash and silica fume, were used together with RA for high-performance RAC [
8,
9,
10,
11]. Though there has been a large amount of research on the properties of RAC, the results have been varied because the properties of RAs from different sources (such as the demolition of bridges, buildings and airport pavements) and produced using different recycling methods (e.g., the type and effort of the crushers used) vary greatly [
12]. It is generally accepted that the properties of RA and the hardened properties of RAC made with such RA are both largely affected by the nature of the attached old mortar [
13,
14,
15,
16,
17]. However, it is difficult to establish an accurate relationship between the two, since at present there is no established method for accurately measuring the quantity and quality of the attached mortar in RA. On the other hand, RAs may also contain impurities, such as bricks, glass, tiles, asphalt, plastics, gypsum, wood and clay, etc. In small amounts, however, their presence may seriously deteriorate the quality of RA. The presence of other impurities makes it more complicated to predict the properties of RAC.
Therefore, there are at least two major difficulties in building a model that can predict the performance of hardened RAC made with RAs from different sources: (1) the model should act as an expert system covering the factors that may affect the properties of RAC, such as cement content, water to cement ratio, aggregate to cement ratio, cement type and particle size of aggregates, etc.; (2) an optimal combination of RA characteristics should be included in the model so that it can be applicable to the majority of RAs from different sources. A previous study [
18] used regression analysis to propose a number of equations relating the hardened properties (compressive strength) of RAC with the water absorption or density of different types and combinations of aggregates obtained from different sources. However, the accuracy of the prediction is limited since the properties of RA cannot be completely represented by the density or water absorption values of RA. Tam and Tam [
19] suggested that there were six main factors that characterize the properties of RA: (1) particle size distribution; (2) particle density; (3) porosity and absorption; (4) particle shape; (5) strength and toughness; and (6) chloride and sulphate contents. Through a comparison and analysis of ten sources of RAs and one type of natural aggregate (NA), they constructed relationships among these factors and indicated that the RA properties could be assessed by only measuring three of the six parameters mentioned. However, whether the model is suitable for RAs obtained from other sources has not been verified.
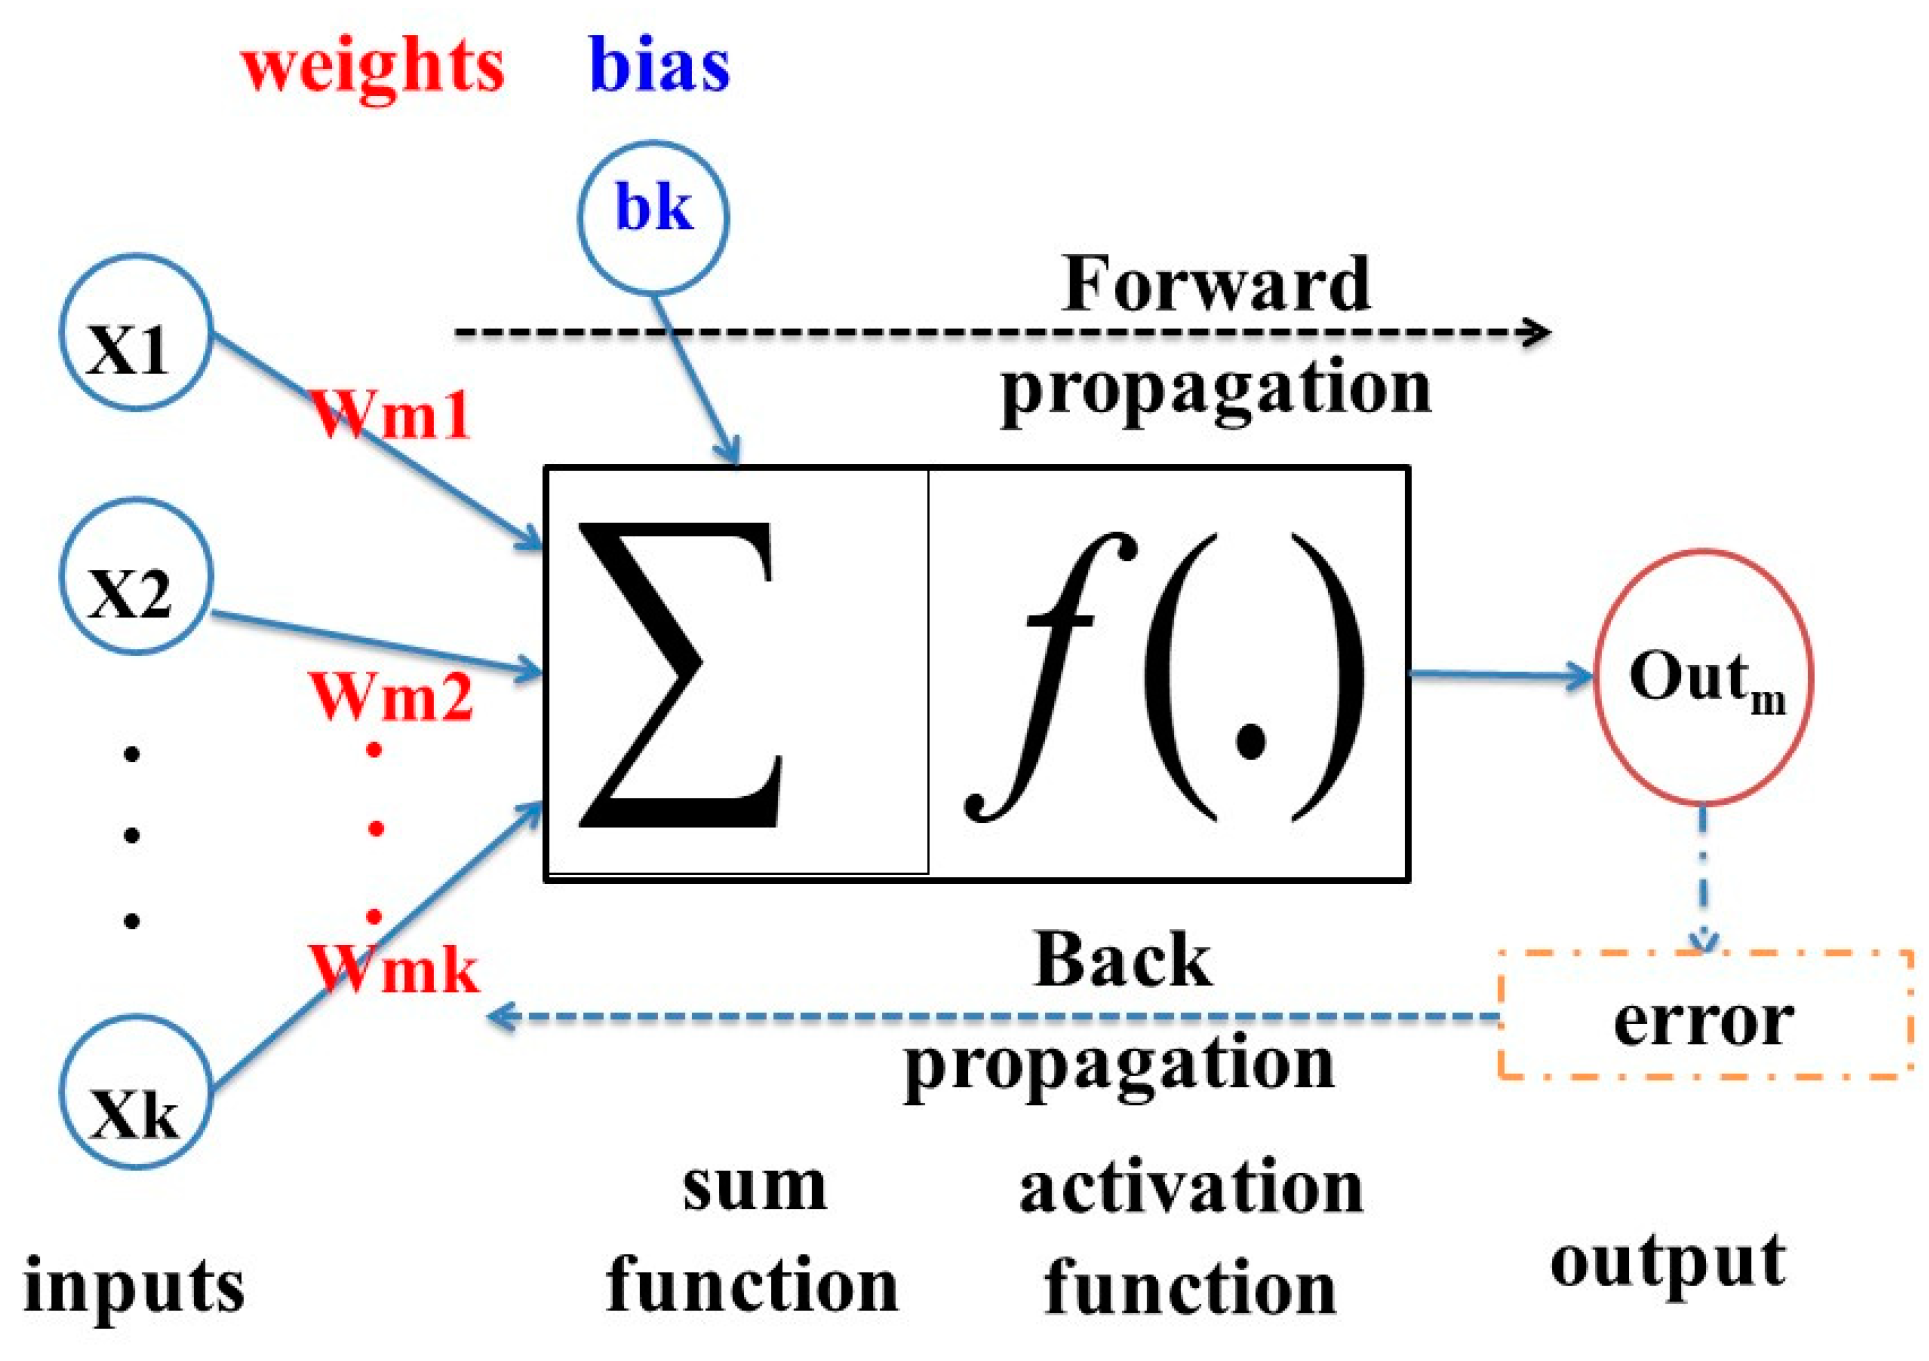
As a modeling tool, artificial neural networks (ANN) have been widely used since the mid-1980s, and have also been demonstrated to have superior capacities in modeling more complex relationships. Among all the ANN structures, the back-propagation network (BPN) is generally regarded as one of the simplest and most applicable networks used in simulating concrete properties. As shown in
Figure 1, a typical BPN model consists of an input layer, one or more hidden layers and an output layer, and each layer consists of numerous neurons. During the training set, feed-forward propagation and back-propagation propagation run in turn to reach the required criteria. The former propagation can first transform the input mode onto the hidden layer, and then pass the weighted sum of inputs to the output layer through an activation function, resulting in one output value. In this stage, the sigmoidal function (
f (.)) is generally used, and the output can be calculated according to Equation (1). Immediately after that, the back-propagation propagation works by passing the error of network backwards from the output layer to the input layer, with the weights adjusted based on some learning strategies to reduce the network error.
where
wji is the connection weight from neuron
i in the lower layer to neuron
j in the upper layer and an initially small random value,
oi is the output of neuron
i, and
b is the bias value.
Duan et al. [
20] carried out a study on predicting the compressive strength of RAC at the curing time of 28 days using an ANN model. The authors collected a large amount of published data on the 28-day compressive strength of RAC, which came from previous research. The RA used was derived from different countries and sources. The data were used for the construction of the ANN model, and the predicted results of the ANN model were quite accurate. Moreover, the same author also established another ANN model for predicting the elastic modulus of RAC [
21]. This model was built based on regression analysis and performed better predictions. Sensitivity analysis, an uncertainty analysis technique in relation to quantitative analysis, is a study to assess the sensitivity of the prediction results of the model to the change in the selected input variables [
22]. It also determines the significance of these uncertain factors on the results [
23,
24,
25]. Therefore, it is of interest to apply the sensitivity analysis to the constructed ANN model to further study the influence of each input variable on the output. By conducting a sensitivity analysis, Jain et al. [
26] determined the effect of the constituents of concrete mixes on the desired workability.
To predict the compressive strength of NAC (natural aggregate concrete) using ANN, the concrete mix proportions used [
27,
28,
29,
30] and the time of testing of the compressive strength [
31,
32,
33] were generally selected as the input variables. For concrete made with RAs from different sources, the difference between the properties of different RAs should be taken into account. The aggregate characteristics, such as water absorption, specific gravity, and aggregate crush value are closely related to the properties of the old mortar attached, which can affect the properties of RAC by different levels. In theory, the more factors are taken into consideration, the more accurate the model is. However, in practice it is unsuitable to use all the affected factors due to the complicated calculation and the measuring error. Therefore, it is important to determine the significance of each RA characteristic and the optimal combination of factors, which aims to ensure the factors can be applicable to the majority of RAs from different sources. In other words, how to fully represent the aggregate properties in the ANN model is an important issue.
The purpose of this study is to examine the relative importance of the different characteristics of RA in affecting RAC properties. Moreover, it also aims to determine which factor or combination of factors is most suitable for representing RA properties when used in ANN model for compressive strength and elastic modulus prediction. In this study, the following steps were used for this purpose.
2. Methodologies
2.1. Building the ANN Models and the Sensitivity Analysis
First, experiments on the mechanical properties of RAC with different RAs were carried out in the laboratory, which had 46 concrete mixes and were divided into 3 groups. The RAs were categorized into 3 groups according to their sources: (1) RAs derived from 3 different sources and crushed using different methods; (2) RAs derived from concrete cubes made in the laboratory with different compressive strengths (35–85 MPa); (3) RAs contained different amounts of masonry added (clay bricks or tiles). As many sources of natural and recycled aggregates were used in these mixes, 8 aggregate characteristics, including fineness modulus of the fine aggregate (FM), residual mortar content (MC), 10% fines value (TFV), aggregate crushing value (ACV), water absorption value (Wa), specific gravity (SGSSD), impurity content (δ) and masonry content (m) of the coarse aggregate, were comprehensively measured and quantified. These factors, together with the mix proportions and concrete curing time, were selected as the input variables of the ANN for modeling the compressive strength and elastic modulus. To facilitate the analysis, factors including the mix proportions (5 variables) and curing time (1 variable) were designated as “certainties”, while the other factors (8 variables) were named “uncertainties”.
The experimental results obtained from the above mixes at different ages were divided into three groups, acting as: (i) the training set; (ii) the validation set; and (iii) the testing set, respectively. The corresponding ANN model could be established using the procedures described previously [
20]. For each model, the ANN network parameters were determined when the error values reached the minimum. Based on the comparison of the error of integral testing set after a series of trials, the initial network architecture and parameters used in this study were as follows:
Number of input layer units = 14
Number of hidden layers = 1
Number of hidden layer units = 40
Number of output layer units = 1
Momentum rate = 0.9
Learning rate = 0.01
Learning cycle = 15,000
In this study, the mean absolute percentage error (
MAPE), root-mean-squared error (
RMS) and absolute fraction of variance (
R2) computed using Equations (2)–(4) were used to access the accuracy of the ANN model developed.
where
t: the predicted output of the network;
o: the actual output of the network;
p: the total number of training and testing patterns;
tj: the predicted output of
jth pattern of the network;
oj: the actual output of
jth pattern of the network.
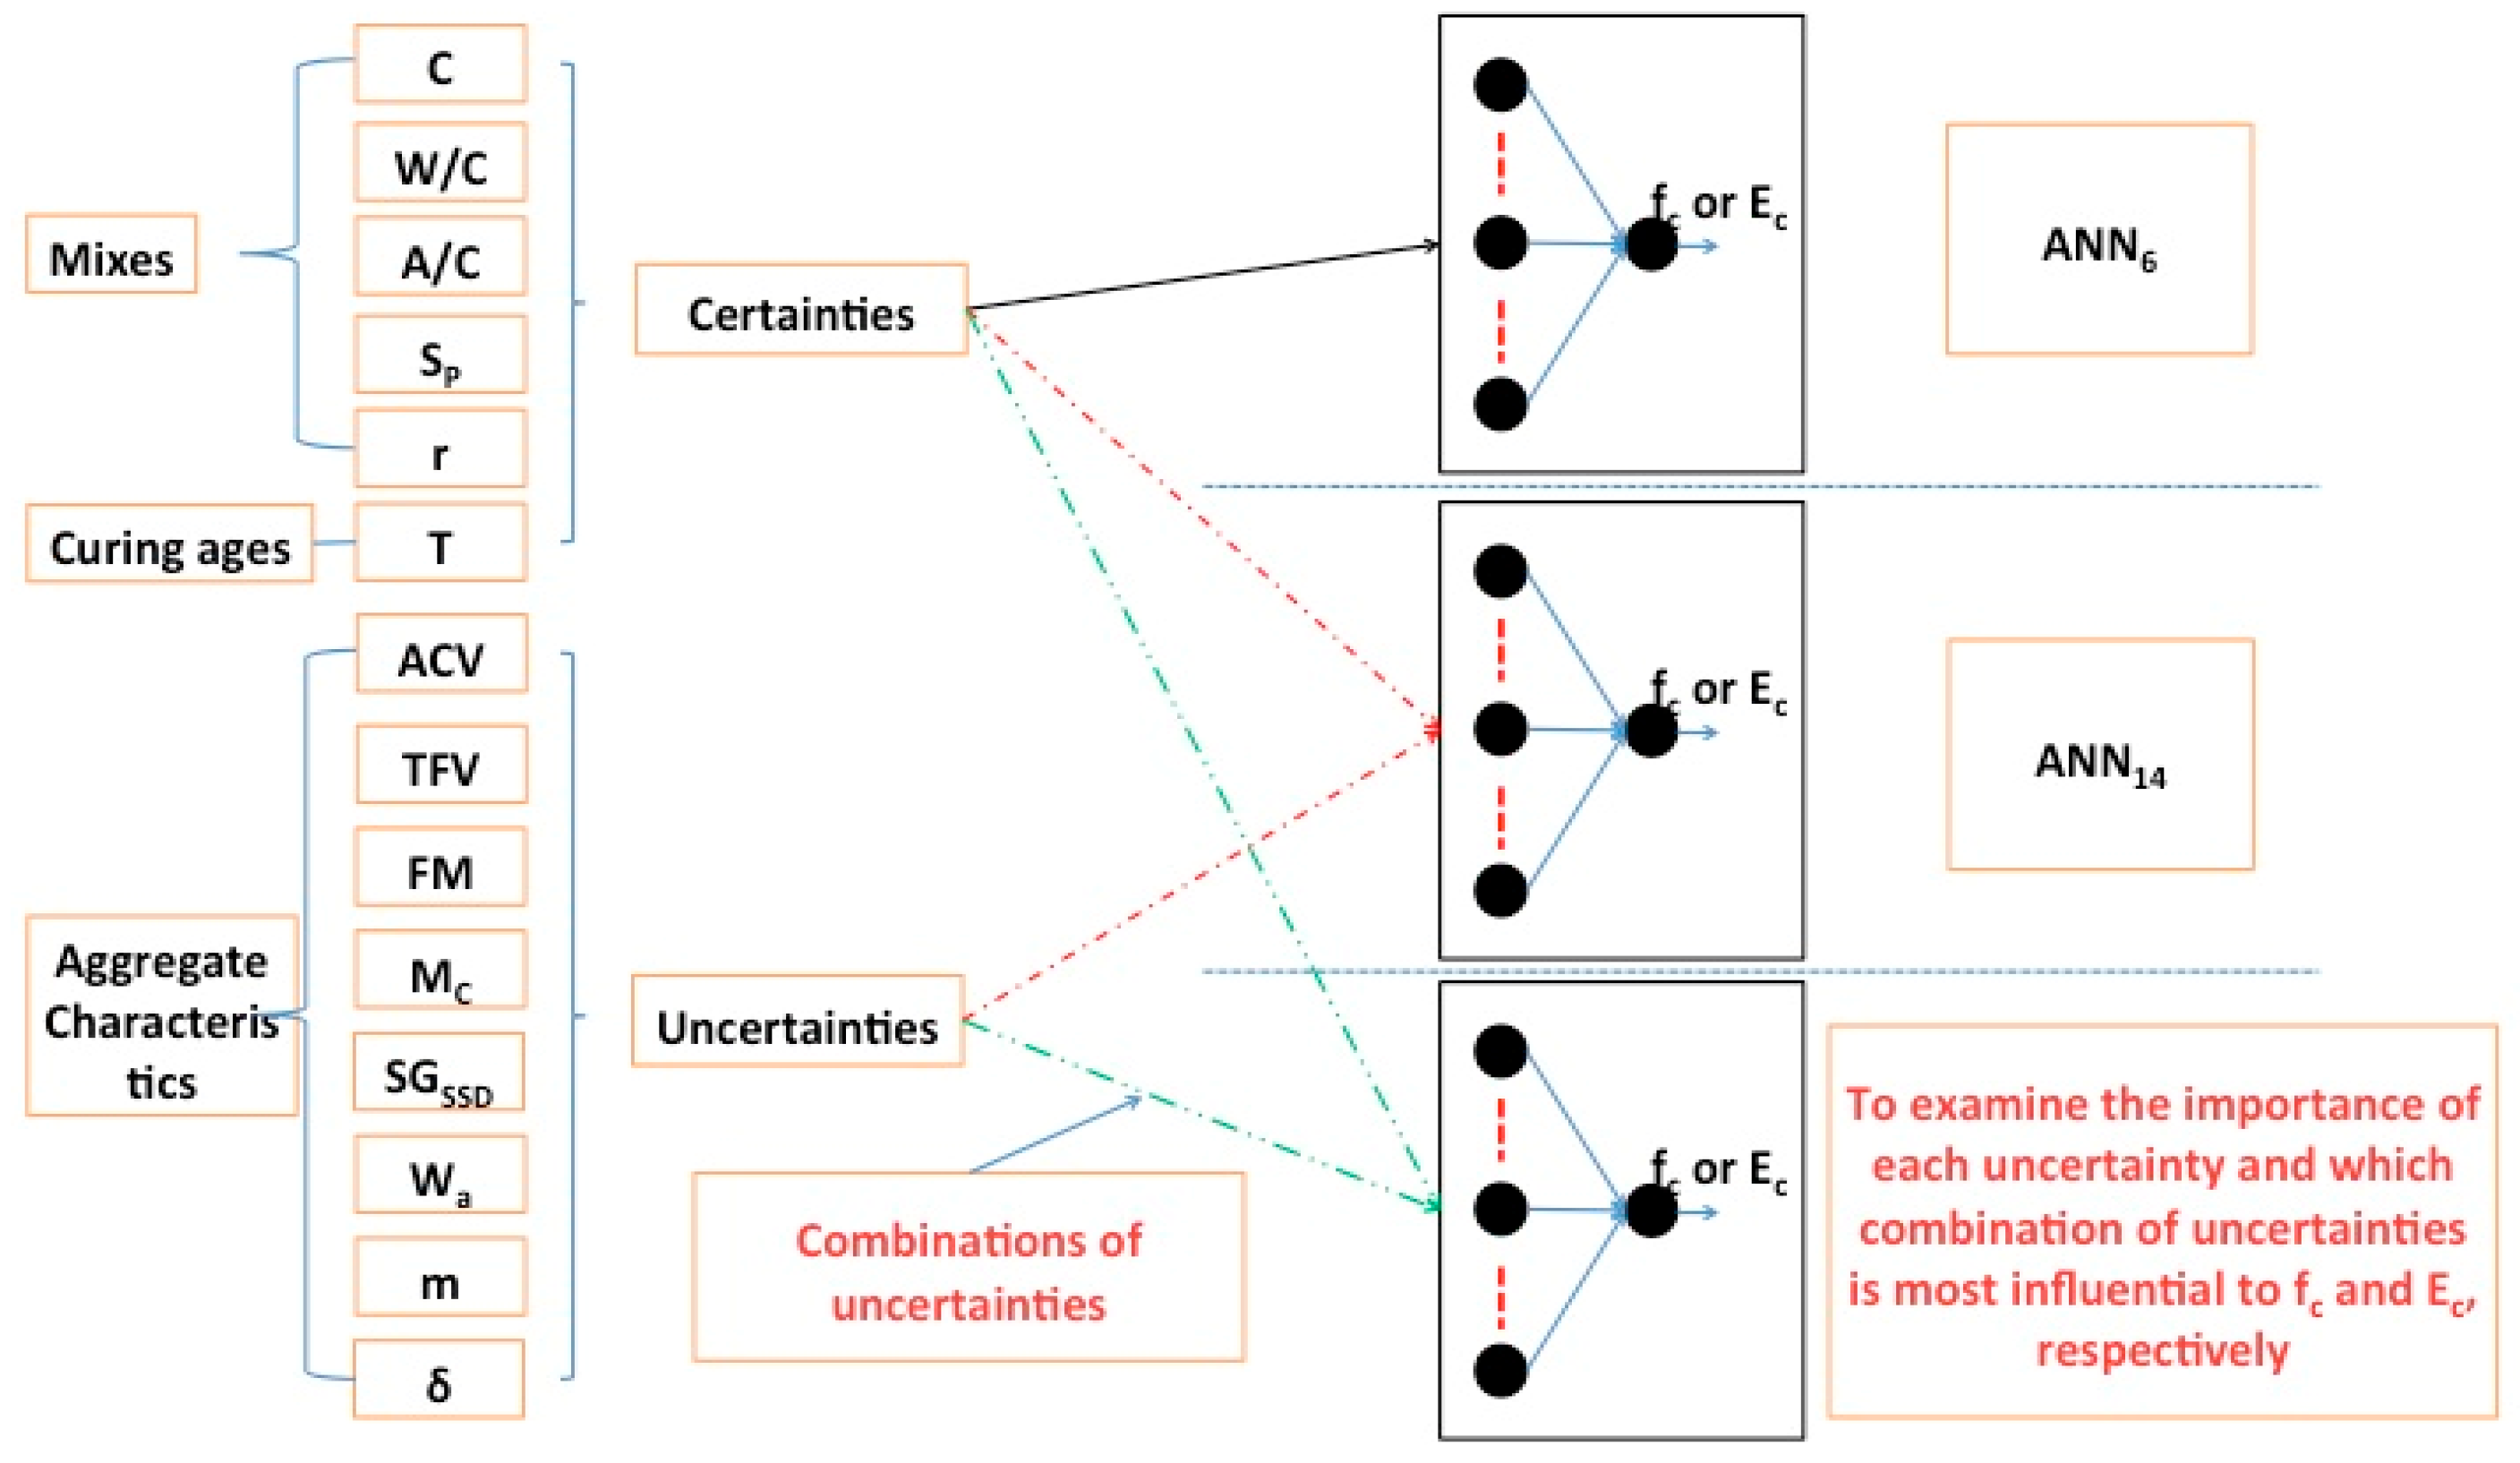
After the construction of the ANN models, the sensitivity analysis was then conducted according to
Figure 2.
Step 1: A comparison of the performance between the models (ANN14) with all variables (14 variables) and that (ANN6) with certainties (only 6 variables) was first made, while keeping the other networks parameters constant.
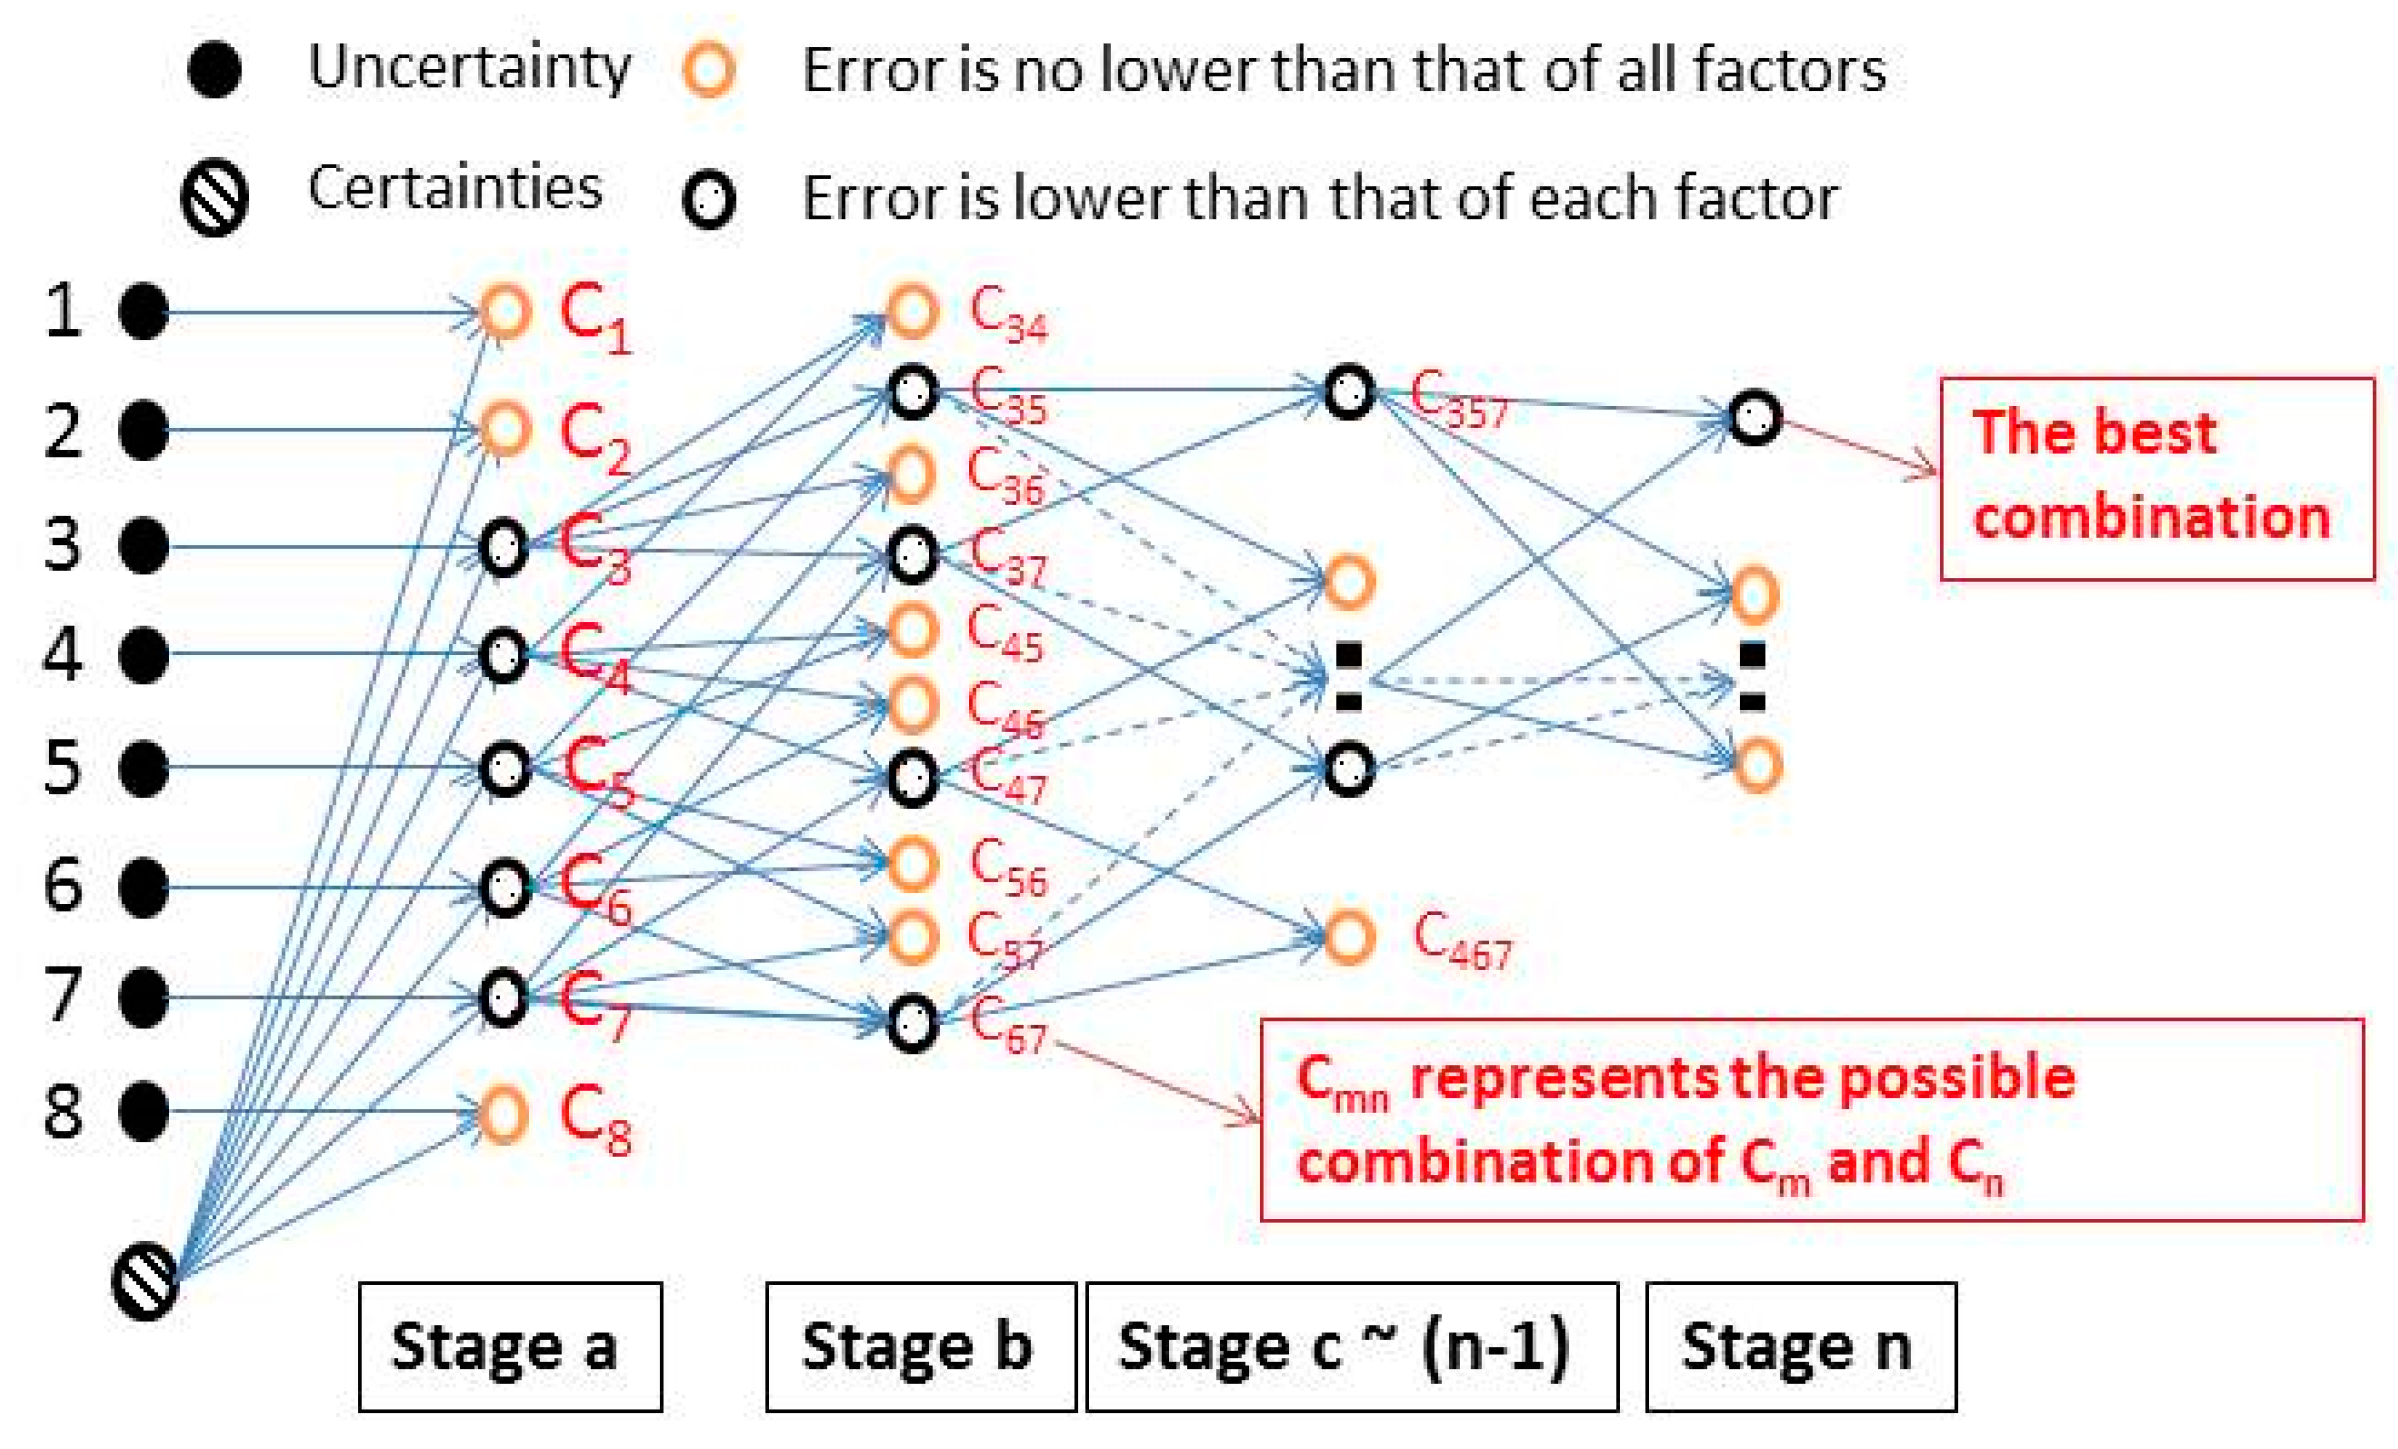
Step 2: Various combinations of the uncertainties (aggregate characteristics) together with the “certainties” were used as the inputs of each model to find the best model with the minimum error. However, it would take a huge amount of time if all the combinations were tried out one by one. Considering the interaction and constraints among the aggregate characteristics, a simple method developed to determine the best combination of variables is shown in
Figure 3.
At Stage a, the resulted error of ANN6 was compared with that of the networks (ANN7) when each “uncertainty” was sequentially added as an input variable. If the error could not be reduced, then the “uncertainty” added was regarded as negative for the output and would not be further studied in the next stages. The larger the reduction in the error value, the more important the respective “uncertainty”, and vice versa.
At Stage b, the variables that could reduce the error of
ANN6 were retained. Sequentially, each variable was paired with the others as the added inputs of
ANN6 to build a new model (
ANN8), and the resulted error values were compared with those of the networks (
ANN7) when only one variable was added to
ANN6. If the resulted error of the
ANN8 was not less than that of each
ANN7, the pair of variables was not further studied. For example, as shown in
Figure 3, in the further right column, items 3 and 4 represent two aggregate characteristics, respectively. Accordingly, C3 and C4 (in the second right column) represent a combination of “certainty” variables with items 3 and 4, respectively. Assuming that the addition of either item 3 or item 4 to the certainties could reduce the network error of
ANN6, C3 and C4 would be both retained and used to form a new combination C34, which contained 8 input variables (items 3, 4 and certainties). When comparing the
MAPE values of the networks using C34, C3 and C4 as inputs, respectively, and if the first one was lower than both the latter two values, C34 would be retained for the next stage. Otherwise, it would be discarded.
This above approach was continued until the networks error could not be further reduced. In this way, after trying out all the possible combinations, the most influential factor or a combination of factors to the compressive strength and elastic modulus of RAC could be identified.
Considering that the predicted results of the networks would change slightly even when using the same model, each of the networks was trained 5 times and the average value of the MAPEs of the testing set and validation set was used as the final indicator of the network error.
2.2. Experimental Program
It is not necessary to use ANN to model the effect of RA on the properties of RAC when only one type of RA is used, since in this case the complexity of RA cannot be reflected and the predictive ability of ANN is generally no better than that of traditional methods like regression analysis.
When RAs from different sources were used, ANN models, which are more capable of modeling complex non-linear relationships, may be more suitable for predicting the hardened properties of RAC. The published data of RAs used can be divided into two cases: (1) several types of RAs used by a single researcher; (2) the data of RAs from different literature sources. The factors that influence the properties of RAC and used as the input variables of the networks in the two cases are quite different. For the former case, the types of materials other than aggregate, specimen size and operator error are essentially the same, so only the mix proportions and RA characteristics are chosen as the input variables; for the latter case, on the other hand, in addition to the mix proportions and RA characteristics, more factors such as cement type, specimen size, etc. should be included to establish a generalized model. In this paper, only the first case is considered. The second case will be dealt with in a separate paper.
- (1)
The source of the data
As introduced above, experiments on the mechanical properties of RAC with different RAs were carried out in the laboratory, which had 46 concrete mixes and were divided into 3 groups. The properties of these aggregates are shown in
Table 1. Except for the chosen aggregate characteristics, the particle size was also listed in
Table 1 for different aggregate types. The details of the mixes and the corresponding hardened properties of the concrete prepared are shown in
Table 2 and
Table 3, respectively.
- (2)
Construction of the ANN models
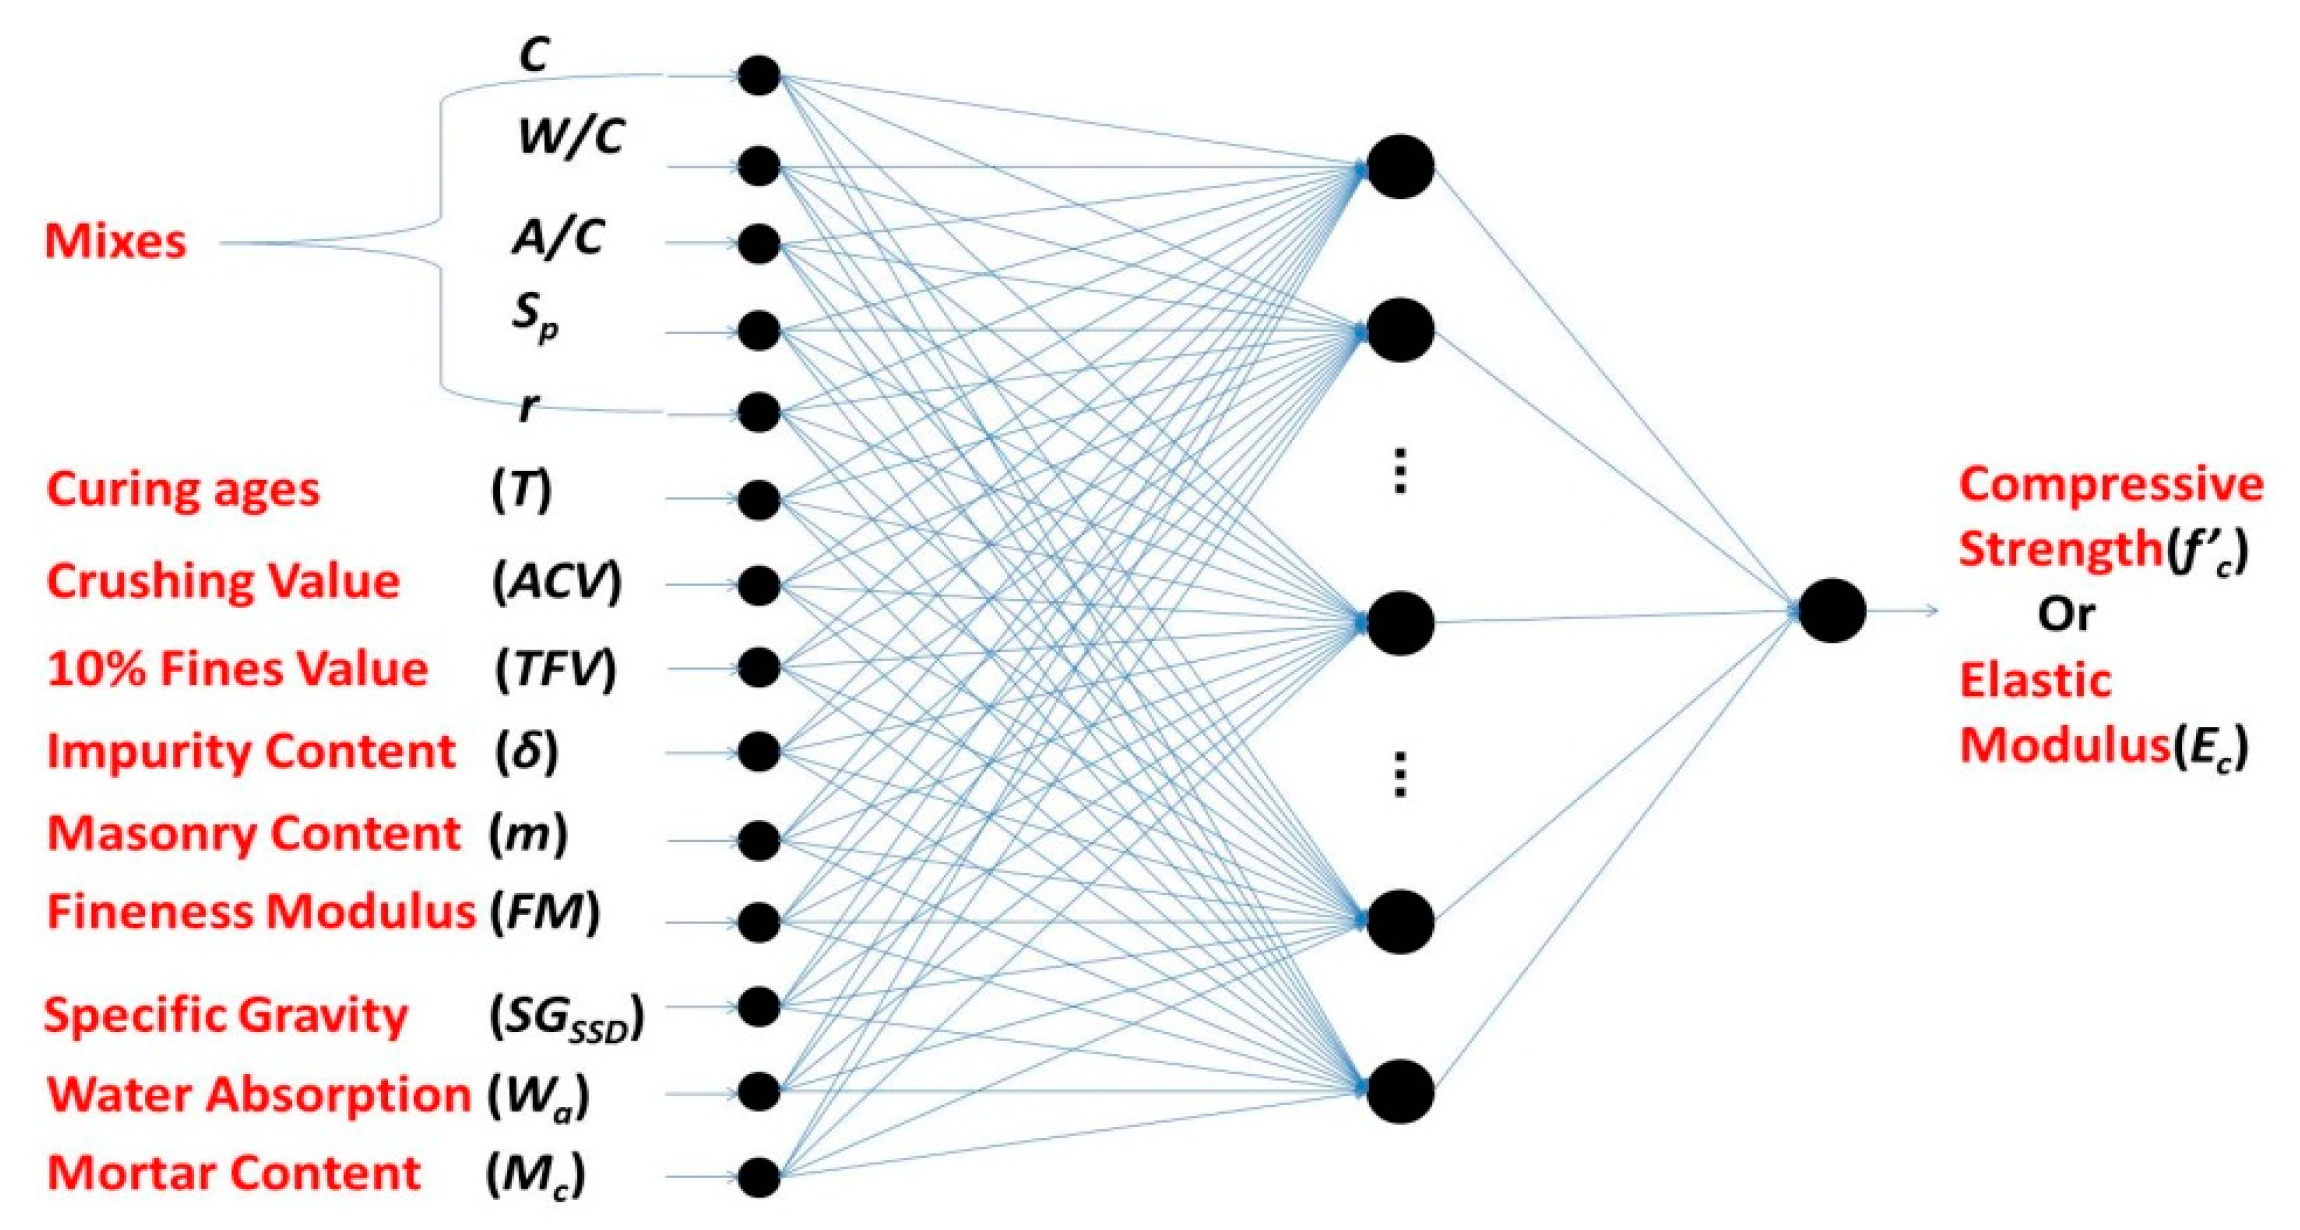
As shown in
Table 3, the experiment had a total of 145 and 92 results for compressive strength and elastic modulus, respectively, which were divided randomly into 3 groups used to construct the ANN models. The 3 groups were used as the training, testing and validation sets, respectively. The testing and validation sets were intended to establish the model with the generalization ability. After training, the optimal models for simulating the compressive strength (
ANN14-fc) and elastic modulus (
ANN14-Ec) using all 14 variables were constructed (
Figure 4), and the network architecture and parameters selected were as follows, in line with the similar procedure previously established [
15].
Number of input layer units = 16
Number of hidden layers = 1
Number of hidden layer units = 40
Number of output layer units = 1
Momentum rate = 0.9
Learning rate = 0.01
Learning cycle = 10,000
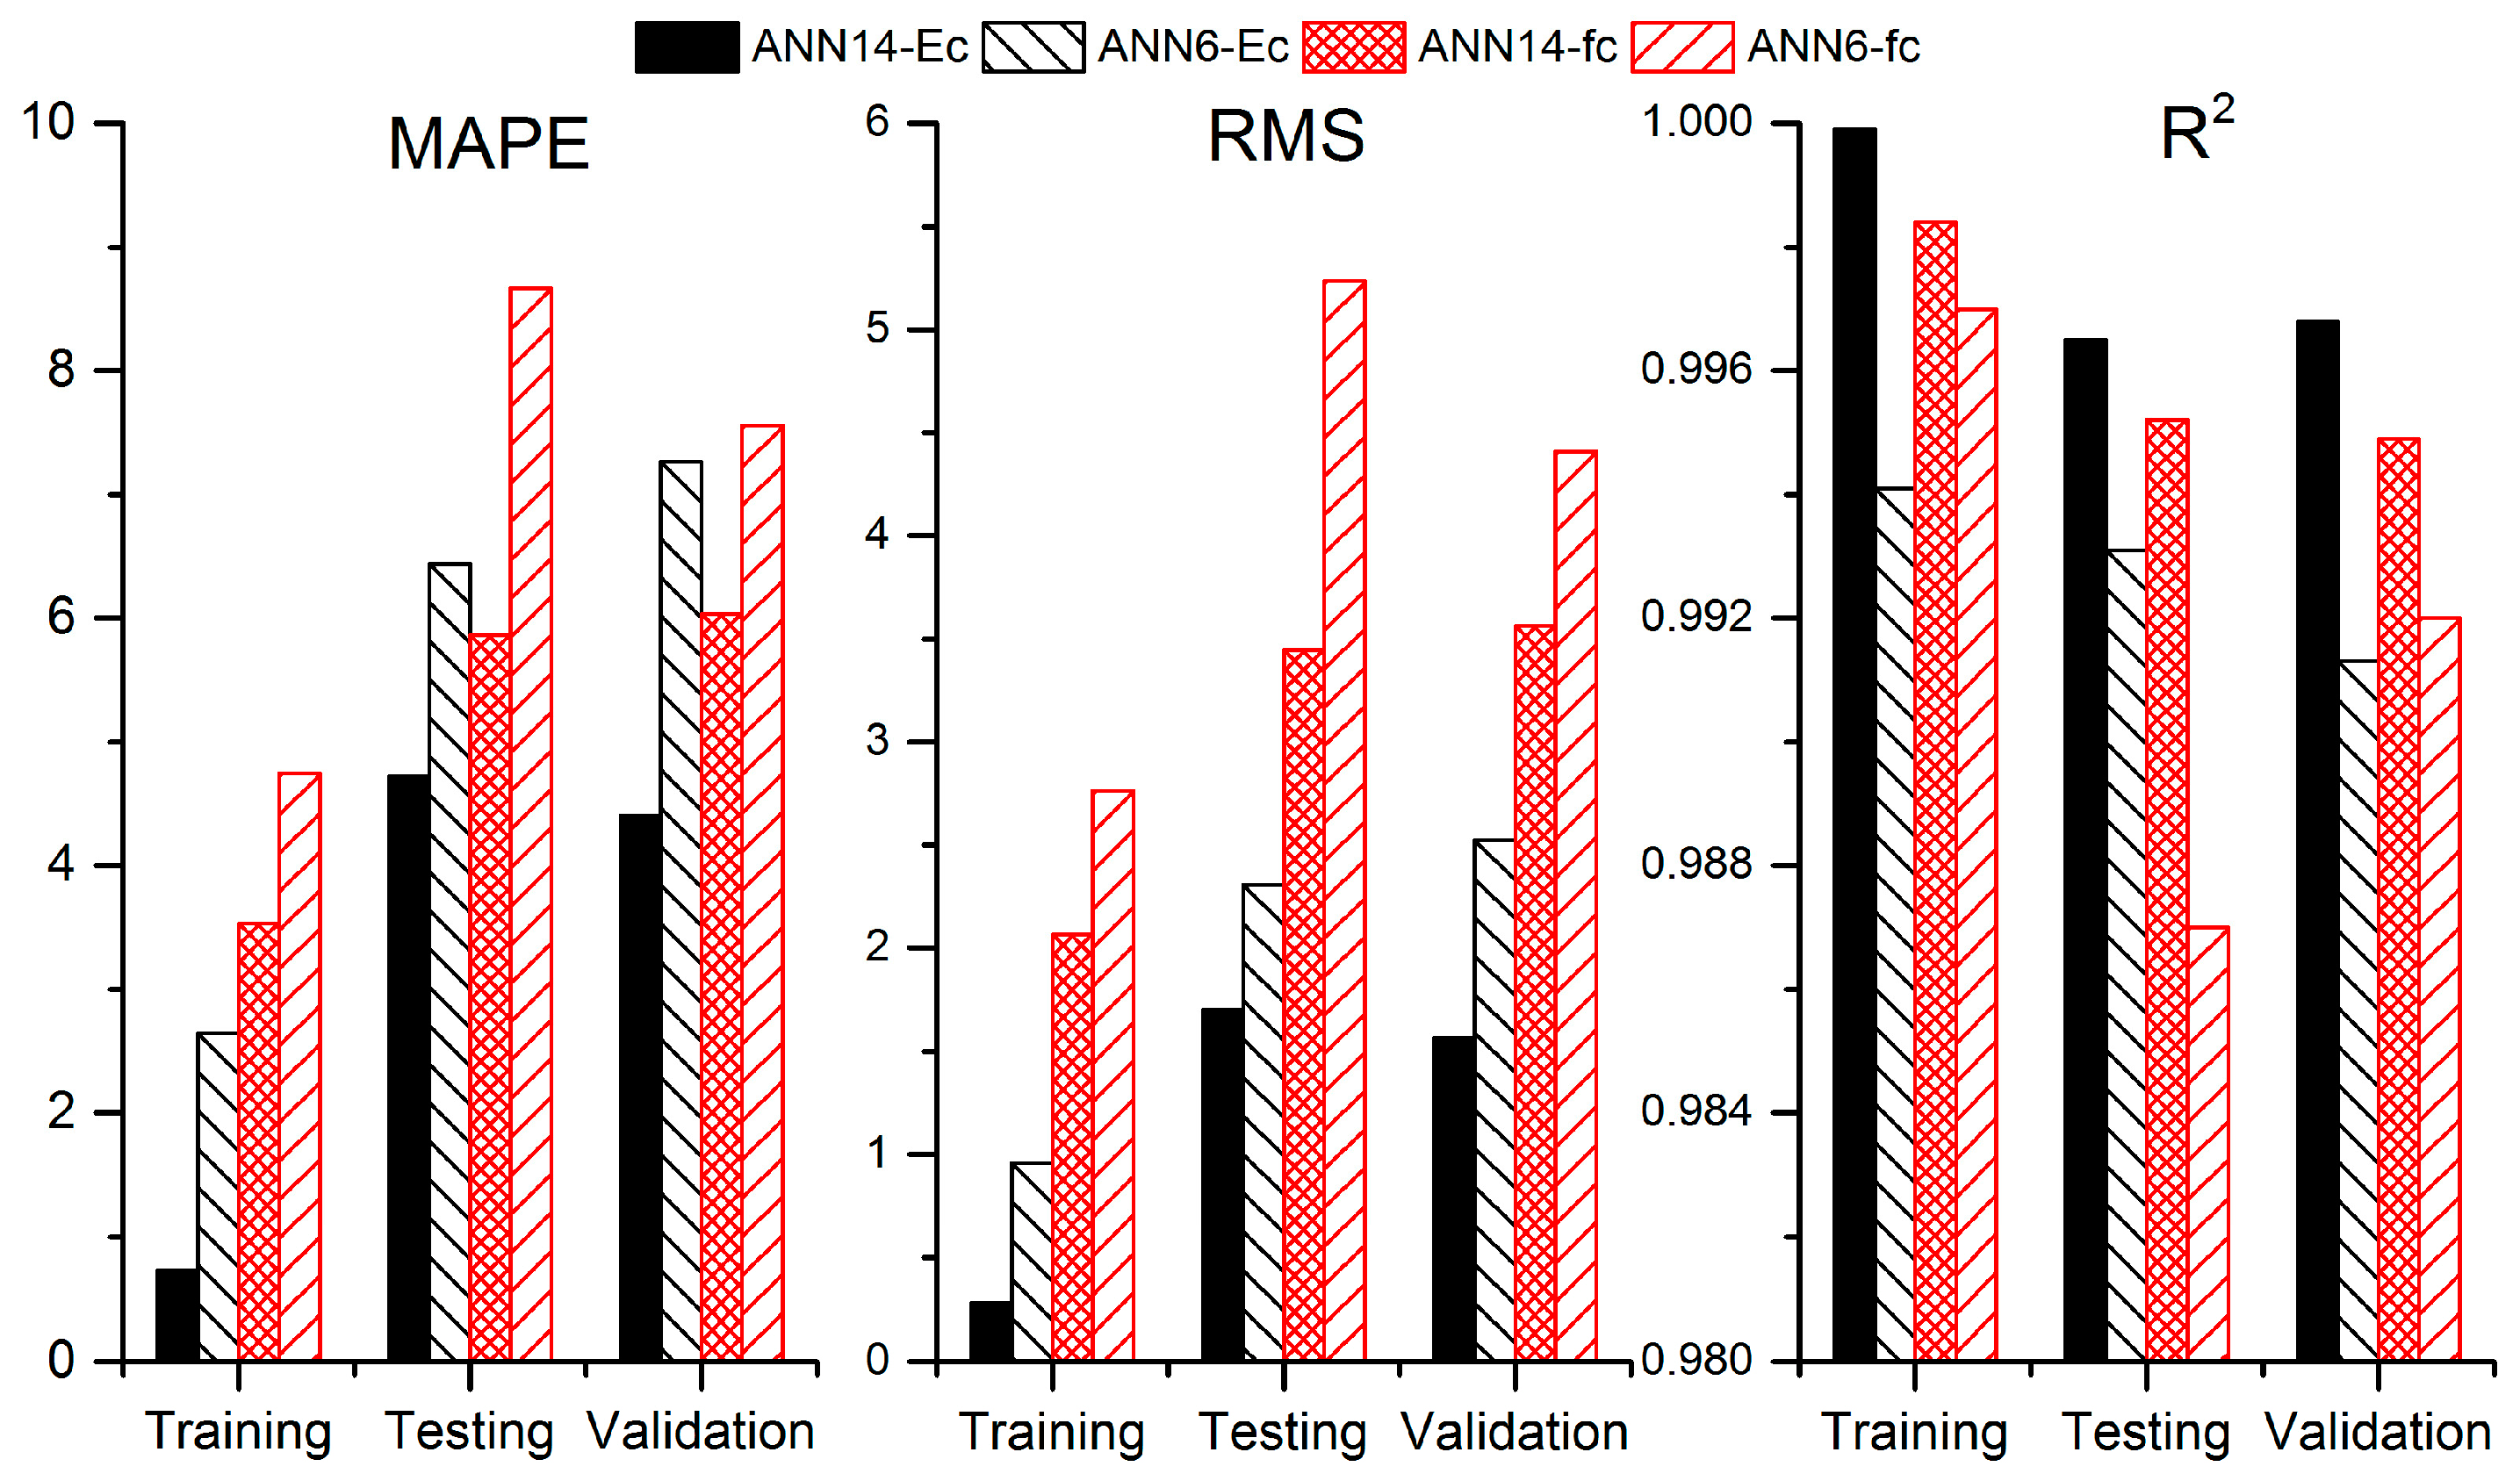
3. Results and Discussion
The performance of the constructed ANN models (
ANN14-fc,
ANN14-Ec) in predicting the compressive strength and elastic modulus of RAC with all 14 variables and compared to the models (
ANN6-fc,
ANN6-Ec) using only the “certainties” as input variables is shown in
Table 4 and
Figure 5.
The correlation coefficient R2 of the networks in modeling the compressive strength and elastic modulus reached 0.9984 and 0.9999, respectively, indicating that the correlations between the predictions and the true results were very good. The R2 values of both models were all above 0.994 in the testing and validation sets and these further proved that the constructed models, ANN14-fc and ANN14-Ec, had not only good simulating abilities, but also good generalization capabilities.
When only the mix proportions and the curing ages were used as the inputs of the networks, the R2 values of ANN6-fc and ANN6-Ec in the training sets were still up to 0.997 and 0.9941. However, the generalization performance (testing and validation sets) of both networks were significantly poorer, with the R2 values reduced to the range of 0.987–0.9931 and the predicted errors MAPE increased by about 50% in both the validation and testing sets. This might explain why many established formulae (based on regression analysis) could not be used for practical applications although they had good correlation coefficients.
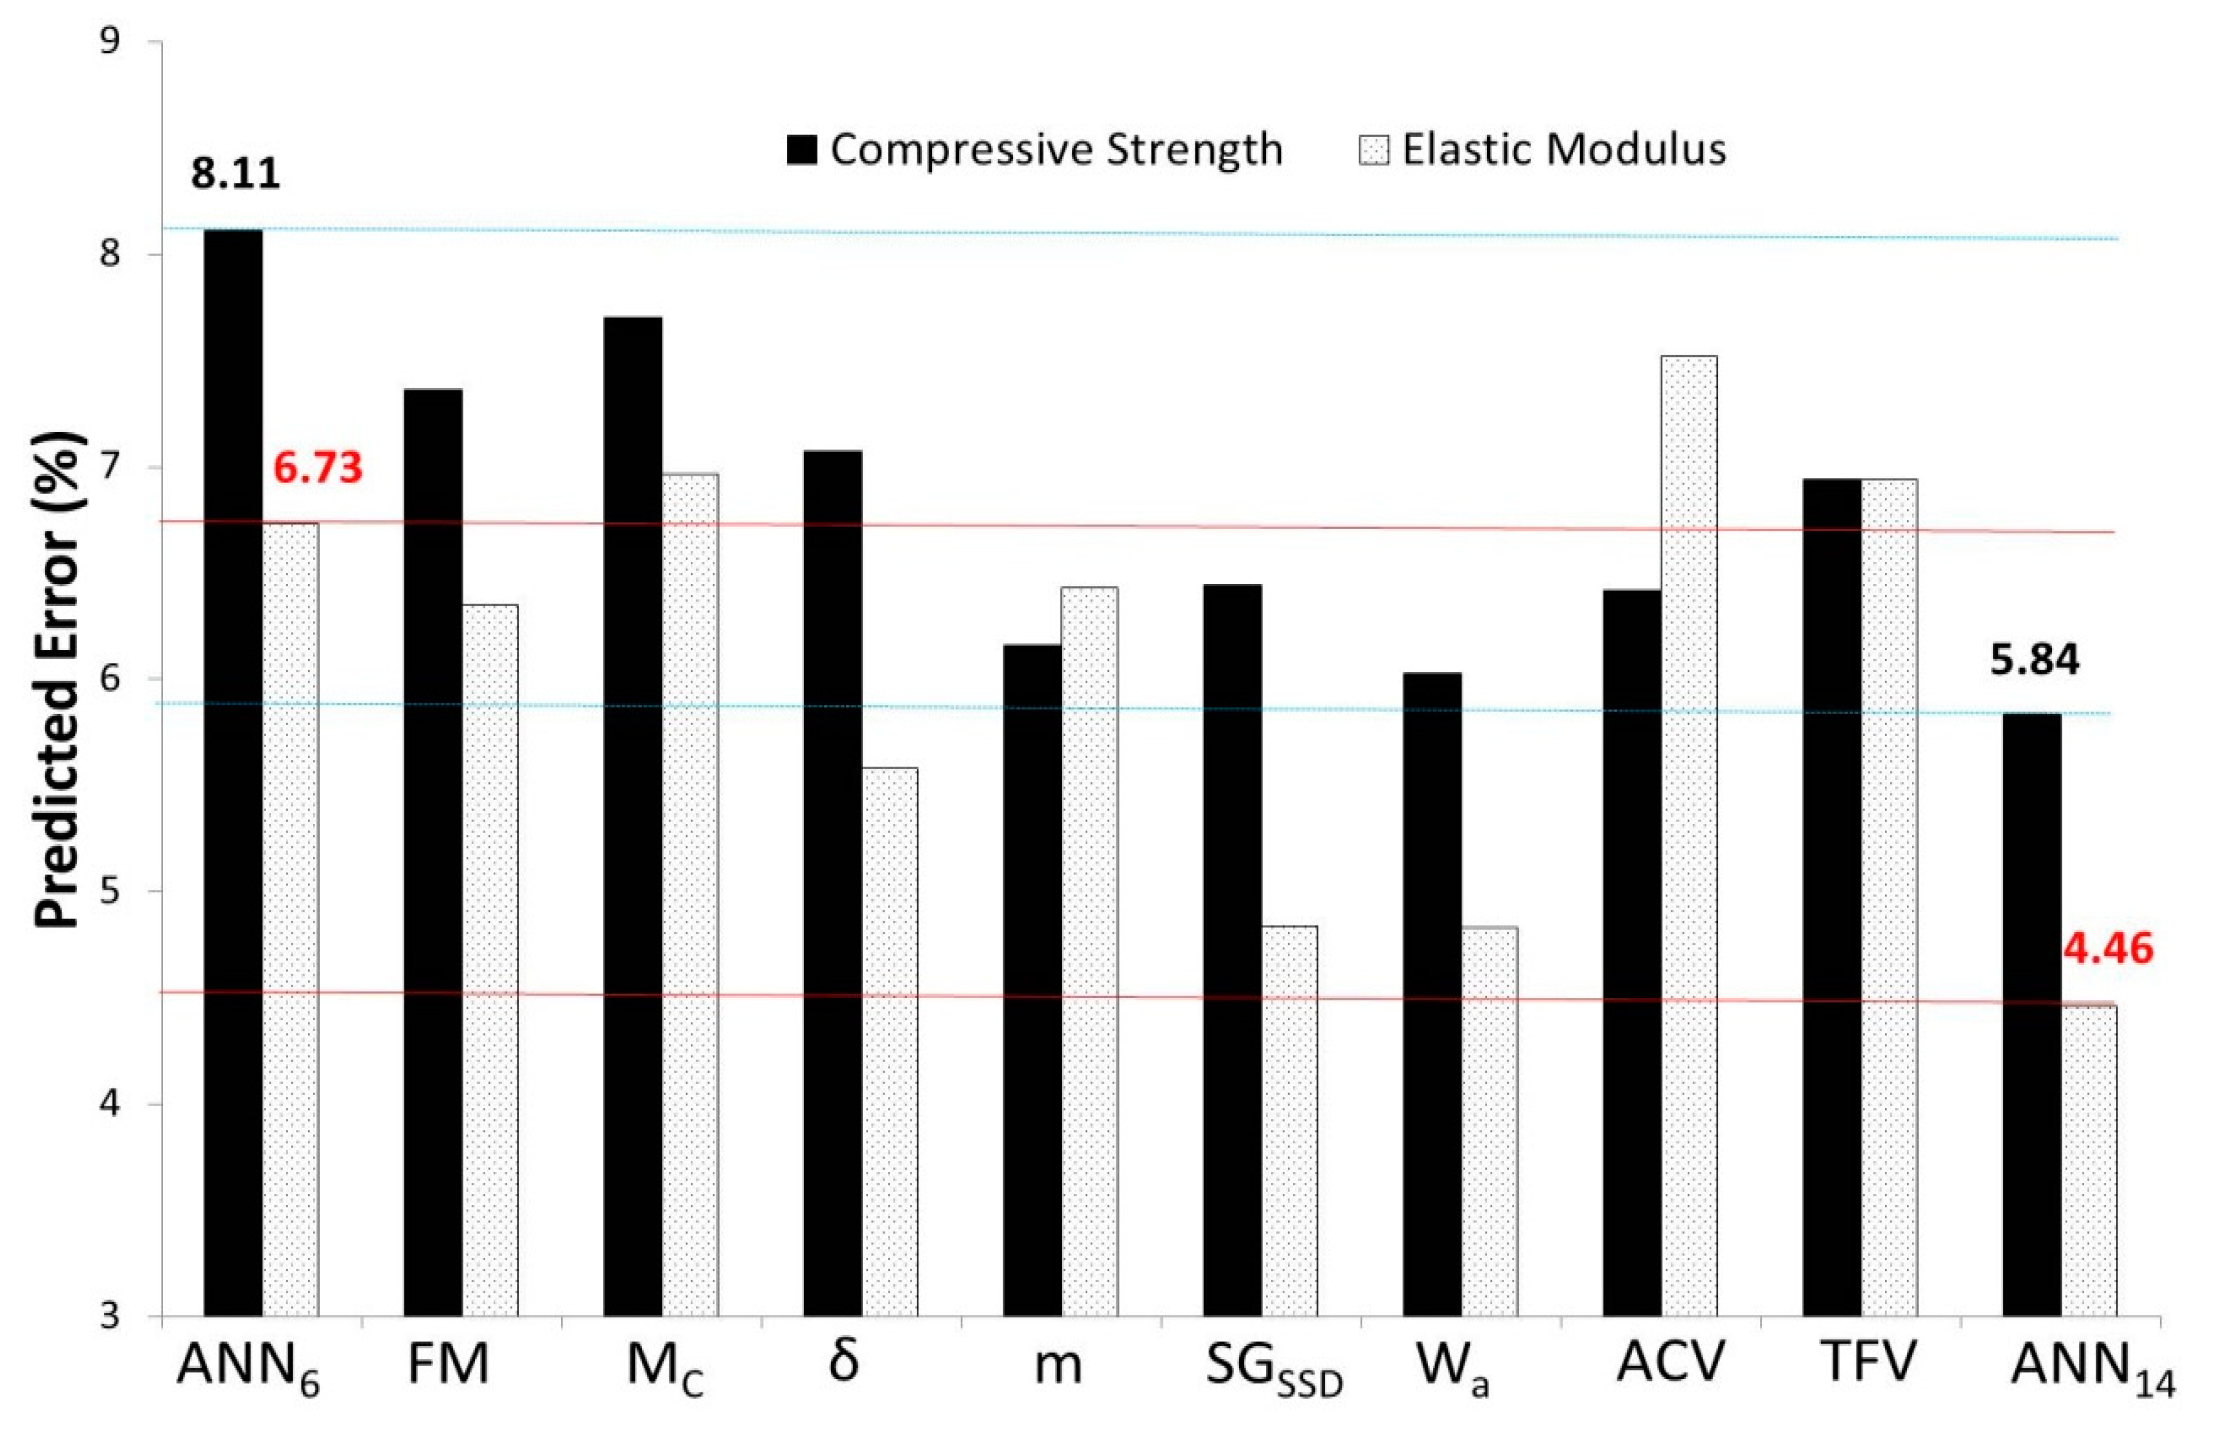
For compressive strength,
Figure 6 shows that the predicted error of the networks (
ANN6-fc) using only “certainties” as inputs was about 8.11%, and the performance of the networks could be enhanced with the addition of each aggregate characteristic to the inputs. It can be found that the predicted error of compressive strength was lower when the water absorption or masonry content of the coarse aggregate were taken into consideration, which was almost close to the model (
ANN14-fc) with all variables as inputs.
As shown in
Table 5, the performance of the networks (
ANN8) with the combinations of two aggregate characteristics added as inputs of
ANN6-fc was not necessarily better than those with only one aggregate characteristic added to the inputs. This was mainly due to the fact that the degrees of influence related to these aggregate characteristics were inconsistent, which may have misled the correlation of the inputs and outputs. However, the results demonstrated that the use of seven combinations (italics) of aggregate characteristics as inputs to
ANN6-fc could improve the predicted capability of the networks; these combinations were SG
SSD and W
a, SG
SSD and TFV, W
a and δ, W
a and TFV, FM and TFV, m and δ, and m and M
c.
Then, these combinations of two characteristics were used to examine whether they could form new combinations of three or four characteristics that could further improve the prediction of the networks. The results listed in
Table 6 show that the error of networks could be reduced to 5.43–5.91 when the following combinations of aggregate characteristics, together with “certainties”, were adopted as the inputs of networks: SG
SSD + W
a + δ, SG
SSD + m + TFV + M
c, SG
SSD + W
a + TFV and FM + m + TFV + M
c. Moreover, the further combinations of these factors was no longer useful to reduce the error of prediction of the networks (
Table 7).
To sum up, the addition of any one of the eight aggregate characteristics to ANN6-fc could help achieve a better prediction of the compressive strength of RAC. When these characteristics were added to the input variables of ANN6-fc alone, water absorption contributed to the largest reduction in the error of networks, from about 8.11% to only 6.03%. The use of some combinations of these eight characteristics could further decrease the error of networks, even lower than that of ANN14-fc. The network error was only 5.43% when a combination of SGSSD, Wa, δ, and the “certainties” (mix proportions and curing ages) were used as the input variables.
The case was slightly different for the elastic modulus. As shown in
Figure 5, the error of the networks (
ANN6-Ec) with only the mix proportions and the curing ages as inputs was about 6.73%. When each one of the eight aggregate characteristics was added to the input variables alone, the results showed that three characteristics (viz mortar content, aggregate crushing value and 10% fines value) could not improve the prediction, while the other five characteristics could help to optimize the model; among the eight aggregate characteristics, the SG
SSD and W
a played the most significant influence, being capable of reducing the error to about 4.84% and 4.83%, respectively.
However, only the combination of SG
SSD and W
a could further decrease the network error to about 3.89%, as shown in
Table 8. Therefore, in this study the best combination of parameters for modeling the elastic modulus of RAC was mix proportions, curing ages, and the specific gravity and water absorption values of the RA.


