Feasibility Study of Steel Bar Corrosion Monitoring Using a Piezoceramic Transducer Enabled Time Reversal Method


1
Key Laboratory of Coastal and Offshore Engineering, Dalian University of Technology, Dalian 116024, China
2
School of Civil Engineering, Changsha University of Science and Technology, Changsha 410114, China
*
Authors to whom correspondence should be addressed.
Appl. Sci. 2018, 8(11), 2304; https://0-doi-org.brum.beds.ac.uk/10.3390/app8112304
Submission received: 4 October 2018
/
Revised: 14 November 2018
/
Accepted: 15 November 2018
/
Published: 19 November 2018
(This article belongs to the Special Issue Structural Damage Detection and Health Monitoring)
Abstract
:Steel bars, which are commonly used as reinforcements in concrete structures, are slender rods and are good conduits for stress wave propagation. In this paper, a lead zirconate titanate (PZT)-based steel bar corrosion monitoring approach was proposed. Two PZT transducers are surface-bonded on the two ends of a steel rod, respectively. One works as actuator to generate stress waves, and the other functions as a sensor to detect the propagated stress waves. Time reverse technology was applied in this research to monitor the corrosion of the steel bars with a high signal to noise ratio (SNR). Accelerated corrosion experiments of steel bars were conducted. The anti-corrosion performance of the protected piezoceramic transducers was tested first, and then they were used to monitor the corrosion of the steel bar using the time reversal method. The degree of corrosion in the steel bar was determined by the ratio of mass loss during the experiment. The experimental results show that the peak values of the signal that were obtained by time reversal operation are linearly related to the degree of corrosion of the steel bar, which demonstrates the feasibility of the proposed approach for monitoring the corrosion of steel bars using the time reversal method enabled by piezoceramic transducers.
1. Introduction
Steel bars are widely used as reinforcements for concrete structures in civil engineering [1,2]. Although the use of non-metal bars in concrete is receiving more and more attention [3,4], steel bars are still the most commonly used in concrete structures. During their service life, steel bars are prone to corrosion in the natural environment [5]. The consequences of the corrosion of steel rebars may result in non-uniform distributed points or pits on the steel surface, and the volumetric expansion of the reactant leads to the increase of radial stress on the reinforcement concrete, which reduces the constraints of the reinforced concrete, destroys the original bonding, and ultimately results in cracks in the structure [6,7]. The corrosion of steel bars often occurs in coastal structures, hydraulic structures, and bridges, as well as roads and buildings, among others. The corrosion of steel bars poses a threat to the safety and health of these structures, and may cause catastrophic consequences if undetected.
Monitoring corrosion is one of the best options to offer early warning about corrosion, and the high cost of later repairing can be avoided. Structural health monitoring (SHM) [8,9] is a relatively new area that is currently being explored in corrosion monitoring in order to achieve the objectives of rapid and real-time detection of the corrosion of steel reinforcement, and to offer an early warning for timely maintenance [10].
In the current literature, physical and electrochemical methods are the two main methods used to detect the corrosion of steel rebars [11]. Physical methods are used to evaluate the corrosion of steel rebars by detecting changes in the physical characteristics, including electrical resistance, electromagnetics, heat conduction, and sound propagation. Such methods include time domain reflectometry (TDR) [12], X-ray diffraction and atomic absorption probe technique, infrared (IR) thermography [13], and fiber optic corrosion detection [14]. A disadvantage is that the external sensor wire is not sufficiently sensitive to detect the degree of corrosion of steel rebars in the TDR measurement. The X-ray diffraction and atomic absorption probe technique are not suitable for on-site monitoring, owing to their radiation hazard [15]. The fiber optic sensors can also be used to monitor the corrosion of steel bars, but the detection is restricted to the small area where the sensor probe is installed. In addition, the high cost of protecting the fiber and interrogator also poses challenges to implementation [16].
The electrochemical method is an approach that detects the electrochemical properties in order to evaluate the corrosive degree of a reinforced concrete corrosion system. It includes the half-cell potential method [17], galvanostatic pulse technique [18], and electrochemical impedance spectroscopy method [19,20]. Although these electrochemical methods can be used for monitoring civil structures, their disadvantages include a long preparation time, low accuracy, saturation, unstable readings, insulation aging, poor electromagnetic interference resistance [21], and the loss of signal owing to a long electrode lead wire.
The ultrasonic guided wave (UGW) technique is a type of physical method. With the advantages of in situ, real time, and more precision in corrosion monitoring, it has become increasingly popular in the corrosion monitoring of steel bars [22]. Miller et al. [23] proposed a corrosion monitoring method of steel bars in an RC structure based on the time of arrival changes. Ervin et al. [24] used frequency sweeps of guided mechanical waves for the detection and estimation of corrosion damage in steel-reinforced mortar samples with seeded defects, and in samples undergoing accelerated corrosion owing to the impressed current. Moustafa et al. [25] presented an approach for monitoring the corrosion evolutionary path in post-tensioned systems, based on the fractal analysis of UGW. In addition, acoustic emission (AE) can also be used to monitor and classify early corrosion damage in RC piles exposed to saltwater [26].
The time reversal (TR) method has been increasingly popular in the fields of signal processing and imaging in recent years. TR is a reverse operation for the received signals in the time domain. Two properties, namely spatial focusing and temporal focusing, enable the TR operated signal to have a high signal to noise ratio (SNR) [27]. Zhang et al. [28] proposed a TR method using stress wave-based active sensing in order to detect the state of looseness of a cuplock connection. Mustapha et al. [29] used a method to detect corrosion damage in reinforced concrete beams, which is based on the time reversal of the guided waves. Tian et al. [27] proposed a method to monitor the grouting quality using a piezoceramic transducer enabled time-reversal method. Qiu et al. [30] proposed an impact image method, which is time-reversal-focusing-based, to estimate the position of the impact for complex composite structures. Hong et al. [31] proposed an active sensing method to monitor the degree of looseness of a pipeline tapered thread connection, which used piezoceramic transducers based on time reversal, and demonstrated it to be more robust in rejecting noise in SHM applications. Zhang et al. [32] proposed a TR method to identify the depths of artificial pitting corrosion on the galvanized steel wires. On et al. [33] proposed a technique regarding time reversal to improve the performance of detecting a cylindrical object bottoming at the seafloor in shallow water.
Piezoceramic is one kind of functional material that can realize the conversion of electrical energy and mechanical energy [34]. In addition, piezoceramics have many advantages, including a high sensitivity, low cost [35], quick response [36], wide frequency response range [37,38], suitability for high-frequency excitation [39], and small size, which have almost no effect on the structural properties [40]. Piezoceramics have been widely used in medical imaging, acoustics, ultrasound, and energy harvesting [41,42,43,44,45,46,47], among others. Piezoceramics can be conveniently developed into sensors or actuators of different shapes [48,49], because of their positive piezoelectric effect and inverse piezoelectric effect [50]. Piezoceramic devices are commonly used to generate and detect ultrasonic waves for structural health monitoring [35,51,52]. Piezoceramics can be embedded into structures or pasted onto the surface of structures in order to monitor the health of structures [53,54,55,56]. Lead zirconate titanate (PZT) is the most commonly used piezoceramic material, with a strong piezoelectric effect. Shao et al. [38] used PZT to detect bolt looseness. Jiang et al. proposed an active sensing method to detect the debonding between the reinforcing bar and the concrete [57].
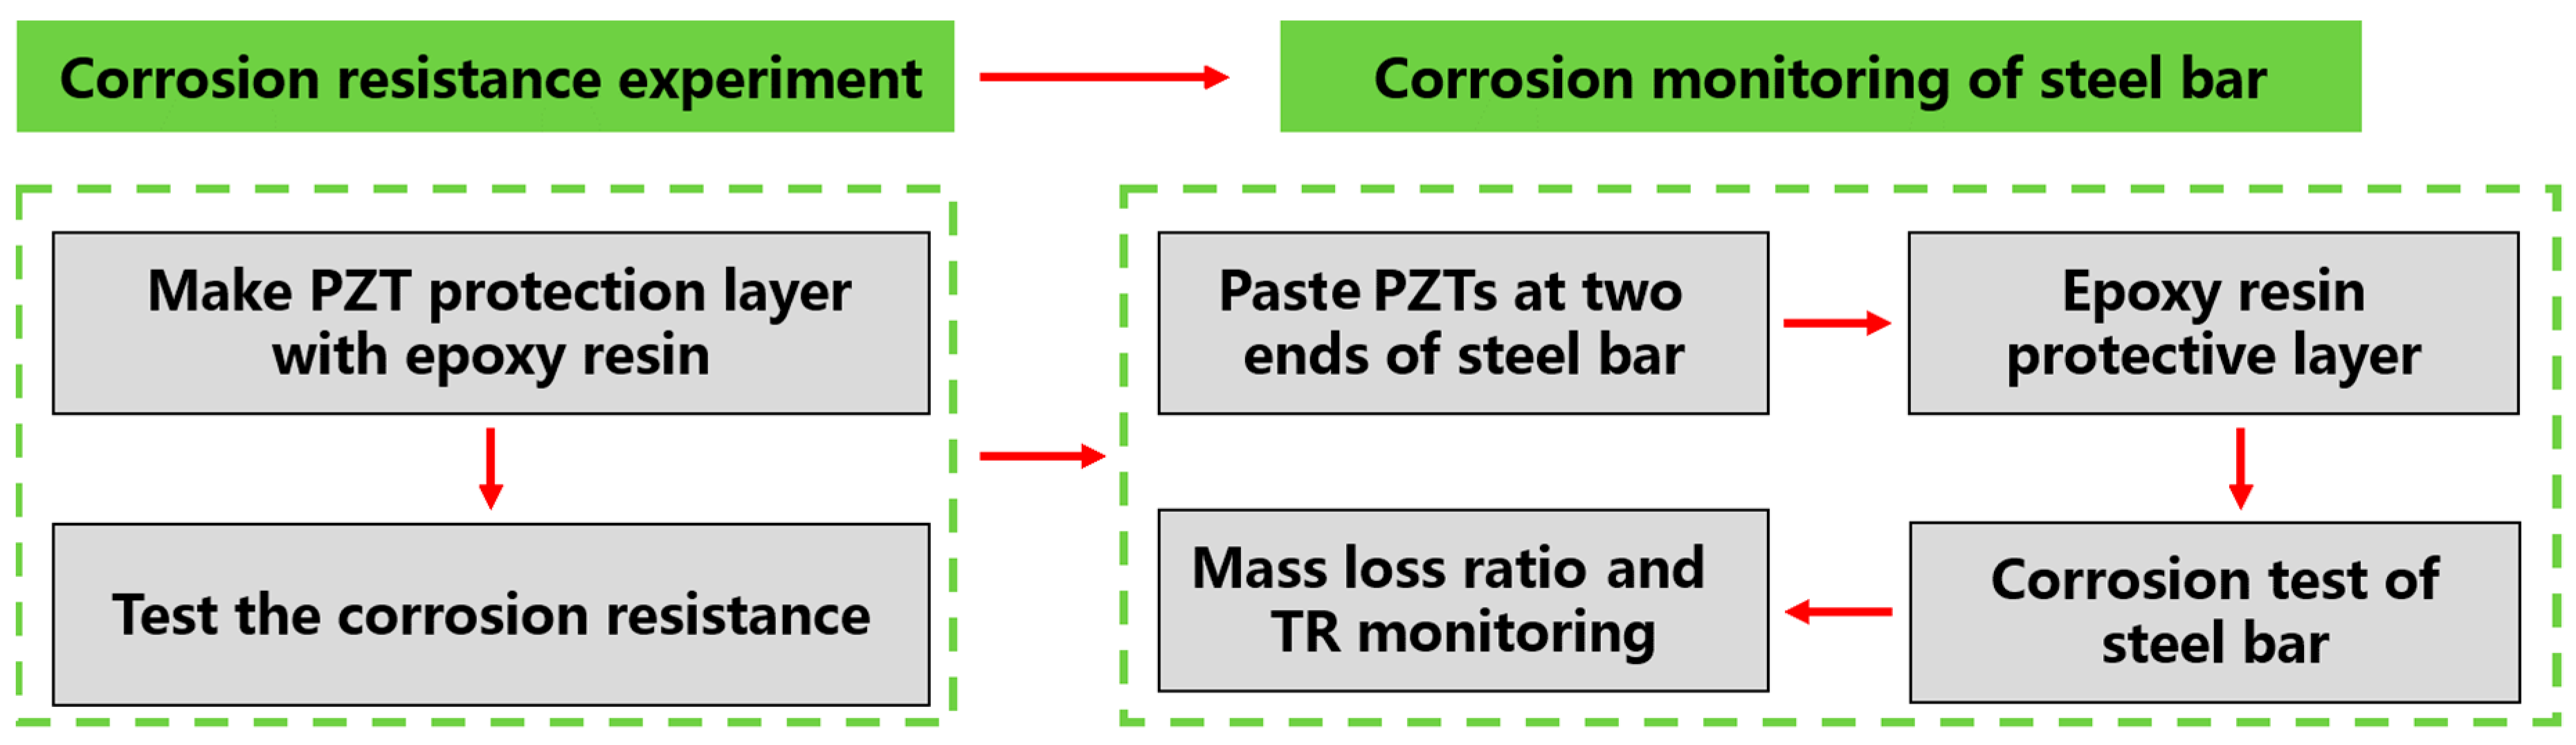
To monitor the corrosion of steel bars, this paper proposes a new approach that is simple to implement and offers real time monitoring. First of all, the corrosion resistance of the piezoceramic transducers with epoxy resin protection were investigated. A rapid corrosion test environment was created using a 20% solution of sodium chloride (NaCl) with an amplified current. The experimental results demonstrated that the NaCl solution had no influences on the epoxy resin proofed piezoceramic transducers. Then, two PZT transducers were surface-bonded on the two ends of a steel rod, respectively. One PZT worked as an actuator, which emits a Gauss signal, and the other one was a receiver. By the TR operation, the amplitude of the focused signal works as the criteria to evaluate the corrosion severity of the steel bars. The accelerated corrosion experiments of steel bars were conducted in a water solution containing 5% NaCl. The ratio of mass loss was applied to evaluate the corrosion severity of the steel bar. The corrosion result shows that the corrosion on the steel bar significantly effects the propagation of the stress wave. The amplitude of the focused signal can effectively reflect the corrosion state of the steel bar. Figure 1 presents a flow chart to summarize the experimental flow of our study.
2. Piezoceramic Transducer and Monitoring Principle
2.1. Piezoceramic Transducer
Piezoelectric materials, such as piezoceramics, have characteristics of actuating and sensing in a wide frequency range, which makes them suitable for the SHM field [58,59,60,61]. The piezoelectric effect includes the direct and converse piezoelectric effect [62,63]. Owing to these characteristics, the piezoceramic materials can be used as a sensor and an actuator [64,65,66]. The piezoelectric material has a strong commercial availability and piezoelectric effect; therefore, it is highly applied in this research. Furthermore, we used PZT disks as transducers so as to enable the TR method to monitor steel bar corrosion.
2.2. Time Reversal (TR) Method
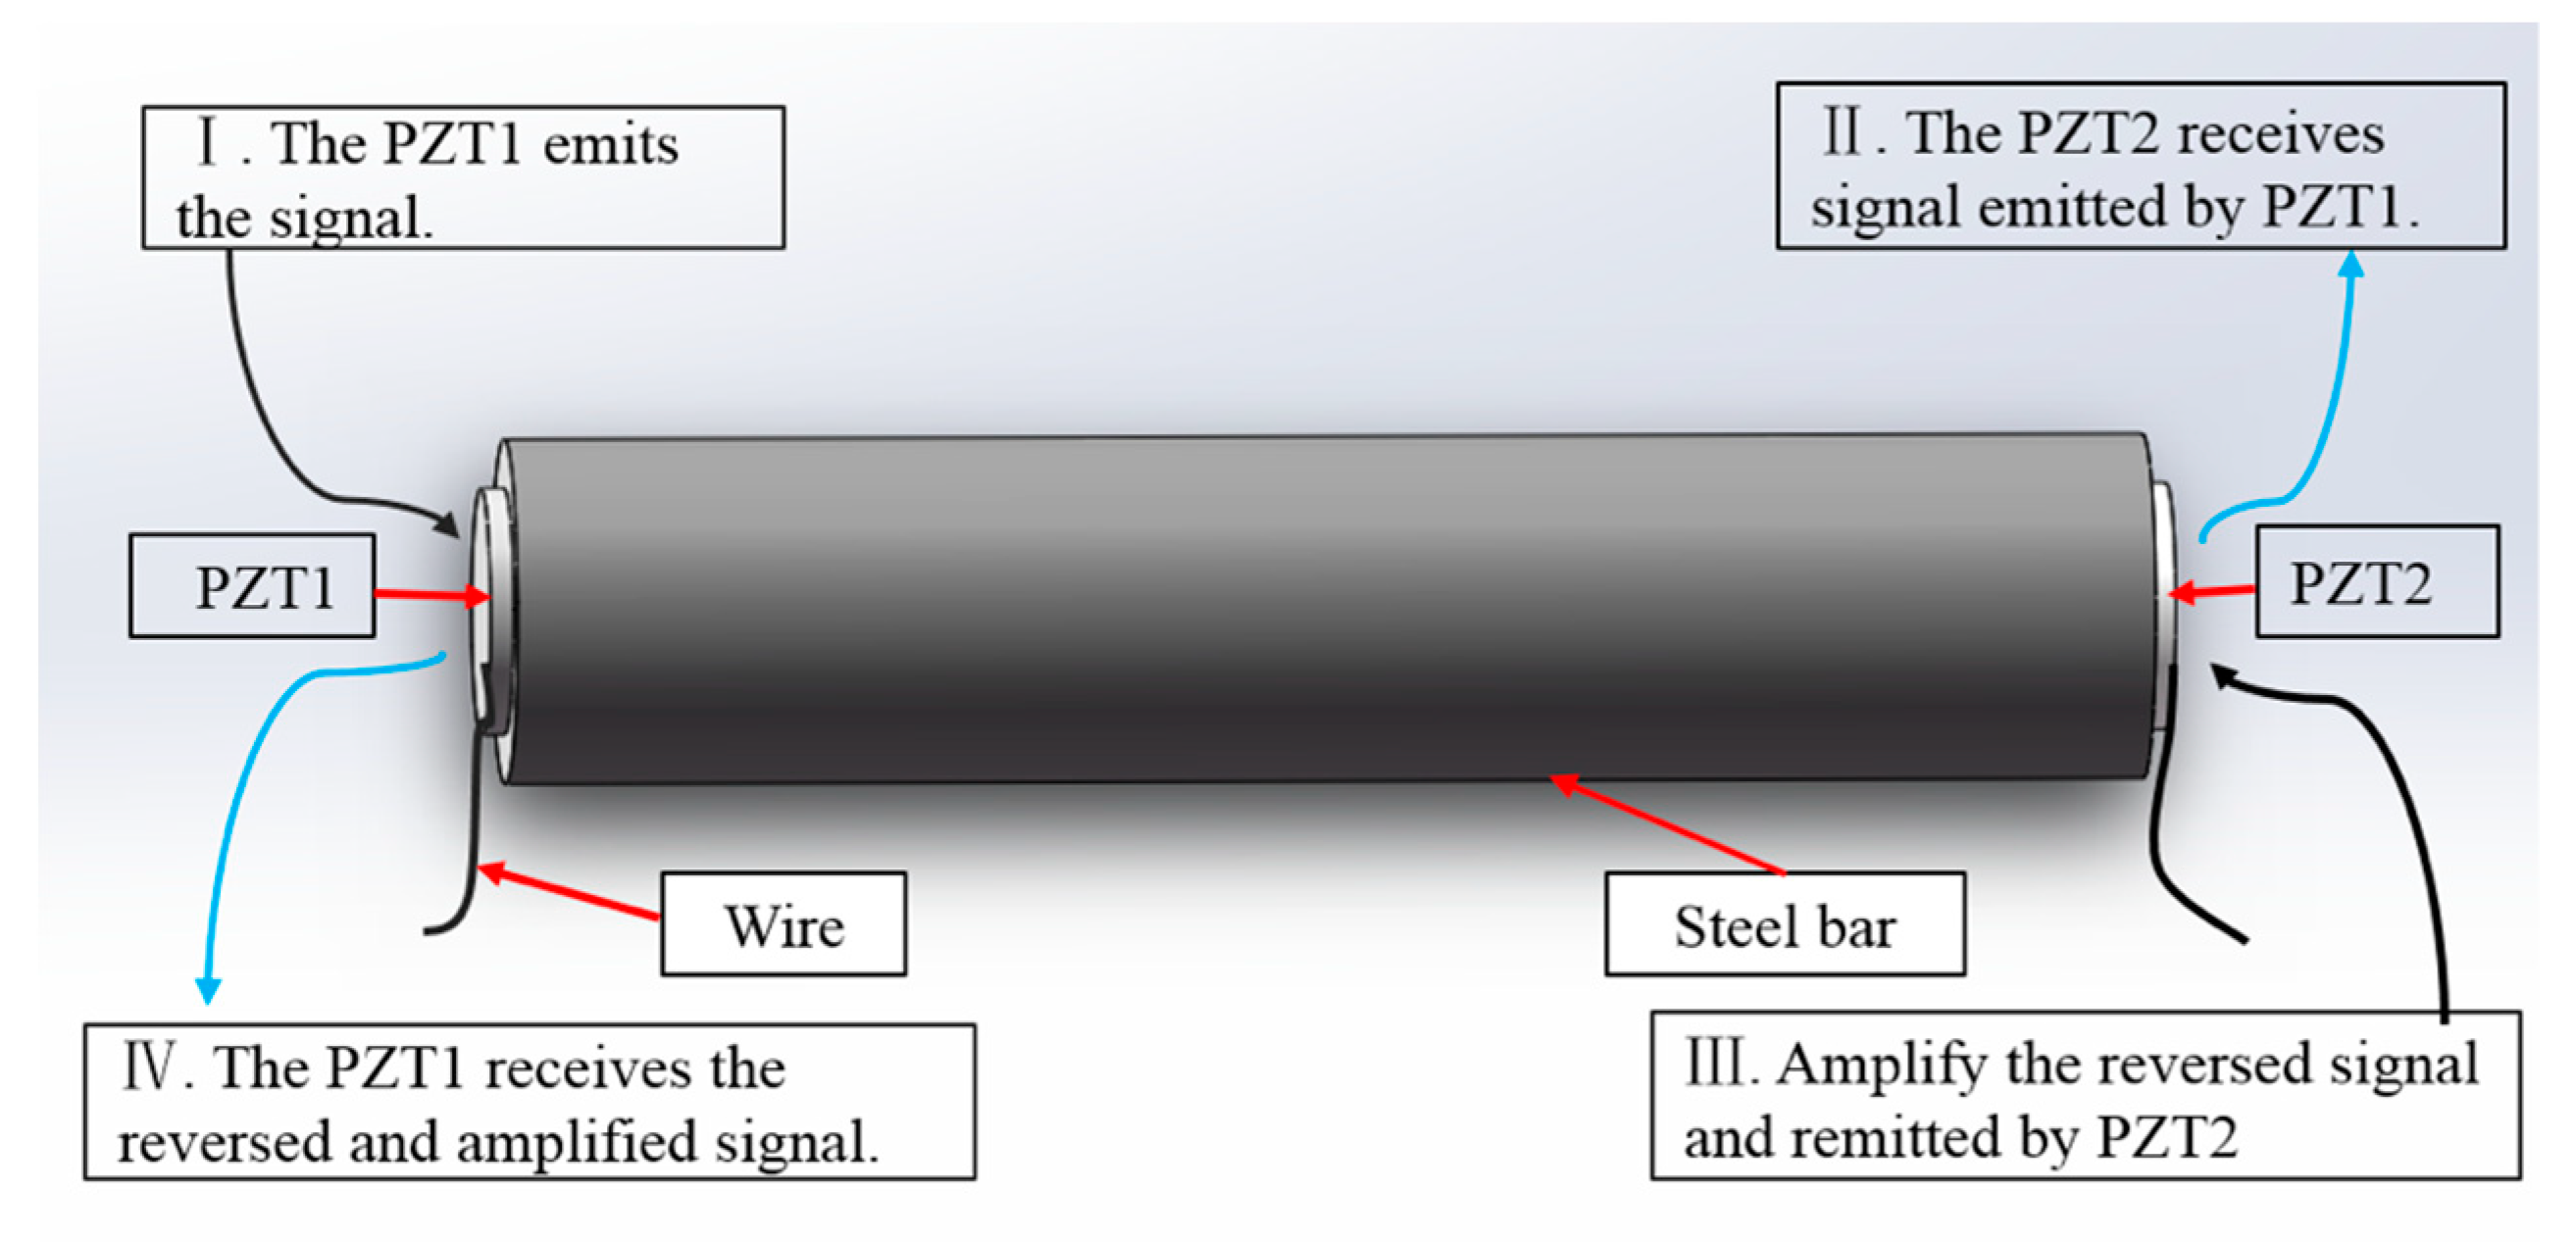
The time reversal (TR) method enabled by the piezoceramic transducer is a relative new approach, and has found use in some applications, including therapy, electromagnetic, SHM, underwater acoustics, and ultrasound medical imaging. For guided waves in cylinders, the propagation of the stress waves is complex, and numerous vibrating modes propagate simultaneously at one single excitation frequency [32]. For steel bars, the propagation of the guided waves in them will be more complex, and non-uniform distributed points or pits on the bar surface as a result of the corrosion can cause serve noise. As an inherent property, the time-reversal method has the capability of self-adaptive focusing and robust anti-noise [67], which can make up for the limitation of multi-path transmission [68], enhance the received pulse energy [69,70], and improve the detection capability. Fink [71] applied the TR methods to the acoustic field, and carried out an in-depth research on the theory, experiment, and application of the adaptive focusing principle. The TR method has the above advantages, and has been applied to steel bar corrosion monitoring in this study. Taking the advantages of having the ability to generate and detect stress waves in a wide frequency range, two PZT disks, which are bonded to the end-surfaces of the steel bar, are used as transducers to enable the TR method, as illustrated in Figure 2.
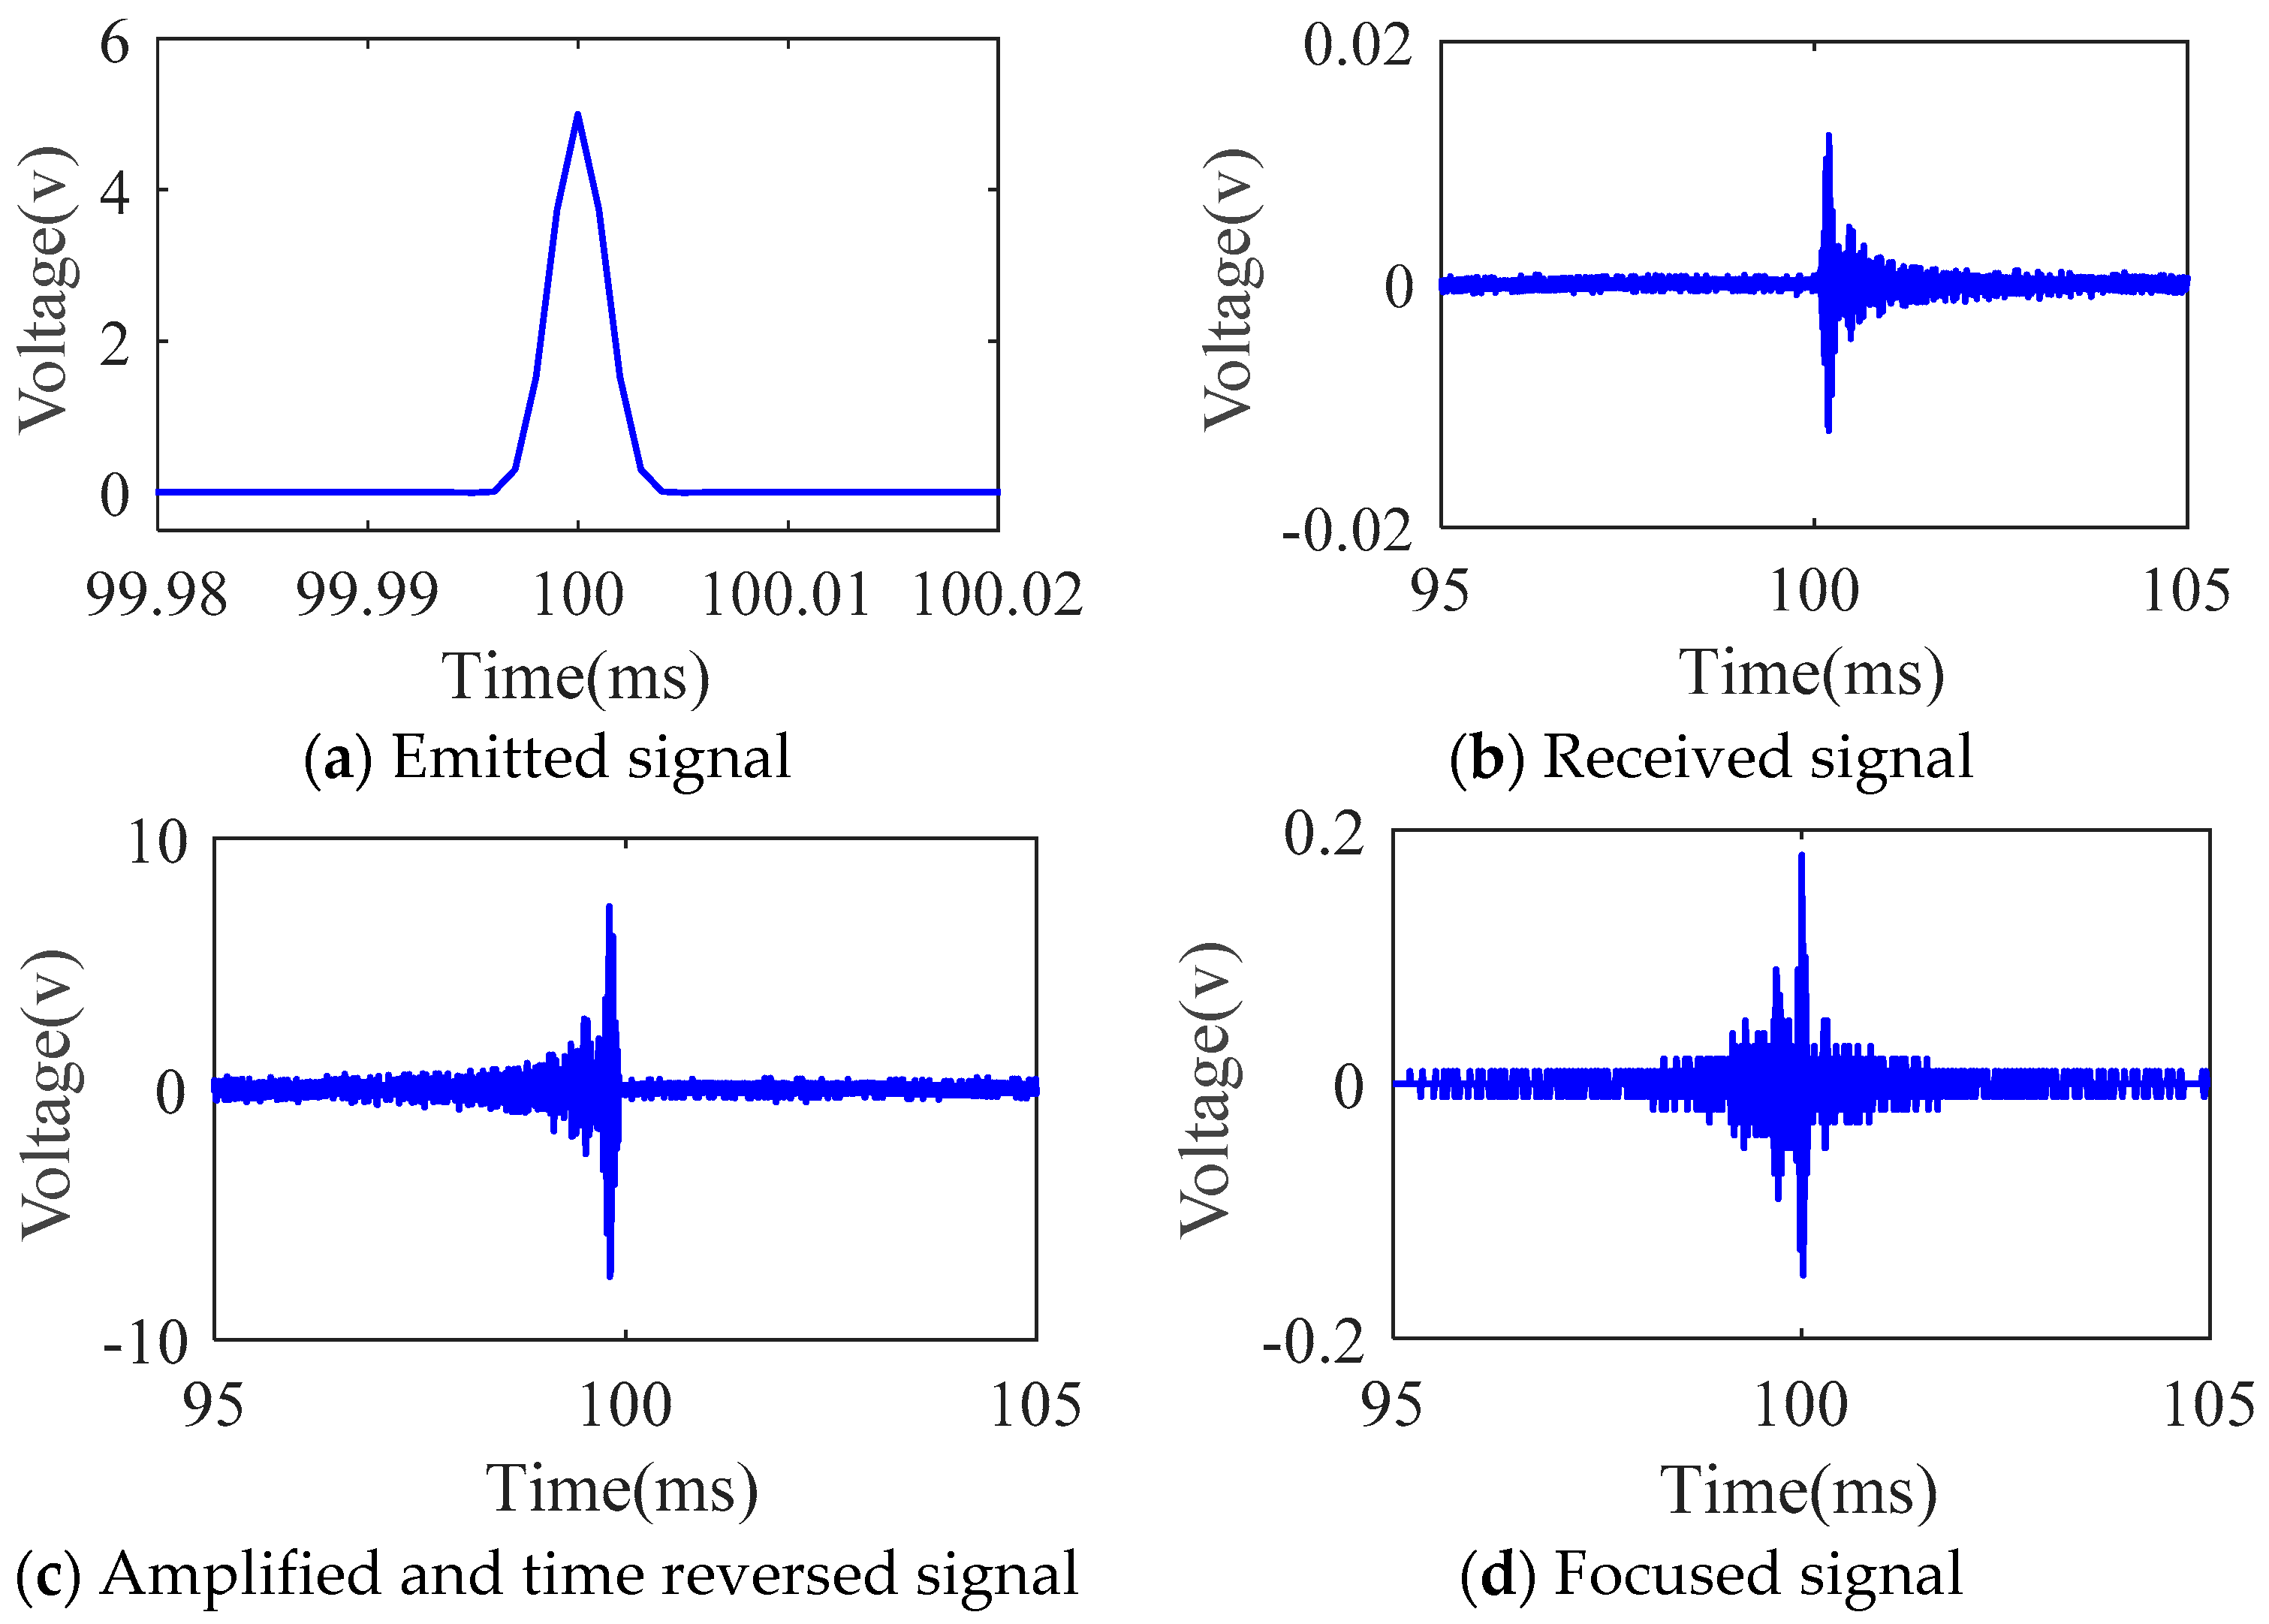
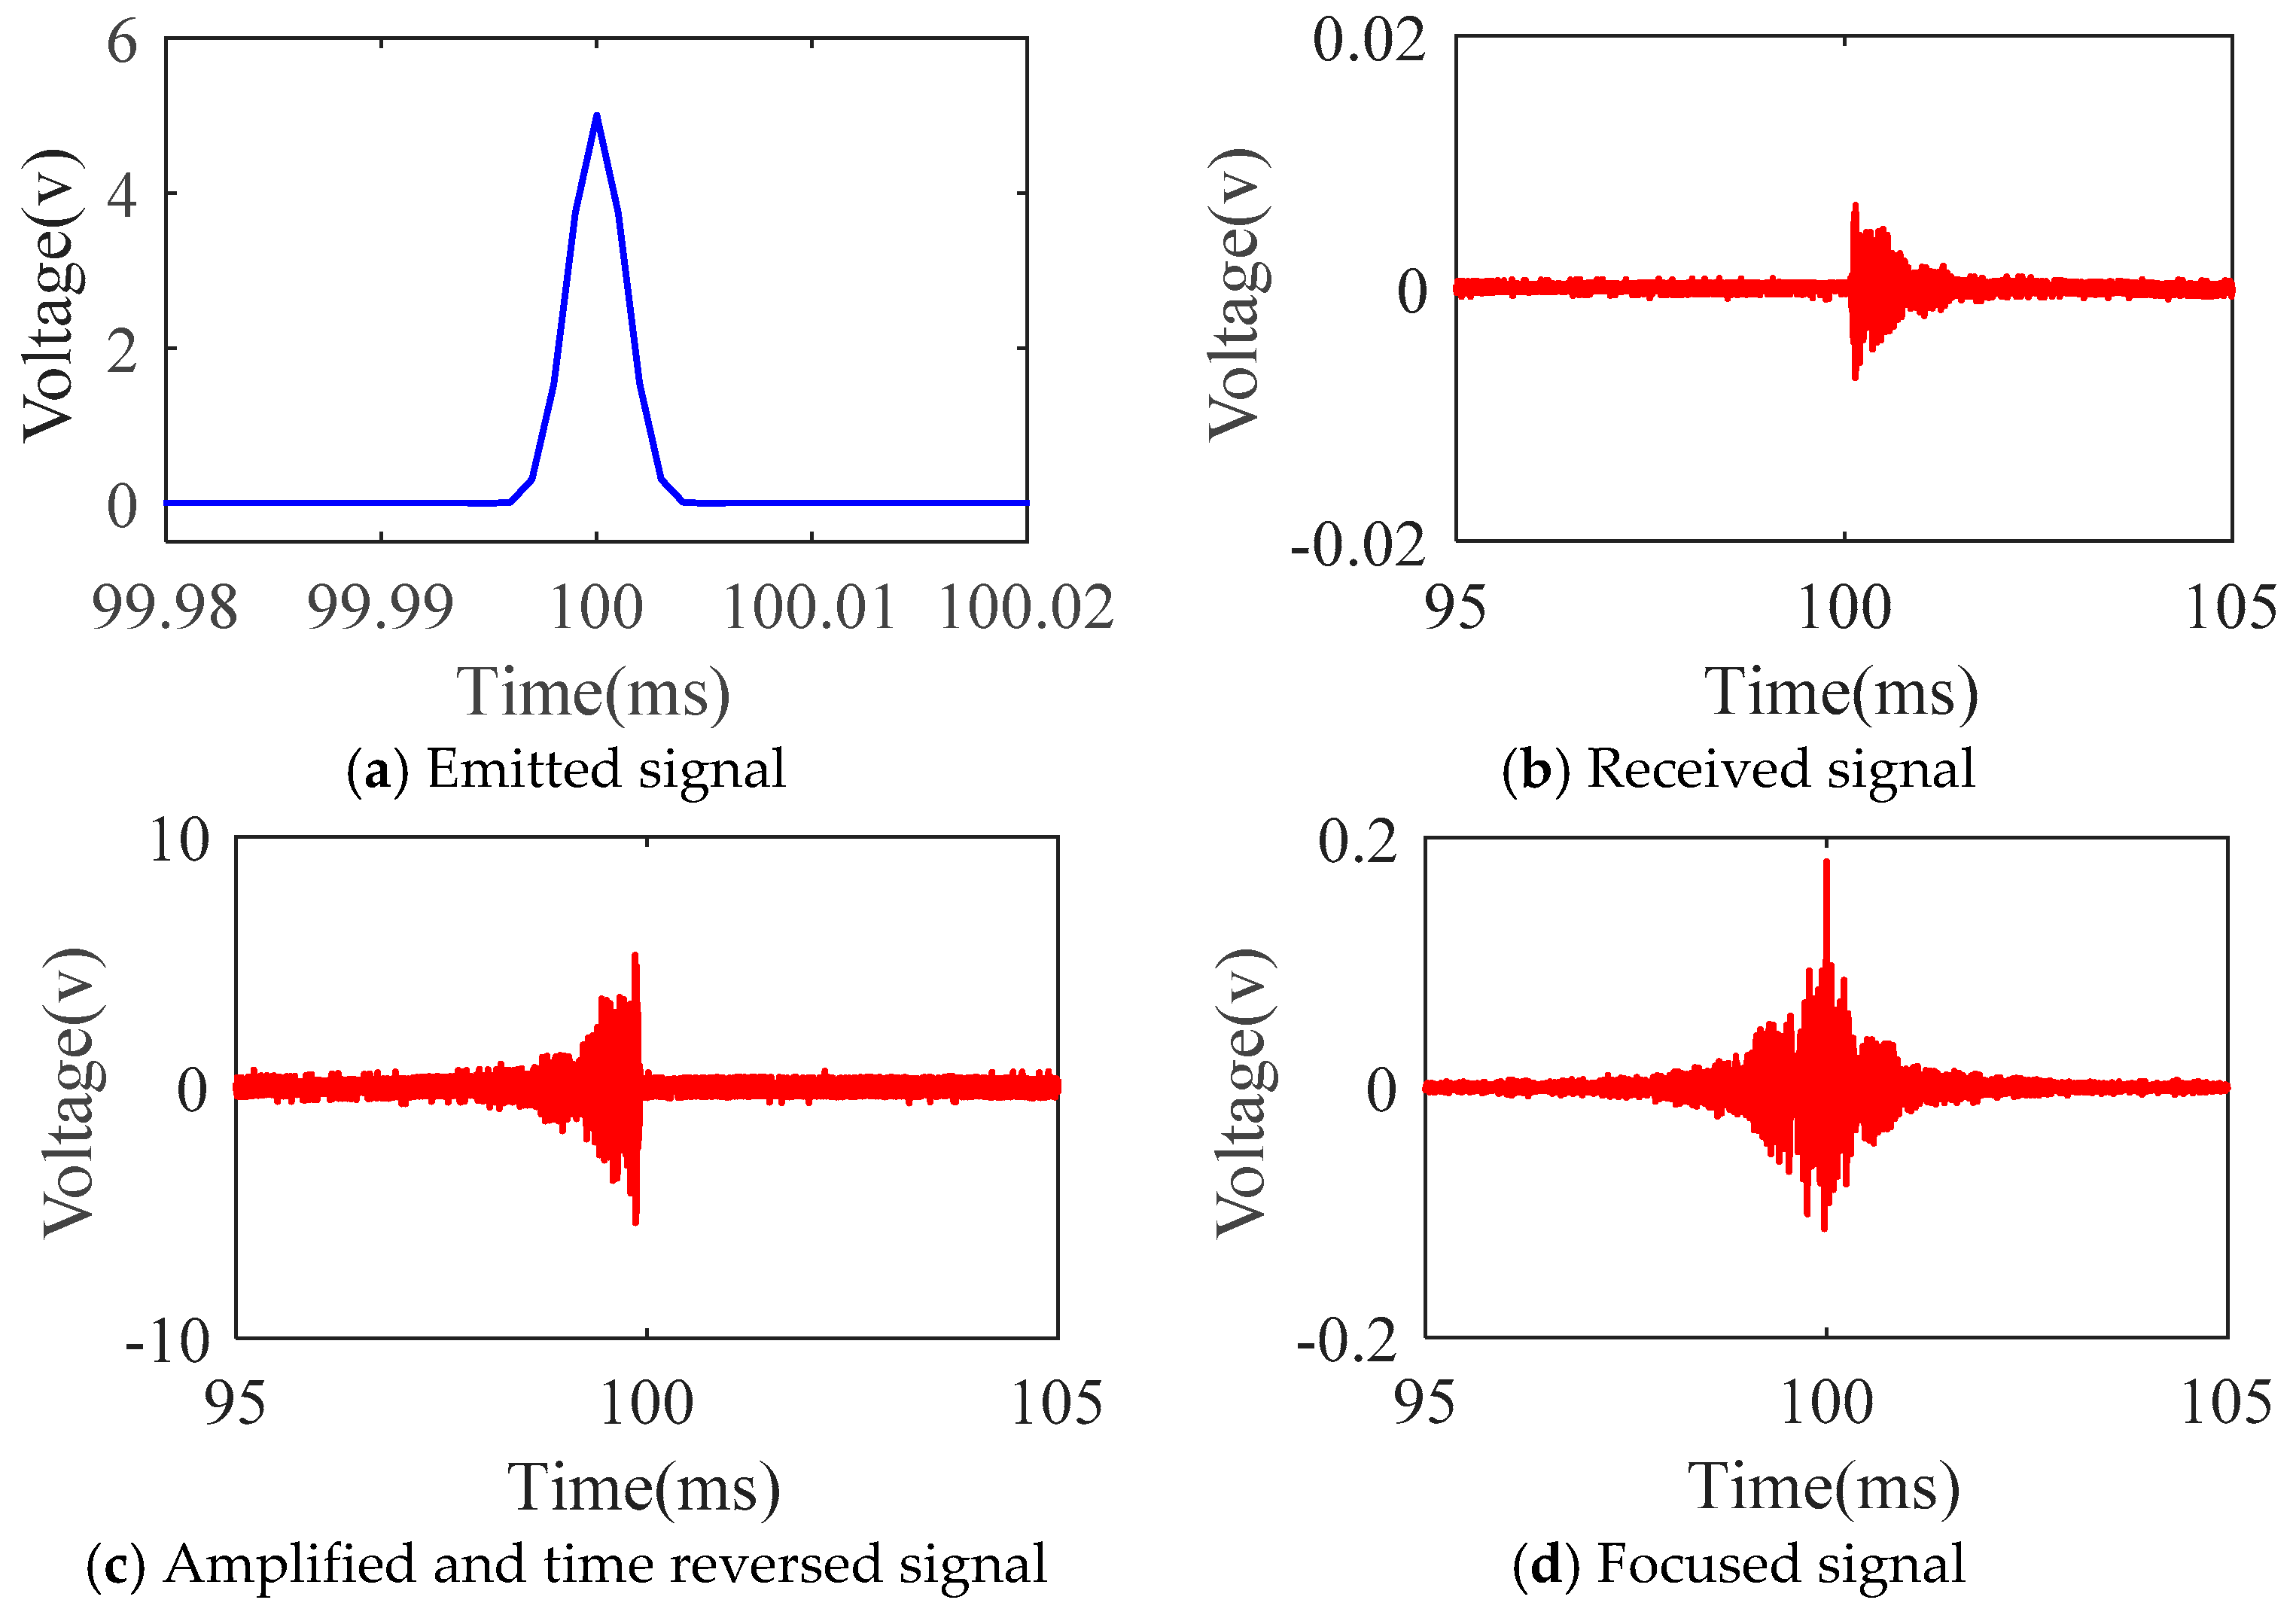
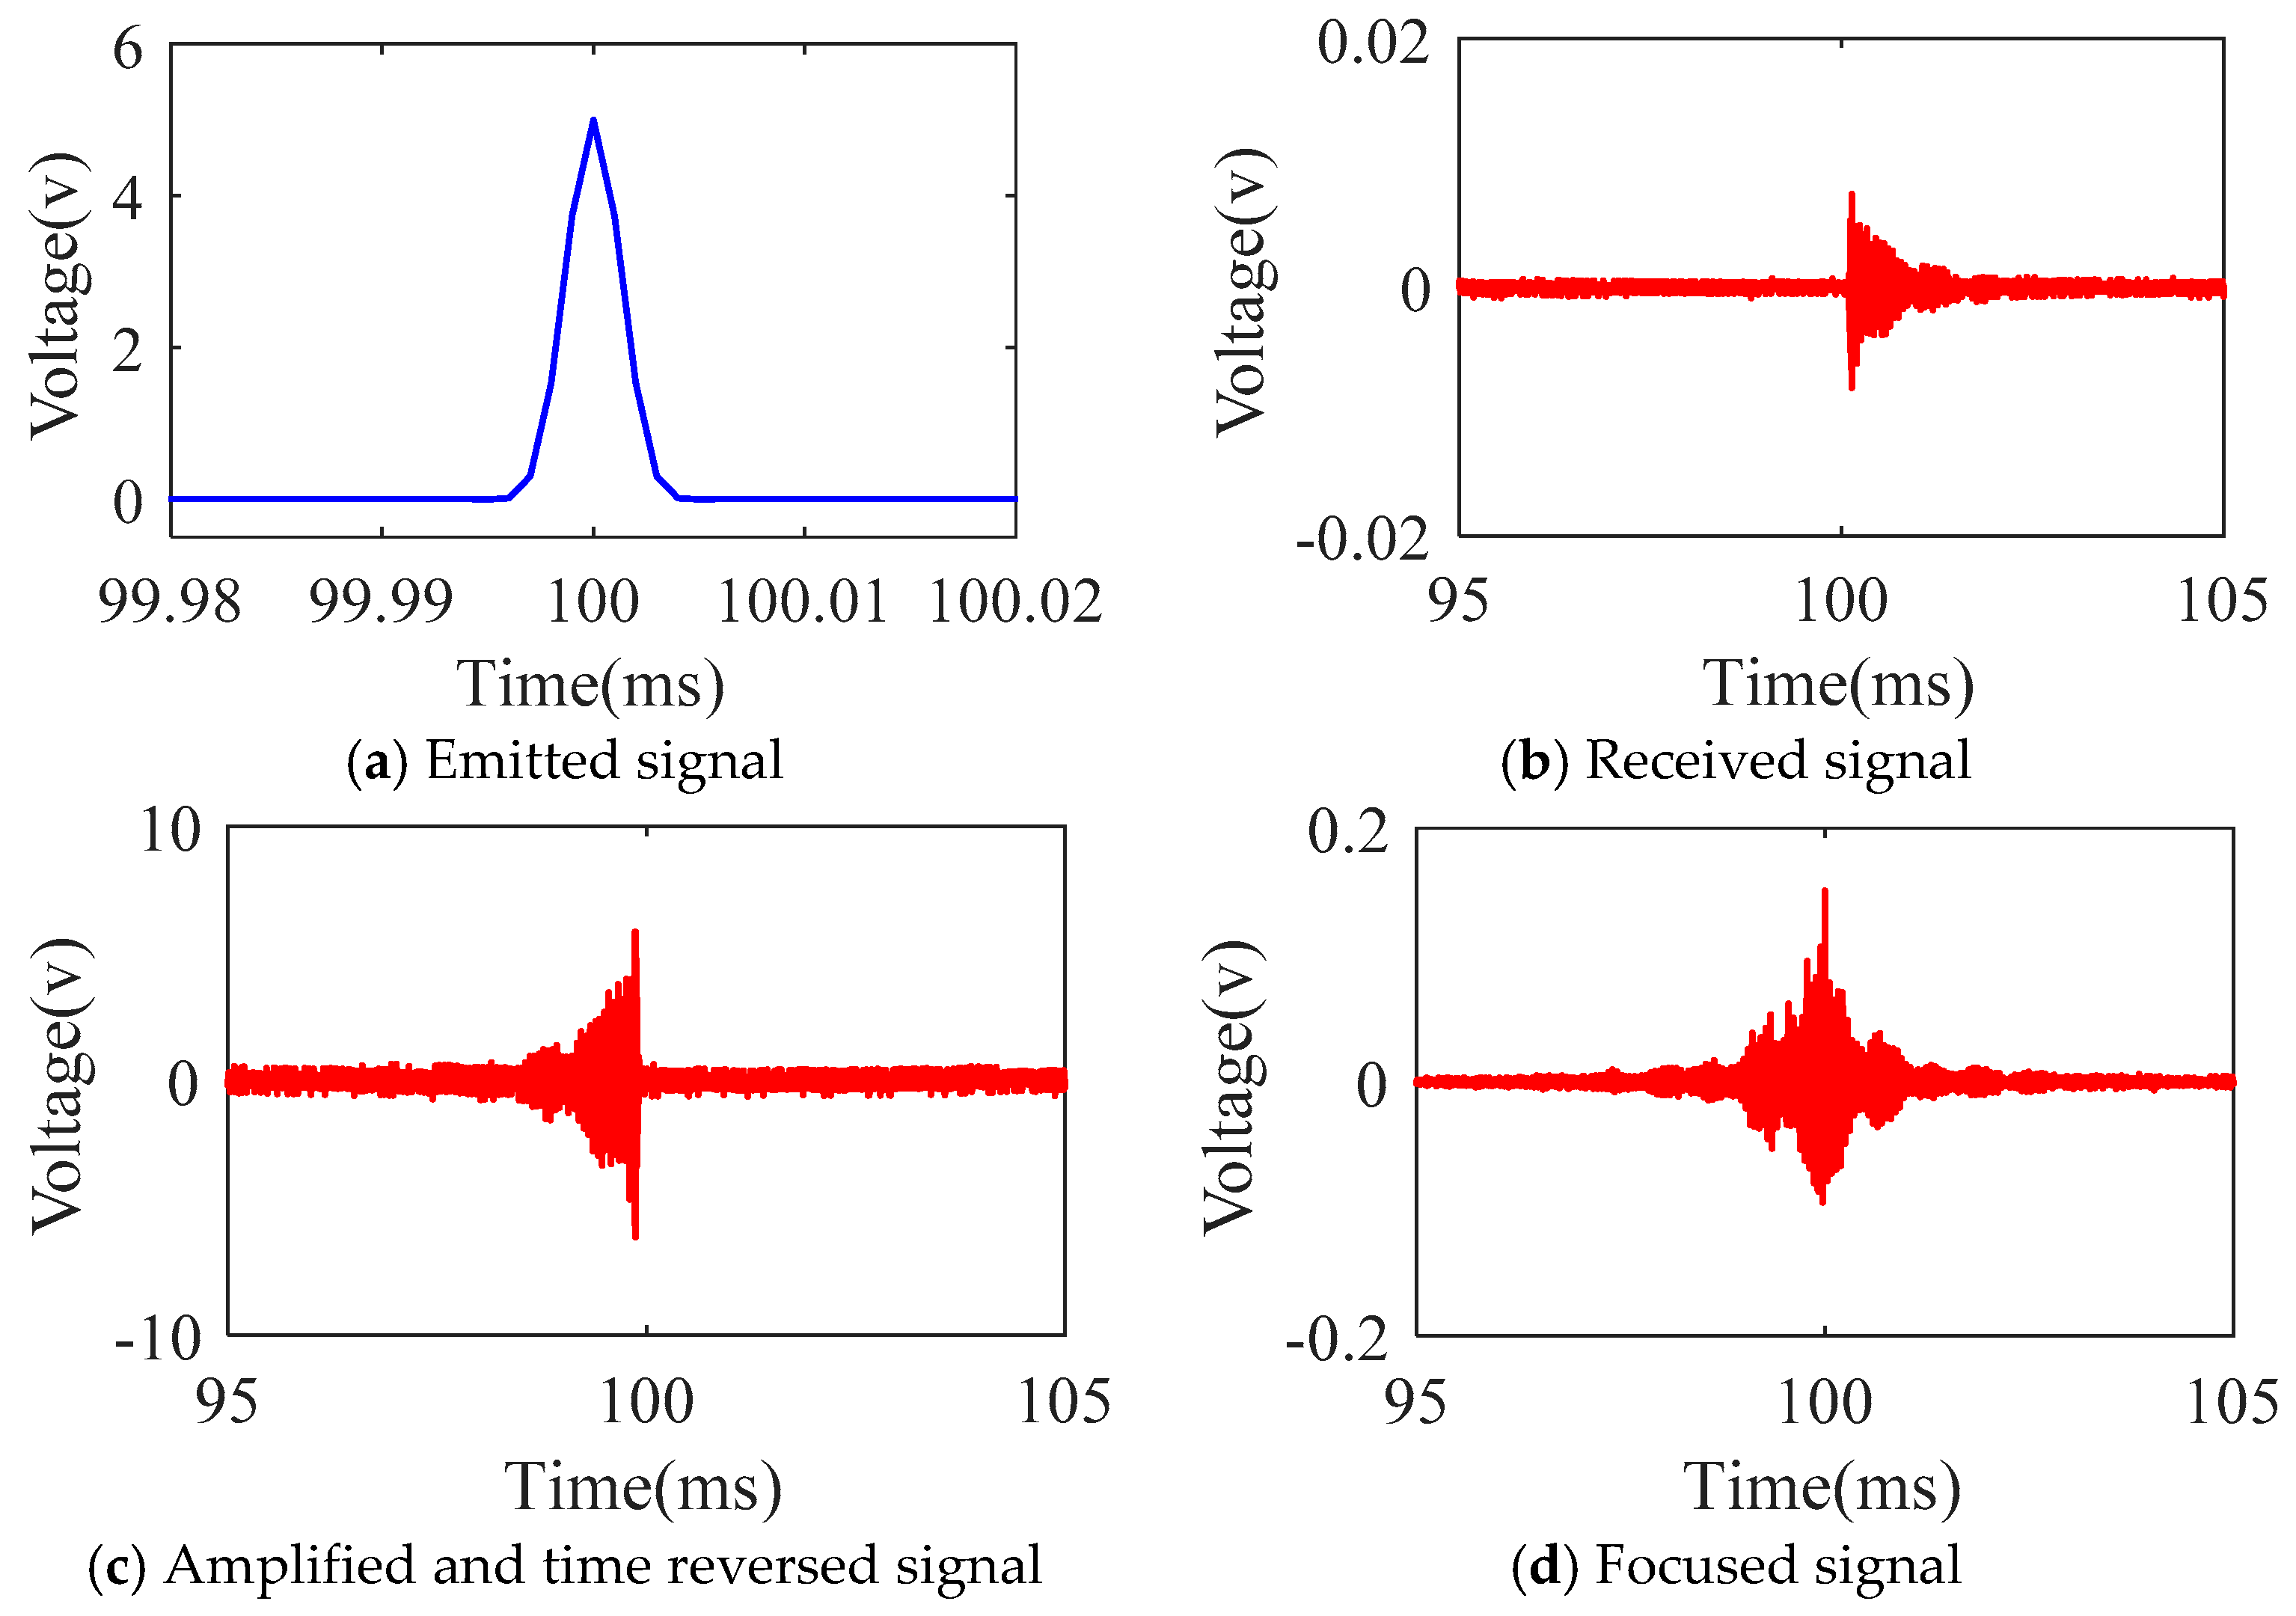
First, in Figure 3a, PZT1 emits a Gauss signal, then, PZT2 records the propagated signal, which shown in Figure 3b. Second, we reversed the recorded signal in the time domain. After being amplified by the power amplifier, the reversed signal was re-emitted to PZT1. Figure 3c shows the reversed signal. Figure 3d is the focused signal generated by PZT1. When the corrosion becomes more severe, more masses will be lost and the surface of the steel bar will be full of corrosion pits, which will negatively impact the stress wave propagation and reduce the peak of the focused signal. As a result, the corrosion status of the steel bar was monitored by observing the peak value of the focus signal through the time reversal process.
2.3. The Accelerated Steel Bar Corrosion Experiment
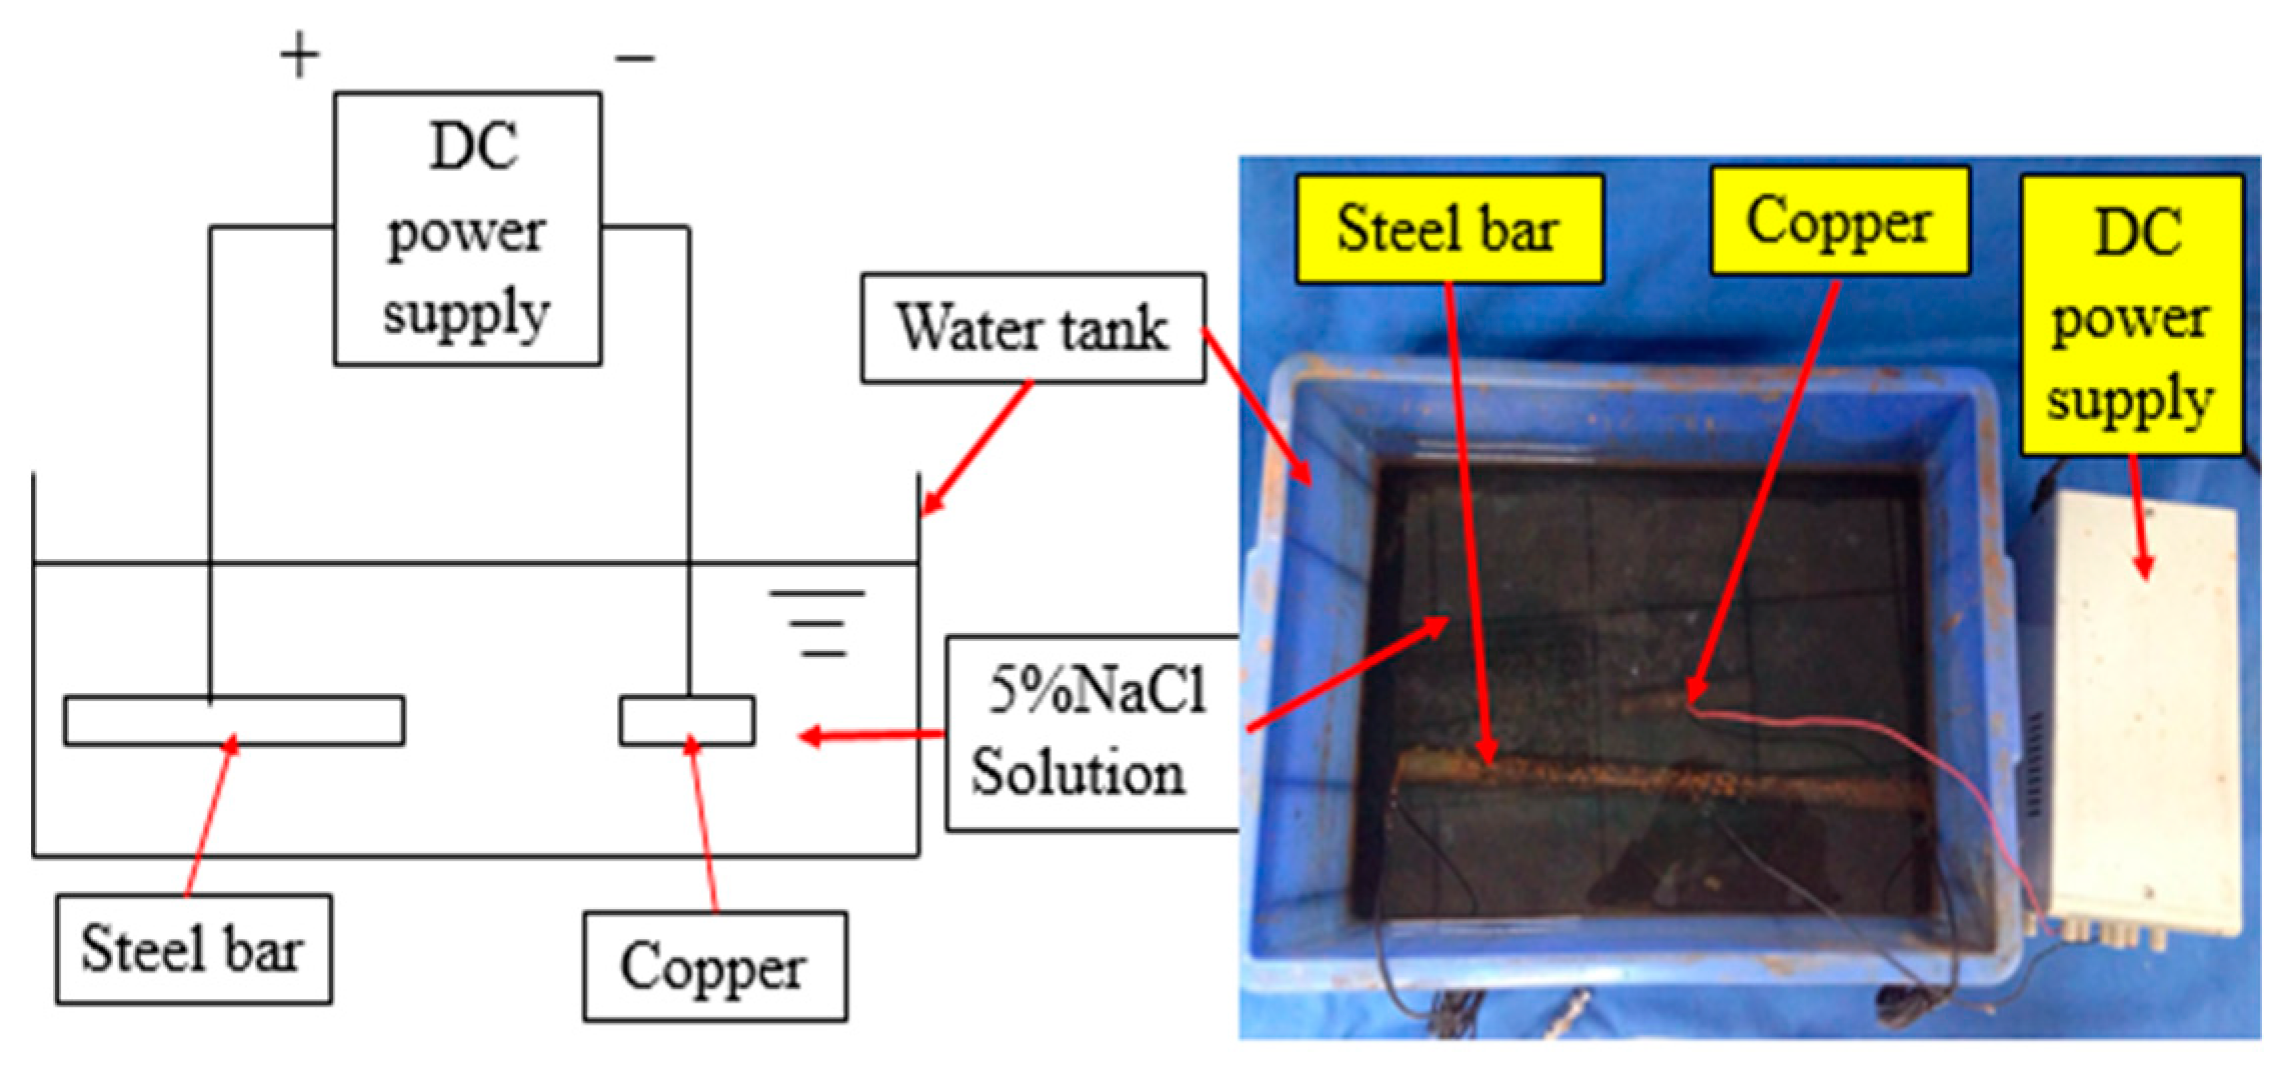
The impressed current technique, also known as the galvanostatic method, was widely used to accelerate the corrosion of the steel bar in the concrete durability tests [72]. The steel bar was connected to the positive electrode of a DC power supply source as the anode, which acted as a reducing agent, and was oxidized under the effect of the electric current and the loss of the ions. The copper rod connected to the negative electrode acted as the cathode, and the combined with generated hydroxyl ions when a reduction reaction occurred in the oxidant. The ions combined with the ions and generated when there were relatively increased oxygen contents in the electrolyte. Conversely, could be oxidized completely when there was a lack of oxygen in the electrolyte, which was changed to black rust as [73]. The chemical process of the steel bar corrosion is shown in Figure 4.
3. Experimental Setup
3.1. Corrosion Resistance of the Resin-Protected Piezoceramic Transducers
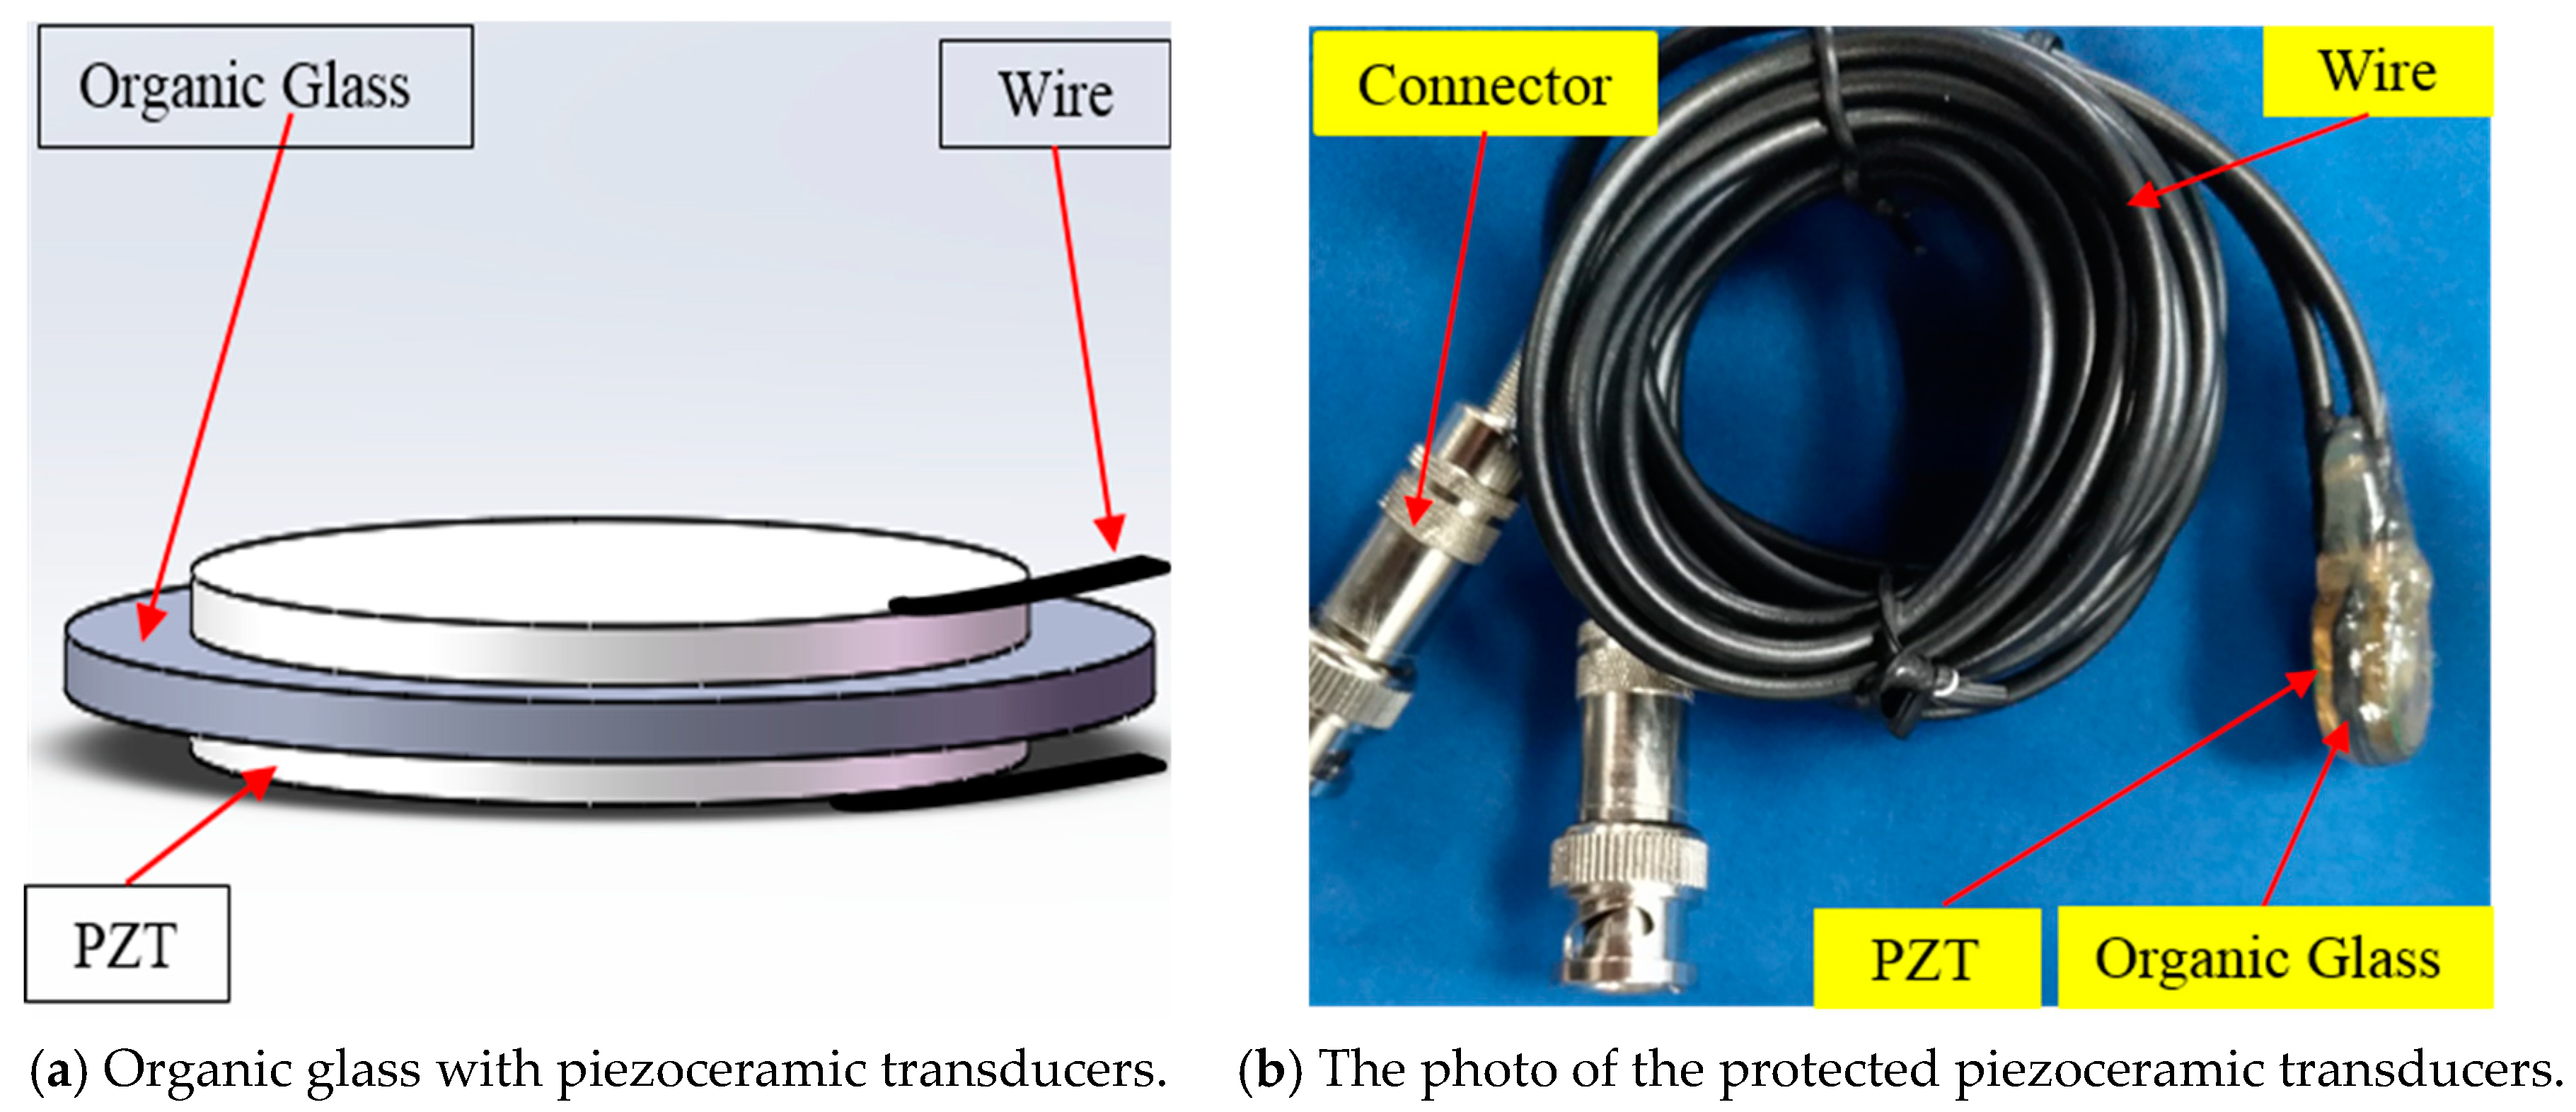
In the steel bar corrosion detection experiments, the piezoceramic transducers and the steel bar were simultaneously immersed in the sodium chloride solution. To ensure that the piezoceramic transducers worked properly without corrosion, it was necessary to experimentally study the property of the piezoceramic transducers in the solution. For this experimental study, two pieces of piezoceramic transducers were bonded on both sides of a piece of organic glass disk by using an ultrasonic vibrator adhesive, as shown in Figure 5a. Then, an epoxy resin was used to wrap them completely, in order to protect the piezoceramic transducers and the connection wires, as shown in Figure 5b.
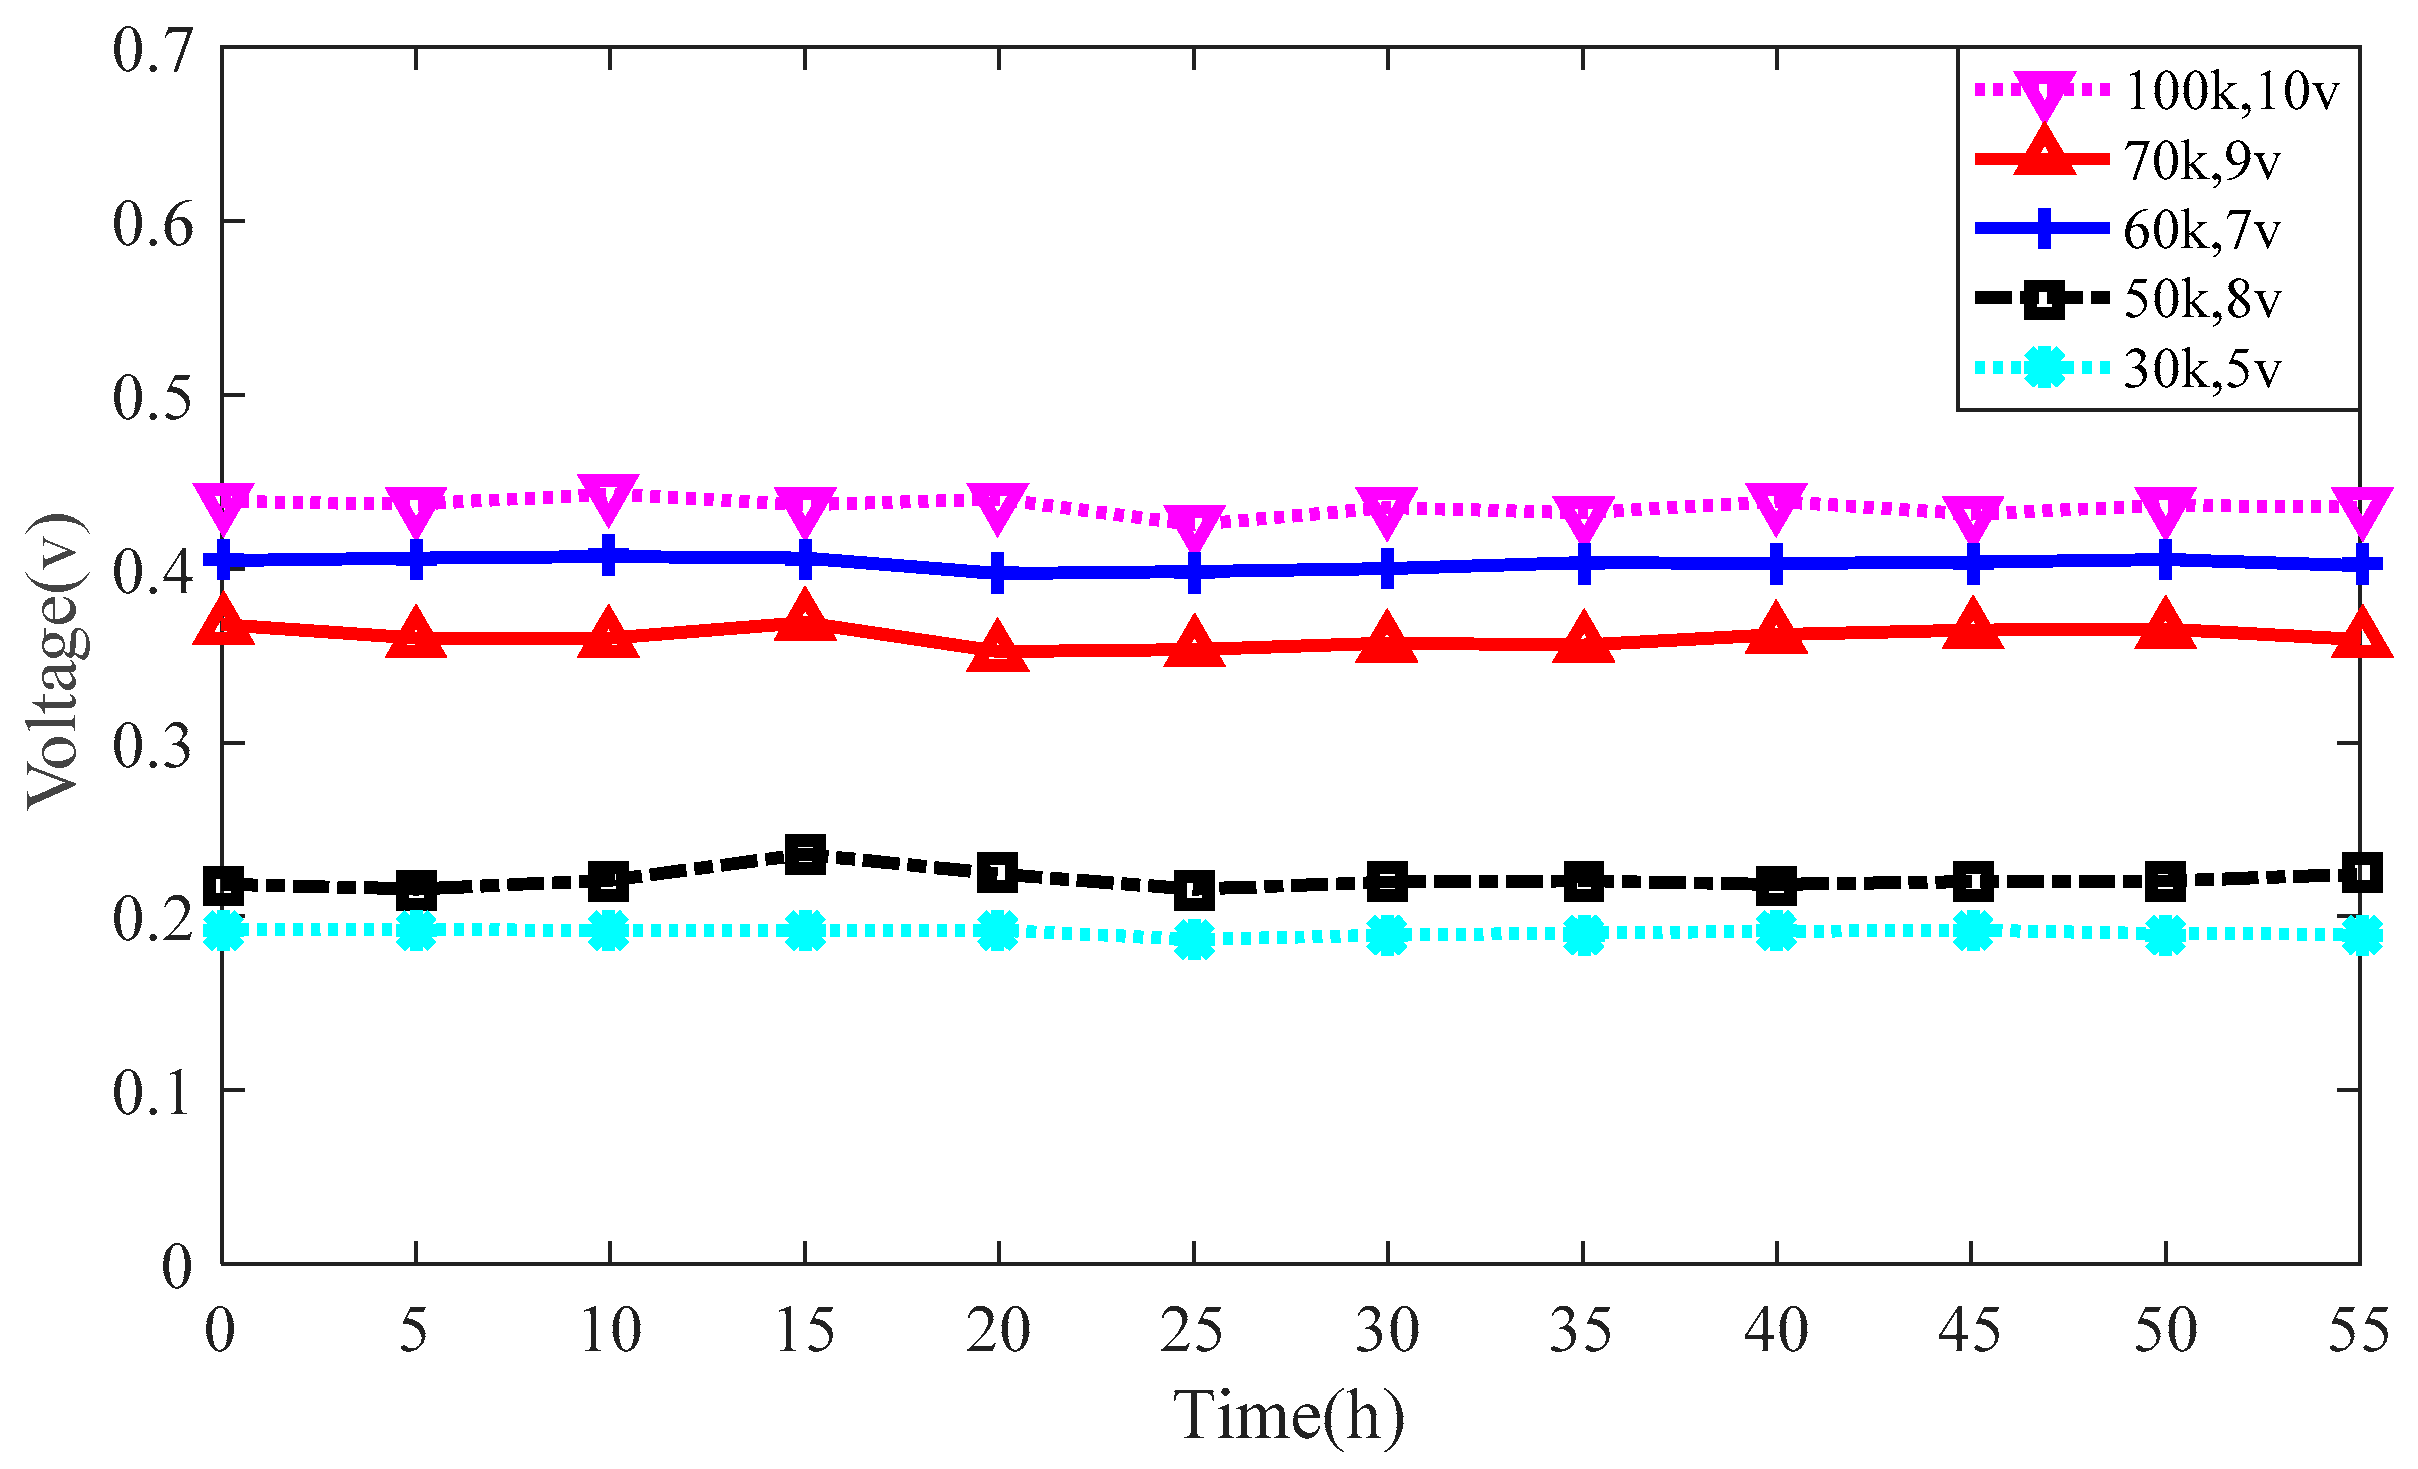
The piezoceramic transducers were immersed into a container filled with a solution of 20% NaCl. A Labview program was used to emit Gaussian pulse signals, whose frequencies were set as 100 KHz, 70 KHz, 60 KHz, 50 KHz, and 30 KHz, and the corresponding amplitudes were 10 V, 9 V, 7 V, 8 V, and 5 V, respectively. The focused signals were recorded after 55 h using the Labview program.
Figure 6 shows the relationship between the focused signals and the corrosion time. Obviously, the amplitude of the voltage did not produce any obvious changes in the signal, and the transducer was stable in the NaCl solution. Therefore, the piezoceramic transducers that were protected with epoxy resin were not affected by corrosion in the NaCl solution, and remained working properly.
3.2. Detection of Corrosion in Steel Bars
In a concrete structure, natural corrosion is a time-consuming process. The corrosion electric current has significant effect on the corrosion speed of the steel bar. Thus, in this study, the impressed current was used to shorten the corrosion time and to obtain the corroded specimens quickly. The experimental instruments included a real-time data acquisition system (NI-USB 6363), PC, specimens, piezoceramic disk transducers, and support foam. With the consideration of the properties’ difference of the steel bars, four Q235 steel specimens with a different date of production were used to verify the consistency of the experimental results. The diameter and length of the steel bars were 20 mm and 400 mm, respectively. The piezoceramic disk transducers were bonded to the ends of the steel bar, one of which was used as a signal receiver, and the other one was used as a signal generator. Then, both of the ends of the steel bar and the wires were wrapped with epoxy resin. In addition, the impressed current technique was used for accelerated corrosion under a constant current of 2 A. The experimental apparatus is shown in Figure 7.
The steel bar and a copper rod were immersed in a tank filled with a water solution containing 5% NaCl. The steel bar was connected to the positive electrode of a DC power supply source as the anode, and the copper rod was connected to the negative electrode, and it acted as the cathode, which formed the accelerated corrosion system. Figure 8 shows the accelerated corrosion setup.
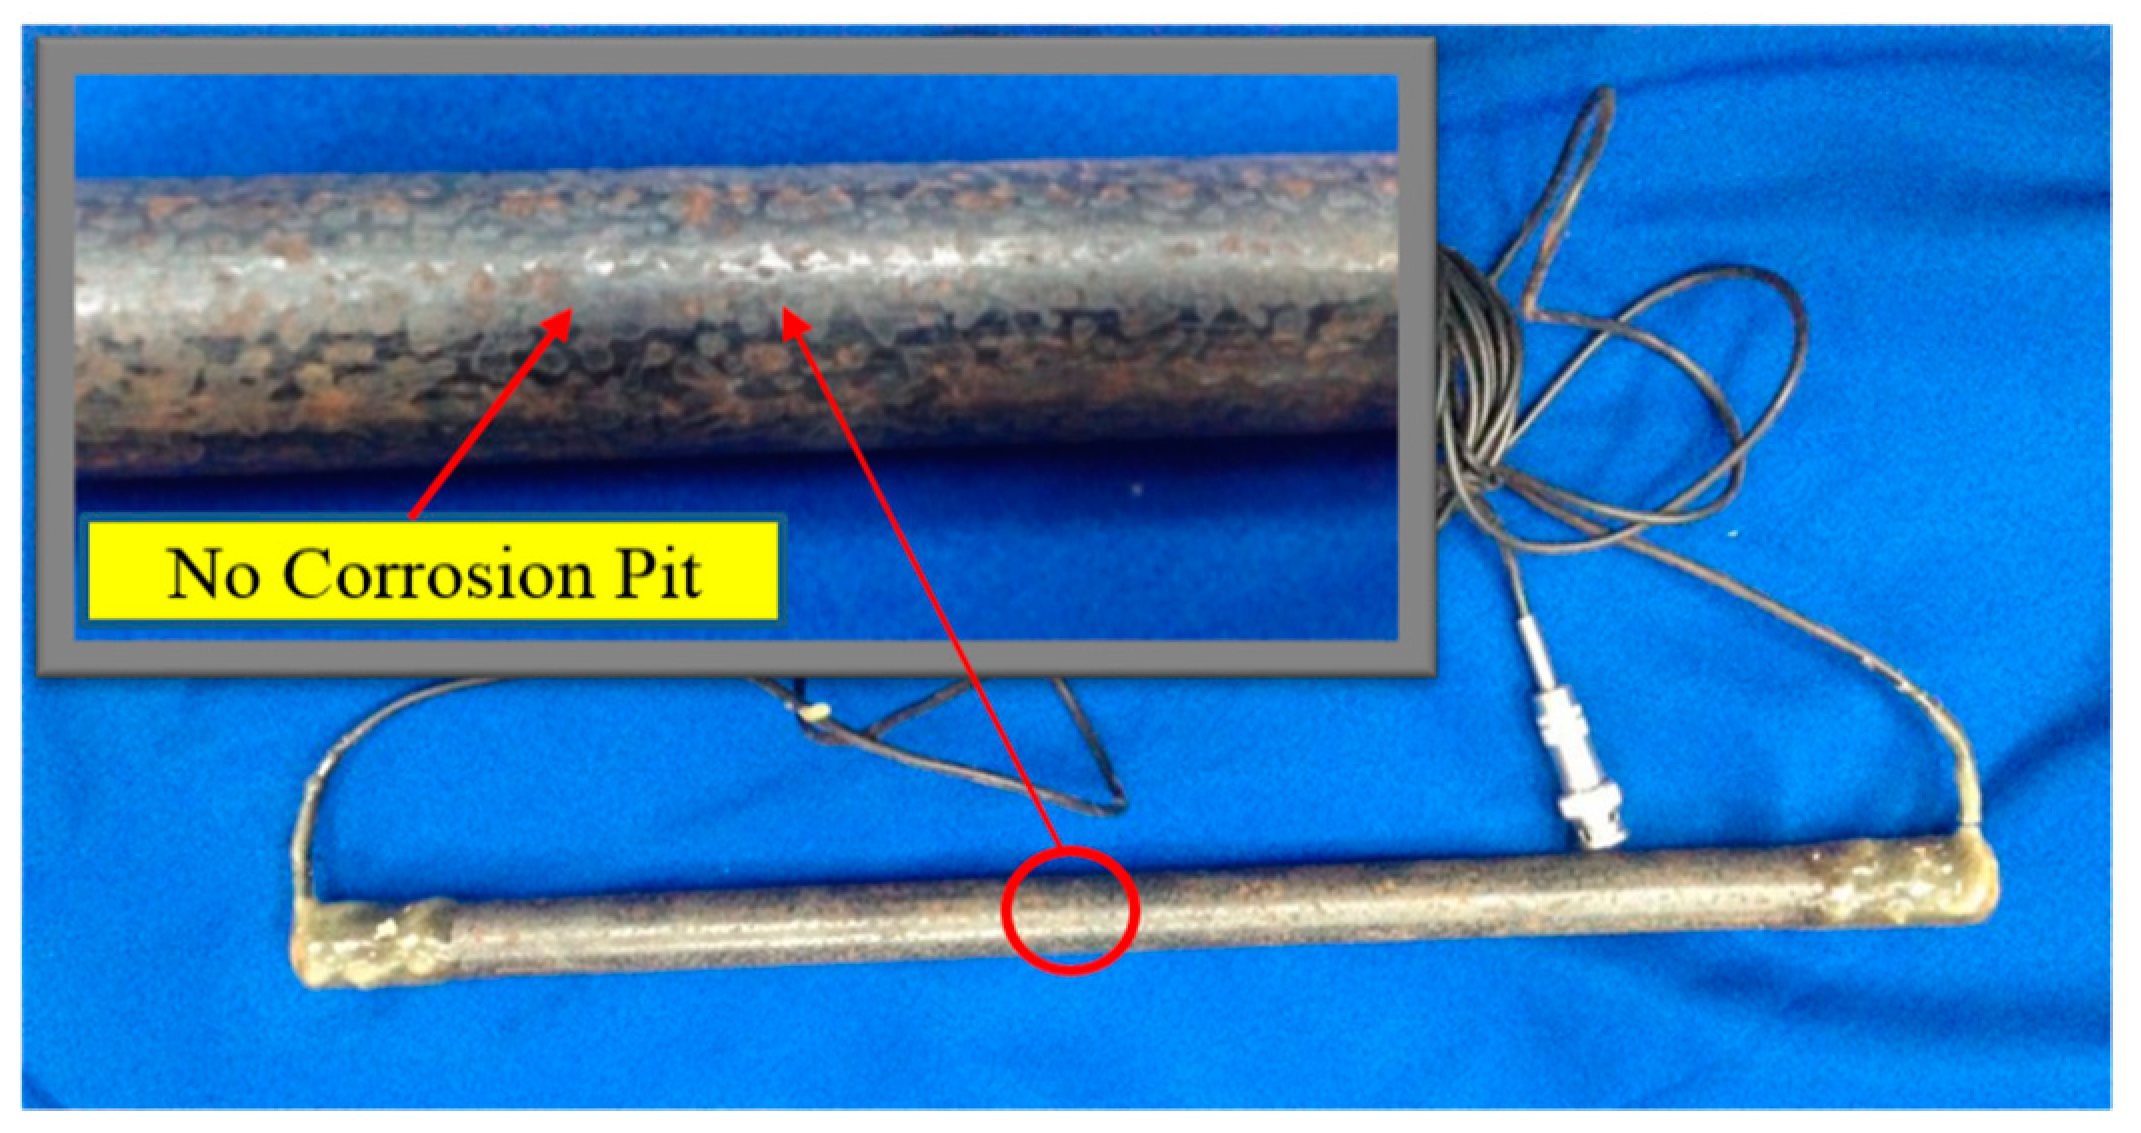
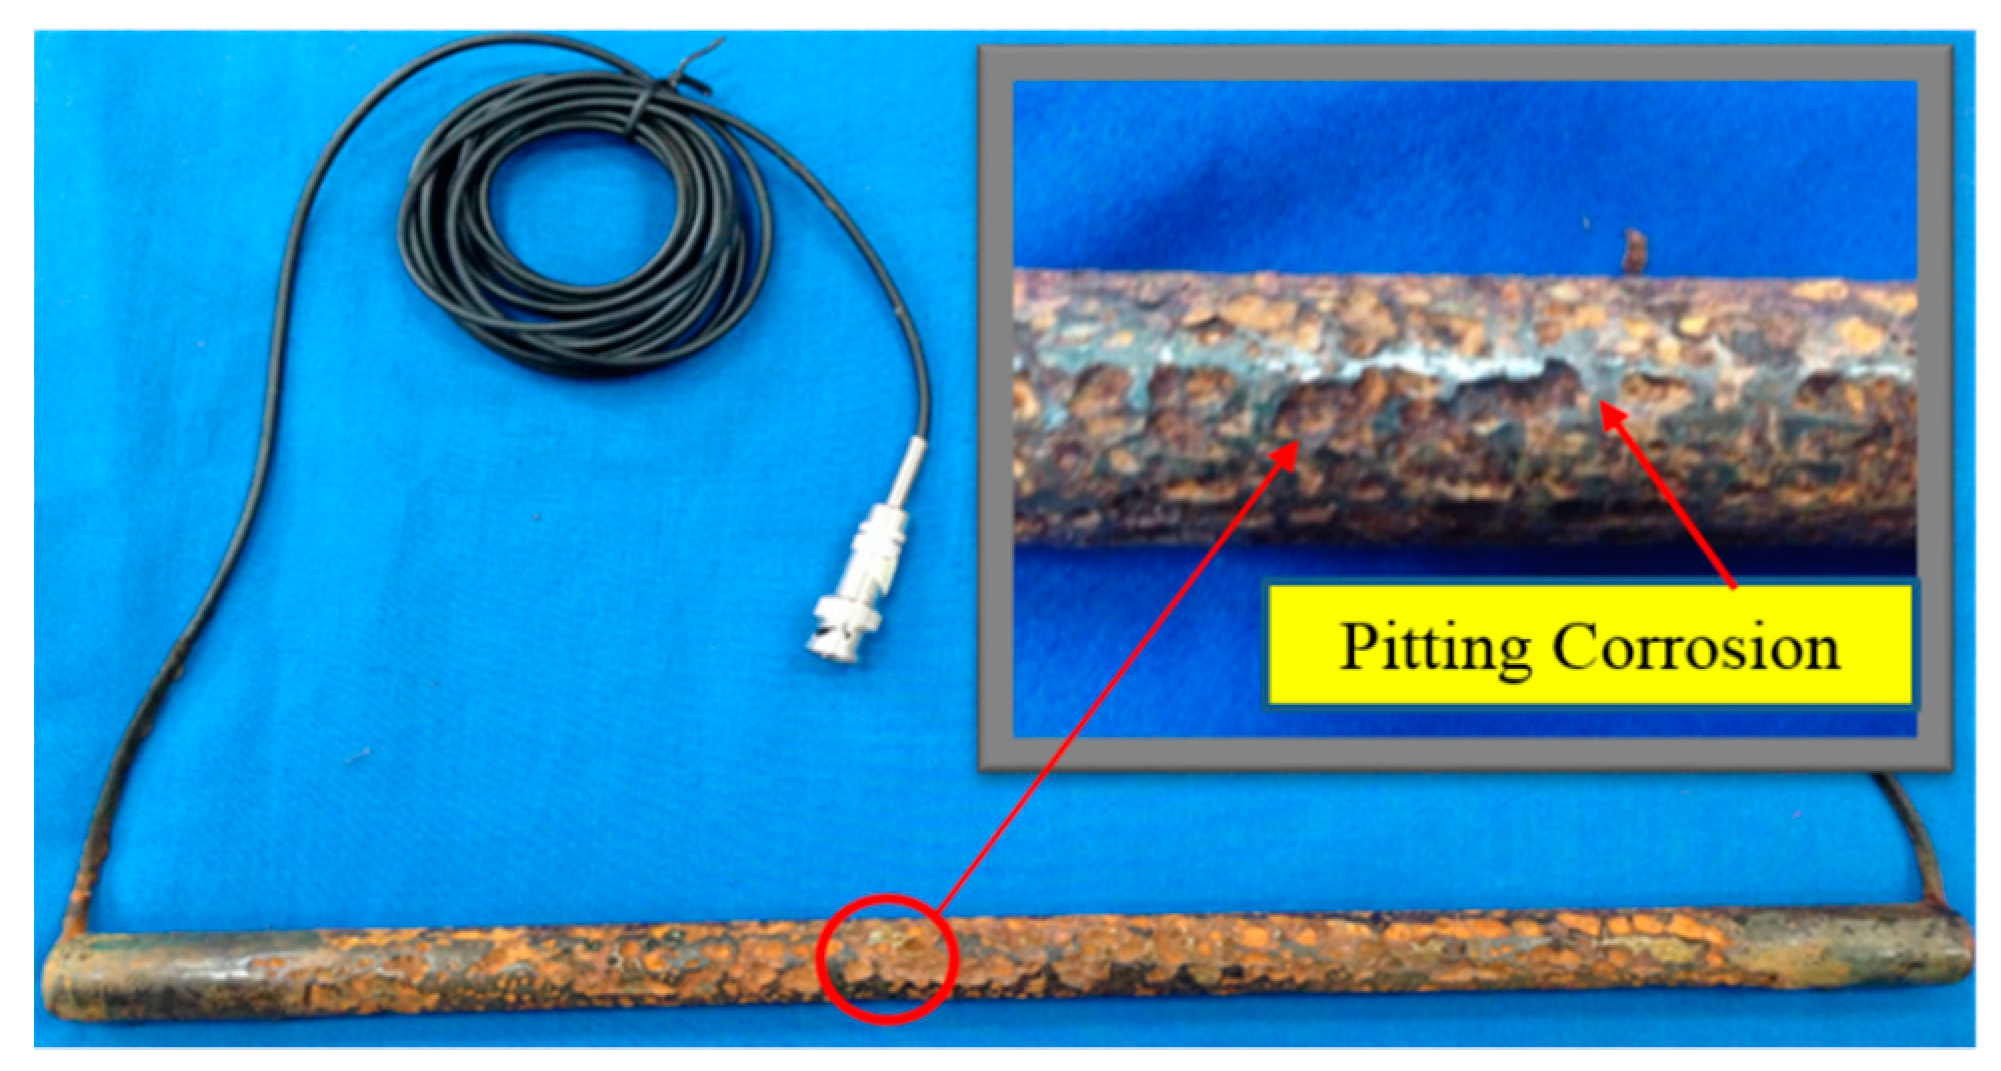
An NaCl solution has been chosen in this study, which is based on the large amount of NaCl in seawater, and because the long-span bridge structure is vulnerable to seawater erosion. Piezoceramic transducers were bonded on the surface of the two ends of the steel bar, and a multimeter was used to detect whether the piezoceramic transducers were properly insulated. First, the Labview data acquisition system was used to carry out a frequency sweep so as to acquire the resonance frequencies of the steel bars and to record the waveform data. The obtained data showed that the amplitude of the received signal had a better response at frequencies ranging between 25 KHz to 100 KHz. The Gaussian pulse signals, whose frequencies were set as 70 KHz, 60 KHz, and 50 KHz, respectively, and with an amplitude of 5 V for all of the frequencies, were generated using a Labview program hosted by a PC. The pulse signals were recorded every 5 h using a Labview program, and the quality of the steel bar during the accelerated corrosion process was measured using the current control technique. Figure 9 and Figure 10 show the steel bar without corrosion and the same bar with corrosion after 35 h, respectively.
Figure 11 and Figure 12 show the amplitudes of the focused signal after 15 h and 35 h, respectively. During the test, the received time domain signal was reversed using the TR method, and the gain coefficient of the Labview data acquisition program was adjusted to improve the amplitude of the reversed signal. Then, the corresponding focused signal was obtained using the TR method. The non-uniform distributed points or pits on the surface of the steel bar increased with the increase of the corrosion degree, which meant that the wave propagation path was more complicated owing to the rusting of the steel bar surface. The transmission signal oscillated repeatedly in the propagation path and led to an increased dissipation of the wave energy within the steel bar. As a result, the magnitudes of the focused signals were decreased. As shown in Figure 11d and Figure 12d, the peak values of the focused signals show a significant decline at the two different time periods.
After 50 h, the corresponding signals for the different degrees of corrosion were obtained. To analyze the influences of the corrosion degrees on the amplitudes of the focused signal received by the piezoceramic transducers, the peak values of the focused signals for the four specimens are listed in Table 1, Table 2, Table 3 and Table 4, respectively. Each table includes three cases for the frequency of the emitted Gaussian pulse signal 50 KHz, 60 KHz, and 70 KHz. It can be seen from the tables that with the decrease of the magnitude of the focused signal, the mass loss ratio of the steel bar is increased, which means that the steel bar was corroded more seriously.
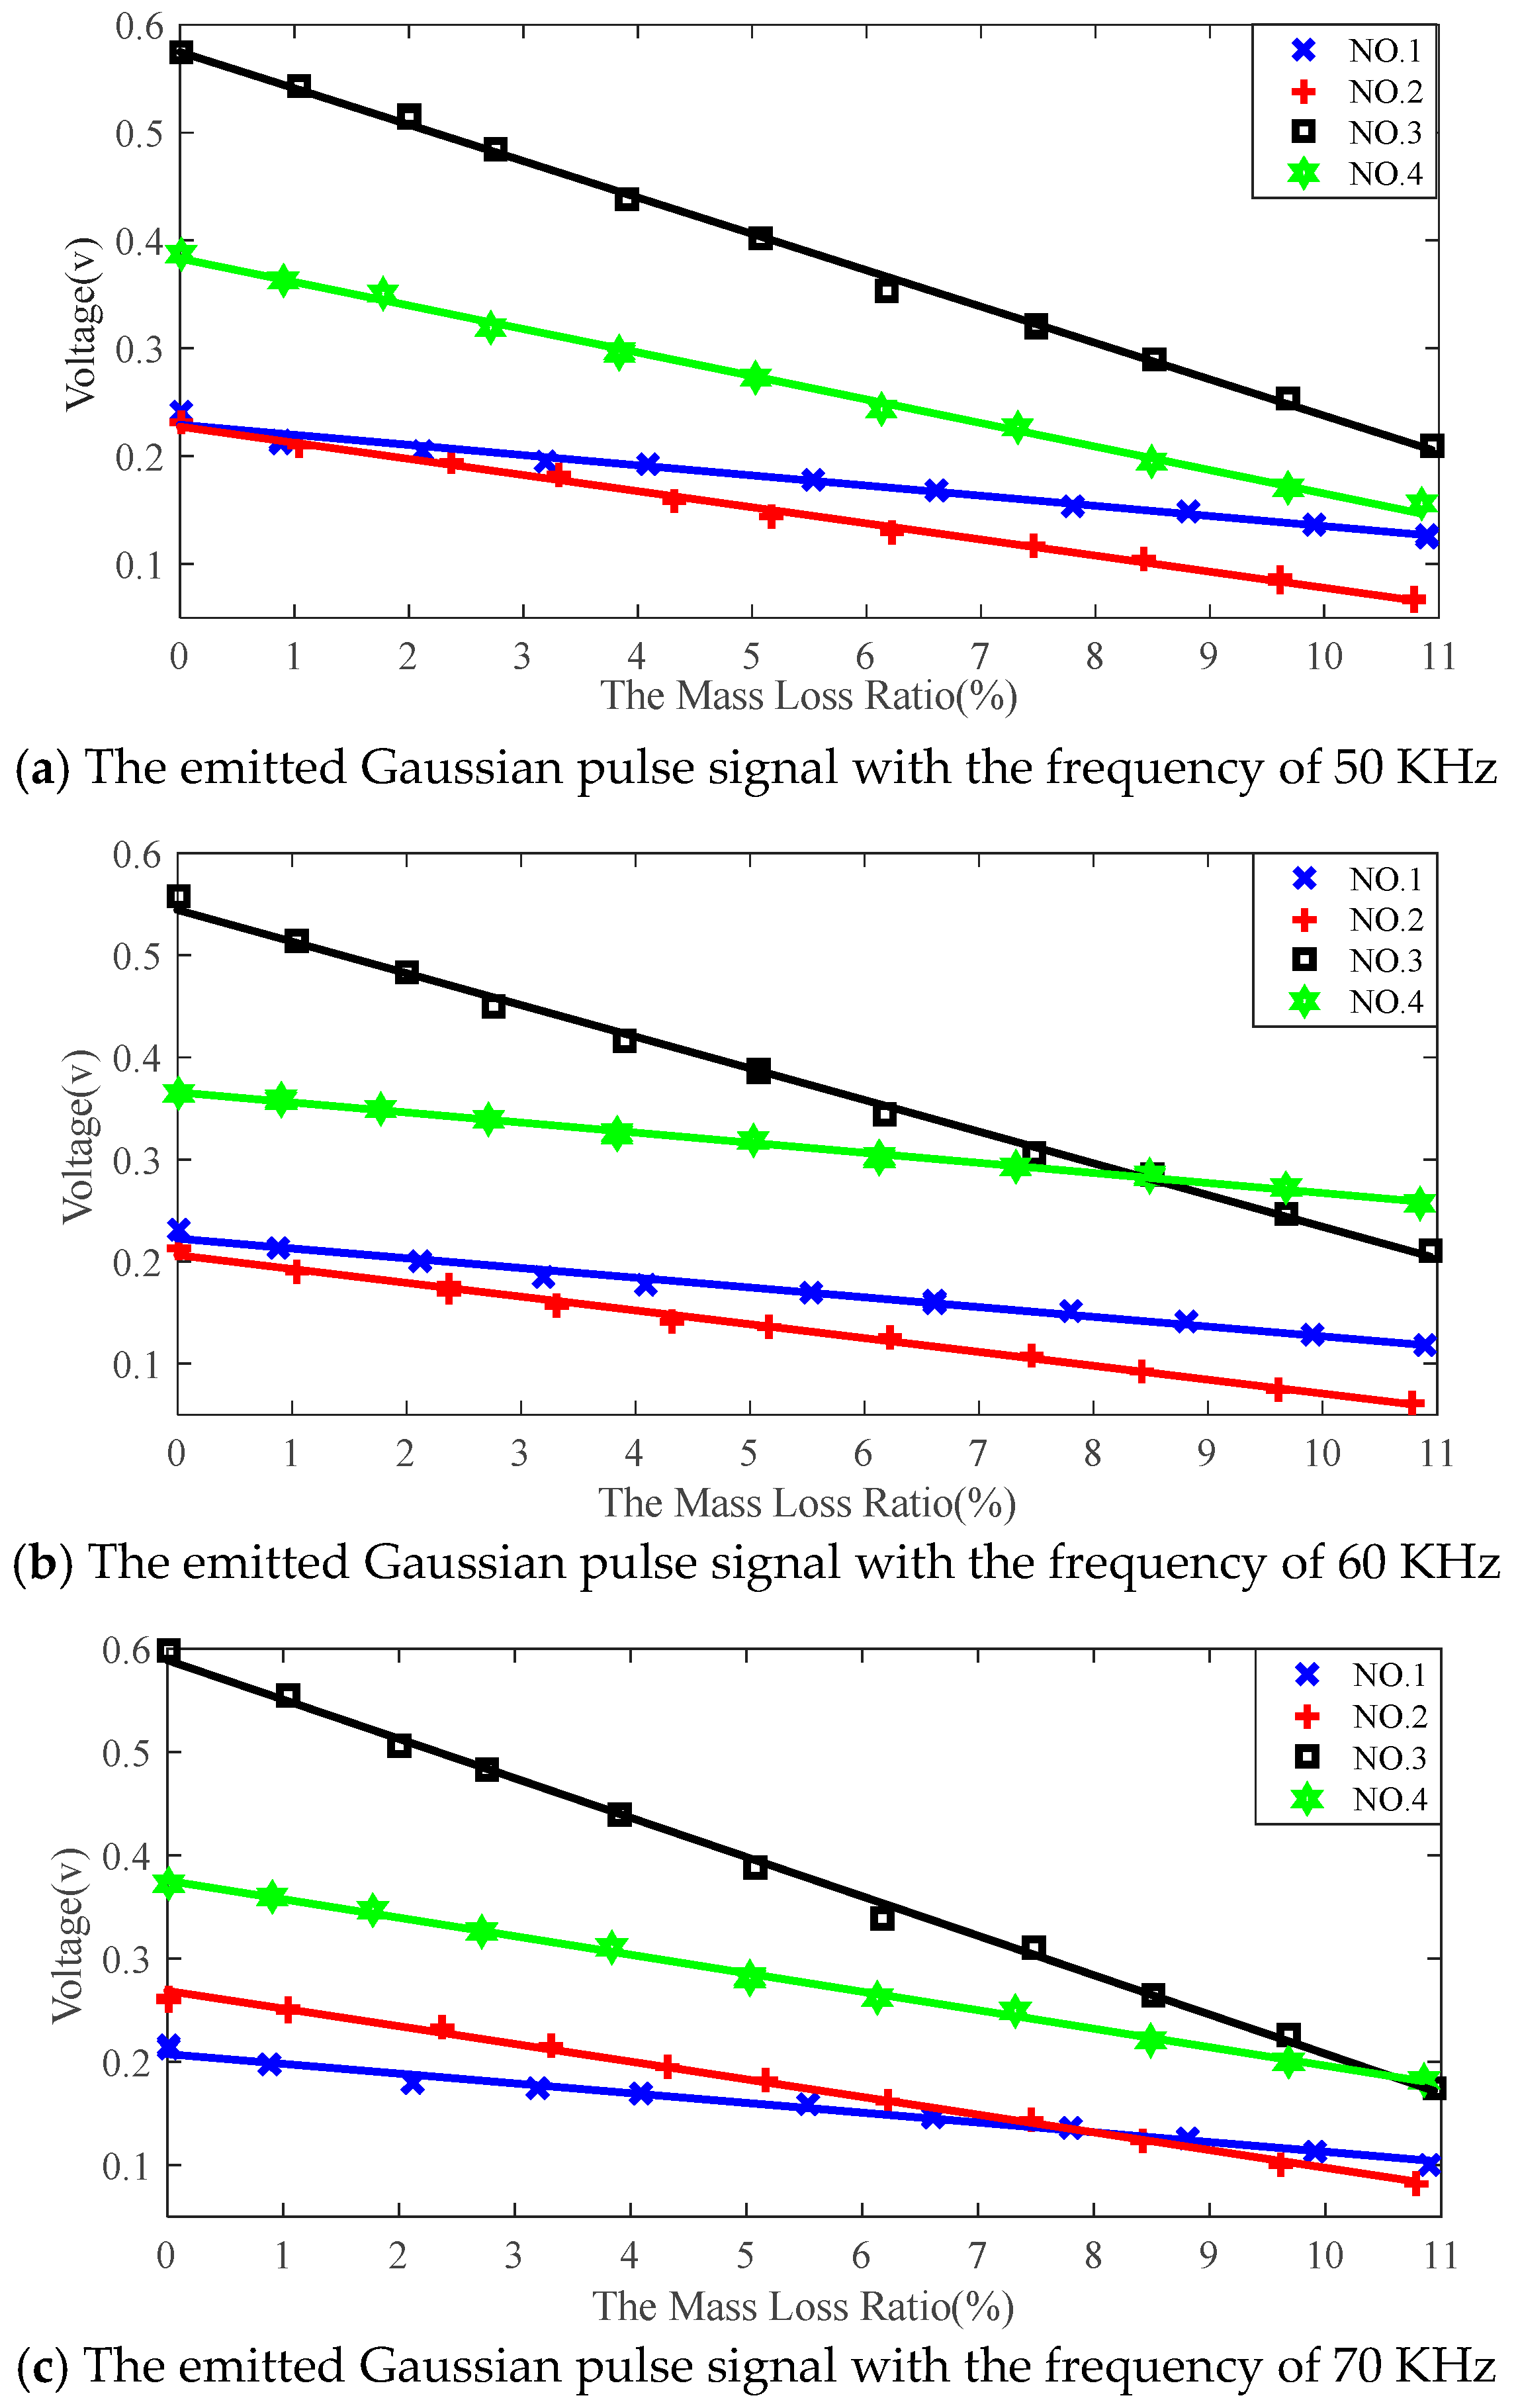
The relationship between the mass loss ratio of the steel bar and the peak values of the focused signal were established, as shown in Figure 13a–c. Four different straight lines with cross, plus, square, and star signs (in Figure 13) express the experimental results of different steel bars (specimens no. 1, 2, 3, and 4, respectively).
The peak values of the focused signal in Figure 13 are decreased with the increase of the mass loss ratio for different steel bars. Because of the interference resulting from some inevitable human and external conditions, such as the process of pasting piezoceramic transducers at both the ends of the steel bar and the different thicknesses of the epoxy resin at both the ends, different specimens will obtain different signal amplitudes under an identical impressed current and emitted signal. In addition, it can be concluded that the peak values of the focused signal are linearly related to the severity of the corrosion of the steel bar.
4. Conclusions and Future Work
This study proposed a corrosion detection method of steel bars based on piezoceramic transducer enabled time reversal in a controlled laboratory environment. The durability of the piezoceramic transducers was tested using accelerated corrosion experiments, and the results showed that the protected piezoceramic transducers have a good ability for resisting corrosion. In the testing, two piezoceramic transducers were bonded to the two ends of a steel bar, one of which was used as a sensor, and the other was used as an actuator. The experimental results showed that the signal recorded by the piezoceramic transducers changed linearly with the mass loss ratio of the reinforcement bar, which demonstrates the feasibility of the proposed method. Although the proposed method is feasible for detecting corrosion in steel bars, further studies on how to acquire the degree of corrosion and their locations in the segment between two transducers are needed. Furthermore, future work will focus on the corrosion monitoring of different forms of steel bars and structures.
Author Contributions
L.H. and H.-N.L. conceived the original ideas; C.L. and L.H. designed the experiments; C.L. conducted the experiments and analyzed the data under close advice from L.H. and H.-N.L.; C.L. and L.H. planned the outline of the paper; C.L. wrote the paper under guidance from L.H.; T.J. made critical revisions to the paper.
Funding
This research was funded by the Major State Basic Development Program of China (2015CB057704), the General Project of the Natural Science Foundation of China (51478080), the Fundamental Research Funds for the Central Universities of China (DUT16TD03), and General Project of Natural Science Foundation of Jiangsu Province of China (Grant Number BK20180098).
Conflicts of Interest
The authors declare no conflicts of interest.
References
- Park, R.; Paulay, T. Reinforced Concrete Structures; John Wiley & Sons: Hoboken, NJ, USA, 1975. [Google Scholar]
- Zheng, Y. Investigation of Ultimate Strength of Deck Slabs in Steel-Concrete Bridges. ACI Struct. J. 2010, 107, 82–91. [Google Scholar]
- Park, Y.; Kim, Y.H.; Lee, S.H. Long-Term Flexural Behaviors of GFRP Reinforced Concrete Beams Exposed to Accelerated Aging Exposure Conditions. Polymers 2014, 6, 1773–1793. [Google Scholar] [CrossRef] [Green Version]
- Zheng, Y.; Zhang, L.F.; Xia, L.P. Investigation of the behaviour of flexible and ductile ECC link slab reinforced with FRP. Constr. Build. Mater. 2018, 166, 694–711. [Google Scholar] [CrossRef]
- Mccague, C.; Fabian, M.; Karimi, M.; Bravo, M.; Jaroszewicz, L.R.; Mergo, P.; Sun, T.; Grattan, K.T.V. Novel Sensor Design Using Photonic Crystal Fibres for Monitoring the Onset of Corrosion in Reinforced Concrete Structures. J. Lightw. Sci. Technol. 2014, 32, 891–896. [Google Scholar] [CrossRef] [Green Version]
- Pantazopoulou, S.J.; Papoulia, K.D. Modeling Cover Cracking Due to Reinforcement Corrosion in RC Structures. J. Eng. Mech. 2001, 127, 342–351. [Google Scholar] [CrossRef]
- Figueira, R. Electrochemical Sensors for Monitoring the Corrosion Conditions of Reinforced Concrete Structures: A Review. Appl. Sci. 2017, 7, 1157. [Google Scholar] [CrossRef]
- Lynch, J.P. A Summary Review of Wireless Sensors and Sensor Networks for Structural Health Monitoring. Shock Vib. Dig. 2006, 38, 91–128. [Google Scholar] [CrossRef]
- Song, G.; Wang, C.; Wang, B. Structural Health Monitoring (SHM) of Civil Structures. Appl. Sci. 2017, 7, 789. [Google Scholar] [CrossRef]
- Qiao, G.; Sun, G.; Hong, Y.; Liu, T.; Guan, X. Corrosion in Reinforced Concrete Panels: Wireless Monitoring and Wavelet-Based Analysis. Sensors 2014, 14, 3395–3407. [Google Scholar] [CrossRef] [PubMed] [Green Version]
- Legat, A. Monitoring of steel corrosion in concrete by electrode arrays and electrical resistance probes. Electrochim. Acta 2007, 52, 7590–7598. [Google Scholar] [CrossRef]
- Liu, W.; Hunsperger, R.G.; Chajes, M.J.; Folliard, K.J.; Kunz, E. Corrosion Detection of Steel Cables using Time Domain Reflectometry. J. Mater. Civ. Eng. 2002, 14, 217–223. [Google Scholar] [CrossRef]
- Marinetti, S.; Vavilov, V. IR thermographic detection and characterization of hidden corrosion in metals: General analysis. Corros. Sci. 2010, 52, 865–872. [Google Scholar] [CrossRef]
- Leung, C.K.Y.; Tai, W.K.; Chen, L. A Novel Optical Fiber Sensor for Steel Corrosion in Concrete Structures. Sensors 2008, 8, 1960–1976. [Google Scholar] [CrossRef] [PubMed] [Green Version]
- Verma, S.K.; Bhadauria, S.S.; Akhtar, S. Review of Nondestructive Testing Methods for Condition Monitoring of Concrete Structures. J. Constr. Eng. (USA) 2013. [Google Scholar] [CrossRef]
- Dong, S.; Liao, Y.; Tian, Q. Intensity-based optical fiber sensor for monitoring corrosion of aluminum alloys. Appl. Opt. 2005, 44, 5773–5777. [Google Scholar] [CrossRef] [PubMed]
- Leelalerkiet, V.; Kyung, J.W.; Ohtsu, M.; Yokota, M. Analysis of half-cell potential measurement for corrosion of reinforced concrete. Constr. Build. Mater. 2004, 18, 155–1623. [Google Scholar] [CrossRef]
- Sathiyanarayanan, S.; Natarajan, P.; Saravanan, K.; Srinivasan, S.; Venkatachari, G. Corrosion monitoring of steel in concrete by galvanostatic pulse technique. Cem. Concr. Compos. 2006, 28, 630–637. [Google Scholar] [CrossRef]
- Vedalakshmi, R.; Dolli, H.; Palaniswamy, N. Embeddable corrosion rate-measuring sensor for assessing the corrosion risk of steel in concrete structures. Struct. Control Health Monit. 2010, 16, 441–459. [Google Scholar] [CrossRef]
- Duarte, R.G.; Castela, A.S.; Neves, R.; Freire, L.; Montemor, M.F. Corrosion Behavior of Stainless Steel Rebars Embedded in Concrete: An Electrochemical Impedance Spectroscopy Study. Electrochim. Acta 2014, 124, 218–224. [Google Scholar] [CrossRef]
- Verma, S.K.; Bhadauria, S.S.; Akhtar, S. Monitoring corrosion of steel bars in reinforced concrete structures. Sci. World J. 2014, 2014, 957904. [Google Scholar] [CrossRef] [PubMed]
- Sharma, S.; Mukherjee, A. Ultrasonic guided waves for monitoring corrosion in submerged plates. Struct. Control Health Monit. 2015, 22, 19–35. [Google Scholar] [CrossRef]
- Miller, T.H.; Kundu, T.; Huang, J.; Grill, J.Y. A new guided wave-based technique for corrosion monitoring in reinforced concrete. Struct. Health Monit. 2013, 12, 35–47. [Google Scholar] [CrossRef]
- Ervin, B.L.; Bernhard, J.T.; Kuchma, D.A.; Reis, H. Estimation of general corrosion damage to steel reinforced mortar using frequency sweeps of guided mechanical waves. Insight Non-Destr. Test. Cond. Monit. 2006, 48, 682–692. [Google Scholar] [CrossRef]
- Moustafa, A.; Niri, E.D.; Farhidzadeh, A.; Salamone, S. Corrosion monitoring of post-tensioned concrete structures using fractal analysis of guided ultrasonic waves. Struct. Control Health Monit. 2014, 21, 438–448. [Google Scholar] [CrossRef]
- Vélez, W.; Matta, F.; Ziehl, P. Acoustic emission monitoring of early corrosion in prestressed concrete piles. Struct. Control Health Monit. 2015, 22, 873–887. [Google Scholar] [CrossRef]
- Tian, Z.; Huo, L.; Gao, W.; Song, G.; Li, H. Grouting monitoring of post-tensioning tendon duct using PZT enabled time-reversal method. Measurement 2017, 122, 513–521. [Google Scholar] [CrossRef]
- Zhang, L.; Wang, C.; Huo, L.; Song, G. Health monitoring of cuplok scaffold joint connection using piezoceramic transducers and time reversal method. Smart Mater. Struct. 2016, 25, 035010. [Google Scholar] [CrossRef]
- Mustapha, S. Damage detection in rebar-reinforced concrete beams based on time reversal of guided waves. Struct. Health Monit. 2014, 13, 347–358. [Google Scholar] [CrossRef]
- Qiu, L.; Yuan, S.; Zhang, X.; Wang, Y. A time reversal focusing based impact imaging method and its evaluation on complex composite structures. Smart Mater. Struct. 2011, 20, 105014. [Google Scholar] [CrossRef]
- Hong, X.; Song, G.; Ruan, J.; Zhang, Z.; Wu, S.; Liu, G. Active monitoring of pipeline tapered thread connection based on time reversal using piezoceramic transducers. Smart Struct. Syst. 2016, 18, 643–662. [Google Scholar] [CrossRef]
- Zhang, Y.; Li, D.; Zhou, Z. Time reversal method for guidedwaves with multimode and multipath on corrosion defect detection in wire. Appl. Sci. 2017, 7, 424. [Google Scholar] [CrossRef]
- On, B.; Im, S.; Seo, I. Performance of Time Reversal Based Underwater Target Detection in Shallow Water. Appl. Sci. 2017, 7, 1180. [Google Scholar] [CrossRef]
- Li, H.N.; Yi, T.H.; Ren, L.; Li, D.S.; Huo, L.S. Reviews on innovations and applications in structural health monitoring for infrastructures. Struct. Monit. Maint. 2014, 1, 1–45. [Google Scholar] [CrossRef]
- Kong, Q.; Robert, R.; Silva, P.; Mo, Y.L. Cyclic Crack Monitoring of a Reinforced Concrete Column under Simulated Pseudo-Dynamic Loading Using Piezoceramic-Based Smart Aggregates. Appl. Sci. 2016, 6, 341. [Google Scholar] [CrossRef]
- Huo, L.; Li, X.; Li, H.; Wang, Z.; Song, G. Dynamic Modelling of Embeddable Piezoceramic Transducers. Sensors 2017, 17, 2801. [Google Scholar] [CrossRef] [PubMed]
- Jung, Y.; Kwak, J.H.; Lee, Y.H.; Kim, W.D.; Hur, S. Development of a multi-channel piezoelectric acoustic sensor based on an artificial basilar membrane. Sensors 2013, 14, 117–128. [Google Scholar] [CrossRef] [PubMed]
- Shao, J.; Wang, T.; Yin, H.; Yang, D.; Li, Y. Bolt Looseness Detection Based on Piezoelectric Impedance Frequency Shift. Appl. Sci. 2016, 6, 298. [Google Scholar] [CrossRef]
- Hu, X.; Zhu, H.; Wang, D. A Study of Concrete Slab Damage Detection Based on the Electromechanical Impedance Method. Sensors 2014, 14, 19897–19909. [Google Scholar] [CrossRef] [PubMed] [Green Version]
- Jiang, T.; Kong, Q.; Wang, W.; Huo, L.; Song, G. Monitoring of Grouting Compactness in a Post-Tensioning Tendon Duct Using Piezoceramic Transducers. Sensors 2016, 16, 1343. [Google Scholar] [CrossRef] [PubMed]
- Wang, G. Analysis of bimorph piezoelectric beam energy harvesters using Timoshenko and Euler–Bernoulli beam theory. J. Intell. Mater. Syst. Struct. 2013, 24, 226–239. [Google Scholar] [CrossRef]
- Kim, H.S.; Kim, J.H.; Kim, J. A review of piezoelectric energy harvesting based on vibration. Int. J. Precis. Eng. Manuf. 2011, 12, 1129–1141. [Google Scholar] [CrossRef]
- Liang, J.; Liao, W.H. Improved Design and Analysis of Self-Powered Synchronized Switch Interface Circuit for Piezoelectric Energy Harvesting Systems. IEEE Trans. Ind. Electron. 2011, 59, 1950–1960. [Google Scholar] [CrossRef]
- Malakooti, M.H.; Sodano, H.A. Piezoelectric energy harvesting through shear mode operation. Smart Mater. Struct. 2015, 24, 055005. [Google Scholar] [CrossRef]
- Jeong, C.K.; Baek, C.; Kingon, A.I.; Park, K.I.; Kim, S.H. Lead-free perovskite nanowire-employed piezopolymer for highly efficient flexible nanocomposite energy harvester. Small 2018, 14, e1704022. [Google Scholar] [CrossRef] [PubMed]
- Han, J.H.; Bae, K.M.; Hong, S.K.; Park, H.; Kwak, J.H.; Wang, H.S.; Joe, D.J.; Park, J.H.; Jung, Y.H.; Hur, S.; et al. Machine learning-based self-powered acoustic sensor for speaker recognition. Nano Energy 2018, 53, 658–665. [Google Scholar] [CrossRef]
- Park, K.I.; Chang, K.J.; Na, K.K.; Lee, K.J. Stretchable piezoelectric nanocomposite generator. Nano Converg. 2016, 3, 1–12. [Google Scholar] [CrossRef] [PubMed]
- Song, G.; Qiao, P.Z.; Binienda, W.K.; Zou, G.P. Active vibration damping of composite beam using smart sensors and actuators. J. Aerosp. Eng. 2002, 15, 97–103. [Google Scholar] [CrossRef]
- Song, G.; Gu, H. Active vibration suppression of a smart flexible beam using a sliding mode based controller. J. Vib. Control 2007, 13, 1095–1107. [Google Scholar] [CrossRef]
- Du, G.F.; Kong, Q.Z.; Lai, T.; Song, G. Feasibility Study on Crack Detection of Pipelines Using Piezoceramic Transducers. Int. J. Distrib. Sens. Netw. 2013, 7, 631715. [Google Scholar] [CrossRef]
- Broda, D.; Staszewski, W.J.; Martowicz, A.; Uhl, T.; Silberschmidt, V.V. Modelling of nonlinear crack–wave interactions for damage detection based on ultrasound—A review. J. Sound Vib. 2014, 333, 1097–1118. [Google Scholar] [CrossRef]
- Xu, J.; Hao, J.; Li, H.; Luo, M.; Guo, W.; Li, W. Experimental Damage Identification of a Model Reticulated Shell. Appl. Sci. 2017, 7, 362. [Google Scholar] [CrossRef]
- Wang, Y.; Zhu, X.; Hao, H.; Ou, J. Guided wave propagation and spectral element method for debonding damage assessment in RC structures. J. Sound Vib. 2009, 324, 751–772. [Google Scholar] [CrossRef]
- Zou, D.; Liu, T.; Qiao, G.; Huang, Y.; Li, B. An Experimental Study on the Performance of Piezoceramic-Based Smart Aggregate in Water Environment. IEEE Sens. J. 2014, 14, 943–944. [Google Scholar] [CrossRef] [Green Version]
- Venugopal, V.P.; Wang, G. Modeling and analysis of Lamb wave propagation in a beam under Lead Zirconate Titanate actuation and sensing. J. Intell. Mater. Syst. Struct. 2015, 26, 1679–1698. [Google Scholar] [CrossRef]
- Zou, D.; Liu, T.; Liang, C.; Huang, Y.; Zhang, F.; Du, C. An experimental investigation on the health monitoring of concrete structures using piezoelectric transducers at various environmental temperatures. J. Intell. Mater. Syst. Struct. 2015, 26, 1028–1034. [Google Scholar] [CrossRef]
- Jiang, T.; Kong, Q.; Patil, D.; Luo, Z.; Huo, L.; Song, G. Detection of Debonding Between Fiber Reinforced Polymer Bar and Concrete Structure Using Piezoceramic Transducers and Wavelet Packet Analysis. IEEE Sens. J. 2017, 17, 1992–1998. [Google Scholar] [CrossRef]
- Liao, W.; Wang, J.X.; Song, G.; Gu, H.; Olmi, C.; Mo, Y.L.; Chang, K.C.; Loh, C.H. Structural health monitoring of concrete columns subjected to seismic excitations using piezoceramic-based sensors. Smart Mater. Struct. 2011, 20, 125015. [Google Scholar] [CrossRef]
- Hu, Y.; Yang, Y. Wave propagation modeling of the PZT sensing region for structural health monitoring. Smart Mater. Struct. 2007, 16, 706. [Google Scholar] [CrossRef]
- Yang, Y.; Annamdas, V.G.M.; Wang, C.; Zhou, Y. Application of Multiplexed FBG and PZT Impedance Sensors for Health Monitoring of Rocks. Sensors 2008, 8, 271–289. [Google Scholar] [CrossRef] [PubMed] [Green Version]
- Zhang, C.; Yu, X.; Alexander, L.; Zhang, Y.; Rajamani, R.; Garg, N. Piezoelectric active sensing system for crack detection in concrete structure. J. Civ. Struct. Health Monit. 2016, 6, 129–139. [Google Scholar] [CrossRef]
- Xu, B.; Zhang, T.; Song, G.; Gu, H. Active interface debonding detection of a concrete-filled steel tube with piezoelectric technologies using wavelet packet analysis. Mech. Syst. Signal Proc. 2013, 36, 7–17. [Google Scholar] [CrossRef]
- Song, G.; Gu, H.; Mo, Y.L. Smart aggregates: Multi-functional sensors for concrete structures—A tutorial and a review. Smart Mater. Struct. 2008, 17, 033001. [Google Scholar] [CrossRef]
- Feng, Q.; Kong, Q.; Huo, L.; Song, G. Crack detection and leakage monitoring on reinforced concrete pipe. Smart Mater. Struct. 2015, 24, 115020. [Google Scholar] [CrossRef]
- Song, G.; Li, W.; Wang, B.; Ho, S.C.M. A Review of Rock Bolt Monitoring Using Smart Sensors. Sensors 2017, 17, 776. [Google Scholar] [CrossRef] [PubMed]
- Yin, H.; Wang, T.; Yang, D.; Liu, S.; Shao, J.; Li, Y. A Smart Washer for Bolt Looseness Monitoring Based on Piezoelectric Active Sensing Method. Appl. Sci. 2016, 6, 320. [Google Scholar] [CrossRef]
- Huo, L.; Wang, B.; Chen, D.; Song, G. Monitoring of Pre-Load on Rock Bolt Using Piezoceramic-Transducer Enabled Time Reversal Method. Sensors 2017, 17, 2467. [Google Scholar] [CrossRef] [PubMed]
- Ing, R.K.; Fink, M. Time-reversed Lamb waves. IEEE Trans. Ultrason. Ferroelectr. Freq. Control 1998, 45, 1032. [Google Scholar] [CrossRef] [PubMed]
- Huo, L.; Chen, D.; Kong, Q.; Li, H.; Song, G. Smart washer—A piezoceramic-based transducer to monitor looseness of bolted connection. Smart Mater. Struct. 2017, 26, 025033. [Google Scholar] [CrossRef]
- Byun, G.; Song, H.; Kim, J. Virtual Source Array-Based Multiple Time-Reversal Focusing. Appl. Sci. 2018, 8, 99. [Google Scholar] [CrossRef]
- Fink, M. Time reversal of ultrasonic fields. I. Basic principles. IEEE Trans. Ultrason. Ferroelectr. Freq. Control 1992, 39, 555–566. [Google Scholar] [CrossRef] [PubMed]
- Maaddawy, T.A.E.; Soudki, K.A. Effectiveness of Impressed Current Technique to Simulate Corrosion of Steel Reinforcement in Concrete. J. Mater. Civ. Eng. 2003, 15, 41–47. [Google Scholar] [CrossRef]
- Ahmad, S. Reinforcement corrosion in concrete structures, its monitoring and service life prediction—A review. Cem. Concr. Compos. 2003, 25, 459–471. [Google Scholar] [CrossRef]
Figure 1.
The flow chart of steel bar corrosion monitoring. PZT—lead zirconate titanate.

Figure 2.
Time reversal process of steel bar corrosion monitoring.

Figure 3.
Illustration of time reversal process.

Figure 4.
Chemical process of accelerated steel bar corrosion.

Figure 5.
The piezoceramic disk transducers.

Figure 6.
Relationship diagram of time and voltage.

Figure 7.
Experimental setup consisting of piezoceramic transducers to detect the corrosion of steel bar.
Figure 7.
Experimental setup consisting of piezoceramic transducers to detect the corrosion of steel bar.

Figure 8.
Corrosion experimental setup.

Figure 9.
Steel bar without corrosion.

Figure 10.
Corrosion of steel bar after 35 h.

Figure 11.
Signal after 15 h.

Figure 12.
Signal after 35 h.

Figure 13.
The amplitude of focused signal with mass loss ratio of different specimens.


Table 1.
The data of specimen no. 1.
| The Mass Loss Ratio (%) | The Magnitude of Focused Signal (50 KHz) | The Magnitude of Focused Signal (60 KHz) | The Magnitude of Focused Signal (70 KHz) |
|---|---|---|---|
| 0 | 0.2399 | 0.2311 | 0.2142 |
| 0.88 | 0.2132 | 0.2132 | 0.1972 |
| 2.11 | 0.2057 | 0.1997 | 0.1804 |
| 3.19 | 0.1953 | 0.1846 | 0.1747 |
| 4.10 | 0.1915 | 0.1776 | 0.1692 |
| 5.54 | 0.1788 | 0.1703 | 0.1597 |
| 6.61 | 0.1687 | 0.1601 | 0.1456 |
| 7.80 | 0.1541 | 0.1505 | 0.1367 |
| 8.80 | 0.1483 | 0.1403 | 0.1261 |
| 9.90 | 0.1362 | 0.1284 | 0.1132 |
| 10.89 | 0.1257 | 0.1173 | 0.1012 |
Table 2.
The data of specimen no. 2.
| The Mass Loss Ratio (%) | The Magnitude of Focused Signal (50 KHz) | The Magnitude of Focused Signal (60 KHz) | The Magnitude of Focused Signal (70 KHz) |
|---|---|---|---|
| 0 | 0.2311 | 0.2136 | 0.261 |
| 1.05 | 0.2101 | 0.1902 | 0.2507 |
| 2.38 | 0.1941 | 0.1706 | 0.2331 |
| 3.30 | 0.183 | 0.1575 | 0.2161 |
| 4.31 | 0.1577 | 0.1421 | 0.1944 |
| 5.18 | 0.144 | 0.1358 | 0.1829 |
| 6.22 | 0.1281 | 0.1248 | 0.1621 |
| 7.45 | 0.1165 | 0.1077 | 0.1444 |
| 8.42 | 0.1051 | 0.092 | 0.1244 |
| 9.61 | 0.087 | 0.0756 | 0.1009 |
| 10.78 | 0.067 | 0.0621 | 0.0813 |
Table 3.
The data of specimen no. 3.
| The Mass Loss Ratio (%) | The Magnitude of Focused Signal (50 KHz) | The Magnitude of Focused Signal (60 KHz) | The Magnitude of Focused Signal (70 KHz) |
|---|---|---|---|
| 0 | 0.5752 | 0.5578 | 0.5982 |
| 1.03 | 0.5425 | 0.5148 | 0.5546 |
| 1.99 | 0.5141 | 0.4822 | 0.5071 |
| 2.76 | 0.4833 | 0.4495 | 0.4823 |
| 3.90 | 0.4389 | 0.4153 | 0.4398 |
| 5.09 | 0.4008 | 0.3863 | 0.3878 |
| 6.18 | 0.3523 | 0.3455 | 0.3401 |
| 7.47 | 0.3201 | 0.3067 | 0.3102 |
| 8.52 | 0.289 | 0.2851 | 0.2648 |
| 9.691 | 0.2524 | 0.2472 | 0.2254 |
| 10.93 | 0.210 | 0.2113 | 0.1751 |
Table 4.
The data of specimen no. 4.
| The Mass Loss Ratio (%) | The Magnitude of Focused Signal (50 KHz) | The Magnitude of Focused Signal (60 KHz) | The Magnitude of Focused Signal (70 KHz) |
|---|---|---|---|
| 0 | 0.3881 | 0.3658 | 0.3718 |
| 0.90 | 0.3628 | 0.3586 | 0.3603 |
| 1.76 | 0.3510 | 0.3483 | 0.3481 |
| 2.72 | 0.3201 | 0.3391 | 0.3261 |
| 3.84 | 0.2962 | 0.3247 | 0.3099 |
| 5.02 | 0.2722 | 0.3183 | 0.2812 |
| 6.13 | 0.2431 | 0.3021 | 0.2632 |
| 7.32 | 0.2259 | 0.2918 | 0.2504 |
| 8.49 | 0.1952 | 0.2842 | 0.221 |
| 9.69 | 0.1701 | 0.2728 | 0.2001 |
| 10.84 | 0.1552 | 0.2572 | 0.1826 |
© 2018 by the authors. Licensee MDPI, Basel, Switzerland. This article is an open access article distributed under the terms and conditions of the Creative Commons Attribution (CC BY) license (http://creativecommons.org/licenses/by/4.0/).
Share and Cite
MDPI and ACS Style
Huo, L.; Li, C.; Jiang, T.; Li, H.-N. Feasibility Study of Steel Bar Corrosion Monitoring Using a Piezoceramic Transducer Enabled Time Reversal Method. Appl. Sci. 2018, 8, 2304. https://0-doi-org.brum.beds.ac.uk/10.3390/app8112304
AMA Style
Huo L, Li C, Jiang T, Li H-N. Feasibility Study of Steel Bar Corrosion Monitoring Using a Piezoceramic Transducer Enabled Time Reversal Method. Applied Sciences. 2018; 8(11):2304. https://0-doi-org.brum.beds.ac.uk/10.3390/app8112304
Chicago/Turabian StyleHuo, Linsheng, Chuanbo Li, Tianyong Jiang, and Hong-Nan Li. 2018. "Feasibility Study of Steel Bar Corrosion Monitoring Using a Piezoceramic Transducer Enabled Time Reversal Method" Applied Sciences 8, no. 11: 2304. https://0-doi-org.brum.beds.ac.uk/10.3390/app8112304
Note that from the first issue of 2016, this journal uses article numbers instead of page numbers. See further details here.