Article

Resistance of L. monocytogenes and S. Typhimurium towards Cold Atmospheric Plasma as Function of Biofilm Age

1
CPMF2—Flemish Cluster Predictive Microbiology in Foods, 9000 Ghent, Belgium
2
OPTEC—Optimization in Engineering Center-of-Excellence, KU Leuven, 9000 Ghent, Belgium
3
BioTeC—Chemical and Biochemical Process Technology and Control, Department of Chemical Engineering, KU Leuven, 9000 Ghent, Belgium
4
Department of Electrical Engineering and Electronics, University of Liverpool, Liverpool L69 3GJ, UK
*
Author to whom correspondence should be addressed.
Submission received: 28 November 2018 / Revised: 14 December 2018 / Accepted: 17 December 2018 / Published: 19 December 2018
(This article belongs to the Special Issue Cold Plasma Treatment for Food Safety and Quality)

Abstract

:

Featured Application

Cold Atmospheric Plasma (CAP) is a promising technology for the treatment of abiotic (food) contact surfaces to inactivate biofilms that have been developed on these surfaces. However, the efficacy of this technology for inactivation of highly mature (and more resistant) biofilms should be investigated in order to comment on a possible application of this technology for the disinfection of abiotic (food) contact surfaces.

Abstract

The biofilm mode of growth protects bacterial cells against currently applied disinfection methods for abiotic (food) contact surfaces. Therefore, innovative methods, such as Cold Atmospheric Plasma (CAP), should be investigated for biofilm inactivation. However, more knowledge is required concerning the influence of the biofilm age on the inactivation efficacy in order to comment on a possible application of CAP in the (food) processing industry. L. monocytogenes and S. Typhimurium biofilms with five different ages (i.e., 1, 2, 3, 7, and 10 days) were developed. For the untreated biofilms, the total biofilm mass and the cell density were determined. To investigate the biofilm resistance towards CAP treatment, biofilms with different ages were treated for 10 min and the remaining cell density was determined. Finally, for the one-day old reference biofilms and the most resistant biofilm age, complete inactivation curves were developed to examine the influence of the biofilm age on the inactivation kinetics. For L. monocytogenes, an increased biofilm age resulted in (i) an increased biomass, (ii) a decreased cell density prior to CAP treatment, and (iii) an increased resistance towards CAP treatment. For S. Typhimurium, similar results were obtained, except for the biomass, which was here independent of the biofilm age.

Graphical Abstract

1. Introduction

Biofilms have been defined as a structured community of bacterial cells within a self-produced matrix of polymeric substances, which is attached to an inert (abiotic) or living (biotic) surface [1]. Biofilms are omnipresent in nature and in many industrial environments, causing economic and health related problems, such as contamination/spoilage of food products, an impeded heat transfer in heat exchangers, and corrosion of surfaces [2,3,4,5]. With respect to contamination of food products, it has become clear that pathogenic bacteria, such as Listeria monocytogenes, Salmonella spp., Campylobacter jejuni, and Yersinia enterocolitica, grow predominantly as biofilms on (a)biotic surfaces rather than as planktonic cells or colonies [6,7]. In addition, these pathogenic species were mainly responsible for the foodborne illnesses reported in 2015 within the European Union [8]. Based on their notification and (high) fatality rates, two of these species (i.e., S. Typhimurium and L. monocytogenes), were selected as model microorganisms to conduct this research. Salmonellosis (caused by S. (Typhimurium)) has a high notification rate (21.2/100,000 capita) and a relatively high fatality rate (0.24%). Listeriosis (mainly caused by L. monocytogenes) has a relatively low notification rate (0.46/100,000 capita), but a very high fatality rate (17.7%) [8].
The biofilm mode of living protects the cells from environmental stresses, such as shear forces, nutrient limitations, pH changes, disinfectants, and antibiotics [9,10]. This increased resistance is the result of different biofilm-specific characteristics, such as the production of Extracellular Polymeric Substances (EPS), the presence of less metabolically active cells, and the accumulation of protective enzymes within the matrix [1,2,10,11]. The EPS matrix has several functions, i.e., it (i) prevents the cells from dehydration and starvation, (ii) keeps the cells/biofilm attached to the surface, and, (iii) limits the diffusion of antimicrobial agents into the three-dimensional structure of the matrix [1,2,11]. Biofilm-associated cells can also undergo physiological changes, i.e., a subpopulation of the cells can become metabolically dormant with a decreased growth rate and a decreased consumption of nutrients and oxygen [2]. Since antimicrobial agents (and antibiotics) are far more effective towards actively growing cells, this results in an incomplete inactivation of the biofilm population [2]. Finally, the production of antibiotic degrading enzymes (such as β-lactamase) and the subsequent accumulation within the matrix is also one of the possible defence mechanisms of biofilm-associated cells, although this only concerns treatment of health related (medical) issues [2].
Due to all of these characteristics, biofilm-associated cells are already very resistant towards the inactivation methods that are currently applied in an industrial (food processing) environment. These methods involve the use of (hot) water and antimicrobial agents, in combination with a mechanical action, such as the use of brushes [6]. In addition, many studies proved that the resistance of biofilms towards these methods further increases as the biofilm ages [12,13,14,15]. This phenomenon can be explained by the fact that a mature biofilm is denser and more complex when compared to a younger one, limiting the penetration of antimicrobial agents [15]. Also, microorganisms in a biofilm can be less susceptible to antimicrobial agents due to their altered physiological state, which might be more prominent as the biofilm ages [14].
To ensure food safety, new biofilm inactivation methods should be investigated and implemented in the existing cleaning processes. One of the promising technologies for biofilm inactivation is the use of Cold Atmospheric Plasma (CAP), since log-reductions up to 4-log CFU/sample have been obtained for L. monocytogenes and S. Typhimurium biofilms [16,17]. Plasma can be defined as a (partially) ionized gas, consisting of ions (positive and negative), photons, free electrons, and activated neutral species (excited and radical) [18,19]. CAP is a specific type of plasma, which can be created by using an electric discharge in a gas, at room temperature and at atmospheric pressure. The use of CAP as inactivation technology for (food) contact surfaces has many advantages when compared to the currently applied methods, i.e., (i) it is fast, (ii) it can be performed at a low temperature, (iii) the plasma components fade out immediately after treatment, (iv) it is environmentally friendly, (v) it has a low running cost, and (vi) cells can be inactivated by multiple inactivation mechanisms [18,19,20,21]. The latter has an additional advantage since it is thought that the broad range of active agents, mechanisms of action, and target sites, would decrease the likelihood that (biofilm-associated) cells are resistant towards this treatment [21].
However, despite the promising biofilm inactivation efficacy of CAP reported in literature, further investigation is still required to examine whether the efficacy would decrease with an increased biofilm age. If biofilms grown on (food) contact surfaces are not (completely) inactivated by means of CAP or other (traditional) inactivation methods, they might become more mature and more resistant towards CAP treatment. Consequently, the chance of (cross) contamination of food products would increase, implying higher food safety risks. For this reason, it is necessary to investigate the influence of the biofilm age on the CAP inactivation efficacy. In addition, the induction of sub-lethally injured cells following CAP treatment of biofilms with different ages should be investigated as well. Sub-lethal injury of (biofilm-associated) cells can be the result of an inefficient treatment, which was only able to damage the cells without killing them. This phenomenon has been reported with other (traditional) inactivation methods (such as a mild heat treatment) and it is important to take into account since sub-lethally injured cells might recover if they re-encounter optimal growth conditions [22,23,24].
Therefore, the goal of this research was to examine the influence of the biofilm age on (i) the total biofilm mass of the untreated biofilms, (ii) the cell density of the untreated biofilms, (iii) the CAP efficacy for biofilm inactivation, and (iv) the CAP inactivation kinetics. L. monocytogenes (Gram-positive) and S. Typhimurium (Gram-negative) biofilms with different ages (i.e., 1, 2, 3, 7, and 10 day(s)) were developed and treated with a previously determined combination of optimal plasma characteristics [17].

2. Materials and Methods

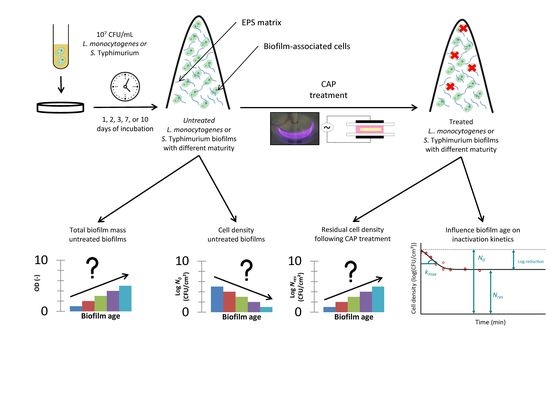
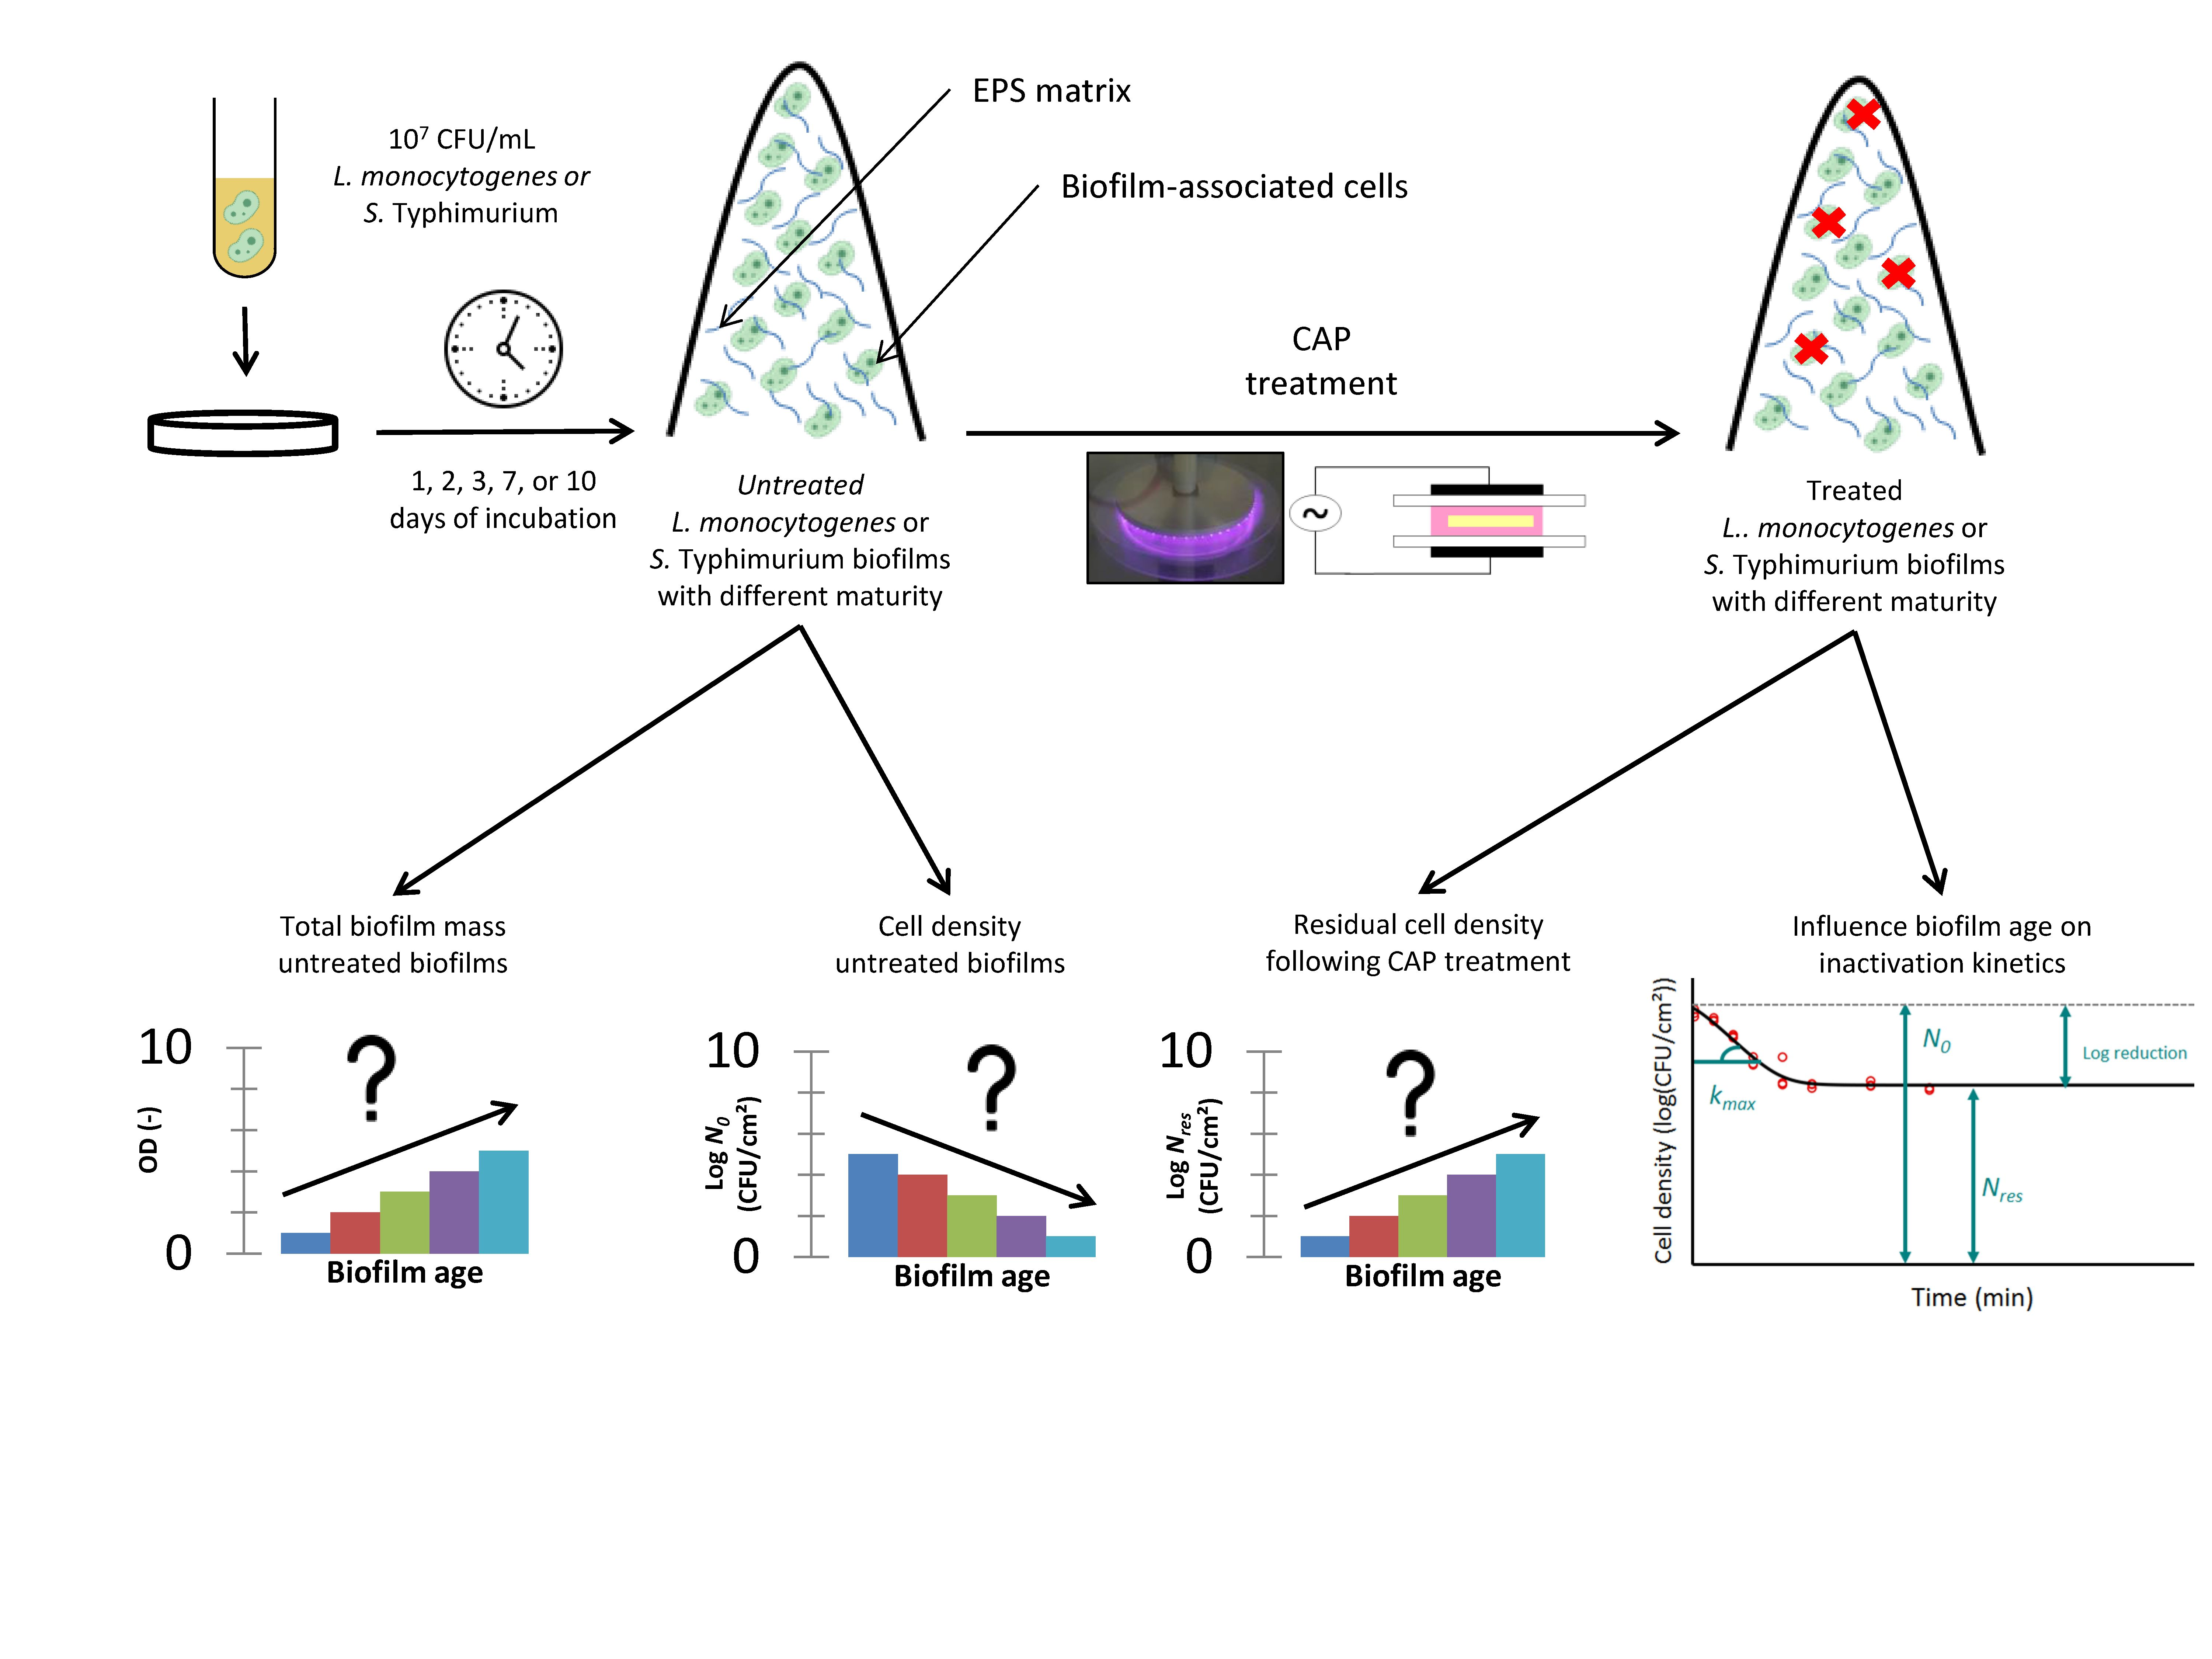
2.1. Experimental Design

In the first part of this research, L. monocytogenes and S. Typhimurium biofilms with five different ages were developed, i.e., 1, 2, 3, 7, and 10 day(s) old (starting from inoculation of the surfaces). For each of the biofilm ages, the cell density on general and selective medium was determined before and after a 10 min during treatment with Cold Atmospheric Plasma (CAP). CAP treatment conditions were selected based on the research that was done by Govaert et al. [17]. In that research, the most effective inactivation of the one-day old (reference) model biofilms was obtained by using a Dielectric Barrier Discharge (DBD) electrode, a helium gas flow, and an input voltage of 21.88 V (which resulted in a dissipated plasma power of approximately 7 W). In addition, for each of the biofilm ages in the presented research, the total biofilm mass of the untreated biofilm was determined using the crystal violet assay [25]. For both quantification methods, i.e., cell enumeration and crystal violet assay, three biological replicates were used.
In the second part of this research, complete inactivation curves were developed for two biofilm ages (for each species), i.e., for (i) the one-day old reference biofilm and (ii) the biofilm age, which showed the highest resistance towards CAP treatment in the first part of this research. To develop the inactivation curves, biofilms were treated with the same optimal CAP conditions, however, for different treatment times (i.e., 0, 1, 2, 5, 7.5, 10, 15, 20, 25, and 30 min). For each of the treatment times, two biological replicates were assessed and the cell densities were determined using general and selective media.
For both parts of this study, medium refreshment was not implemented in the experimental design as the authors intended to simulate the effect of equipment downtime (following an inefficient cleaning procedure) on the biofilm resistance towards CAP treatment.

2.2. Microorganisms, Pre-culture Conditions, and Inoculum Preparation

Stock-cultures of L. monocytogenes LMG23775 and S. Typhimurium LMG14933, acquired from the BCCM/LMG bacteria collection of Ghent University in Belgium, were respectively stored at −80 °C in Brain Heart Infusion broth (BHI, VWR International, Oud-Heverlee, Belgium) or Tryptic Soy Broth (TSB, Becton Dickinson, Franklin Lakes, NJ, USA), both supplemented with 20 (v/v) % glycerol (VWR International).
Starting from these stock-cultures, a purity plate was prepared by spreading a loopful of stock-culture onto a Lennox Luria Bertani Agar plate (LBA, Becton Dickinson) supplemented with 5 g/L NaCl (Sigma-Aldrich, St. Louis, MO, USA). Purity plates were incubated for 24 h at 30 (L. monocytogenes) or 37 °C (S. Typhimurium). Following this incubation period, pre-cultures were prepared by transferring one colony from the purity plate into an Erlenmeyer containing 20 mL fresh Lennox Luria Bertani broth (LB, Becton Dickinson), supplemented with 5 g/L NaCl, and incubated for 24 h at 30 °C (L. monocytogenes) or 37 °C (S. Typhimurium).
Finally, an inoculum with a cell density of approximately 107 CFU/mL was prepared by making a 100-fold dilution of the stationary phase culture. Dilution media were selected based on the research done by Govaert et al. [25], i.e., BHI (VWR Chemicals) and 20-fold diluted TSB (TSB/20) were used as dilution medium for L. monocytogenes and S. Typhimurium, respectively.

2.3. Development of Biofilms with Different Ages

Polystyrene Petri dishes (50 mm diameter, 9 mm height, Simport, Saint-Mathieu-de-Beloeil, QC, Canada) were inoculated with 1.2 mL of inoculum. Depending on the required biofilm age, Petri dishes were incubated for 1, 2, 3, 7, or 10 days (starting from the time of inoculation of the surfaces) without the addition/refreshment of the medium in order to mimic equipment downtime. Incubation temperatures were again selected based on the research that was done by Govaert et al. [25], i.e., 30 and 25 °C were used as incubation temperatures for L. monocytogenes and S. Typhimurium, respectively.

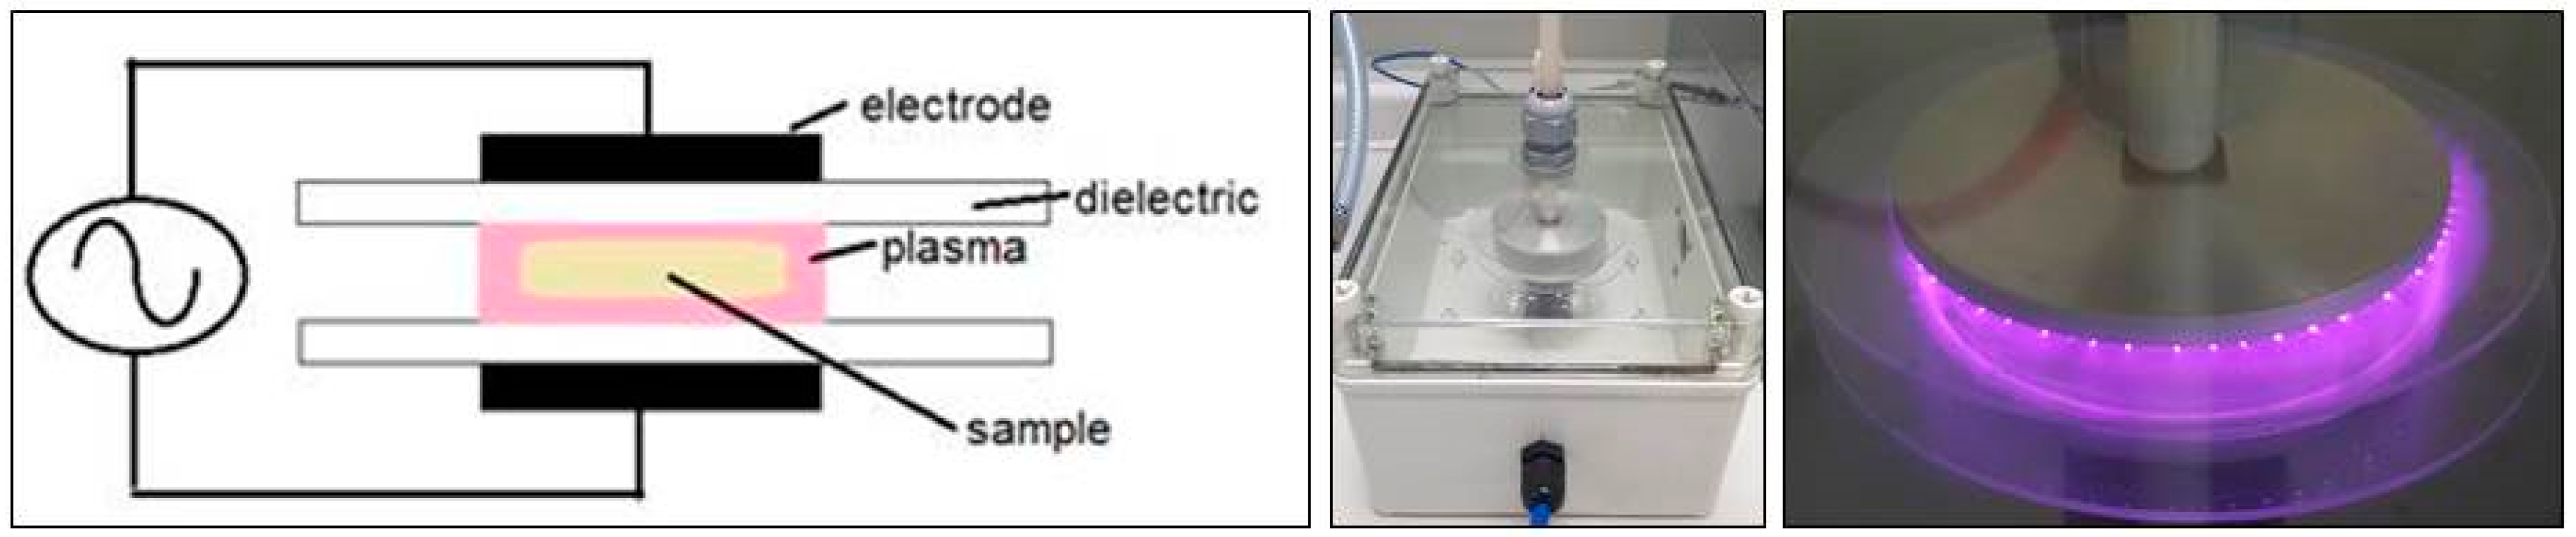
2.4. CAP Equipment and Inactivation Procedure

In this research, biofilms with different ages were inactivated using the optimal combination of plasma characteristics determined in the research of Govaert et al. [17]. This optimal combination involves (i) the use of a Dielectric Barrier Discharge (DBD) electrode configuration; (ii) a helium gas flow (purity 99.996%; flow rate 4 L/min); and, (iii) an input voltage of 21.88 V. The low voltage DC input is transformed by the plasma power supply into a high voltage AC signal (approximately 6.5 kV) and a dissipated plasma power of approximately 7 W. Finally, the frequency to generate the plasma was set at 15 kHz.
For the DBD electrode configuration (illustrated in Figure 1), the discharge is generated between two electrodes (diameter = 5.5 cm) that are covered by a dielectric layer (diameter = 7.5 cm) and the electrode gap is set at 0.8 cm. Around the electrode, an enclosure (22.5 cm × 13.5 cm × 10 cm) has been provided to increase the residence time of the plasma species and to obtain a more controlled environment.
Prior to CAP treatment, the sample was placed in between the electrodes. After flushing the reactor chamber for 4 min to ensure a homogeneous gas mixture, the high-voltage power source was energized, and the plasma was generated. Samples, which were rinsed three times with sterile Phosphate Buffered Saline (PBS) solution (to remove the remaining planktonic cells) and allowed to dry prior to treatment, were treated up to 30 min.

2.5. Biofilm Quantification Via Viable Cell Counts

The biofilm cell density before and after CAP treatment was determined via plate counts. 2 mL of sterile PBS solution was added to the rinsed and dried (un)treated biofilms and a cell scraper (blade width 20 mm, Carl Roth GmbH+Co., Karlsruhe, Germany) was used to remove the biofilm from the surface. Serial decimal dilutions of the obtained cell suspension were prepared and plated on agar plates. For each of the serial dilutions, three drops of 20 µL were plated on general and selective media in order to examine the percentage of sub-lethally injured cells [23,26]. Brain Heart Infusion Agar (BHIA, BHI supplemented with 14 g/L biological agar, VWR Chemicals, Belgium) and PALCAM (VWR Chemicals, Belgium) were used as general and selective media for L. monocytogenes, respectively. For S. Typhimurium, the general and selective media were Tryptic Soy Agar (TSA, TSB supplemented with 14 g/L biological agar) and Xylose Lysine Deoxycholate Agar (XLDA, Merck & Co., Kenilworth, NJ, USA), respectively. Before counting the colonies, agar plates were incubated for (at least) 24 h at 30 (BHIA and PALCAM) or 37 °C (TSA and XLDA).
It should be mentioned that the cell density was considered to be equal to zero when the number of CFU’s in the three droplets of 20 µL (=60 µL in total) was below 10. Consequently, the detection limit of this method was 1.2 log (CFU/cm2).

2.6. Biofilm Quantification Via Crystal Violet Staining

The total biofilm mass of the untreated biofilms was determined using the crystal violet assay, as explained in the research of Govaert et al. [25]. In summary, the different steps of this assay are: (i) rinsing of the biofilms with PBS; (ii) fixation of adhering biofilms with methanol (99 (v/v) %, VWR Chemicals, Belgium), (iii) staining with a 2 (v/v) % crystal violet solution (Sigma-Aldrich, USA), (iv) removal of excess stain; (v) addition of glacial acetic acid solution (33 (v/v) %, VWR International) to re-dissolve the remaining stain, and, (vi) optical density (OD) measurement at 570 nm (VersaMax tunable microplate reader (Molecular devices, Wokingham, UK)). If the OD was higher than 1, then the solution was diluted using the glacial acetic acid solution and a correction factor was incorporated to determine the OD of the original solution.

2.7. Statistical Analysis, Modelling, Parameter Estimation, and Estimation of Sub-Lethal Injury

For the first part of this research, analysis of variance (ANOVA) tests were performed to determine whether there are any significant differences amongst means of (i) the total mass of the untreated biofilms, (ii) the cell densities prior to CAP treatment, and (iii) the obtained log-reductions following 10 min of CAP treatment. A confidence level of 95.0% (α = 0.05) was applied and Fisher’s Least Significant Difference (LSD) test was used to distinguish which means were significantly different from others. Standardized skewness and standardized kurtosis were used to assess if the data sets came from normal distributions. The analyses were performed using the Statgraphics 18 software (Statistical Graphics, Washington, DC, USA). Significant differences have been indicated with a different letter, with ‘a’ or ‘A’ bearing the lowest value.
In the second part of this research, the model of Geeraerd et al. [27], describing a microbial inactivation curve consisting of a log-linear inactivation phase and a tail (Equation (1)), was used to fit the experimental data obtained for the two selected biofilm ages.
N ( t ) = ( N 0 N r e s )   · e k m a x · t + N r e s
where N(t) [CFU/cm2] is the cell density at time t [min], N0 [CFU/cm2] the initial cell density (prior to treatment), Nres [CFU/cm2] is a more resistant subpopulation, and kmax [1/min] is the maximum specific inactivation rate. Based on the difference between log10 N0 and log10 Nres, the final log-reduction (following 30 min of CAP treatment) has been calculated for each biofilm age.
The parameters of the Geeraerd et al. [27] model were estimated via the minimization of the sum of squared errors (SSE), using the lsqnonlin routine of the Opzimization Toolbox of Matlab version R2015b (The Mathworks, Inc., Natick, MA, USA). At the same time, the parameter estimations were determined based on the Jacobian matrix. The Root Mean Squared Error (RMSE) served as an absolute measure of the goodness of the model to fit the actual obtained data.
To calculate the percentage of sub-lethal injury (% SI), theoretical concentrations that were obtained from the model of Geeraerd et al. [27] were used for both the general and selective counts. The equation of Busch and Donelly [28] (Equation (2)) was used to determine the percentage of injured cells at each treatment time. As a result, the percentage of sub-lethal injury was plotted as a function of the treatment time.
% SI = CFU   general   medium CFU   selective   medium CFU   general   medium · 100
Finally, for each parameter of the Geeraerd et al. [27] model, different ANOVA tests (for each microorganism separately) were performed by making use of the Statgraphics 18 software.

3. Results and Discussion

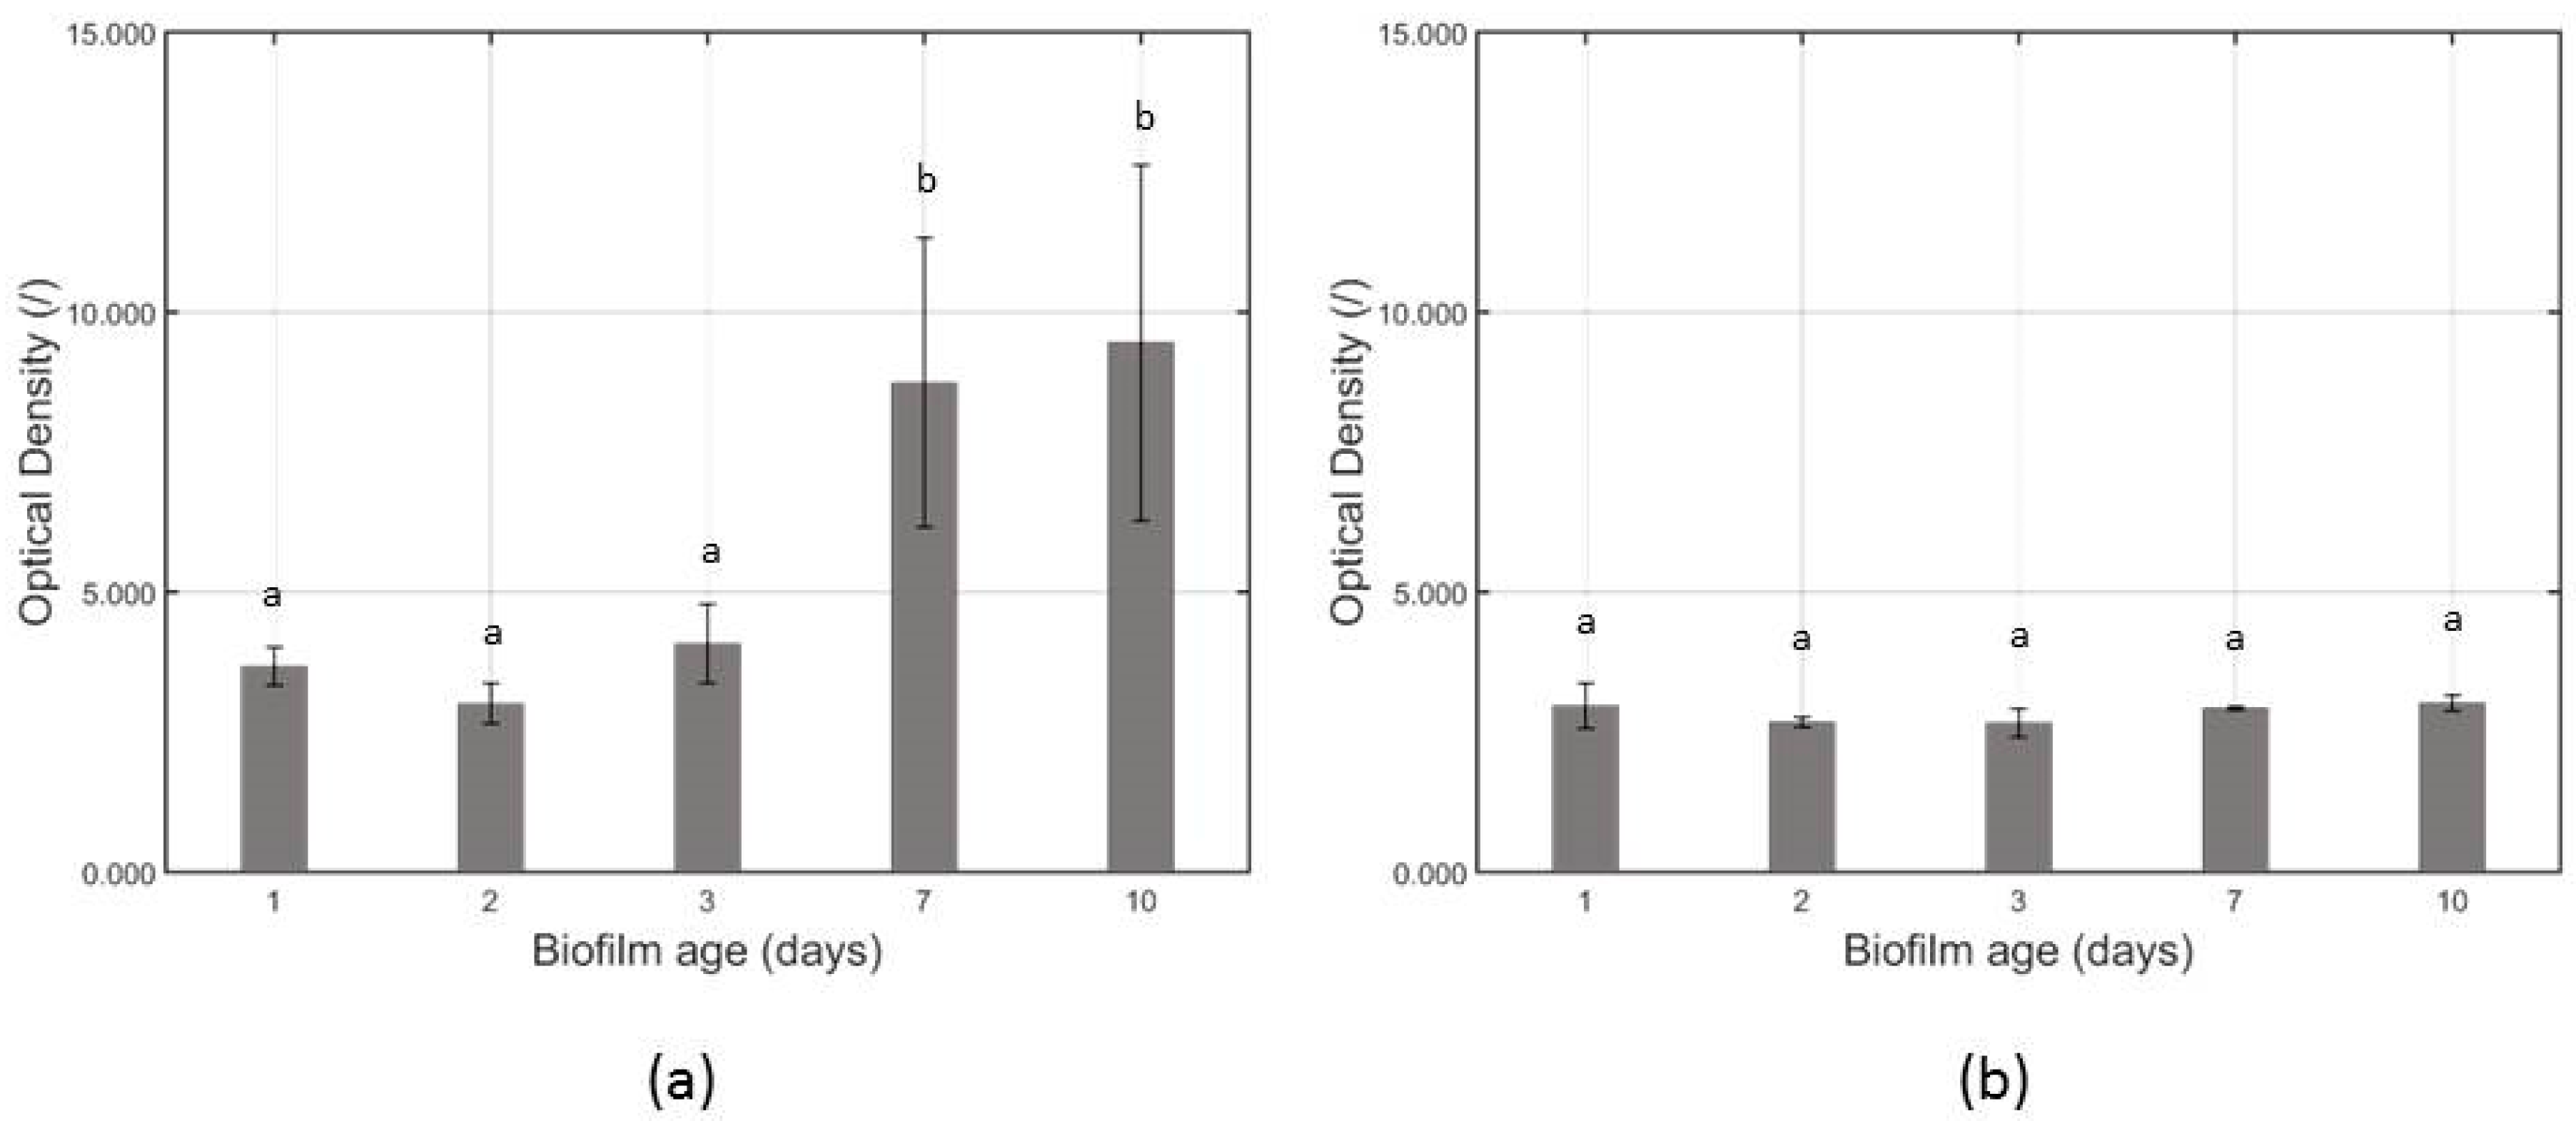
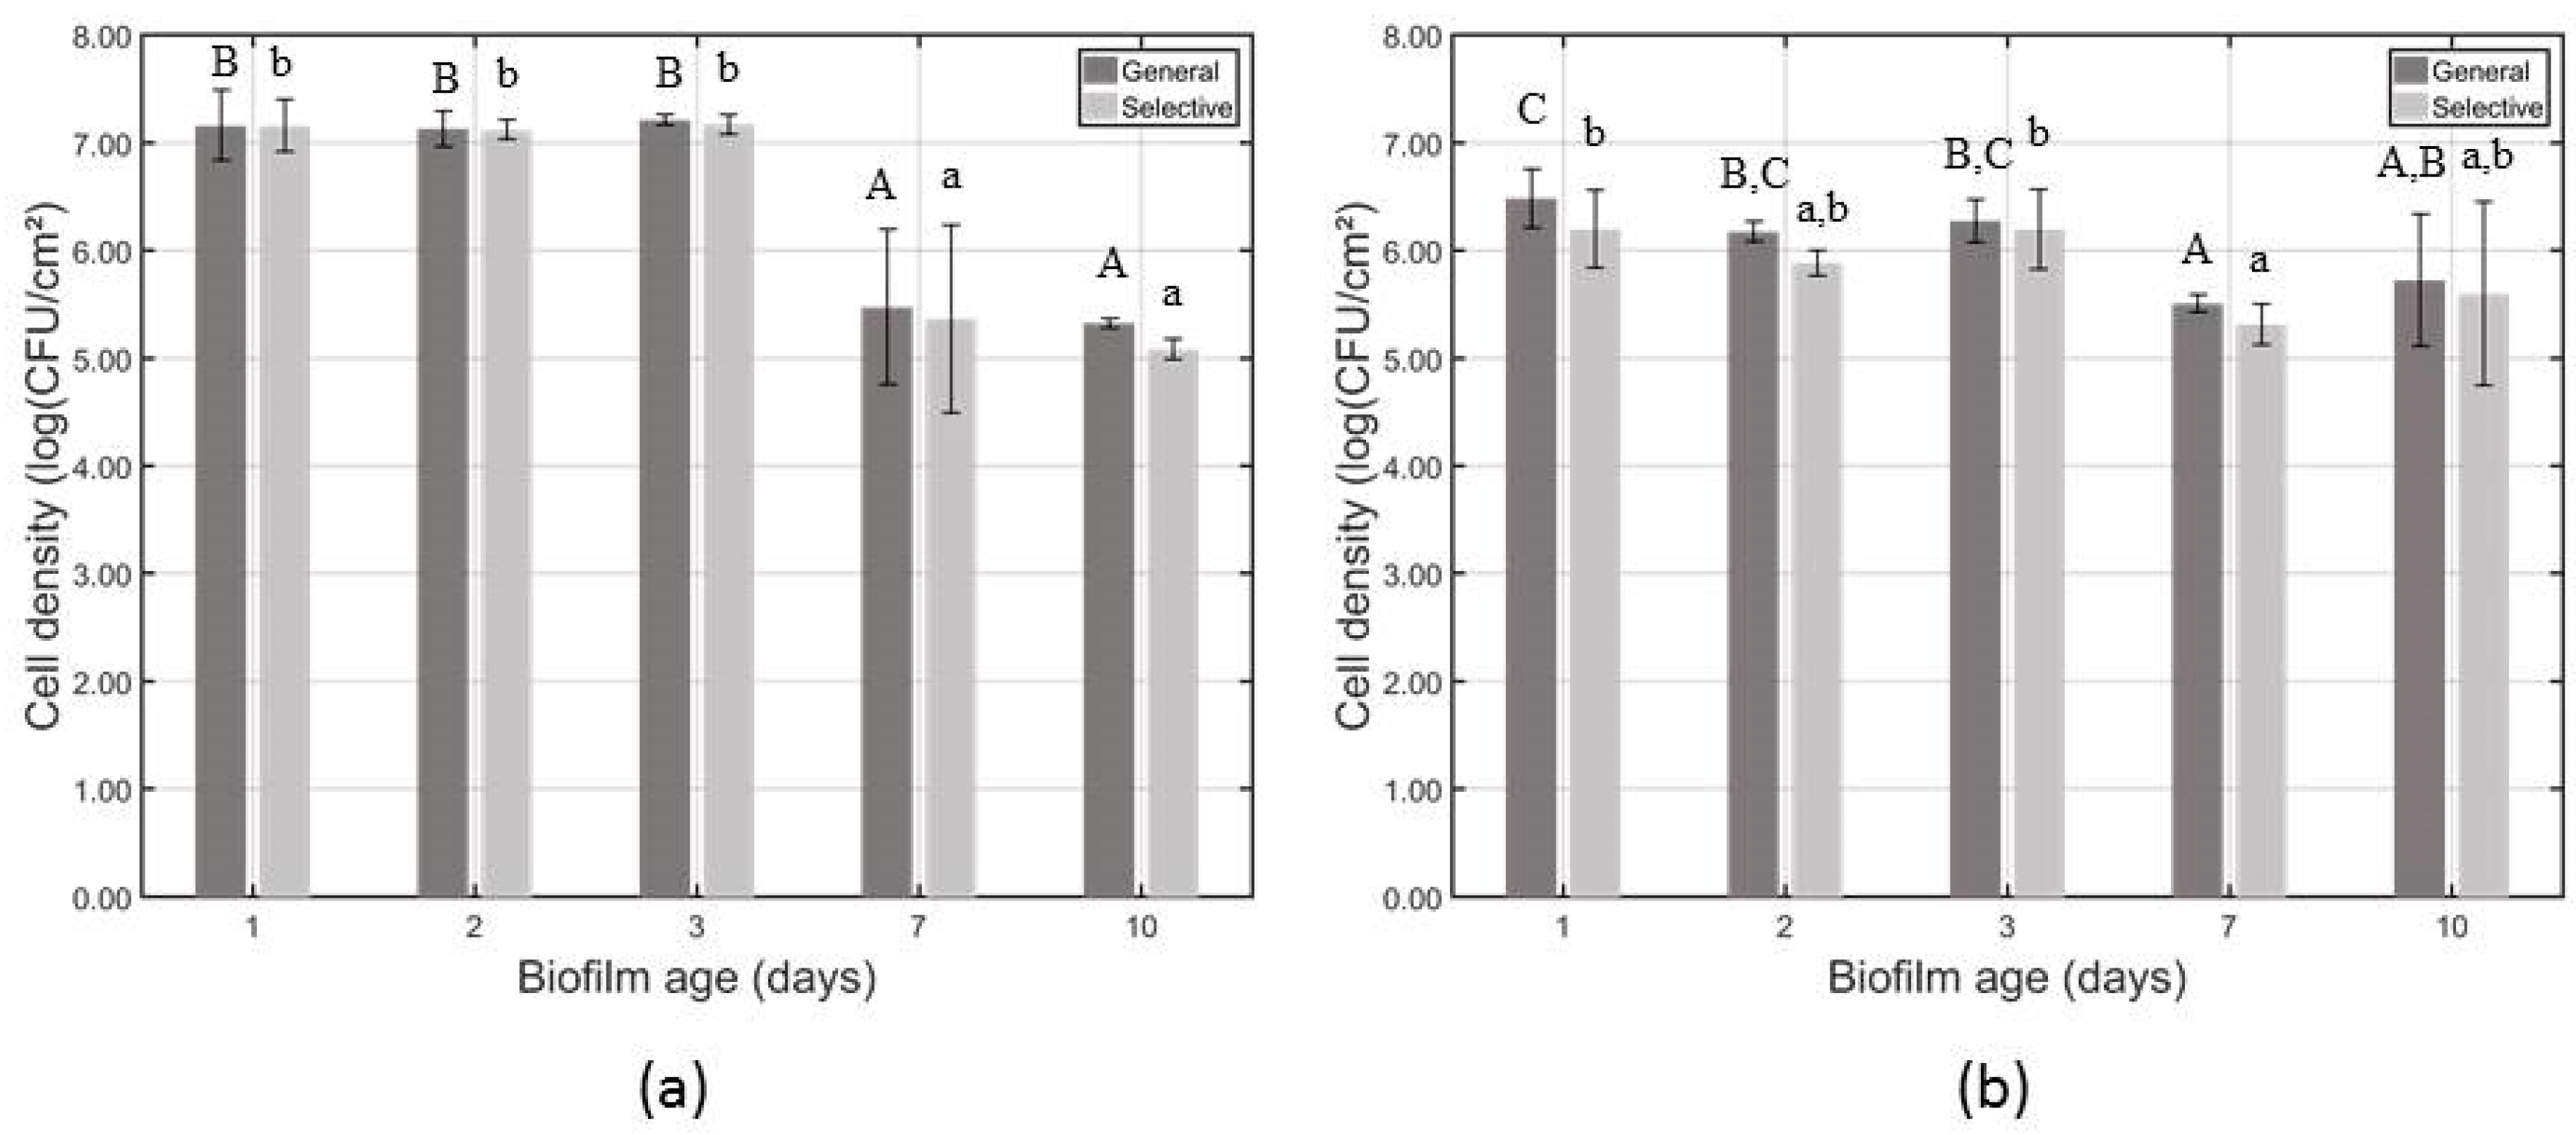
3.1. Influence of the Biofilm Age on the Total Biofilm Mass and the Cell Density of the Untreated Biofilms

The total biofilm mass and the cell density of the untreated L. monocytogenes biofilms following 1, 2, 3, 7, and 10 day(s) of incubation at 30 °C have been determined and the obtained results have been presented in Figure 2a and Figure 3a, respectively.
Based on Figure 2a, it can be concluded that the total biomass of the L. monocytogenes biofilm does not change until three days of incubation. However, as the biofilm ages even more (i.e., following seven and 10 days of incubation), the OD values have increased significantly. Since the crystal violet stains both the matrix and the cells [29], this indicates a higher production of EPS matrix by the biofilm-associated cells and/or an increased cell density. The increased cell density can, however, not be confirmed based on the results obtained in Figure 3a. The L. monocytogenes cell density initially remains (for both media) constant until three days of incubation. However, following seven and 10 days of incubation, the cell density has decreased significantly for both media. Consequently, the increased total biomass following seven and 10 days of incubation is the result of an increased production of EPS matrix. It is, however, important to notice that there is a high variability in OD for the seven and 10 days old L. monocytogenes biofilms (Figure 2a), which can be explained based on visual observations when performing the crystal violet staining. The 7 and 10 days old biofilms were less strongly attached to the surface, resulting in some parts of the biofilm that got rinsed off prior to the staining. Consequently, these detached parts were not included anymore in the quantification procedure.
For S. Typhimurium, similar experiments were performed, i.e., the total biofilm mass and the cell density of the (untreated) biofilms following 1, 2, 3, 7, and 10 day(s) of incubation at 25 °C were determined and the obtained results have been presented in Figure 2b and Figure 3b, respectively. In contrary to the results that were obtained for L. monocytogenes, no significant differences can be observed between the OD values obtained for all different S. Typhimurium biofilm ages (Figure 2b), meaning that the total biofilm mass does not change as a function of the biofilm age. Consequently, the amount of produced EPS matrix and the number of cells are not expected to change as function of the S. Typhimurium biofilm age. Nevertheless, in Figure 3b, it can be observed that the cell density prior to CAP treatment does change as function of the biofilm age. Until 3 days of incubation, the biofilm age does not significantly influence the cell density prior to CAP treatment. However, upon further incubation (i.e., following seven and 10 days of incubation), the cell density (prior to CAP treatment) has decreased significantly compared to the one-day old (reference) biofilm, although not significant for the selective medium following 10 days of incubation. The decrease in cell density following seven and 10 days of incubation is not expected since the total biofilm mass of the untreated S. Typhimurium biofilms does not change as function of the biofilm age (Figure 2b).
The (significantly) lower cell densities for the seven and 10 days old L. monocytogenes and S. Typhimurium biofilms can be the result of biofilm-associated cells that have died due to starvation, i.e., following seven and 10 days of incubation, many of the available nutrients have been consumed. However, it could also be the result of detachment of (some parts of) the biofilm and cells becoming planktonic again [30]. In general, three different modes of biofilm dispersal have been observed in literature, i.e., (i) the continuous release of single cells or small clusters of cells (erosion), (ii) a sudden release of a large portion of the biofilm (sloughing), and (iii) the rapid release of a large number of single cells from hollow cavities that have been formed inside the biofilm colony (seeding) [31,32,33,34,35]. Quorum sensing can play an important role in this matter. Upon replication, cell-to-cell signaling molecules are produced and once a certain threshold is exceeded, the expression of certain genes is induced, e.g., hydrolytic enzymes can be produced and excreted by the bacteria. Consequently, components of the EPS matrix get degraded and parts of the biofilm (or single cells) can detach and become planktonic again as the biofilm ages [30,36,37]. Based on the visual observations during the crystal violet staining of the seven and 10 days old L. monocytogenes biofilms, it could indeed be concluded that some parts of the biofilm are detached and rinsed off prior to biofilm quantification. Nevertheless, since the biomass of the seven and 10 days old L. monocytogenes biofilms is still much higher than the biomass of the one-day old (reference) biofilm, the lower cell density at seven and 10 days of incubation is most likely the result of cells that have died due to starvation or waste accumulation [38], possibly in combination with (a low number of) single cells that became planktonic again. For the S. Typhimurium biofilms, the hypothesis of biofilm dispersal can, however, not be confirmed based on the (visual) observations, i.e., (i) there was no detachment of the biofilms during the crystal violet staining and (ii) the total biofilm mass of the seven days old biofilms is not significantly lower than the biofilm mass of the one-day old (reference) biofilms. Consequently, the lower cell density of the seven days old S. Typhimurium biofilms should be the result of cells that died due to nutrient depletion and/or waste accumulation [38]. As for L. monocytogenes, it might also be possible that (a low amount of) the S. Typhimurium cells became planktonic again.

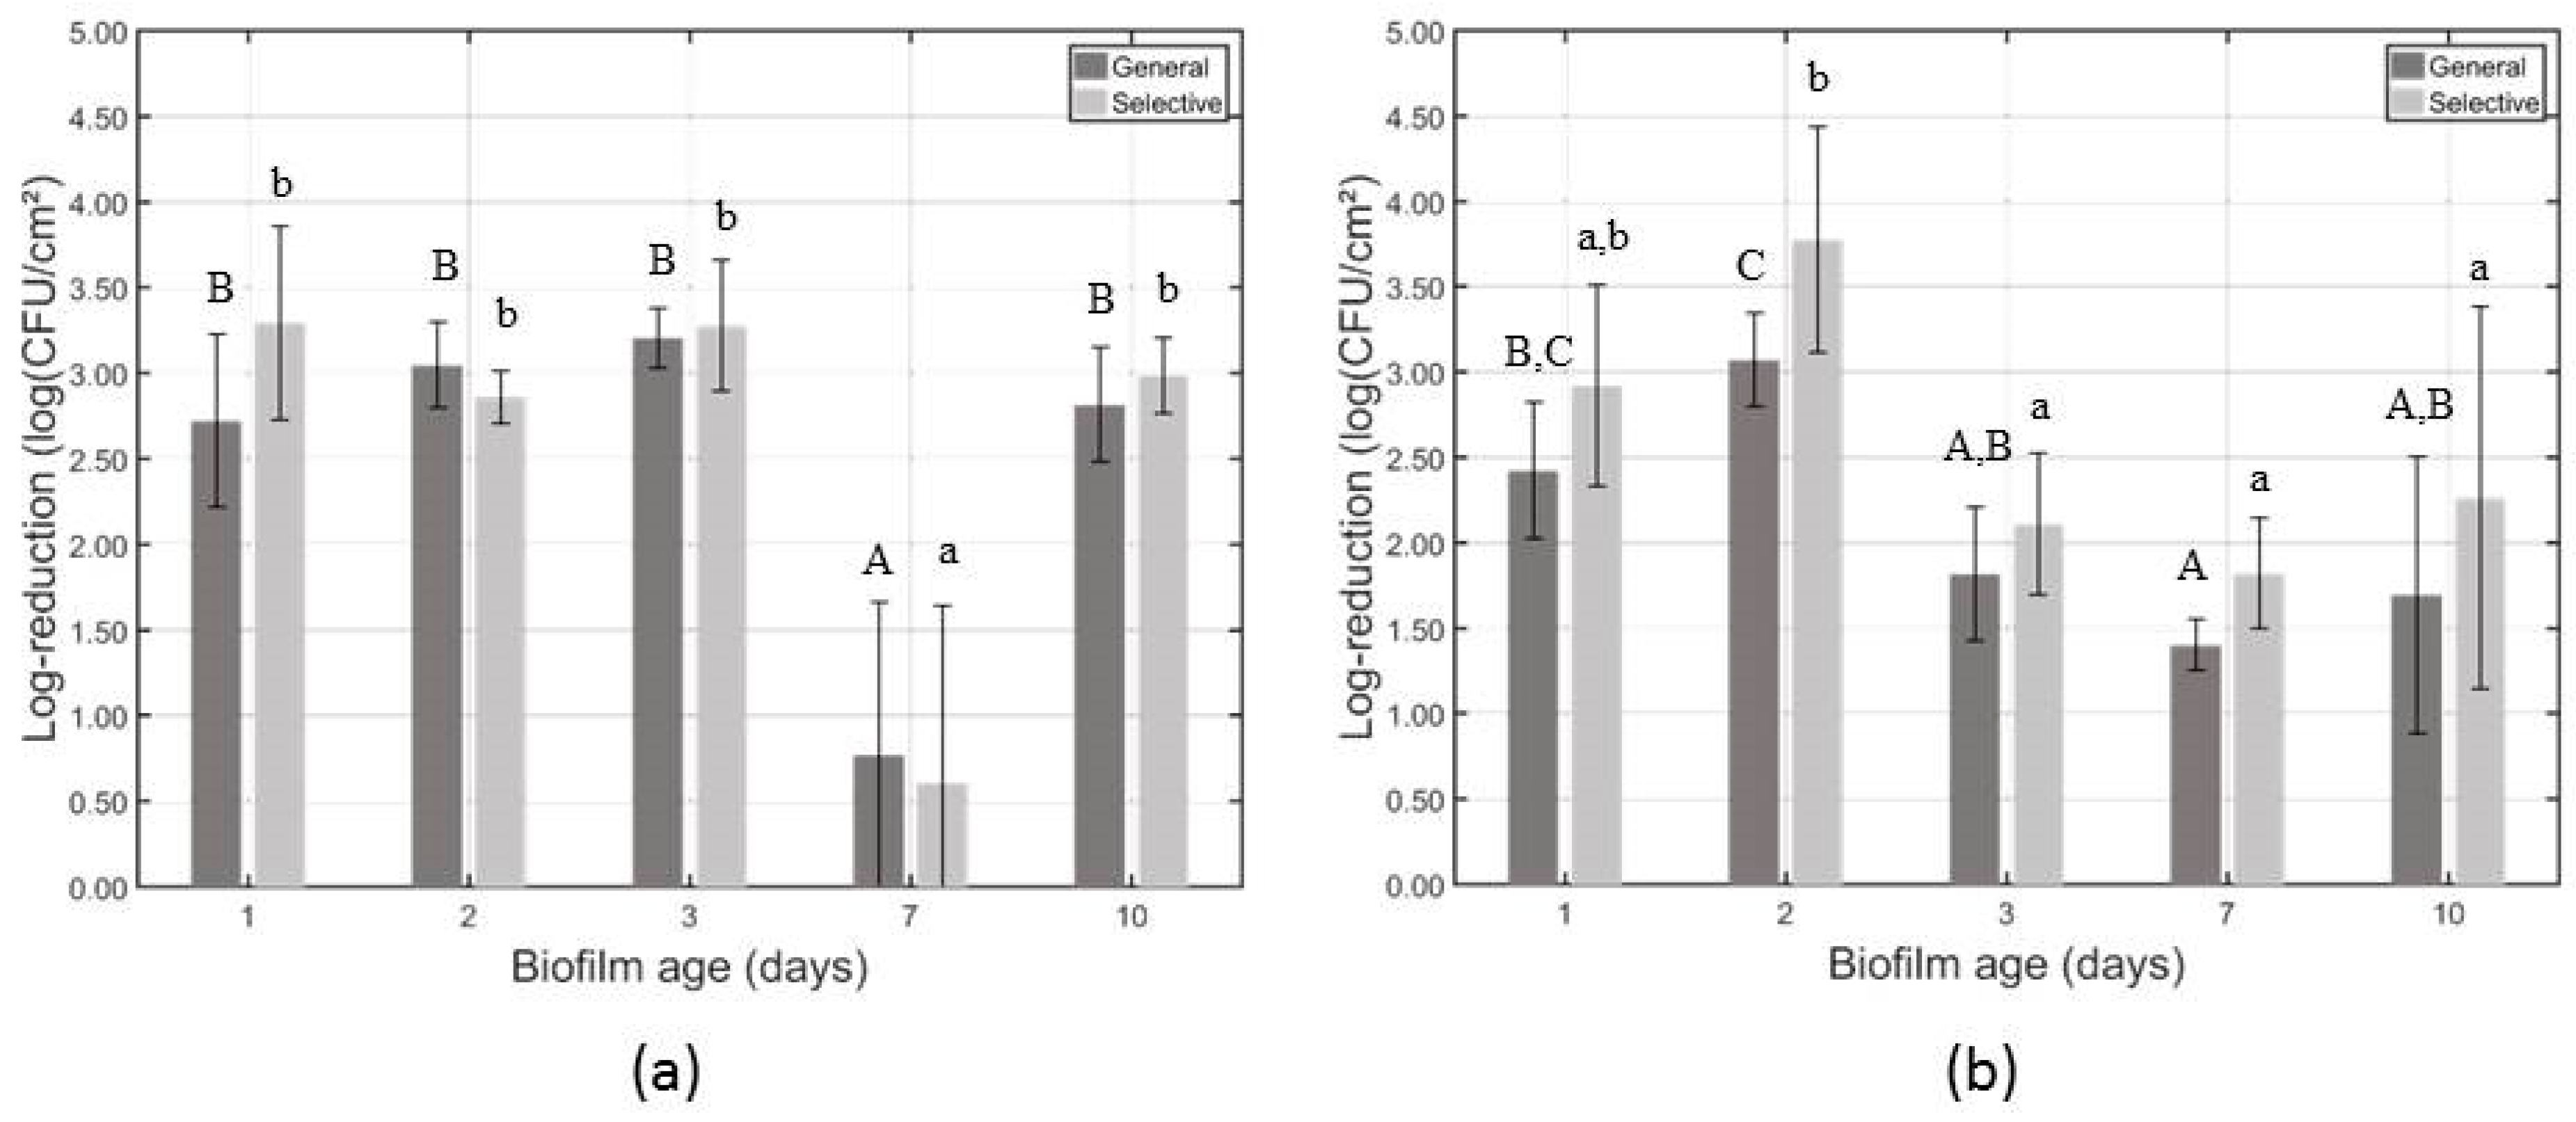
3.2. Influence of the Biofilm Age on the CAP Efficacy Following 10 min of Treatment

In this section, the log-reductions obtained following 10 min of CAP treatment of the different biofilm ages (i.e., 1, 2, 3, 5, and 7 day(s) old) will be compared for both pathogenic species. The log-reductions have been calculated based on the cell densities of the untreated biofilms and the remaining cell densities following 10 min of CAP treatment. Results have been presented in Figure 4a and Figure 4b for L. monocytogenes and S. Typhimurium, respectively.
To the best of the authors’ knowledge, only Ziuzina et al. [16] studied the effect of the biofilm age on the CAP inactivation efficacy for (S. Typhimurium, L. monocytogenes, and Escherichia coli) biofilms before. In that research, it could be concluded that biofilms become more resistant towards CAP treatment as the biofilm ages. Nevertheless, in contrary to the currently presented research, these biofilms were grown on real food products (small pieces of lettuce) and not on abiotic (food) contact surfaces. In addition, only two biofilm ages were compared, i.e., 24 and 48 h old biofilms, which are still two relatively young biofilm ages. Due to the novelty of the presented research, observations within the following paragraphs will be explained based on general biofilm characteristics and/or biofilm inactivation studies with (conventional) antimicrobial agents, although the inactivation mechanism differs.
Based on the results that are presented in Figure 4a, it can be concluded that significantly lower log-reductions are obtained for the seven days old L. monocytogenes biofilms, and this for both the general and the selective medium. This means that the CAP inactivation efficacy is significantly lower for the seven days old biofilms or, in other words, that the L. monocytogenes biofilm-associated cells become more resistant towards CAP inactivation as the biofilm ages. For the 10 days old biofilms, however, the log-reductions are again similar to those obtained for the 1, 2, and 3 day(s) biofilms, meaning that the resistance towards CAP treatment decreases again.
For the S. Typhimurium biofilms (Figure 4b), similar observations can be made, i.e., following CAP treatment of the 1, 2, and 3 day(s) old biofilms, the obtained log-reductions do not significantly decrease (compared to the one-day old reference biofilms), meaning that the biofilm resistance does not increase up until this biofilm age. However, following 2 days of incubation, it should be mentioned that the obtained log-reductions are significantly higher than the ones obtained for the 3 days old biofilms. As the S. Typhimurium biofilm ages even more, i.e., following 7 days of incubation, the log-reductions following 10 min of CAP treatment decrease compared to the one-day old (reference) biofilms, although only significantly for the general medium. This means that the 7 days old biofilms become more resistant towards CAP treatment. Nevertheless, as for L. monocytogenes, the CAP resistance decreases again for the 10 days old biofilms, i.e., log-reductions obtained for the latter biofilm age are similar to the ones obtained for the one-day old (reference) biofilms.
The higher resistance of the seven days old L. monocytogenes biofilms can be explained based on the difference in biomass between this biofilm age and the one-day old (reference biofilms), i.e., the OD of the 7 days old biofilms is much higher than the one of the reference biofilms due to a higher amount of produced EPS (Section 3.1). This higher amount of EPS following seven days of incubation probably limits the diffusion of the plasma species into the biofilm, and, consequently, protects the biofilm-associated cells [15]. In addition, it has been reported by Donlan [39] that the increased production of EPS results in nutrient and oxygen gradients within the biofilm, affecting the cell metabolism and the growth rates. As mentioned previously [2], antimicrobial agents are in general more effective towards actively growing cells. Therefore, the biofilm-associated cells of the seven days old L. monocytogenes biofilms might be more resistant towards those plasma species that are still able to (slowly) penetrate the biofilm. For the S. Typhimurium biofilms, however, the higher resistance towards CAP treatment of the seven days old biofilms cannot be the result of a difference in amount of EPS, since the OD following crystal violet staining was similar for all tested biofilm ages (Section 3.1). Nevertheless, the EPS matrix could still be involved in the increased biofilm resistance. In the research done by Wood et al. [40], the influence of the biofilm age on the structure and density of oral plaque biofilms was investigated by means of Confocal Laser Scanning Microscopy (CLSM). It could be concluded that the oral plaque biofilms became denser with an increased biofilm age. A similar phenomenon could be at the basis of the increased resistance of the seven days old S. Typhimurium biofilms. Although there is no increase in biomass, the biofilm might have collapsed, limiting the diffusion of the plasma species into the (lower layers of the) biofilm. In addition, in the research of Wood et al. [40], it was mentioned that the higher density of the biofilm can result in nutrient and oxygen limitations. Similar to the results that were obtained for the L. monocytogenes biofilms, this could result in an altered growth rate and a lower susceptibility towards the created CAP species.
The results for the CAP treatment of the 10 days old L. monocytogenes and S. Typhimurium biofilms are rather surprising, i.e., for both species, it was expected that the 10 days old biofilms would (at least) be equally resistant towards the CAP treatment as the seven days old biofilms, since for both species, the seven and 10 days old biofilms had a similar OD (Section 3.1). To the best of the authors’ knowledge, no explanation has been found in literature for the contradictory results obtained within the presented research. Further research, e.g., by means of gene expression analysis and/or CLSM, will be required to further investigate this phenomenon.

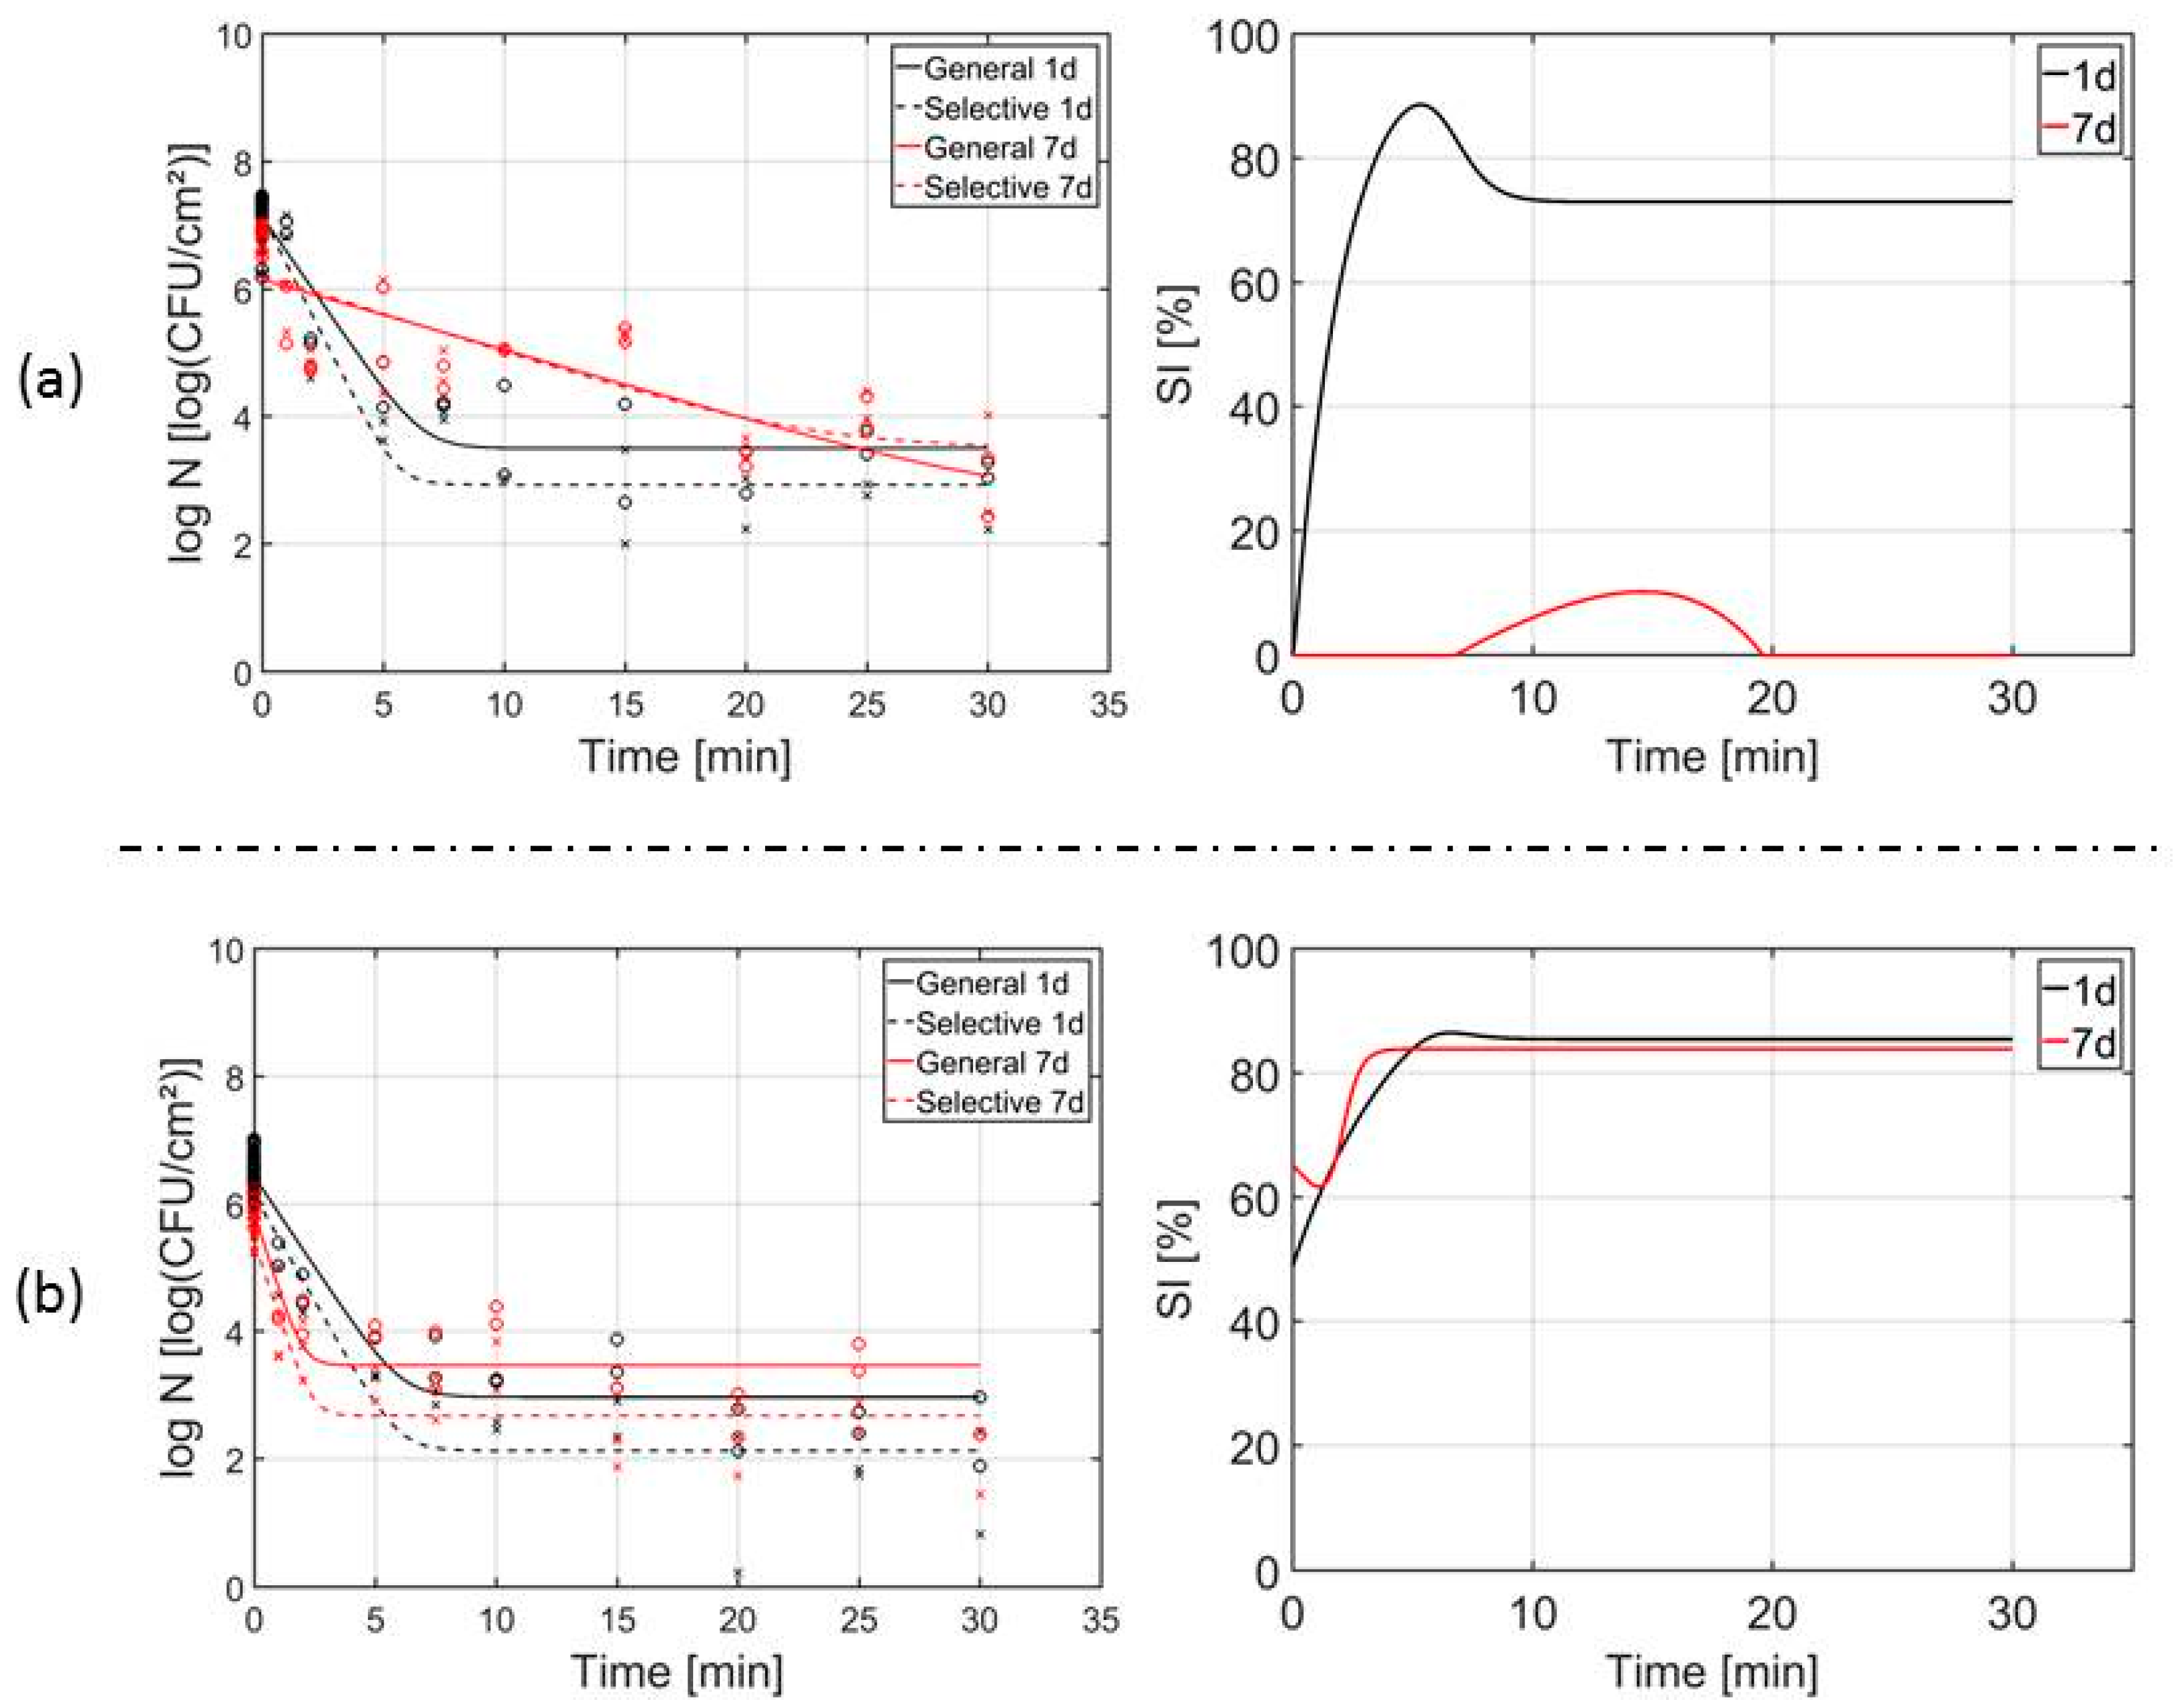
3.3. Influence of the Biofilm Age on the Inactivation Kinetics

Based on the results obtained for the cell densities prior to CAP treatment (Figure 3a,b) and the log-reductions following 10 min of CAP treatment (Figure 4a,b), it has been decided to investigate the influence of the biofilm age on the CAP inactivation kinetics. The kinetics for the one-day old L. monocytogenes and S. Typhimurium biofilms have been discussed in detail in the research of Govaert et al. [17] and will be compared in the presented research with the inactivation kinetics of the 7 days old biofilms. The latter biofilm age has been selected based on (i) the difference in total biofilm mass compared to the one-day old biofilm (for L. monocytogenes), (ii) the lower cell densities (prior to CAP treatment) obtained following this incubation time (for both species), and (iii) the significantly lower log-reductions that were obtained following 10 min of CAP treatment (for both species). The cell densities of the one and seven day(s) old biofilms as function of the CAP treatment time have been plotted in Figure 5a and Figure 5b for L. monocytogenes and S. Typhimurium, respectively. The percentage of sub-lethally injured cells as function of the CAP treatment time can be observed as well in these figures. For each of the microorganisms and each of the biofilm ages, the estimated model parameters of the Geeraerd et al. [27] model have been presented in Table 1.
Based on the inactivation curves in Figure 5a and the estimated model parameters in Table 1, several conclusions can be drawn with respect to the influence of the biofilm age on the inactivation kinetics of CAP treatment for L. monocytogenes biofilms.
First of all, the initial cell density (prior to CAP treatment) of the seven days old L. monocytogenes biofilm is significantly lower than the one obtained for the one-day old biofilm (on both media), which has been discussed already in Section 3.1 (Figure 2a). In addition, the cells that are present in the one and seven day(s) old biofilms are not sub-lethally injured prior to treatment, which can be observed as well in previously mentioned Section 3.1, i.e., initial cell densities (prior to CAP treatment) are similar on both media.
Secondly, it can be observed as well that the inactivation curves for the seven days old biofilms (on both the general and the selective medium) are differently shaped than the ones obtained for the one-day old biofilms. In the former case, there is only a log-linear inactivation phase, while in the latter case, a shorter log-linear inactivation phase is followed by a tail. This means that further inactivation of the seven days old biofilms would still be possible if the treatment time would be prolonged. This is not possible for the one-day old biofilms, since a residual cell density is reached due to the presence of a more resistant sub-population within the biofilm. Nevertheless, the inactivation rate for the seven days old biofilms is significantly lower than the one for the one-day old biofilms, meaning that a longer treatment time is required for the former biofilm age in order to obtain a similar log-reduction as for the latter biofilm age. For this reason, significant differences between the log-reductions have been observed in Figure 3a, where one and seven day(s) old biofilms were treated for only 10 min (Section 3.2). As mentioned before, the latter phenomenon is probably the result of a limited/slower diffusion of the plasma species into the biofilm.
Thirdly, if the final cell densities (Nres) that were obtained following 30 min of CAP treatment are compared with each other, no significant differences can be observed between both biofilm ages. In other words, the CAP inactivation efficacy decreases in terms of required treatment time, i.e., a prolonged treatment time is required as the biofilm ages due to a slower penetration of the CAP species, but the same (residual) final population can still be obtained. Due to the higher initial cell density (N0) for the one-day old biofilm, however, higher log-reductions can be obtained for this biofilm age as compared to the seven days old biofilms, although only significantly for the selective medium.
Finally, with respect to the percentage of sub-lethal injury as function of the treatment time, differences can again be observed between both biofilm ages. For the one-day old biofilms, the percentage of sub-lethally injured cells increases rapidly until a maximum percentage of approximately 90% is obtained following 7.5 min of CAP treatment. After this, the percentage of sub-lethal injury declines again until a residual percentage of approximately 75% is obtained. Important to mention is that the maximum percentage of sub-lethal injury coincides with the end of the log-linear inactivation phase, suggesting a mechanism of injury accumulation eventually resulting in cell lysis [23,41]. For the seven days old biofilms, the percentage of sub-lethal injury remains constant (at 0%) until 8 min of CAP treatment, meaning that no sub-lethal injury is induced during the beginning of the treatment. Upon further treatment, the percentage increases until a maximum of approximately 10% is reached following 15 min of CAP treatment. Next, the percentage of sub-lethal injury decreases again until it reaches 0%. For this biofilm age, the maximum percentage of sub-lethal injury does not coincide with the end of the log-linear inactivation phase. However, since the maximum percentage of sub-lethal injury is relatively low, it is more likely that the peak in sub-lethal injury would be the result of experimental variability and not due to the CAP treatment.
As for L. monocytogenes, several observations can be drawn for the influence of the biofilm age on the S. Typhimurium inactivation kinetics (Figure 5b and Table 1).
First of all, differences can be observed between the initial cell density (N0) of the one and seven day(s) old biofilms, i.e., the cell density decreases as the biofilm ages, although not significantly. This is in contradiction with the results that were obtained in Section 3.1, however, this might be the result of experimental/biological variability or due to the model fit. When the percentages of sub-lethally injured cells prior to treatment are compared, it can be observed that this percentage slightly increases with an increased biofilm age, which might be the result of nutrient limitations and/or waste accumulation [38]. Nevertheless, this small difference could also be the result of experimental variability.
When the shapes of the inactivation curves are compared, it can be observed that for both the one and seven day(s) old biofilms, a log-linear inactivation phase is followed by a tail. Thus, for both biofilm ages, a prolonged treatment would not result in higher log-reductions, i.e., a more resistant sub-population is present within the biofilms. In addition, no significant differences can be observed for the inactivation rates (kmax) obtained for both biofilm ages. This was to be expected, since no significant differences between the OD values of the one and seven days old biofilms were observed in Section 3.1 (Figure 2b). Nevertheless, the duration of the log-linear inactivation phase is shorter for the seven days old biofilms, i.e., for this biofilm age, the tail phase already starts following approximately 3 min of CAP treatment. For the one-day old biofilms on the other hand, CAP treatment up to 7.5 min is required to reach this tail phase.
The combined effect of (i) no significant differences between the kmax values obtained for both biofilm ages and (ii) the shorter duration of the log-linear inactivation phase for the seven days old S. Typhimurium biofilms results in an increased resistance of the seven days old S. Typhimurium biofilms following 10 min of CAP treatment (Section 3.2). As mentioned before, this increased resistance might be the result of a limited penetration of the CAP species, i.e., they cannot reach the lower layers of the biofilm and/or an altered growth rate of the biofilm-associated cells [15,40].
Following 30 min of CAP treatment, the residual S. Typhimurium population (Nres) of the seven days old biofilms is similar to the one for the one-day old biofilms, and this for both the general and the selective medium. However, the average values for the one-day old S. Typhimurium biofilms are (slightly) higher. Due to this (non-significant) difference in Nres combined with the (non-significant) difference for N0, significant differences between the final log-reductions (obtained following 30 min of treatment) are obtained, i.e., higher log-reductions are obtained for the one-day old S. Typhimurium biofilms. This means that the CAP inactivation efficacy for S. Typhimurium biofilms decreases as the biofilm ages due to the previously mentioned phenomena.
Finally, comparing the percentage of sub-lethal injury as function of the CAP treatment time, a similar shape of the curves can be observed for both S. Typhimurium biofilm ages. There is an initial percentage of sub-lethal injury (50–65%), which increases immediately until approximately 3 and 7.5 min of CAP treatment for the one and seven day(s) old biofilms, respectively. For the former biofilm age, the percentage of sub-lethal injury remains constant (approximately 85%) when the CAP treatment is prolonged. For the latter biofilm age, the percentage decreases very slightly until a similar value is obtained as for the one-day old biofilms. As for the one-day old L. monocytogenes biofilms, the maximum percentage in sub-lethal injury coincides again (for both S. Typhimurium biofilm ages) with the end of the log-linear inactivation phase. The fact that the percentage does not (or almost not) decrease anymore upon further treatment is important to take into account, since this might result in an underestimation of the remaining biofilm cell density if only selective media are used during the microbial assessment of (food) contact surfaces. The sub-lethally injured cells might recover if they re-encounter a favorable environment, and consequently, cause public health concerns [23].

4. Conclusions

The goal of this research was to investigate the influence of the biofilm age on (i) the total biofilm mass of the untreated biofilms, (ii) the cell density of the biofilms prior to CAP treatment, (iii) the CAP efficacy for biofilm inactivation following 10 min of treatment, and (iv) the CAP inactivation kinetics. For L. monocytogenes, the total biofilm mass of the untreated biofilms increased following seven and 10 days of incubation (without medium refreshment), indicating an increased production of EPS matrix. For S. Typhimurium, on the other hand, the biofilm mass was independent of the biofilm age. For both biofilm forming species, the cell density prior to CAP treatment decreased following seven and 10 days of incubation, which is most likely due to starvation and/or waste accumulation. In addition, for both species, the biofilms became more resistant towards CAP treatment as the biofilm age increased up to seven days. For L. monocytogenes, this was the result of the increased amount of EPS matrix, while for S. Typhimurium, it was hypothesized that this might be the result of collapsing of the biofilm structure. Finally, the biofilm age had an influence on the CAP inactivation kinetics for L. monocytogenes, i.e., the increased biofilm age (seven days) resulted in a slower inactivation rate when compared to the one-day old reference biofilm. Nevertheless, following a treatment of 30 min, similar residual cell densities and log-reductions were obtained for both tested L. monocytogenes biofilm ages. For the S. Typhimurium biofilms, the biofilm age had only an influence on the final log-reduction following 30 min of CAP treatment, which was probably the result of the collapsed biofilm structure.

Author Contributions

Individual contributions of each of the authors to the research are the following: conceptualization, M.G., C.S., M.B. and J.V.I.; methodology, M.G.; software, M.G.; validation, M.G.; formal analysis, M.G.; investigation, M.G. and B.E.; resources, J.L.W. and J.V.I.; data curation, M.G.; writing—original draft preparation, M.G.; writing—review and editing, M.G., C.S., M.B., J.L.W. and J.V.I.; visualization, M.G.; supervision, M.G., C.S., M.B. and J.V.I.; project administration, M.G.; funding acquisition, J.V.I.

Funding

This work was supported by project C24/18/046 of the KU Leuven Research Council and by the Fund for Scientific Research-flanders, project G.0863.18.

Conflicts of Interest

The authors declare no conflict of interest.

References

  1. Costerton, J.W.; Stewart, P.S.; Greenberg, E.P. Bacterial biofilms: A common cause of persistent infections. Science 1999, 284, 1318–1322. [Google Scholar] [CrossRef] [PubMed]
  2. Kumar, C.G.; Anand, S.K. Significance of microbial biofilms in food industry: A review. Int. J. Food Microbiol. 1998, 42, 9–27. [Google Scholar] [CrossRef]
  3. Garrett, T.R.; Bhakoo, M.; Zhang, Z. Bacterial adhesion and biofilms on surfaces. Prog. Nat. Sci. 2008, 18, 1049–1056. [Google Scholar] [CrossRef]
  4. Barry, D.M.; Kanematsu, H. Cooling Water. In Biofilm and Materials Science, 1st ed.; Kanematsu, H., Barry, D.M., Eds.; Springer International Publishing: Cham, Switzerland, 2015; pp. 79–84. ISBN 978-3-319-14564-8. [Google Scholar]
  5. Javaherdashti, R. Corrosion and Biofilm. In Biofilm and Materials Science, 1st ed.; Kanematsu, H., Barry, D.M., Eds.; Springer International Publishing: Cham, Switzerland, 2015; pp. 69–78. ISBN 978-3-319-14564-8. [Google Scholar]
  6. Kim, S.; Wei, C. Biofilms. In Decontamination of Fresh and Minimally Processed Produce, 1st ed.; Gómez-López, V.M., Ed.; John Wiley & Sons, Inc.: Ames, IA, USA, 2012; pp. 59–76. ISBN 978-0-8138-2384-3. [Google Scholar]
  7. Giaouris, E.; Heir, E.; Hébraud, M.; Chorianopoulos, N.; Langsrud, S.; Møretrø, T.; Habimana, O.; Desvaux, M.; Renier, S.; Nychas, G.J. Attachment and biofilm formation by foodborne bacteria in meat processing environments: Causes, implications, role of bacterial interactions and control by alternative novel methods. Meat Sci. 2014, 97, 298–309. [Google Scholar] [CrossRef] [PubMed]
  8. EFSA; ECDC. The European Union summary report on trends and sources of zoonoses, zoonotic agents and food-borne outbreaks in 2015. EFSA J. 2017, 14, 3991. [Google Scholar] [CrossRef]
  9. Jefferson, K.K. What drives bacteria to produce a biofilm? FEMS Microbiol. Lett. 2004, 236, 163–173. [Google Scholar] [CrossRef] [PubMed] [Green Version]
  10. Costerton, J.W.; Cheng, K.J.; Geesey, G.G.; Ladd, T.I.; Nickel, J.C.; Dasgupta, M.; Marrie, T.J. Bacterial biofilms in nature and disease. Annu. Rev. Microbiol. 1987, 41, 435–464. [Google Scholar] [CrossRef] [PubMed]
  11. Ciofu, O.; Tolker-Nielsen, T. Antibiotic Tolerance and Resistance in Biofilms. In Biofilm Infections, 1st ed.; Bjarnsholt, T., Jensen, P.Ø., Moser, C., Høiby, N., Eds.; Springer: New York, NY, USA, 2001; pp. 215–229. ISBN 978-1-489-98228-5. [Google Scholar]
  12. Anwar, H.; Costerton, J.W. Enhanced activity of combination of tobramycin and piperacillin for eradication of sessile biofilm cells of Pseudomonas aeruginosa. Antimicrob. Agents Chemother. 1990, 34, 1666–1671. [Google Scholar] [CrossRef] [PubMed]
  13. Fraud, S.; Maillard, J.Y.; Kaminski, M.A.; Hanlon, G.W. Activity of amine oxide against biofilms of Streptococcus mutans: A potential biocide for oral care formulations. J. Antimicrob. Chemother. 2005, 56, 672–677. [Google Scholar] [CrossRef]
  14. Stewart, S.P. Antimicrobial Tolerance in Biofilms. Microbiol. Spectr. 2015, 3, 1–30. [Google Scholar] [CrossRef]
  15. Jiang, S.; Chen, S.; Zhang, C.; Zhao, X.; Huang, X.; Cai, Z. Effect of the Biofilm Age and Starvation on Acid Tolerance of Biofilm formed by Streptococcus mutans Isolated from Caries-Active and Caries-Free Adults. Int. J. Mol. Sci. 2017, 18, 713. [Google Scholar] [CrossRef] [PubMed]
  16. Ziuzina, D.; Han, L.; Cullen, P.J.; Bourke, P. Cold plasma inactivation of internalised bacteria and biofilms for Salmonella enterica serovar Typhimurium, Listeria monocytogenes and Escherichia coli. Int. J. Food Microbiol. 2015, 210, 53–61. [Google Scholar] [CrossRef] [PubMed]
  17. Govaert, M.; Smet, C.; Vergauwen, L.; Ećimović, E.; Walsh, J.L.; Baka, M.; Van Impe, J. Influence of plasma characteristics on the efficacy of Cold Atmospheric Plasma (CAP) for inactivation of Listeria monocytogenes and Salmonella Typhimurium biofilms. Innov. Food Sci. Emerg. Technol. 2018, 2018, 221–228. [Google Scholar]
  18. Fernández, A.; Thompson, A. The inactivation of Salmonella by cold atmospheric plasma treatment. Food Res. Int. 2012, 45, 678–684. [Google Scholar] [CrossRef]
  19. Banu, M.S.; Sasikala, P.; Dhanapal, A.; Kavitha, V.; Yazhini, G.; Rajamani, L. Cold plasma as a novel food processing technology. IJETED 2012, 4, 803–818. [Google Scholar]
  20. Misra, N.N.; Tiwari, B.K.; Raghavarao, K.S.M.S.; Cullen, P.J. Nonthermal Plasma Inactivation of Food-Borne Pathogens. Food Eng. Rev. 2011, 3, 159–170. [Google Scholar] [CrossRef] [Green Version]
  21. Patil, S.; Bourke, P.; Cullen, P.J. Principles of Nonthermal Plasma Decontamination. In Cold Plasma in Food and Agriculture—Fundamentals and Applications, 1st ed.; Misra, N.N., Schlüter, O.K., Cullen, P.J., Eds.; Elsevier Inc.: London, UK, 2016; pp. 143–178. ISBN 978-0-12-801365-6. [Google Scholar]
  22. Wuytack, E.Y.; Phuong, L.D.; Aertsen, A.; Reyns, K.M.; Marquenie, D.; De Ketelaere, B.; Masschalck, B.; Van Opstal, I.; Diels, A.M.; Michiels, C.W. Comparison of sublethal injury induced in Salmonella enterica serovar Typhimurium by heat and by different nonthermal treatments. J. Food Prot. 2003, 66, 31–37. [Google Scholar] [CrossRef] [PubMed]
  23. Noriega, E.; Velliou, E.; Van Derlinden, E.; Mertens, L.; Van Impe, J.F. Effect of cell immobilization on heat-induced sublethal injury of Escherichia coli, Salmonella Typhimurium and Listeria innocua. Food Microbiol. 2013, 36, 355–364. [Google Scholar] [CrossRef] [PubMed]
  24. Wang, X.; Devlieghere, F.; Geeraerd, A.; Uyttendaele, M. Thermal inactivation and sublethal injury kinetics of Salmonella enterica and Listeria monocytogenes in broth versus agar surface. Int. J. Food Microbiol. 2017, 243, 70–77. [Google Scholar] [CrossRef] [PubMed]
  25. Govaert, M.; Smet, C.; Baka, M.; Janssens, T.; Van Impe, J. Influence of incubation conditions on the formation of model biofilms by Listeria monocytogenes and Salmonella Typhimurium on abiotic surfaces. J. Appl. Microbiol. 2018, 125, 1890–1900. [Google Scholar] [CrossRef] [PubMed]
  26. Miles, A.A.; Misra, S.S.; Irwin, J.O. The estimation of bactericidal power of the blood. J. Hyg. (Lond.) 1938, 38, 732–749. [Google Scholar] [CrossRef] [PubMed]
  27. Geeraerd, A.H.; Herremans, C.H.; Van Impe, J.F. Structural model requirements to describe microbial inactivation during a mild heat treatment. Int. J. Food Microbiol. 2000, 59, 185–209. [Google Scholar] [CrossRef]
  28. Busch, S.V.; Donnelly, C.W. Development of a repair-enrichment broth for resuscitation of heat-injured Listeria monocytogenes and Listeria innocua. Appl. Environ. Microbiol. 1992, 58, 14–20. [Google Scholar] [PubMed]
  29. Peeters, E.; Nelis, H.J.; Coenye, T. Comparison of multiple methods for quantification of microbial biofilms grown in microtiter plates. J. Microbiol. Methods 2008, 72, 157–165. [Google Scholar] [CrossRef] [PubMed] [Green Version]
  30. Kaplan, J.B. Biofilm dispersal: Mechanisms, clinical implications, and potential therapeutic uses. J. Dent. Res. 2010, 89, 205–218. [Google Scholar] [CrossRef] [PubMed]
  31. Marshall, K.C. Adhesion and growth of bacteria at surfaces in oligotrophic habitats. Can. J. Microbiol. 1988, 34, 503–506. [Google Scholar] [CrossRef]
  32. Lappin-Scott, H.M.; Bass, C. Biofilm formation: Attachment, growth, and detachment of microbes from surfaces. Am. J. Infect. Control 2001, 29, 250–251. [Google Scholar] [CrossRef] [PubMed]
  33. Stoodley, P.; Wilson, S.; Hall-Stoodley, L.; Boyle, J.D.; Lappin-Scott, H.M.; Costerton, J.W. Growth and detachment of cell clusters from mature mixed-species biofilms. Appl. Environ. Microbiol. 2001, 67, 5608–5613. [Google Scholar] [CrossRef] [PubMed]
  34. Boles, B.R.; Thoendel, M.; Singh, P.K. Rhamnolipids mediate detachment of Pseudomonas aeruginosa from biofilms. Mol. Microbiol. 2005, 57, 1210–1223. [Google Scholar] [CrossRef]
  35. Ma, L.; Conover, M.; Lu, H.; Parsek, M.R.; Bayles, K.; Wozniak, D.J. Assembly and development of the Pseudomonas aeruginosa biofilm matrix. PLoS Pathog 2009, 5, e1000354. [Google Scholar] [CrossRef]
  36. Simões, M.; Simões, L.C.; Vieira, M.J. A review of current and emergent biofilm control strategies. LWT-Food Sci. Technol. 2010, 43, 573–583. [Google Scholar] [CrossRef] [Green Version]
  37. Davies, D.G. Biofilm dispersion. In Biofilm Highlights, 1st ed.; Flemming, H.-C., Wingender, J., Szewzyk, U., Eds.; Springer-Verlag: Berlin/Heidelberg, Germany, 2011; Volume 5, pp. 1–28. [Google Scholar]
  38. Anwar, H.; Strap, J.L.; Costerton, J.W. Establishment of Aging Biofilms: Possible Mechanism of Bacterial Resistance to Antimicrobial Therapy. Antimicrob. Agents Chemother. 1992, 36, 1347–1351. [Google Scholar] [CrossRef] [PubMed]
  39. Donlan, R.M. Biofilms on Central Venous Catheters: Is Eradication Possible. In Current Topics in Microbiology and Immunology, 1st ed.; Romeo, T., Ed.; Springer-Verlag: Berlin/Heidelberg, Germany, 2008; Volume 322, pp. 133–162. ISBN 978-3-540-75417-6. [Google Scholar]
  40. Wood, S.R.; Kirkham, J.; Shore, R.C.; Brookes, S.J.; Robinson, C. Changes in the structure and density of oral plaque biofilms with increasing plaque age. FEMS Microbiol. Ecol. 2002, 39, 239–244. [Google Scholar] [CrossRef] [PubMed] [Green Version]
  41. Smet, C.; Noriega, E.; Rosier, F.; Walsh, J.L.; Valdramidis, V.P.; Van Impe, J.F. Influence of food intrinsic factors on the inactivation efficacy of cold atmospheric plasma: Impact of osmotic stress, suboptimal pH and food structure. Innov. Food Sci. Emerg. Technol. 2016, 38, 393–406. [Google Scholar] [CrossRef]
Figure 1. Dielectric Barrier Discharge (DBD) electrode: graphical illustration (left); set-up used in this study (middle); and close-up of the discharge (right).
Applsci 08 02702 g001
Figure 2. Total biofilm mass, expressed as optical density (-), for the untreated (a) L. monocytogenes and (b) S. Typhimurium biofilms following 1, 2, 3, 7, and 10 day(s) of incubation. For each species, bars bearing different lowercase letters are significantly different (p ≤ 0.05).
Applsci 08 02702 g002
Figure 3. Cell density (log(CFU/cm2)) determined on general and selective medium for the untreated (a) L. monocytogenes and (b) S. Typhimurium biofilms following 1, 2, 3, 7, and 10 day(s) of incubation. Bars bearing different letters (no capital or small letters in common for the general and the selective medium, respectively) are significantly different (p ≤ 0.05).
Applsci 08 02702 g003
Figure 4. Log-reductions (log(CFU/cm2)) obtained on general and selective medium for (a) L. monocytogenes and (b) S. Typhimurium biofilms treated for 10 min with Cold Atmospheric Plasma (CAP) at optimal inactivation conditions (i.e., DBD, 0.0 (v/v) % oxygen, 21.88 V input voltage). Bars bearing different letters (no capital or small letters in common for the general and the selective medium, respectively) are significantly different (p ≤ 0.05).
Applsci 08 02702 g004
Figure 5. Cell density (log(CFU/cm2)) as function of the treatment time following CAP treatment of the one and seven day(s) old biofilms at optimal CAP conditions for biofilm inactivation. Experimental data (symbols) and global fit (line) of the Geeraerd et al. [27] model: total viable population on general medium (o, solid line) and uninjured viable population on selective medium (x, dashed line) (left). Percentage (%) of sub-lethally injured cells as function of the treatment time for both investigated biofilm ages (i.e., one and seven day(s)) (right). (a) Results obtained following CAP treatment of the L. monocytogenes biofilms; (b) Results obtained following CAP treatment of the S. Typhimurium biofilms.
Applsci 08 02702 g005
Table 1. Estimated model parameters Geeraerd et al. [27] model for the inactivation curves of one and seven day(s) old L. monocytogenes and S. Typhimurium biofims. Results for the one-day old biofilms have been presented before in the research of Govaert et al. [17].
Model ParametersL. monocytogenesS. Typhimurium
One-Day Old7 Days OldOne-Day Old7 Days Old
1 Log10 N0 general medium (log(CFU/cm2))B 7.145 ± 0.071A 6.151 ± 0.220A 6.431 ± 0.068A 5.857 ± 0.229
1 Log10 N0 selective medium (log(CFU/cm2))B 7.154 ± 0.071A 6.218 ± 0.237A 6.140 ± 0.089A 5.397 ± 0.249
1kmax general medium (1/min)B 1.265 ± 0.142A 0.253 ± 0.057A 1.308 ± 0.154A 2.730 ± 0.785
1kmax selective medium (1/min)B 1.735 ± 0.172A 0.278 ± 0.078A 1.534 ± 0.198A 2.598 ± 0.687
1 Log10 Nres general medium (log(CFU/cm2))A 3.504 ± 0.133A 2.681 ± 1.710A 2.972 ± 0.125A 3.474 ± 0.158
1 Log10 Nres selective medium (log(CFU/cm2))A 2.935 ± 0.132A 3.501 ± 0.557A 2.134 ± 0.161A 2.680 ± 0.174
1 Log-reduction general medium (log(CFU/cm2))A 3.641 ± 0.150A 3.470 ± 1.724B 3.460 ± 0.143A 2.383 ± 0.278
1 Log-reduction selective medium (log(CFU/cm2))B 4.219 ± 0.149A 2.717 ± 0.606B 4.006 ± 0.184A 2.716 ± 0.304
RMSE general medium (/)0.43540.73300.41980.5714
RMSE selective medium (/)0.43290.76200.54680.6263
1 Influence biofilm age: for each microorganism and each growth medium, model parameters bearing different superscripts (no letters in common) are significantly different (p ≤ 0.05). Parameters bearing the lowest values have been indicated with ‘A’, while those bearing the highest values have been indicated with ‘B’.

