Predicting Human Behaviour with Recurrent Neural Networks


DeustoTech-Deusto Foundation, University of Deusto, Av. Universidades 24, 48007 Bilbao, Spain
*
Author to whom correspondence should be addressed.
†
These authors contributed equally to this work.
Appl. Sci. 2018, 8(2), 305; https://0-doi-org.brum.beds.ac.uk/10.3390/app8020305
Submission received: 15 December 2017
/
Revised: 25 January 2018
/
Accepted: 9 February 2018
/
Published: 20 February 2018
(This article belongs to the Special Issue Socio-Cognitive and Affective Computing)
Abstract
:As the average age of the urban population increases, cities must adapt to improve the quality of life of their citizens. The City4Age H2020 project is working on the early detection of the risks related to mild cognitive impairment and frailty and on providing meaningful interventions that prevent these risks. As part of the risk detection process, we have developed a multilevel conceptual model that describes the user behaviour using actions, activities, and intra- and inter-activity behaviour. Using this conceptual model, we have created a deep learning architecture based on long short-term memory networks (LSTMs) that models the inter-activity behaviour. The presented architecture offers a probabilistic model that allows us to predict the user’s next actions and to identify anomalous user behaviours.
1. Introduction
As a result of the growth of the urban population worldwide [1], cities are consolidating their position as one of the central structures in human organizations. This concentration of resources and services around cities offers new opportunities to be exploited. Smart cities [2,3] are emerging as a paradigm to take advantage of these opportunities to improve their citizens’ lives. Smart cities use the sensing architecture deployed in the city to provide new and disruptive city-wide services both to the citizens and the policy-makers. The large quantity of data available allows for improving the decision-making process, transforming the whole city into an intelligent environment at the service of its inhabitants. One of the target groups for these improved services is the “young–old” category, which comprises people aged from 60 to 69 [4] and that are starting to develop the ailments of old age. The early detection of frailty and mild cognitive impairments (MCI) is an important step to treat those problems. In order to do so, ambient assisted living (AAL) [5] solutions must transition from the homes to the cities.
City4Age is a H2020 research and innovation project with the aim of enabling age-friendly cities. The project aims to create an innovative framework of ICT tools and services that can be deployed by European cities in order to enhance the early detection of risk related to frailty and MCI, as well as to provide personalized interventions that can help the elderly population to improve their daily life by promoting positive behaviour changes. As part of the tools created for the framework, we have developed a series of algorithms for activity recognition and behaviour modelling. The recognized activities and the behaviour variations are then used to ascertain the frailty and MCI risks levels of the users. In the past, we have worked on creating single-user activity recognition algorithms for home environments [6,7,8], but in the case of City4Age, we have created algorithms that take into account both the large-scale scenarios of the project and the variation in the behaviours of the users.
In this paper, we present a conceptual classification of the user behaviour in intelligent environments according to the different levels of granularity used to describe it (Section 3). Using this classification, we also describe the algorithm developed to automatically model the inter-activity behaviour (Section 3). This algorithm uses long short-term memory networks (LSTMs) [9] to create a probabilistic model of user behaviour that can predict the next user action and detect unexpected behaviours. Our evaluation (Section 4) analyses different architectures for the creation of a statistical model of user behaviour.
2. Related Work
There are two main monitoring approaches for automatic human behaviour and activity evaluation, namely, vision- and sensor-based monitoring. For a review of vision-based approaches, [10] can be consulted. When approaching human behaviour and activity evaluation recognition in intelligent environments, sensor-based behaviour and activity evaluation are the most widely used solutions [11], as vision-based approaches tend to generate privacy concerns among the users [12]. Sensor-based approaches are based on the use of emerging sensor network technologies for behaviour and activity monitoring. The generated sensor data from sensor-based monitoring are mainly time series of state changes and/or various parameter values that are usually processed through data fusion, probabilistic or statistical analysis methods and formal knowledge technologies for activity recognition. There are two main approaches for sensor-based behaviour and activity recognition in the literature: data- and knowledge-driven approaches.
The idea behind data-driven approaches is to use data mining and machine learning techniques to learn behaviour and activity models. These are usually presented as a supervised learning approach, for which different techniques have been used to learn behaviours and activities from collected sensor data. Data-driven approaches need big datasets of labelled activities to train different kinds of classifiers. The learning techniques used in the literature are broad, from simple naive Bayes classifiers [13] to hidden Markov models [14], dynamic Bayesian networks [15], support vector machines [16] and online (or incremental) classifiers [17]. The knowledge-driven approaches try to use the existing domain knowledge in order to avoid using labelled datasets for the training. Rashidi and Cook [18] tried to overcome the problem of depending on manually labelled activity datasets by extracting activity clusters using unsupervised learning techniques. These clusters are used to train a boosted hidden Markov model, which is shown to be able to recognise several activities. Chen et al. [19] used logic-based approaches for activity recognition, on the basis of previous knowledge from the domain experts. Others have adopted ontology-based approaches, which allow for a commonly agreed explicit representation of activity definitions independent of algorithmic choices, thus facilitating portability, interoperability and reusability [20,21,22]. User behaviour in intelligent environments builds on user activities to describe the conduct of the user. Modelling user behaviour entails an abstraction layer over activity recognition. Behaviour models describe how specific users perform activities and what activities comprise their daily living. User behaviour prediction is an important task in intelligent environments. It allows us to anticipate user needs and to detect variations in behaviour that can be related to health risks. In the Mavhome project [23], the authors created algorithms to predict the users’ mobility patterns and their device usage. Their algorithms, based mainly on sequence matching, compression and Markov models [24], allowed the intelligent environments to adapt to the user needs. Other authors have used prediction methods to recognize the user activities in smart environments [16]. An analysis of the importance of prediction in intelligent environments can be found in [25]. Prediction has also been used in intelligent environments for the control of artificial illumination [26] using neuro-fuzzy systems or for the control of climate parameters on the basis of user behaviour [27]. A more in-depth analysis of the use of user behaviour prediction for comfort management in intelligent environments can be found in [28]. As explained in the following section, we identify two types of behaviours: intra-activity behaviour (which describes how the user performs activities) and inter-activity behaviour (which describes the actions and activity sequences that compose the user’s daily life). To model and predict the inter-activity behaviour, we use action sequences, as this allows us to have a fine-grained description of the user conduct while abstracting the model from specific sensor technology.
3. Actions, Activities and Behaviours
User behaviours are comprised of a large collection of defining elements, making them a complex structure. In order to properly describe it, we have defined a series of concepts on the basis of those proposed in [29]: actions, activities and behaviours. Actions describe the simplest conscious movements, while behaviours describe the most complex conduct (see Figure 1). We have extended the model proposed in [29] dividing the behaviours into two different types, intra-activity behaviours and inter-activity behaviours. This allows us to better model different aspects of the user’s behaviour.
The different elements of the user behaviour are the following:
- Actions are temporally short and conscious muscular movements made by the users (e.g., taking a cup, opening the fridge, etc.).
- Activities are temporally longer but finite and are composed of several actions (e.g., preparing dinner, taking a shower, watching a movie, etc.).
- Behaviours describe how the user performs these activities at different times. We have identified two types of behaviours. The intra-activity behaviours describe how a single activity is performed by a user at different times (e.g., while the user is preparing dinner, sometimes they may gather all the ingredients before starting, while on other occasions, the user may take them as they are needed). The inter-activity behaviours describe how the user chains different activities (e.g., on Mondays after having breakfast, the user leaves the house to go to work, but in the weekends they go to the main room).
The algorithm we present in this paper models the inter-activity behaviour, using actions to describe it. One of the characteristics of our algorithm is that it works on the action-space instead of the sensor-space. To be able to work with a more flexible representation of the information in the intelligent environments, we map the raw sensor data to actions [19]. Other authors have proved that actions are a suitable approach to model behaviours [30,31]. Using actions for behaviour recognition has also been tackled in the domain of plan and goal recognition. Hoey et al. [32] use the same definition of actions (short and conscious muscular movements) to analyse the hand-washing process of patients with dementia. In their case, the mapping is from a video to a set of actions. Krüger et al. [33] use actions to model activities using computational state-space models. In their case, the mapping is from inertial measurements to actions, and the actions are grouped in different classes. Although different types of sensors (video by Hoey et al., inertial measurements by Krüger et al., and binary sensors in our evaluation) and mapping methods are used, the same concept is present, working on the action-space instead of the sensor-space. The mapping procedure changes according to the sensors used.
The advantage of working on the action-space is that different sensor types may detect the same action type, simplifying and reducing the hypothesis space. This is even more important when using semantic embeddings to represent these actions in the model (as we explain in Section 3.1), as the reduced number of actions produces more significant embedding representations.
3.1. Semantic Embeddings for Action Representation
Traditionally in activity recognition or behaviour modelling tasks, the inputs (when using actions) have been represented as IDs, strings or one-hot vectors. The problem with this type of representation is that it does not contain any information about the action meaning. Using a one-hot vector alone, it is not possible to compute how similar two actions are, and this information is not available for the model that will use the actions. A similar problem occurs in the area of natural language processing (NLP) with the representation of words. The solution to this is to use embeddings [34] to represent the words, and we have used the same approach for the actions.
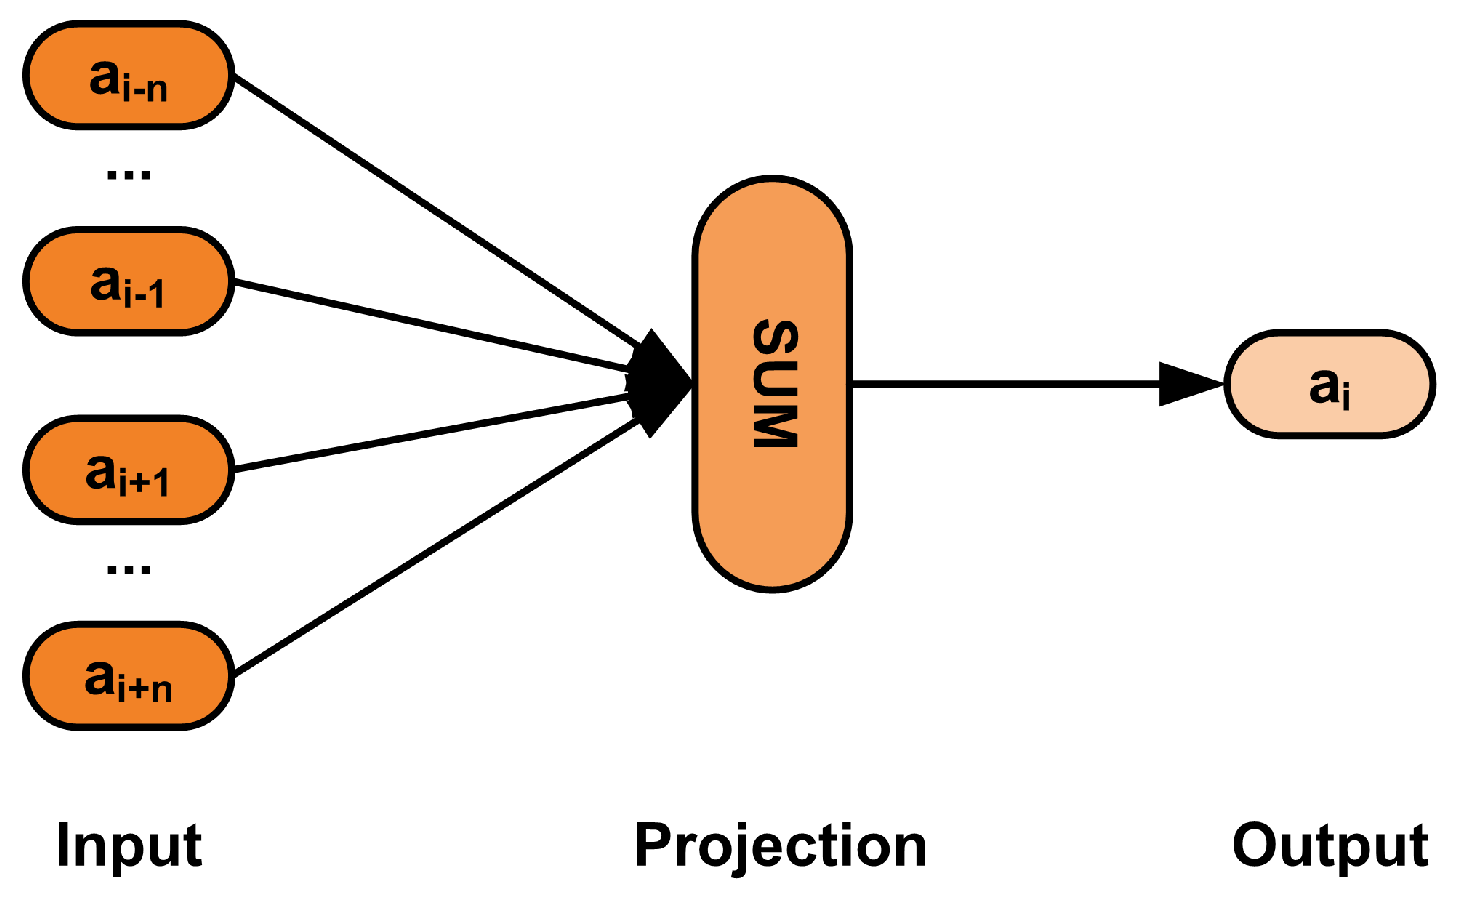
While one-hot vectors are sparse and the features of the model increase with the action dictionary size, embeddings are dense and more computationally efficient, with the number of features being constant, regardless of the number of action types. Most significantly for our model, embeddings provide semantic meaning to the representation of the actions. Each action is represented as a point in a multidimensional plane, which place them at a distance of the other actions, thus providing relations of similitude and significance between them. It is important to note that the system proposed in this paper does not compute explicitly the distances between the actions as an input for the model. Figure 2 shows an example of action embeddings. Given a sequence of actions , where is the sequence length and indicates the action vector of the ith action in the sequence, we let be the context of , where is the length of the context window. We let be the probability of the ith action in the sequence for action . The target of the model used to create the embeddings is to optimize the log maximum likelihood estimation (logMLE):
In our model, we use the Word2Vec algorithm proposed by Mikolov et al. [34] to calculate the embeddings, a widely used embedding model inspired originally by the neural network language model developed by Bengio et al. [35]. Word2Vec has been used successfully in recent years in very varied tasks, such as knowledge path extraction [36], sentiment analysis [37] or sentence classification [38]. This combination of positive results and an easy to perform unsupervised learning process are the reason why we have decided to use the Word2Vec algorithm. In our model, we use the Word2Vec implementation in Gensim to calculate the embedding values for each action in the dataset. Gensim is one of the most popular Python vector-space modelling libraries. We represent each action with a vector of 50 float values, because of the small number of action instances compared with the number of words that are usually used in NLP tasks. Instead of providing the values directly to our model, we have included an embedding layer as the input to the model. In this layer, we store the procedural information on how to transform an action ID to its embedding. Adding this layer allows us to train it with the rest of the model and, in this way, fine-tune the embedding values to the current task, improving the general accuracy of the model.
3.2. LSTM-Based Network for Behaviour Modelling
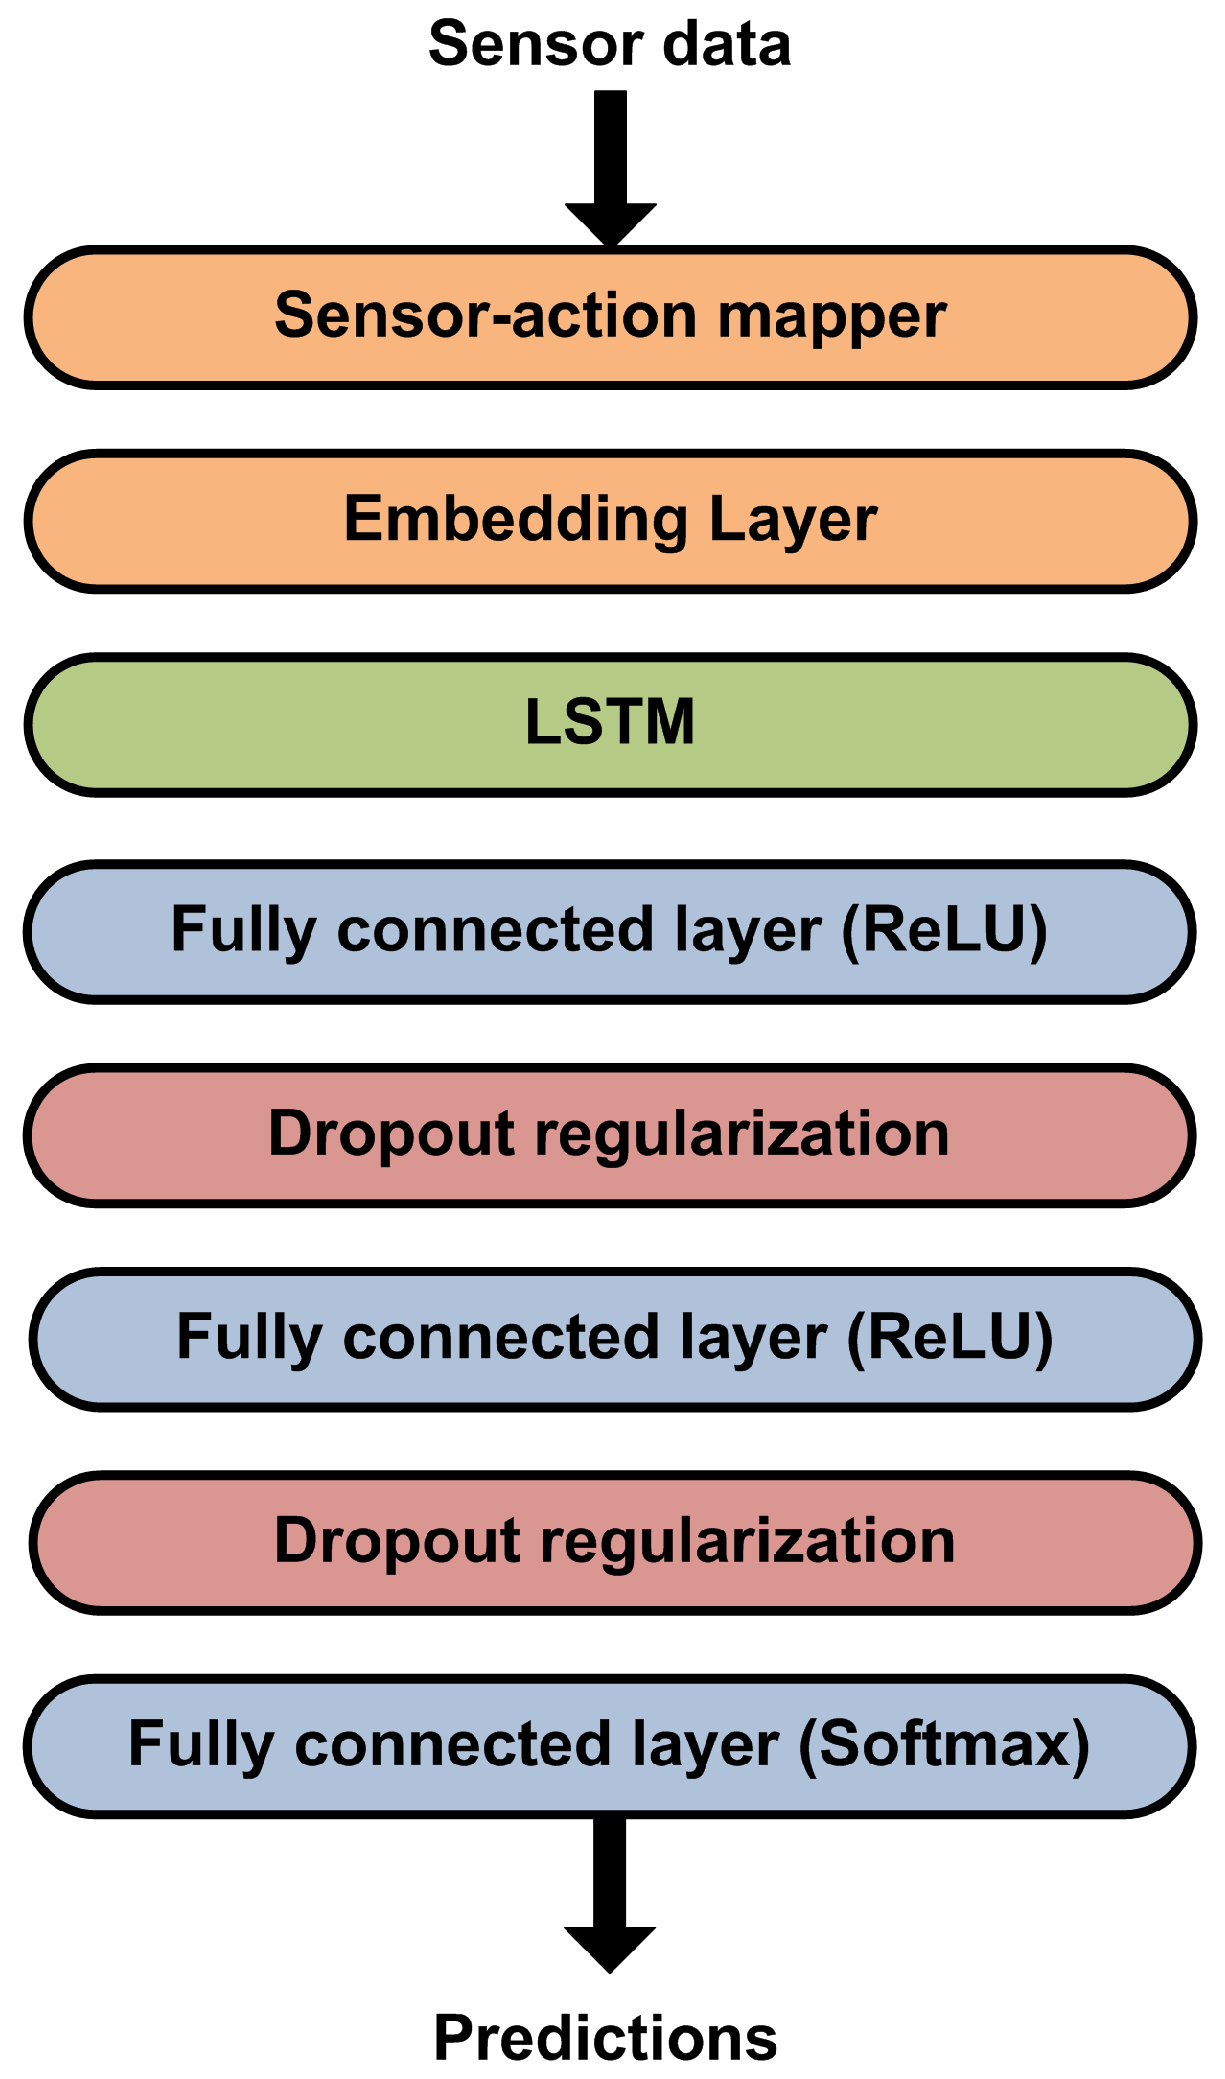
In order to create a probabilistic model for behaviour prediction, we have used a deep neural network architecture (https://github.com/aitoralmeida/c4a_behavior_recognition) (see Figure 3) based on recurrent neural networks, specifically on LSTMs [9]. LSTMs are universal, in the sense that they can theoretically compute anything that a computer can, given enough network units. These types of networks are particularly well suited for modelling problems in which temporal relations are relevant and the time gaps between the events are of unknown size. LSTMs have also been shown to be prepared for sequential data structures [39]. In inter-activity behaviour modelling, the prediction of the activity label for an action depends on the actions registered before. The recurrent memory management of LSTMs allows us to model the problem considering those sequential dependencies.
While the LSTMs are the central element of the proposed architecture, they can be divided into three different parts: the input module, the sequence modelling module and the predictive module. The input module receives raw sensor data and maps it to actions using previously defined equivalences [6]. These actions are then fed to the embedding layer. As discussed in Section 3.1, embeddings provide a more expressive and dense model for the actions. The embedding layer receives the action IDs and transforms them into embeddings with semantic meaning. This layer is configured as trainable, that is, able to learn during the training process. The layer weights are initialized using the values obtained by using the Word2Vec algorithm, as explained in the previous section. The action embeddings obtained in the input module are then processed by the sequence modelling module. As discussed before, LSTMs are the type of network layer most suitable to do this. The layer has a size of 512 network units.
Finally, after the LSTM layer, we have the predictive module, which uses the sequence models created by the LSTMs to predict the next action. This module is composed by densely connected layers with different types of activations. This is a standard design in deep neural models. These densely connected layers are those that learn to predict the next actions on the basis of the models extracted by the previous layers. First we use two blocks of densely connected layers with rectified linear unit (ReLU) activations [40]. ReLU activations are one of the most widely used activations for intermediate densely connected layers in both classification and prediction problems. Each of these layers has a size of 1024 network units. After the ReLU activation, we use dropout regularization [41] with a value of 0.8. Dropout regularization prevents the complex co-adaptations of the fully connected layers by ignoring randomly selected neurons during the training process. This prevents overfitting during the training process. Finally, we use a third fully connected layer with a softmax activation function to obtain the next action predictions. As we want to select the most probable actions for a given sequence, softmax activation is the natural choice for the output layer.
In Section 4, we describe and analyse the different architectures and configurations that we have evaluated, which include combinations of multiple LSTMs and fully connected layers.
4. Evaluation
4.1. Experimental Setup
In order to validate our algorithm, we have used the dataset published by Kasteren et al. [14]. The dataset has been selected because it is widely used in the activity recognition and intelligent environment literature. This allows other researchers working in both areas to better compare the results of this paper with their own work. The dataset is the result of monitoring a 26-year-old man in a three-room apartment where 14 binary sensors were installed. These sensors were installed in locations such as doors, cupboards, refrigerators, freezers or toilets. Sensor data for 28 days was collected for a total of 2120 sensor events and 245 activity instances. The annotated activities were the following: “LeaveHouse”, “UseToilet”, “TakeShower”, “GoToBed”, “Prepare Breakfast”, “Prepare Dinner” and “Get Drink”. In this specific case, the sensors were mapped one to one to actions, resulting in the following set of actions: “UseDishwasher”, “OpenPansCupboard”, “ToiletFlush”, “UseHallBedroomDoor”, “OpenPlatesCupboard”, “OpenCupsCupboard”, “OpenFridge”, “UseMicrowave”, “UseHallBathroomDoor”, “UseWashingmachine”, “UseHallToiletDoor”, “OpenFreezer”, “OpenGroceriesCupboard” and “UseFrontdoor”.
For the training process, the dataset was split into a training set (80% of the dataset) and a validation set (20% of the dataset) of continuous days. These sets were composed by the raw sensor data provided by Kasteren et al. In order to make the training process more streamlined, we apply the sensor to action mappings offline. This allows us to train the deep neural model faster while still having the raw sensor data as the input. To do the training, we use n actions as the input (as described in the sequence-length experiments) to predict the next action (see Section 4.2 for a description of how accuracy is evaluated). That is, the training examples are the sequences of actions, and the label is the next action that follows that sequence, being a supervised learning problem. The proposed architectures have been implemented using Keras and were executed using TensorFlow as the back-end. Each of the experiments was trained for 1000 epochs, with a batch size of 128, using categorical cross-entropy as the loss function and Adam [42] as the optimizer. After the 1000 epochs, we selected the best model using the validation accuracy as the fitness metric. The action embeddings were calculated using the full training set extracted from the Kasteren dataset and using the Word2Vec [34] algorithm, and the embedding layer was configured as trainable.
To validate the results of the architecture, we performed three types of experiments:
- Architecture experiments: we evaluated different architectures, varying the number of LSTMs and fully connected dense layers.
- Sequence length experiments: we evaluated the effects of altering the input action sequence length.
- Time experiments: we evaluated the effects of taking into account the timestamps of the input actions.
For the architecture experiments (see Table 1), we tried different dropout values (with a dropout regularization after each fully connected layer with a ReLU activation), different numbers of LSTM layers, different types of LSTM layers (normal and bidirectional [43]), different numbers of fully connected layers and different sizes of fully connected layers. We also compared using embeddings for the representation of the actions versus the more traditional approach of using one-hot vectors, in order to ascertain the improvements that the embeddings provide.
For the sequence-length experiments (see Table 2), we varied the length of the input action sequence in a network, but maintained the rest of the values to a dropout regularization of 0.8, one LSTM layer with a size of 512, two fully connected layers with ReLU activation with a size of 1024 and one final fully connected layer with softmax activation. This was the same configuration used in experiment A3.
Finally for the time experiments (see Figure 4), we tried different ways of taking into account the timestamps of the actions in the input sequence. We analysed three different options. In the first configuration (T1), we used two parallel LSTM layers, one for the action embeddings and the other for the timestamps, concatenating the results of both layers before the fully connected layers (late fusion strategy [44]). In the second configuration (T2), we concatenated the action embeddings and the timestamps before a single LSTM layer (early fusion strategy [44]). In the third configuration (T3), the embeddings were connected to an LSTM layer, whose output was concatenated with the timestamps and sent to another LSTM layer (slow fusion strategy [44]). All the configurations used a dropout regularization of 0.8, a LSTM layer size of 512, two fully connected layers with ReLU activation with a size of 1024 and one final fully connected layer with softmax activation, as in experiment A3. In all three architectures, the timestamps were represented as a two-position vector (), representing the time in a circle with a radius of 1 and centred at the (0,0) coordinate. The and values were calculated respectively as the cosine and sine of the angle :
where is the timestamp expressed as seconds since midnight and are the total seconds in a day. Using , is expressed as
and is expressed as
4.2. Metrics
To properly validate the predicting capabilities of the proposed architectures, we evaluated how they perform using the top-k accuracy. The top-k accuracy is a standard metric in different prediction and modelling tasks. The top-k accuracy (acc_at_k) is defined as
where is the expected action and is the set of the top k predicted actions; represents the scoring function; when the condition in the first part is true, the function value is 1; otherwise, the value is 0. In our case, if the ground-truth action is in the set of k predicted actions, the function value is 1. To evaluate our models, we provide the accuracy for k values of 1, 2, 3, 4 and 5.
4.3. Results and Discussion
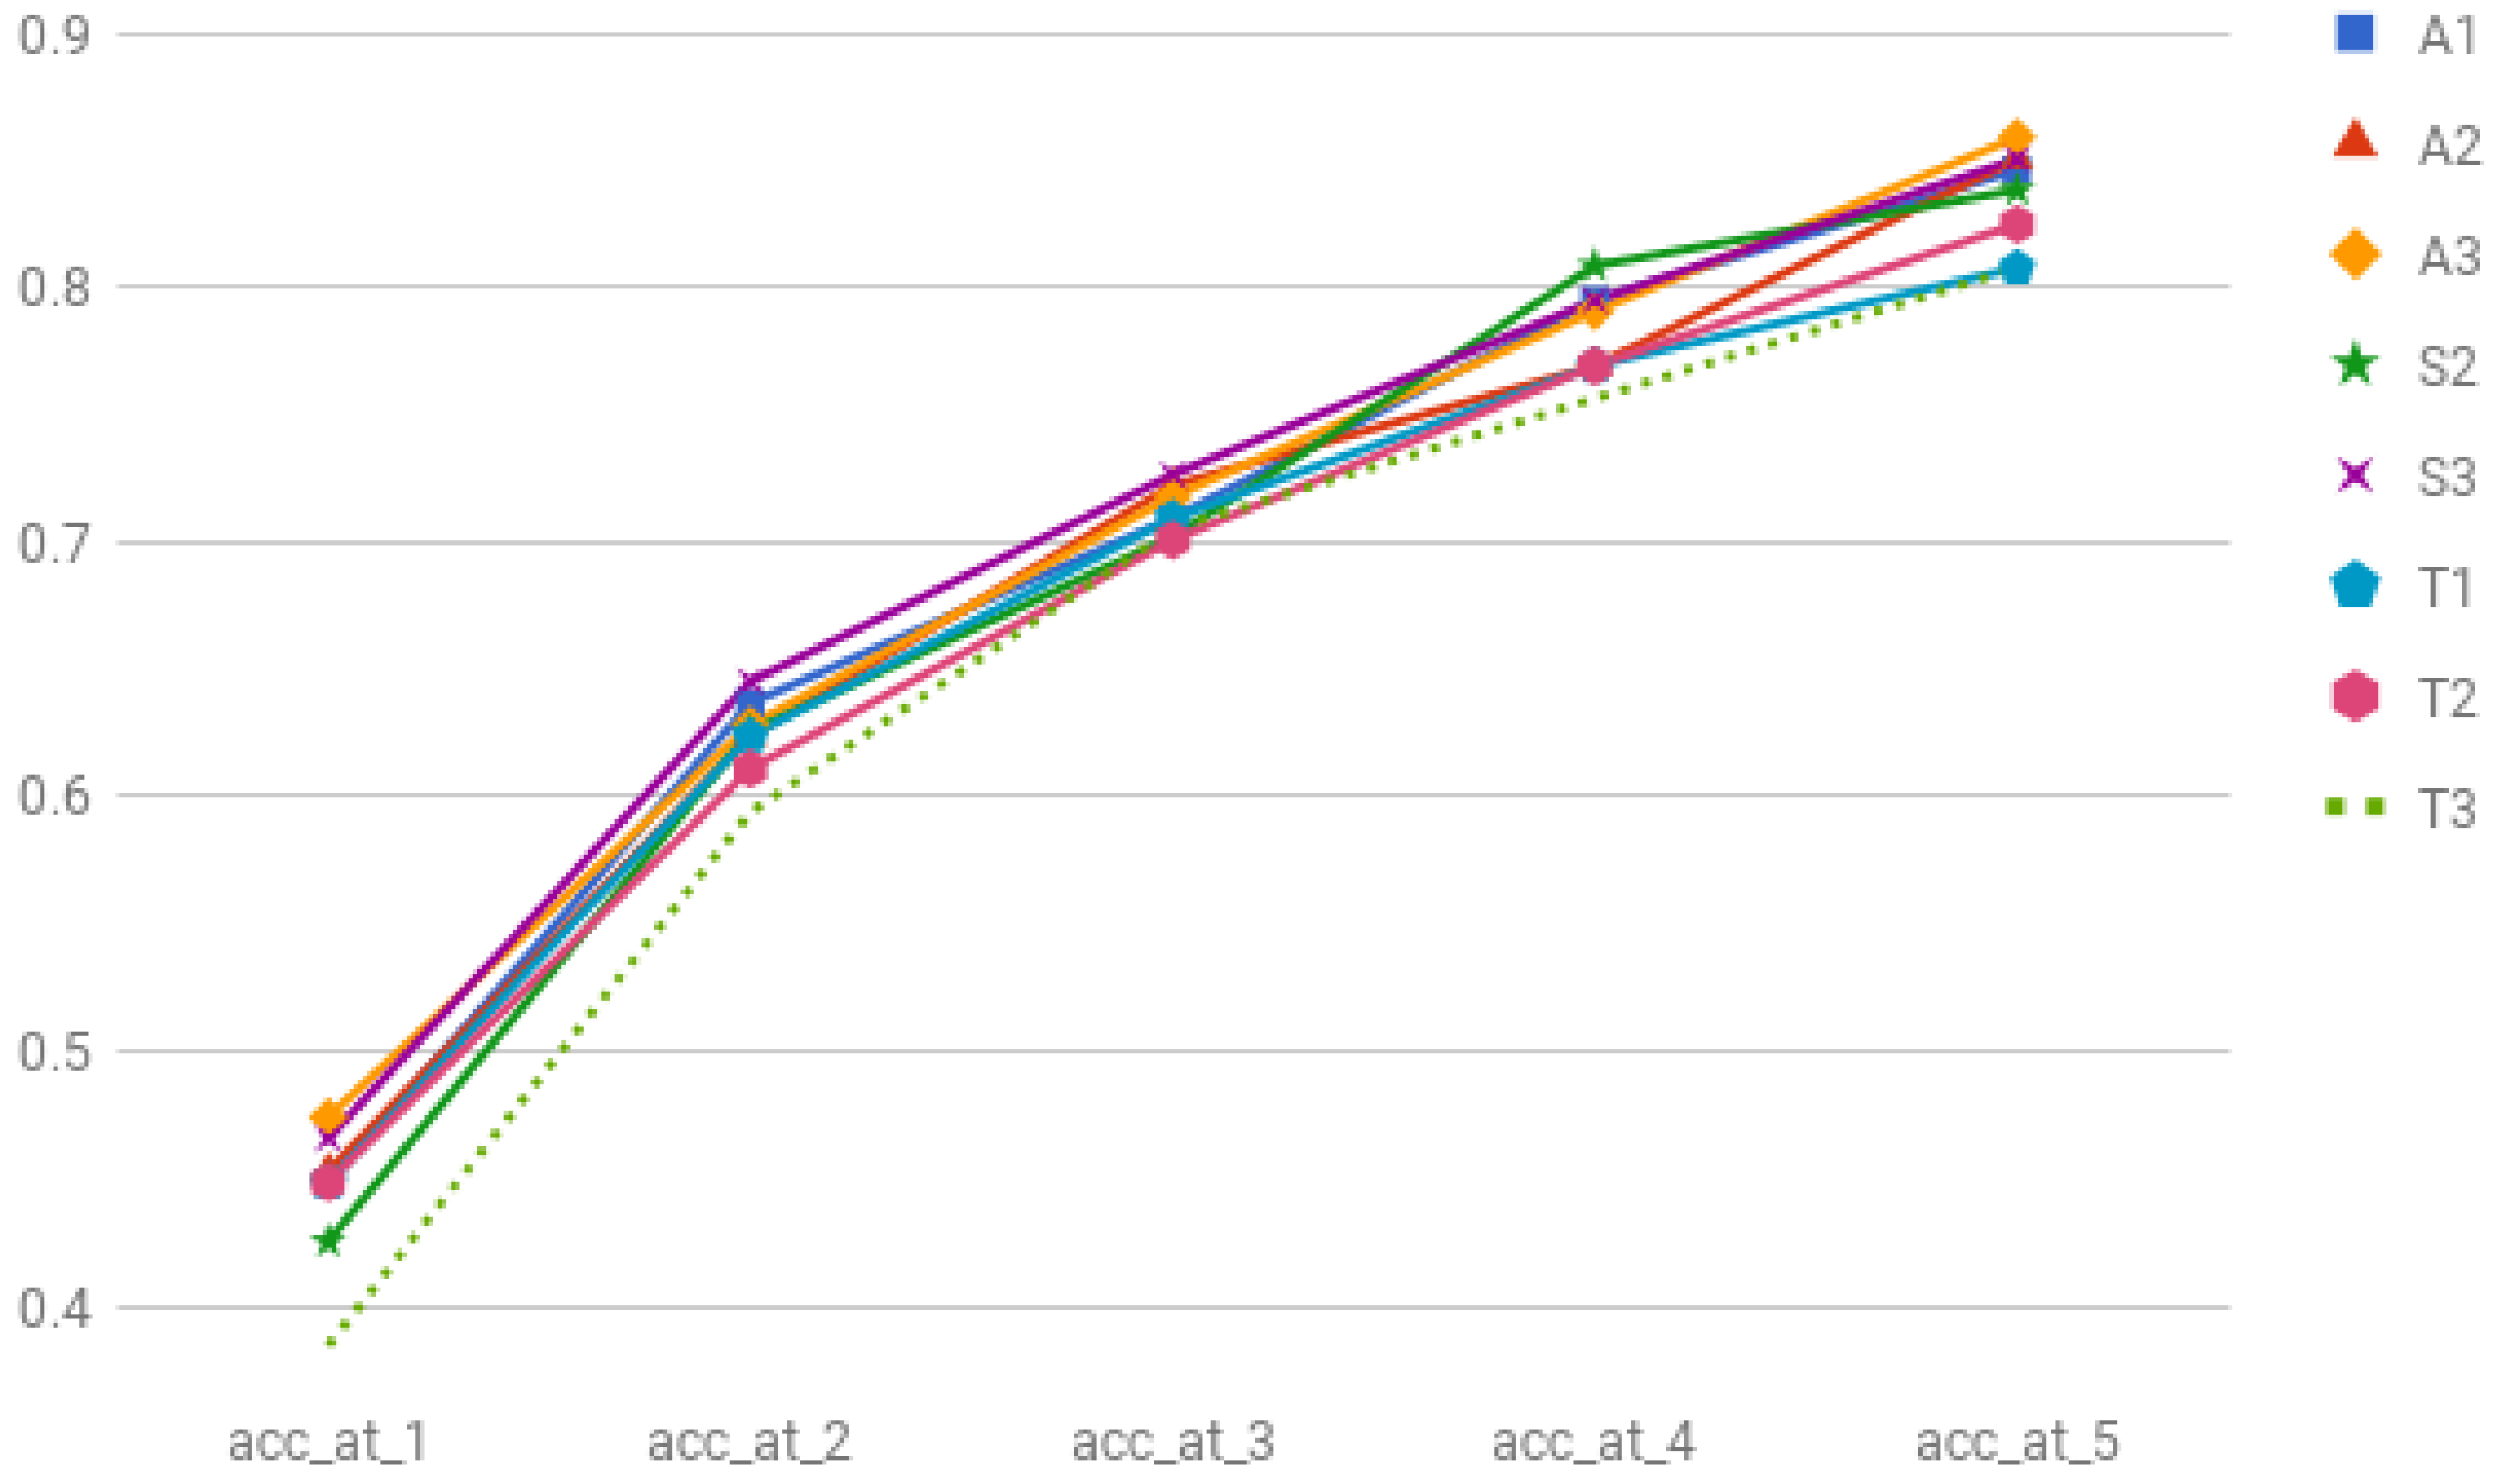
Table 3, Table 4 and Table 5 show the results for each type of experiment. In the case of the architecture experiments (Table 3), adding more LSTM layers (A4) or more smaller, densely connected layers (A5) reduced the overall accuracy of the model no matter the number of predictions. The usage of bidirectional LSTMs (A6) was also detrimental. Generally, higher dropout regularization values (A2 and A3) produced better results. Overall, the A3 configuration offered the best results across the board. As can be seen in the table, the use of embeddings obtained better results when compared to the same configurations using one-hot vectors (A3 vs. A7, A2 vs. A8 and A4 vs. A9). A more semantically rich representation of the actions allows the same architecture to better model the user behaviour. The advantage of using embeddings is that the training process to obtain them is completely unsupervised, not requiring a significant overheat when comparing them against other representation strategies such as one-hot vectors.
For the sequence-length experiments (Table 4), the best results were achieved using sequences with a length of 4 (S3) or 5 (A3) actions. In this specific case, the optimal sequence length was closely related with each deployment, being determined by the average action length of the activities in each scenario. This value should be adjusted in each specific case in order to achieve the best results, and it cannot be generalized.
Finally for the time experiments (Table 5), the evaluation shows that none of the proposed options to take into account the timestamps (T1, T2 and T3) improved the results. When comparing these with an architecture with a similar configuration and no timestamps (A3), the results were clearly worse. Our initial intuition was that taking into account the timestamps would help to model the temporal patterns in the actions, but the results show that this information is not so relevant for the behaviour modelling task. We expect that the temporal data will be much more relevant in the activity recognition task, particularly when discriminating between activity patterns with similar actions that happen at different periods (preparing breakfast vs. preparing dinner).
A summary of the best results can be seen in Figure 5.
5. Conclusions and Future Work
In this paper, we have proposed a multilevel conceptual model that describes the user behaviour using actions, activities, intra-activity behaviour and inter-activity behaviour Using this conceptual model, we have presented a deep learning architecture based on LSTMs that models inter-activity behaviour. Our architecture offers a probabilistic model that allows us to predict the user’s next actions and to identify anomalous user behaviours. We have evaluated several architectures, analysing how each one of them behaves for a different number of action predictions. The proposed behaviour model is being used in the City4Age H2020 project to detect the risks related to the frailty and MCI in young elders.
As future work, we plan to continue studying how the temporal and spatial information could be integrated into the architecture to improve the statistical model. We would like to explore other deep learning architectures, for example, using convolutional neural networks (CNNs) instead of LSTMs. Using CNNs, we intend to model the different action n-grams that occur in the inter-activity behaviour. This will allow us to compare different sequence modelling approaches using deep neural models. We also plan to develop architectures that will cover other aspects of the proposed multilevel conceptual model, starting with the activity recognition task. We plan to use the insights gained with the deep learning architectures proposed in this paper in order to create an activity recognition algorithm.
Acknowledgments
This work has been supported by the European Commission under the City4Age Project Grant Agreement (No. 689731). We gratefully acknowledge the support of the NVIDIA Corporation with the donation of the Titan X Pascal GPU used for this research.
Author Contributions
Aitor Almeida and Gorka Azkune conceived, designed and performed the experiments; analyzed the data; and wrote the paper.
Conflicts of Interest
The authors declare no conflict of interest.
References
- United Nations. World Urbanization Prospects: The 2014 Revision, Highlights; Department of Economic and Social Affairs, Population Division, United Nations: New York, NY, USA, 2014. [Google Scholar]
- Caragliu, A.; Del Bo, C.; Nijkamp, P. Smart cities in Europe. J. Urban Technol. 2011, 18, 65–82. [Google Scholar] [CrossRef]
- Shapiro, J.M. Smart cities: Quality of life, productivity, and the growth effects of human capital. Rev. Econ. Stat. 2006, 88, 324–335. [Google Scholar] [CrossRef]
- Forman, D.E.; Berman, A.D.; McCabe, C.H.; Baim, D.S.; Wei, J.Y. PTCA in the Elderly: The “Young-Old” versus the “Old-Old”. J. Am. Geriatr. Soc. 1992, 40, 19–22. [Google Scholar] [CrossRef] [PubMed]
- Rashidi, P.; Mihailidis, A. A survey on ambient-assisted living tools for older adults. IEEE J. Biomed. Health Inform. 2013, 17, 579–590. [Google Scholar] [CrossRef] [PubMed]
- Azkune, G.; Almeida, A.; L López-de-Ipiña, D.; Chen, L. Extending knowledge-driven activity models through data-driven learning techniques. Expert Syst. Appl. 2015, 42, 3115–3128. [Google Scholar] [CrossRef]
- Azkune, G.; Almeida, A.; López-de-Ipiña, D.; Chen, L. Combining users’ activity survey and simulators to evaluate human activity recognition systems. Sensors 2015, 15, 8192–8213. [Google Scholar] [CrossRef] [PubMed]
- Bilbao, A.; Almeida, A.; López-de-Ipiña, D. Promotion of active ageing combining sensor and social network data. J. Biomed. Inform. 2016, 64, 108–115. [Google Scholar] [CrossRef] [PubMed]
- Hochreiter, S.; Schmidhuber, J. Long short-term memory. Neural Comput. 1997, 9, 1735–1780. [Google Scholar] [CrossRef] [PubMed]
- Weinland, D.; Ronfard, R.; Boyer, E. A survey of vision-based methods for action representation, segmentation and recognition. Comput. Vis. Image Underst. 2011, 115, 224–241. [Google Scholar] [CrossRef]
- Chen, L.; Hoey, J.; Nugent, C.D.; Cook, D.J.; Yu, Z. Sensor-based activity recognition. IEEE Trans. Syst. Man Cybern. Part C (Appl. Rev.) 2012, 42, 790–808. [Google Scholar] [CrossRef]
- Yilmaz, A.; Javed, O.; Shah, M. Object tracking: A survey. ACM Comput. Surv. (CSUR) 2006, 38, 13. [Google Scholar] [CrossRef]
- Bao, L.; Intille, S.S. Activity recognition from user-annotated acceleration data. In Proceedings of the International Conference on Pervasive Computing, Linz and Vienna, Austria, 21–23 April 2004; Springer: Berlin/Heidelberg, Germany, 2004; pp. 1–17. [Google Scholar]
- Van Kasteren, T.; Noulas, A.; Englebienne, G.; Kröse, B. Accurate activity recognition in a home setting. In Proceedings of the 10th International Conference on Ubiquitous Computing, Seoul, Korea, 21–24 September 2008; ACM: New York, NY, USA, 2008; pp. 1–9. [Google Scholar]
- Oliver, N.; Garg, A.; Horvitz, E. Layered representations for learning and inferring office activity from multiple sensory channels. Comput. Vis. Image Underst. 2004, 96, 163–180. [Google Scholar] [CrossRef]
- Fatima, I.; Fahim, M.; Lee, Y.K.; Lee, S. A unified framework for activity recognition-based behavior analysis and action prediction in smart homes. Sensors 2013, 13, 2682–2699. [Google Scholar] [CrossRef] [PubMed]
- Ordóñez, F.J.; Iglesias, J.A.; De Toledo, P.; Ledezma, A.; Sanchis, A. Online activity recognition using evolving classifiers. Expert Syst. Appl. 2013, 40, 1248–1255. [Google Scholar] [CrossRef]
- Rashidi, P.; Cook, D.J. COM: A method for mining and monitoring human activity patterns in home-based health monitoring systems. ACM Trans. Intell. Syst. Technol. (TIST) 2013, 4, 64. [Google Scholar] [CrossRef]
- Chen, L.; Nugent, C.D.; Mulvenna, M.; Finlay, D.; Hong, X.; Poland, M. A logical framework for behaviour reasoning and assistance in a smart home. Int. J. Assist. Robot. Mechatron. 2008, 9, 20–34. [Google Scholar]
- Riboni, D.; Bettini, C. COSAR: Hybrid reasoning for context-aware activity recognition. Pers. Ubiquitous Comput. 2011, 15, 271–289. [Google Scholar] [CrossRef]
- Chen, L.; Nugent, C.D.; Wang, H. A knowledge-driven approach to activity recognition in smart homes. IEEE Trans. Knowl. Data Eng. 2012, 24, 961–974. [Google Scholar] [CrossRef]
- Aloulou, H.; Mokhtari, M.; Tiberghien, T.; Biswas, J.; Yap, P. An adaptable and flexible framework for assistive living of cognitively impaired people. IEEE J. Biomed. Health Inform. 2014, 18, 353–360. [Google Scholar] [CrossRef] [PubMed]
- Das, S.K.; Cook, D.J.; Battacharya, A.; Heierman, E.O.; Lin, T.Y. The role of prediction algorithms in the MavHome smart home architecture. IEEE Wirel. Commun. 2002, 9, 77–84. [Google Scholar] [CrossRef]
- Cook, D.J.; Youngblood, M.; Heierman, E.O.; Gopalratnam, K.; Rao, S.; Litvin, A.; Khawaja, F. MavHome: An agent-based smart home. In Proceedings of the First IEEE International Conference on Pervasive Computing and Communications, (PerCom 2003), Fort Worth, TX, USA, 26 March 2003; IEEE: Piscataway, NJ, USA, 2003; pp. 521–524. [Google Scholar]
- Cook, D.J.; Das, S.K. How smart are our environments? An updated look at the state of the art. Pervasive Mobile Comput. 2007, 3, 53–73. [Google Scholar] [CrossRef]
- Kurian, C.P.; Kuriachan, S.; Bhat, J.; Aithal, R.S. An adaptive neuro-fuzzy model for the prediction and control of light in integrated lighting schemes. Light. Res. Technol. 2005, 37, 343–351. [Google Scholar] [CrossRef]
- Morel, N.; Bauer, M.; El-Khoury, M.; Krauss, J. Neurobat, a predictive and adaptive heating control system using artificial neural networks. Int. J. Sol. Energy 2001, 21, 161–201. [Google Scholar] [CrossRef]
- Dounis, A.I.; Caraiscos, C. Advanced control systems engineering for energy and comfort management in a building environment—A review. Renew. Sustain. Energy Rev. 2009, 13, 1246–1261. [Google Scholar] [CrossRef]
- Chaaraoui, A.A.; Climent-Pérez, P.; Flórez-Revuelta, F. A review on vision techniques applied to human behaviour analysis for ambient-assisted living. Expert Syst. Appl. 2012, 39, 10873–10888. [Google Scholar] [CrossRef] [Green Version]
- Schank, R.C. Dynamic Memory: A Theory of Reminding and Learning in Computers and People; Cambridge University Press: Cambridge, UK, 1983. [Google Scholar]
- Schank, R.C.; Abelson, R.P. Scripts, Plans, Goals and Understanding, an Inquiry into Human Knowledge Structures; Lawrence Erlbaum Associates: Mahwah, NJ, USA, 1977. [Google Scholar]
- Hoey, J.; Poupart, P.; von Bertoldi, A.; Craig, T.; Boutilier, C.; Mihailidis, A. Automated handwashing assistance for persons with dementia using video and a partially observable Markov decision process. Comput. Vis. Image Underst. 2010, 114, 503–519. [Google Scholar] [CrossRef]
- Krüger, F.; Nyolt, M.; Yordanova, K.; Hein, A.; Kirste, T. Computational state space models for activity and intention recognition. A feasibility study. PLoS ONE 2014, 9, e109381. [Google Scholar] [CrossRef] [PubMed]
- Mikolov, T.; Sutskever, I.; Chen, K.; Corrado, G.S.; Dean, J. Distributed representations of words and phrases and their compositionality. In Advances in Neural Information Processing Systems; The MIT Press: Cambridge, MA, USA, 2013; pp. 3111–3119. [Google Scholar]
- Bengio, Y.; Ducharme, R.; Vincent, P.; Jauvin, C. A neural probabilistic language model. J. Mach. Learn. Res. 2003, 3, 1137–1155. [Google Scholar]
- Wang, Z.; Zhang, J.; Feng, J.; Chen, Z. Knowledge Graph Embedding by Translating on Hyperplanes. In Proceedings of the Twenty-Eighth AAAI Conference on Artificial Intelligence, Hilton, QC, Canada, 27–31 July 2014; pp. 1112–1119. [Google Scholar]
- Dos Santos, C.N.; Gatti, M. Deep Convolutional Neural Networks for Sentiment Analysis of Short Texts. In Proceedings of the COLING, the 25th International Conference on Computational Linguistics: Technical Papers, Dublin, Ireland, 23–29 August 2014; pp. 69–78. [Google Scholar]
- Kim, Y. Convolutional Neural Networks for Sentence Classification. 2014. arXiv:1408.5882. arXiv.org e-Print archive. Available online: https://arxiv.org/abs/1408.5882 (accessed on 15 December 2017).
- Lipton, Z.C.; Berkowitz, J.; Elkan, C. A Critical Review of Recurrent Neural Networks for Sequence Learning. 2015. arXiv:1506.00019. arXiv.org e-Print archive. Available online: https://arxiv.org/abs/1506.00019 (accessed on 15 December 2017).
- Glorot, X.; Bordes, A.; Bengio, Y. Deep Sparse Rectifier Neural Networks. In Proceedings of the Fourteenth International Conference on Artificial Intelligence and Statistics, PMLR, Ft. Lauderdale, FL, USA, 11–13 April 2011; Volome 15, No. 106. p. 275. [Google Scholar]
- Srivastava, N.; Hinton, G.E.; Krizhevsky, A.; Sutskever, I.; Salakhutdinov, R. Dropout: A simple way to prevent neural networks from overfitting. J. Mach. Learn. Res. 2014, 15, 1929–1958. [Google Scholar]
- Kingma, D.; Ba, J. Adam: A method for stochastic optimization. In Proceedings of the 3rd International Conference for Learning Representations, San Diego, CA, USA, 7–9 May 2015. [Google Scholar]
- Schuster, M.; Paliwal, K.K. Bidirectional recurrent neural networks. IEEE Trans. Signal Process. 1997, 45, 2673–2681. [Google Scholar] [CrossRef]
- Karpathy, A.; Toderici, G.; Shetty, S.; Leung, T.; Sukthankar, R.; Fei-Fei, L. Large-scale video classification with convolutional neural networks. In Proceedings of the IEEE Conference on Computer Vision and Pattern Recognition, Columbus, OH, USA, 23–28 June 2014; pp. 1725–1732. [Google Scholar]
Figure 1.
Elements of the user behaviour.

Figure 2.
Representation of actions as embeddings.

Figure 3.
Long short-term memory network (LSTM) for behaviour modelling.

Figure 4.
Architectures used in the time experiments. Each of the experiments used a different fusion strategy: T1 used late fusion, T2 used early fusion and T3 used slow fusion.
Figure 4.
Architectures used in the time experiments. Each of the experiments used a different fusion strategy: T1 used late fusion, T2 used early fusion and T3 used slow fusion.

Figure 5.
Best results in all the experiments.


Table 1.
Architecture experiments. Dropout is the value of the dropout regularizations. LSTM No. is the number of long short-term memory network (LSTM) layers in the architecture. LSTM size is the size of the LSTM layers. Dense No. is the number of fully connected layers with a rectified linear unit (ReLU) activation (all the architectures have a final fully connected layer with a softmax activation). Dense size is the size of the fully connected layers with a ReLU activation. Sequence length is the length of the input action sequence. Coding is the codifying strategy used for the actions, either embeddings or a one-hot vector.
| ID | Dropout | LSTM # | LSTM Size | Dense # | Dense Size | Sequence Length | Coding |
|---|---|---|---|---|---|---|---|
| A1 | 0.4 | 1 (Standard) | 512 | 1 | 1024 | 5 | Embedding |
| A2 | 0.8 | 1 (Standard) | 512 | 1 | 1024 | 5 | Embedding |
| A3 | 0.8 | 1 (Standard) | 512 | 2 | 1024 | 5 | Embedding |
| A4 | 0.8 | 2 (Standard) | 512 | 2 | 1024 | 5 | Embedding |
| A5 | 0.2 | 1 (Standard) | 512 | 5 | 50 | 5 | Embedding |
| A6 | 0.8 | 1 (Bidirectional) | 512 | 2 | 1024 | 5 | Embedding |
| A7 | 0.8 | 1 (Standard) | 512 | 2 | 1024 | 5 | One-hot vector |
| A8 | 0.8 | 1 (Standard) | 512 | 1 | 1024 | 5 | One-hot vector |
| A9 | 0.8 | 2 (Standard) | 512 | 2 | 1024 | 5 | One-hot vector |
Table 2.
Sequence-length experiments. Each experiment followed the same configuration used in A3 (see Table 1).
Table 2.
Sequence-length experiments. Each experiment followed the same configuration used in A3 (see Table 1).
| ID | Sequence Length |
|---|---|
| S1 | 3 |
| S2 | 1 |
| S3 | 4 |
| S4 | 6 |
| S5 | 10 |
| S6 | 30 |
Table 3.
Architecture experiments: Accuracy for different number of predictions.
| ID | acc_at_1 | acc_at_2 | acc_at_3 | acc_at_4 | acc_at_5 |
|---|---|---|---|---|---|
| A1 | 0.4487 | 0.6367 | 0.7094 | 0.7948 | 0.8461 |
| A2 | 0.4530 | 0.6239 | 0.7222 | 0.7692 | 0.8504 |
| A3 | 0.4744 | 0.6282 | 0.7179 | 0.7905 | 0.8589 |
| A4 | 0.4444 | 0.5940 | 0.6965 | 0.7735 | 0.8247 |
| A5 | 0.4402 | 0.5982 | 0.7136 | 0.7820 | 0.8418 |
| A6 | 0.4487 | 0.6068 | 0.7136 | 0.7905 | 0.8376 |
| A7 | 0.4572 | 0.6153 | 0.7094 | 0.7820 | 0.8376 |
| A8 | 0.4529 | 0.5811 | 0.7051 | 0.7735 | 0.8376 |
| A9 | 0.4102 | 0.5940 | 0.7008 | 0.7777 | 0.8247 |
Table 4.
Sequence-length experiments: Accuracy for different number of predictions.
| ID | acc_at_1 | acc_at_2 | acc_at_3 | acc_at_4 | acc_at_5 |
|---|---|---|---|---|---|
| A3 | 0.4744 | 0.6282 | 0.7179 | 0.7905 | 0.8589 |
| S1 | 0.4553 | 0.5957 | 0.7021 | 0.8 | 0.8553 |
| S2 | 0.4255 | 0.6255 | 0.7021 | 0.8085 | 0.8382 |
| S3 | 0.4658 | 0.6452 | 0.7264 | 0.7948 | 0.8504 |
| S4 | 0.4700 | 0.6196 | 0.6965 | 0.7692 | 0.8461 |
| S5 | 0.4592 | 0.6351 | 0.7210 | 0.7896 | 0.8369 |
| S6 | 0.4192 | 0.5589 | 0.6593 | 0.7554 | 0.8122 |
Table 5.
Time experiments: Accuracy for different number of predictions. The A3 experiment depicted in the first row did not use any time information.
Table 5.
Time experiments: Accuracy for different number of predictions. The A3 experiment depicted in the first row did not use any time information.
| ID | acc_at_1 | acc_at_2 | acc_at_3 | acc_at_4 | acc_at_5 |
|---|---|---|---|---|---|
| A3 | 0.4744 | 0.6282 | 0.7179 | 0.7905 | 0.8589 |
| T1 | 0.4487 | 0.6239 | 0.7094 | 0.7692 | 0.8076 |
| T2 | 0.4487 | 0.6111 | 0.7008 | 0.7692 | 0.8247 |
| T3 | 0.3846 | 0.5940 | 0.7051 | 0.7564 | 0.8076 |
© 2018 by the authors. Licensee MDPI, Basel, Switzerland. This article is an open access article distributed under the terms and conditions of the Creative Commons Attribution (CC BY) license (http://creativecommons.org/licenses/by/4.0/).
Share and Cite
MDPI and ACS Style
Almeida, A.; Azkune, G. Predicting Human Behaviour with Recurrent Neural Networks. Appl. Sci. 2018, 8, 305. https://0-doi-org.brum.beds.ac.uk/10.3390/app8020305
AMA Style
Almeida A, Azkune G. Predicting Human Behaviour with Recurrent Neural Networks. Applied Sciences. 2018; 8(2):305. https://0-doi-org.brum.beds.ac.uk/10.3390/app8020305
Chicago/Turabian StyleAlmeida, Aitor, and Gorka Azkune. 2018. "Predicting Human Behaviour with Recurrent Neural Networks" Applied Sciences 8, no. 2: 305. https://0-doi-org.brum.beds.ac.uk/10.3390/app8020305
Note that from the first issue of 2016, this journal uses article numbers instead of page numbers. See further details here.