Design and Construction of Oblique Prestressed Concrete Pavement: A Case Study in China

 and
and
Abstract
:Featured Application
Abstract
1. Introduction
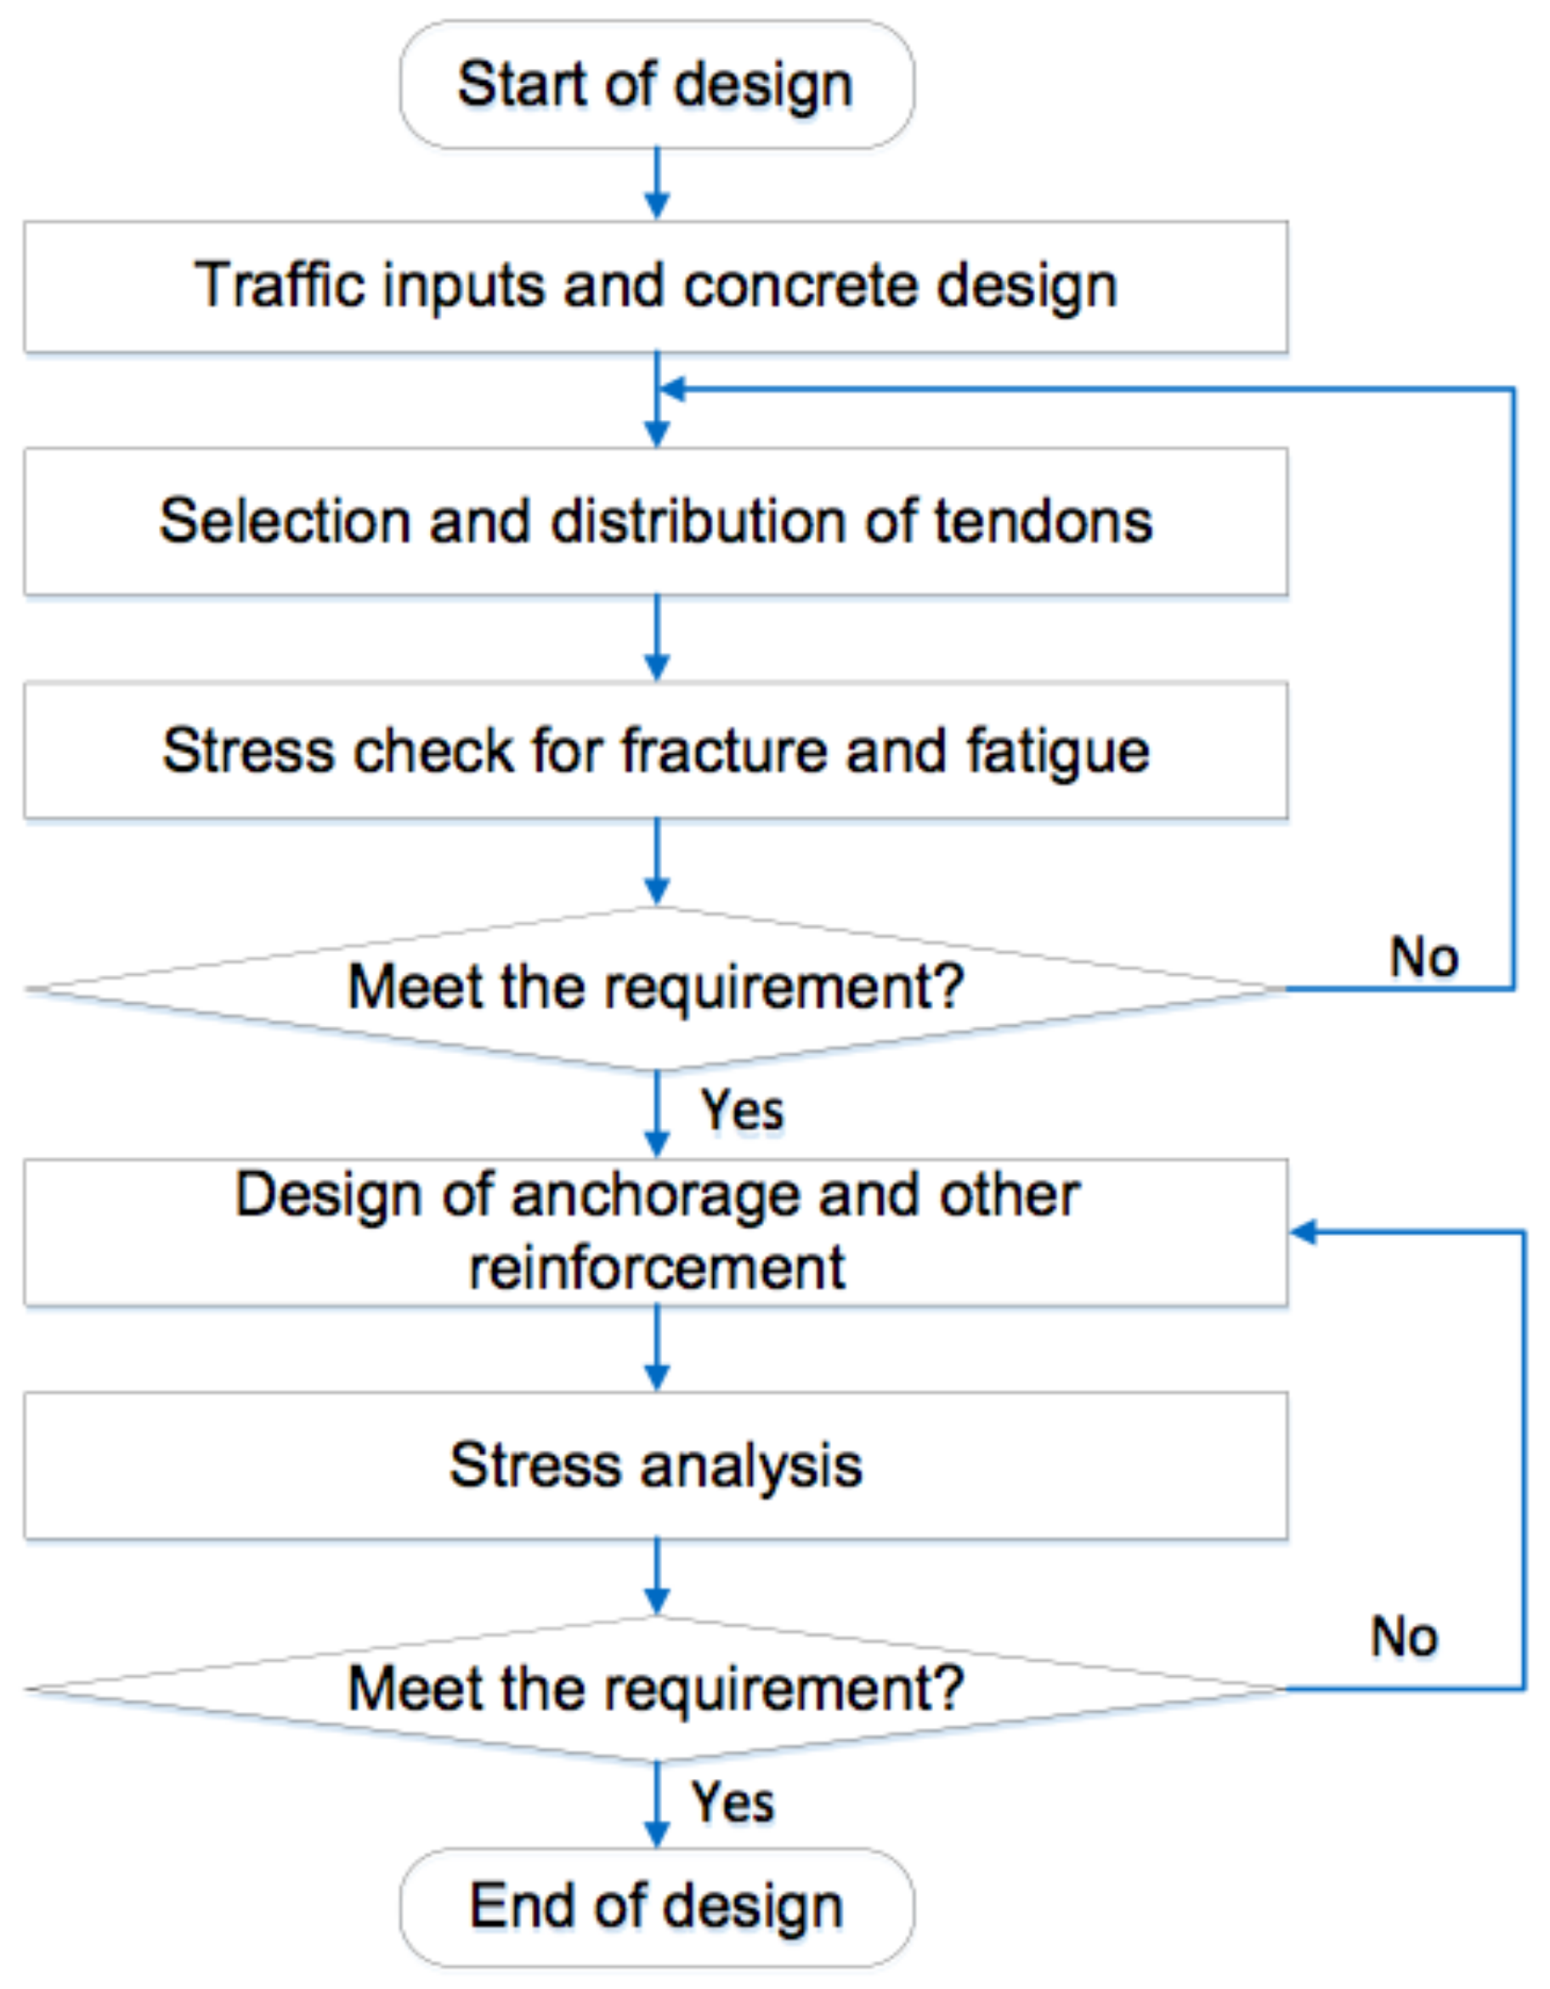
2. Methodology
3. Stress Analysis of Oblique Prestressed Concrete Slabs
3.1. Prestress Loss
- = the effective stress;
- = the value of prestress loss of item n (n = 1 to 5);
- = the tensioned control stress of prestressed reinforcement.
- (1)
- Prestress loss caused by the anchorage deformation and the shrinkage when tensioning the prestressed reinforcement, denoted as . Regardless how the tendons are tensioned, the deformation of anchorage and the base plate, as well as the sliding of the prestressed tendons can cause prestress loss. The prestress loss due to the tendon shrinkage mainly occurs around the anchorage area and is non-uniform along with the tendon direction [26]. The prestress loss due to anchor deformation and tendon shrinkage can be calculated as:where,
- = the prestress loss due to anchor deformation;
- = the distance between the two anchor ends, mm;
- = the shrinkage length of the tendons due to anchor deformation, for jaw vice anchorage, 6–8 mm.
- (2)
- Prestress loss due to friction, denoted as . There is friction between the prestressed tendons and the casing pipe. The closer to the anchorage area, the higher is the friction force, which can be expressed as [24]:where,
- = the prestress loss due to friction;
- = the distance from the anchorage area to the calculation cross section;
- = the factor of the casing pipe;
- = the friction coefficient between the tendons and the casing pipe;
- = the cumulative angle.
- (3)
- Prestress loss due to relaxation. The unrecovered deformation of steel wires at high tensioning is inevitable, which is also known as relaxation. The prestress loss due to this can be expressed as [24]:where,
- = the prestress loss due to relaxation;
- = the tensile strength of the prestress tendons.
- (4)
- Prestress due to concrete shrinkage and creep. Shrinkage is a common phenomenon during the curing of concrete. Creep occurs when high pressure is applied on the concrete. Both the shrinkage and creep can cause prestress loss, which can be expressed as [24]:where,
- = the reinforcement ratio;
- = the normal compressive stress of concrete;
- = the compressive strength of concrete under pressure.
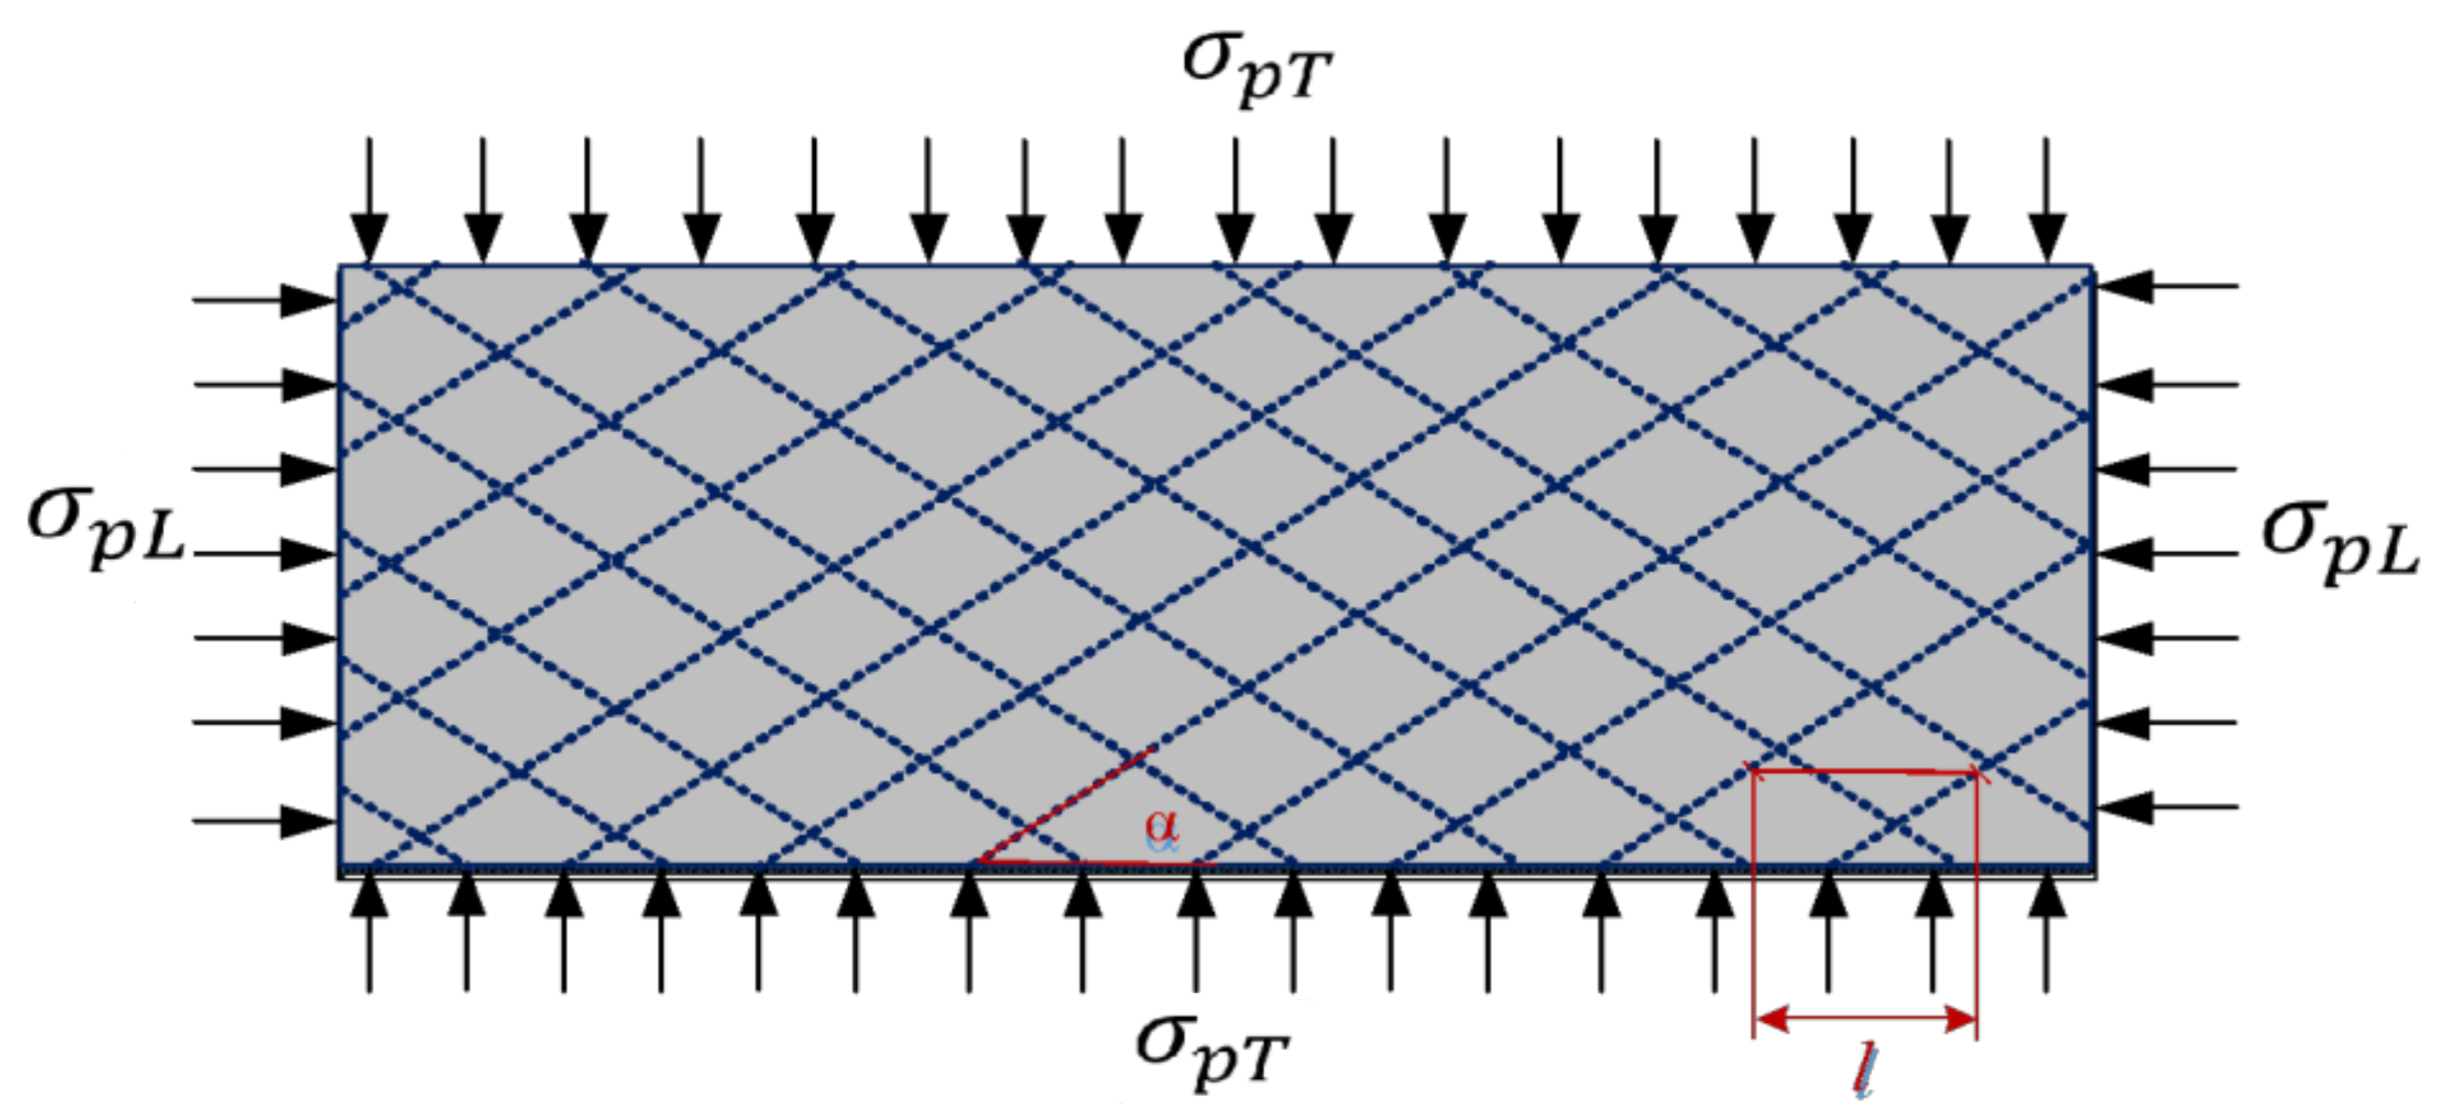
3.2. Longitudinal and Transverse Stress
- = the longitudinal prestress;
- = the transverse prestress;
- = the controlled design strength of tendons;
- = the cross section area of the prestressed tendons;
- = the spacing between neighboring tendons along the road direction;
- = the thickness of the concrete slab.
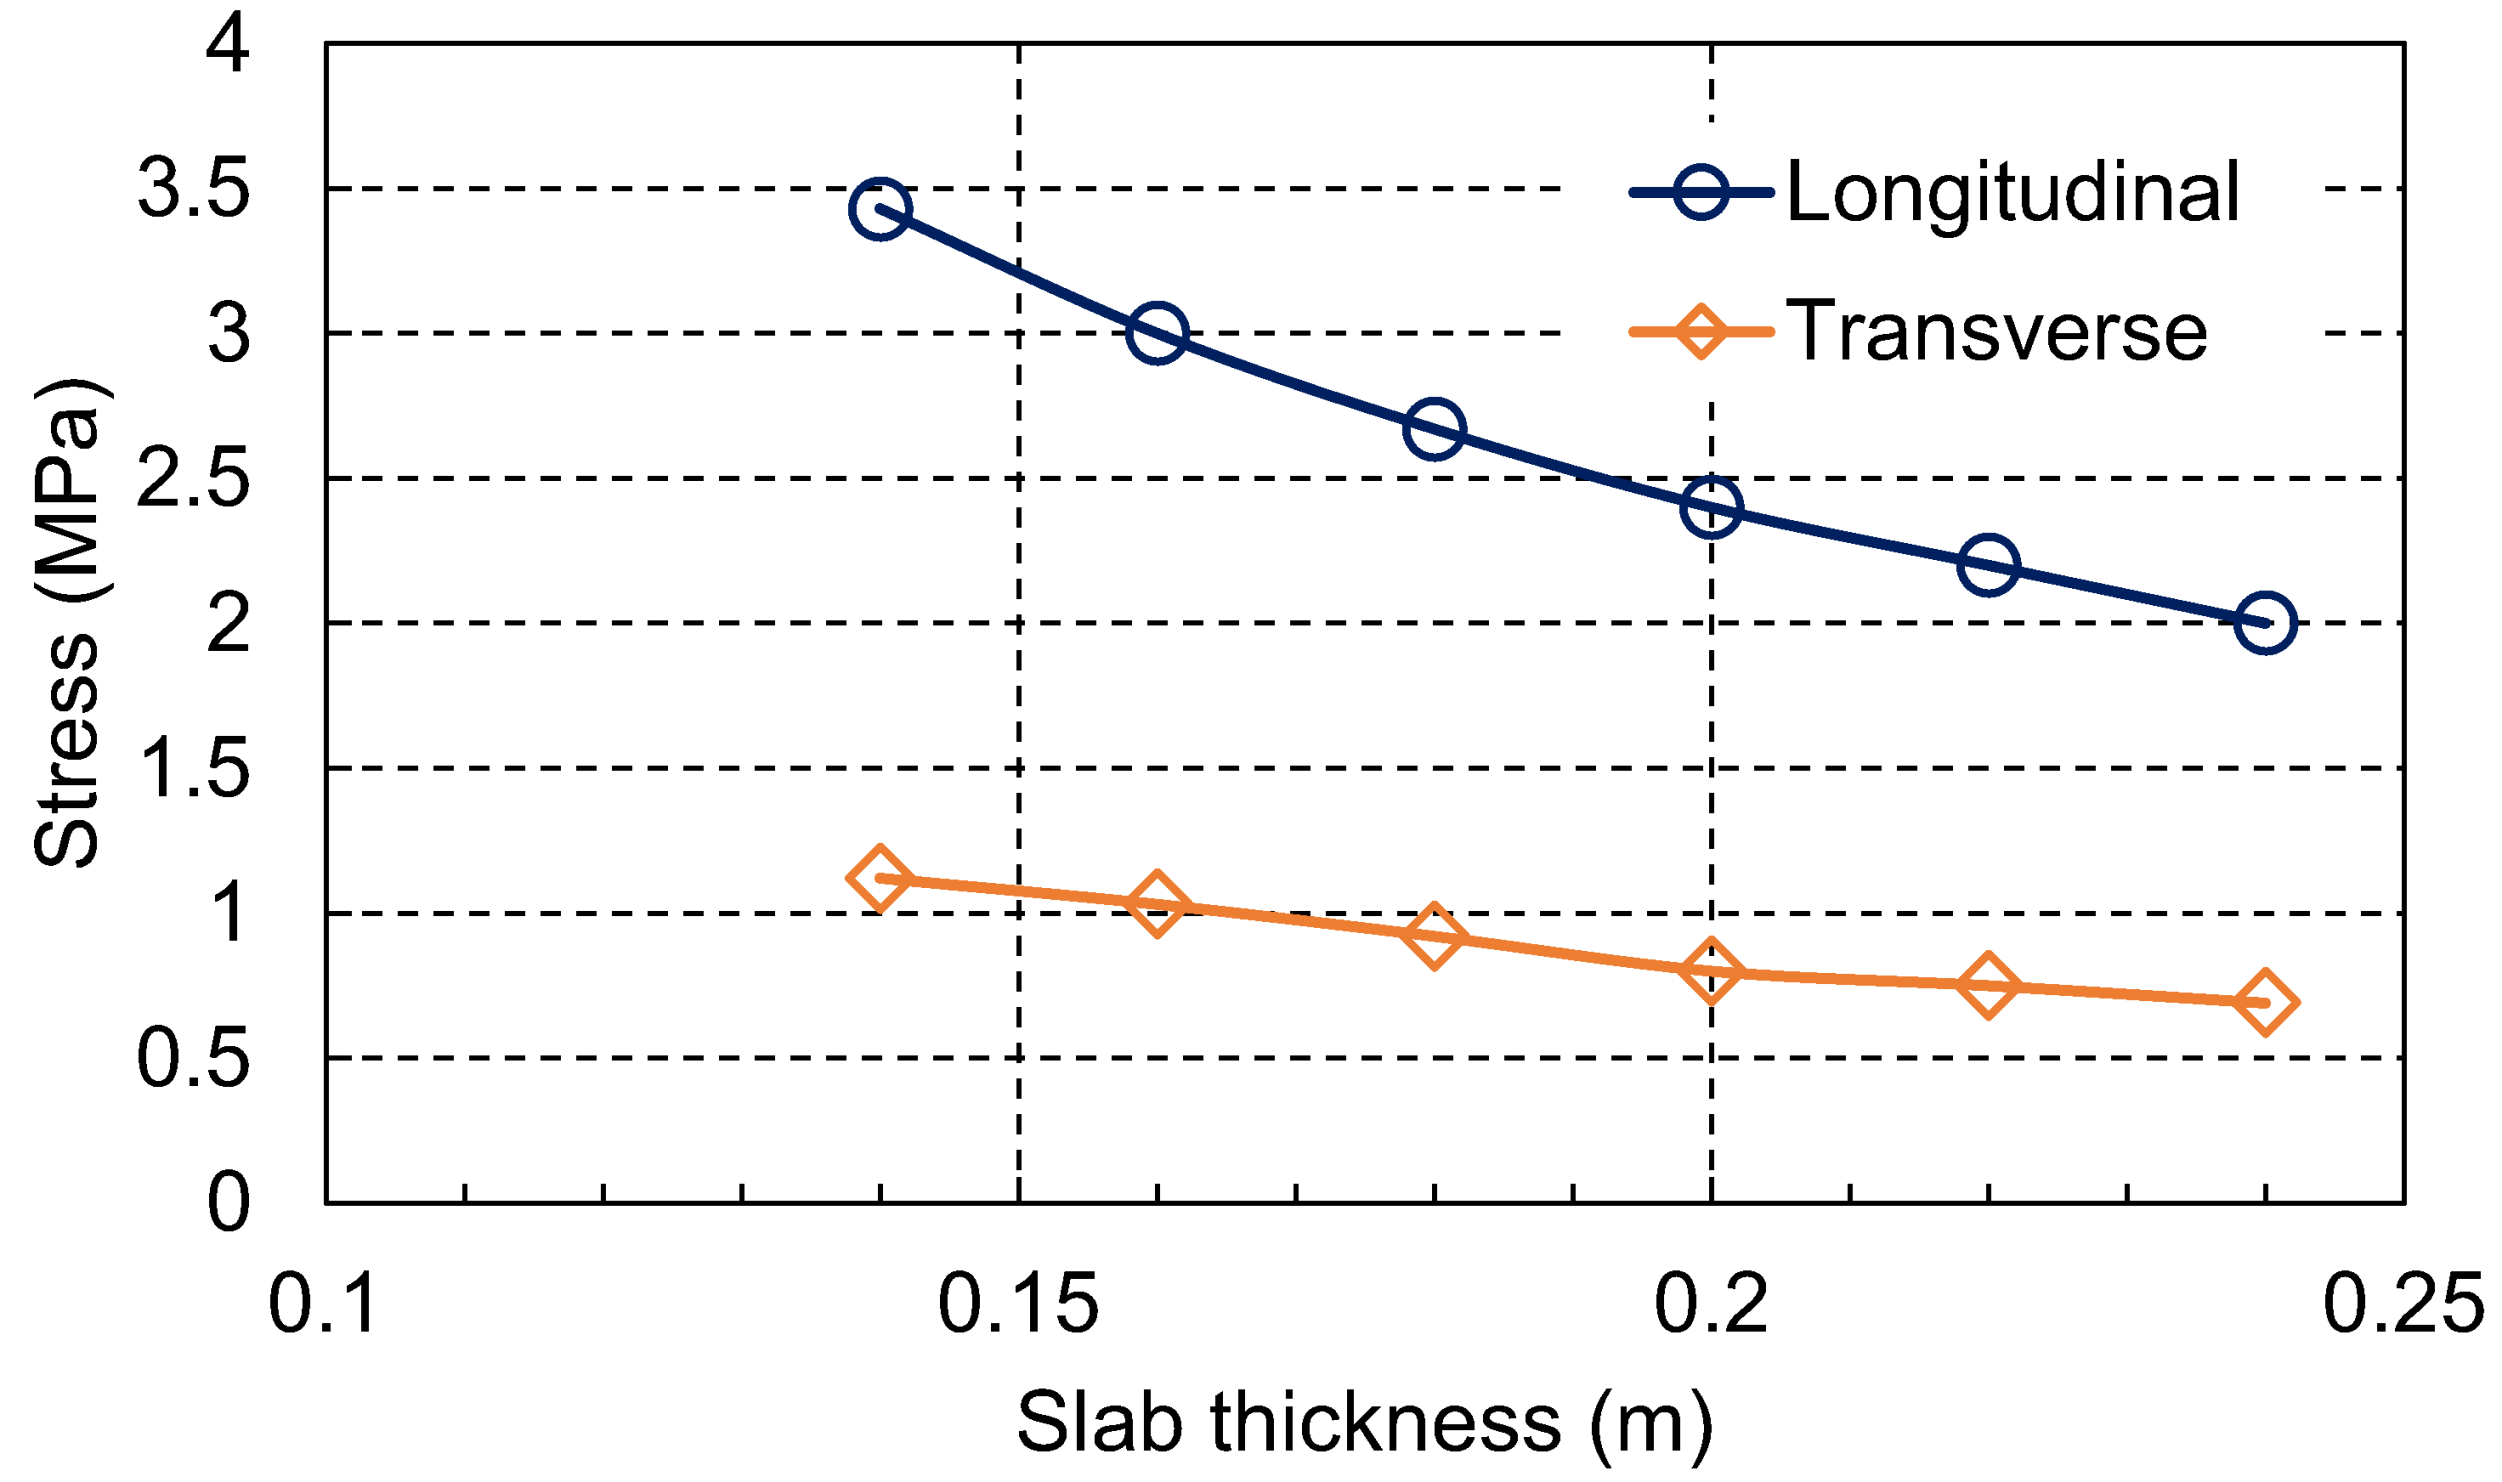
3.3. Effect of Slab Thickness
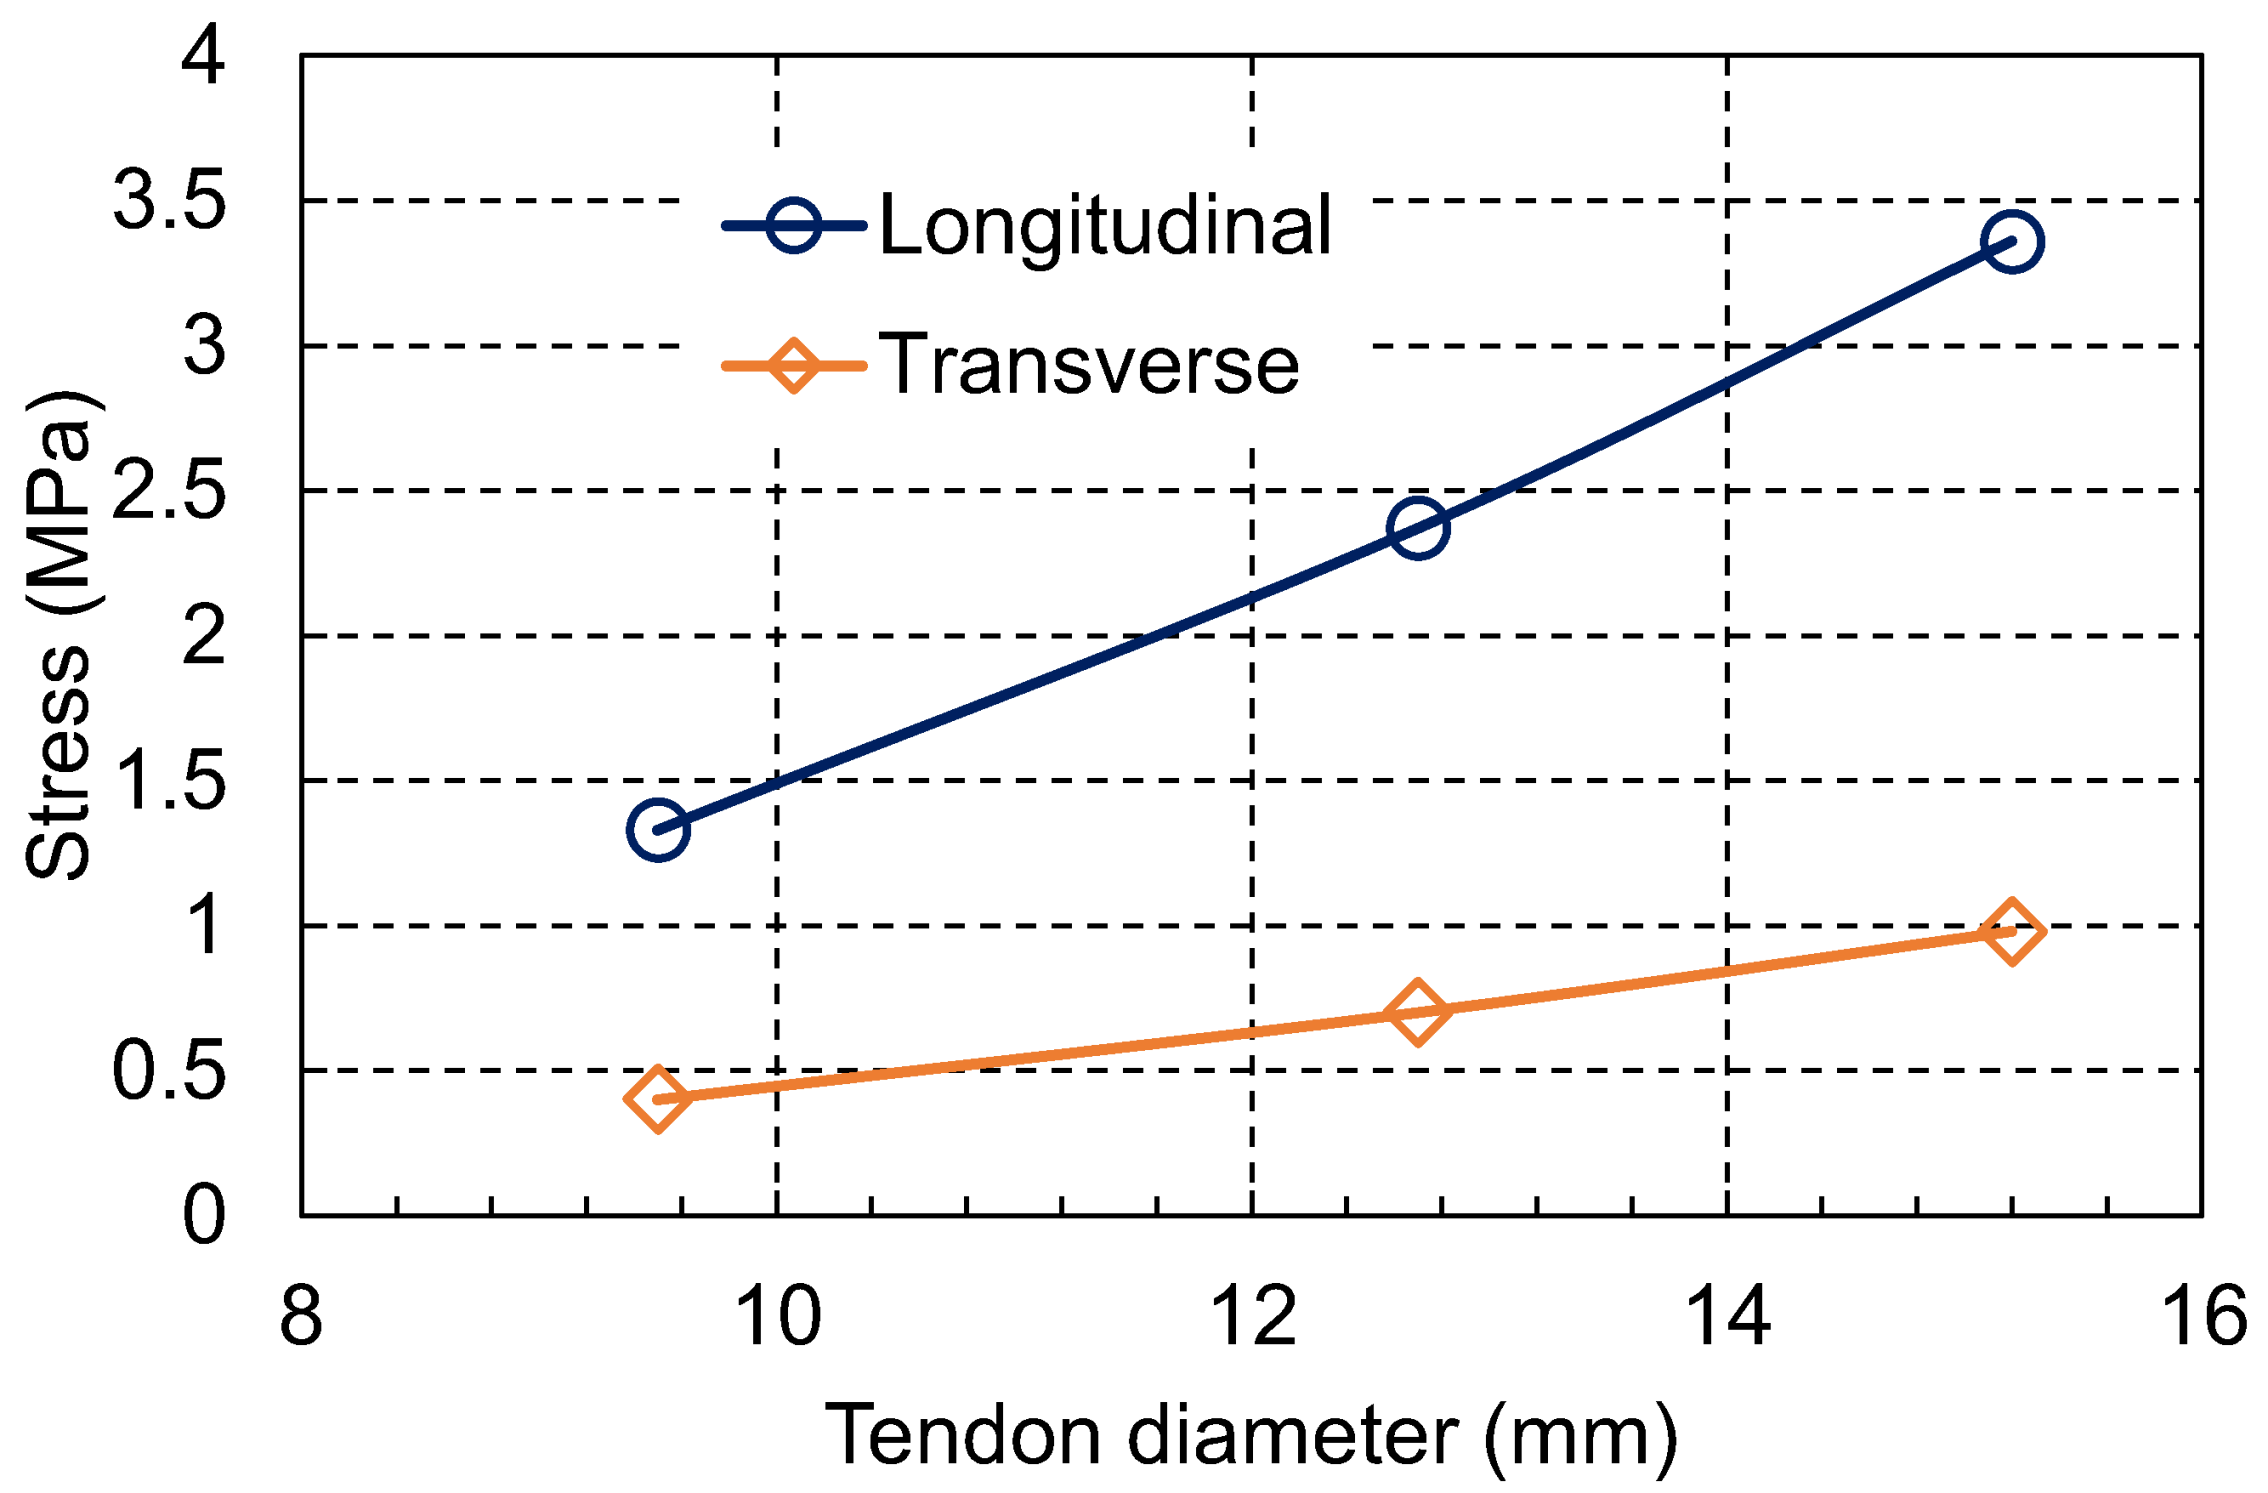
3.4. Effect of Prestressed Tendon Diameter
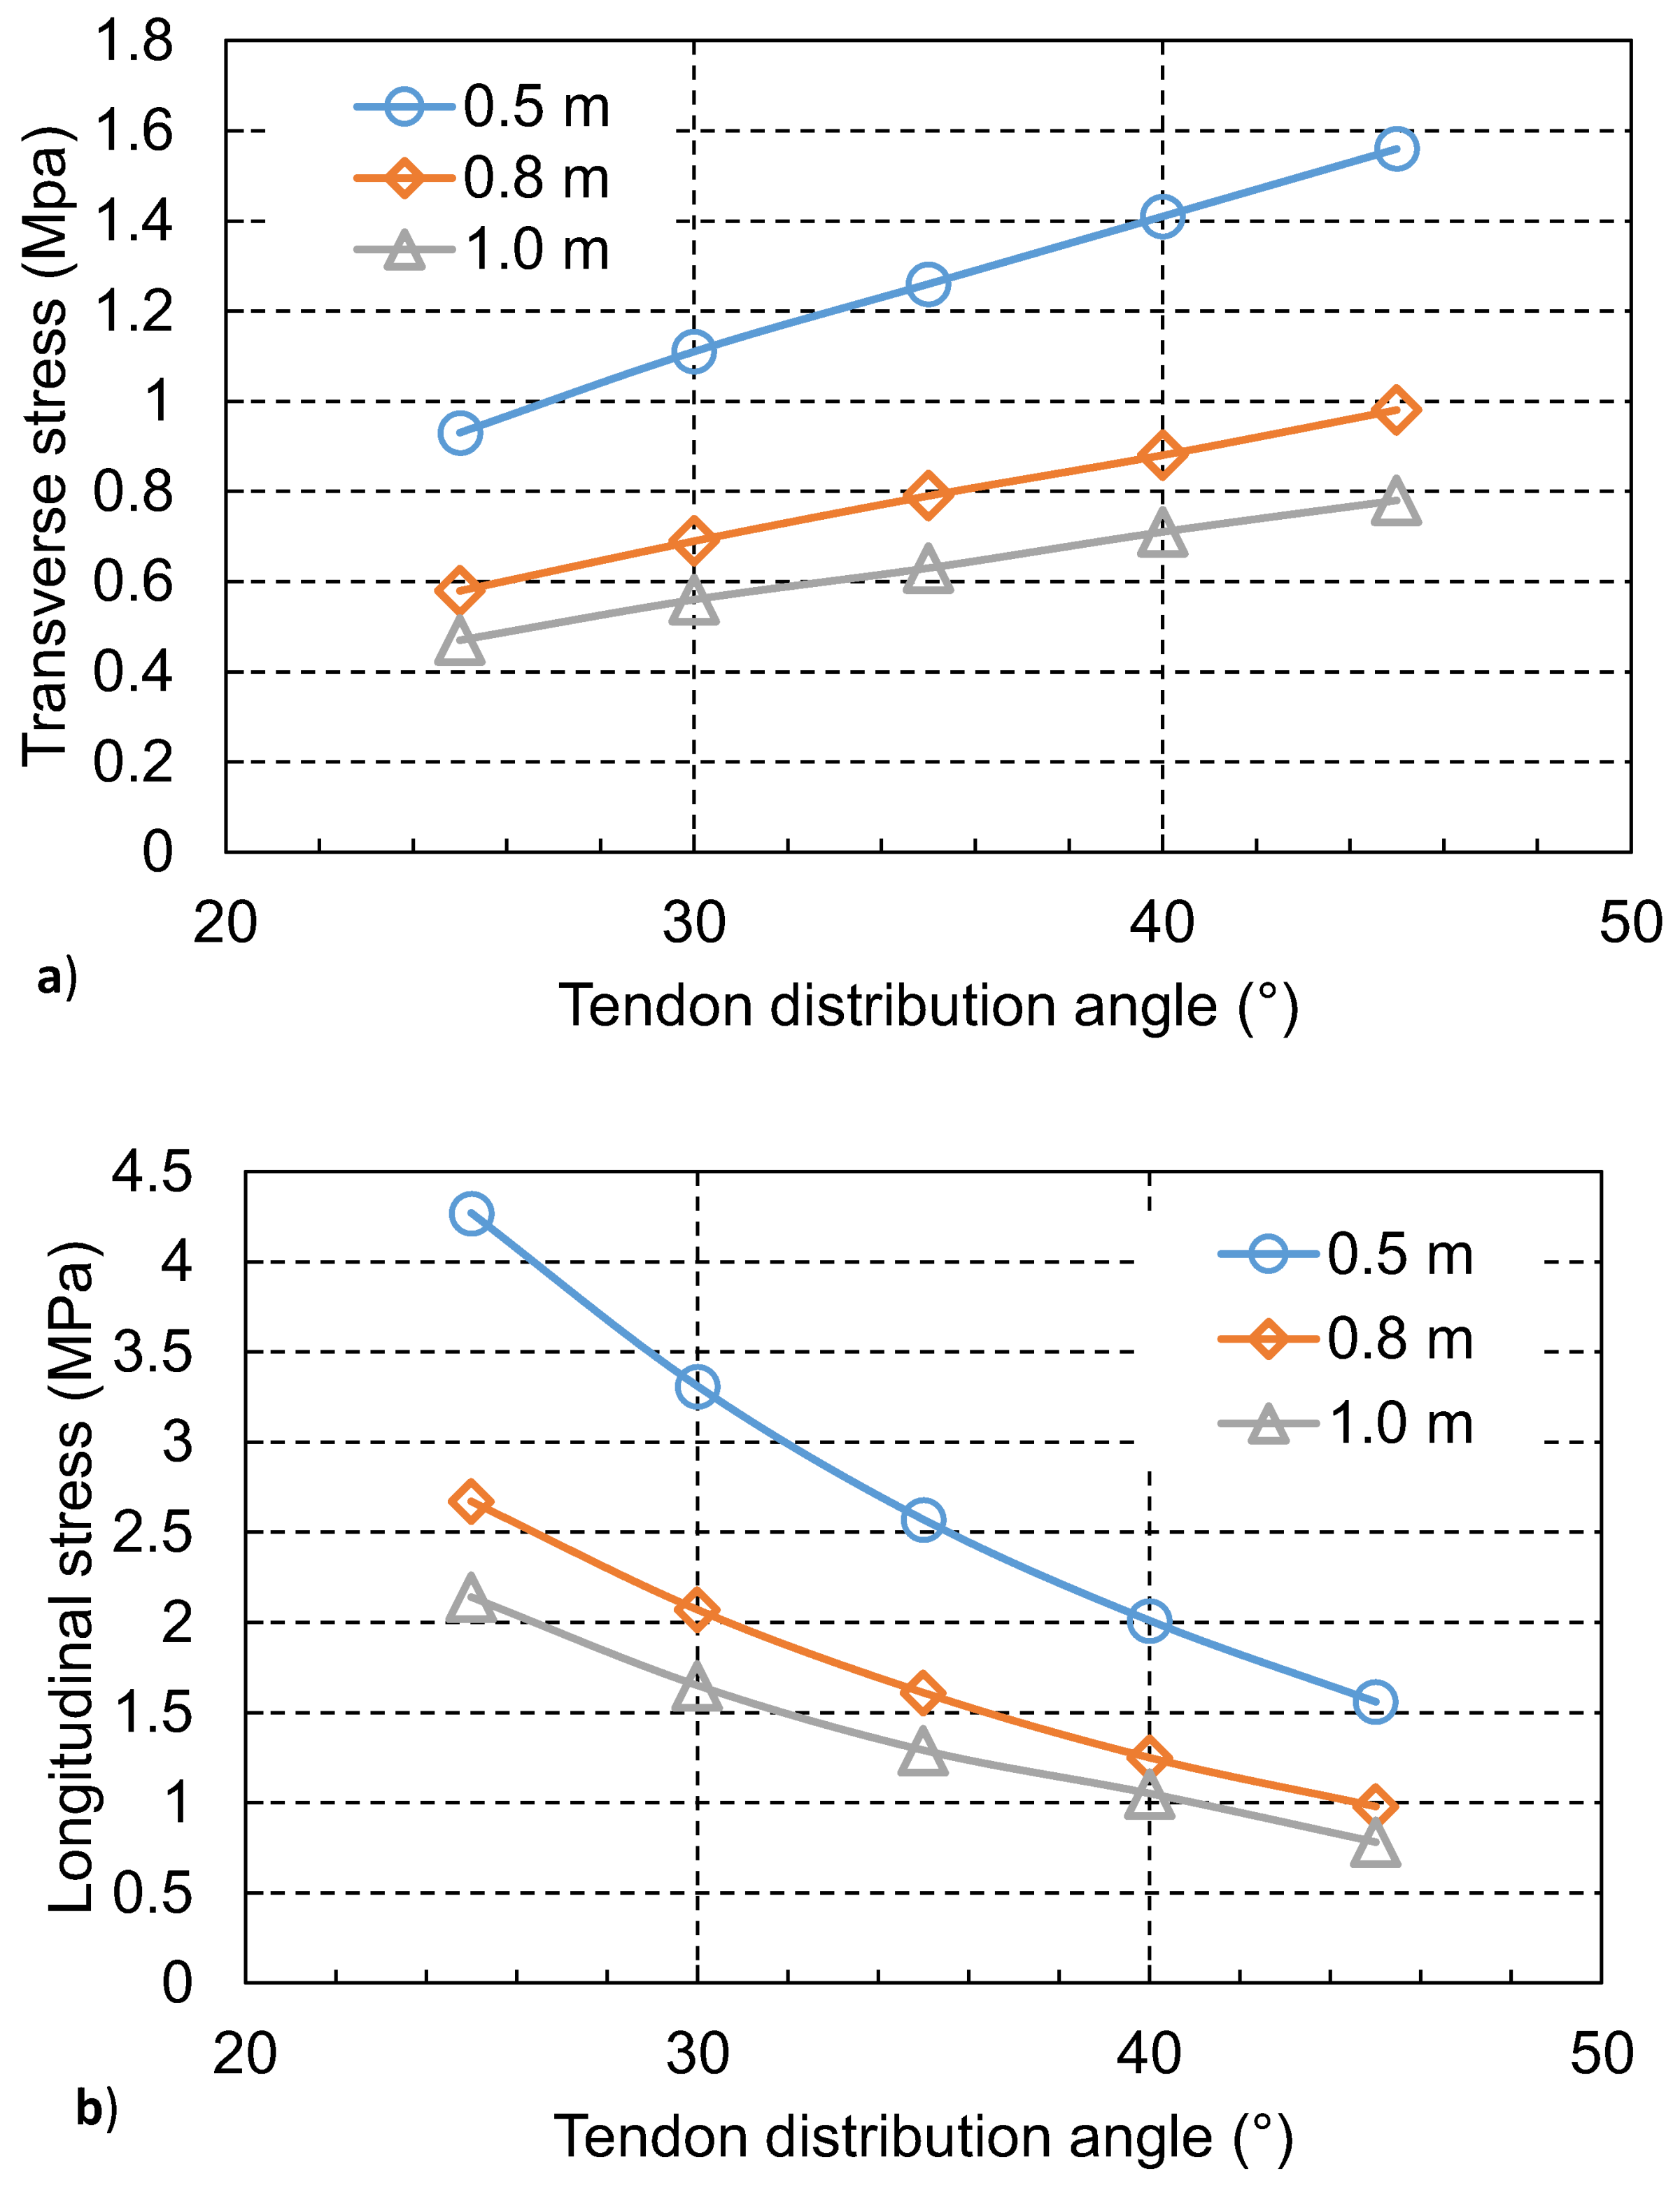
3.5. Effect of Tendon Distribution Angle and Spacing
3.6. Buckling of Concrete Slab
- = the thickness to width ratio;
- = elastic modulus of concrete;
- = the coefficient of subgrade;
- = the width of concrete slab;
- = the Poisson’s ratio of concrete;
- = the length to width ratio;
- = the linear expanding coefficient.
- = the resilient modulus of the subgrade;
- = the radius of the rigid plate (cm), 15 cm.
- = the equivalent temperature differential caused by prestressing;
- = the prestress level in the concrete slab.
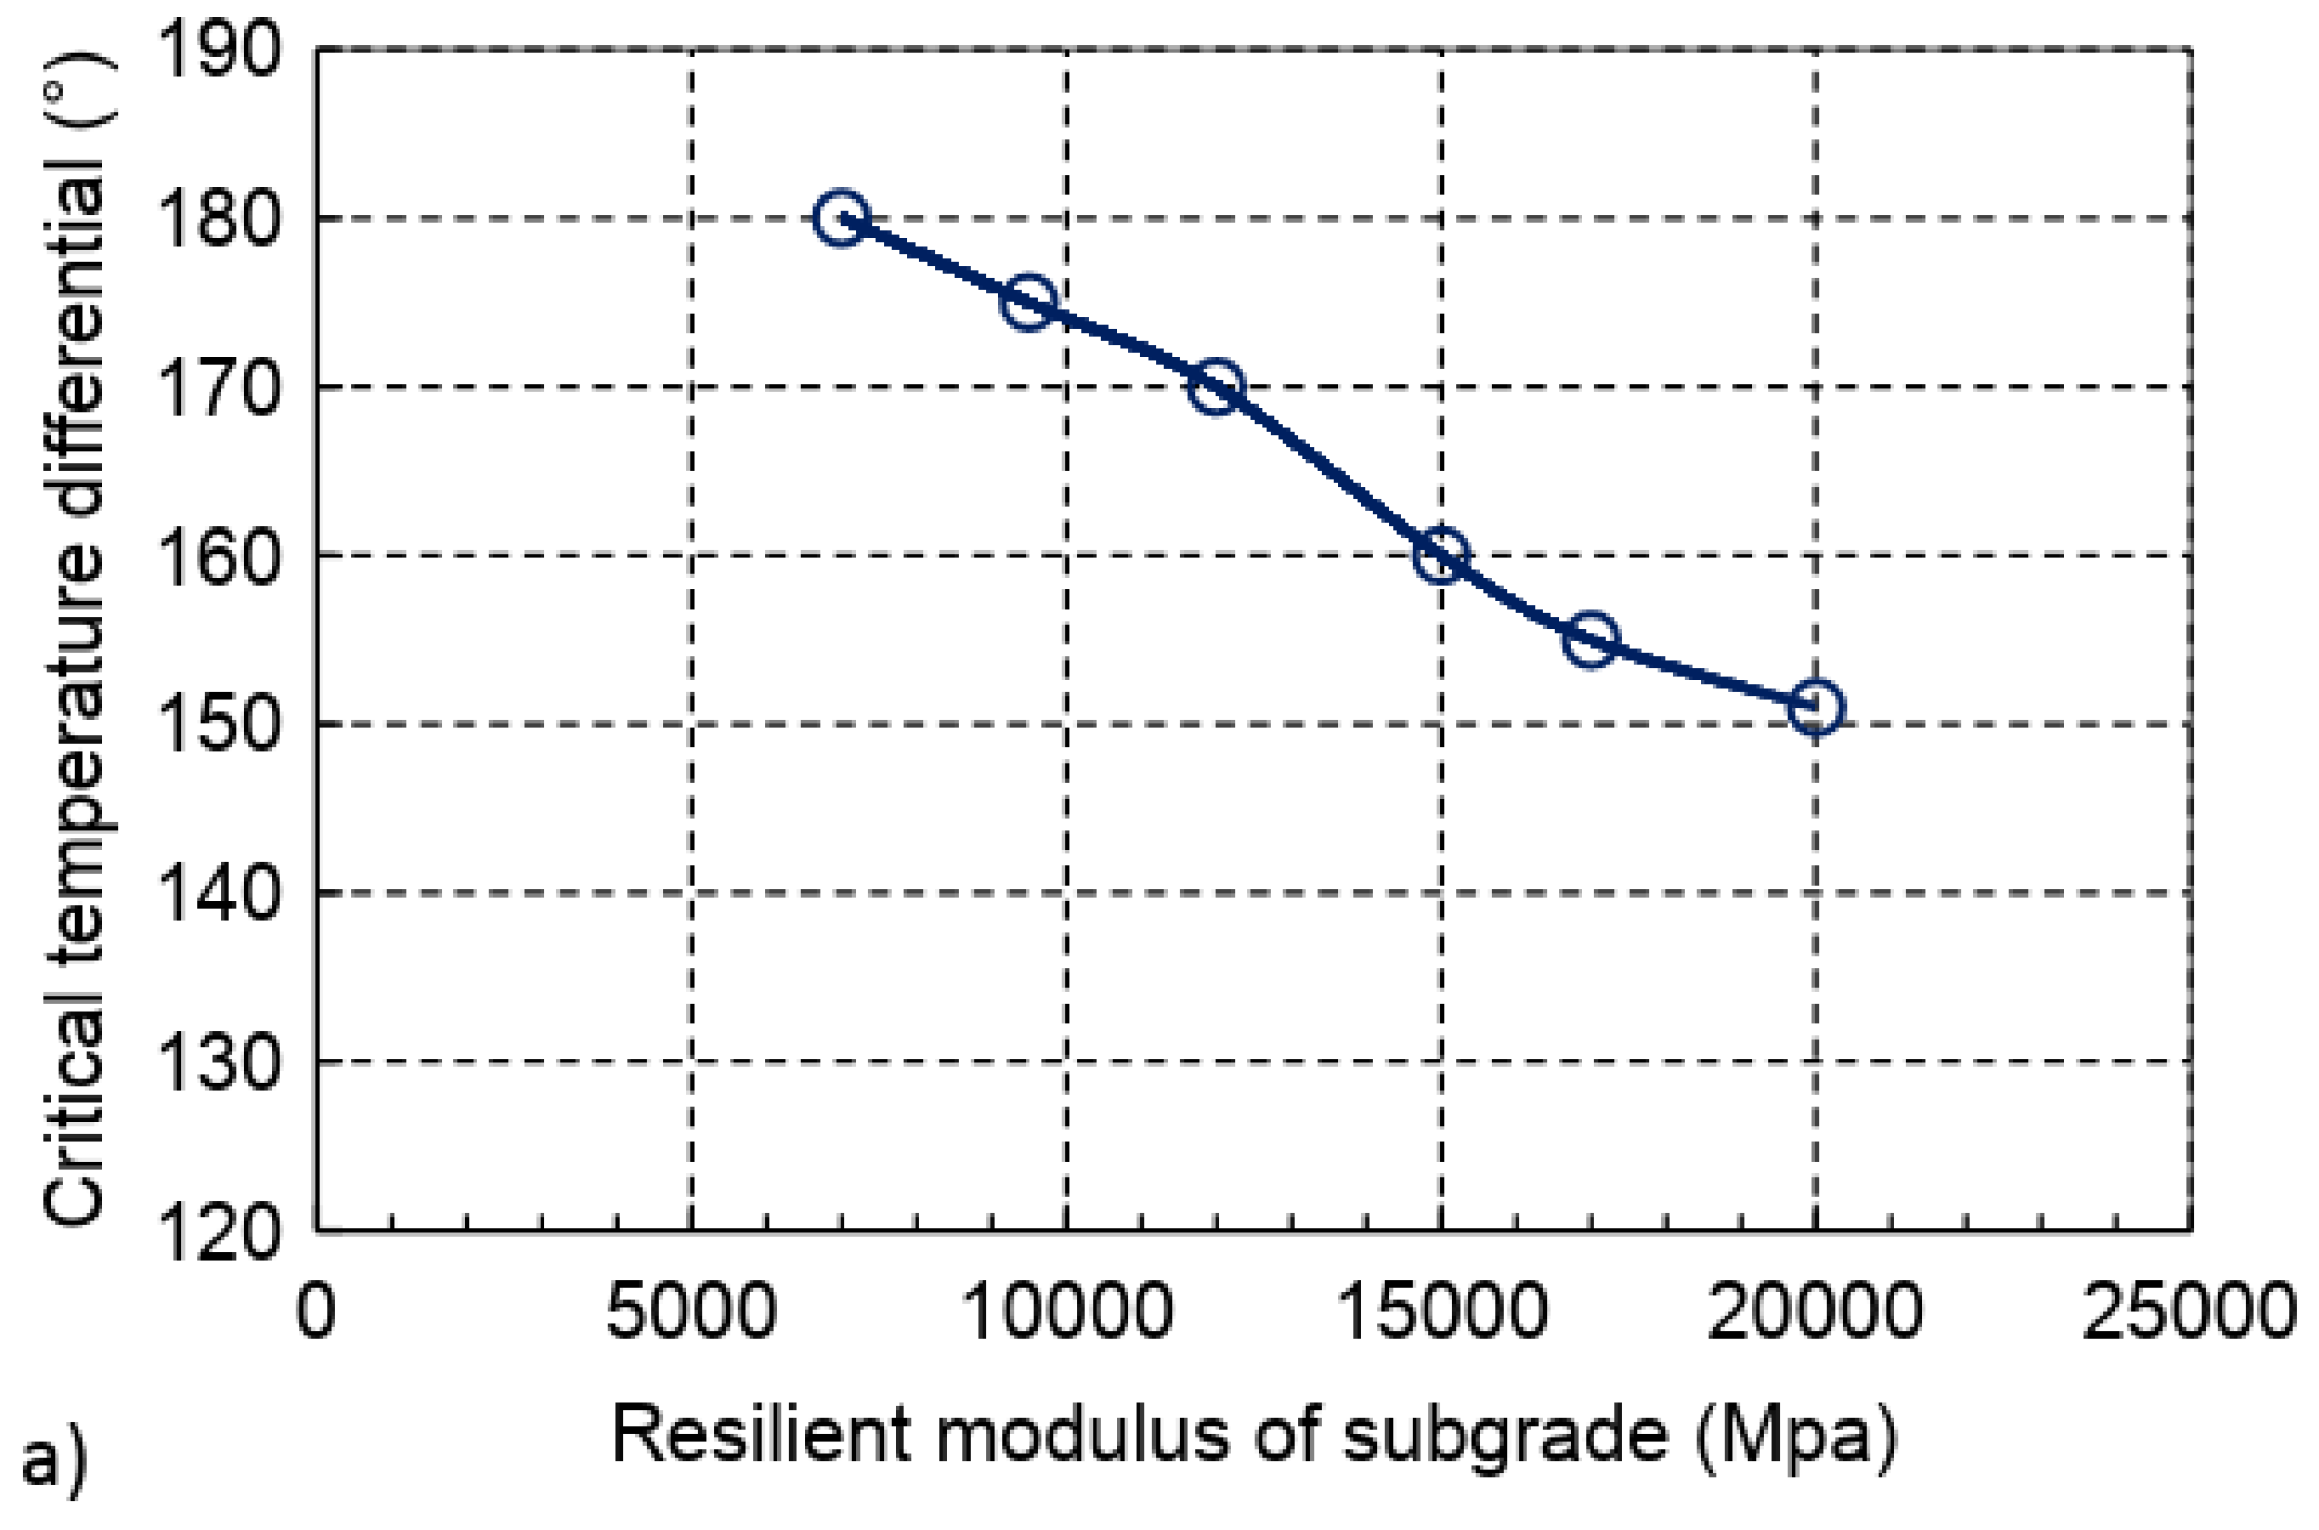
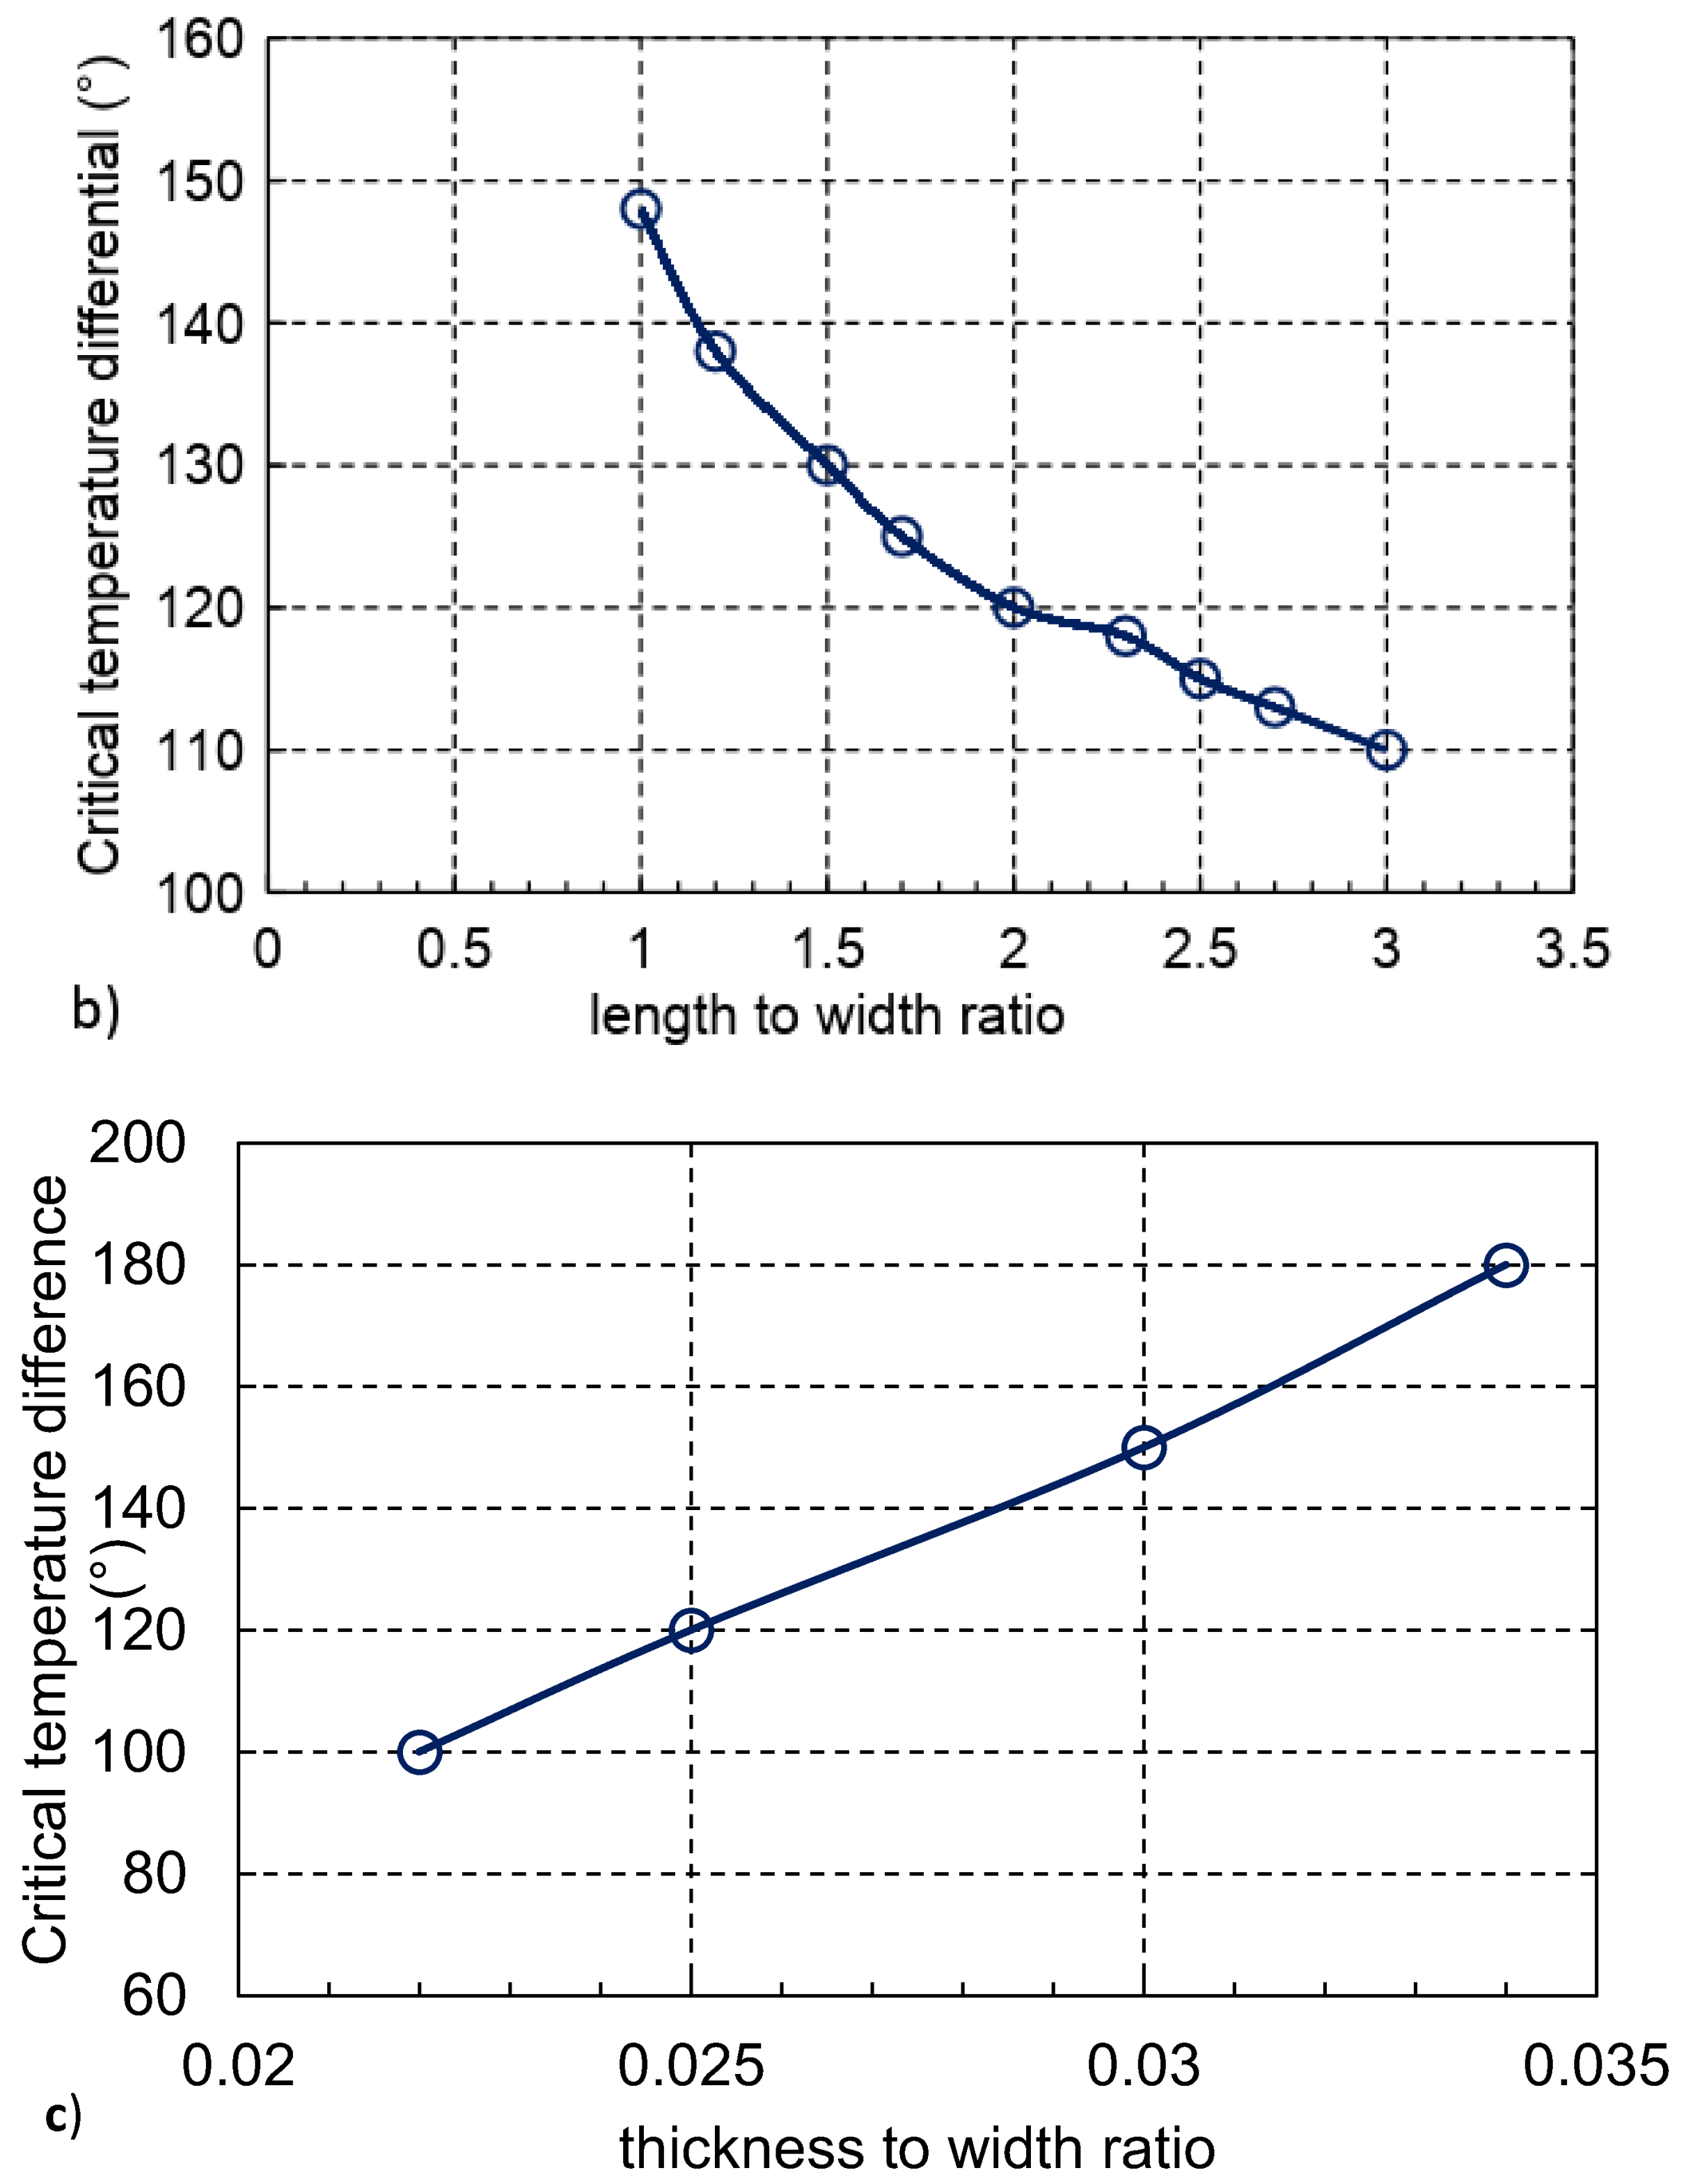
3.7. Parametric Study on Buckling
4. Design of Demonstrative Concrete Pavement Section
4.1. Stress within the Concrete
4.1.1. Fracture Criteria
- = the tensile strength of concrete;
- = temperature induced stress;
- = traffic induced stress;
- = friction related stress;
- = effective prestress in longitudinal direction;
- = coefficient of reliability.
- = initial load induced stress;
- = coefficient for fatigue cracking;
- = coefficient for the impact of eccentric and dynamic loading.
- = coefficient of cumulative fatigue stress;
- = the thermal stress, expressed as:
- = elastic modulus of concrete (MPa);
- = expansion coefficient of concrete;
- = Poisson’s ratio;
- = the temperature gradient along the thickness (°C).
4.1.2. Fatigue Criteria
- N = the fatigue life;
- = the ratio between the stress level to the tensile strength of concrete.
4.2. Stress in Anchorage Area
- = the regional stress level in the anchorage area;
- = the strength coefficient of concrete;
- = the increase coefficient of concrete in compression;
- = the design compressive strength of concrete;
- = the reduction coefficient due to spiral reinforcement;
- = the volume proportion of spiral reinforcement;
- = the tensile strength of spiral steels;
- = the area of concrete under compression.
4.3. Stress Analysis
4.3.1. Stress Analysis on Concrete
4.3.2. Determine Tendon Spacing
4.3.3. Verification
4.4. Regional Stress Analysis in Anchorage Area
5. Materials and Preparation
5.1. Cement and Aggregates
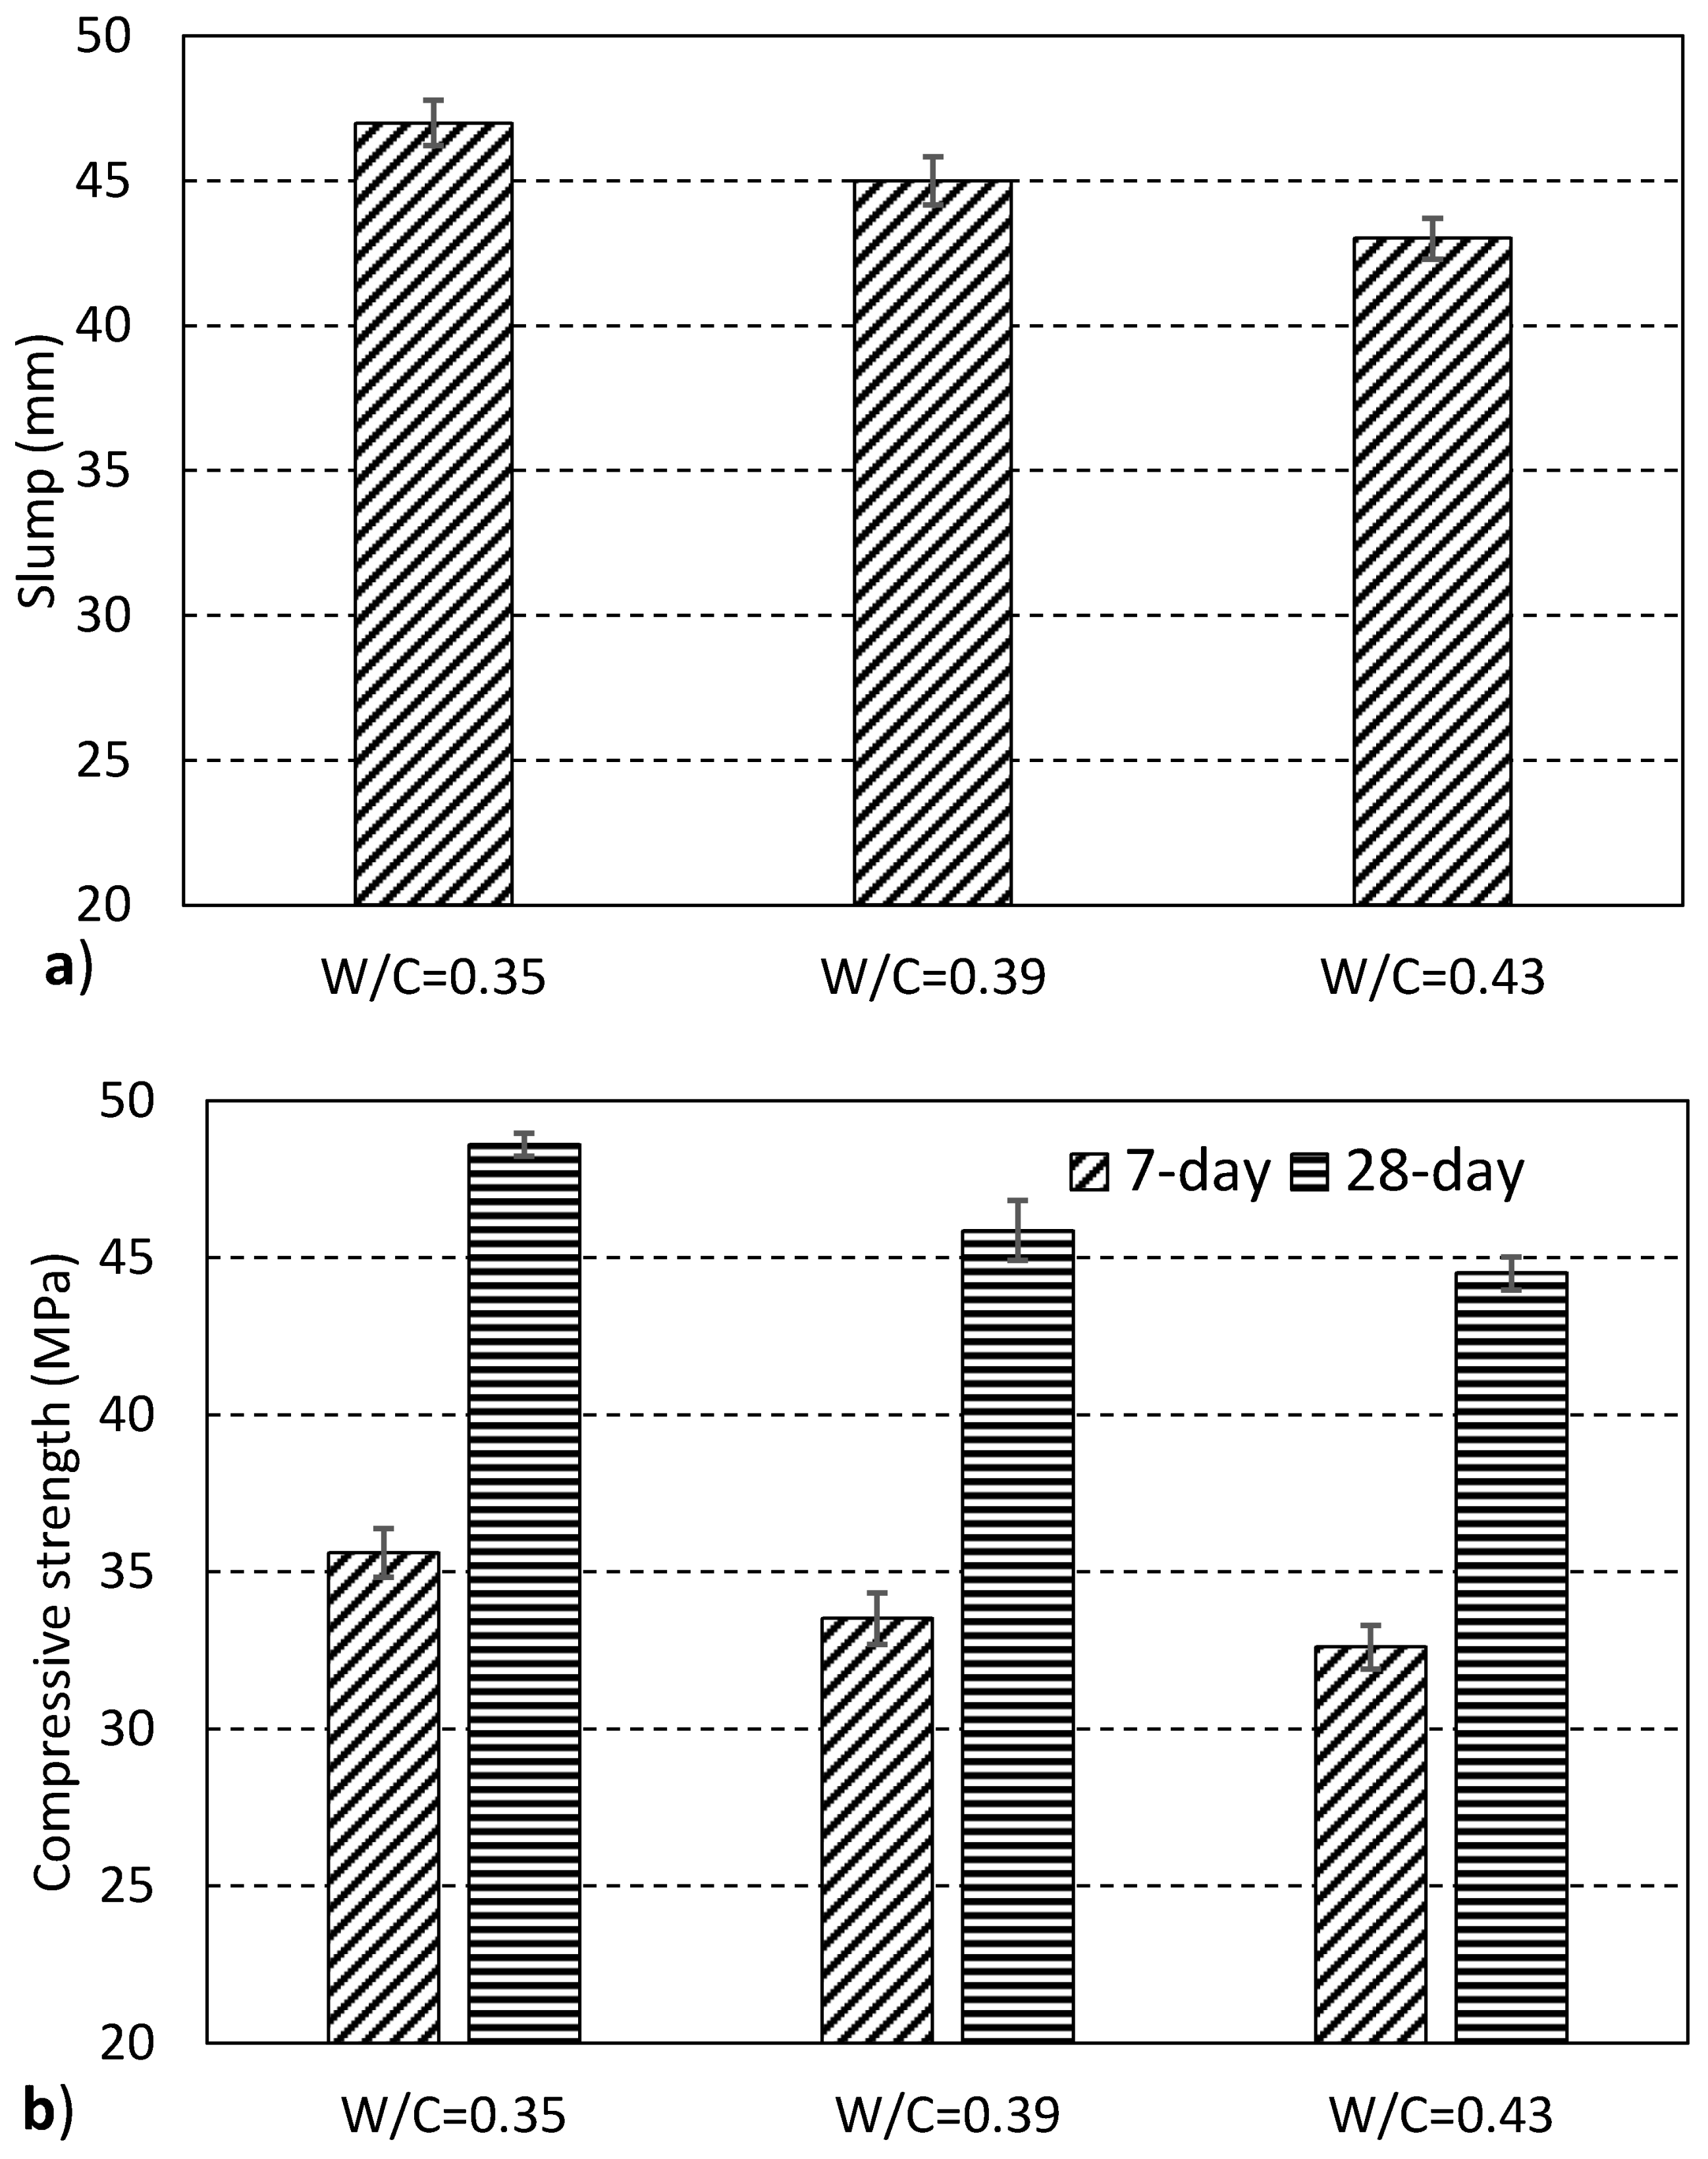
5.2. Concrete Design
5.3. Prestressed Concrete Tendons
5.4. Anchorage
6. Construction of Demonstrative Pavement Section
6.1. Side Formwork
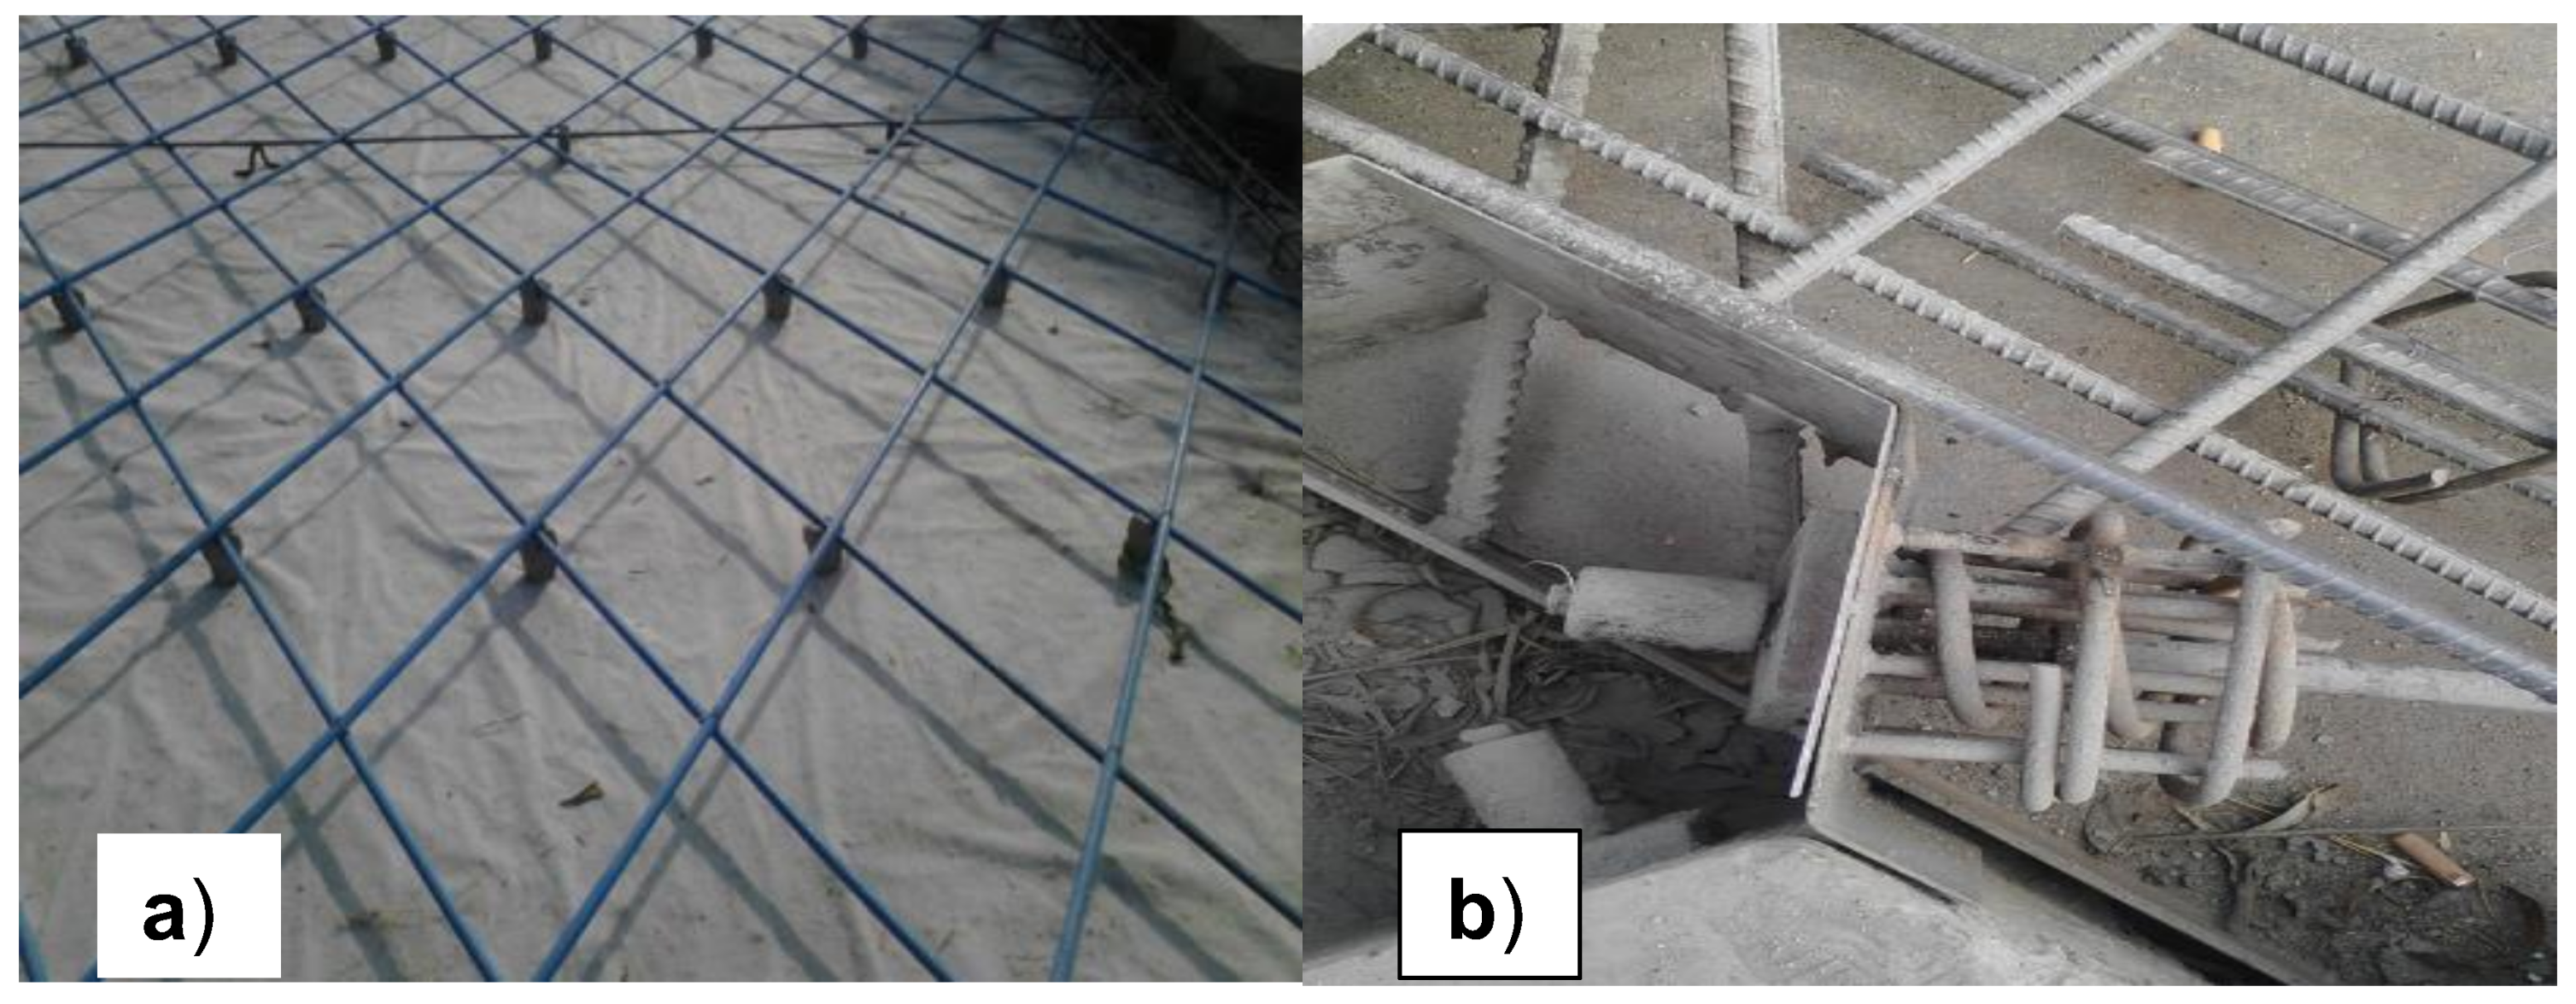
6.2. Sliding Layer
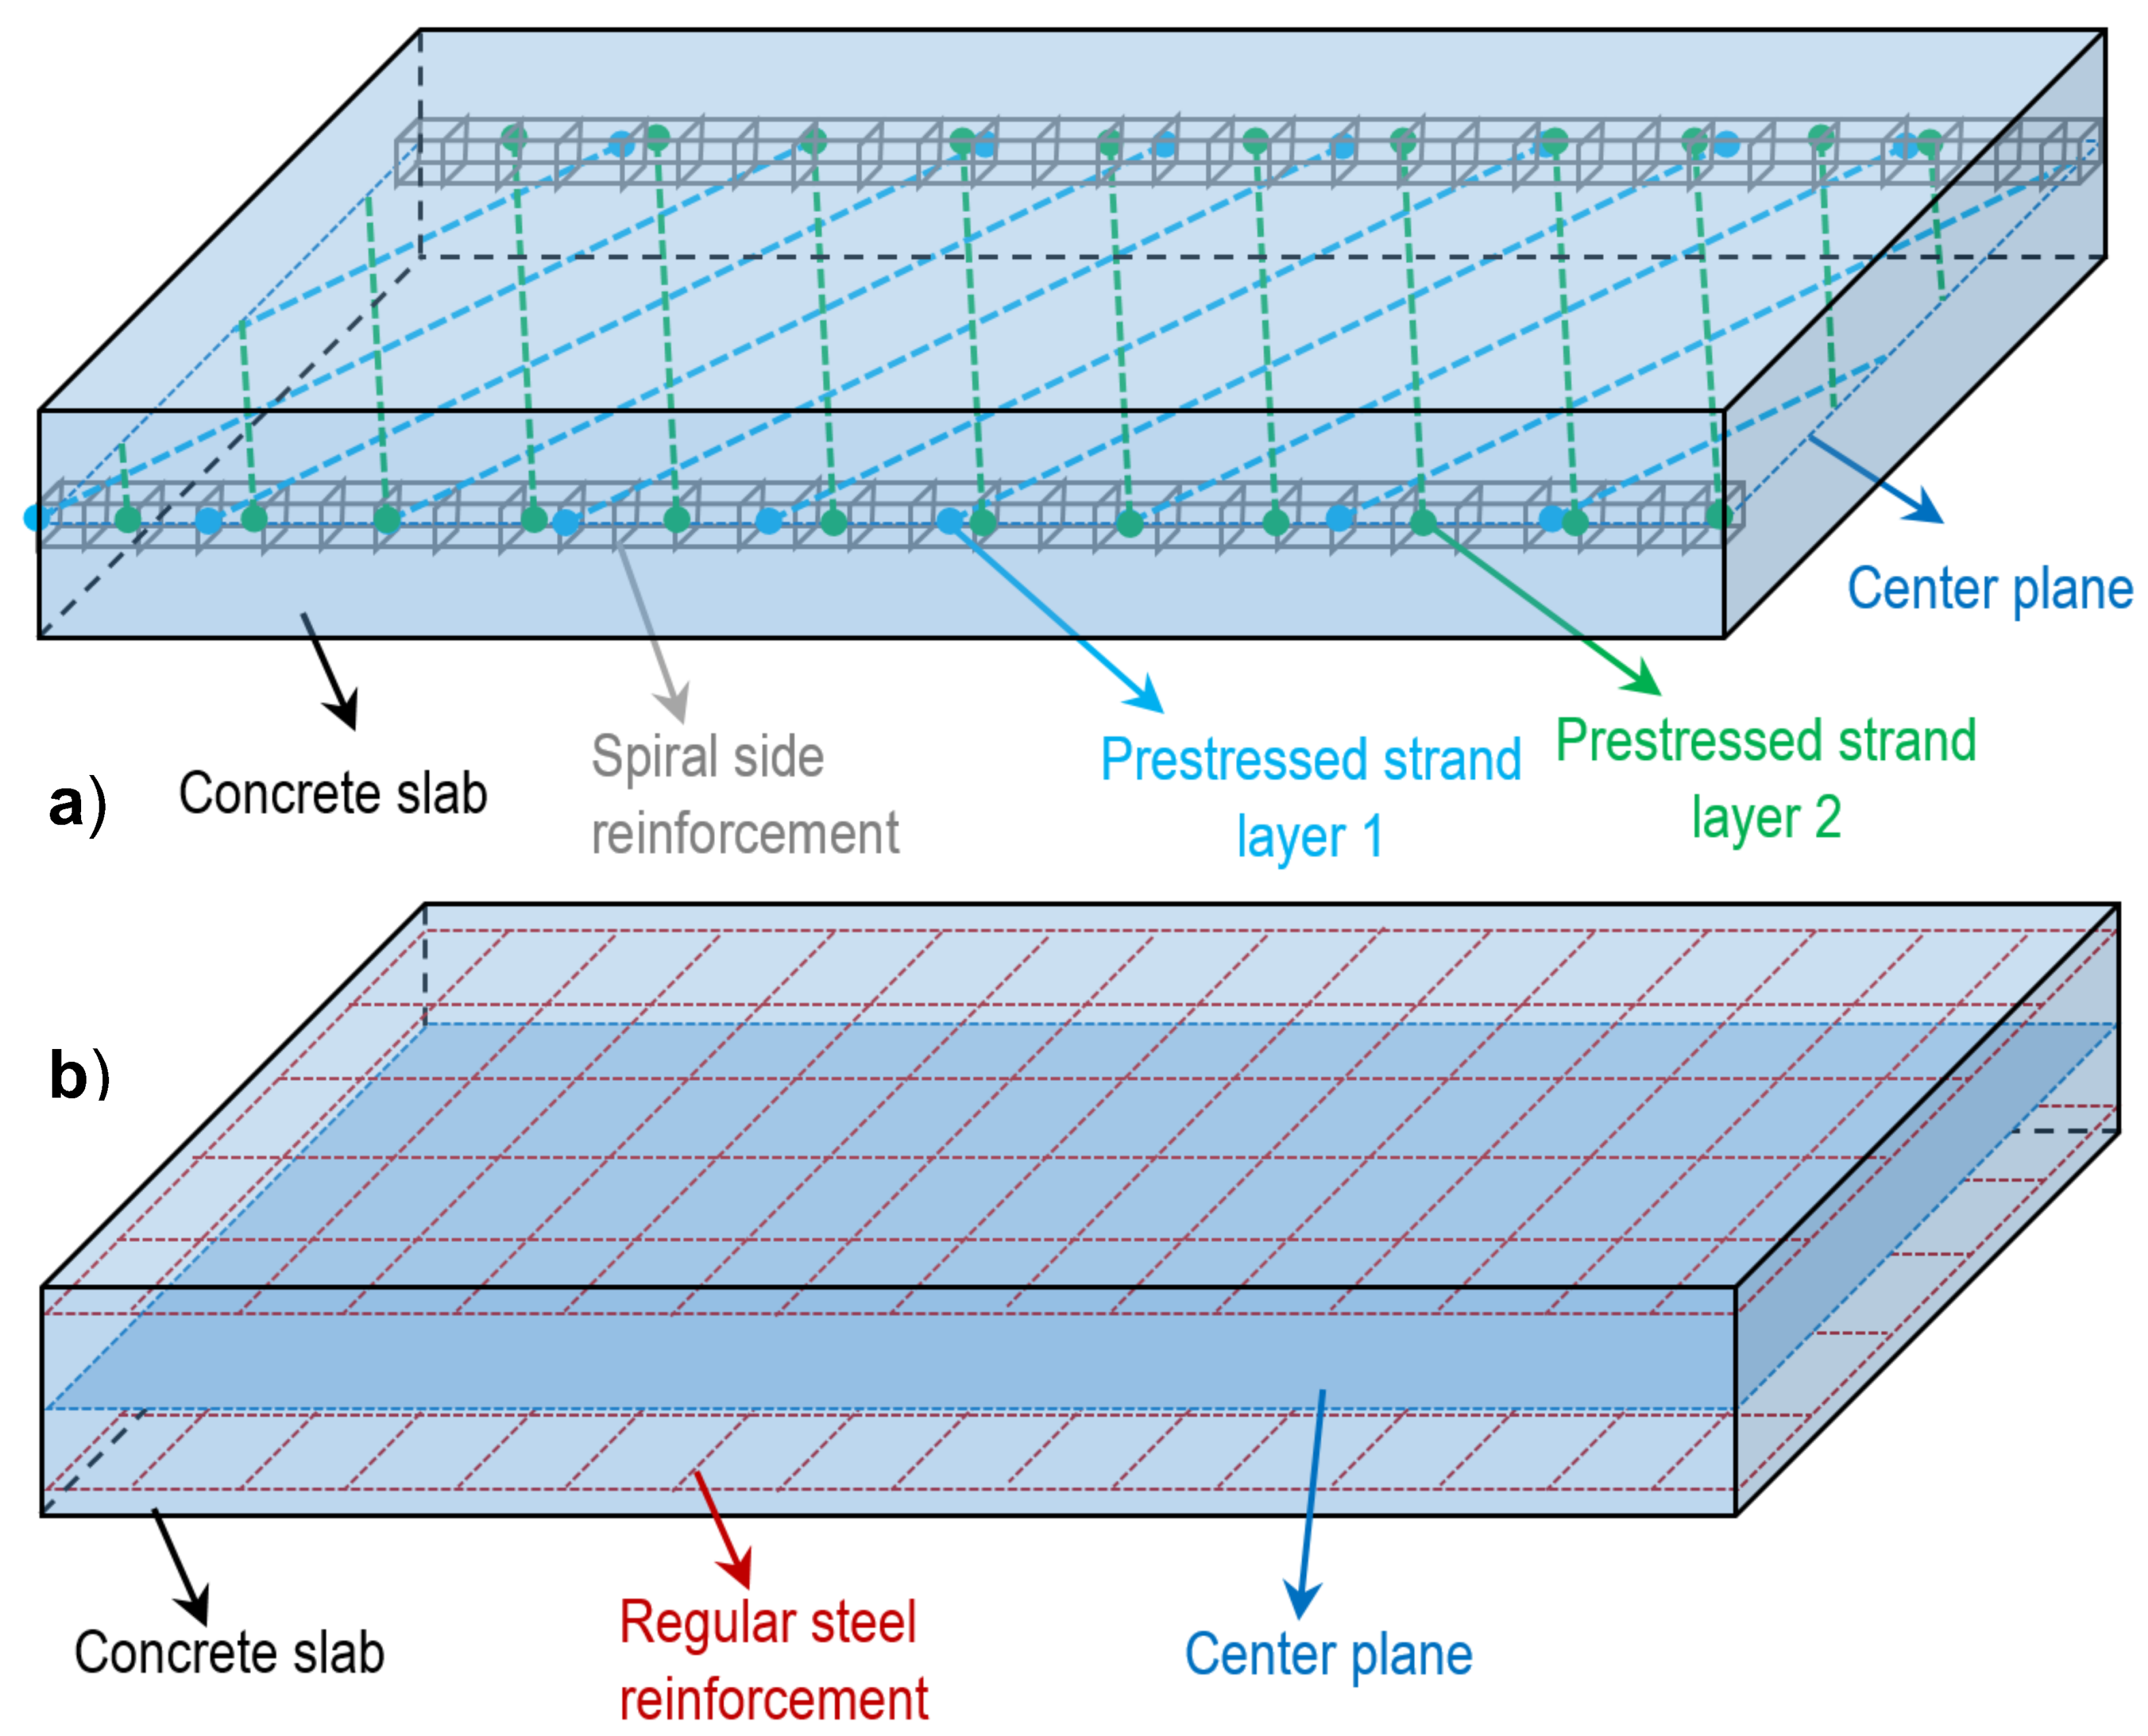
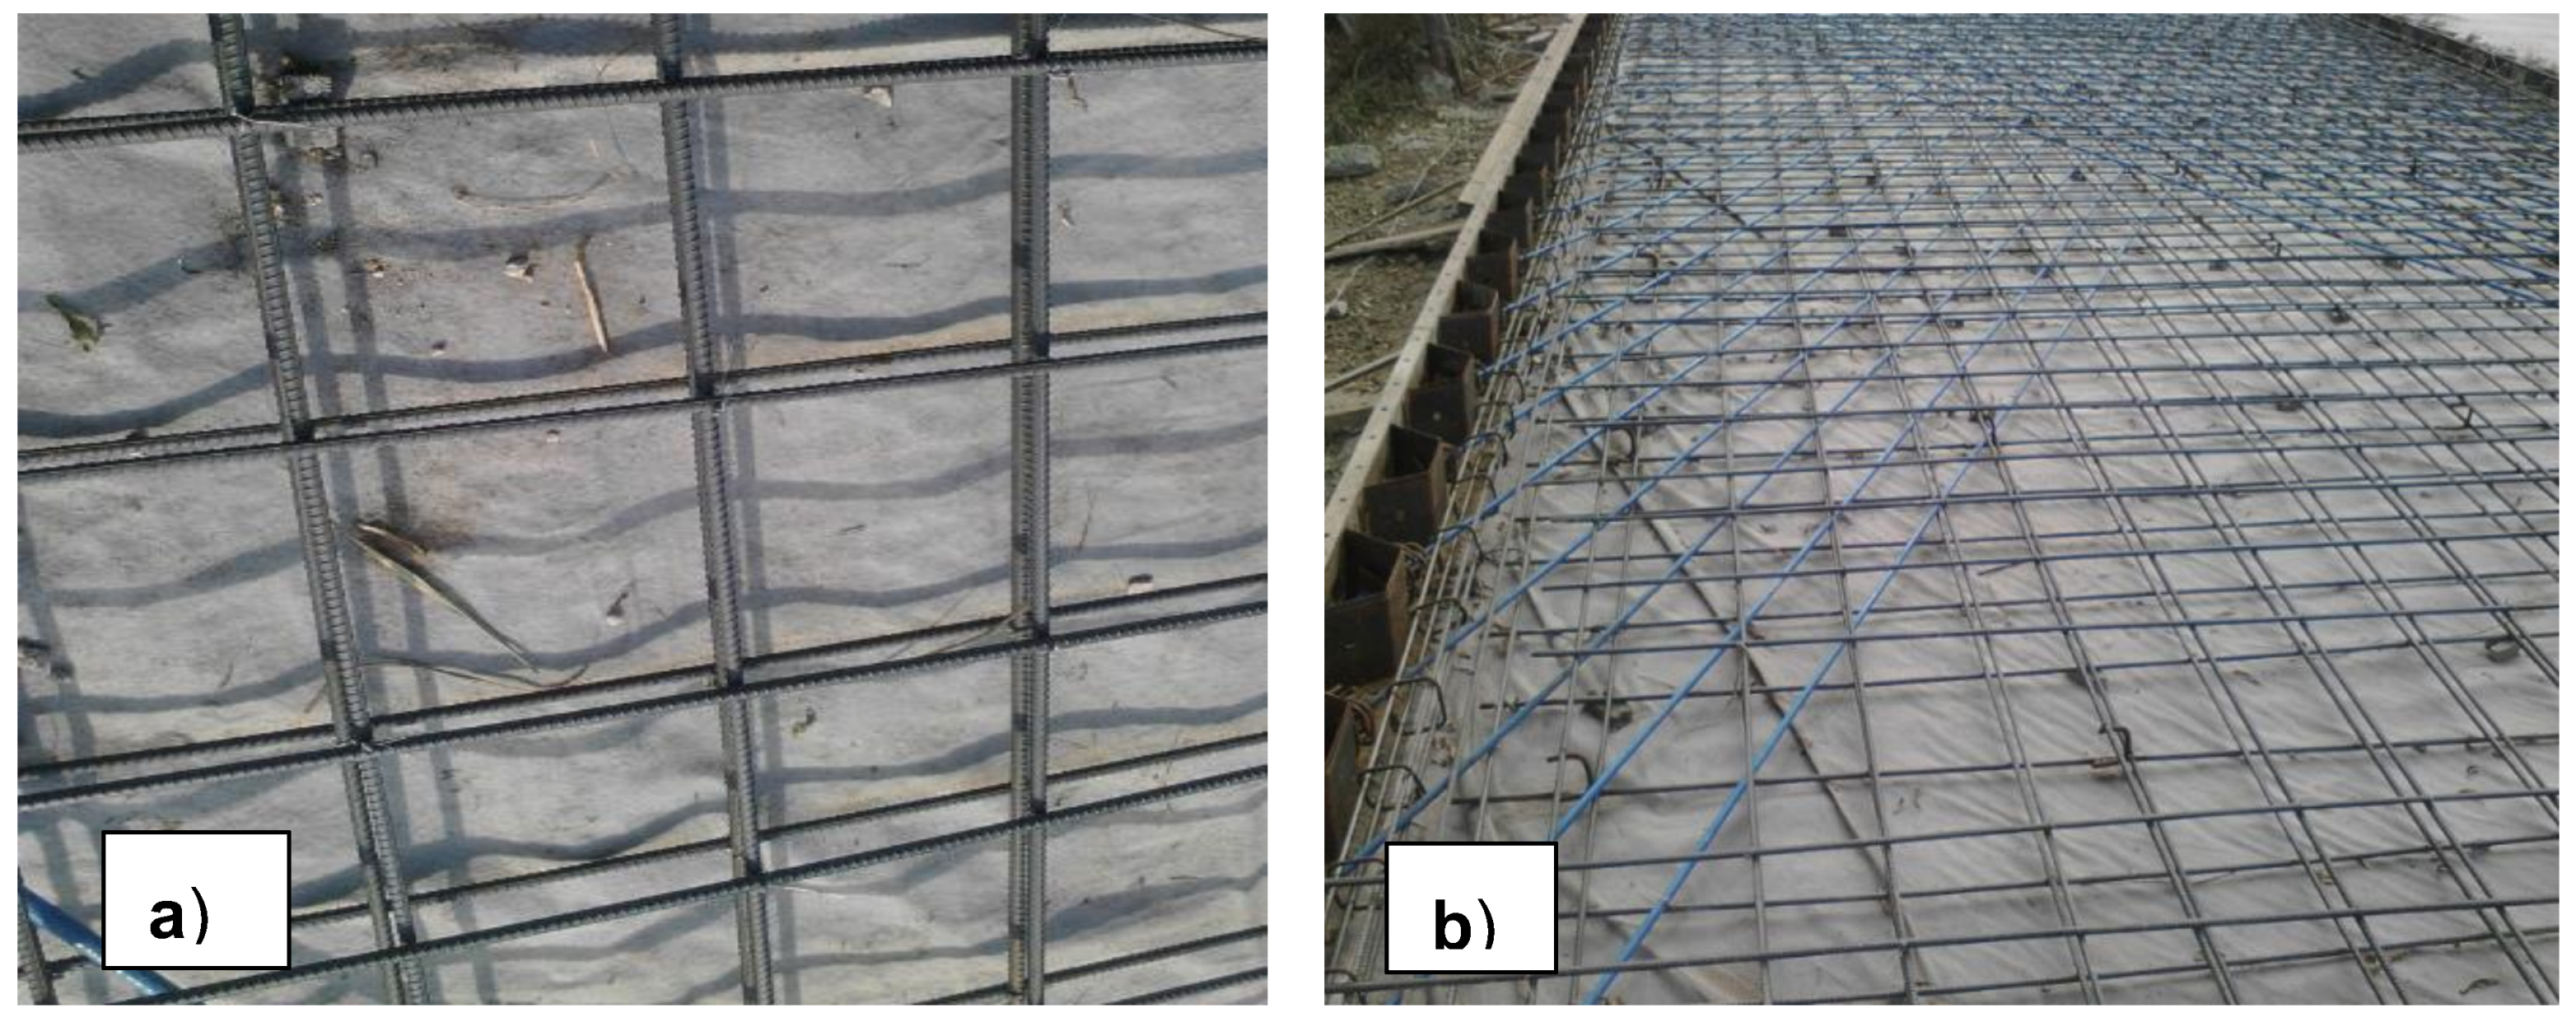
6.3. Distribution of Tendons and Tensioning
6.4. Reinforcement at Slab Top and Bottom
6.5. Concrete Placing and Curing
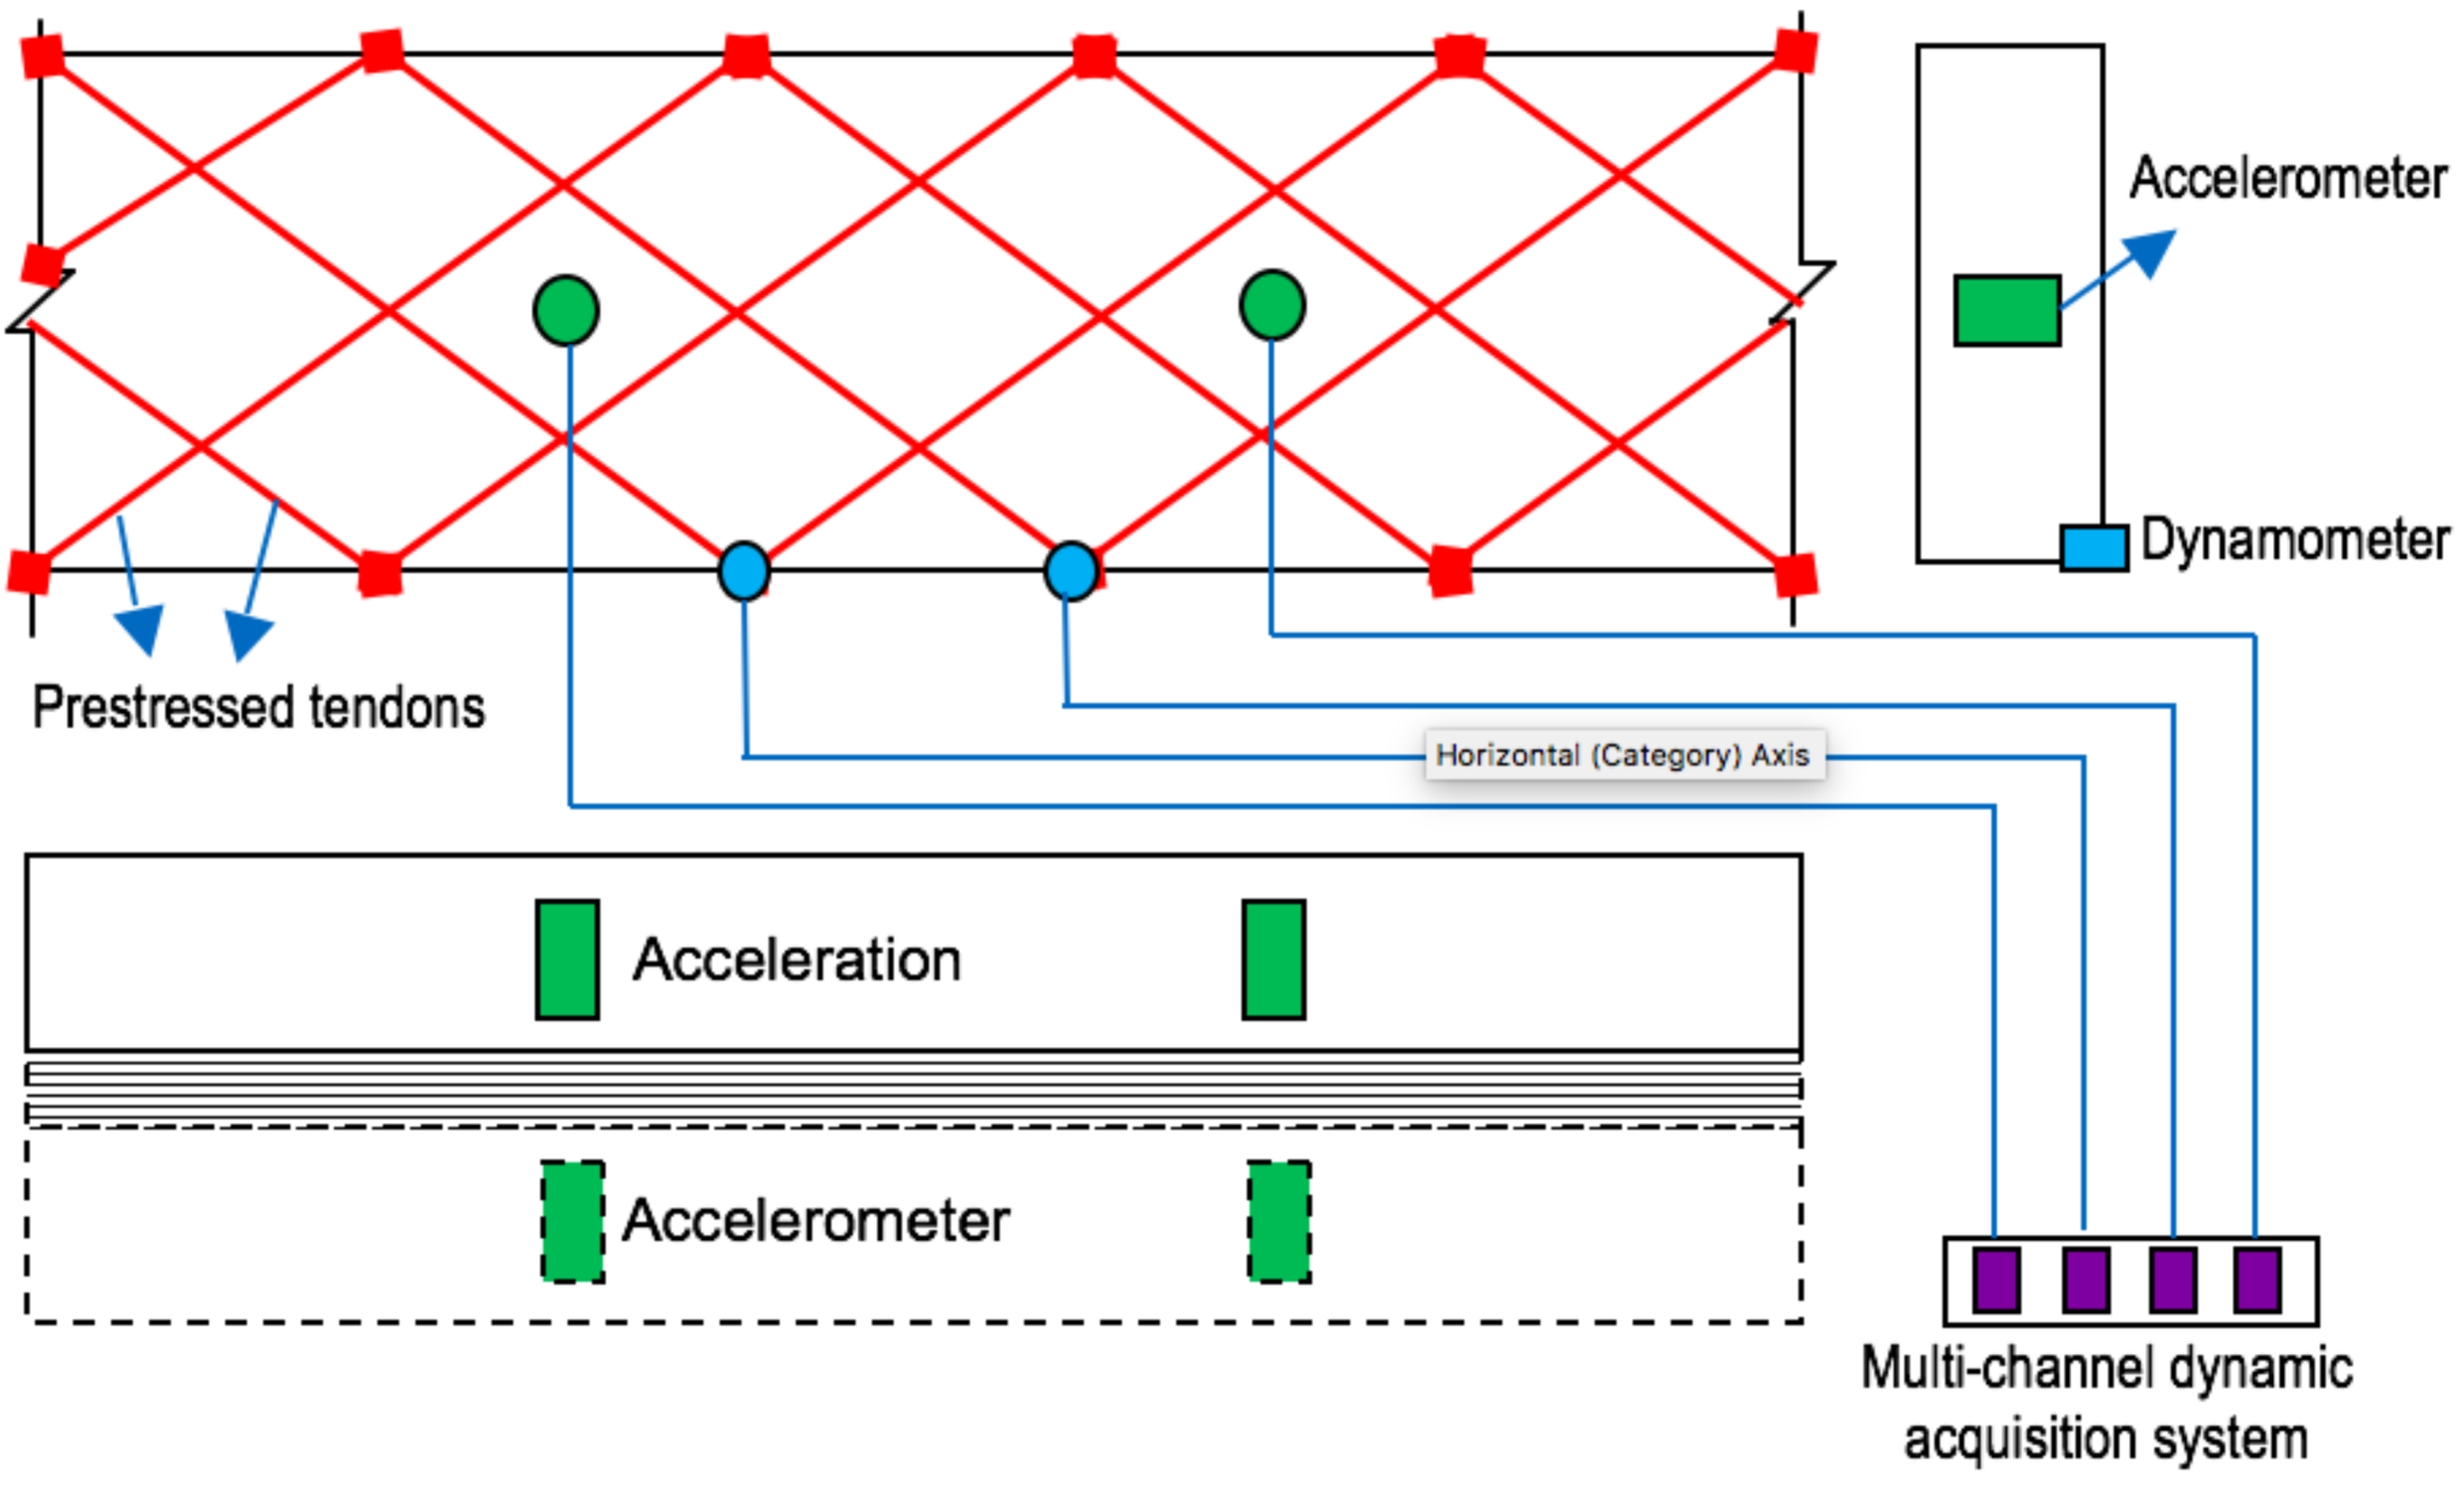
6.6. Pavement Monitoring System
7. Summary and Conclusions
- The cement concrete was designed based on the compressive strength and workability to meet the requirement of prestressed concrete in China;
- The possible buckling of concrete slab due to temperature change or prestressing was evaluated and it was determined that buckling would not occur under the natural temperature change in China;
- The required prestress applied on concrete slabs was obtained based on fracture criteria and fatigue criteria and the prestressed tendon spacing was obtained based on the stress analysis;
- The effect of slab thickness, tendon diameter, tendon distribution angle, and tendon spacing on the stress level within the concrete slab were analyzed in detail;
- Spiral indirect reinforcement on the side was applied to strengthen the anchorage area and regular reinforcement was applied on the top and bottom of the concrete slabs to improve the stress condition;
- The design of the anchorage area was verified based on regional stress analysis;
- The step-by-step construction of the oblique prestressed concrete pavement was described and the demonstration road section has performed well over the three years since traffic opening.
Author Contributions
Conflicts of Interest
References
- Hossain, M.; Hancock, J.; Wu, Z. Cross Tensioned Concrete Pavement. J. Transp. Eng. 2003, 129, 427–433. [Google Scholar] [CrossRef]
- Sargious, M.; Wang, S.K. Design of Prestressed Concrete Airfield Pavements under Dual and Dual Tandem Wheel Loading. J. Prestress. Concr. Inst. 1971, 16, 19. [Google Scholar] [CrossRef]
- Sargious, M.; Wang, S.K. Economical Design of Prestressed Concrete Pavements. J. Prestress. Concr. Inst. 1971, 16, 64. [Google Scholar] [CrossRef]
- Sargious, M. Performance of Transverse Joints in Prestressed and Reinforced-Concrete Airfield Pavements. J. Am. Concr. Inst. 1978, 75, 359–366. [Google Scholar]
- Merritt, K.D.; Tyson, S.S. Precast Prestressed Concrete Pavement Applications in the USA. In Proceedings of the First International Conference on Recent Advances in Concrete Technology; Amde, A.M., Sabnis, G., Tan, J.S.Y., Eds.; Destech Publications, Inc.: Lancaster, PA, USA, 2007; pp. 457–470. [Google Scholar]
- Zhang, D.; Xu, X.; Li, N.; Han, W. Research on the Design Method of Diagonal Post-Tensioned Prestressed Jointless Cement Concrete Pavement. In Proceedings of the ICCTP 2011: Towards Sustainable Transportation Systems, Nanjing, China, 14–17 August 2011; American Society of Civil Engineers: Reston, VA, USA, 2011. [Google Scholar]
- El-Reedy, M.A. Advanced Materials and Techniques for Reinforced Concrete Structures; CRC Press: Boca Raton, FL, USA, 2009. [Google Scholar]
- Wieckowski, A.; Sznurawa, A. Structural Aspects of Airfield Runways with Concrete Pavements. In Contemporary Challenges of Transport Systems and Traffic Engineering; Macioszek, E., Sierpinski, G., Eds.; Springer International Publishing AG: Cham, Switzerland, 2017; pp. 39–52. [Google Scholar]
- Li, N.; Han, S.; Yu, J.T.; Wang, H.F. Analysis of Bridge Deck Pavement Structure Interlayer Based on Different Interface Form. In Proceedings of the 10th International Conference of Chinese Transportation Professionals (ICCTP), Beijing, China, 4–8 August 2010; American Society of Civil Engineers: Reston, VA, USA, 2010. [Google Scholar]
- Guo, C.; Zhang, M.; Wang, Z.; Wang, X. Analysis of Cross Tensioned Concrete Pavement Damage. In Advances of Transportation: Infrastructure and Materials; Wang, H., Liu, Y., You, Z., Eds.; Destech Publications, Inc.: Lancaster, PA, USA, 2006; Volume 2, pp. 893–899. [Google Scholar]
- Han, S.; Chen, D.; Ling, C.; Zhang, D. Study on sliding layer of cross-tensioned concrete pavement. Road Mater. Pavement Des. 2015, 16, 518–535. [Google Scholar] [CrossRef]
- Li, N.; Zhang, D.; Xu, X.; Han, W. Numerical Simulation on Cross-Tensioned Prestressed Concrete Pavement. In Proceedings of the Fourth International Conference on Transportation Engineering, Chengdu, China, 19–20 October 2013; American Society of Civil Engineers: Reston, VA, USA, 2013. [Google Scholar]
- Tayabji, S. Precast Concrete Pavement Implementation by US Highway Agencies; The National Academies of Sciences, Engineering, and Medicine: Washington, DC, USA, 2015. [Google Scholar]
- Kawamura, N.; Maekawa, R.; Morohashi, K.; Shiji, A.; Kamitani, K. Development of high durable grout for airport prestressed concrete pavement. In Advances in Transportation Geotechnics II; CRC Press, Taylor & Francis Group: Boca Raton, FL, USA, 2012; pp. 259–264. [Google Scholar]
- Tomek, R. Advantages of Precast Concrete in Highway Infrastructure Construction. Procedia Eng. 2017, 196, 176–180. [Google Scholar] [CrossRef]
- Syed, A.; Sonparote, R.S. Analysis of Prestressed Precast Concrete Pavement. Mater. Today Proc. 2017, 4, 9713–9717. [Google Scholar] [CrossRef]
- Merritt, D.K.; McCullough, B.F.; Burns, N.H. Design-construction of a precast, prestressed concrete pavement for Interstate 10, El Monte, California. PCI J. 2005, 50, 18–27. [Google Scholar] [CrossRef]
- Qu, B.; Weng, X.; Zhang, J.; Mei, J.; Guo, T.; Li, R.; An, S. Analysis on the deflection and load transfer capacity of a prefabricated airport prestressed concrete pavement. Constr. Build. Mater. 2017, 157, 449–458. [Google Scholar] [CrossRef]
- Zhang, M.; Guo, C.; Lu, L.; Wang, X.; Wang, Z. Cross Tension Prestressed Concrete Pavements Temperature Stresses. In Advances of Transportation: Infrastructure and Materials; Wang, H., Liu, Y., You, Z., Eds.; Destech Publications, Inc.: Lancaster, PA, USA, 2016; Volume 2, pp. 947–954. [Google Scholar]
- Naddafi, M.F.; Sadeghi, V. Finite Element Investigation of the Prestressed Jointed Concrete Pavements. J. Fundam. Appl. Sci. 2016, 8, 167–178. [Google Scholar] [CrossRef]
- Kim, K.; Tia, M.; Greene, J. Evalution of Strauctural Behavior of Precast Prestressed Concrete Pavement with Finite Element Analysis. Transp. Res. Rec. 2016, 2590, 84–93. [Google Scholar] [CrossRef]
- Melhem, H.; Kim, H.S. Damage detection in concrete by Fourier and wavelet analyses. J. Eng. Mech. 2003, 129, 571–577. [Google Scholar] [CrossRef]
- China Academy of Building Research. JGJ 55-2000 Specification for Mix Proportion Design of Ordinary Concrete; China Building Industry Press: Beijing, China, 2001. [Google Scholar]
- Yan, Y.; Liu, C.; Huang, W. Structural Design of Continuous Reinforced Concrete Pavement as Overlay. J. China Foreign Highw. 2005, 5. (In Chinese) [Google Scholar]
- Zirakian, T.; Showkati, H. Experiments on Distortional Buckling of I-Beams. J. Struct. Eng. 2007, 133, 1009–1017. [Google Scholar] [CrossRef]
- Wei, W.; Dong, D. Prestress Loss Calculation due to Anchor Deformation. J. Archit. Sci. Eng. 2007, 24, 86–90. [Google Scholar]
- Wang, F. Study on the Structural Performace of Prestressed Highway Tunnel Pavement. Master’s Thesis, Chang’an University, Xi’an, China, 2013. (In Chinese). [Google Scholar]
- GB50422, Engineering Technical Standard of Prestressed Concrete Pavement; Ministry of Housing and Urban Construction: Beijing, China, 2007.
- Hazaree, C.; Wang, K.; Ceylan, H.; Gopalakrishnan, K. Capillary Transport in RCC: Water-to-Cement Ratio, Strength, and Freeze-Thaw Resistance. J. Mater. Civ. Eng. 2011, 23, 1181–1191. [Google Scholar] [CrossRef]
- Wu, J. The Design of Anchorage Area of Post-tensioning Concrete. Master’s Thesis, Tongji University, Shanghai, China, 2007. [Google Scholar]
- Zirakian, T.; Zhang, J. Elastic distortional buckling of singly symmetric I-shaped flexural members with slender webs. Int. J. Struct. Stab. Dyn. 2012, 12, 359–376. [Google Scholar] [CrossRef]
- Yan, X. The Application of Oblique Prestressed Concrete Pavement Technology Research. Master’s Thesis, Shenyang Jianzhu University, Shenyang, China, 2015. [Google Scholar]
- Ministry of Housing and Urban-Rural Development of China. GB 50422-2007: Technical Code for Engineerings of Prestressed Concrete Pavement; China Plan Publishing: Beijing, China, 2007.


| Aggregates | Mesh Size (mm) | 2.4 | 4.8 | 9.5 | 16.0 | 19.0 | 26.5 | 31.5 | |
| Coarse | Cumulative retained (%) | Upper limit | 100 | 100 | 90 | 75 | 60 | 35 | 5 |
| Lower limit | 95 | 90 | 75 | 60 | 40 | 20 | 0 | ||
| Fine | Mesh size (mm) | 0.15 | 0.30 | 0.60 | 1.18 | 2.36 | 4.75 | - | |
| Cumulative retained (%) | Upper limit | 100 | 92 | 70 | 50 | 25 | 10 | - | |
| Lower limit | 90 | 70 | 41 | 10 | 0 | 0 | - | ||
| Compositions | Design 1 | Design 2 | Design 3 |
|---|---|---|---|
| Water–cement ratio | 0.35 | 0.39 | 0.43 |
| Sand to coarse aggregate ratio | 0.49 | 0.47 | 0.45 |
| Cement mass percent | 17.9 | 19.7 | 20.3 |
| Sand mass percent | 24.4 | 23.3 | 22.2 |
| Coarse aggregates mass percent | 49.6 | 49.1 | 50.0 |
| Water mass percent | 7.8 | 7.8 | 7.3 |
| Superplasticizer mass percent | 0.2 | 0.2 | 0.2 |
© 2018 by the authors. Licensee MDPI, Basel, Switzerland. This article is an open access article distributed under the terms and conditions of the Creative Commons Attribution (CC BY) license (http://creativecommons.org/licenses/by/4.0/).
Share and Cite
Yu, L.; Yang, X.; Yan, X.; Zhang, X.; Zhao, T.; Duan, C.; Mills-Beale, J. Design and Construction of Oblique Prestressed Concrete Pavement: A Case Study in China. Appl. Sci. 2018, 8, 607. https://0-doi-org.brum.beds.ac.uk/10.3390/app8040607
Yu L, Yang X, Yan X, Zhang X, Zhao T, Duan C, Mills-Beale J. Design and Construction of Oblique Prestressed Concrete Pavement: A Case Study in China. Applied Sciences. 2018; 8(4):607. https://0-doi-org.brum.beds.ac.uk/10.3390/app8040607
Chicago/Turabian StyleYu, Ling, Xu Yang, Xiaohui Yan, Xiaowei Zhang, Ting Zhao, Cong Duan, and Julian Mills-Beale. 2018. "Design and Construction of Oblique Prestressed Concrete Pavement: A Case Study in China" Applied Sciences 8, no. 4: 607. https://0-doi-org.brum.beds.ac.uk/10.3390/app8040607