Article

Fusion of Spectra and Texture Data of Hyperspectral Imaging for the Prediction of the Water-Holding Capacity of Fresh Chicken Breast Filets

1
College of Engineering, China Agricultural University, Beijing 100083, China
2
Quality & Safety Assessment Research Unit, U. S. National Poultry Research Center, USDA-ARS, 950 College Station Rd., Athens, GA 30605, USA
*
Author to whom correspondence should be addressed.
Submission received: 11 February 2018 / Revised: 3 April 2018 / Accepted: 3 April 2018 / Published: 20 April 2018
(This article belongs to the Special Issue Hyperspectral Chemical Imaging for Food Authentication)

Abstract

:
This study investigated the fusion of spectra and texture data of hyperspectral imaging (HSI, 1000–2500 nm) for predicting the water-holding capacity (WHC) of intact, fresh chicken breast filets. Three physical and chemical indicators—drip loss, expressible fluid, and salt-induced water gain—were measured to be different WHC references of chicken meat. Different partial least squares regression (PLSR) models were established with corresponding input variables including the full spectra, key wavelengths, and texture variables, as well as the fusion data of key wavelengths and the corresponding texture variables, respectively. The results demonstrated that for drip loss and expressible fluid, texture data was an effective supplement to spectra data, and fusion data as an input variable could effectively improve the predictive ability of the independent prediction set (Rp = 0.80, RMSEp = 0.80; Rp = 0.56, RMSEp = 2.10). While the best model to predict salt-induced water gain was based on key wavelengths (Rp = 0.69, RMSEp = 18.04), this was mainly because salt-induced water gain was measured on mince samples, which lacked the important physical structure to represent the texture information of meat. Our results of this study demonstrated the potential to further improve the evaluation of the WHC of chicken meat by HSI.

1. Introduction

Chicken breast meat is considered to be an important protein source in healthy diets, and its consumption is increasing worldwide [1]. Nowadays, chicken breast meat with quality assurance is becoming more expected and pursued by consumers. Water-holding capacity (WHC) is defined as the ability of muscle to retain water or resist water loss and is determined by a series of complicated physical structures and chemical components of chicken meat (i.e., diameter and density of muscle fibers and the integrity of connective tissue, as well as myofibrillar protein and collagen content) [2,3,4,5]. Meanwhile, a change in WHC is usually expressed as a change in texture in the meat to a large extent [6].
WHC is directly related to other sensory and physio-chemical traits, such as tenderness, juiciness, color, and pH value, thereby influencing consumers’ willingness to pay for meat products [7,8,9]. In addition, WHC is closely related to economic benefits, as it is well-known that chicken meat products are always sold by weight, and any water loss leads to a total weight reduction [10]. Thus, the evaluation of WHC of chicken meat is important for both producers and consumers. However, the conventional methods to determine WHC, such as gravimetric method, centrifugation method, and filter paper wetness method, are laborious, destructive, and extremely time-consuming [11,12]. There is a need for a rapid and nondestructive method of WHC evaluation, which will bring great benefits for the chicken meat industry.
Optical techniques are one of the feasible ways to replace those conventional methods of WHC evaluation based on its advantages of fast, non-invasive, simultaneous detection of multiple traits [13,14]. Visible and near-infrared spectroscopy (Vis/NIRS) has been widely tested to measure quality traits of meat and meat product, and good results have been achieved [15,16,17]. However, the limited capacity to estimate WHC by Vis/NIRS has been confirmed by many researchers [18,19] because Vis/NIRS can only measure a small sample area with limited spatial information to reflect the heterogeneity of meat, which is related to the values of WHC [20]. On the other hand, computer vision provides abundant information of a sample at the pixel-wise level and has been used for evaluating meat quality [21,22]. However, computer vision has a limited capacity for detecting chemical components, such as water, fat, and protein, as it only works in the visible spectral range.
Hyperspectral imaging (HSI) with its advantage of providing both spectral and spatial information of samples simultaneously is receiving a growing interest and attention in the meat industry [23,24]. Spectral information can effectively reflect the chemical components within the meat [25,26,27], while spatial information can evaluate important physical qualities of meat, such as size, shape, texture, etc. In particular, texture can be used as an effective tool for reflecting the surface information of chicken breast filets, such as the distribution of muscle fibers, fat, and fascia [28,29]. Some studies have tested the fusion of spectral and spatial information of HSI for predicting the WHC of fish and red meat [8,30], and the results demonstrated that the prediction accuracy can be improved. However, there is a lack of relevant research reports on fusion data for predicting the WHC of chicken meat. Thus, HSI is an ideal tool that shows great potential in predicting the WHC of chicken meat.
The main objective of this study was to investigate the fusion of spectra and texture data to enhance the hyperspectral prediction ability of the water-holding capacity of intact chicken breast filets (pectoralis major). The specific objectives were to (1) build robust partial least squares regression (PLSR) models to quantitatively relate full spectral information with three reference WHC indicators (i.e., drip loss, salt-induced water gain, and expressible fluid), (2) extract the key wavelength linked to each WHC trait from established PLSR models, (3) extract the texture of WHC traits from the selected key wavelength images, (4) fuse the key wavelengths and texture data by feature level fusion method, and (5) compare the model performance base on different input variables (full spectra, key wavelengths, texture, and fusion data of key wavelengths and texture) and determine the best prediction model for each WHC indicator.

2. Materials and Methods

2.1. Sample Preparation

A total of 90 boneless breast filets (2 h postmortem) were collected after water chill (prechill and chill time averaged 60–65 min) from a commercial processing plant on six separate trial dates. The filets were placed on ice and transported to the laboratory (Russell Research center, USDA, Athens, GA, USA) within 15 min. Each filet was trimmed to remove skin, fat tissue, and bones before further analysis. The key steps of the experimental procedure are presented in Figure 1.

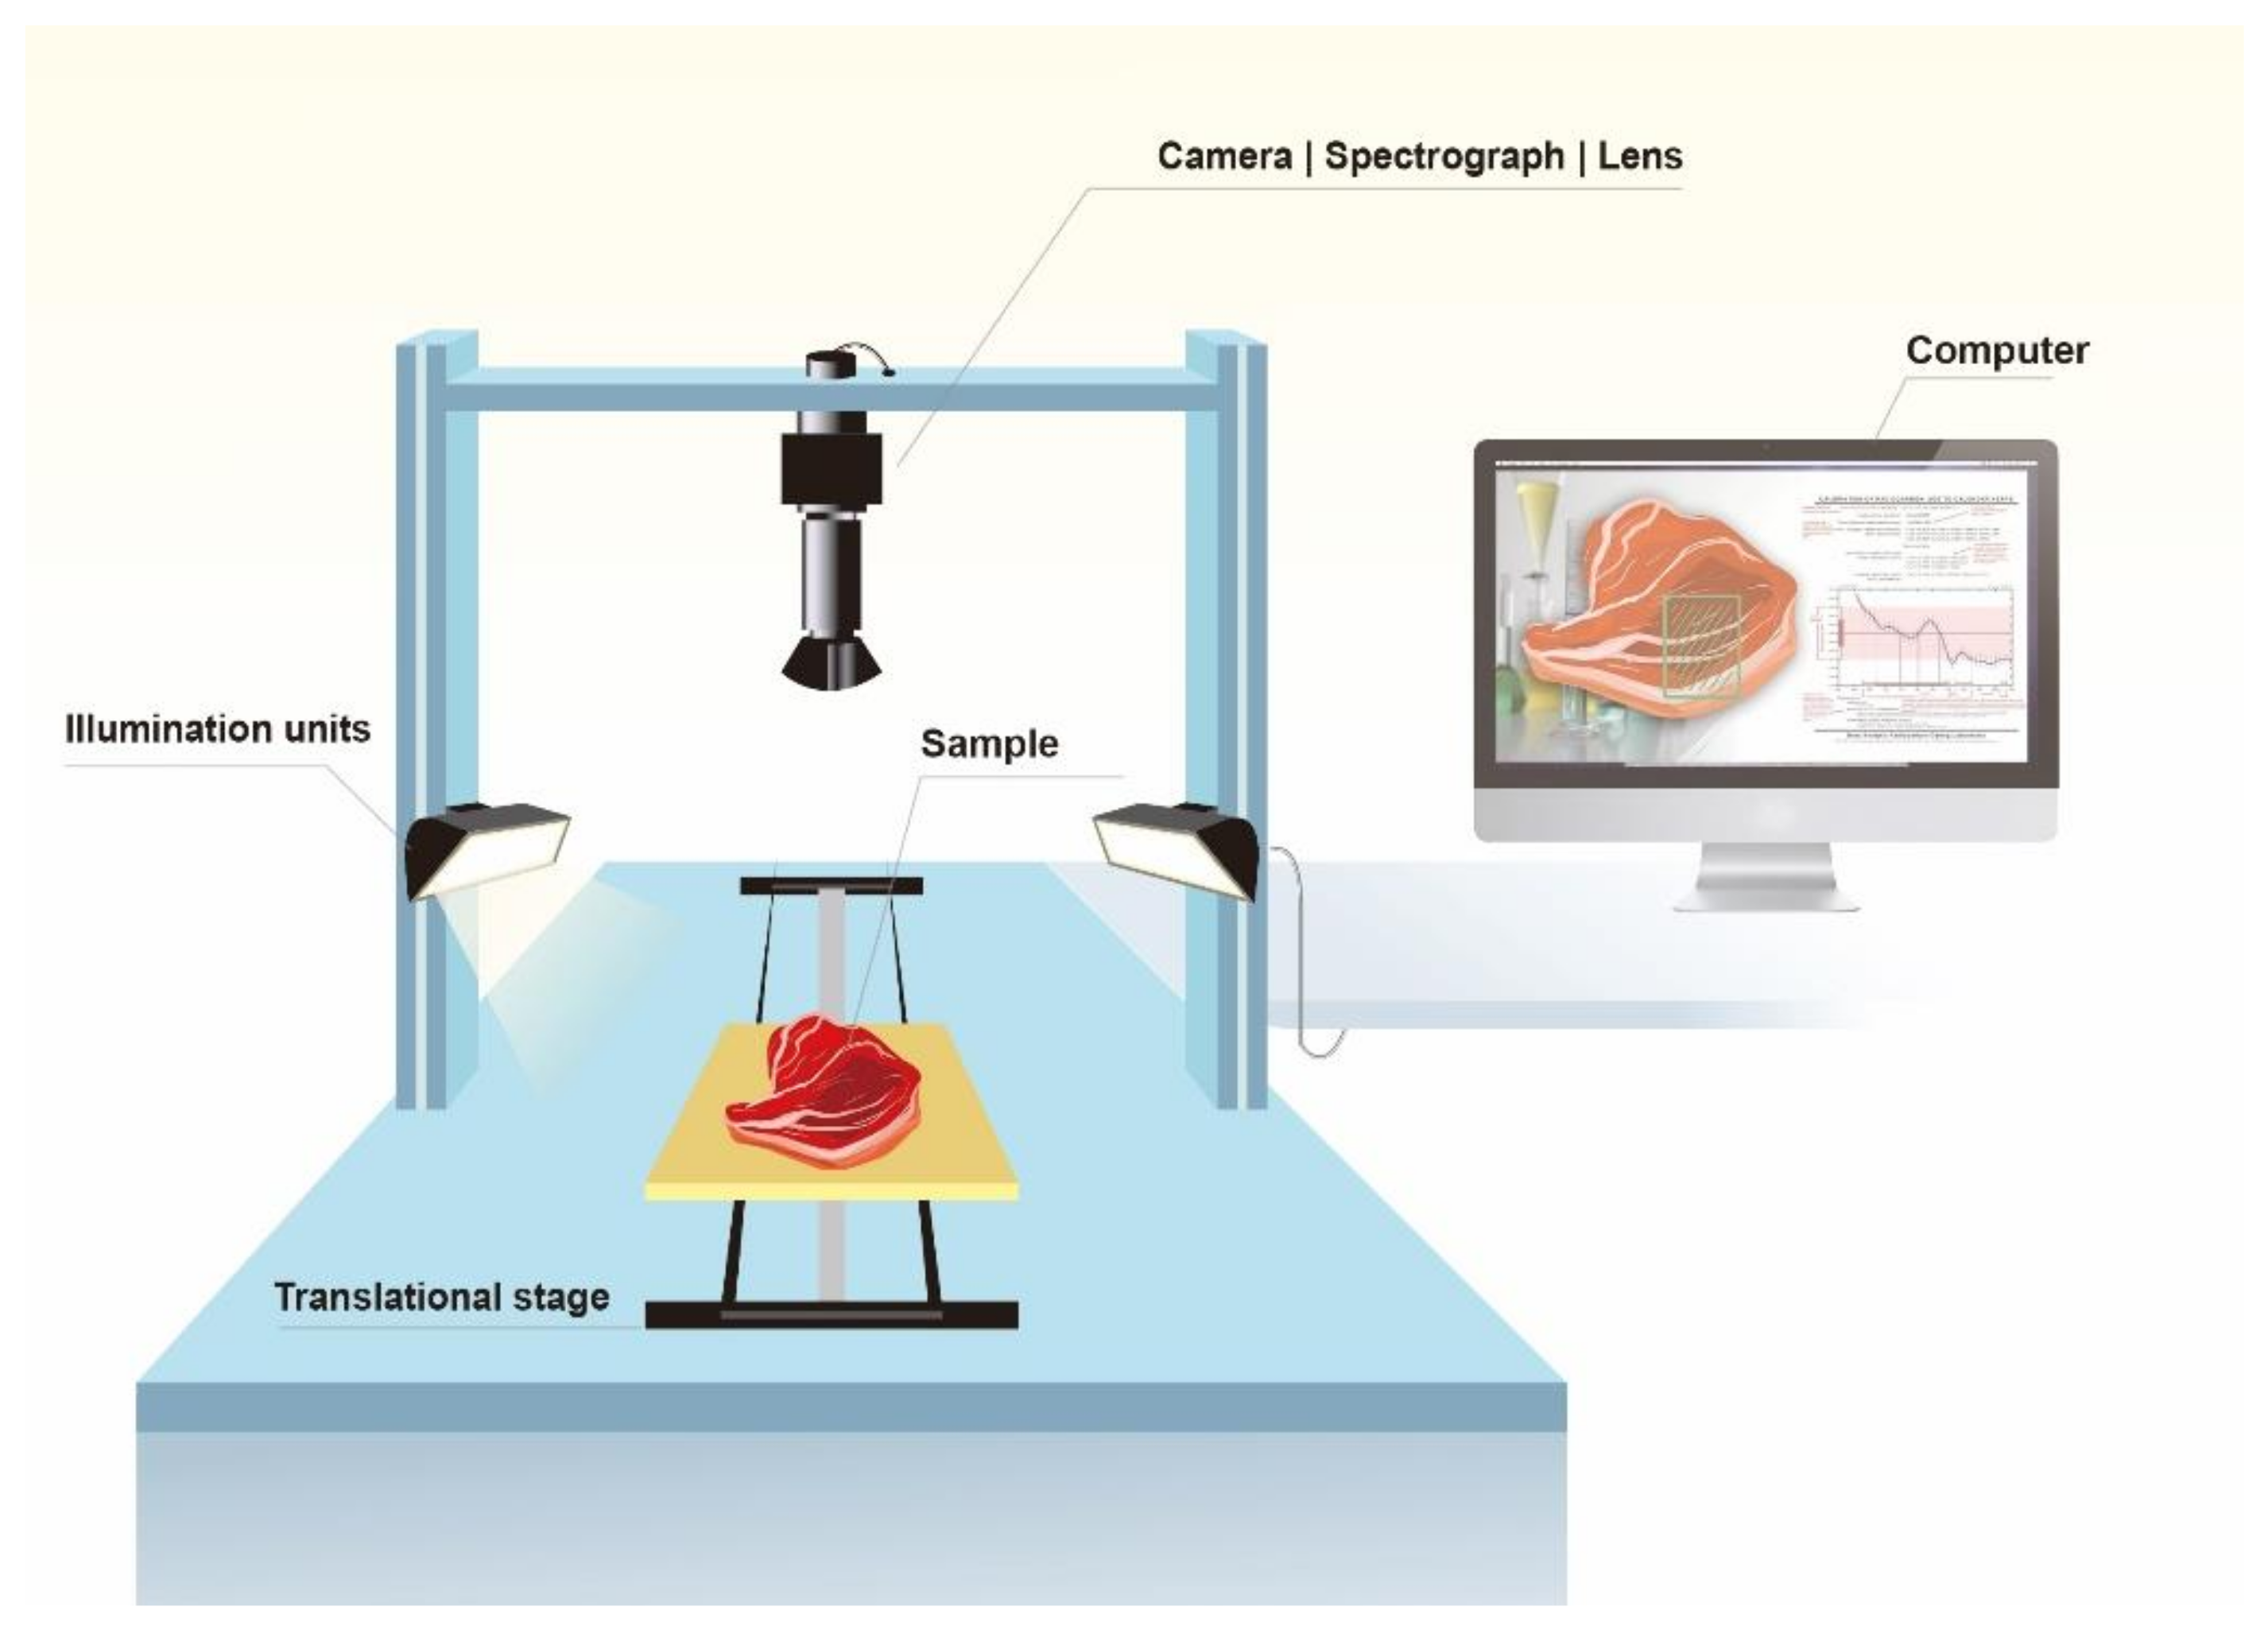
2.2. Hyperspectral Imaging System

2.2.1. Configuration and Main Components of the System

Spectral images were acquired in the reflectance mode using a push broom line-scanning HSI system, as shown in Figure 2. The system consisted of a spectrograph (Hyperspec SWIR, Headwall Photonics, Fitchburg, MA, USA), a digital camera with a Peltier-cooled 320 × 256 mercury-cadmium-telluride (MCT) detector (MCT-851 XC403, XenICs, Leuven, Belgium), a 30.7 mm front lens (OLES30, Specim, Oulu, Finland), an illumination unit comprised of two tungsten-halogen lamps (Fiber Lite A-240L and A-240P, Dolan-Jenner Industries, Boxborough, MA, USA), a translation stage (TLSR300B, Zaber Technologies, Inc., Vancouver, BC, Canada), a data acquisition software (written inhouse), and a computer.

2.2.2. Hyperspectral Image Acquisition and Calibration

Each filet was placed on the linear translation stage and then conveyed to the field of view of camera with adjusted speed and exposure time to be scanned line by line. These individual lines of data were then compiled into a single, coherent, raw hyperspectral image and then saved in the computer before being processed. The raw hyperspectral image for each filet contains both spectral and spatial information in the spectral range of 1000–2500 nm with a total of 198 bands. Thus, the final hyperspectral images have a dimension of 320 pixels × 320 pixels × 198 bands. The entire image acquisition process was controlled using inhouse software.
To correct the raw, acquired hyperspectral images (R), two extra images for dark (D) and standard white (W) references were used to eliminate the influences from the bright and dark response. The dark image (0% reflectance) was acquired by recording a spectral image after turning off the light source and completely covering the camera lens. The white reference image was obtained by collecting a spectral image from a uniform white calibration tile (75% reflectance). The calibrated image (I) was then calculated using the following equation:
Ii = (Ri-Di)/(Wi-Di),
where i is the pixel index (i.e., i = 1, 2, 3, …, n) and n is the total number of pixels. The final corrected spectral images were used as the basis for subsequent spectral extraction and data analysis.

2.3. Measurement of Water-Holding Capacity (WHC)

In this study, water-holding capacity was measured by three methods, which are drip loss, salt-induced water gain, and expressible fluid. They represent different water characteristics in meat and had different indications for meat functionality.

2.3.1. Drip Loss

Drip loss is commonly used to indicate the capability of the muscle to hold water, especially the free water (unbound water) that comes out from meat due to gravity. Drip loss was measured according to the modified procedure of previous study [31]. Chicken breast samples (30 g) were removed from the central portion of filets, weighted, and placed on a mesh screen in a covered plastic container for 48 h at 2 °C. Drip loss (%) was calculated as (100 × (weight of drip/initial sample weight)) [12].

2.3.2. Expressible Fluid

Expressible fluid measures the release of juice from meat after application of external forces and consists of both extracellular and intracellular free and loosely bound water. Expressible fluid was measured by the filter paper press method [32]. Chicken breast samples (300 mg) were placed on filter paper (11 cm diameter), which had been dried before use, and pressed at 50 kg (a 50 kg load cell) for 5 min by a TA-XTPlus texture analyzer (Stable Micro Systems Inc., Surry, UK). The filter paper was then scanned into a computer with a scanner. The meat area and the total fluid area were measured using Adobe Photoshop CS3 Extended (Adobe Systems Inc., San Jose, CA, USA). Expressible fluid (%) was calculated as (100 × (fluid area/total wet area)) [12].

2.3.3. Salt-Induced Water Gain
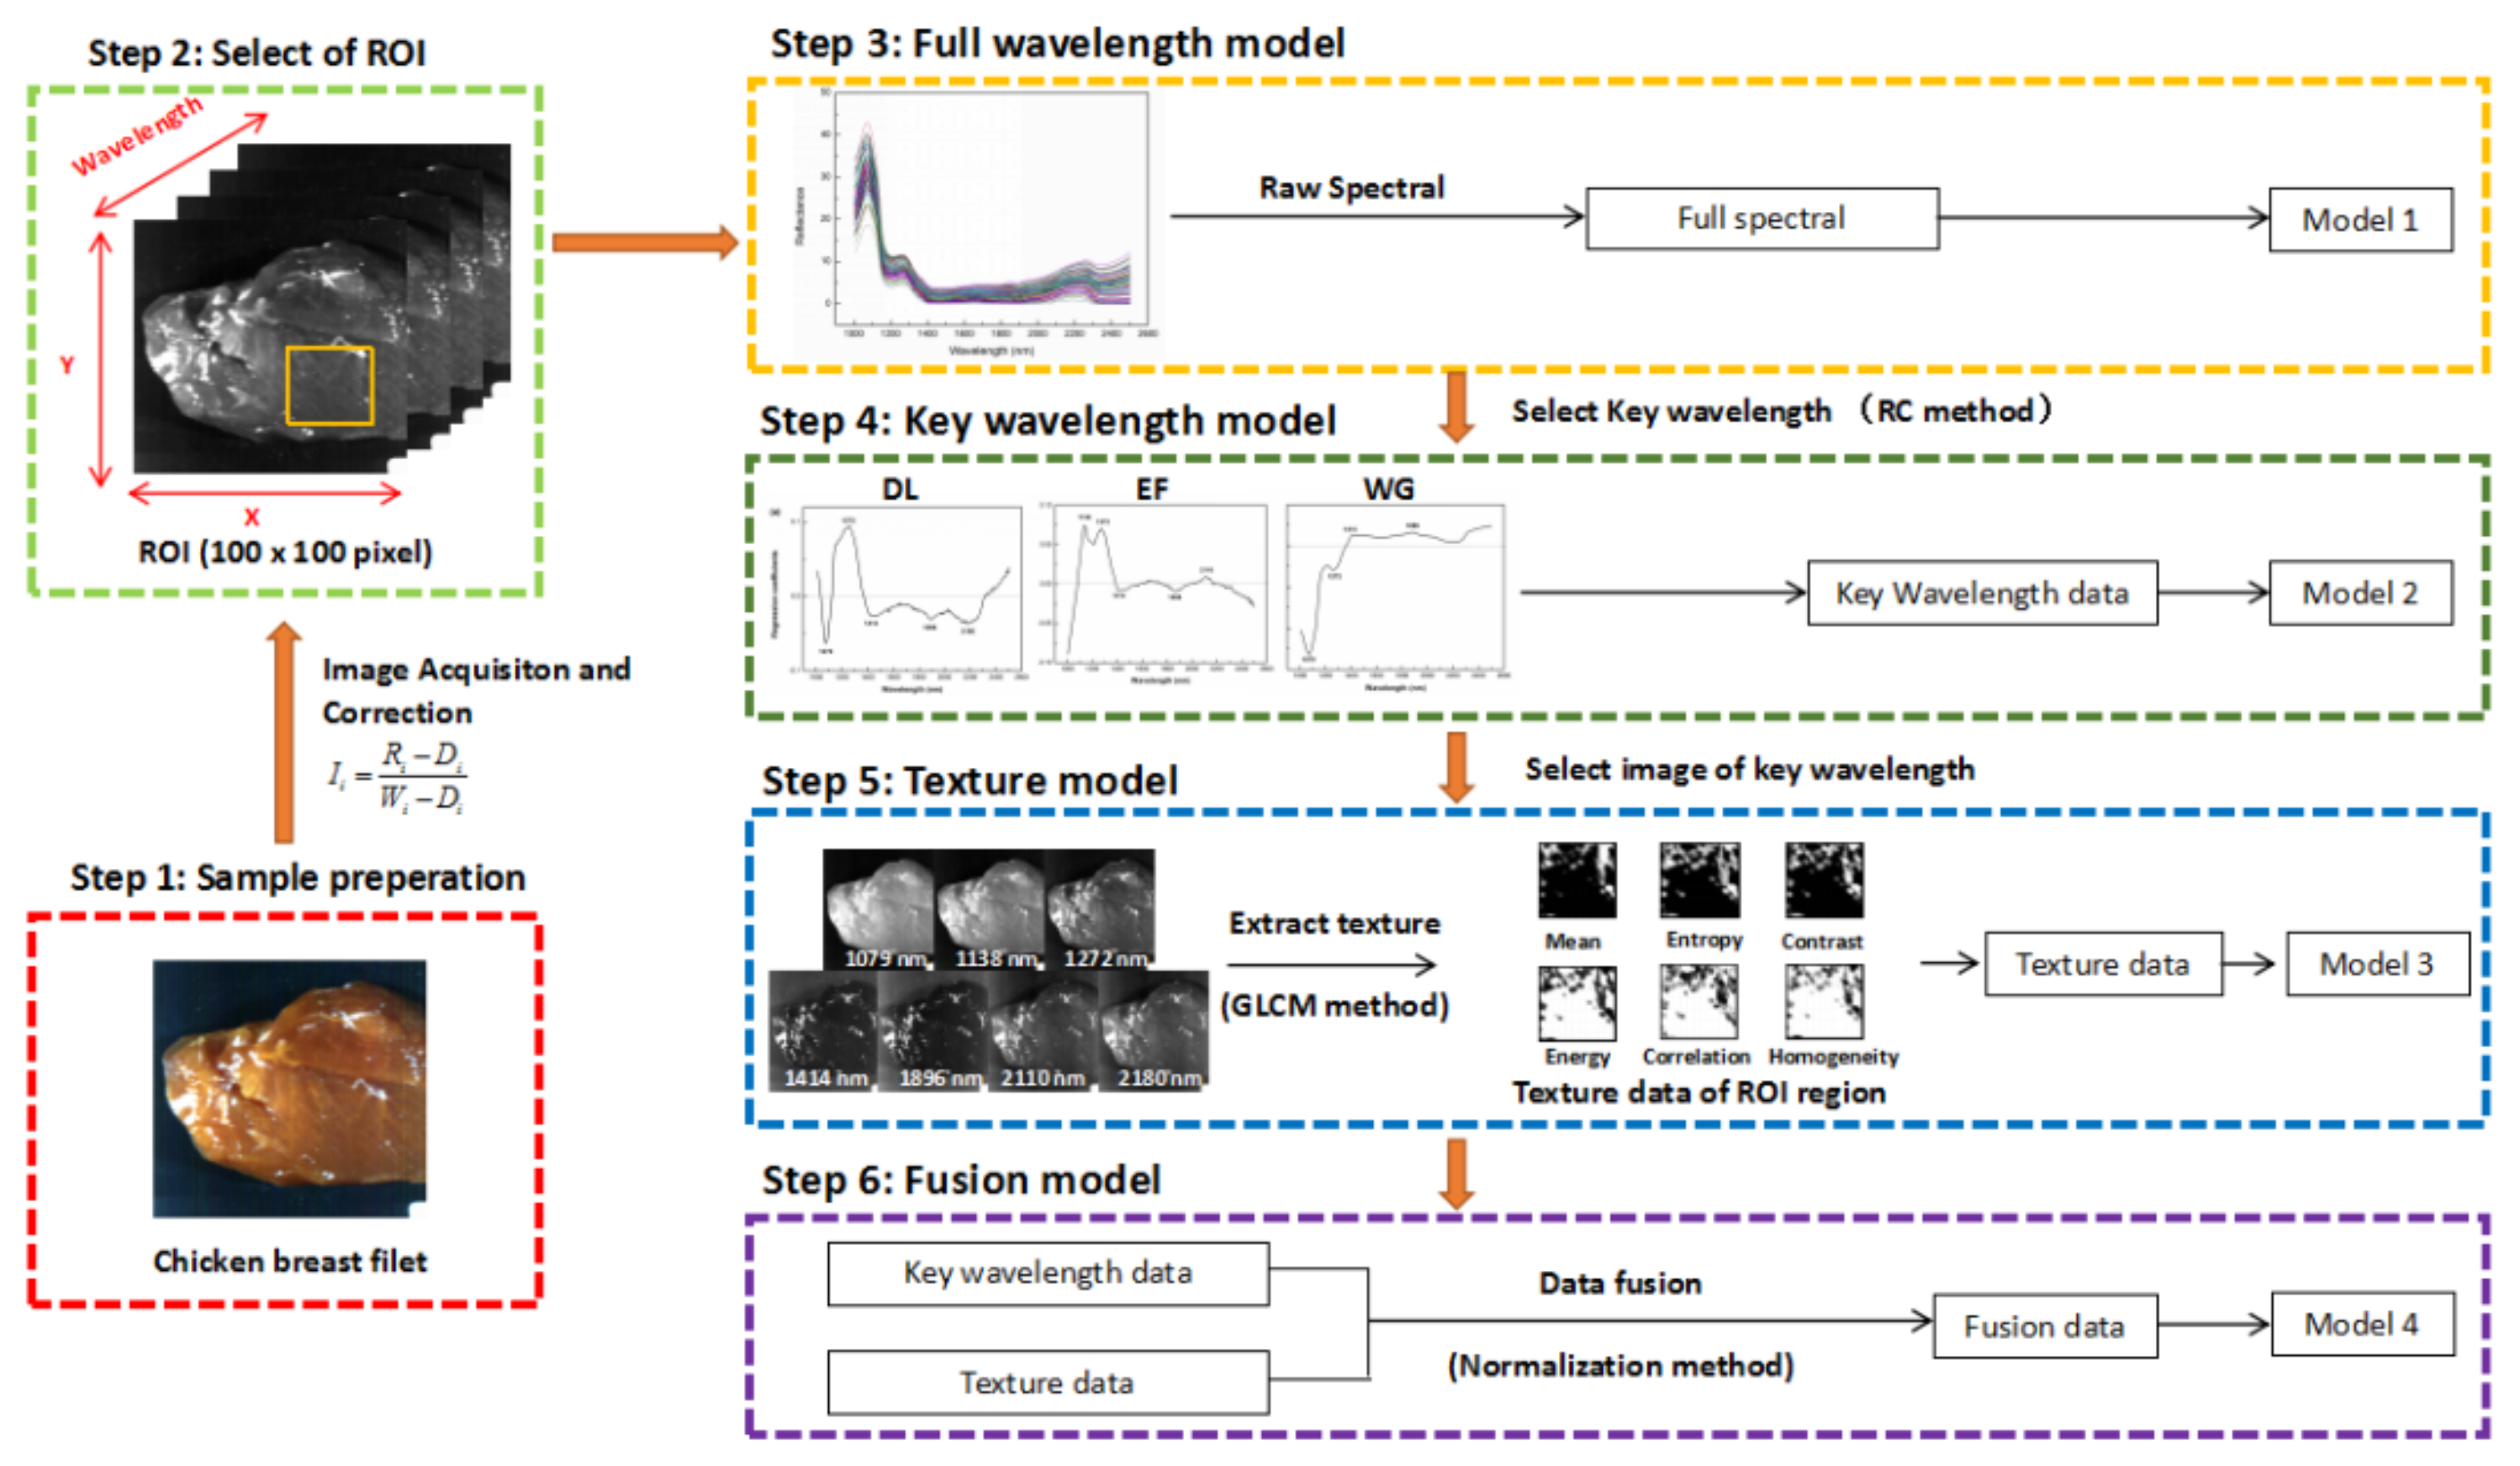
Salt-induced water gain indicates the maximal potential for muscle to gain water in the presence of salt. Salt-induced water gain was measured by a swelling and centrifugation method [33]. The minced samples (10 g) and 15 mL of 0.6 M NaCl solution were added to a 50-mL centrifuge tube and mixed with a Vortex mixer for 1 min. Before being centrifuged (3000× g for 15 min), the tube was refrigerated at 4 °C for 15 min. After centrifugation, the excess liquid was decanted, and the sample was reweighed. Salt-induced water gain was expressed as the percentage of weight gained by the pellet (100 × (final weight − initial weight)/initial weight)) [2].

2.4. Data Analysis

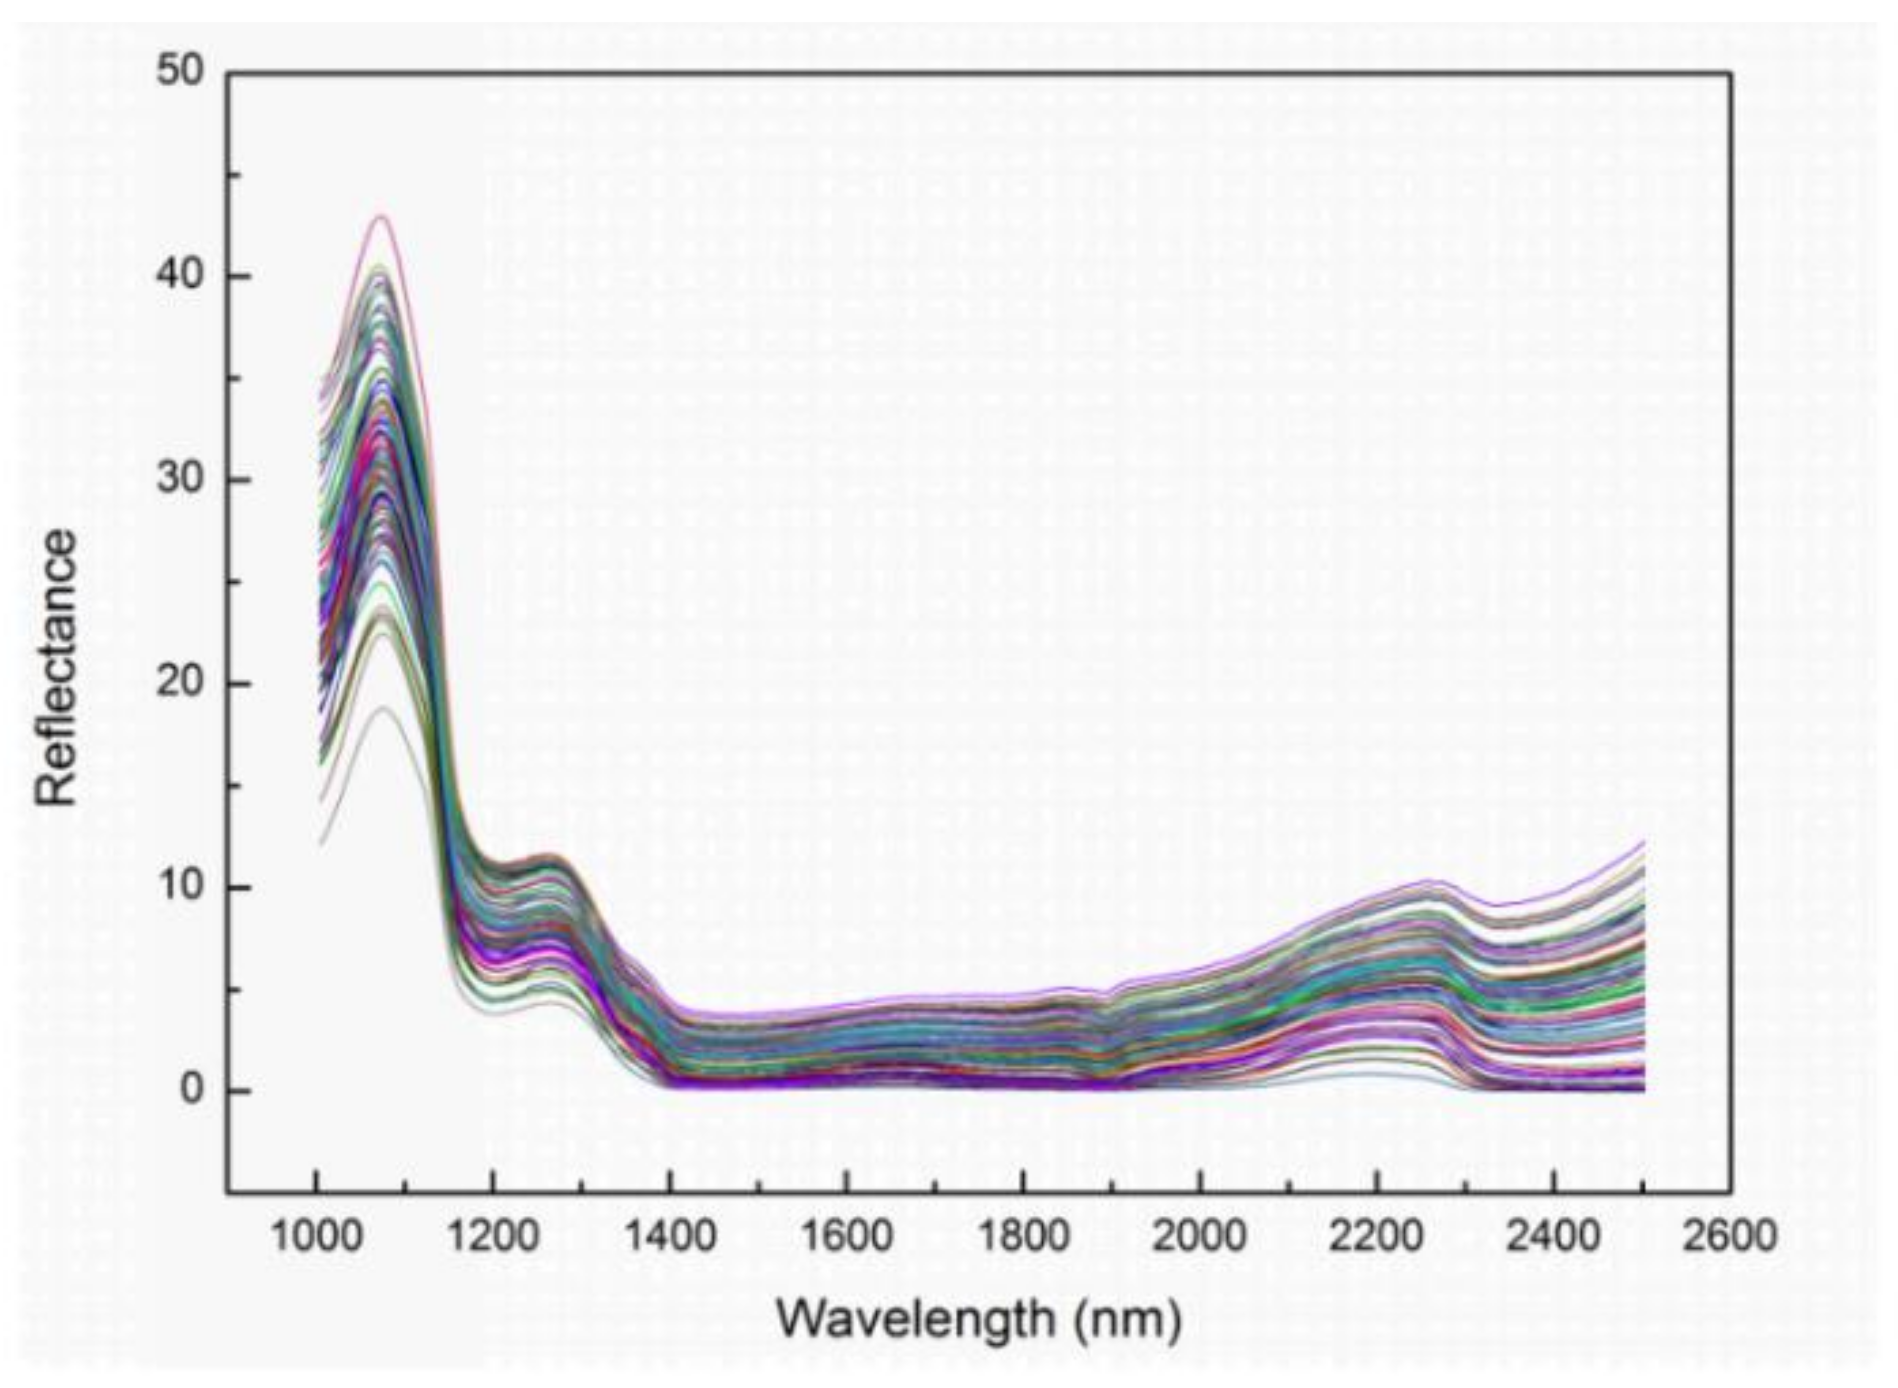
2.4.1. Spectral Data Extraction

A square region of 100 × 100 pixels around the center of each filet in the calibrated image was taken as the region of interest (ROI), where the WHC traits had been measured. All spectral data of each pixel contained in the ROI were extracted and averaged into one mean spectrum, which stood for the filet. After all filets finished this procedure, a spectral matrix of 90 samples × 198 bands was constructed. The identification of ROIs and extraction of spectral data from the ROIs were carried out using ENVI 4.8 (Exelis Visual Information Solutions, Boulder, CO, USA).

2.4.2. Prediction Model

Partial least square regression (PLSR), a popular multivariate data analysis method is applicable to spectral analysis [19]. In this study, PLSR models were individually established to represent quantitative relationships between information data (full spectra, key wavelengths, texture data, and fusion data) and three reference WHC traits of the samples. Full cross validation was applied to validate the prediction and avoid over-fitting of the PLSR models [11]. Finally, the samples from an independent prediction set were used to verify the predictive ability of the established PLSR model. The model performance was evaluated by the coefficient of calibration (Rc), the root-mean-square error estimated by calibration (RMSEc), the coefficient of cross-validation (Rcv), the root-mean-square error estimated by cross-validation (RMSEcv), the coefficient of independent prediction (Rp), and the root-mean-square error estimated by independent prediction (RMSEp). Commonly, the model, which has high coefficients of determination (Rc, Rcv, and Rp) and low root-mean-square error (RMSEc, RMSEcv, and RMSEp) as well as a small difference between RMSEc, RMSEcv, and RMSEp, is considered to be the desired model [27]. All predictive model development procedures were carried out by Unscrambler X 10.1 software (CAMO, Trondheim, Norway).

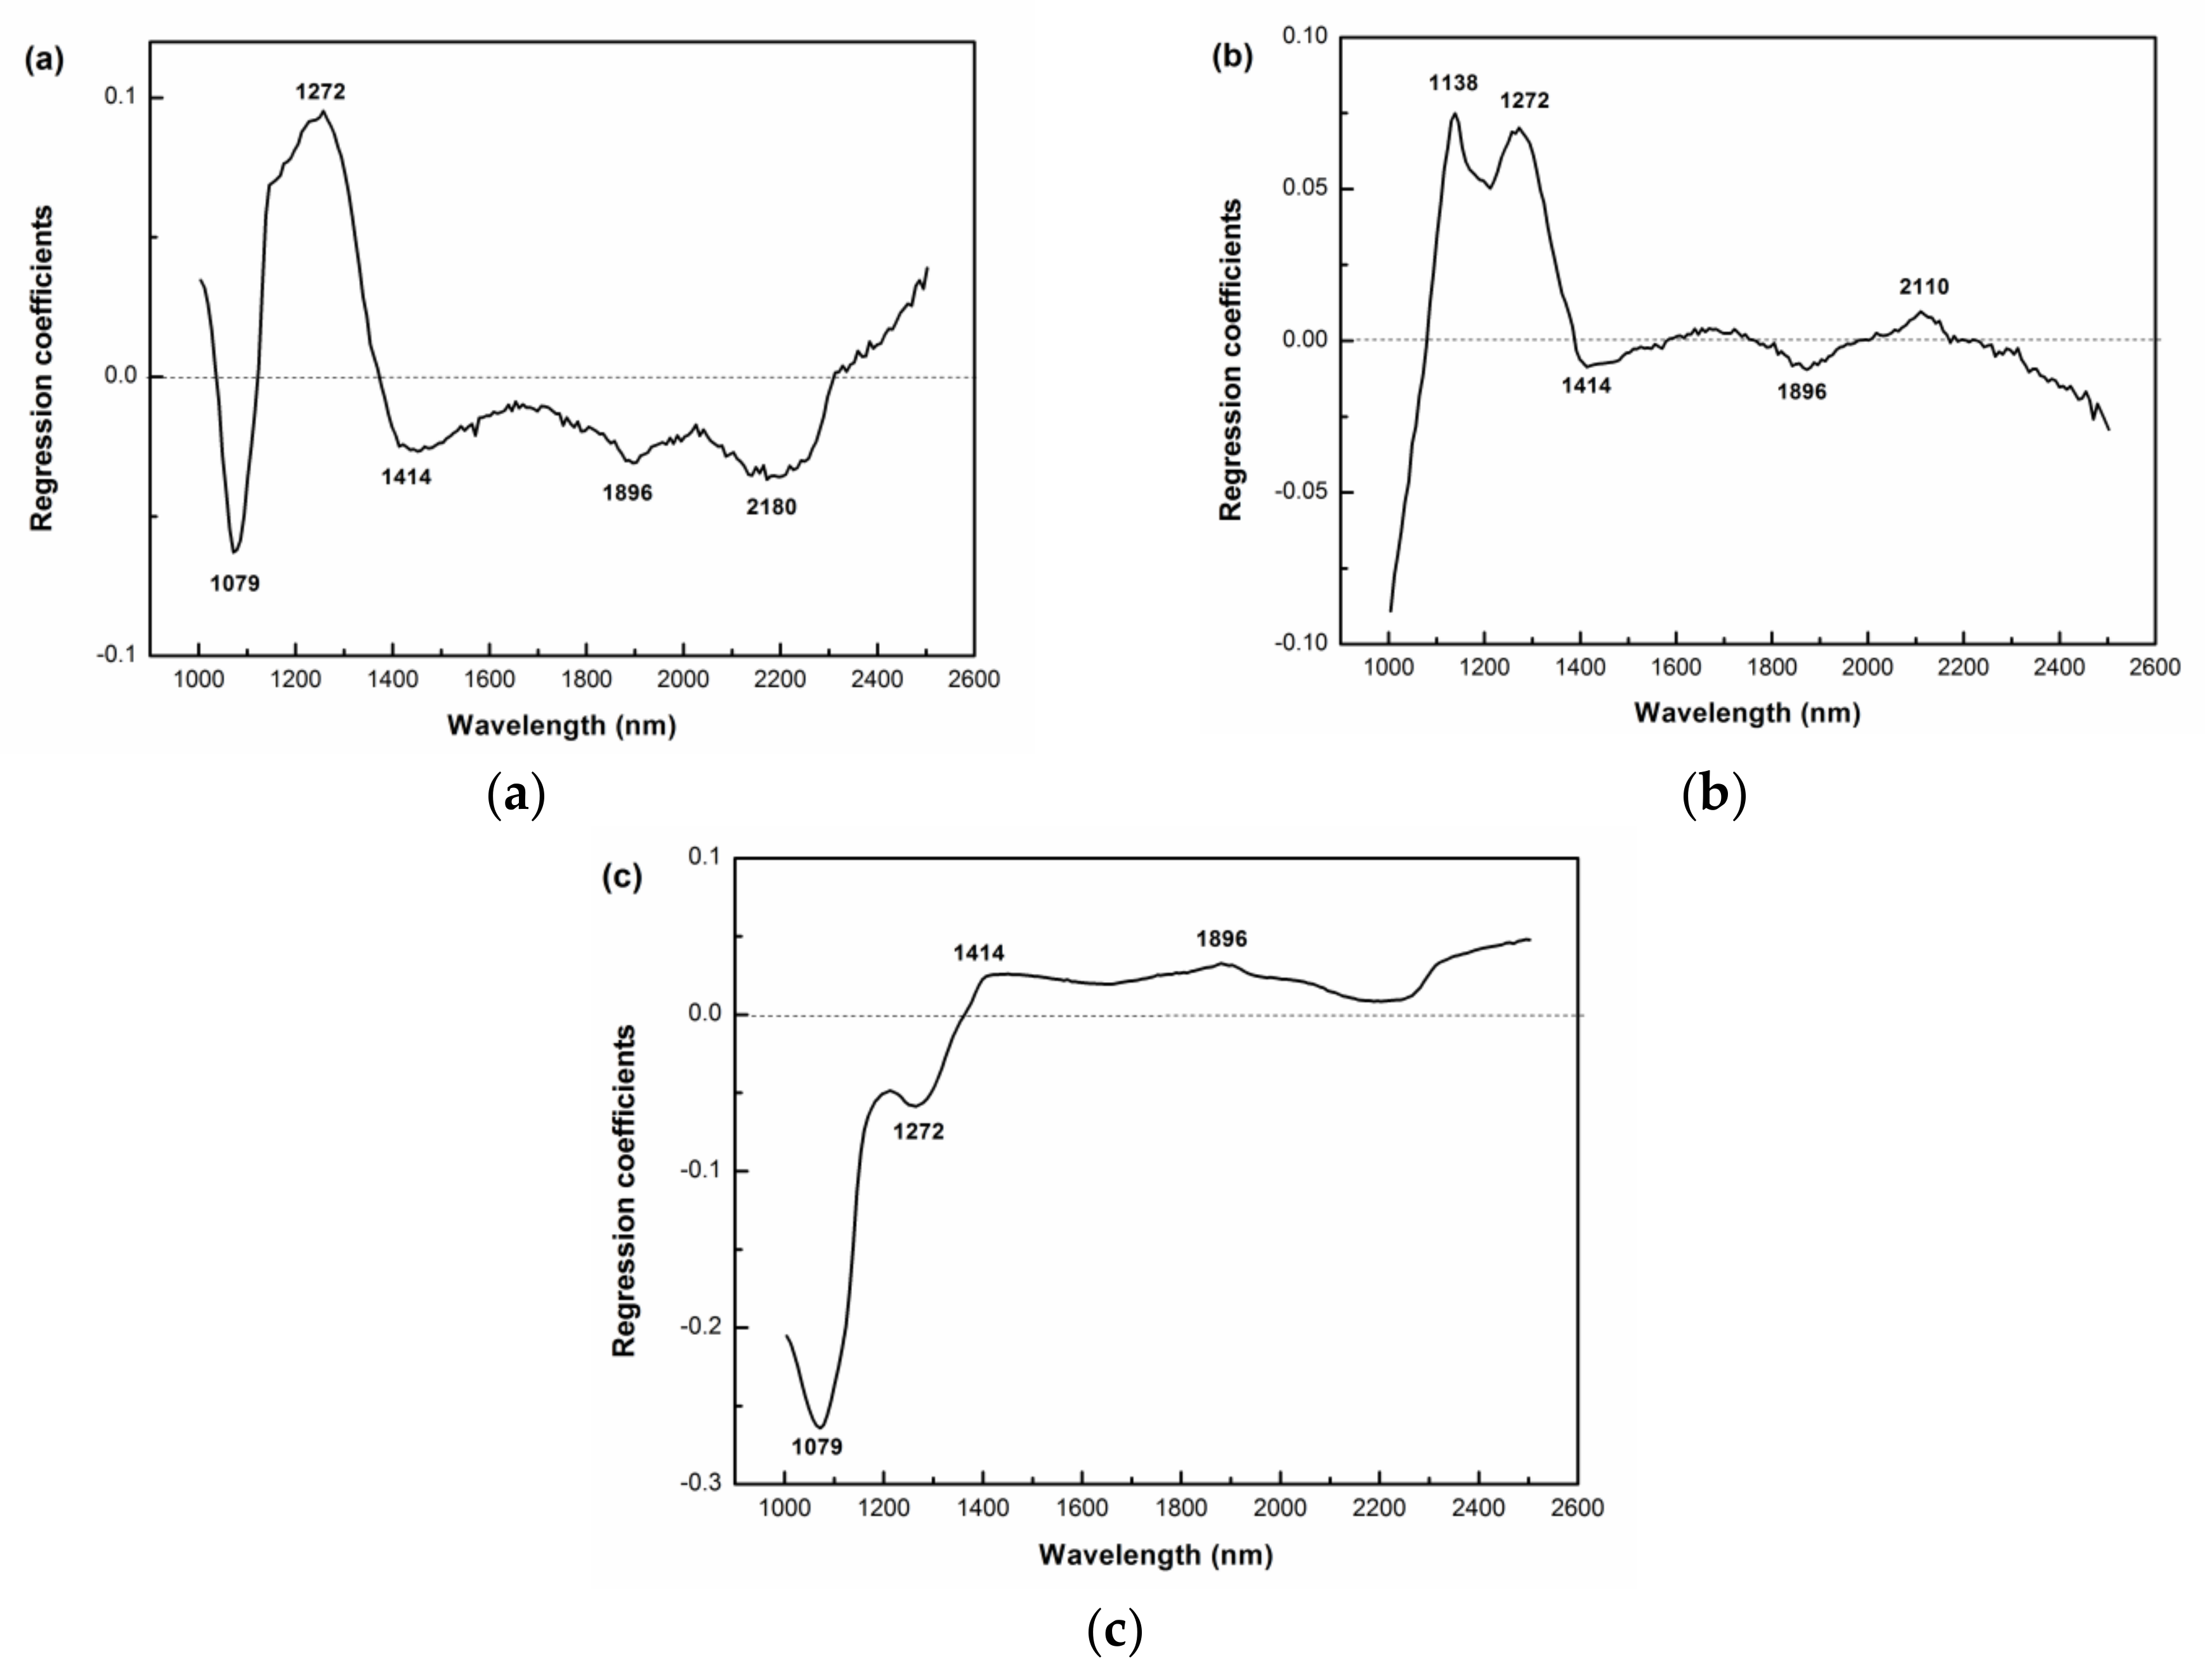
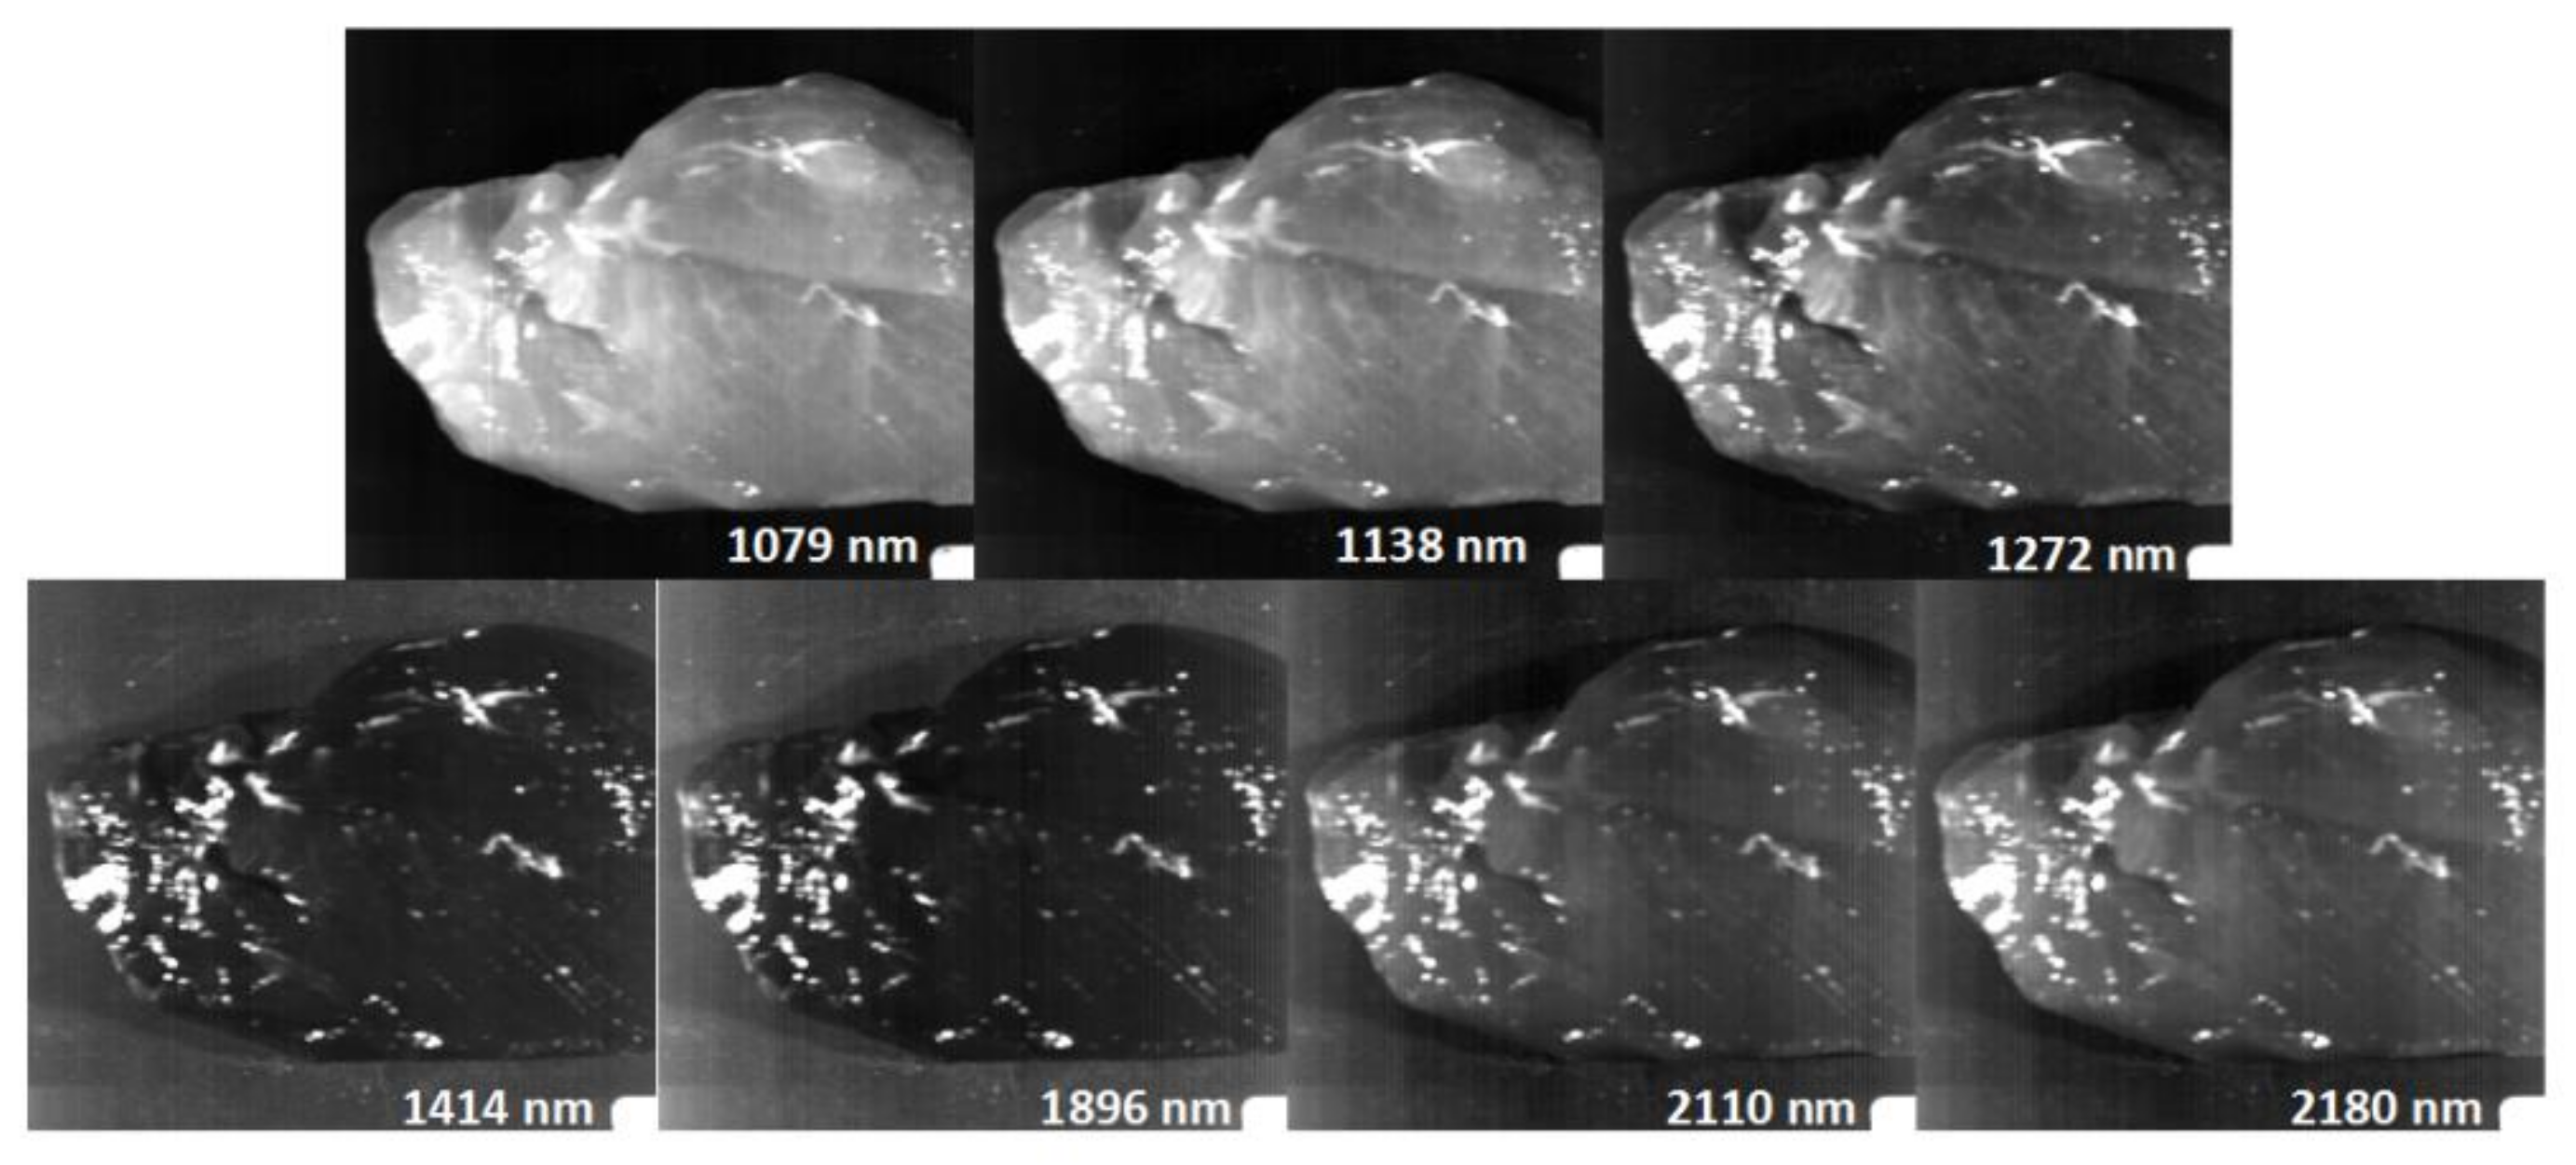
2.4.3. Selection of Key Wavelengths

Owing to data redundancy among contiguous wavelengths of hyperspectral images, the number of wavelengths needs to be reduced. The wavelengths carrying the most useful information should be selected as key wavelengths for simplifying the PLSR models [34]. These selected key wavelengths can be a guide to facilitate the modeling procedure, interpret the predicted results, and develop the lower price and higher speed instrument for online practice [5]. In this study, the regression coefficients resulting from the established full spectra PLSR prediction model were used to identify the key wavelengths, which contributed most to WHC trait prediction of the chicken breast filet. Wavelengths having large regression coefficient values (regardless of the sign) were considered as good candidates for effective prediction [10] in this work.

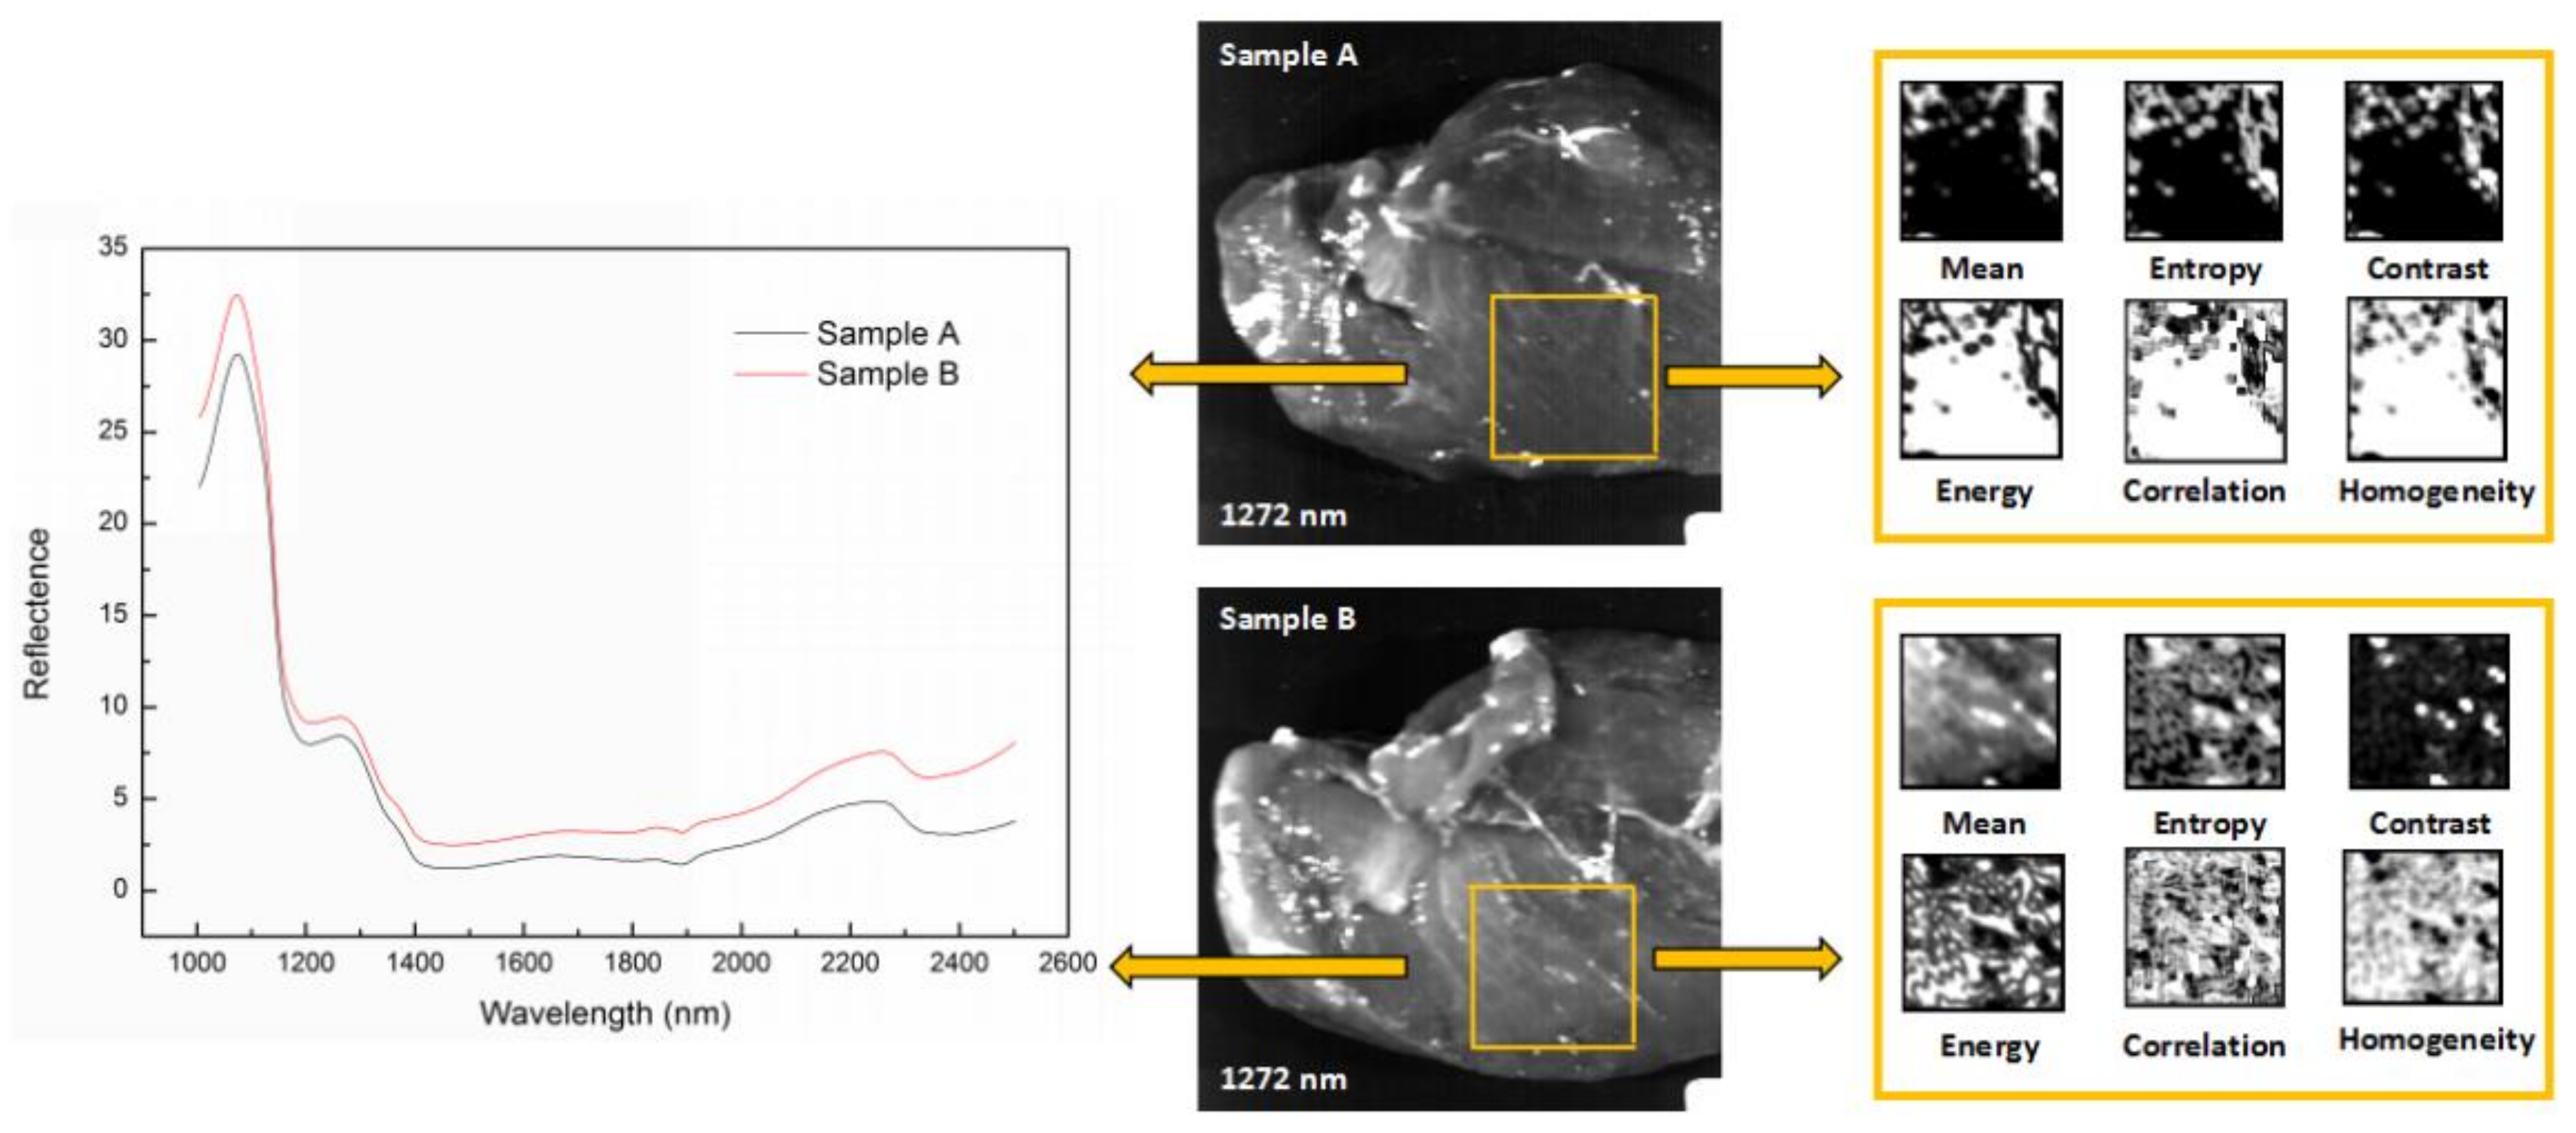
2.4.4. Extraction of Texture Data

Gray level co-occurrence matrix (GLCM) is a common technique for texture analysis, in which texture of images can be effectively depicted by calculating the probability that a pixel of particular gray level occurs at a specified direction and distance from its neighboring pixels [35]. In this study, six GLCM texture variables—mean, homogeneity, contrast, entropy, energy, and correlation—were extracted from the selected key wavelength images of the selected ROI region (sliding window of 5 × 5 pixels, distance of 1 pixel, as well as mean value of angle 0°, 45°, 90°, and 135°).
In order to save computing time and workload, the gray level of the image was reduced to level 16 before the extraction [36]. Regarding the six GLCM texture variables, mean measures the average gray level present in the image. Homogeneity shows the variation amount of gray level in the images. Contrast is the overall light and shade contrast of the gray level image. Entropy represents the amount of information and texture complexity of the image. Entropy measures the textural uniformity of the image. Correlation is the measurement of the spatial arrangement of gray levels [29,36,37,38]. The procedure of texture variable extraction was carried out using ENVI 4.8 (Exelis Visual Information Solutions, Boulder, CO, USA).

2.4.5. Fusion of Spectra and Texture Data

In order to obtain more information from the chicken filets and to improve prediction models performance, some researchers [29,39] have attempted to integrate two complementary information models of hyperspectral image (spectral and spatial data), and good potential was shown. Generally, data fusion can be categorized into three methods—pixel level fusion, feature level fusion, and decision level fusion [40]: Pixel level fusion is a direct method that integrates the original data from various data sources and requires immense data calculation; feature level fusion requires the extraction of feature variables and then fuses the feature variables using statistical approaches, such as arithmetic combinations, filters, and regression variable substitution; and decision level fusion is a method that integrates the extracted data by applying decision rules [40,41]. Of these methods, feature level fusion has the advantage of avoiding huge data pre-processing and potential information losses, and was thus used to integrate spectra and texture data in this study. However, during the procedure of data fusion, another potential problem is that the feature parameters have large disparities in values, and large-value parameters may hide the predictive ability of small-value parameters [28]. Therefore, a classical mean normalization procedure was applied to rescale the different values between the spectra and texture features as follows:
YN,I = Yi/Y,
where YN,i is the normalized parameter for sample i, Yi is the original parameter for sample I, and Y is the mean value of all parameters. This normalization procedure was applied to both the calibration and independent prediction sets. Finally, PLSR was applied to develop prediction models of different WHC traits using the integrated features.

3. Results and Discussion

3.1. Statistics of Measured WHC Traits

Before the measurement of the WHC traits, a total of 90 filets were randomly divided into the calibration set (60 filets) and the independent prediction set (30 filets). The variations for drip loss, expressible fluid, and salt-induced water gain of the examined chicken breast filets are summarized in Table 1. As shown in Table 1, a wide range of variability was present in the three WHC traits of filets for both the calibration set and the independent prediction set. Thus, it is beneficial to establish robust calibration models.

3.2. Prediction of WHC Traits Using Full Spectra

In this study, three WHC indicators—drip loss, expressible fluid, and salt-induced water gain—were predicted using PLSR models with the full wavelength range (1000–2500 nm), and the predicted results are presented in Table 2. As Table 2 shows, the Rp for the WHC traits of the independent prediction set ranged from 0.52 to 0.73. Drip loss had the best predictive ability (Rp = 0.73 and RMSEp = 0.93) of all the traits; these results were in accordance with previous studies [8]. The predictive ability of salt-induced water gain in intact chicken breast meat was Rp = 0.70 and RMSEp = 17.64. The result was also in agreement with those reported in a previous study by the author, working with pork meat samples [30]. Finally, expressible fluid had the lowest predictive ability (Rp = 0.52 and RMSEp = 2.19). The raw spectral curves of all 90 filets are shown in Figure 3.

3.3. The Selection and Fusion of Data

3.3.1. Selection of Key Wavelengths

Regression coefficients (RC) of the established full spectra PLSR models were used to identify key wavelengths related to each WHC trait of the chicken breast filets. The key wavelengths identified for drip loss, expressible fluid, and salt-induced water gain are shown in Figure 4, and the detailed wavelengths, as well as the comparison are listed in Table 3.
Water is the most important component of chicken meat (about 75%). As Table 3 shows, the bands at 1414 and 1896 nm were likely due to water present in the muscle samples [10,20,42]. The bands at 1414 nm and 1896 nm were related to the O-H second overtone and O-H combination bonds, respectively. Chicken meat is famous for its high protein content. The bands at 2110 and 2180 nm likely correspond to protein present in the muscle samples [2,7]. The bands at 1230–1440 nm likely correspond to C-H bonds and appeared many times in the previous reports [7,43].

3.3.2. Extraction of Texture Data

The physical structure of the muscle mainly determines the WHC of the chicken meat, and the texture features can represent these structures effectively [2,4,6]. Each filet had a total of seven key wavelength band images for all three WHC traits. Six texture variables were extracted by GLCM from each image, and a total of 42 texture variables (6 variables × 7 bands) were obtained for each filet in the end. Seven key wavelength band images were shown in Figure 5, and the mean value of the 42 texture variables of all 90 filets were listed in Table 4.
As shown in Figure 5, the images of the same filet in different bands are distinctly different, and those key wavelength band images can reflect texture information in different ways. In Table 4, the mean value of the texture variables varied with the changing of wavelength bands. Mean and entropy had the same change trend as the reflectance of the spectral curves (shown in Figure 3), and the variation of mean was greater. Meanwhile, the change trend of correlation, energy, and homogeneity was the same, which was opposite to the reflectance of the spectral curves. Contrast was different from the other five variables, and it increased to the maximum at the band of 1272 nm and then decreased gradually. In summary, the total information and complexity of the image increased with the reflectance and gray scale of the image, but the uniformity and regularity of image decreased at the same time. This result is in agreement with previous studies [36,37].

3.3.3. Fusion of Spectra and Texture Data

Data fusion is a function that combines multiple features into one, which aims to enhance the information extracted from the images, as well as increase the reliability of the interpretation [44]. As shown in Figure 6, two typical samples with different water-holding capacity had significant differences in both spectral curve and texture features. Sample A had firm and complete muscular structure and clear texture features, as well as lower reflectance of spectral curve. While sample B was soft with blurred texture features, and the reflectance of the spectral curve was higher. The key factors determining the WHC of the chicken meat, such as external physical structure and internal chemical composition, can be interpreted simultaneously by spectral and spatial information of hyperspectral images. Therefore, the integration of the spectral and textural features of the HSI image, as an effective information enhancement method, has been adopted to further improve the performance of HSI in predicting the WHC traits.

3.4. Prediction of WHC Traits Using Key Wavelengths, Texture, and Their Fusion Data

The PLSR model was also used to establish the quantitative relationship between three different WHC traits, key wavelengths, and texture data, as well as their fusion data. As can be seen from Table 2, the PLSR models established by key wavelengths had comparable predictive ability to the corresponding full spectra PLSR models, but the numbers of input variables were greatly reduced. The predictive ability of the texture data PLSR model alone was not satisfactory, especially for salt-induced water gain. However, the PLSR model based on fusion features had the best model performances in the prediction of drip loss and expressible fluid (Rp = 0.80, RMSEp = 0.80; Rp = 0.56, RMSEp = 2.10). It means that texture data is an effective supplement to spectral feature and the fusion of them can improve the predictive ability of HSI. The unsatisfactory model’s predictive abilities for salt-induced water gain by texture data and fusion feature (Rp = 0.07, RMSEp = 24.30; Rp = 0.68, RMSEp = 18.16) might be due to the measurement method of salt-induced water gain, which used a minced sample instead of an intact sample. Compared to the intact sample used for drip loss and expressible fluid, the physical structure of the chicken muscles in the minced samples for salt-induced water gain had been completely destroyed. Thus, the best prediction method for salt-induced water gain used the key wavelength feature (Rp = 0.69, RMSEp = 18.04).

4. Conclusions

This study investigated the fusion of spectra and texture data of HSI for evaluating different WHC traits—drip loss, expressible fluid, and salt-induced water gain—of chicken breast filets. Key wavelengths were selected by RC, texture variables (including mean, homogeneity, contrast, entropy, energy, and correlation) were extracted by GLCM, and data fusion was used by feature level fusion. Different PLSR models were established with corresponding input variables, including the full spectra, multispectra at selected key wavelengths, and texture variables, as well as the fusion data of multispectral and the corresponding texture data, respectively. The results demonstrated that for drip loss and expressible fluid, texture data was an effective supplement to spectra data, and fusion data as an input variable could effectively improve the predictive ability of the independent prediction set (Rp = 0.80, RMSEp = 0.80; Rp = 0.56, RMSEp = 2.10). While for salt-induced water gain, the model based on multispectral data at selected wavelengths (Rp = 0.69, RMSEp = 18.04) had better performance than the fusion model (Rp = 0.68, RMSEp = 18.16). This was mainly due to the fact that the measurement of salt-induced water gain was based on mince samples, which lacked the important physical structural information of intact meat. In conclusion, fusion data contained more information (i.e., physical structure, chemical composition, and water characteristics of the chicken meat) than spectra or texture data alone and thus influenced the predictive ability of the WHC traits. The results of this study have practical significance and can improve the WHC evaluation ability of chicken meat by HSI. A larger number of samples and a wider range of WHC traits should be used in the future to further improve the model performance.

Acknowledgments

This study is supported by the National Natural Science Foundation of China (No. 31772062).

Author Contributions

Hong Zhuang and Seung-Chul Yoon conceived of, designed, and performed the experiments; Yi Yang, Hongzhe Jiang, and Wei Wang analyzed the data and wrote the paper. All authors collaborated in the interpretation of the results and on the preparation of the manuscript.

Conflicts of Interest

The authors declare no conflict of interest.

References

  1. Alexandrakis, D.; Doweny, G.; Scannell, A.G.M. Rapid Non-destructive Detection of Spoilage of Intact Chicken Breast Muscle Using Near-infrared and Fourier Transform Mid-infrared Spectroscopy and Multivariate Statistics. Food Bioprocess Technol. 2012, 5, 338–347. [Google Scholar] [CrossRef]
  2. Bowker, B.; Hawkins, S.; Zhuang, H. Measurement of water-holding capacity in raw and freeze-dried broiler breast meat with visible and near-infrared spectroscopy. Poult. Sci. 2014, 93, 1834–1841. [Google Scholar] [CrossRef] [PubMed]
  3. Zhuang, H.; Savage, E.M. Comparisons of sensory descriptive flavor and texture profiles of cooked broiler breast fillets categorized by raw meat color lightness values. Poult. Sci. 2010, 89, 1049–1055. [Google Scholar] [CrossRef] [PubMed]
  4. Cheng, J.H.; Sun, D.W.; Han, Z.; Zeng, X.A. Texture and structure measurements and analyses for evaluation of fish and fillet freshness quality: A review. Compr. Rev. Food Sci. Food Saf. 2014, 13, 52–61. [Google Scholar] [CrossRef]
  5. He, H.J.; Wu, D.; Sun, D.W. Rapid and non-destructive determination of drip loss and pH distribution in farmed Atlantic salmon (Salmosalar) fillets using visible and near-infrared (Vis/NIR) hyperspectral imaging. Food Chem. 2014, 156, 394–401. [Google Scholar] [CrossRef] [PubMed]
  6. Zhang, L.; Barbut, S. Effects of regular and modified starches on cooked pale, soft, and exudative; normal; and dry, firm, and dark breast meat batters. Poult. Sci. 2005, 84, 789–796. [Google Scholar] [CrossRef] [PubMed]
  7. Prieto, N.; Roeche, R.; Lavin, P.; Batten, G.; Andres, S. Application of near infrared reflectance spectroscopy to predict meat and meat products quality: A review. Meat Sci. 2009, 83, 175–186. [Google Scholar] [CrossRef] [PubMed]
  8. Wu, D.; Sun, D.W. Application of visible and near infrared hyperspectral imaging for non-invasively measuring distribution of water-holding capacity in salmon flesh. Talanta 2013, 116, 266–276. [Google Scholar] [CrossRef] [PubMed]
  9. Prieto, N.; Andrés, S.; Giráldez, F.J.; Mantecón, A.R.; Lavín, P. Ability of near infrared reflectance spectroscopy (nirs) to estimate physical parameters of adult steers (oxen) and young cattle meat samples. Meat Sci. 2008, 79, 692–699. [Google Scholar] [CrossRef] [PubMed]
  10. EIMasry, G.F.; Sun, D.W.; Allen, P. Non-destructive determination of water-holding capacity in fresh beef by using NIR hyperspectral imaging. Food Res. Int. 2011, 44, 2624–2633. [Google Scholar] [CrossRef]
  11. Savenije, B.; Geesink, G.H.; van der Palen, J.G.P.; Hemke, G. Prediction of pork quality using visible/near-infrared reflectance spectroscopy. Meat Sci. 2006, 73, 181–184. [Google Scholar] [CrossRef] [PubMed]
  12. Zhuang, H.; Savage, E.M. Postmortem aging and freezing and thawing storage enhance ability of early deboned chicken pectoralis major muscle to hold added salt water. Poult. Sci. 2012, 91, 1203–1209. [Google Scholar] [CrossRef] [PubMed]
  13. Barbin, D.F.; Kaminishikawahara, C.M.; Soares, A.L.; Mizubuti, I.Y.; Grespan, M.; Shimokomaki, M.; Hirooka, E.Y. Prediction of chicken quality attributes by near infrared spectroscopy. Food Chem. 2015, 168, 554–560. [Google Scholar] [CrossRef] [PubMed]
  14. Cozzolino, D.; Barlocco, N.; Vadell, A.; Ballesteros, A.; Gallieta, G. The use of visible and near infrared reflectance spectroscopy to predict colour on both intact and homogenised pork muscle. LWT Food Sci. Technol. 2003, 36, 195–202. [Google Scholar] [CrossRef]
  15. Liu, Y.; Lyon, B.G.; Windham, W.R.; Lyon, C.E.; Savage, E.M. Prediction of physical, color and sensory characteristics of broiler breasts by visible/near infrared reflectance spectroscopy. Poult. Sci. 2004, 83, 1467–1474. [Google Scholar] [CrossRef] [PubMed]
  16. Monroy, M.; Prasher, S.; Ngadi, M.O.; Wang, N.; Karimi, Y. Pork meat quality classification using Visible/Near-Infrared spectroscopic data. Biosyst. Eng. 2010, 107, 271–276. [Google Scholar] [CrossRef]
  17. Kapper, C.; Klont, R.E.; Verdonk, J.M.A.J.; Williams, P.C.; Urlings, H.A.P. Prediction of pork quality with near infrared spectroscopy (NIRS) 2. Feasibility and robustness of NIRS measurements under production plant conditions. Meat Sci. 2012, 91, 300–305. [Google Scholar] [CrossRef] [PubMed]
  18. Geesink, G.H.; Schreutelkamp, F.H.; Frankhuizen, R.; Vedder, H.W.; Faber, N.M.; Kranen, R.W.; Gerritzen, M.A. Prediction of pork quality attributes from near infrared reflectance spectra. Meat Sci. 2003, 65, 661–668. [Google Scholar] [CrossRef]
  19. Yang, Y.; Zhuang, H.; Yoon, S.C.; Wang, W.; Jiang, H.Z.; Jia, B.B. Rapid Classification of Intact Chicken Breast Fillets by Predicting Principal Component Score of Quality Traits with Visible/Near-Infrared Spectroscopy. Food Chem. 2018, 244, 184–189. [Google Scholar] [CrossRef] [PubMed]
  20. Wu, D.; Sun, D.W.; He, Y. Application of long-wave near infrared hyperspectrral imaging for measurement of color distribution in salmon fillet. Innov. Food Sci. Emerg. Technol. 2012, 16, 361–372. [Google Scholar] [CrossRef]
  21. Jackman, P.; Sun, D.W.; Allen, P. Recent advances in the use of computer vision technology in the quality assessment of fresh meats. Trends Food Sci. Technol. 2015, 22, 185–197. [Google Scholar] [CrossRef]
  22. Yang, C.C.; Chao, K.; Kim, M.S. Machine vision system for online inspection of freshly slaughtered chickens. Sens. Instrum. Food Qual. Saf. 2009, 3, 70–80. [Google Scholar] [CrossRef]
  23. Elmasry, G.; Sun, D.W.; Allen, P. Near-infrared hyperspectral imaging for predicting colour, pH and tenderness of fresh beef. J. Food Eng. 2012, 110, 127–140. [Google Scholar] [CrossRef]
  24. Barbin, D.F.; Elmasry, G.; Sun, D.W.; Allen, P. Near-infrared hyperspectral imaging for grading and classification of pork. Meat Sci. 2012, 90, 259–268. [Google Scholar] [CrossRef] [PubMed]
  25. Iqbal, A.; Sun, D.W.; Allen, P. Prediction of moisture, color and pH in cooked, pre-sliced turkey hams by nirhyperspectral imaging system. J. Food Eng. 2013, 117, 42–51. [Google Scholar] [CrossRef]
  26. Barbin, D.F.; Elmasry, G.; Sun, D.W.; Allen, P. Non-destructive determination of chemical composition in intact and minced pork using near-infrared hyperspectral imaging. Food Chem. 2013, 138, 1162–1171. [Google Scholar] [CrossRef] [PubMed]
  27. He, H.J.; Wu, D.; Sun, D.W. Non-destructive and rapid analysis of moisture distribution in farmed Atlantic salmon (Salmosalar) fillets using visible and near-infrared hyperspectral imaging. Innov. Food Sci. Emerg. Technol. 2013, 18, 237–245. [Google Scholar] [CrossRef]
  28. Xiong, Z.; Sun, D.W.; Pu, H.; Zhu, Z.; Luo, M. Combination of spectra and texture data of hyperspectral imaging for differentiating between free-range and broiler chicken meats. LWT Food Sci. Technol. 2015, 60, 649–655. [Google Scholar] [CrossRef]
  29. Cheng, W.; Sun, D.W.; Pu, H.; Liu, Y. Integration of spectral and textural data for enhancing hyperspectral prediction of k value in pork meat. LWT Food Sci. Technol. 2015, 72, 322–329. [Google Scholar] [CrossRef]
  30. Kamruzzaman, M.; Makino, Y.; Oshita, S. Hyperspectral imaging for real-time monitoring of water holding capacity in red meat. LWT Food Sci. Technol. 2016, 66, 685–691. [Google Scholar] [CrossRef]
  31. Honikel, K.O. Reference methods for the assessment of physical characteristic of meat. Meat Sci. 1998, 49, 447–457. [Google Scholar] [CrossRef]
  32. Yang, Y.; Zhuang, H.; Yoon, S.C.; Wang, W.; Jiang, H.Z.; Jia, B.B.; Li, C.Y. Quality assessment of intact chicken breast fillets using factor analysis with vis/nir spectroscopy. Food Anal. Methods 2017, 1–11. [Google Scholar] [CrossRef]
  33. Wardlaw, F.B.; McCaskill, L.H.; Acton, J.C. Effect of postmorterm muscle changes on poultry meat loaf properties. J. Food Sci. 1973, 38, 421–423. [Google Scholar] [CrossRef]
  34. Keskin, M.; Dodd, R.B.; Han, Y.J.; Khalilian, A. Assessing nitrogen content of golf course turfgass clippings using spectral reflectance. Appl. Eng. Agric. 2004, 20, 245–253. [Google Scholar] [CrossRef]
  35. Xue, J.; Zhang, S.; Zhang, J. Ripeness classification of Shajin apricot using hyperspectral imaging technique. Trans. Chin. Soc. Agric. Eng. 2015, 31, 300–307. [Google Scholar] [CrossRef]
  36. Zhao, J.; Peng, Y.K. Distribution of beef tenderness grading based on texture features by hyperspectral image analysis. Trans. Chin. Soc. Agric. Eng. 2015, 31, 279–286. [Google Scholar] [CrossRef]
  37. Huang, F.; Zhang, S.; Yang, Y.; Man, Z.; Zhang, X.; Wu, Y. Application of Hyperspectral Imaging for Detection of Defective Features in Nectarine Fruit. Trans. Chin. Soc. Agric. Eng. 2015, 46, 252–259. [Google Scholar] [CrossRef]
  38. Liu, D.; Pu, H.; Sun, D.W.; Wang, L.; Zeng, X.A. Combination of spectra and texture data of hyperspectral imaging for prediction of pH in salted meat. Food Chem. 2014, 160, 330–337. [Google Scholar] [CrossRef] [PubMed]
  39. Khulal, U.; Zhao, J.; Hu, W.; Chen, Q. Intelligent evaluation of total volatile basic nitrogen (TVC-N) content in chicken meat by an improved multiple level data fusion model. Sens. Actuators B. 2017, 238, 337–345. [Google Scholar] [CrossRef]
  40. Pohl, C.; Van Genderen, J. Review article multisensor image fusion in remote sensing: Concepts, methods and applications. Int. J. Remote Sens. 2015, 19, 823–854. [Google Scholar] [CrossRef]
  41. Huang, L.; Zhao, J.W.; Chen, Q.S.; Zhang, Y.H. Rapid detection of total viable count (TVC) in pork meat by hyperspectral imaging. Food Res. Int. 2013, 54, 821–828. [Google Scholar] [CrossRef]
  42. Cozzolino, D.; De Mattos, D.; Vaz Martins, D. Visible/near infrared reflectance spectroscopy for predicting composition and tracing system of production of beef muscle. Anim. Sci. 2002, 74, 477–484. [Google Scholar] [CrossRef]
  43. De Marchi, M.; Penasa, M.; Cecchinato, A.; Bittante, G. The relevance of different near infrared technologies and sample treatments for predicting meat quality traits in commercial beef cuts. Meat Sci. 2013, 93, 329–335. [Google Scholar] [CrossRef] [PubMed]
  44. Bronselaer, A.; Szymczak, M.; Zadrożny, S.; Tré, G.D. Dynamical order construction in data fusion. Inf. Fusion 2015, 27, 1–18. [Google Scholar] [CrossRef]
Figure 1. Key steps of the experimental procedure. GLCM: gray level co-occurrence matrix; ROI: region of interest; RC: regression coefficients; Ri: raw image; Di: dark reference; Wi: white reference.
Applsci 08 00640 g001
Figure 2. Hyperspectral imaging (HSI) system.
Applsci 08 00640 g002
Figure 3. The raw spectral curves of all 90 filets.
Applsci 08 00640 g003
Figure 4. Selection of key wavelengths. (a) Drip loss. (b) Expressible fluid. (c) Salt-induced water gain.
Applsci 08 00640 g004
Figure 5. Key wavelength band images of chicken breast filet.
Applsci 08 00640 g005
Figure 6. Typical samples with different water-holding capacity. (Sample A: DL = 0.48, EF = 70.28, WG = 129.90; Sample B: DL = 2.27, EF = 73.45, WG = 98.03). DL: drip loss, EF: expressible fluid, and WG: salt-induced water gain.
Applsci 08 00640 g006
Table 1. Water-holding capacity (WHC) traits of chicken breast filets.
WHC TraitsCalibration SetPrediction Set
MinMaxMean ± SDMinMaxMean ± SD
Drip loss0.275.901.74 ± 1.360.318.011.52 ± 1.59
Expressible fluid66.6577.7473.29 ± 2.5168.1178.1572.98 ± 2.58
Salt-induced water gain27.91154.0084.19 ± 24.6334.11146.3384.78 ± 27.82
Table 2. Prediction of the WHC traits of the chicken breast filet with different input variables.
ModelNo.LVRcRMSEcRcvRMSEcvRpRMSEp
Drip lossFull spectra198100.810.800.750.900.730.93
Key wavelength540.790.820.750.890.730.91
texture3050.651.030.531.160.501.18
Fusion3580.890.610.820.760.800.80
Expressible fluidFull spectra198100.602.020.492.210.522.19
Key wavelength530.532.110.492.210.472.25
texture3040.242.460.202.480.152.50
Fusion3560.622.010.532.160.562.10
Salt-induced water gainFull spectra19890.7217.060.6918.210.7017.64
Key wavelength430.7117.200.6918.140.6918.04
texture2440.0724.360.0024.990.0724.30
Fusion2860.6918.200.6718.360.6818.16
LV: latent variables; Rc: coefficient of calibration; RMSEc: root-mean-square error of calibration; Rcv: coefficient of cross-validation; RMSEcv: root-mean-square error of cross-validation; Rp: coefficient of independent prediction; RMSEp: root-mean-square error of independent prediction.
Table 3. Selected important wavelengths of WHC traits.
WHC TraitsNo.Key Wavelength
Drip loss510791272141418962180
Expressible fluid511381272141418962110
Salt-induce water gain41079127214141896
Table 4. Extraction of texture data.
Key WavelengthTexture (Mean ± SD)
MeanHomogeneityContrastEntropyEnergyCorrelation
10792.120.810.350.660.580.54
11381.550.810.370.630.590.57
12721.040.810.430.610.610.60
14140.310.840.390.360.740.75
18960.280.840.340.360.740.74
21100.430.820.380.460.690.66
21800.540.830.330.460.690.67

