Analysis and Modelling of Shrinkage and Creep of Reactive Powder Concrete

1
School of Civil Engineering, Harbin Institute of Technology, Harbin 150090, China
2
Key Lab of Structures Dynamic Behaviour and Control of the Ministry of Education, Harbin Institute of Technology, Harbin 150090, China
3
Key Lab Smart Prevention and Mitigation of Civil Engineering Disasters of the Ministry of Industry and Information Technology, Harbin Institute of Technology, Harbin 150090, China
*
Author to whom correspondence should be addressed.
Appl. Sci. 2018, 8(5), 732; https://0-doi-org.brum.beds.ac.uk/10.3390/app8050732
Submission received: 8 April 2018
/
Revised: 26 April 2018
/
Accepted: 4 May 2018
/
Published: 5 May 2018
(This article belongs to the Special Issue New Trends in Recycled Aggregate Concrete)
Abstract
:The objective of this study was to examine the shrinkage and creep of reactive power concrete (RPC) with different steel fibre contents (0%, 1% and 2% by volume). A total of 37 RPC specimens were prepared and tested for compression strength, elastic modulus, shrinkage, and creep. In addition, different axial stress ratios (0.2, 0.3 and 0.4) were used in the creep tests. Furthermore, the accuracy of the ACI 209-82 model, CEB-FIP 90 model, B3 model, and GL 2000 model for predicting the shrinkage and creep of RPC was evaluated and new numerical shrinkage and creep models were developed. The experimental results revealed that the compressive strength and elastic modulus increase with increasing steel fibre content. The shrinkage and creep decreased with increasing addition of steel fibre from 0% to 2%. A good linear relationship was found between the axial stress ratios and creep strain. All four existing models were unable to accurately predict the shrinkage and creep of RPC. A good agreement between the experimental results and proposed shrinkage and creep numerical models was observed. Therefore, it is suggested that the proposed shrinkage and creep models can be used to calculate the shrinkage and creep of RPC.
1. Introduction
Reactive powder concrete (RPC) is a type of ultra-high performance concrete which has been developed in the last two decades [1,2]. RPC has superior compressive and tensile strengths, which can significantly reduce the dead load of structures [3,4]. Thus, it is especially suitable for long-span bridge decks, thin-plate structures, and field-cast joints for precast bridge decks [5]. It possesses superior energy absorption owing to the addition of steel fibre [6], provides good structural reliability, and has excellent durability, leading to a long service life. It is also almost impermeable, which almost entirely prevents carbonation and penetration of chlorides and sulphates, thereby making it suitable for use in harsh climatic conditions such as freeze-thaw or coastal areas [7]. However, the high cement content (usually as high as 800–1000 kg/m3) affects production costs and increases the risk of shrinkage [8,9,10,11,12]. Furthermore, the addition of silica fume increases the risk of shrinkage and creep of RPC [13,14,15,16].
Shrinkage and creep can significantly affect the long-term characteristics of concrete. In large scale structures, shrinkage and creep can increase the width of cracks and structural deformation. It can also cause stress loss in the prestressed reinforcement of prestressed components [17]. Therefore, it is important to predict and monitor the shrinkage and creep of concrete. In recent years, many studies on the shrinkage and creep of normal strength concrete have been carried out, and mature theories and models have been developed [18,19,20]. However, there are relatively few studies on the shrinkage and creep of RPC. To produce RPC, it is necessary to minimize the aggregate size, increase the paste/aggregate ratio, decrease the water/binder ratio, add silica fume and steel fibre, and use steam-heat curing. All these measures make the shrinkage and creep characteristics of RPC different from those of normal strength concrete.
Peiliang Shen et al. investigated the autogenous shrinkage of steam-heat cured RPC [21], and the results showed that three factors (i.e., steel fibre, silica fume, and aggregate size) have significant effects on the autogenous shrinkage of RPC. Furthermore, the autogenous shrinkage mainly occurred during the stream-heat curing period. Ehsan Ghafari et al. studied the effects of different supplementary cementitious materials (i.e., silica fume, fly ash, and ground granulated blast furnace slag) on the autogenous shrinkage of RPC, and developed an autogenous shrinkage model for RPC [16]. Shamsad Ahmad et al. conducted studies on the shrinkage of RPC with water curing for 3 days, and observed that the shrinkage increases with increasing water/binder ratio, cement content, and silica fume content [22]. Nguyen found that adding rice husk ash to RPC can reduce the autogenous shrinkage of RPC significantly [23]. Moreover, several other measures such as using expansive additives, shrinkage reducing admixtures, or coarser cement particles, and improving curing conditions were identified to decrease the autogenous shrinkage of RPC [24,25,26,27]. Mo Jinchuan et al. demonstrated that both the autogenous and drying shrinkage of RPC increase with raising granulated blast furnace slag (GBFS) [28]. C.M. Tam et al. studied the dry shrinkage of RPC with water curing for 28 days, and found drying shrinkage increases with increasing water/binder ratio and superplasticizer dosage [6]. A. Cwirzen suggested that adding coarse aggregate to RPC can reduce its drying shrinkage and creep [29]. A. Graybeal found that high compressive stress (axial stress of higher than 0.60) on relatively low strength RPC cause significant short-term creep [30].
To the best of the authors’ knowledge, previous studies on the shrinkage and creep of RPC have mainly focused on the autogenous shrinkage of RPC. The effects of RPC components on autogenous shrinkage have been investigated. In addition, some measures have been purposed to decrease the autogenous shrinkage of RPC. In present times, RPC is widely used in prefabricated components. For commercial RPC, steam-heat curing is typically used in order to accelerate the hydration process and strength development [31], but there are relatively few studies on the shrinkage of RPC after steam-heat curing and creep in RPC. Furthermore, there is no RPC shrinkage and creep model to predict shrinkage and creep of RPC at present, most of the existing shrinkage and creep models were developed from experimental data fitting, and the results of these models are mostly compared to data related to normal strength concrete. Hence, these models are suitable for normal strength concrete rather than RPC [32]. The applicability of the existing shrinkage and creep models for RPC needs to be further verified.
In this study, the shrinkage after steam-heat curing and creep of RPC have been investigated. To this end, a total of 18 samples were prepared for compressive strength and elastic modulus tests, 9 samples for shrinkage tests, and 10 samples for creep tests. In addition, the influence of steel fibre on the compressive strength, elastic modulus, shrinkage, and creep of RPC was investigated. The effect of axial stress on the creep of RPC was also examined. Finally, the shrinkage and creep of RPC predicted by widely used models were compared with the experimental data to verify the applicability of the models for RPC, and new shrinkage and creep numerical models were developed for RPC.
2. Materials and Mix Proportions
2.1. Raw Materials
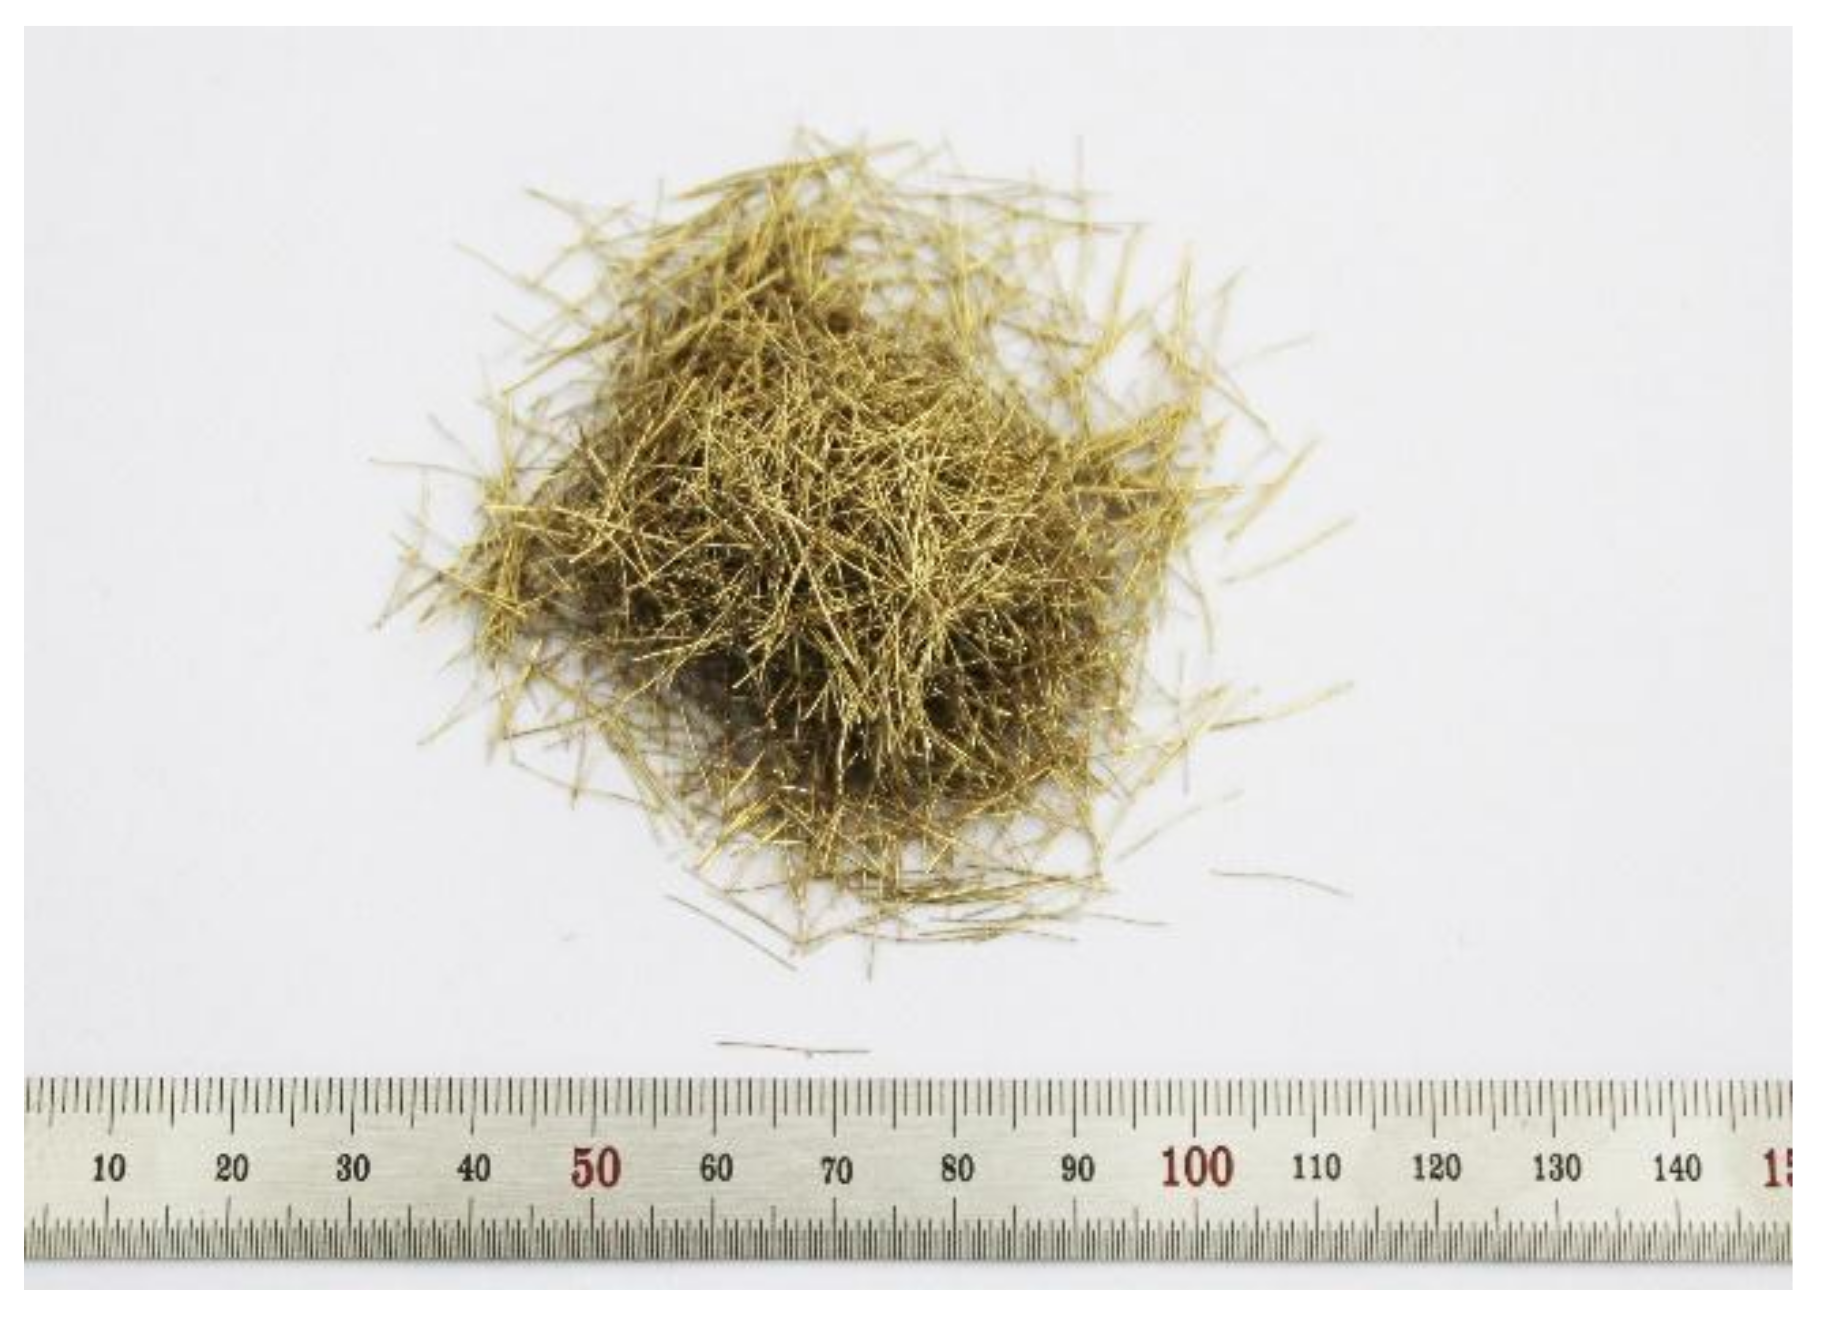
Type I Portland cement (PC), silica fume (SF), water, quartz sand, quartz powder, steel fibre (ST), and superplasticizer (SP) were used to produce the RPC samples. The Type I cement conforms to Chinese National Standard GB175-2007 [33], and has a specific gravity of 3.20. The silica fume is an extremely fine material with a particle size smaller than 0.1 μm. The specific surface area and dry bulk density of the silica fume are 18.4 m2/g and 0.65 kg, respectively. The chemical components of the cement and silica fume are given in Table 1. Quartz sand with a particle size distribution in the range of 0.01–0.50 mm was used as an aggregate, and quartz powder with particle sizes from 10–45 μm was used as a micro-filler. The superplasticizer is a polycarboxylic acid water reducer with a specific gravity of 1.20, allowing for water reduction of up to 25% to achieve the target workability. The mixing water is tap water from Harbin, China. The diameter and length of the steel fibre are 0.22 mm and 13 mm, respectively. The tensile strength of the steel fibre is greater than 2850 MPa. The steel fibre used in this study is shown in Figure 1.
2.2. RPC Mixtures and Curing Conditions
37 RPC samples were prepared for tests of the compressive strength, elastic modulus, shrinkage, and creep. The W/B (water-binder ratio) for all RPC specimens is 0.20. Steel fibre contents of 0%, 1% and 2% by volume of mixture were used. The specific mix proportions are listed in Table 2. The numbers in Table 2 represent mass ratios of the RPC mixtures.
The mixing procedure affects the material properties of RPC [34], and the manufacturing method for RPC is different from that of normal strength concrete. To minimize the impact of the mixing process, all the mixtures were made using the same planetary mixer. Based on previous studies [28,35], the mixing procedure is as follows:
- (I)
- The cement, silica fume, quartz sand, and quartz powder are mixed in a dry state for approximately 2 min at a low speed of approximately 140 rpm. During this dry mixing process, steel fibre was added to the mixtures.
- (II)
- 50% of the water and 50% of the superplasticizer were gradually added to the mixtures, and the mixtures were stirred for 3 min at a high speed of approximately 280 rpm.
- (III)
- The remaining 50% of the water and the superplasticizer were added to the mixtures, which were then stirred again for 3 min at a high speed of approximately 280 rpm.
- (IV)
- After mixing, the RPC was poured into moulds and vibrated until fully consolidated.
After 24 h, the RPC samples were removed from the moulds, and the samples were cured in a special curing box at a temperature of 90 °C and relative humidity (RH) of greater than 95% for 48 h. The samples were then moved to a testing room with a temperature of 20 °C and a relative humidity (RH) of 60% until the experiments were performed.
3. Experiments
3.1. Compressive Strength and Elastic Modulus Tests
The compressive strength and elastic modulus of RPC samples after 28 days were determined experimentally. According to Chinese standard test methods for mechanical properties of concrete [36], 100 × 100 × 300 mm prisms were loaded uniaxially. The tests were conducted at a loading rate of approximately 0.5 MPa/s. Three samples for the compressive strength test and an additional three samples for the elastic modulus test were tested at each steel fibre content.
3.2. Shrinkage Tests of RPC
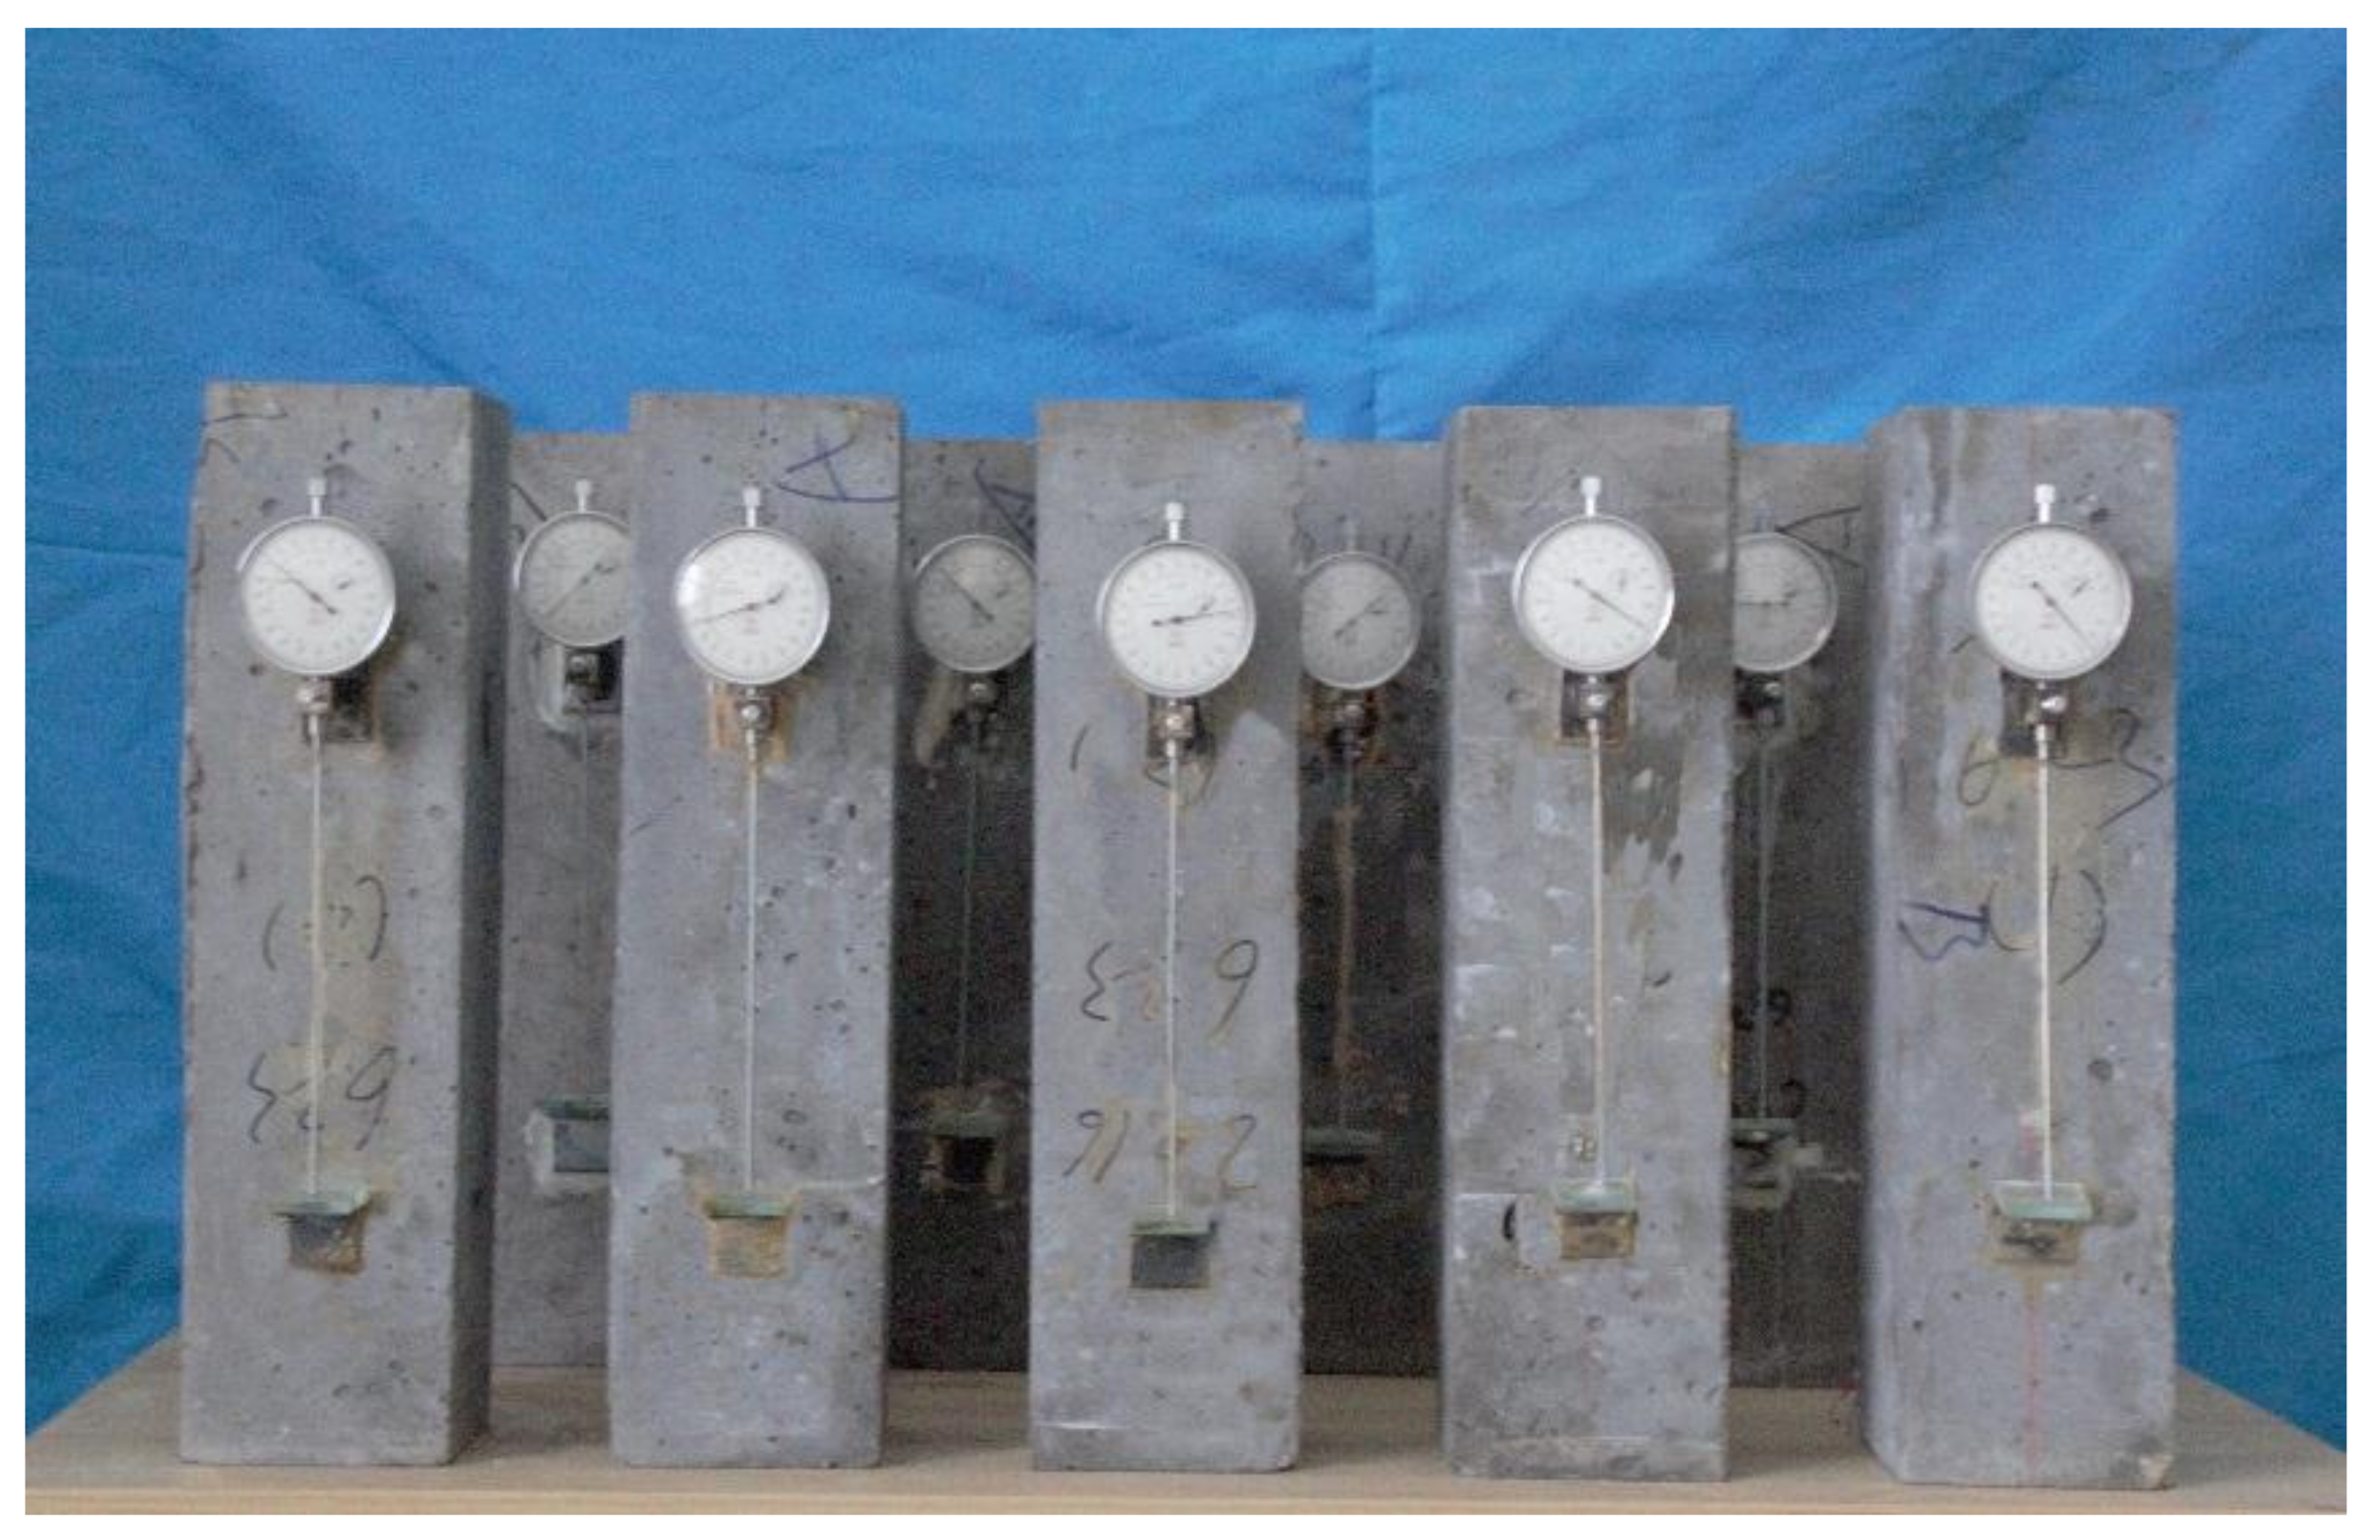
For the shrinkage test, 100 × 100 × 400 mm prisms of RPC were cast. After steam-heat curing, all the RPC samples were placed in the testing room at a controlled temperature of 20 °C and a relative humidity of 60%, and the shrinkage tests were conducted immediately. The shrinkage test was designed according to the Chinese standard for test methods of long-term performance and durability of concrete [37]. Two dial gauges with a gauge length of 200 mm were placed on opposite sides of the sample, as shown in Figure 2. For each steel fibre content, the shrinkage was measured for three samples, and the average of the three measured shrinkage strains was reported.
3.3. Creep Tests of RPC
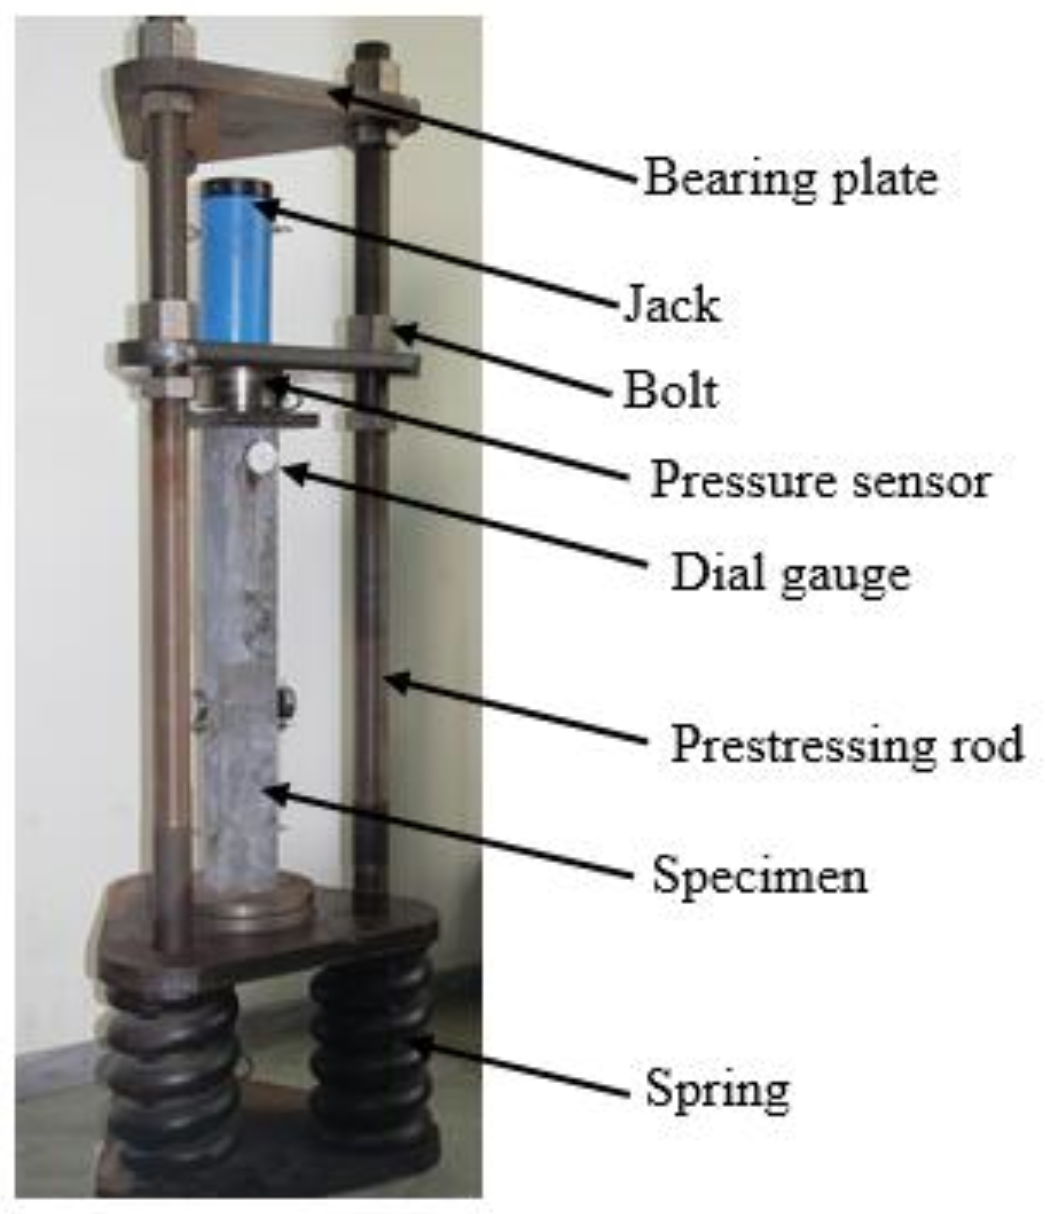
For the creep tests, RPC samples were cast in 100 × 100 × 400 mm prisms. After curing the RPC, the samples were all placed in the testing room for 25 days before beginning the creep tests. A total of 10 RPC specimens (in 5 groups) were tested, and the experimental parameters are outlined in Table 3. Self-resisting loading frames were used to conduct the tests, as shown in Figure 3. In each group, two of the same specimens were stacked one on top of the other. A load was applied using an oil-pressure jack at the scheduled loading time, monitored with a pressure sensor, and sustained with the bolts of the pressing rods for the scheduled load duration to determine the compressive creep strain. Two dial gauges were set on opposite sides of the sample with a gauge length of 200 mm. For each self-resisting loading frame, the total strains of the two samples were measured, and their average was reported. The creep strain was determined by subtracting the instantaneous strain and the shrinkage strain from the total strain.
4. Results and Discussion
4.1. Compressive Strength and Elastic Modulus of RPC
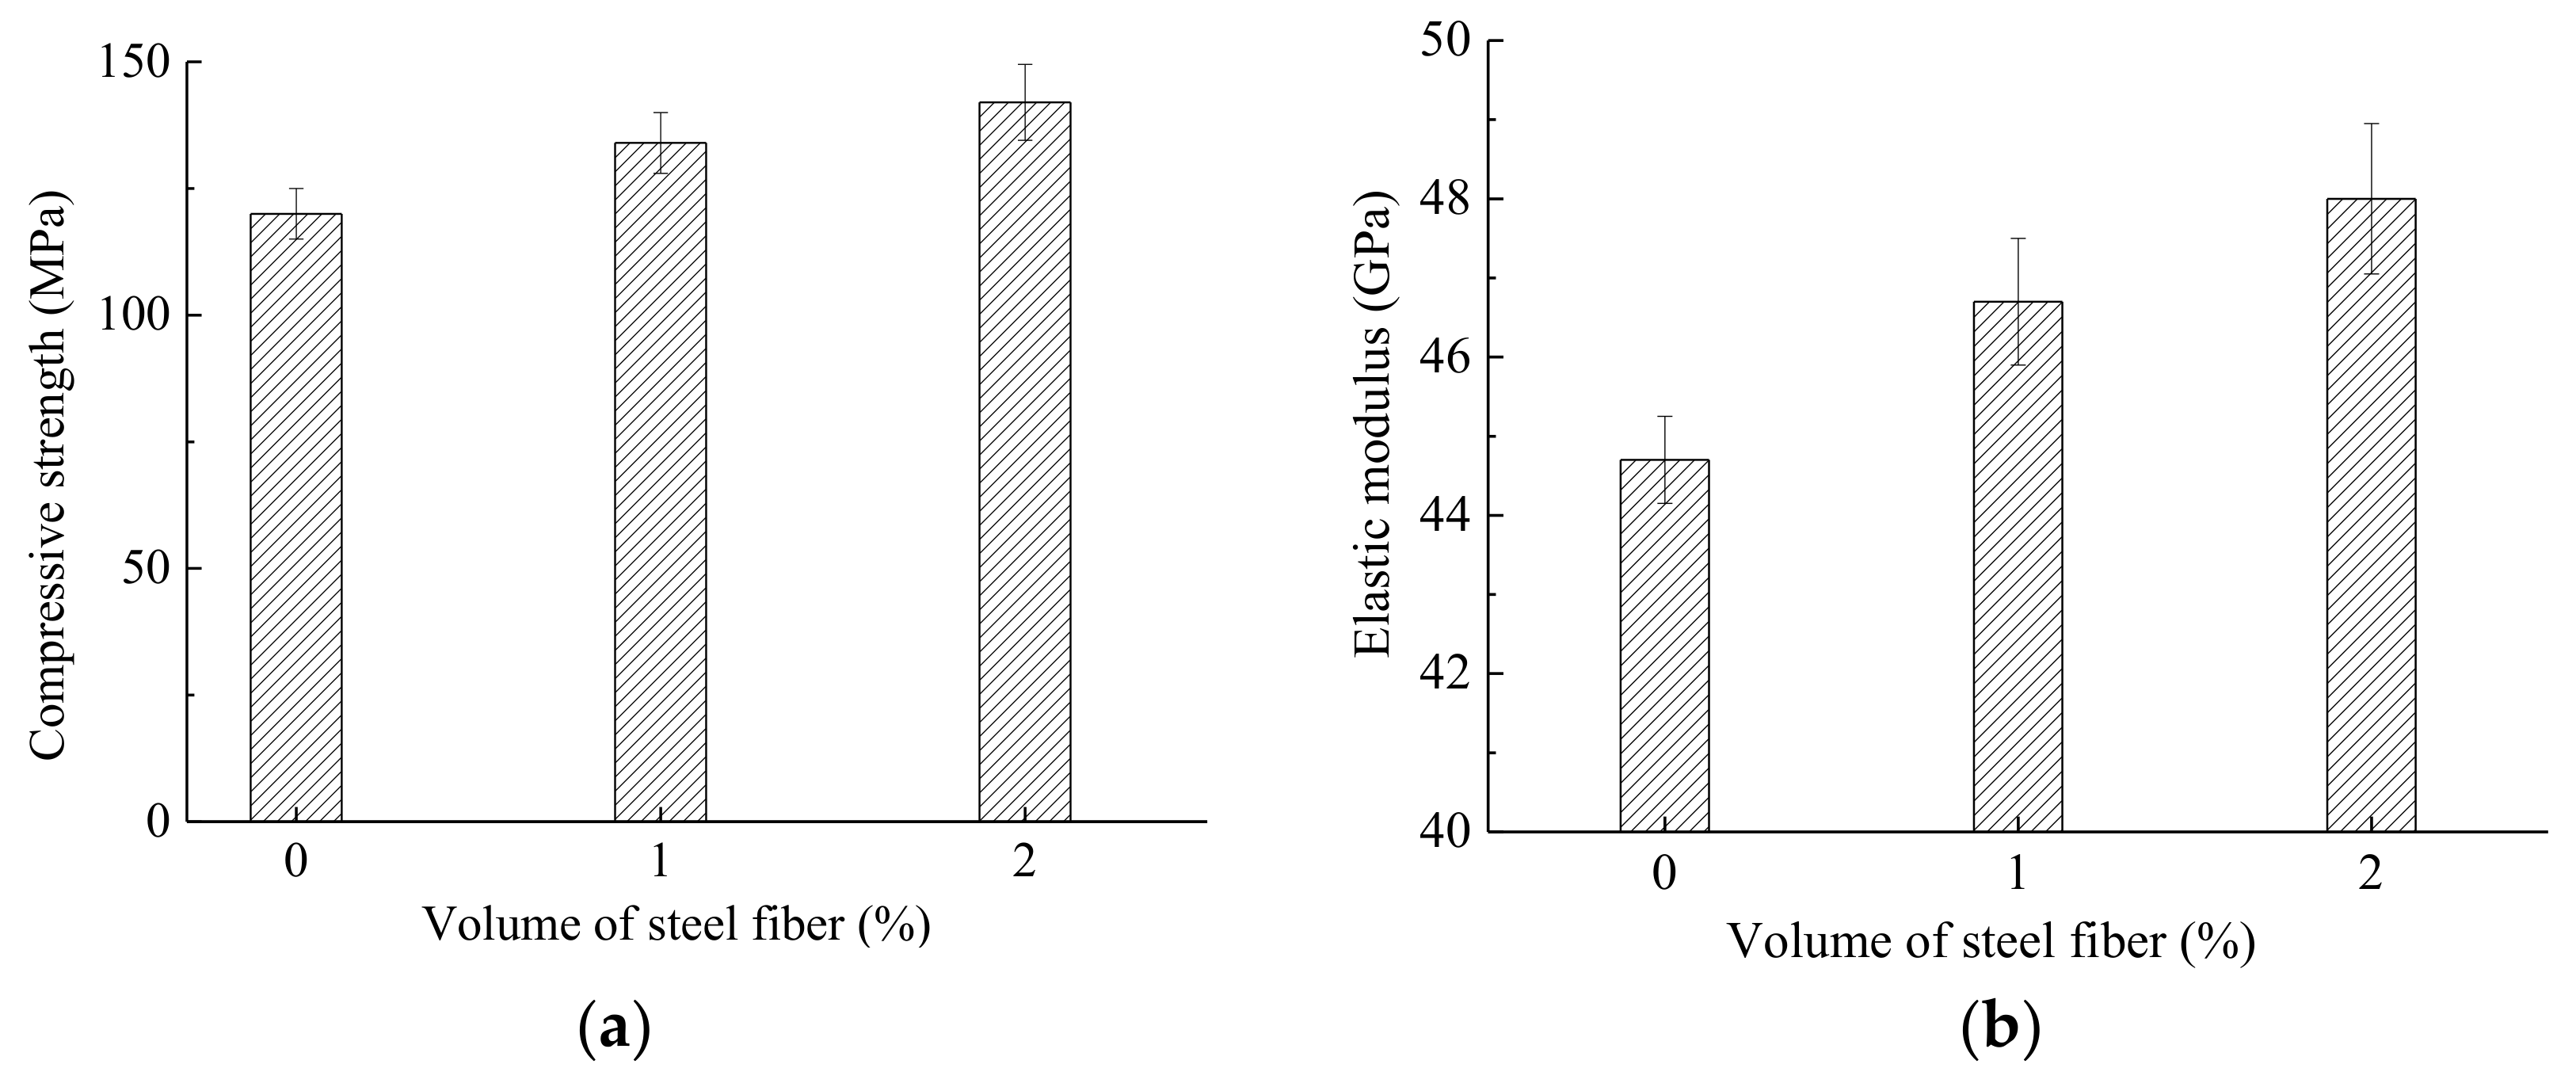
The compressive strength and elastic modulus were determined for RPC samples after 28 days of aging. As shown in Figure 4, the compressive strength and elastic modulus of the RPC samples increase with increasing steel fibre content. The compressive strength increases from 120 MPa to 142 MPa, and the elastic modulus increases from 44.7 GPa to 48.0 GPa as the steel fibre content increases from 0% to 2%. The compressive strengths of the RPC samples with 1% and 2% steel fibre content are 11.9% and 18.3% higher, respectively, than that of RPC samples without steel fibre. The elastic modulus of the RPC samples with 1% and 2% steel fibre content are 4.4% and 7.3% greater, respectively, than that of RPC samples without steel fibre. The strength of RPC is far greater than that of normal strength concrete, which is usually in the range of 20–80 MPa. RPC has a dense structure, which is attributed to the low W/B, hydration of the cement, and the pozzolanic effect of the SF [38]. As a result, the RPC has an ultra-high strength. The steel fibre plays the role of a bridge and dowel in the RPC samples. Increasing steel fibre content can make more fibres to sustain the load, which decreases the stress between fibres and matrix and restricts the development of microcracks and transverse deformation. Thus, the compressive strength and the elastic modulus increase with increasing steel fibre content [39,40].
4.2. Shrinkage of RPC
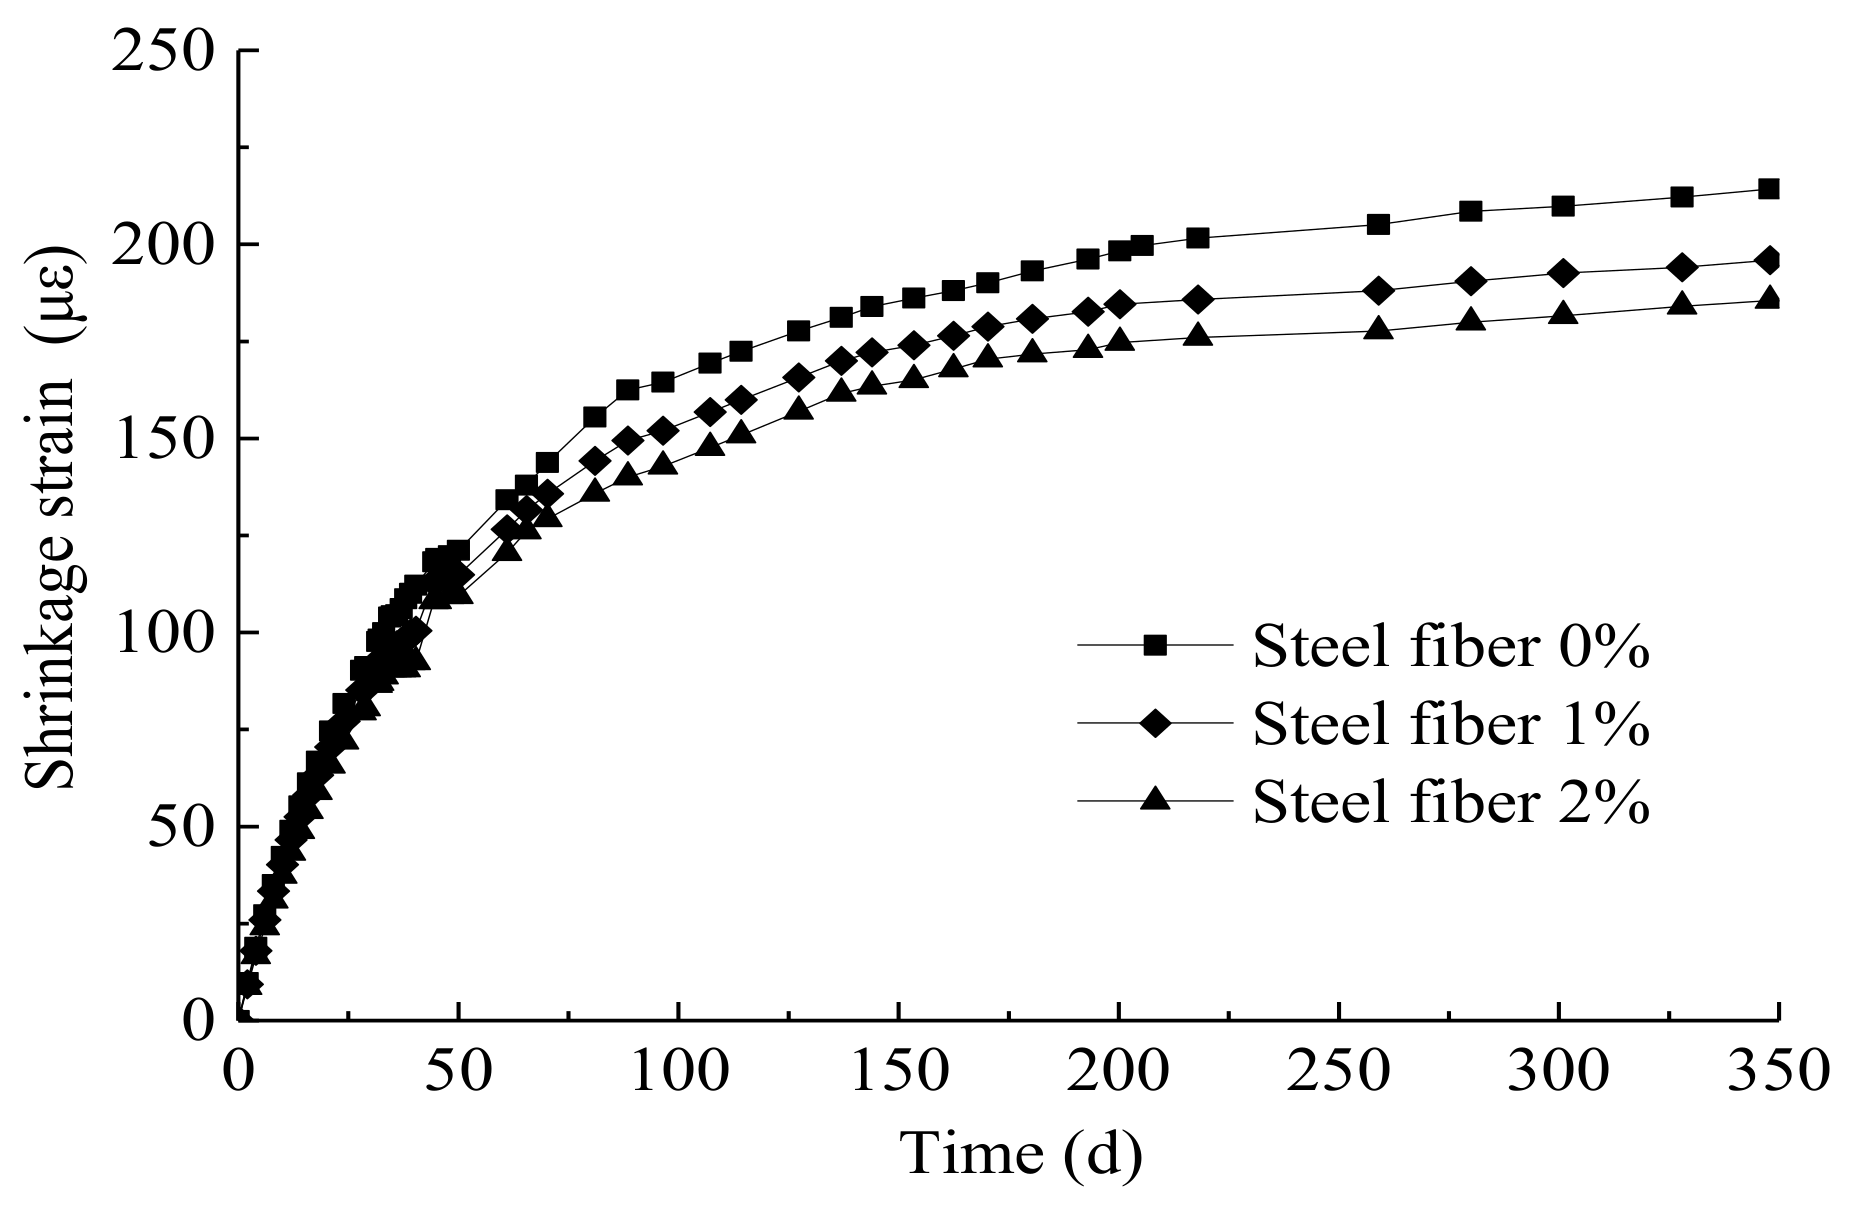
Figure 5 shows the variation in the shrinkage strain of the RPC samples with age. At the early ages, the shrinkage strain increases at a fast rate, and the shrinkage reaches a steady state at approximately 200 days. However, the shrinkage of RPC is much smaller than that of normal strength concrete, which is usually on the order of several hundred micro strain or more. With the improved uniformity and minimized pore size of the RPC, the escape of moisture is inhibited, capillary stress is reduced, and as a result, the shrinkage is also reduced. The shrinkage decreases with increasing steel fibre content. The final shrinkage of the RPC samples with 1% and 2% steel fibre content is 10.6% and 15.0% less, respectively, than that of the RPC samples without steel fibre. This is similar to the effect of steel fibre on shrinkage in normal strength concrete [41,42]. The positive effect of steel fibre for reducing the shrinkage of RPC can be explained as follows:
- (I)
- During the process of mixing the steel fibre into the RPC matrix, some micron-scale water films are formed on the steel fibre surface. As a result, calcium hydroxide crystals form directly on the surface of the fibre and grow with no constraints, which forms a loose reticular structure at the interface of the steel fibre and RPC matrix, thereby reducing shrinkage [43].
- (II)
4.3. Creep of RPC
4.3.1. Effect of the Axial Stress Ratio on the Creep of RPC
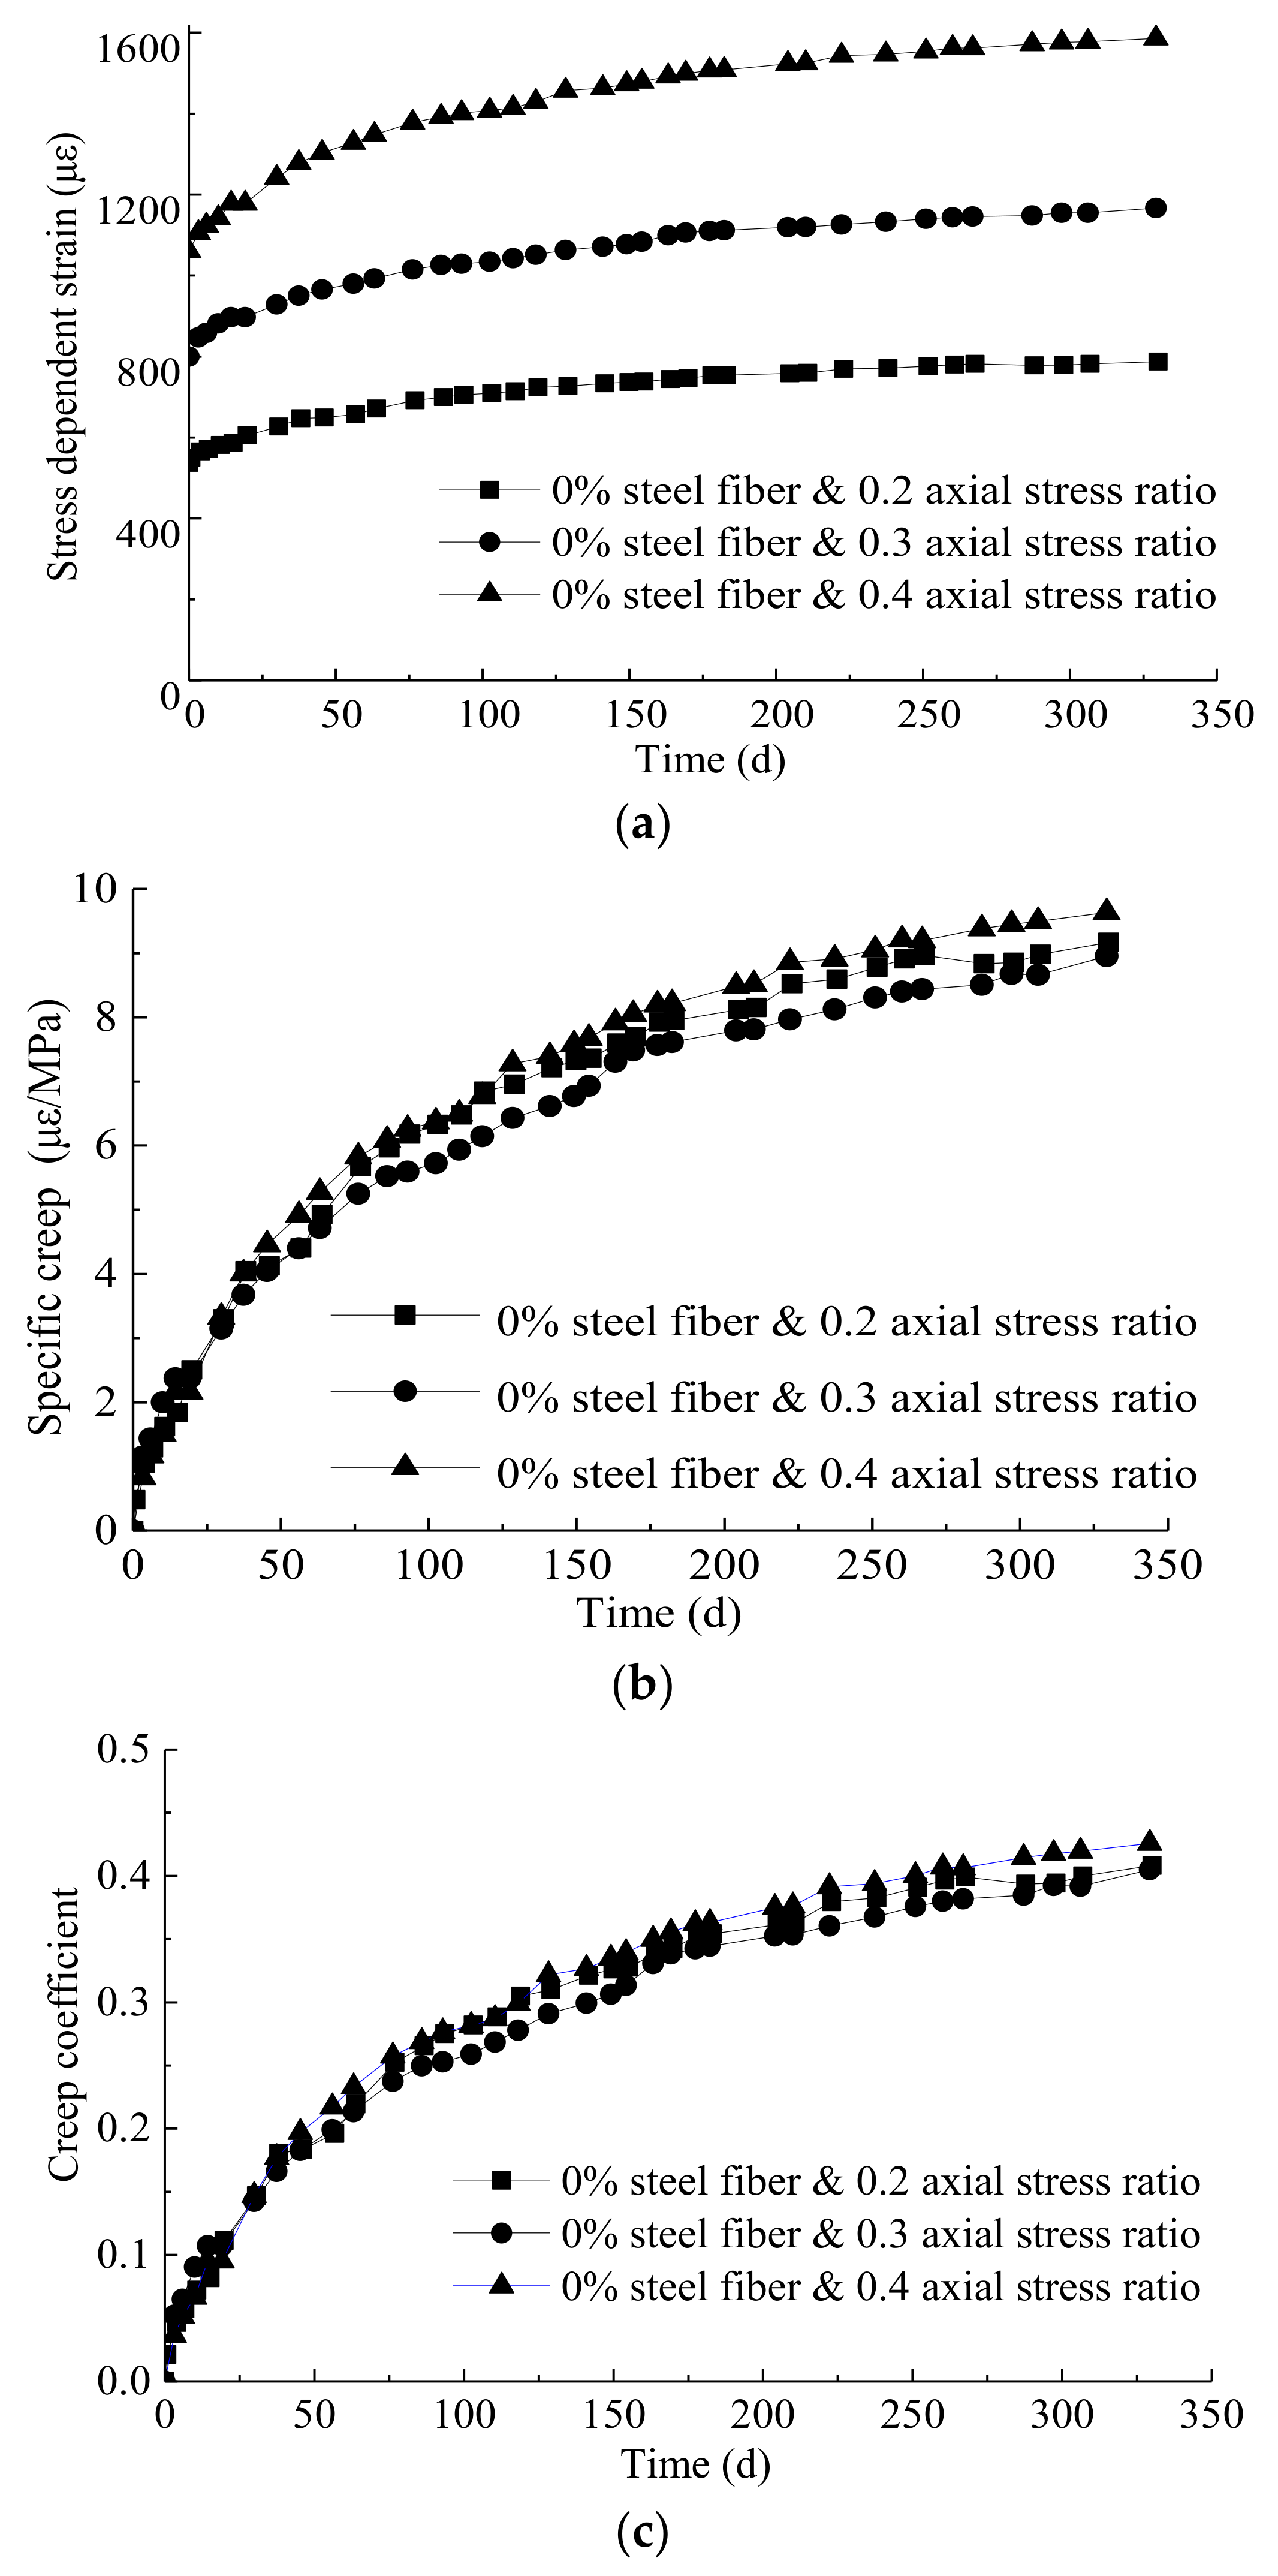
The stress-dependent strain is the sum of the instantaneous strain and the creep strain, the specific creep is the creep strain caused by unit stress, and the creep coefficient is the ratio of the creep strain to instantaneous strain at loading time. Figure 6 shows the variations in the stress-dependent strain, specific creep, and creep coefficient of the RPC samples subjected to different stress ratios with time. The stress-dependent strain and its growth rate both increase with increasing axial stress ratio. However, the specific creep and the creep coefficient of RPC samples subjected to different axial stress ratios are almost the same. This indicates that the creep of RPC is linear when the axial stress ratio is less than 0.4, which is consistent with the behaviour of normal strength concrete.
4.3.2. Effect of Steel Fibre on Creep of RPC
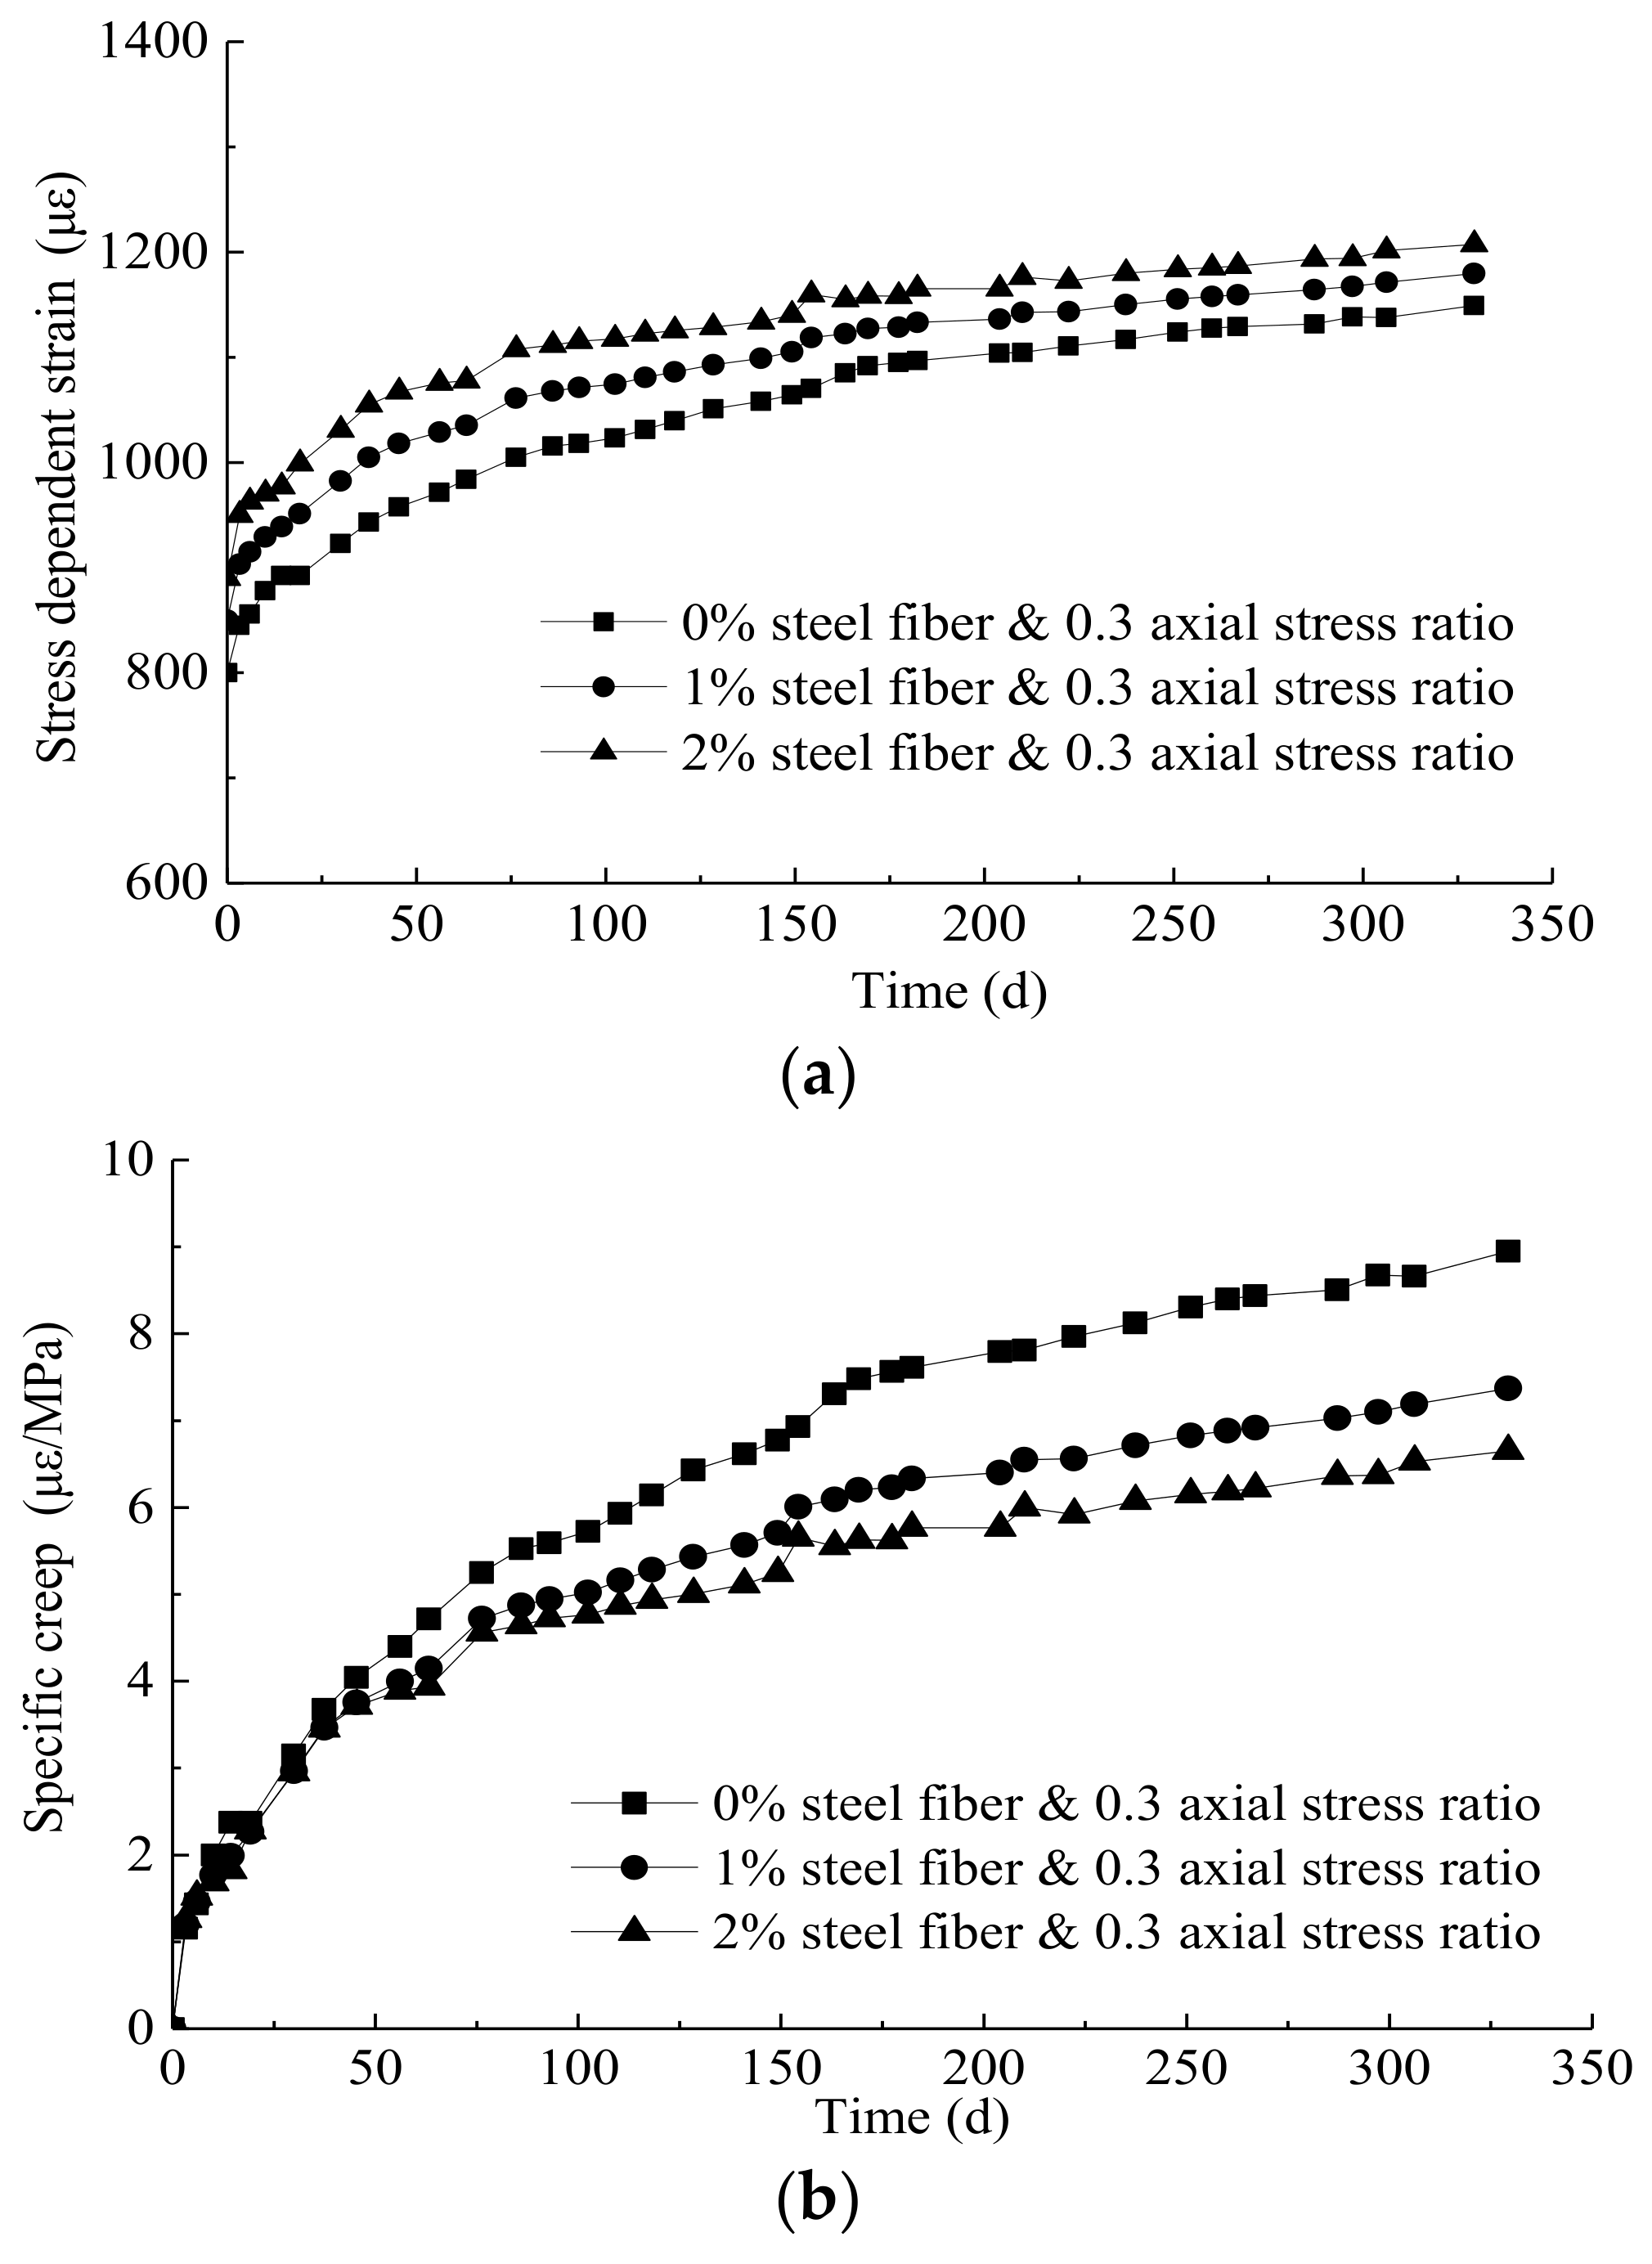
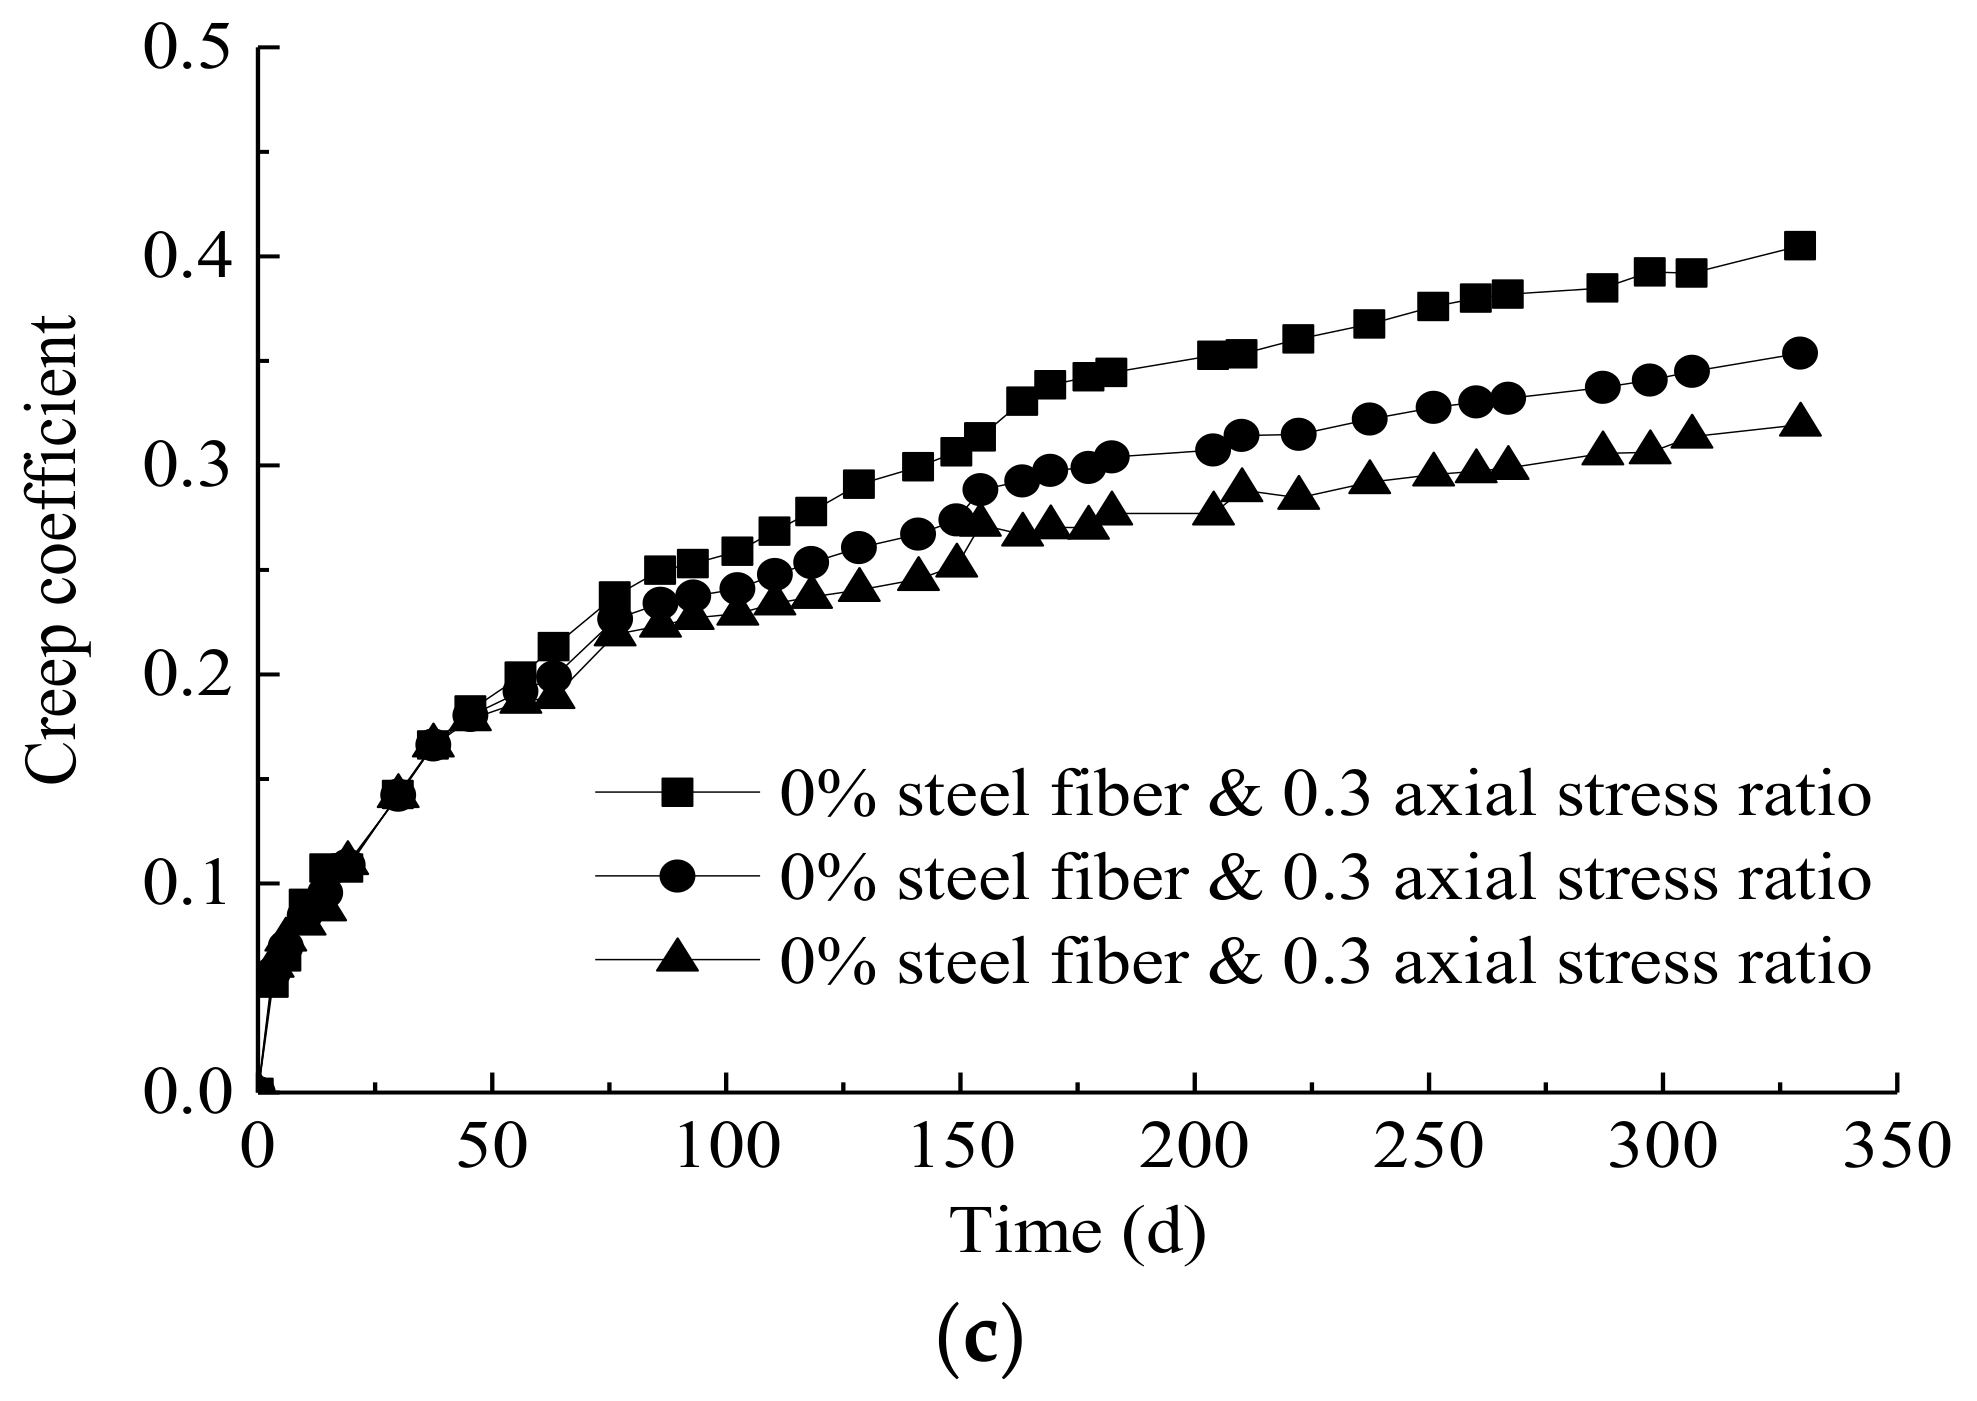
Figure 7 shows variations in the stress-dependent strain, specific creep, and creep coefficient of RPC samples containing different steel fibre contents with time. In Figure 7a, the stress-dependent strain increases with increasing steel fibre content. This is because at the same axial stress ratio, the samples with more steel fibre content bear greater stress, causing more stress-dependent strain. As shown in Figure 7b,c, during the later period after loading, the specific creep and creep coefficient of the RPC samples decrease with increasing steel fibre content. For the samples without steel fibre, the ultimate specific creep is 8.95 με/MPa. However, for the samples with 1% and 2% steel fibre content, the ultimate specific creep is 7.37 and 6.65 με/MPa, respectively. The ultimate specific creep of the RPC samples with 1% and 2% steel fibre content are thus 17.7% and 25.7% less, respectively, than that of the RPC samples without steel fibre. For the samples without steel fibre, the ultimate creep coefficient is 0.40. However, for the samples with 1% and 2% steel fibre content, the ultimate creep coefficients are 0.35 and 0.32, respectively. This means that the ultimate creep coefficients of RPC samples with 1% and 2% steel fibre content are 12.5% and 20.0% smaller, respectively, than that of the RPC samples without steel fibre. The positive effect of steel fibre for reducing creep, particularly during the later period after loading, can be explained as follows:
- (I)
- Even within the linear creep range, when the RPC carries a compressive load, microcracks can form and develop gradually inside the RPC due to the inhomogeneity of the RPC matrix. As the microcracks emerge during the later stage, the steel fibres passing through the microcracks can prevent the microcracks from developing further. Hence, the creep strain is reduced.
- (II)
- During the early period after loading, the steel fibre and RPC matrix produce a section slip. As a result, the inhibition effect of the steel fibre on creep is not significant. On the other hand, during the later period after loading, the slip between the steel fibre and RPC matrix tends to be stable. Hence, the ability of steel fibre to inhibit creep gradually appears.
4.4. Comparison of Shrinkage and Creep of RPC with Existing Models
Shrinkage and creep have complex mechanisms involving many interrelated factors, and there is no single theory which can fully explain these mechanisms. Thus, experimental studies are essential as a basis for shrinkage and creep models. The ACI 209-82 model [46] is the current standard code model recommended by the American Concrete Institute, and is accepted by building codes in the United States. The CEB-FIP 90 model [47] is recommended by the CEB-FIP model code 1990 (Euro-International Committee for Concrete and the International Federation for Prestressing). The B3 model [20] is based on consolidation, has a clear physical background, and considers most of the internal and external factors that affect shrinkage and creep, and thus has a greater accuracy. The GL 2000 model [48] is a modified Atlanta 97 model, influenced by the CEB-FIP 90 model, and was developed to correct the negative relaxation at early loading ages. These four models are the most commonly used shrinkage and creep models for normal strength concrete.
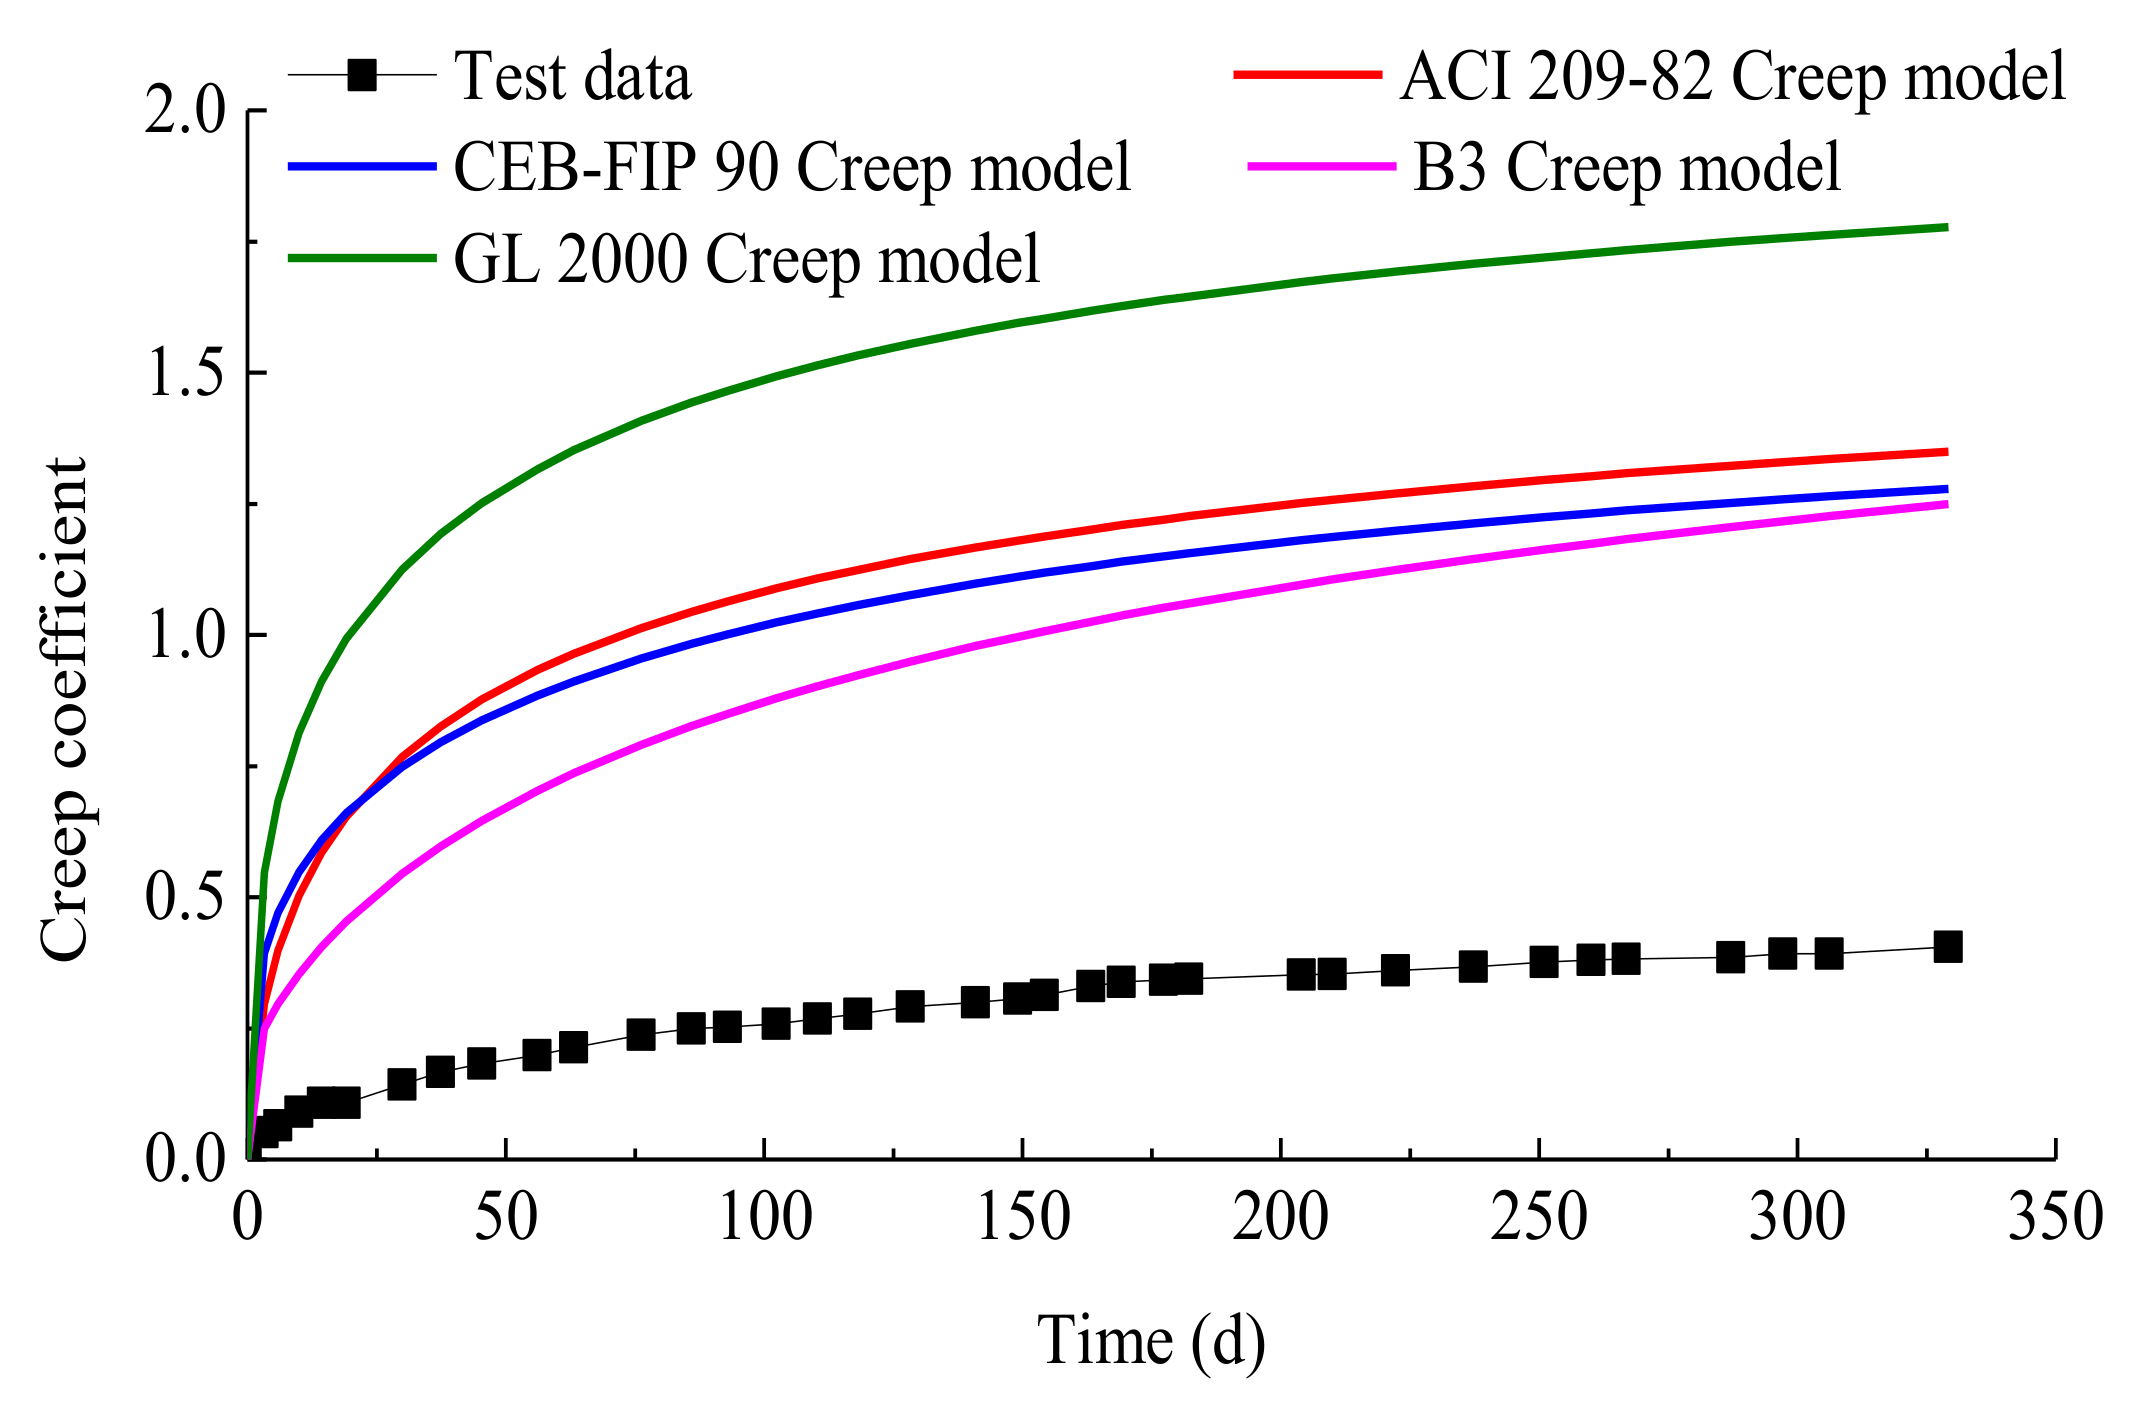
The experimental shrinkage and creep results for RPC in this study were compared with the predicted values from the four models, as shown in Figure 8 and Figure 9. The CEB-FIP 90 model [48] underestimates the shrinkage strain of RPC. However, the ACI 209-82 model [47], B3 model [20], and GL 2000 model [48] overestimate the shrinkage strain of RPC. Moreover, all four models overestimate the creep strain of RPC. From Figure 8 and Figure 9, it can be seen that the shrinkage and creep strain predicted by all four models are inconsistent with the experimental results. The application scopes of the four models are listed in Table 4, from which it can be seen that the four models are mainly focused on compressive strengths at 28 days from 16–90 MPa, water-binder ratios greater than 0.35, and cement contents of less than 719 kg/m3. They also ignore the influence of the silica fume. However, RPC has an ultra-high strength and dense microstructure due to its low water-binder ratio (often less than 0.2), high cementitious material content compared to normal strength concrete, replacement of aggregate with quartz sand and quartz powder, addition of steel fibre to improve the strength and ductility, and replacement of a portion of the cement with silica fume, which can act as a filler material and participate in the pozzolanic reaction, leading to the production of additional C-S-H gel. Therefore, the four models have errors when predicting the shrinkage and creep of RPC.
4.5. Shrinkage and Creep Model of RPC
The existing shrinkage and creep models cannot accurately predict the shrinkage and creep of RPC, so it is necessary to develop new simple numerical models to predict the shrinkage and creep of RPC. Based on the ACI 209-82 shrinkage model [46], the general equations for predicting shrinkage of concrete are as follows:
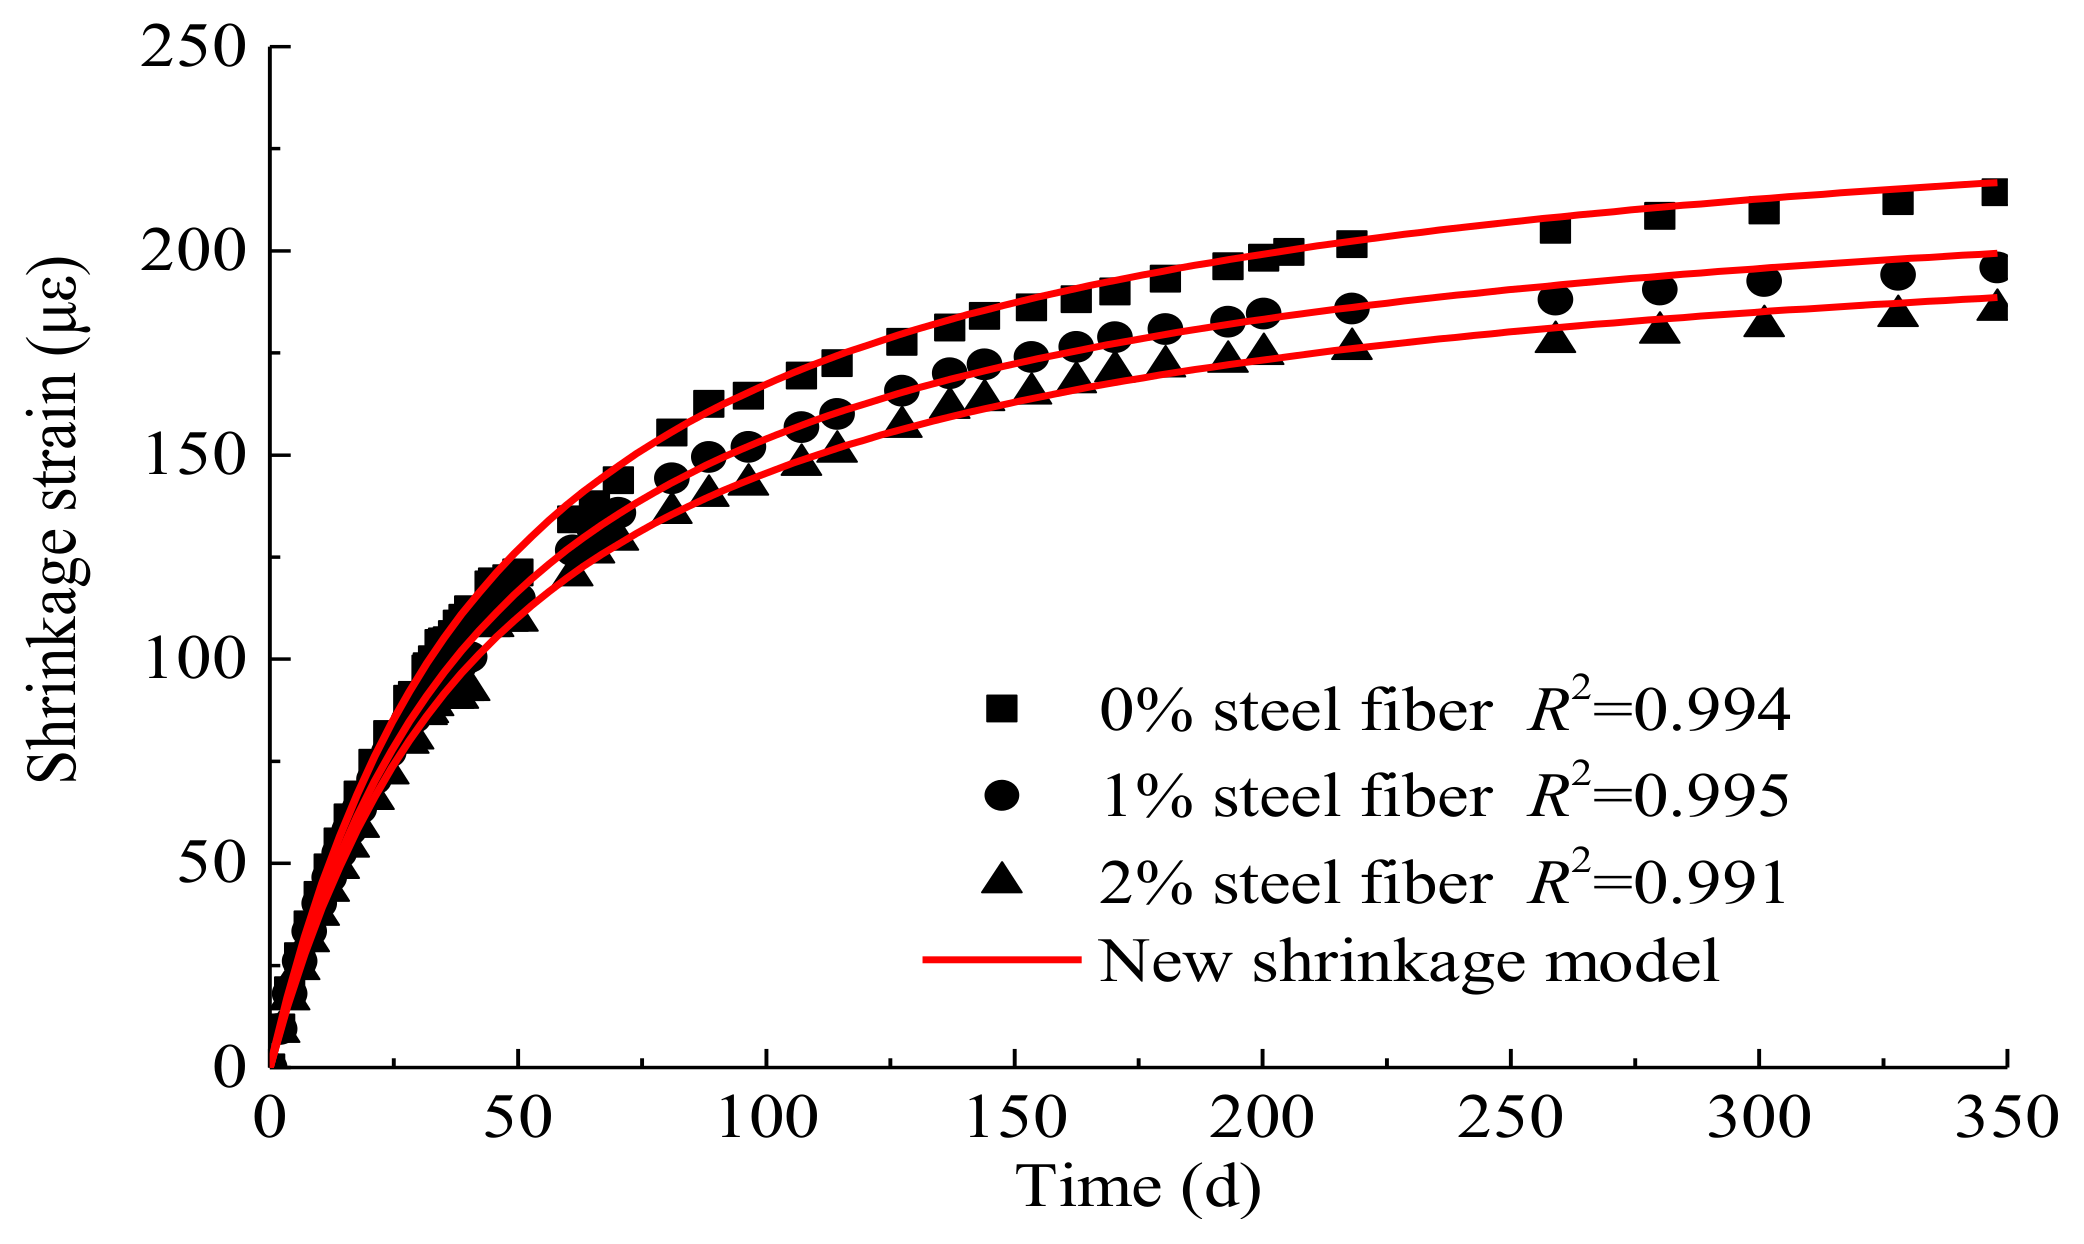
In these equations, is the shrinkage strain of concrete at time, (days), with curing time (days); is the time function of shrinkage; is the ultimate shrinkage strain; and is constant which influences the rate of shrinkage with time. By applying regression fitting to the shrinkage experimental data, a simple shrinkage model (Equations (3) and (4)) for RPC have been developed. In Equation (3), the ultimate shrinkage strain is 246 corresponding to 780 in normal strength concrete. The effects of steel fibre content on the ultimate value of shrinkage is considered by introducing coefficient . A comparison of the proposed shrinkage model predictions and the experimental shrinkage results is shown in Figure 10. The correlation coefficients (R2) for all the shrinkage samples are greater than 0.991. Therefore, the new shrinkage model can be used to predict the shrinkage of RPC after steam-heat curing with steel fibre content less than 2%.
where is the shrinkage strain at time, t, with curing time, ; is the volume fraction of steel fibre.
Based on the ACI 209-82 creep model [47], the general equations for predicting creep of concrete can be written as:
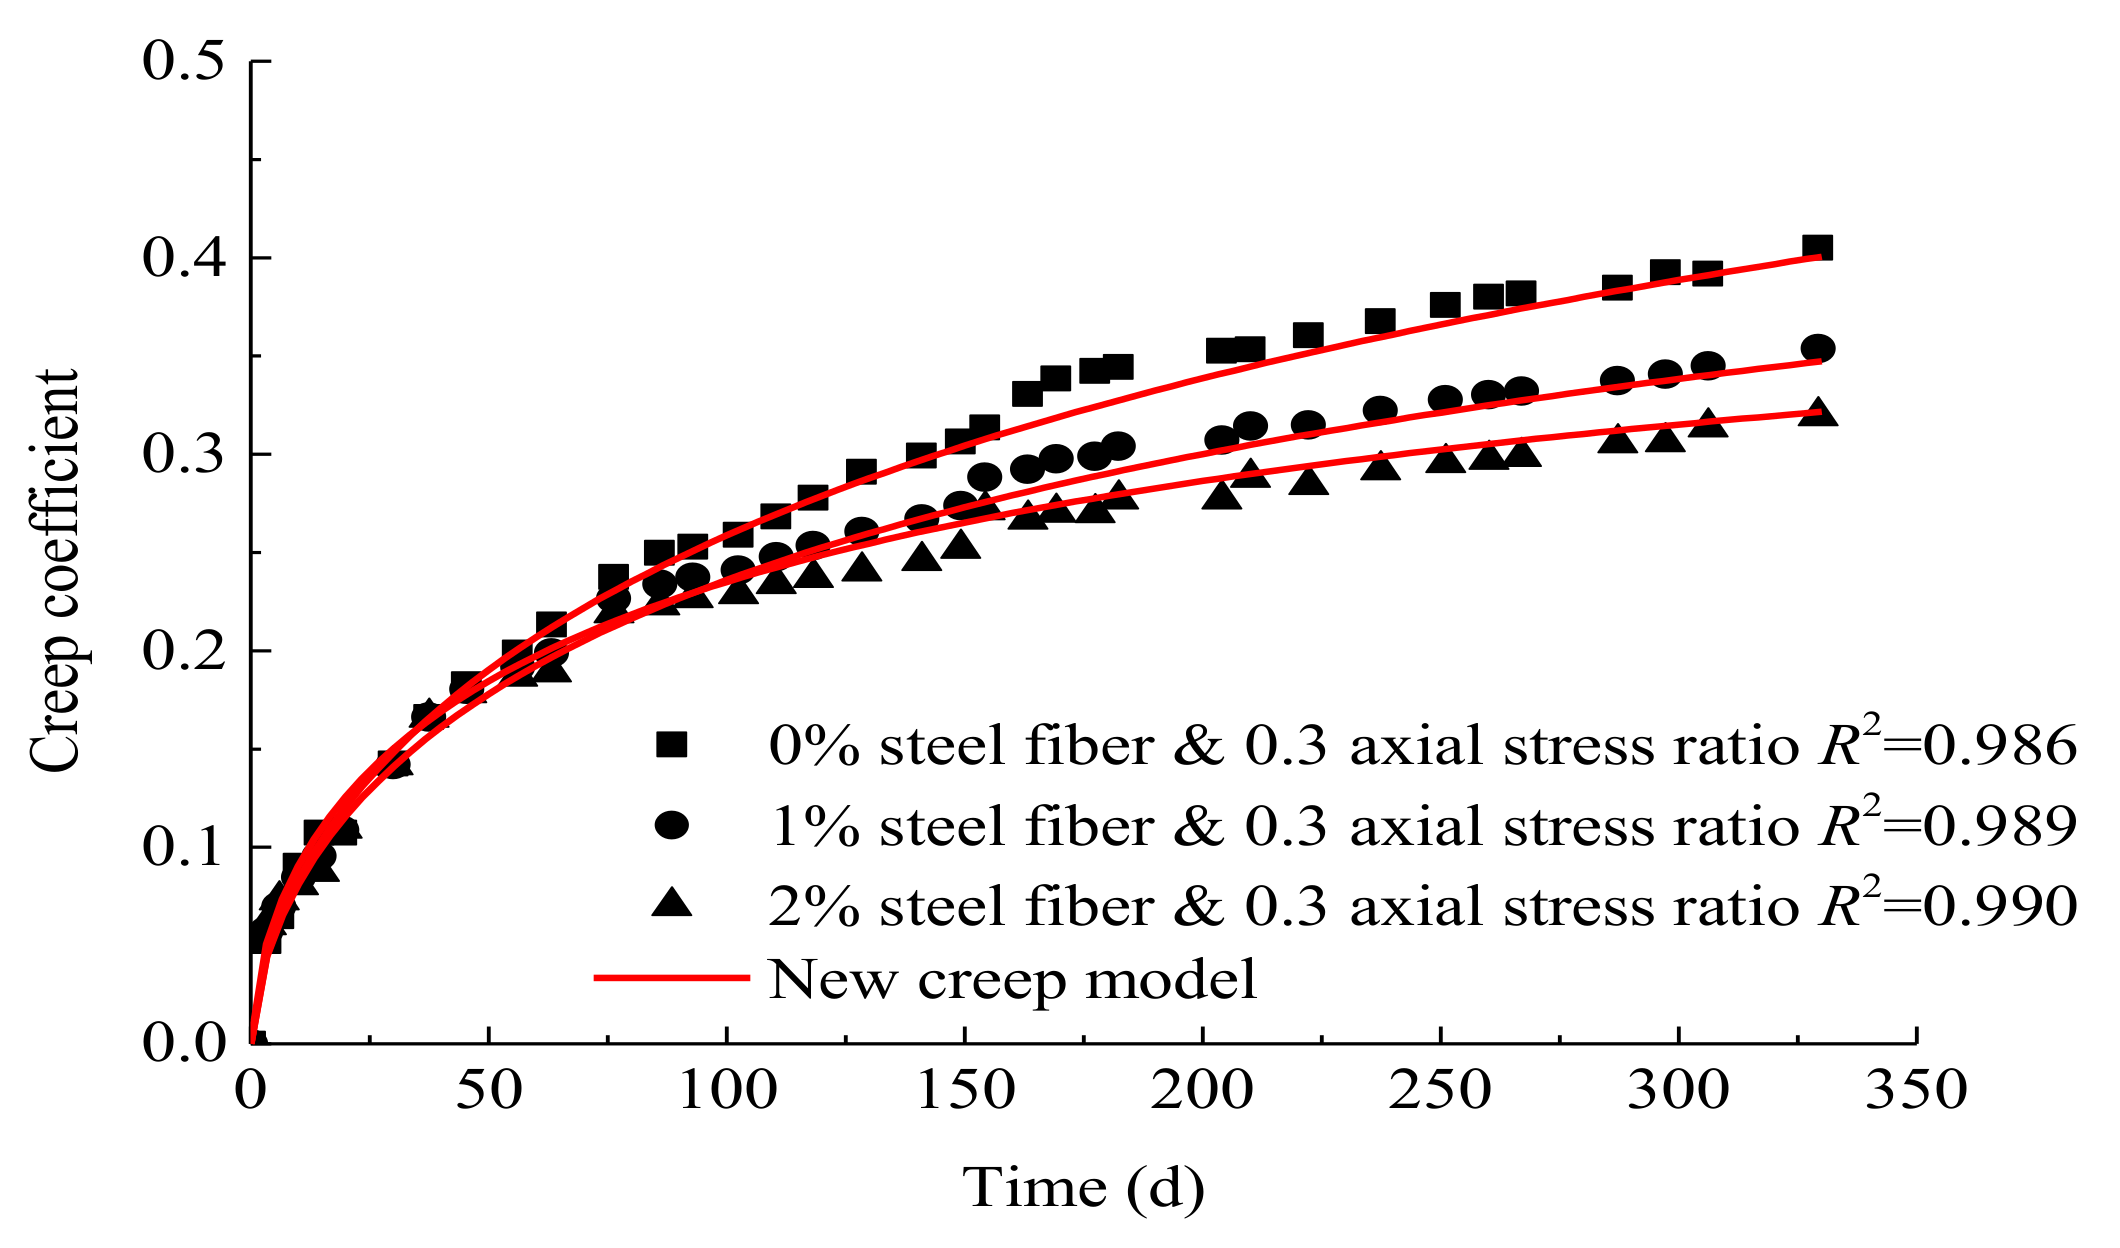
In these equations, is the creep coefficient of concrete at time, (days), loading at time (days); is the time function of creep; is the ultimate creep strain; A and B are constant. By applying regression fitting to the creep experimental data, a simple creep model (Equations (7)–(9)) for RPC have been developed. In Equation (7), the ultimate creep coefficient is 0.82 corresponding to 2.35 in normal strength concrete. The steel fibre can influence both the ultimate value and the rate of creep. Therefore, the effects of fiber content on the ultimate value and development rate of creep are considered by coefficients and , respectively. A comparison between the predictions of the proposed creep model and the experimental creep results is shown in Figure 11. The correlation coefficients (R2) for all the creep samples are greater than 0.986. Therefore, it can be inferred that the new creep model agrees well with the experimental data, and the new model can be used to predict the creep of RPC after steam-heat curing, with the volume fraction of steel fibre below 2% and axial stress ratio less than 0.4.
5. Conclusions
In this study, the compressive strength and the elastic modulus of RPC were tested. The shrinkage after steam-heat curing and the creep of RPC were investigated. The effect of steel fibre on shrinkage and creep, and the influence of the axial stress ratio on creep were discussed. Then, a comparison was made between the experimental results and predictions obtained from existing shrinkage and creep models. Finally, a regression analysis of the experimental shrinkage and creep results for RPC was carried out. The conclusions of this study are as follows:
- (1)
- The compressive strength of RPC is obviously higher than normal strength concrete due to its dense microstructure. The compressive strength and the modulus elastic increase with increasing steel fibre content, as the streel fibre restricts the development of microcracks and transverse deformation.
- (2)
- The shrinkage of RPC is much smaller than normal strength concrete with the improved uniformity and the narrowed pore size. The shrinkage decreases with increasing steel fibre content due to the micro-scale water films formed on the steel fibre surface and skeleton formed by the cross and overlap of steel fibre.
- (3)
- The creep of RPC decreases with increasing steel fibre content which is obvious during the later period after loading, as steel fibre can prevent the development of microcracks (emerging mainly during the later stage). Besides, the slip between the steel fibre and RPC matrix tends to be stable in the later period, the ability of steel fibre to inhibit creep gradually appears.
- (4)
- For axial stress ratios of less than 0.4, the creep strain of RPC varies linearly with the axial stress (RPC is in the linear creep stage).
- (5)
- The shrinkage strains of RPC predicted by the ACI 209-82 model, B3 model, and GL 2000 model are significantly greater than the corresponding experimental results. However, the shrinkage strains of RPC predicted by the CEB-FIP 90 model are significantly smaller than the experimental results. Moreover, all four models overestimate the creep strain of RPC. Thus, these models cannot be used for predicting the shrinkage and creep of RPC.
- (6)
- Simple shrinkage and creep models for RPC which consider the influence of steel fibre have been developed.
Author Contributions
Wenzhong Zheng and Ying Wang conceived and designed the experiments; Pang Chen and Wei Chang performed the experiments. All the authors analysed the data and contributed to writing the paper.
Acknowledgments
The authors gratefully acknowledge the financial support of the National Science Foundation of China (Project No. 51678190, No. 51478142).
Conflicts of Interest
The authors declare no conflict of interest.
References
- Richard, P.; Cheyrezy, M. Composition of reactive powder concretes. Cem. Concr. Res. 1995, 25, 1501–1511. [Google Scholar] [CrossRef]
- Richard, P.; Cheyrezy, M. Reactive powder concretes with high ductility and 200–800 MPa compressive strength. ACI 1994, 114, 507–518. [Google Scholar]
- Cheyrezy, M.; Maret, V.; Frouin, L. Microstructural analysis of RPC (Reactive Powder Concrete). Cem. Concr. Res. 1995, 25, 1491–1500. [Google Scholar] [CrossRef]
- Wang, R.; Gao, X.J. Relationship between Flowability, Entrapped Air Content and Strength of UHPC Mixtures Containing Different Dosage of Steel Fiber. Appl. Sci. 2016, 6, 216. [Google Scholar] [CrossRef]
- Blais, P.Y.; Couture, M. Precast, Prestressed Pedestrian Bridge—World’s First Reactive Powder Concrete Structure. PCI. J. 1999, 44, 60–71. [Google Scholar] [CrossRef]
- Tam, C.M.; Tam, V.W.Y.; Ng, K.M. Assessing drying shrinkage and water permeability of reactive powder concrete produced in Hong Kong. Constr. Build. Mater. 2013, 26, 79–89. [Google Scholar] [CrossRef]
- Zheng, W.Z.; Lu, X.Y. Literature review of reactive powder concrete. J. Build. Struct. 2015, 36, 44–58. (In Chinese) [Google Scholar]
- Yazıcı, H.; Yardımcı, M.Y.; Aydın, S.; Karabulut, A.S. Mechanical properties of reactive powder concrete containing mineral admixtures under different curing regimes. Const. Build. Mater. 2009, 23, 1223–1231. [Google Scholar] [CrossRef]
- Su, A.; Qin, L.; Zhang, S.; Zhang, J.; Li, Z. Effects of Shrinkage Reducing Agent and Expansive Admixture on the Volume Deformation of Ultrahigh Performance Concrete. Adv. Mater. Sci. Eng. 2017, 5, 1–7. [Google Scholar]
- Morin, V.; Tenoudji, F.C.; Feylessoufi, A.; Richard, P. Superplasticizer effects on setting and structuration mechanisms of ultrahigh-performance concrete. Cem. Concr. Res. 2001, 31, 63–71. [Google Scholar] [CrossRef]
- Feylessoufi, A.; Tenoudji, F.C.; Morin, V.; Richard, P. Early ages shrinkage mechanisms of ultra-high-performance cement-based materials. Cem. Concr. Res. 2001, 31, 1573–1579. [Google Scholar] [CrossRef]
- Soliman, A. Effect of partially hydrated cementitious materials on early-age shrinkage of ultra-high-performance concrete. Mag. Con. Res. 2013, 65, 1147–1154. [Google Scholar] [CrossRef]
- Maruyama, I.; Teramoto, A. Temperature dependence of autogenous shrinkage of silica fume cement pastes with a very low water–binder ratio. Cem. Concr. Res. 2013, 50, 41–50. [Google Scholar] [CrossRef]
- Jensen, O.M.; Hansen, P.E. Autogenous Relative Humidity Change in Silica Fume Modified Cement Paste. Aci. Mater. J. 1996, 7, 539–543. [Google Scholar] [CrossRef]
- Yang, Y.; Sato, R.; Kawai, K. Autogenous shrinkage of high-strength concrete containing silica fume under drying at early ages. Cem. Concr. Res. 2005, 35, 449–456. [Google Scholar] [CrossRef]
- Ghafari, E.; Ghahari, S.A.; Costa, H.; Júlio, E.; Portugal, A.; Durães, L. Effect of supplementary cementitious materials on autogenous shrinkage of ultra-high performance concrete. Const. Build. Mater. 2016, 127, 43–49. [Google Scholar] [CrossRef]
- Yazdizadeh, Z.; Marzouk, H.; Hadianfard, M.A. Monitoring of concrete shrinkage and creep using Fiber Bragg Grating sensors. Const. Build. Mater. 2017, 137, 505–512. [Google Scholar] [CrossRef]
- Baant, Z.P.; Prasannan, S. Solidification theory for aging creep. Cem. Concr. Res. 1988, 18, 923–932. [Google Scholar] [CrossRef]
- Bazant, Z.P. Prediction of concrete creep and shrinkage: past, present and future. Nucl. Eng. Des. 2001, 203, 27–38. [Google Scholar] [CrossRef]
- Bažant, Z.P.; Baweja, S. Creep and shrinkage prediction model for analysis and design of concrete structures—model B 3. Mater. Struct. 1995, 28, 357–365. [Google Scholar]
- Shen, P.; Lu, L.; He, Y.; Rao, M.; Fu, Z.; Wang, F.; Hu, S. Experimental investigation on the autogenous shrinkage of steam cured ultra-high performance concrete. Const. Build. Mater. 2018, 162, 512–522. [Google Scholar] [CrossRef]
- Ahmad, S.; Zubair, A.; Maslehuddin, M. Effect of the key mixture mixture parameters on shrinkage of reactive powder concrete. Sci. World. J. 2014, 6. [Google Scholar] [CrossRef] [PubMed]
- Tuan, N.V.; Ye, G.; Breugel, K.V. Effect of rice husk ash on autogenous shrinkage of ultra high performance concrete. In Proceedings of the International Rilem Conference on Use of Superabsorbent Polymers and Other New Additives in Concrete, Lyngby, Denmark, 15–18 August 2010. [Google Scholar]
- Bentz, D.P.; Peltz, M.A. Reducing Thermal and Autogenous Shrinkage Contributions to Early-Age Cracking. Aci. Mater. J. 2008, 105, 414–420. [Google Scholar]
- Nmai, C.K.; Tomita, R.; Hondo, F.; Buffenbarger, J. Shrinkage-reducing admixtures. Int. J. Concr. Struct. 1998, 20, 31–37. [Google Scholar]
- Soliman, A.M.; Nehdi, M.L. Effects of shrinkage reducing admixture and wollastonite microfiber on early-age behavior of ultra-high performance concrete. Cem. Concr. Comp. 2014, 46, 81–89. [Google Scholar] [CrossRef]
- Soliman, A.M.; Nehdi, M.L. Effect of drying conditions on autogenous shrinkage in ultra-high performance concrete at early-age. Mater. Struct. 2011, 44, 879–899. [Google Scholar] [CrossRef]
- Mo, J.; Ou, Z.; Zhao, X.; Wang, Y. Influence of superabsorbent polymer on shrinkage properties of reactive powder concrete blended with granulated blast furnace slag. Const. Build. Mater. 2017, 146, 283–296. [Google Scholar] [CrossRef]
- Cwirzen, A.; Penttala, V.; Vornanen, C. Reactive powder based concretes: mechanical properties, durability and hybrid use with OPC. Cem. Concr. Res. 2008, 38, 1217–1226. [Google Scholar] [CrossRef]
- Graybeal, A. Characterization of the Behavior of Ultrahigh Performance Concrete. Ph.D. Thesis, University of Maryland, College Park, MD, USA, 2005. [Google Scholar]
- Yoo, D.Y.; Kim, S.; Kim, M.J. Comparative shrinkage behavior of ultra-high-performance fiber-reinforced concrete under ambient and heat curing conditions. Const. Build. Mater. 2018, 162, 406–419. [Google Scholar] [CrossRef]
- Pan, Z.; Li, B.; Lu, Z. Re-evaluation of CEB-FIP 90 prediction models for creep and shrinkage with experimental database. Constr. Build. Mater. 2013, 38, 1022–1030. [Google Scholar] [CrossRef]
- Jiang, L.Z.; Yan, B.L.; Xiao, Z.M.; Wang, W.Y.; Zhang, D.T. General purposed portland cement. Cement 2008, 4, 1–2. (In Chinese) [Google Scholar]
- Madandoust, R.; Ranjbar, M.M.; Ghavidel, R.; Shahabi, S.F. Assessment of factors influencing mechanical properties of steel fiber reinforced self-compacting concrete. Mater. Des. 2015, 83, 284–294. [Google Scholar] [CrossRef]
- Zheng, W.Z.; Luo, B.F.; Wang, Y. Compressive and tensile properties of reactive powder concrete with steel fibres at elevated temperatures. Constr. Build. Mater. 2013, 41, 844–851. [Google Scholar] [CrossRef]
- GB 50010-2002. Ministry of Construction of the People’s Republic of China, Code for Design of Concrete Structures; Chinese Architecture and Building Press: Beijing, China, 2002. (In Chinese) [Google Scholar]
- GB/T 50081-2009. Ministry of Housing and Urban-Rural Development of the People’s Republic of China. Standard for Test Methods of Long-Term Performance and Durability of Ordinary Concrete; China Architecture and Building Press: Beijing, China, 2009. (In Chinese) [Google Scholar]
- Wang, C.; Liu, F.; Wan, C.; Pu, X. Preparation of Ultra-High Performance Concrete with common technology and materials. Cem. Concr. Comp. 2012, 34, 538–544. [Google Scholar] [CrossRef]
- Gao, D.Y.; Cheng, H.Q.; Zhu, H.T. Splitting Tensile Bonding Strength of Steel Fiber Reinforced Concrete to Old Concrete. J. Build. Mater. 2007, 10, 505–509. (In Chinese) [Google Scholar]
- Ren, G.M.; Wu, H. Effects of steel fiber content and type on static mechanical properties of UHPCC. Constr. Build. Mater. 2017, 163, 826–839. [Google Scholar] [CrossRef]
- Huang, K.; Deng, M.; Mo, L.; Wang, Y. Early age stability of concrete pavement by using hybrid fiber together with MgO expansion agent in high altitude locality. Constr. Build. Mate. 2013, 48, 685–690. [Google Scholar] [CrossRef]
- Miao, B.Q. Influences of fibre content on properties of self-compacting steel fibre reinforced concrete. J. Chin. Inst. Eng. 2003, 26, 523–530. (In Chinese) [Google Scholar] [CrossRef]
- Yu, J.C.; Zhao, Q.X. Effect of steel fibre on creep behaviour of concrete. J. Chin. Ceram. Soc. 2013, 8, 1087–1093. (In Chinese) [Google Scholar]
- Noushini, A.; Vessalas, K.; Arabian, G.; Samali, B. Drying Shrinkage Behaviour of Fibre Reinforced Concrete Incorporating Polyvinyl Alcohol Fibres and Fly Ash. Adv. Civil. Eng. 2014, 356–365. [Google Scholar] [CrossRef]
- Mo, J.; Ou, Z.; Wang, Y. Influence of MgO and Hybrid Fiber on the Bonding Strength between Reactive Powder Concrete and Old Concrete. Adv. Mater. Sci. Eng. 2016, 5, 1–13. [Google Scholar]
- ACI Committee209. Prediction of Creep, Shrinkage, and Temperature Effects in Concrete Structures; American Concrete Institute: Farmington Hills, MI, USA, 1992. [Google Scholar]
- Clark, L.A. CEB-FIP Model Code 1990. Progr. Usenix Unix Suppl. Doc. 2008, 40, 233–235. [Google Scholar]
- Gardner, N.J.; Lockman, M.J. Design Provisions for Drying Shrinkage and Creep of Normal-Strength Concrete. Aci. Mater. J. 2001, 98, 159–167. [Google Scholar]
Figure 1.
Steel fibre used in this study.

Figure 2.
Shrinkage tests of RPC.

Figure 3.
Creep tests of RPC.

Figure 4.
Compressive strength and elastic modulus of the RPC samples: (a) Compressive strength; (b) Elastic modulus.
Figure 4.
Compressive strength and elastic modulus of the RPC samples: (a) Compressive strength; (b) Elastic modulus.

Figure 5.
Shrinkage strain of the RPC samples with age.

Figure 6.
Effect of the axial stress ratio on the stress dependent strain, specific creep, and creep coefficient of RPC: (a) Stress-dependent strain; (b) Specific creep; (c) Creep coefficient.
Figure 6.
Effect of the axial stress ratio on the stress dependent strain, specific creep, and creep coefficient of RPC: (a) Stress-dependent strain; (b) Specific creep; (c) Creep coefficient.

Figure 7.
Effect of the steel fibre content on the stress-dependent strain, specific creep, and creep coefficient of RPC: (a) Stress-dependent strain; (b) Specific creep; (c) Creep coefficient.
Figure 7.
Effect of the steel fibre content on the stress-dependent strain, specific creep, and creep coefficient of RPC: (a) Stress-dependent strain; (b) Specific creep; (c) Creep coefficient.


Figure 8.
Comparison of the experimental shrinkage strain results for RPC with shrinkage model predictions.
Figure 8.
Comparison of the experimental shrinkage strain results for RPC with shrinkage model predictions.

Figure 9.
Comparison of the experimental creep strain results for RPC with creep model predictions.

Figure 10.
Comparison of the proposed shrinkage model predictions with experimental shrinkage strain results for the RPC samples.
Figure 10.
Comparison of the proposed shrinkage model predictions with experimental shrinkage strain results for the RPC samples.

Figure 11.
Comparison of the proposed creep model predictions with experimental creep coefficient results for the RPC samples.
Figure 11.
Comparison of the proposed creep model predictions with experimental creep coefficient results for the RPC samples.


Table 1.
Chemical composition of cement and silica fume.
| Constituent | Cement (%) | Silica Fume (%) |
|---|---|---|
| CaO | 63.37 | 0.39 |
| SiO2 | 22.08 | 95.11 |
| Al2O3 | 5.72 | 0.43 |
| Fe2O3 | 3.05 | 0.42 |
| K2O | 0.43 | 0.48 |
| MgO | 2.02 | 0.17 |
| Na2O | 0.19 | 0.19 |
| Equivalent alkalis (Na2O + 0.658K2O) | 0.33 | 0.64 |
| SO3 | 2.10 | 0.28 |
| Loss on ignition | 0.71 | 1.89 |
Table 2.
RPC sample mixtures for experiments.
| W/B | Cement | SF | Quartz Sand | Quartz Powder | SP | ST 1 (%) |
|---|---|---|---|---|---|---|
| 0.20 | 1.00 | 0.30 | 0.70 | 0.35 | 0.024 | 0 |
| 0.20 | 1.00 | 0.30 | 0.70 | 0.35 | 0.024 | 1 |
| 0.20 | 1.00 | 0.30 | 0.70 | 0.35 | 0.024 | 2 |
1 Volume percentage.
Table 3.
RPC creep experiment parameters.
| Group | t0 (day) | Δt (day) | fc (MPa) | η | ST% |
|---|---|---|---|---|---|
| I | 28 | 330 | 120 | 0.2 | 0 |
| II | 329 | 120 | 0.3 | 0 | |
| III | 329 | 120 | 0.4 | 0 | |
| IV | 329 | 134 | 0.3 | 1 | |
| V | 329 | 142 | 0.3 | 2 |
Note: t0 is the RPC age at loading, Δt is the load duration, fc is the compressive strength at loading, and η is the axial stress ratio, defined as the ratio of the loading stress to the compressive strength.
Table 4.
Application scope of the existing models.
| Parameters | ACI 209-82 | CEB-FIP 90 | B3 | GL 2000 |
|---|---|---|---|---|
| fc28 (MPa) | - | 20–90 | 17.2–69 | 16–82 |
| Cement content (kg/m3) | - | - | 160–719 | - |
| W/B | - | - | 0.35–0.85 | 0.40–0.60 |
| Relative humidity (%) | 40–100 | 40–100 | 40–100 | 20–100 |
| tc (Moist cured) | ≥7 days | ≤14 days | - | ≥1 day |
| tc (Steam cured) | ≥1 day | ≤14 days | - | ≥1 day |
| η | ≤0.4 | ≤0.4 | ≤0.45 | ≤0.4 |
Note: fc28 is the compressive strength at 28 days, tc is the curing age.
© 2018 by the authors. Licensee MDPI, Basel, Switzerland. This article is an open access article distributed under the terms and conditions of the Creative Commons Attribution (CC BY) license (http://creativecommons.org/licenses/by/4.0/).
Share and Cite
MDPI and ACS Style
Chen, P.; Zheng, W.; Wang, Y.; Chang, W. Analysis and Modelling of Shrinkage and Creep of Reactive Powder Concrete. Appl. Sci. 2018, 8, 732. https://0-doi-org.brum.beds.ac.uk/10.3390/app8050732
AMA Style
Chen P, Zheng W, Wang Y, Chang W. Analysis and Modelling of Shrinkage and Creep of Reactive Powder Concrete. Applied Sciences. 2018; 8(5):732. https://0-doi-org.brum.beds.ac.uk/10.3390/app8050732
Chicago/Turabian StyleChen, Pang, Wenzhong Zheng, Ying Wang, and Wei Chang. 2018. "Analysis and Modelling of Shrinkage and Creep of Reactive Powder Concrete" Applied Sciences 8, no. 5: 732. https://0-doi-org.brum.beds.ac.uk/10.3390/app8050732
Note that from the first issue of 2016, this journal uses article numbers instead of page numbers. See further details here.