Article

YAG Ceramic Nanocrystals Implementation into MCVD Technology of Active Optical Fibers

1
Institute of Photonics and Electronics of the Czech Academy of Sciences, Chaberska 57, 182 51 Prague 8, Czech Republic
2
Department of Nuclear Chemistry, Faculty of Nuclear Sciences and Physical Engineering, Czech Technical University in Prague, Brehova 7, 115 19 Prague 1, Czech Republic
3
Department of Solid State Physics, University of P. J. Safarik in Kosice, Park Angelinum 9, 04154 Kosice, Slovakia
4
Institute of Materials of the Slovak Academy of Sciences, Watsonova 47, 04353 Kosice, Slovakia
5
Université Côte d’Azur, INPHYNI, CNRS UMR7010, Parc Valrose, 06108 Nice, France
*
Author to whom correspondence should be addressed.
Submission received: 29 April 2018 / Revised: 15 May 2018 / Accepted: 15 May 2018 / Published: 21 May 2018
(This article belongs to the Special Issue Rare-Earth Doping for Optical Applications)

Abstract

:
Nanoparticle doping is an alternative approach the conventional solution doping method allowing the preparation of active optical fibers with improved optical and structural properties. The combination of the nanoparticle doping with MCVD process has brought new technological challenges. We present the preparation of fiber lasers doped with Er-doped yttrium aluminum garnet (Er:YAG) nanocrystals. These nanocrystals, prepared by a hydrothermal reaction, were analyzed by several structural methods to determine the mean nanocrystal size and an effective hydrodynamic radius. The nanocrystals were incorporated into silica frits with various porosity made by the conventional MCVD process. The Er:YAG-doped silica frits were processed into preforms, which were drawn into optical fibers. We studied the effect of the nanocrystal size and frit’s porosity on the final structural and optical properties of prepared preforms and optical fibers. Selected optical fibers were tested as an active medium in a fiber ring laser setup and the characteristics of the laser were determined. Optimal laser properties were achieved for the fiber length of 7 m. The slope efficiency of the fiber laser was about 42%. Presented method can be simply extended to the deposition of other ceramic nanomaterials.

1. Introduction

Fiber lasers are one of human breakthroughs that have changed the modern world. They can be found practically everywhere in daily life. Besides their traditional role in telecommunications as amplifiers in optical networks [1,2], they are a key component of sophisticated photonic devices which are used in data processing systems, time metrology, mechanical engineering, etc. [3,4]. An increase in fiber laser power from 30 W to 100 kW in the last two decades [5,6] should be considered as a great success of modern photonics. However, high laser powers have brought demanding requirements on fiber laser materials, such as high thermal stability, improved luminescence, etc. [7]. Recent progress in nanotechnologies has brought a completely novel powerful tool to this field.
Rare-earth doped glass has been used as basic material in active fiber core. Tick [8] suggested to replace glass in the fiber core with glass-ceramic material to improve the active fiber properties. This innovative approach started a new research field of glass-ceramic and nanoparticle doped fibers [9,10]. However, the prepared fibers exhibited quite high background losses in comparison with conventional glass fibers [6,11,12,13,14]. The nanoparticle doping of alumina nanoparticles, for the first time presented at 20th Annual Meeting of the IEEE Lasers and Electro-Optics Society in 2007 [15], has brought the major breakthrough in the field of nanoparticle doped active optical fibers. It was demonstrated that the nanoparticle doping is fully competitive with the conventional solution doping method. This novel method started a glamour career; it has attracted huge attention of the researchers [6,16,17] and has rapidly found its place in industry [18,19]. It has been generally accepted that the nanoparticle doping significantly improves properties of active optical fibers [16,20,21] in comparison with the traditional solution doping method [11]. A homogeneous distribution of nanoparticles inside the fiber core suppresses optical losses. The nanoparticle structure and their composition can improve luminescence properties of the incorporated rare-earth element which determines the operating wavelength of the fiber laser [1,6,17].
A number of advanced methods and materials have been studied to produce active fibers suitable for fiber lasers. Besides the nanoparticle doping, several concepts of fiber preparation like phase nanoseparation [21,22,23], in-situ thermally-induced crystallization [24,25], and direct nanoparticle deposition [26], etc. have been elaborated. However, the nanoparticle doping approach is still very popular because it allows us to simply extend the common MCVD process.
Here we present the preparation of fiber lasers doped with Er-doped yttrium aluminum garnet nanocrystals. The conventional MCVD method was combined with a solution-doping deposition of Er:YAG nanocrystals which were prepared by a hydrothermal reaction. Effects of the nanocrystal size and silica frit’s porosity on the final structural and optical properties of the prepared preforms and optical fibers were studied and optical and wave-guiding properties of prepared fibers were determined. Selected optical fibers were tested as an active medium in a ring laser setup and their laser characteristics were examined.

2. Materials and Methods

2.1. Sample Preparation

Erbium-doped yttrium aluminum garnet nanocrystals with the formula Y3Al5O12 were prepared by photo-induced synthesis followed by a hydrogen reduction according to the Ref. [27]. The concentration of Er3+ ions in the YAG matrix was 0.5 at. %. To form a temporally stable colloidal solution, a total of 2 g of prepared nanocrystals were dispersed in 200 mL of ethanol (UV-grade, Sigma-Aldrich, Prague, Czech Republic).
Nanocrystal-doped preforms were made by modified chemical vapor deposition (MCVD) method combined with a nanocrystal-doping technique [28,29]. The process of doping was as follow: First, a set of porous silica layers of 300 mm long was deposited at 1250 °C onto the inner side of the starting silica tubes with a diameter of 18 mm and wall thickness of 1.4 mm. Three preforms were prepared at different flow rates of the carrying gas through the bubbler −100, 250 and 400 sccm. The prepared silica layers were impregnated with a colloidal solution of Er:YAG nanocrystals for 24 h. The impregnated silica layers were dried under an oxygen flow of 10 sccm for 48 h and thermally treated at 600 °C to burn-out residual organic materials. Afterwards, the doped silica frits were sintered at 1600 °C and collapsed at 2100 °C into final preforms. The preforms were drawn into optical fiber with an outer diameter of 125 μm and coated with a UV-curable acrylate (UV-A 3471, DeSoto, London, UK).

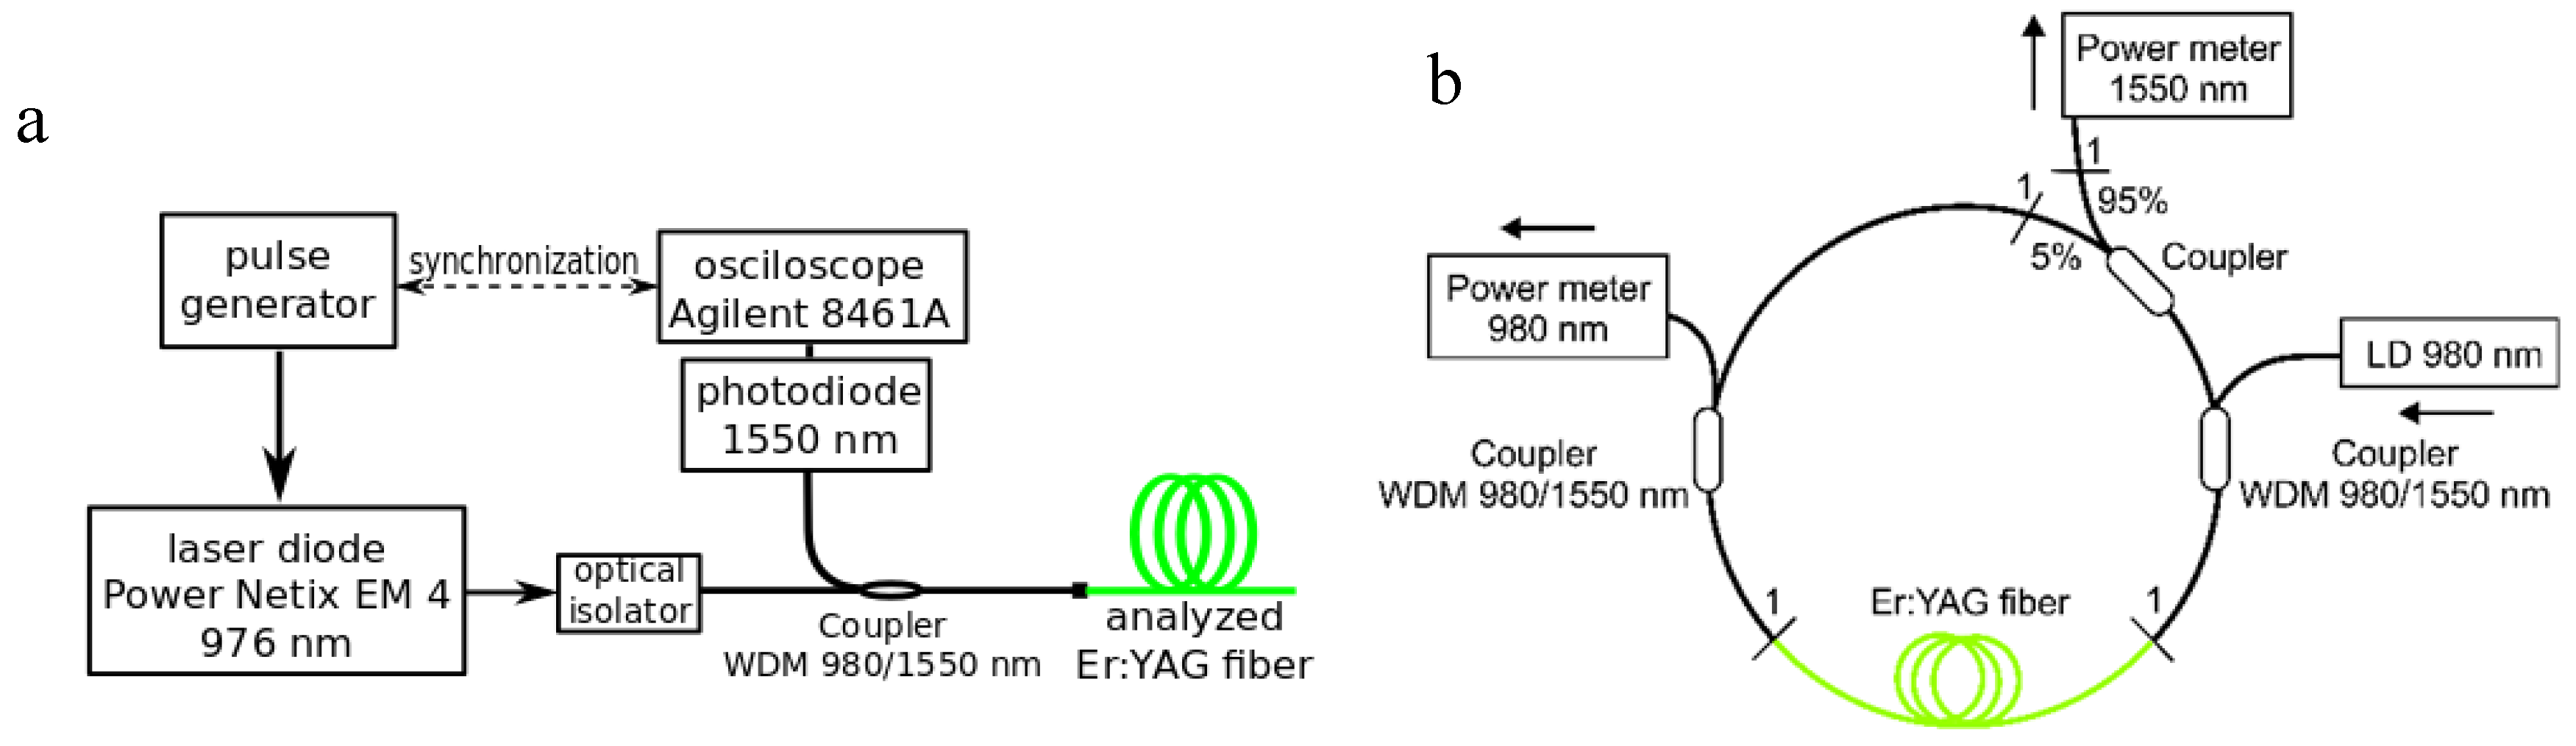
2.2. Characterization Techniques

X-ray diffraction (XRD) analyses were performed on a Bruker D8 Discover diffractometer with Bragg-Brentano geometry operating with Cu-Kα radiation (λ = 1.54056 Å, operating voltage 40 kV, current 40 mA, integration time 200 ms). The crystallized phase was compared to JCPDS data file number 79-1892 of yttrium aluminum garnet Y3Al5O12. The mean nanocrystal size was calculated using in-built operating software. Dynamic light scattering (DLS) on the nanocrystals was used to determine the particle size distribution. The measurement and analysis were performed with ZetaPals particle size analyzer (Brookhaven instruments, Holtsville, NY, USA). High-resolution transmission electron microscopy was performed using a JEOL JEM 2100F UHR microscope equipped with an energy-dispersive X-ray electron spectrometer (EDX). The microscope operated at 200 kV (Schottky FEG cathode) with a point resolution of 1.9 Å. A copper grid coated with a porous carbon support film was used as a sample holder. The sample powder was dispersed in ethanol and the resulting suspension was treated in an ultrasonic bath for 10 min and then applied to the grid.
Refractive index profiles of preform were measured with Photon Kinetics’s A2600 refractive index analyzer. Concentration profiles of the preforms were measured with Cameca SX100 electron microprobe. A thin carbon layer was sputtered on the samples prior to the analysis to prevent charging.
Spectral attenuation and steady-state luminescence properties of the fibers were recorded by AQ-6315B (Ando, Tokyo, Japan) spectral analyzer. The longitudinal homogeneity of the fiber and background losses at 850 and 1310 nm were measured with an optical time-domain reflectometer (OTDR) EXFO 715B. The width of the excitation pulse was 5 ns and the integration time was 30 s. The analyzed fibers were spliced with a standard single-mode optical fiber which was connected to the spectrometer.
The time-resolved luminescence properties of the fiber were measured by the cut-back method. The setup is depicted in Figure 1a. The analyzed fibers were spliced with a standard telecommunication wavelength division multiplexer (WDM) 980/1550 nm. The samples were excited by a power adjustable laser diode EM 4 (PowerNetix) operating at 976 nm. The luminescence at 1550 nm was detected by an InGaAs photodiode G8941 (Hamamatsu, Japan). The time-response of the photodiode was analyzed by a 1-GS/s oscilloscope 8461A (Agilent, London, UK). The oscilloscope was synchronized with a rising edge of the excitation pulse of the pulse generator Agilent 33512B.
Lasing properties of the prepared fiber were measured in a ring laser arrangement [14] depicted in Figure 1b. Segments of the fiber were spliced (“1” denotes the splices) into a fiber ring consisting of two WDM’s operating at 980 and 1550 nm (FWDM-59-2-2-FA, Opneti, Hong Kong, China) and an output optical fiber coupler with splitting ratio of 5/95 (SQS Vlaknova optika, Nova Paka, Czech Republic). The WDMs and output couplers were standard optical fiber components used in telecommunications made by fused-biconical-taper process. The high output coupling ratio was chosen because in similar cavity arrangements and high-gain, low-loss active media, the optimum power conversion is achieved for resonators with high output coupling. Indeed, for example in Er/Yb-doped ring fiber laser in similar setup, the output power was maximized for output coupling of 95% and the maximum was rather flat between 70% and 98% [30]. Intensities of the unabsorbed pumping signal at 980 nm and laser signal at 1550 nm were measured with a dual-channel optical multimeter AQ-2140 (Ando, Tokyo, Japan).

3. Results

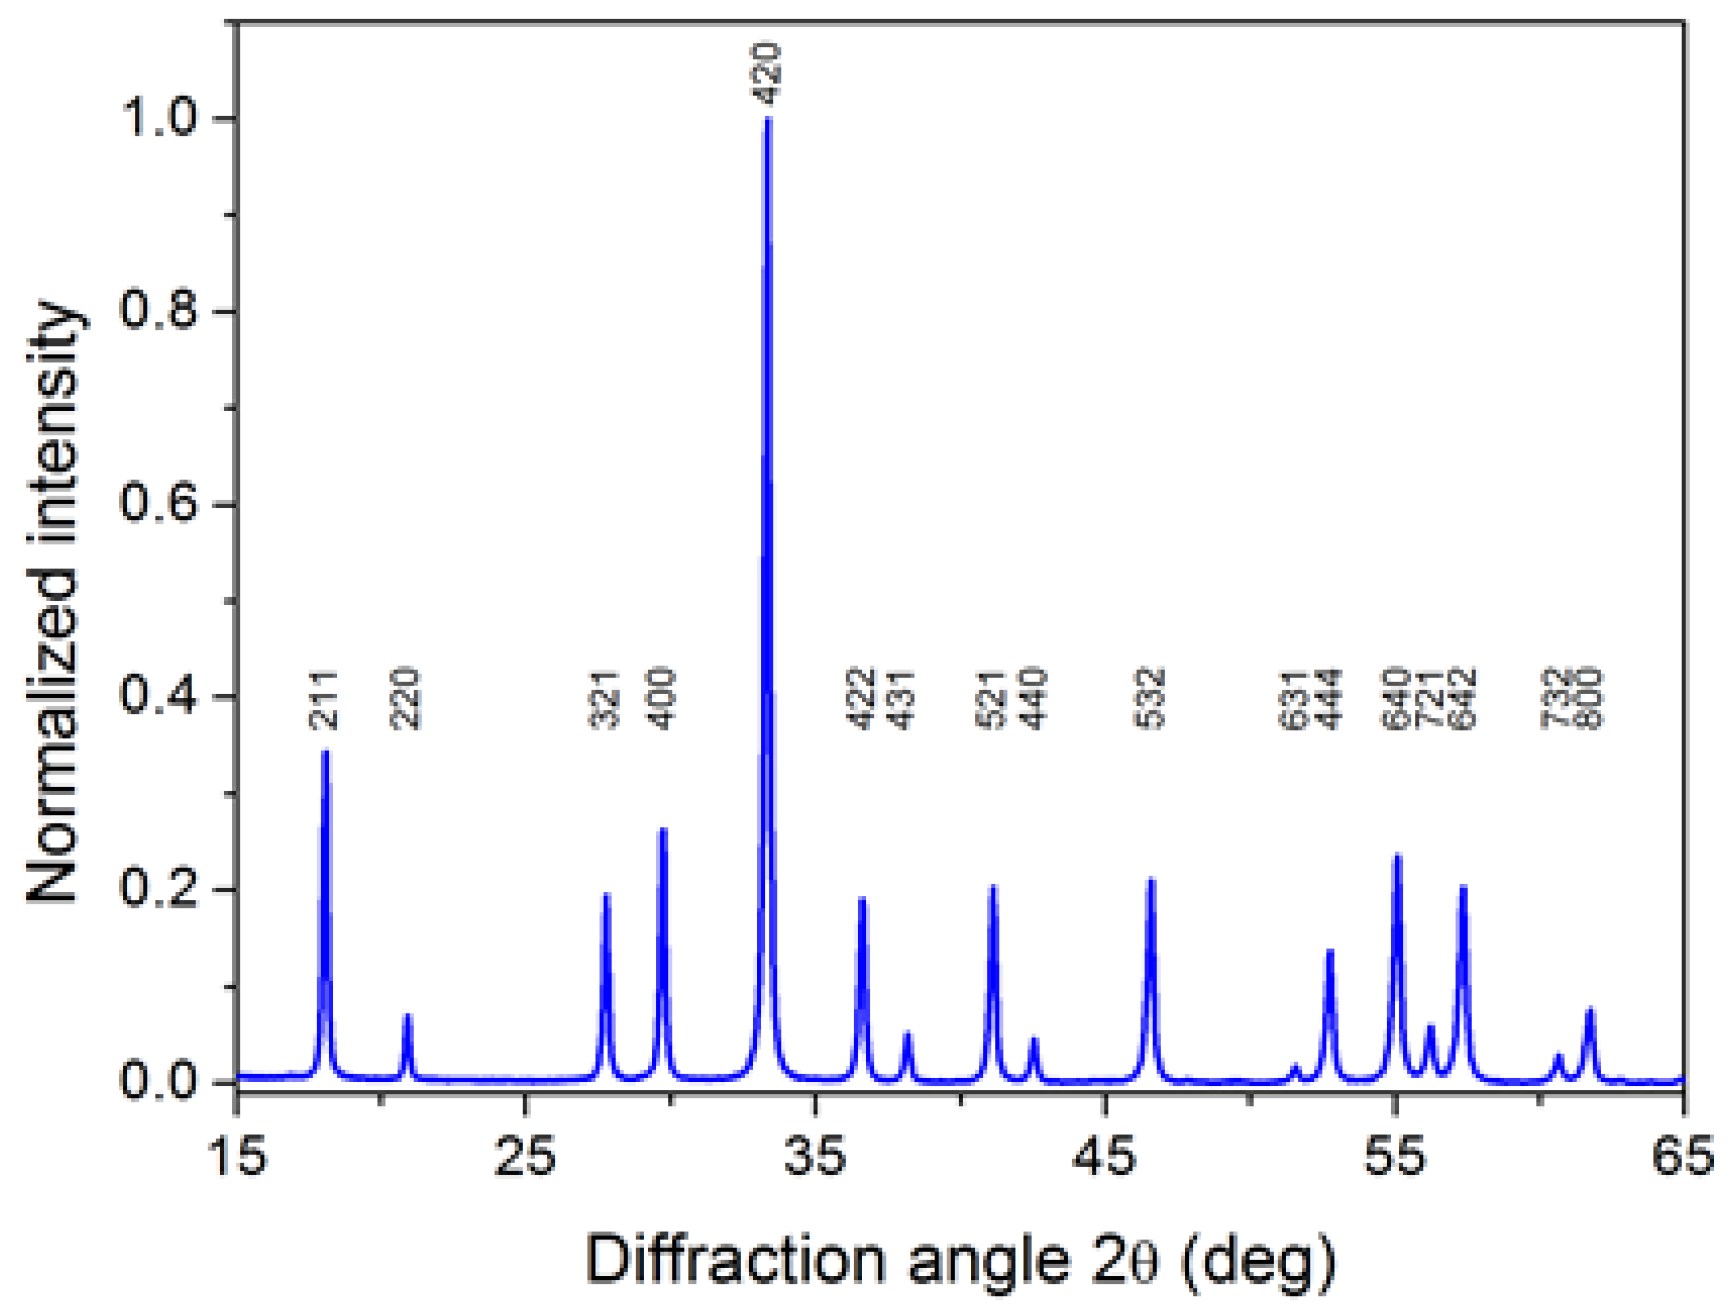
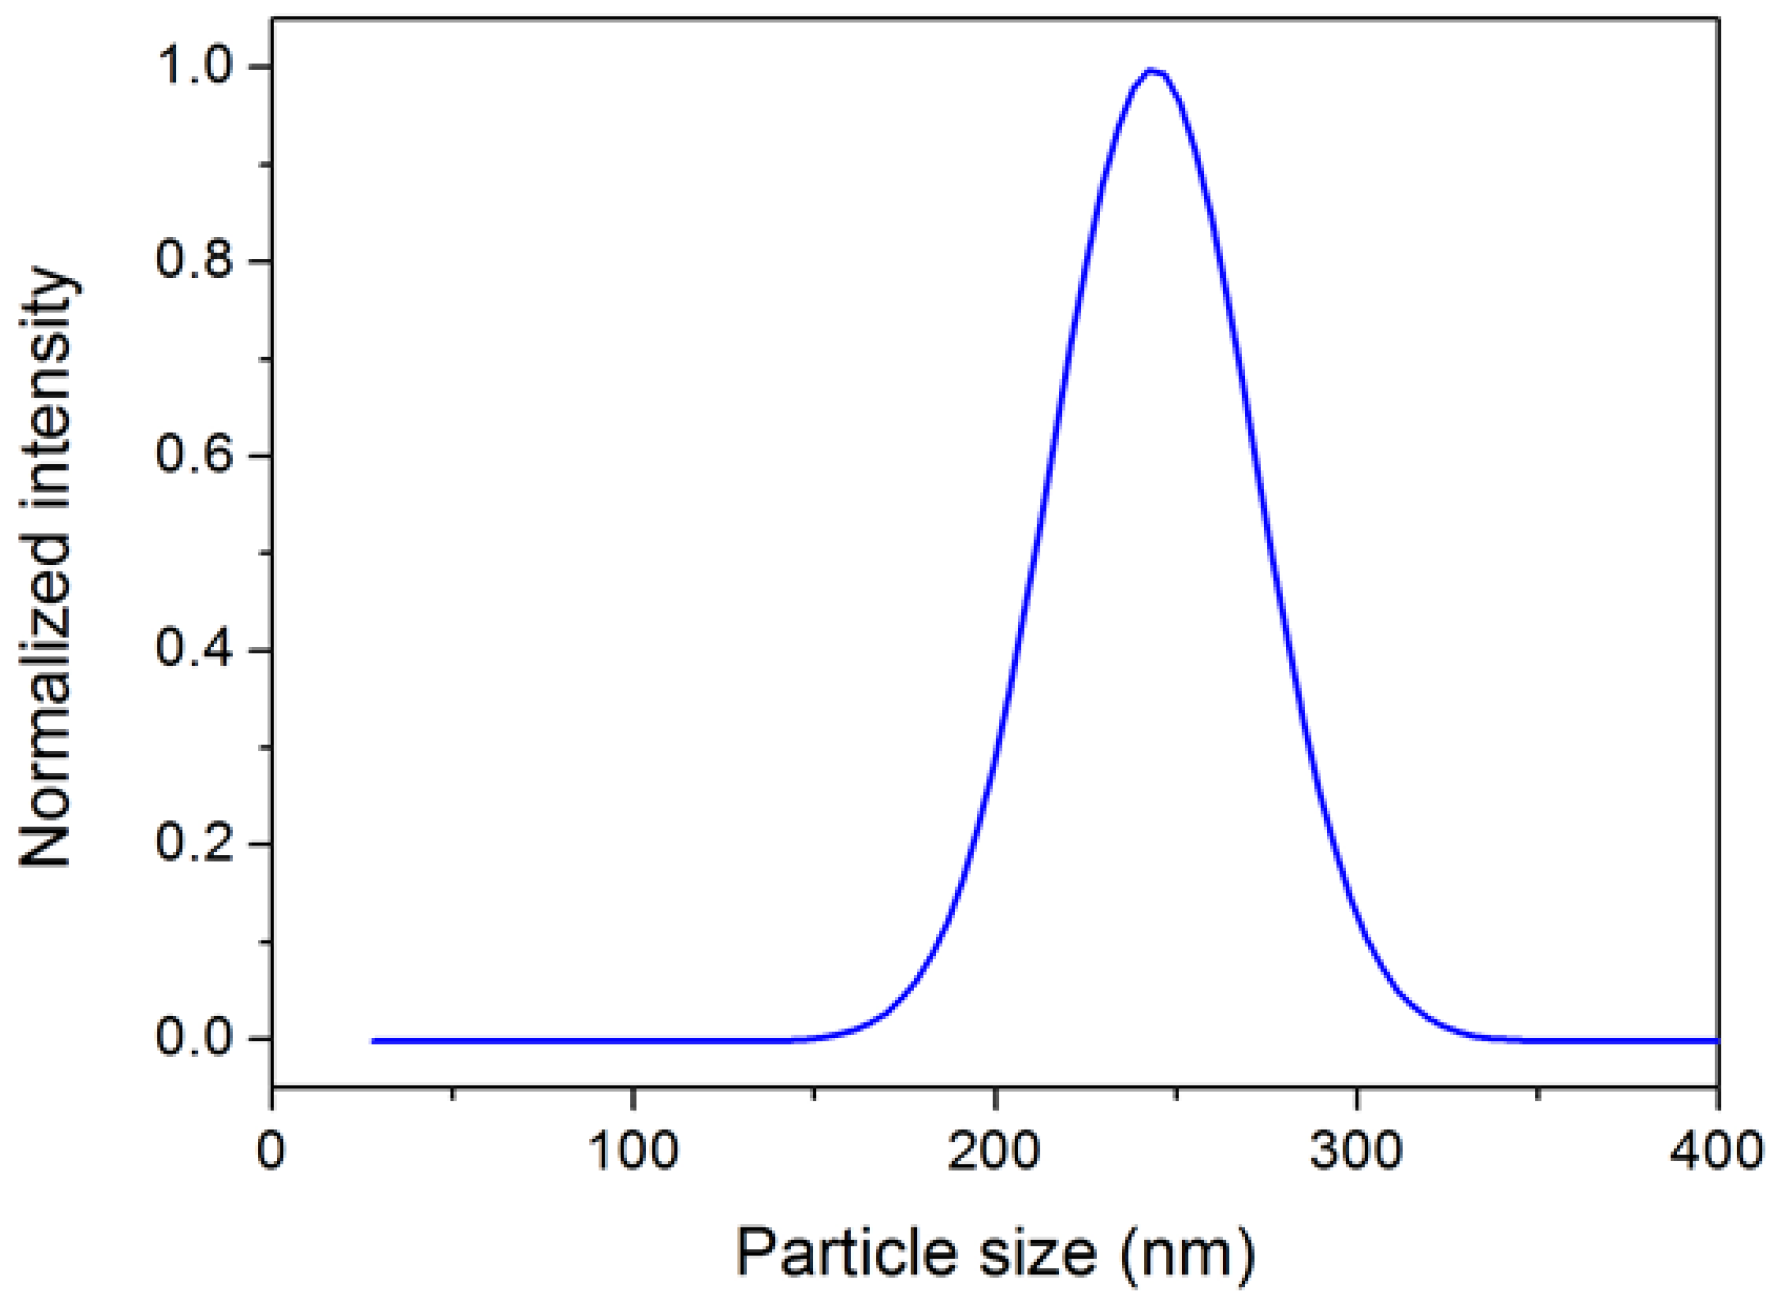
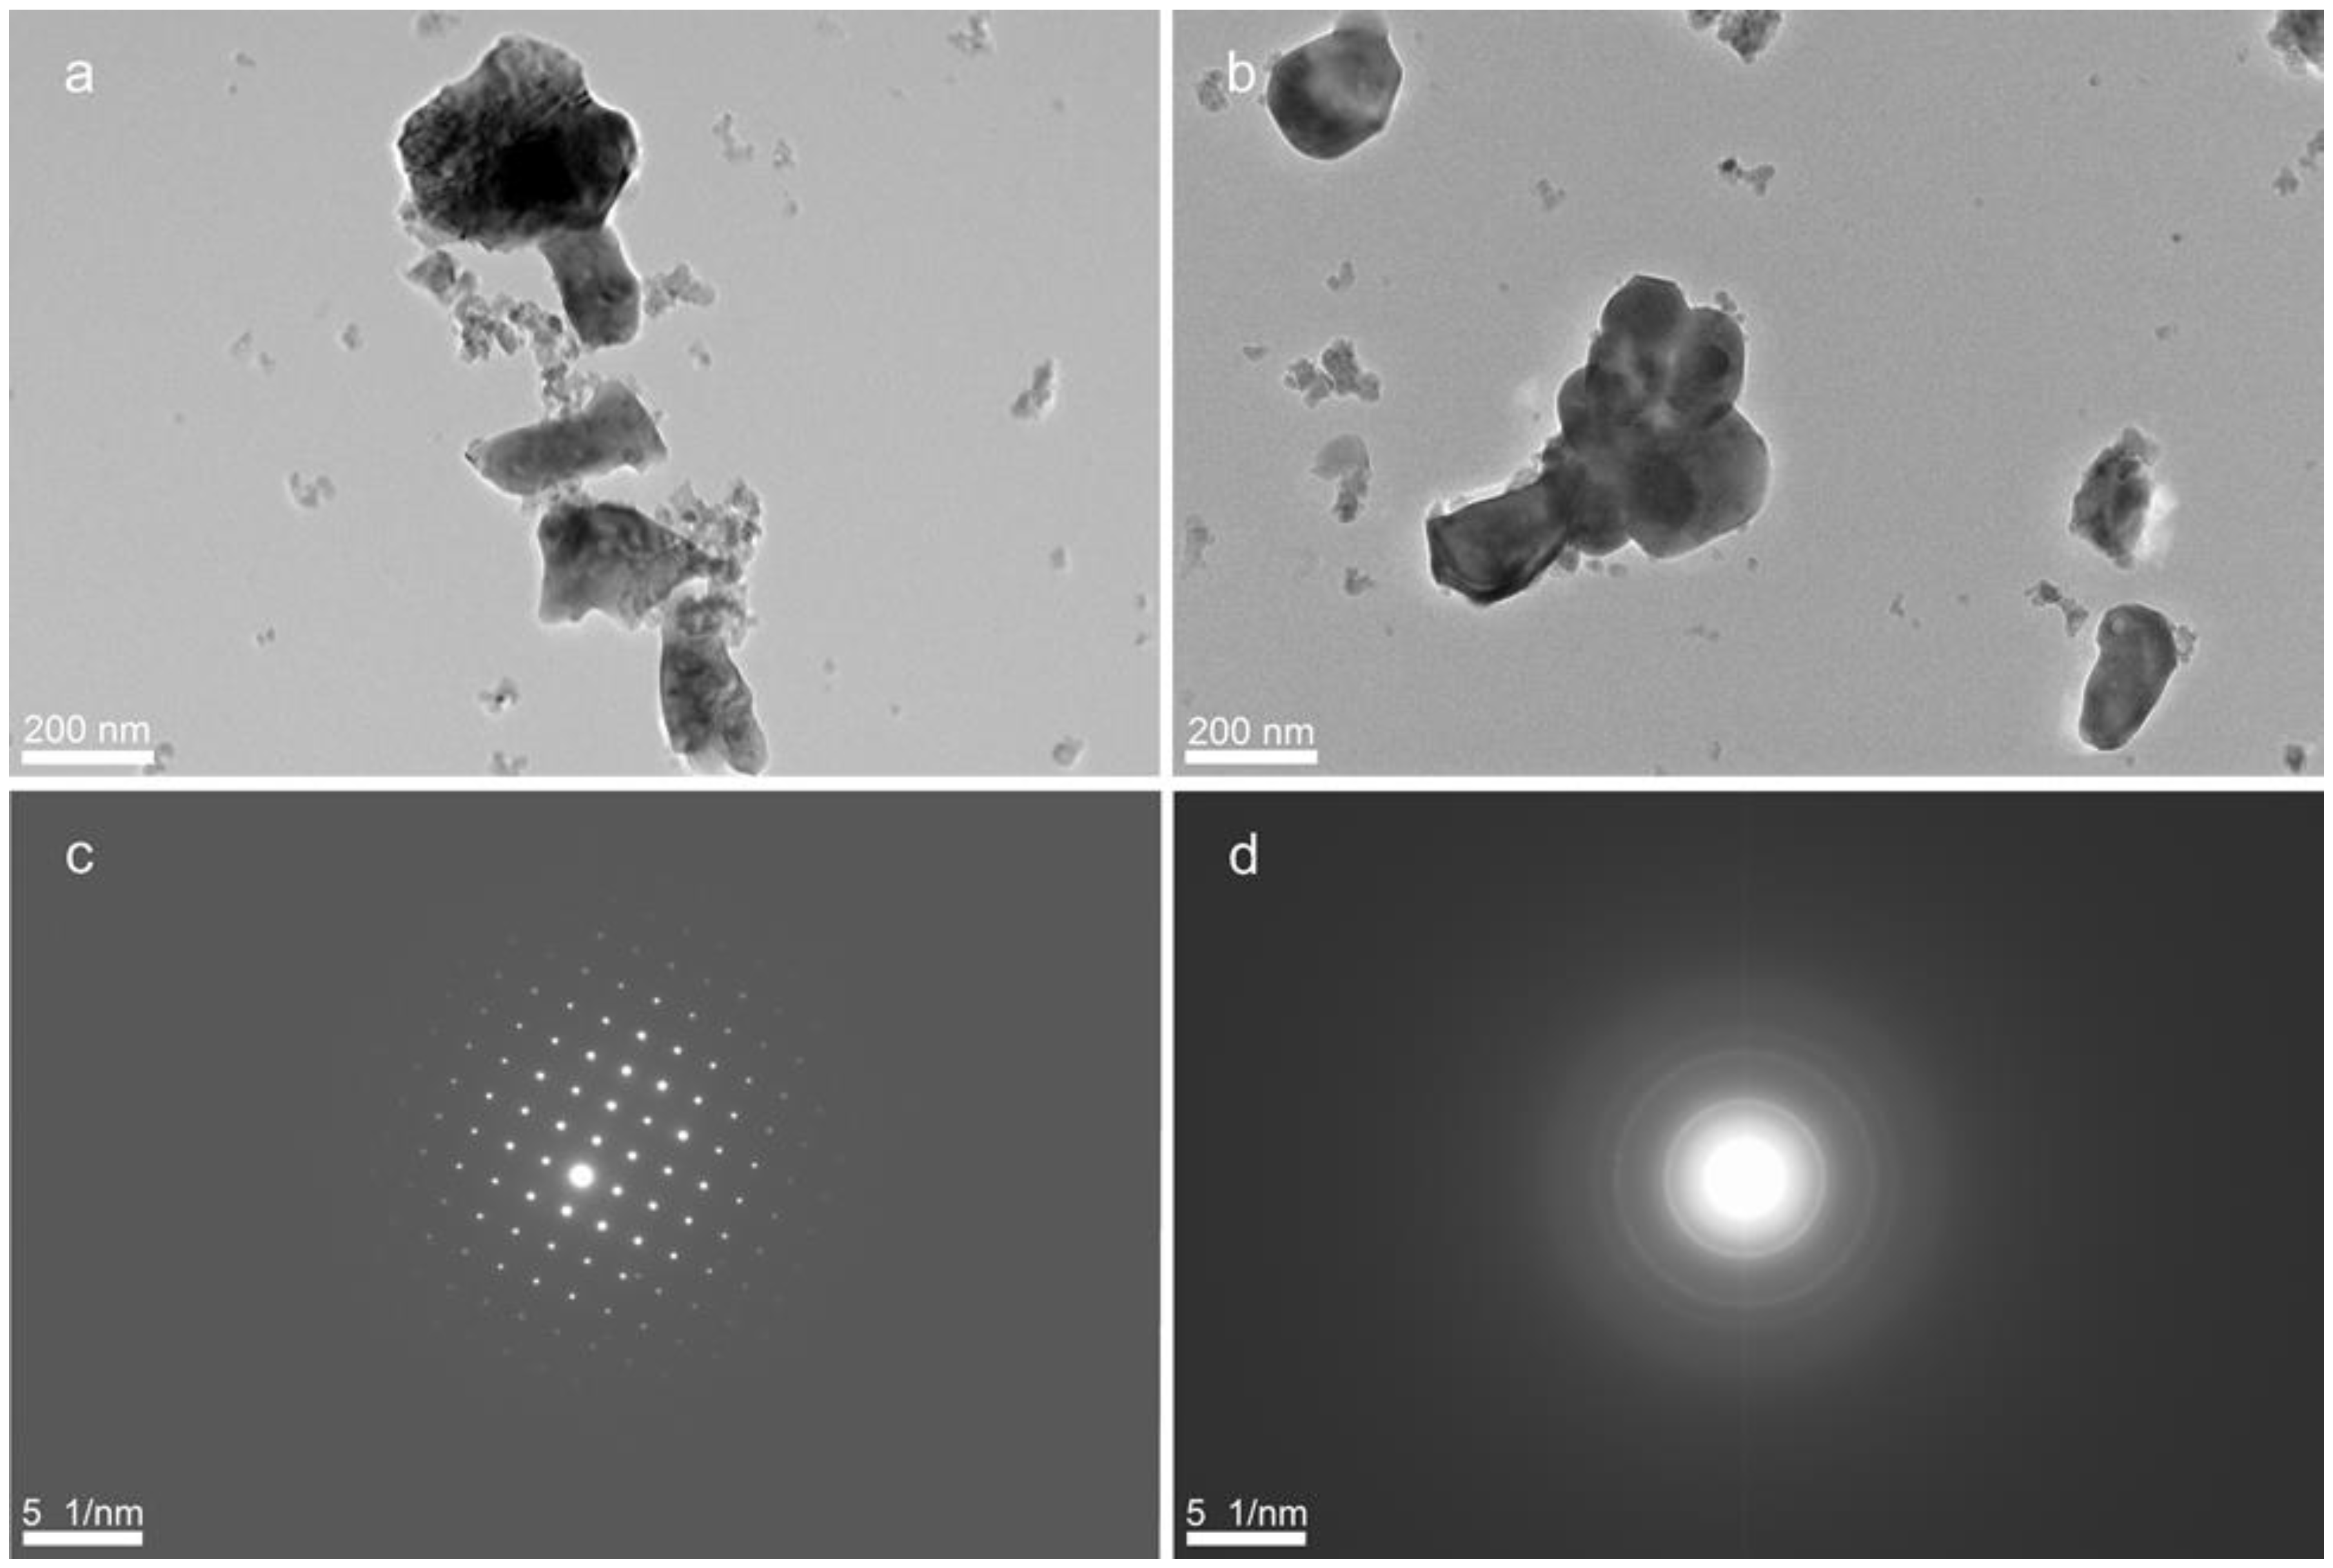
3.1. Characterization of YAG Nanocrystals

To correctly determine the size of Er:YAG nanocrystals several structural methods were used. Figure 2 shows an XRD pattern of Er:YAG nanocrystals with denoted (hkl) indices. A sample calcined at 950 °C exhibited a set of well pronounced peaks which corresponded to pure YAG crystallizing in the cubic structure with a lattice parameter a = 12.00 Å. The peak intensities proved that orientation of nanocrystals in the analyzed samples is random. No traces of impurities were detected in the XRD record. The mean nanocrystal size, calculated from XRD peak broadening according to Scherrer’s equation, was 140 ± 20 nm.
To verify the size of nanocrystals and their stability in the colloidal solution, the size distribution of YAG nanocrystals was measured by dynamic light scattering. Figure 3 shows that the nanocrystal sizes followed Gaussian’s distribution ranging from 160 to 310 nm and that the effective diameter of the nanocrystals was 234 nm. A value of the polydispersity index equal to 0.162 indicated that the colloidal solution exhibited a moderately polydisperse character.
Shapes and morphology of Er:YAG nanocrystals were examined by transmission electron microscope (TEM) and the selected results are shown in Figure 4. The TEM images allowed us to distinguish two main nanocrystal fractions in the sample (Figure 4a,b). To the first fraction belong the nanocrystals larger than 110 nm. They occurred either as individual nanocrystals or as larger nanocrystal clusters with a size up to 400 nm. The selected area electron diffraction (SAED) performed on these nanocrystals (Figure 4c) and the local EDX analysis confirmed that their crystalline structure and chemical composition corresponded to YAG. To the second fraction belong nanoparticles smaller than 5 nm. These nanoparticles are aggregated into clusters smaller than 30 nm. The related SAED pattern (Figure 4d) shows only three diffraction rings which are not as sharp as for typical crystalline structure, and fourth diffusive ring. It can be concluded that these nanocrystals are amorphous rather than crystalline. The local EDX analysis confirmed that their chemical composition corresponded to aluminum oxide.

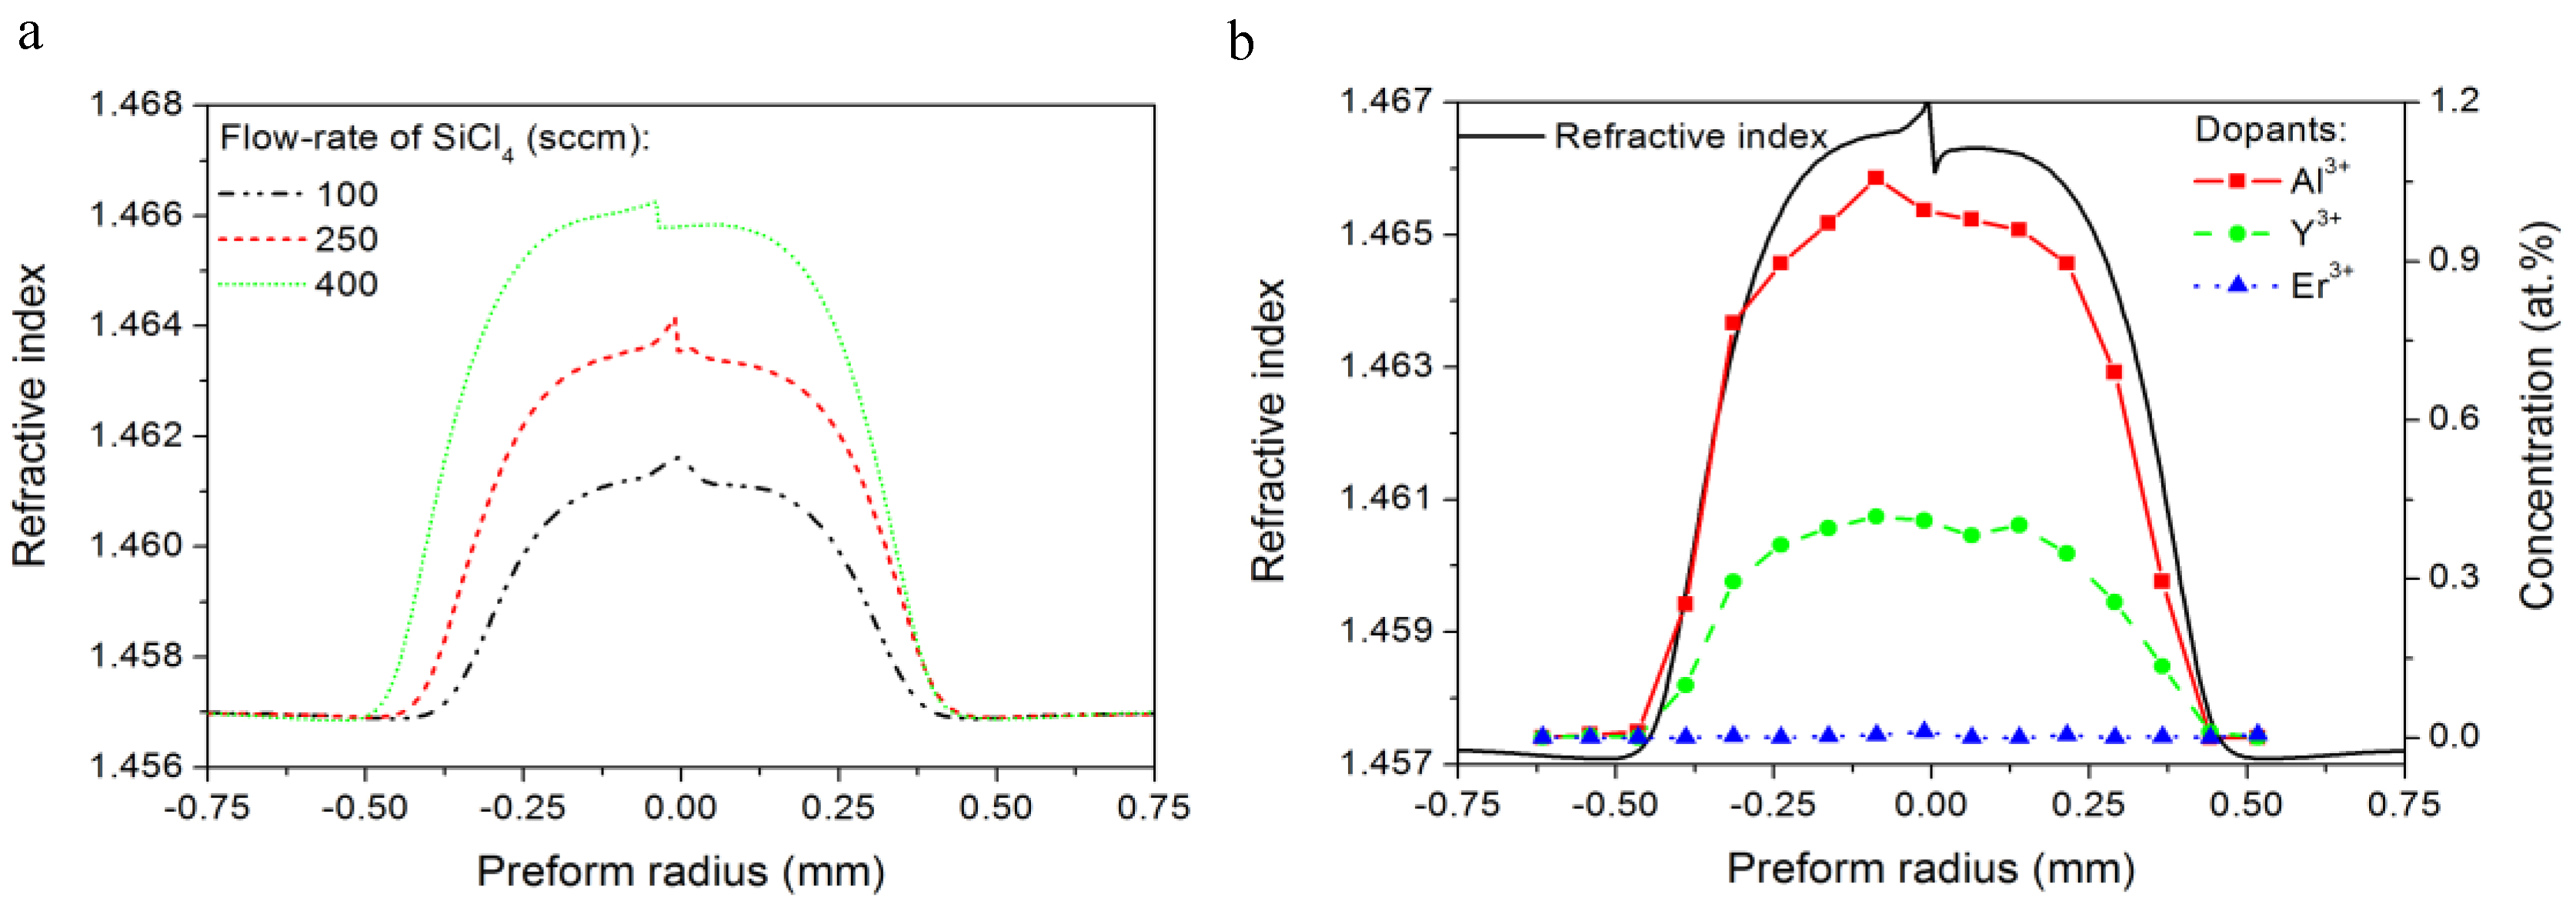
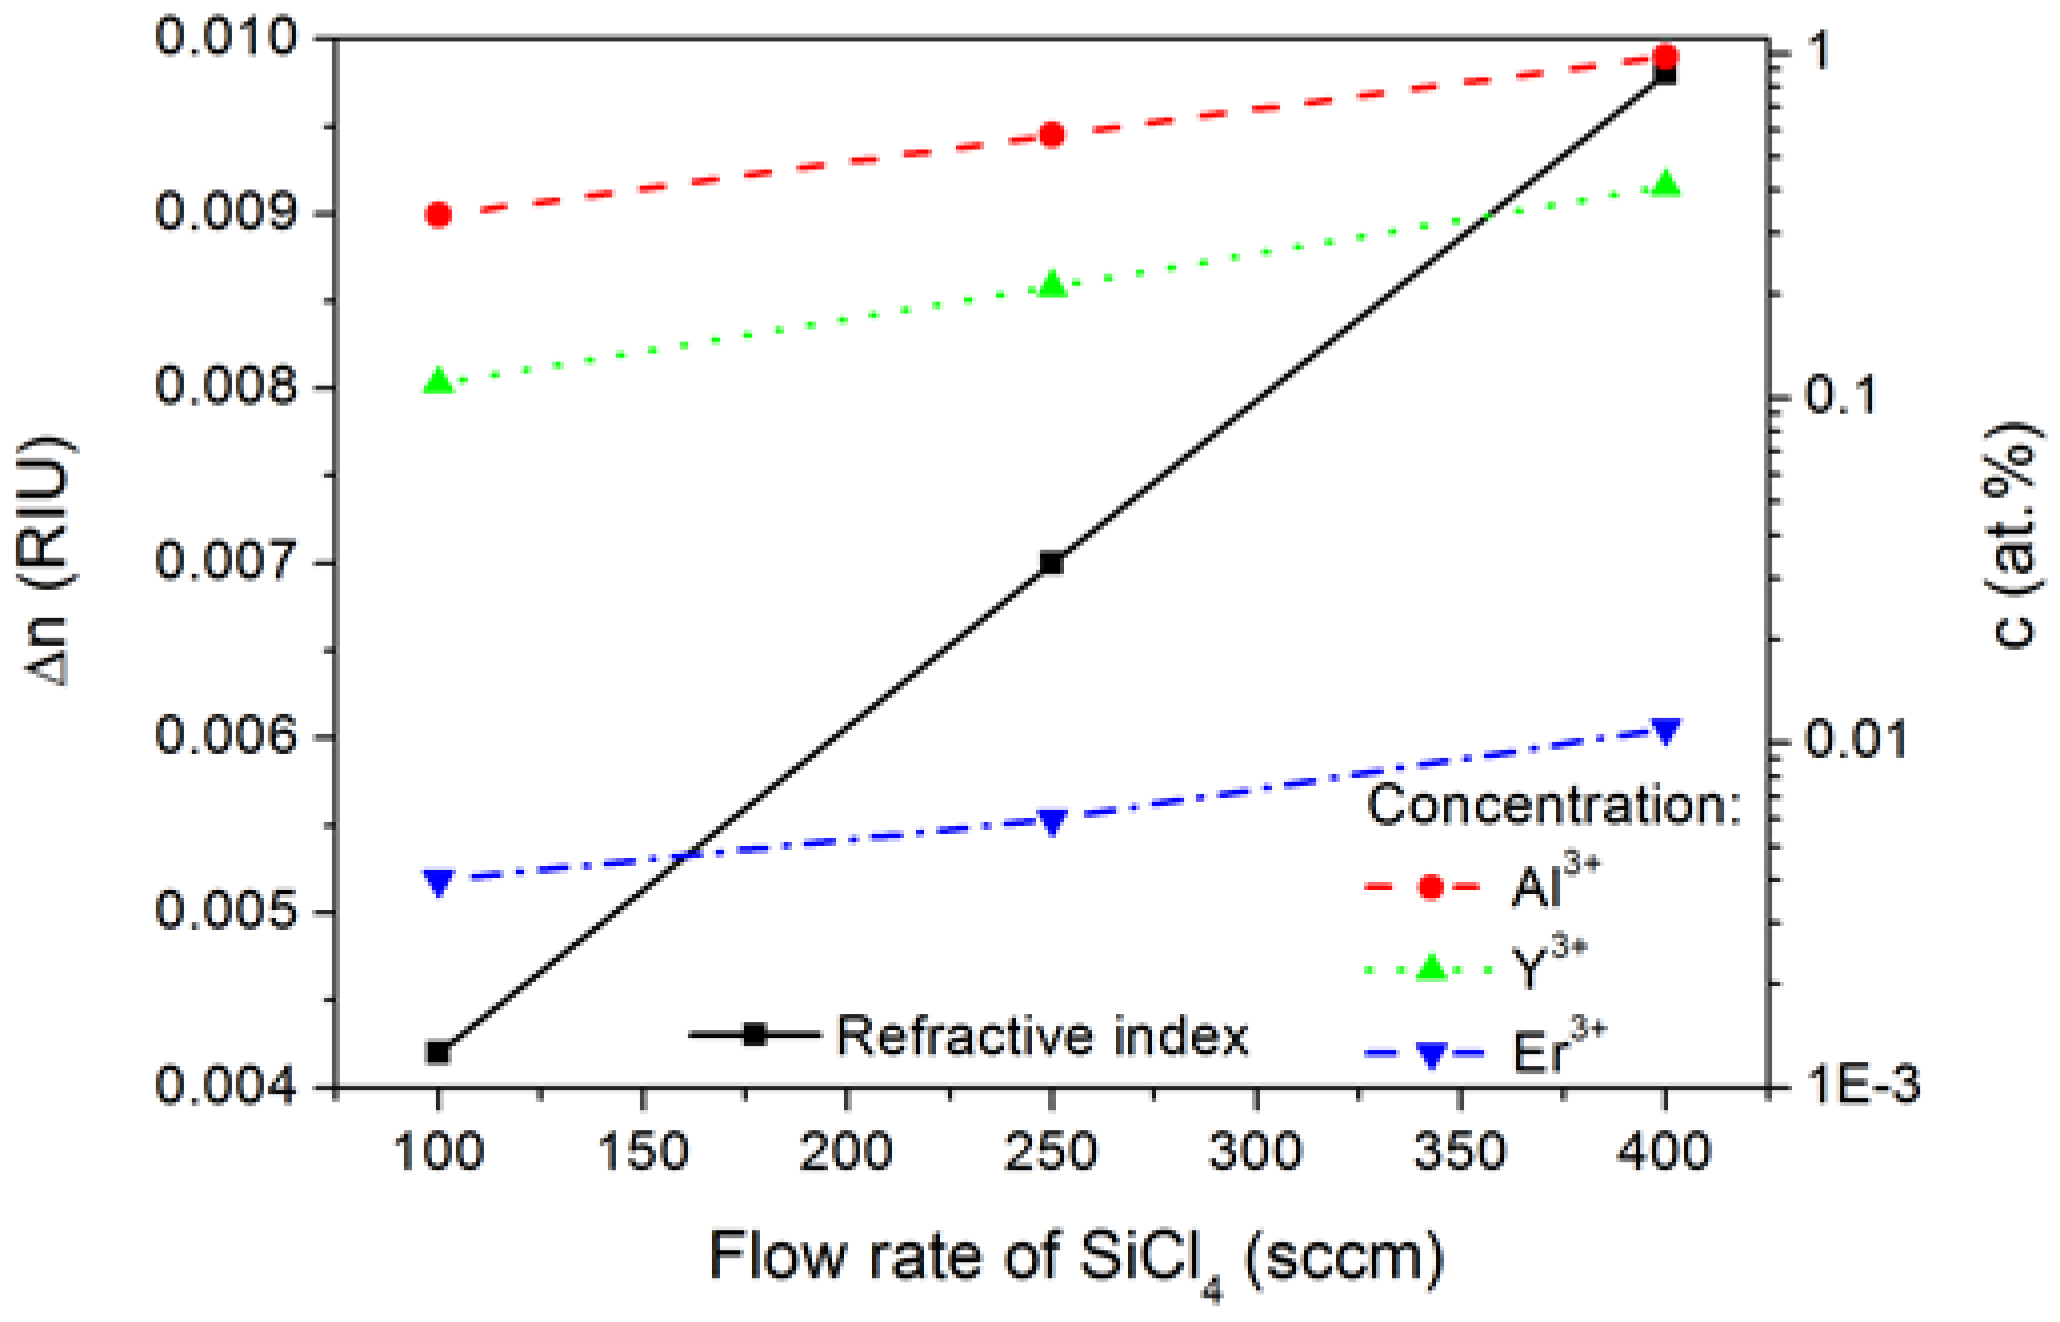
3.2. Characterization of Preforms

The combination of the MCVD technology with nanocrystal doping of YAG nanocrystals resulted into the formation of highly transparent and homogenous preforms. Selected properties of the preforms are summarized in Table 1. Figure 5a shows the effect of the deposition flow rate of SiCl4 on refractive index profiles of the preforms. The refractive index gradually increased with increasing flow rate of SiCl4 reaching a maximal value of 1.466. As can be seen in Figure 5b, for the preform prepared at the flow rate equals to 400 sccm, the dopants were homogeneously distributed in the preform core and the refractive index profile followed the distribution of the dopants. The effect of the flow rate of SiCl4 on the maximal core-cladding refractive index difference and on the maximal concentration of the dopants is demonstrated in Figure 6. The refractive index differences and maximal concentrations of dopants were proportional to the deposition flow rate of SiCl4.
However, the highest concentrations of Y3+ and Al3+ ions achieved were 0.40 and 0.979 at. %, respectively. These concentrations correspond to a ratio of Y3+:Al3+ equal to 3:7.3, which is lower than the expected ratio of 3:5, which corresponds to the stoichiometric formula of YAG, indicating a surplus of Al3+ ions in the preform core attributed to the alumina nanoparticles.

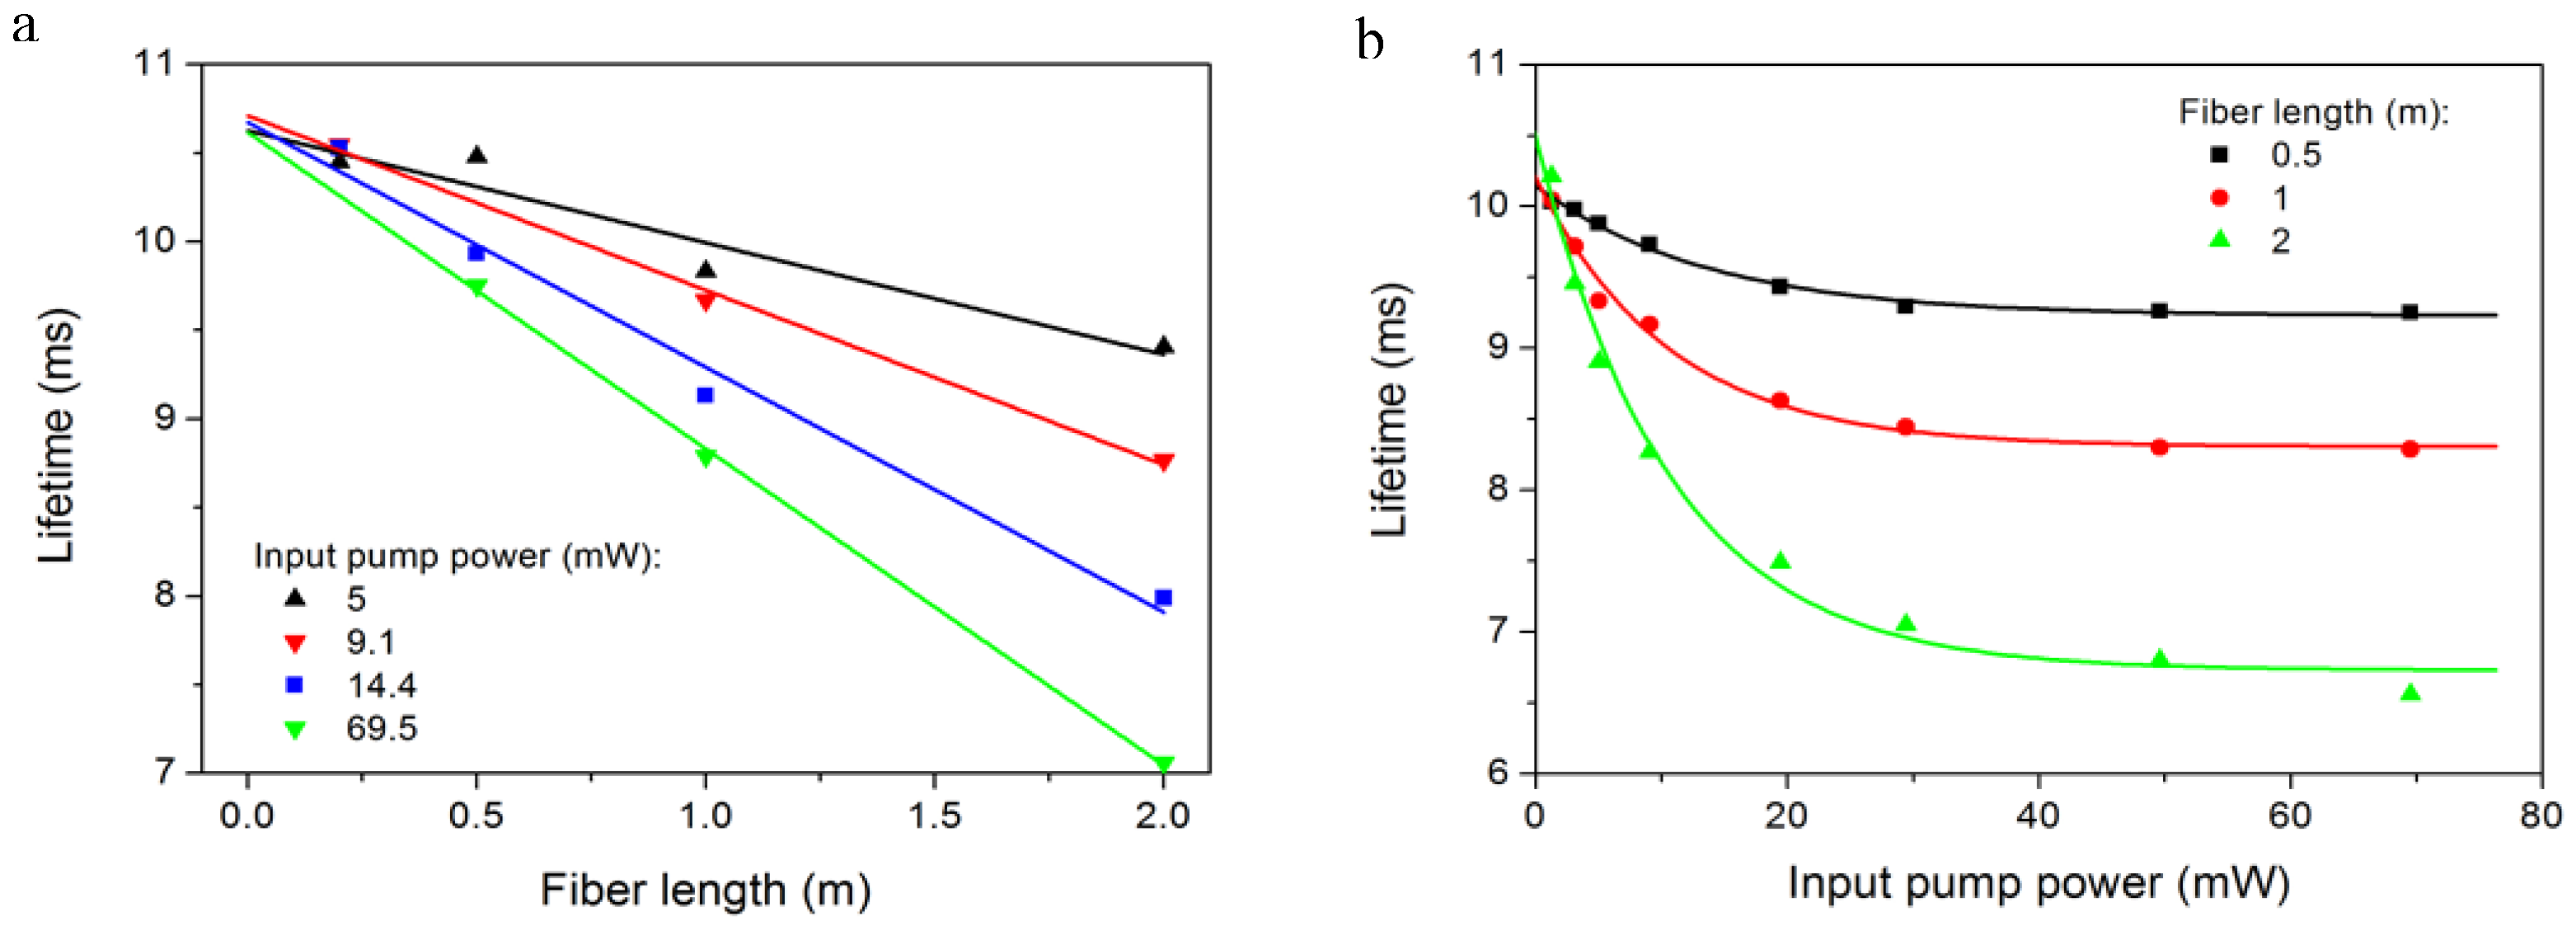
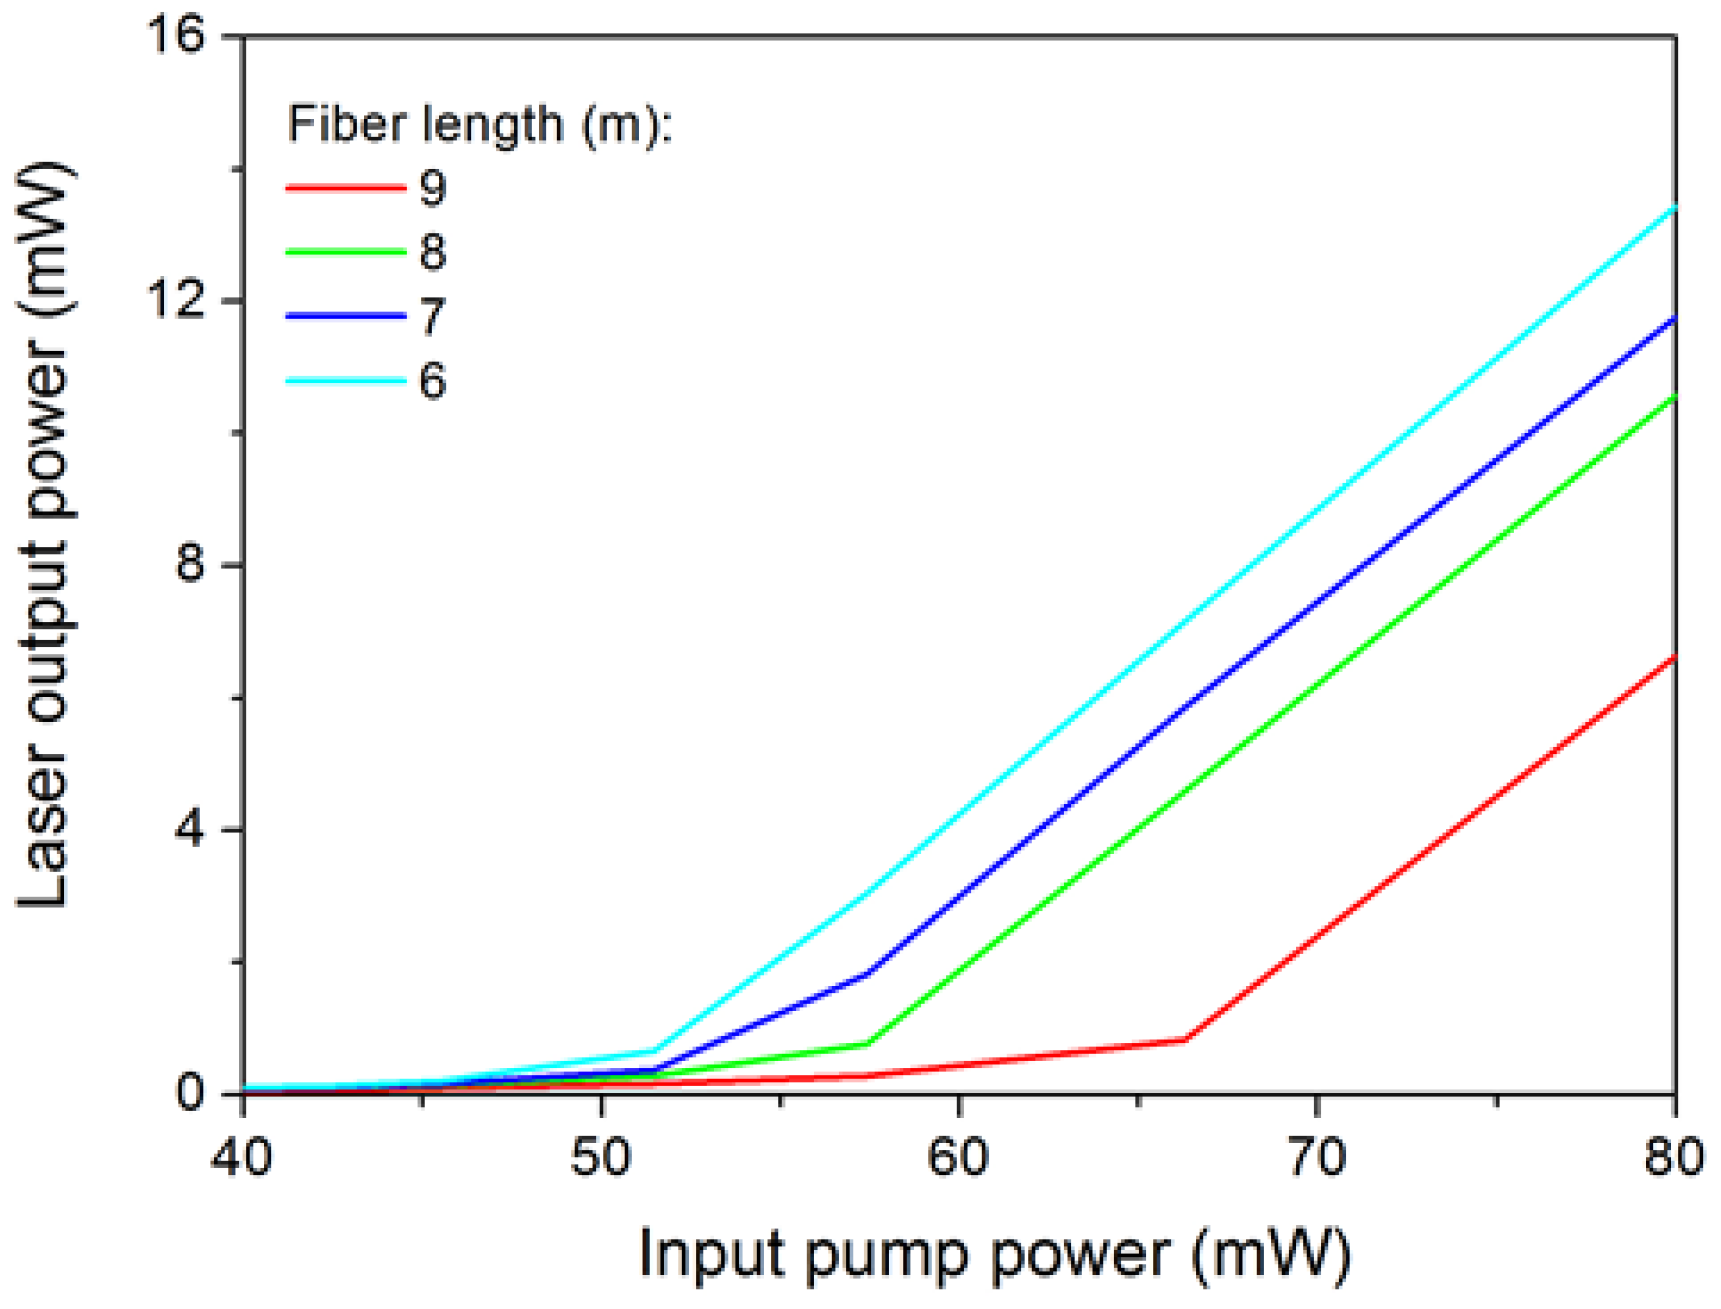
3.3. Characterization of Fibers

Prepared preforms were drawn into optical fibers with outer diameters of 125 ± 2 µm and core diameters of 11 µm. Selected properties of the optical fibers are summarized in Table 1. The fiber numerical apertures were calculated according to Equation (1):
NA = n core 2 n cladding 2
where ncore is the refractive index of the core and ncladding is the refractive index of the silica cladding, which is equal to 1.457. The calculated numerical apertures were proportional to the concentrations of dopants and reached the highest value of 0.162. Cutoff wavelengths of LP11 mode ranged between 1080 and 1175 nm. These results lead to a conclusion that the drawn fibers were single-mode at lasing wavelength. Spectral attenuation of the fiber prepared at the flow rate of SiCl4 equals to 400 sccm is shown in Figure 7. The most important parameters are listed in Table 1. The absorption spectrum exhibited a set of the absorption peaks typical of Er3+ ions. The recorded background losses increased with increasing flow rate of SiCl4 and achieved the maximal values of 0.022 and 0.138 dB·m−1 at 850 and 1310 nm, respectively. The attenuations of fibers at 1310 nm were slightly higher because this spectral region overlaps the absorption peak of free –OH groups. The concentration of OH group was estimated to be ~5 at. ppm.
Although all prepared fibers exhibited wave-guiding properties, the final concentration of Er3+ ions inside the fibers was not sufficient for the luminescence at 1550 nm to be observed, except the fiber prepared at the flow rate of SiCl4 equal to 400 sccm. Therefore, only that fiber was used for the luminescence measurements and in the fiber ring laser. Although low erbium concentration limits the use of the fiber samples to fiber lasers with relatively long-cavity (several meters or more), the low concentration of this sample of about 110 at. ppm Er3+ is beneficial in terms of mitigating energy up-conversion processes that often leads to decrease of the fiber laser efficiency [31]. To eliminate the cross-relaxation and amplified spontaneous emission effects, a technique of extrapolation from various pump powers to the “zero” value of the pump power was used. The extrapolations of the fluorescence lifetime values of the transition 4I13/24I15/2 (at the 1/e level) evaluated for various fiber lengths and pump powers are shown in Figure 8. The values of measured lifetimes regularly decreased for longer fiber length and for higher pump powers. The lifetime value, extrapolated to the “zero” fiber length, was 10.6 ± 0.1 ms. The extrapolation to the “zero” input power resulted to the lifetime 10.586 ± 0.05 ms.
The prepared fiber was tested as a gain medium in a fiber ring laser. This configuration was used in order to eliminate the risk of longitudinal mode instability and self-pulsing [32,33]. The fiber was spliced into the ring laser setup and the dependence of the laser output power-Poutput-on the input pump power-Ppump–was measured. Laser thresholds for particular fiber lengths were calculated as the intercepts of linear fits from the dependence of the laser output power on the input pump power. Laser output characteristics are shown in Figure 9. The laser threshold regularly increased with increasing length of the active fiber. Its lowest value of 48.8 mW was obtained for the fiber length of 4 m. The highest laser threshold of 64.3 mW was obtained for the fiber length of 9 m. The slope efficiency η is a characteristic parameter of the laser that is defined by Equation (2):
η = dP output dP pump
As can be seen in Figure 10, the slope efficiency increased with increasing length of the active fiber. It reached saturation of about 42% for fiber lengths larger than 7 m.

4. Discussion

Final concentrations of the dopants in the fibers depend on the porosity of the silica frit as well as on the nanocrystal size, composition, and affinity toward the silica frit [6]. The silica frit porosity is proportional to the deposition flow rate of SiCl4 [34]. The center of the Gaussian pore size distribution shifts from 100 to 500 nm for flow rates between 100 and 400 sccm. The affinity depends on the nanocrystal composition, solvent, or applied surfactant. The structural methods, XRD and DLS, provided different nanocrystal’s sizes. The exact determination of nanocrystal sizes is a rather complex task limited by the fundamental principles, capabilities and resolutions of analytical methods available. XRD analysis provides information on the size of primary nanocrystals. The primary nanocrystals are usually aggregated into larger clusters. Sizes of these clusters dispersed in a solvent can be measured by dynamic light scattering which provides the information about the behavior of aggregated nanocrystals in the solvent. This measurement is the most important for the deposition because the size of the formed clusters limits their penetration into the silica frit. Comparing the mean nanocrystal’s size of Er:YAG calculated from XRD analysis, i.e., 140 nm, with the effective diameter of the clusters calculated from DLS, i.e., 234 nm, we can estimate that several primary nanocrystals are aggregated together forming larger clusters. The presence of isolated primary nanocrystals or clusters larger than 320 nm were an exception as was reported in Figure 3 and supported by TEM observations in Figure 4. However, none of these method allows us to determine low concentrations of amorphous nanocrystals and therefore direct observation by electron microscopy is necessary. Contrary to expectations, the analysis of the synthetized Er:YAG nanopowder confirmed the presence of two kind of nanoparticles: nanocrystalline Er:YAG and side-formed amorphous aluminum oxide. The concentration of side-formed amorphous aluminum oxide nanoparticles in synthetized Er:YAG was very low and their presence cannot be effectively detected by conventional structural methods, except for TEM. The unexpected presence of aluminum oxide nanoparticles could be attributed to the crystallization kinetics of YAG. It has been found that several processes contribute to the crystallization kinetics of YAG prepared by bottom-up approaches [35] and Y3+ ions are incorporated into YAG matrix prior to the Al3+ ions [35,36]. The crystallization kinetics, that strongly depends on the heating-rate [35], causes formation of a diffusion barrier on the nanocrystal surface which could lead to a formation of unreacted amorphous aluminum oxide nanoparticles in the prepared nanocrystalline powders. The small size and the isoelectric point of aluminum oxide nanoparticles supported their preferential adsorption into the porous silica frit resulting to an increase in the concentration of Al3+ ions in the fibers in comparison with the stoichiometric ratio of YAG nanocrystals. Similar behavior during the crystallization and deposition into the silica frit can also be expected for other ternary nanocrystals.
Optical properties of the fibers significantly depend on the nanocrystal size and frit’s porosity. Attenuation of optical fibers can be divided into intrinsic and extrinsic components [13]. The intrinsic attenuation is given by optical properties of core material, i.e., silica glass. It covers material absorption, chromatic dispersion, scattering phenomena etc. It corresponds to the background losses of optical fibers. Recently prepared telecommunication optical fibers usually reach a theoretical value of 0.4 dB·km−1 [28]. Rare-earth doped optical fibers usually have background losses on the level of 0.05–0.5 dB·m−1 [6,22,37]. The reason can be found in the formation of local fluctuations inside the glass structure which enhance scattering effects. These fluctuations strongly depend on properties of the silica frit including its porosity [34,37]. The Rayleigh scattering on the incorporated nanocrystal contributes to background losses [6]. Optical absorption of dopants and impurities presented in the fibers cause the extrinsic attenuation. Because the MCVD technology, including its nanocrystal-doping modification, provides extremely pure materials, the extrinsic attenuation practically corresponds to the absorption of introduced dopants and free –OH groups remaining in the silica glass matrix. The observed –OH concentration was higher than in the case of conventional solution doping with chlorides salts, has been already reported by doping the solution with LaF3 nanoparticles [38].
From the general point of view Er3+ ions can be distributed inside the original YAG matrix, inside the amorphous or semi-amorphous Al2O3 matrix or inside host silica matrix. The crystallinity and the chemical composition of the individual matrixes can significantly change the splitting of the energy levels of Er3+ ions. Such a splitting should change the pronouncement of the absorption and emission bands and results to the existence of several luminescence decays [39].The observed luminescence lifetimes of the Er:YAG doped fibers exhibited single-exponential character and they were slightly shorter than 10.98 ms, which value was predicted for polycrystalline Er:YAG [40]. Besides an alternative reaction of the nanoparticles with the host silica matrix and its presence in side-formed Al2O3, such a difference can be explained by the nanocrystal size. Smaller nanocrystals have larger specific surface area than the larger ones. The specific surface area is proportional to the concentration of surface defects contributing to the non-radiative energy transitions [12]. Considering a homogenous distribution of Er3+ ions in nanocrystals, the smaller nanocrystals have higher concentration of Er3+ ions at the nanocrystal’s surface than the larger ones. Consequently, the nanocrystal size is inversely proportional to the quantum yield of the luminescence. It should be pointed out that the requirements imposed on nanocrystals in terms of fiber attenuation and luminescence properties are mutually contradictory. Smaller nanocrystals can reduce the Rayleigh scattering and thus the fiber attenuation. However, smaller nanocrystals can exhibit shorter luminescence lifetime. Considering the optimal performance of the fiber ring laser, the requirements are predominantly placed on high slope efficiency, low threshold power and short lengths of the employed fibers. These complex requirements were fulfilled for the fiber length of 7 m, which can be regarded as optimal.
Despite the novel composition of the incorporated nanocrystals the results do not significantly differ from those achieved with fibers doped with now widely used aluminum oxide nanocrystals. More than a decade of intense research in the world-leading laboratories has led to the preparation of aluminum oxide nanocrystals doped fibers exhibiting lifetimes ranging from 10.3 to 11.8 ms [6,20] and laser slope efficiency ranging from 8% to 75%. It should be pointed out that the reported results were achieved for a monolithic Fabry-Perot fiber laser setup, the slope efficiency of which is usually higher. However, the application of YAG nanocrystals opens new horizons for further tailoring laser parameters. Lower background losses and higher concentrations of dopants can be achieved by the incorporation of smaller and more uniform Er:YAG nanocrystals which could penetrate even in very small pores of the frit. Moreover, the Er3+ ions incorporated inside the YAG matrix can be during the synthesis simply replaced by another rare-earth element allowing us to shift or extend the operating wavelength range of the laser.

5. Conclusions

Active optical fibers were prepared by incorporating of Er-doped yttrium aluminum garnet nanocrystals into the porous silica frits. We studied the effect of the nanocrystal size and frit’s porosity on the final structural and optical properties of the prepared preforms and optical fibers. Active single-mode erbium-doped fibers were prepared by the presented approach. Fiber prepared at the deposition flow rate of SiCl4 equal to 400 sccm showed luminescence properties typical of trivalent erbium ions distributed inside the nanocrystalline lattice of yttrium aluminum garnet. The lifetime of the 4I13/24I15/2 transition was 10.6 ± 0.1 ms. Lasing properties of prepared fiber were demonstrated in a ring laser setup. Optimal laser properties were obtained for a fiber length of 7 m. The corresponding laser threshold was 53.4 mW. The slope efficiency of the fiber-laser was about 42%. The presented approach can be simply extended to the deposition of other ceramic nanomaterials and other rare-earth elements.

Author Contributions

Conceptualization, J.M. and P.P.; Investigation, W.B., I.K., O.P., V.G., V.P., V.Č., L.P., J.A., J.C.; Writing-Original Draft Preparation, J.M., W.B.; Writing-Review & Editing, J.M.

Funding

This work was jointly supported by the European Action COST MP1401 “Advanced Fibre Laser and Coherent Source as Tools for Society, Manufacturing and Lifescience”, the Ministry of Education Youth and Sports of the Czech Republic (LD15122), the Czech Science Foundation (GA17-06479S), European Operational Program NanoCEXmat II (ITMS 26220120035) in Slovakia, and Centre National de la Recherche Scientifique (CNRS), France.

Conflicts of Interest

The authors declare no conflict of interest. The founding sponsors had no role in the design of the study; in the collection, analyses, or interpretation of data; in the writing of the manuscript, and in the decision to publish the results”.

References

  1. Harun, S.W.; Dimyati, K.; Jayapalan, K.K.; Ahmad, H. An overview on s-band erbium-doped fiber amplifiers. Laser Phys. Lett. 2007, 4, 10–15. [Google Scholar] [CrossRef]
  2. Richardson, D.J.; Nilsson, J.; Clarkson, W.A. High power fiber lasers: Current status and future perspectives. J. Opt. Soc. Am. B 2010, 27, B63–B92. [Google Scholar] [CrossRef]
  3. Fermann, M.E.; Hartl, I. Ultrafast fiber laser technology. IEEE J. Sel. Top. Quantum Electron. 2009, 15, 191–206. [Google Scholar] [CrossRef]
  4. Bauerle, D. Laser processing and chemistry: Recent developments. Appl. Surf. Sci. 2002, 186, 1–6. [Google Scholar] [CrossRef]
  5. Ye, C.G.; Petit, L.; Koponen, J.J.; Hu, I.N.; Galvanauskas, A. Short-term and long-term stability in ytterbium-doped high-power fiber lasers and amplifiers. IEEE J. Sel. Top. Quantum Electron. 2014, 20, 188–199. [Google Scholar]
  6. Kasik, I.; Peterka, P.; Mrazek, J.; Honzatko, P. Silica optical fibers doped with nanoparticles for fiber lasers and broadband sources. Curr. Nanosci. 2016, 12, 277–290. [Google Scholar] [CrossRef]
  7. Ballato, J.; Ebendorff-Heidepriem, H.; Zhao, J.B.; Petit, L.; Troles, J. Glass and process development for the next generation of optical fibers: A review. Fibers 2017, 5. [Google Scholar] [CrossRef]
  8. Tick, P.A. Are low-loss glass-ceramic optical waveguides possible? Opt. Lett. 1998, 23, 1904–1905. [Google Scholar] [CrossRef] [PubMed]
  9. Yoo, S.; Paek, U.C.; Han, W.T. Development of a glass optical fiber containing ZnO-Al2O3-SiO2 glass-ceramics doped with Co2+ and its optical absorption characteristics. J. Non-Cryst. Solids 2003, 315, 180–186. [Google Scholar] [CrossRef]
  10. Tick, P.A.; Borrelli, N.F.; Reaney, I.M. The relationship between structure and transparency in glass-ceramic materials. Opt. Mater. 2000, 15, 81–91. [Google Scholar] [CrossRef]
  11. Ainslie, B.J.; Craig, S.P.; Davey, S.T.; Wakefield, B. The fabrication, assessment and optical-properties of high-concentration Nd-3+-doped and Er-3+-doped silica-based fibers. Mater. Lett. 1988, 6, 139–144. [Google Scholar] [CrossRef]
  12. Mrazek, J.; Surynek, M.; Bakardjieva, S.; Bursik, J.; Probostova, J.; Kasik, I. Luminescence properties of nanocrystalline europium titanate Eu2Ti2O7. J. Alloys Compd. 2015, 645, 57–63. [Google Scholar] [CrossRef]
  13. Senior, J.M. Optical Fiber Communications: Principles and Practice, 2nd ed.; Parker, S., Ed.; Prentice Hall International (UK) Ltd.: London, UK, 1992; p. 922. [Google Scholar]
  14. Peterka, P.; Kasik, I.; Kubecek, V.; Matejec, V.; Hayer, M.; Honzatko, P.; Zavadilova, A.; Dvoracek, P. Optimization of erbium-ytterbium fibre laser with simple double-clad structure—Art. No. 618010. In Photonics, Devices and System III; Tomanek, P., Hrabovsky, M., Miler, M., Senderakova, D., Eds.; SPIE: New York, NY, USA, 2006; Volume 6180, p. 18010. [Google Scholar]
  15. Podrazky, O.; Kasik, I.; Pospisilova, M.; Matejec, V.; IEEE. Use of alumina nanoparticles for preparation of erbium-doped fibers. In Proceedings of the 20th Annual Meeting of the IEEE Lasers and Electro-Optics Society (LEOS 2007), Lake Buena Vista, FL, USA, 21–25 October 2007; pp. 246–247. [Google Scholar]
  16. Blanc, W.; Dussardier, B.; Monnom, G.; Peretti, R.; Jurdyc, A.M.; Jacquier, B.; Foret, M.; Roberts, A. Erbium emission properties in nanostructured fibers. Appl. Opt. 2009, 48, G119–G124. [Google Scholar] [CrossRef] [PubMed]
  17. Dhar, A.; Das, S.; Maiti, H.S.; Sen, R. Fabrication of high aluminium containing rare-earth doped fiber without core-clad interface defects. Opt. Commun. 2010, 283, 2344–2349. [Google Scholar] [CrossRef]
  18. Pastouret, A.; Gonnet, C.; Collet, C.; Cavani, O.; Burow, E.; Chaneac, C.; Carton, A.; Jolivet, J.P. Nanoparticle doping process for improved fibre amplifiers and lasers. In Fiber Lasers VI: Technology, Systems, and Applications; Gapontsev, D.V., Kliner, D.A., Dawson, J.W., Tankala, K., Eds.; SPIE: New York, NY, USA, 2009; Volume 7195. [Google Scholar]
  19. Pastouret, A.; Burov, E.; Boivin, D.; Collet, C.; Cavani, O. Amplifying Optical Fiber and Method of Manufacturing. U.S. Patent 8, 259,389, 4 September 2012. [Google Scholar]
  20. Baker, C.C.; Friebele, E.J.; Burdett, A.A.; Rhonehouse, D.L.; Fontana, J.; Kim, W.; Bowman, S.R.; Shaw, L.B.; Sanghera, J.; Zhang, J.; et al. Nanoparticle doping for high power fiber lasers at eye-safer wavelengths. Opt. Express 2017, 25, 13903–13915. [Google Scholar] [CrossRef] [PubMed]
  21. Dhar, A.; Kasik, I.; Podrazky, O.; Matejec, V.; Dussardier, B. Preparation and properties of Er-doped ZrO2 nanocrystalline phase-separated preforms of optical fibers by MCVD process. Int. J. Appl. Ceramic. Tec 2012, 9, 341–348. [Google Scholar] [CrossRef] [Green Version]
  22. Paul, M.C.; Bysakh, S.; Das, S.; Dhar, A.; Pal, M.; Bhadra, S.K.; Sahu, J.K.; Kir’yanov, A.V.; d’Acapito, F. Recent developments in rare-earths doped nano-engineered glass based optical fibers for high power fiber lasers. Trans. Indian Ceram. Soc. 2016, 75, 195–208. [Google Scholar] [CrossRef]
  23. Blanc, W.; Mauroy, V.; Nguyen, L.; Bhaktha, B.N.S.; Sebbah, P.; Pal, B.P.; Dussardier, B. Fabrication of rare earth-doped transparent glass ceramic optical fibers by modified chemical vapor deposition. J. Am. Ceram. Soc. 2011, 94, 2315–2318. [Google Scholar] [CrossRef]
  24. Dorosz, D.; Zmojda, J.; Kochanowicz, M. Investigation on broadband near-infrared emission in yb3+/ho3+ co-doped antimony-silicate glass and optical fiber. Opt. Mater. 2013, 35, 2577–2580. [Google Scholar] [CrossRef]
  25. Samson, B.N.; Pinckney, L.R.; Wang, J.; Beall, G.H.; Borrelli, N.F. Nickel-doped nanocrystalline glass-ceramic fiber. Opt. Lett. 2002, 27, 1309–1311. [Google Scholar] [CrossRef] [PubMed]
  26. Koponen, J.J.; Petit, L.; Kokki, T.; Aallos, V.; Paul, J.; Ihalainen, H. Progress in direct nanoparticle deposition for the development of the next generation fiber lasers. Opt. Eng. 2011, 50. [Google Scholar] [CrossRef]
  27. Cuba, V.; Indrei, J.; Mucka, V.; Nikl, M.; Beitlerova, A.; Pospisil, M.; Jakubec, I. Radiation induced synthesis of powder yttrium aluminium garnet. Radiat. Phys. Chem. 2011, 80, 957–962. [Google Scholar] [CrossRef]
  28. Poole, S.B.; Payne, D.; Mears, R.J.; Fermann, M.E.; Laming, R. Fabrication and characterization of low-loss optical fibers containing rare-earth ions. J. Lightwave Technol. 1986, 4, 870–876. [Google Scholar] [CrossRef]
  29. Kasik, I.; Podrazky, O.; Mrazek, J.; Cajzl, J.; Aubrecht, J.; Probostova, J.; Peterka, P.; Honzatko, P.; Dhar, A. Erbium and al2o3 nanocrystals-doped silica optical fibers. Bull. Pol. Acad. Sci. Tech. Sci. 2014, 62, 641–646. [Google Scholar] [CrossRef]
  30. Karasek, M.; Kanka, J. Numerical analysis of Yb3+-sensitised, Er3+-doped, fibre-ring laser. IEEE Proc. Optoelectron. 1998, 145, 133–137. [Google Scholar] [CrossRef]
  31. Nykolak, G.; Becker, P.C.; Shmulovich, J.; Wong, Y.H.; Digiovanni, D.J.; Bruce, A.J. Concentration-dependent-i-4(13/2) lifetimes in Er3+-doped fibers and Er3+-doped planar wave-guides. IEEE Photonics Technol. Lett. 1993, 5, 1014–1016. [Google Scholar] [CrossRef]
  32. Peterka, P.; Koska, P.; Ctyroky, J. Reflectivity of superimposed bragg gratings induced by longitudinal mode instabilities in fiber lasers. IEEE J. Sel. Top. Quantum Electron. 2018, 24. [Google Scholar] [CrossRef]
  33. Aubrecht, J.; Peterka, P.; Koska, P.; Podrazky, O.; Todorov, F.; Honzatko, P.; Kasik, I. Self-swept holmium fiber laser near 2100 nm. Opt. Express 2017, 25, 4120–4125. [Google Scholar] [CrossRef] [PubMed]
  34. Dhar, A.; Paul, M.C.; Pal, M.; Mondal, A.K.; Sen, S.; Maiti, H.S.; Sen, R. Characterization of porous core layer for controlling rare earth incorporation in optical fiber. Opt. Express 2006, 14, 9006–9015. [Google Scholar] [CrossRef] [PubMed]
  35. Chovanec, J.; Svoboda, R.; Kraxner, J.; Cerna, A.; Galusek, D. Crystallization kinetics of the Y3Al5O12 glass. J. Alloys Compd. 2017, 725, 792–799. [Google Scholar] [CrossRef]
  36. Prnova, A.; Klement, R.; Bodisova, K.; Valuchova, J.; Galusek, D.; Bruneel, E.; Van Driessche, I. Thermal behaviour of yttrium aluminate glasses studied by dsc, high-temperature x-ray diffraction, sem and sem-eds. J. Therm. Anal. Calorim. 2017, 128, 1407–1415. [Google Scholar] [CrossRef]
  37. Dhar, A.; Pal, A.; Paul, M.C.; Ray, P.; Maiti, H.S.; Sen, R. The mechanism of rare earth incorporation in solution doping process. Opt. Express 2008, 16, 12835–12846. [Google Scholar] [CrossRef] [PubMed]
  38. Vermillac, M.; Fneich, H.; Lupi, J.F.; Tissot, J.B.; Kucera, C.; Vennegues, P.; Mehdi, A.; Neuville, D.R.; Ballato, J.; Blanc, W. Use of thulium-doped laf3 nanoparticles to lower the phonon energy of the thulium’s environment in silica-based optical fibres. Opt. Mater. 2017, 68, 24–28. [Google Scholar] [CrossRef]
  39. Agazzi, L.; Worhoff, K.; Pollnau, M. Energy-transfer-upconversion models, their applicability and breakdown in the presence of spectroscopically distinct ion classes: A case study in amorphous Al2O3:Er3+. J. Phys. Chem. C 2013, 117, 6759–6776. [Google Scholar] [CrossRef]
  40. Gruber, J.B.; Nijjar, A.S.; Sardar, D.K.; Yow, R.M.; Russell, C.C.; Allik, T.H.; Zandi, B. Spectral analysis and energy-level structure of Er3+(4f(11)) in polycrystalline ceramic garnet Y3Al5O12. J. Appl. Phys. 2005, 97. [Google Scholar] [CrossRef]
Figure 1. (a) Setup of the time-resolved luminescence measurement and (b) fiber ring laser setup.
Applsci 08 00833 g001
Figure 2. XRD pattern of YAG nanocrystals with denoted (hkl) indices.
Applsci 08 00833 g002
Figure 3. Size distribution of YAG nanoparticles recorded by dynamic light scattering.
Applsci 08 00833 g003
Figure 4. TEM visualization of YAG nanoparticles. (a,b) Overall view. (c) Diffraction pattern recorded on one of aggregated nanocrystals. (d) Diffraction pattern recorded on nanoparticles smaller than 10 nm.
Applsci 08 00833 g004
Figure 5. (a) The effect of the deposition flow rate of SiCl4 on the refractive index profiles of the preforms. (b) Refractive index profile (left scale) and the corresponding concentration profile of dopants (right scale) of the preform prepared flow rate of SiCl4 equal to 400 sccm.
Applsci 08 00833 g005
Figure 6. The effect of the deposition flow rate of SiCl4 on the maximal core-cladding refractive index difference (left scale) and on the maximal concentration of the dopants (right logarithmic scale).
Applsci 08 00833 g006
Figure 7. Absorption spectrum of the fiber prepared at flow rate of SiCl4 equal to 400 sccm.
Applsci 08 00833 g007
Figure 8. The fluorescence lifetime values of 4I13/24I15/2 transition recorded for various (a) fiber lengths and (b) input pump powers.
Applsci 08 00833 g008
Figure 9. Power conversion in fiber-laser setup recorded for different active fiber lengths.
Applsci 08 00833 g009
Figure 10. Slope efficiency of the fiber laser for different lengths of active fiber.
Applsci 08 00833 g010
Table 1. Selected parameters of the preforms and optical fibers.
Sample #123
Deposition flow rate of SiCl4 (sccm)100250400
Maximal core-cladding Δn0.00420.00660.0090
Maximal concentration Al3+ (at. %)0.3390.5780.979
Maximal concentration Y3+ (at. %)0.1100.2100.410
Maximal concentration Er3+ (at. %)0.0040.0060.011
Numerical aperture0.1110.1390.162
Attenuation coefficient at 850 nm (dB·m−1)0.0150.0180.022
Attenuation coefficient at 980 nm (dB·m−1)0.2100.6201.540
Attenuation coefficient at 1310 nm (dB·m−1)0.0270.0750.138
Cutoff wavelength of LP11 mode (nm)108011401175

