1. Introduction
The most recent European statistics on road accidents show that, despite an overall reduction in the number of incidents over the long term (2001–2016) being achieved, further actions and initiatives are needed to increase road safety. In fact, according to the World Health Organization (WHO), road accidents determine annually more than 1.2 million deaths worldwide [
1], and 3283 in Italy [
2]. Additionally, they are the main cause of death for young people aged between 15 and 29. The United Nations (UN) General Assembly, in 2010, established the Decade of Action for Road Safety (2011–2020), with the goal of halving the number of deaths on roads by 2020, compared to the 2011 records. From the data analysis on accidents, it is possible to appreciate how, currently, the trend of reduction in the number of victims of accidents, even if relevant, is not sufficient to achieve the mentioned goal [
1,
2,
3].
From the engineering perspective, two kinds of analysis are usually performed to understand, and therefore, limit the phenomenon of accidents: preventive analysis according to road safety review (RSR) techniques, i.e., the identification of problems concerning the safety of a road infrastructure before the occurrence of an accidental event, and the analysis of historical data on accidents, based on the collection and subsequent processing of accident-related data detected by the different collectors [
3]. The two kinds of analysis mentioned, and particularly the analysis of historical data on accidents, are often affected by the following limitations:
Unavailability or lack of accuracy of information about the location of accidents. Both the localization and the repetitiveness of accidents in a site are essential elements for the execution of accurate safety analysis;
Unavailability of data related to car accidents that did not require the intervention of law enforcement agencies or collectors;
Limited consideration of the human factor in the analyses.
This last element is particularly significant, since, although the dynamics of road accidents are the result of a complex interaction between the vehicle, the driver, and the external environment, the responsibility for the accident is, in most cases, attributable to the driver’s behavior. Considering the Italian national context, the data collected by the Italian National Institute for Statistics (ISTAT), updated in 2016, show that the circumstances underlying road accidents with injuries to people are mainly due to distracted driving (19.6% of total accidents on extra-urban roads), followed by failure to comply with safety rules (17.4% of the total considering only urban roads), and by right of way and high speed (15.3% of accidents on extra-urban roads) [
2]. Thus, the recorded increase in the safety of vehicles and infrastructures must necessarily be associated with interventions and measures able to determine positive impacts on the driver’s behavior.
To effectively direct the interventions in this context, it is useful to increase the knowledge and understanding of the driver during the driving activity, investigating also their emotional states. Studies and researches about this subject were conducted in various fields and disciplines. The complexity related to these studies lies in the component of subjectivity associated with emotional states. For example, considering stress, it can be observed that, typically, the reaction of the human body to a stressful situation can be identified with an increase in heartbeat, muscle tension, blood pressure, and sweating [
4,
5,
6]. However, the factors and elements that can determine the onset of a state of stress, and its related “degree” of stress, can vary widely depending on each individual subject and, for the same subject, depending on many internal variables (such as stress collected during the day, emotional factors, or moods).
Trying to assess the psychophysical state of a person as objectively as possible, methods evolved from simple questionnaires to a direct evaluation of parameters, allowed by new and smarter technological possibilities. In the analyses performed within this study, the physiological signals taken into consideration, according to the literature review, were heartbeat (in particular, heart rate variability (HRV) and some of its components), skin conductivity (galvanic skin response (GSR)), and respiratory rate (RR) [
7,
8,
9,
10,
11,
12,
13,
14,
15,
16,
17,
18,
19,
20,
21]. These parameters and their functionality are described together with the method.
The research described in this paper is oriented to the study of the psychophysical state of the user driving a car, investigating conditions of particular stress, and contrarily, of considerable relaxation as possible causes of distraction, to increase the knowledge of these conditions during driving activities, and to provide elements of possible support for preventive accidental analysis.
The main objectives can be summarized with the following three points:
Definition of a method for the identification of stressful/relaxing points for the driver;
Validation of the method through the development and testing of an experimental protocol;
Identification of possible correlations between stressful/relaxing points and black spots, identified through accidental analysis.
It should be underlined that investigation of the driver’s psychophysical state was performed in several previous studies [
22,
23,
24,
25,
26,
27,
28,
29,
30,
31]. The added value of this paper is an investigation into how this aspect influences driving activity, in particular, the probability that high levels of stress or relaxation could impact on-road safety issues, supporting a preventive approach for road safety analysis. Among all the remarkable elements, it must be taken into account that dynamic tests with wearable and comfortable tools were carried out in the real world, while, in other methodologies, the tests were mainly performed in protected environments or with driving simulators.
2. Materials and Methods
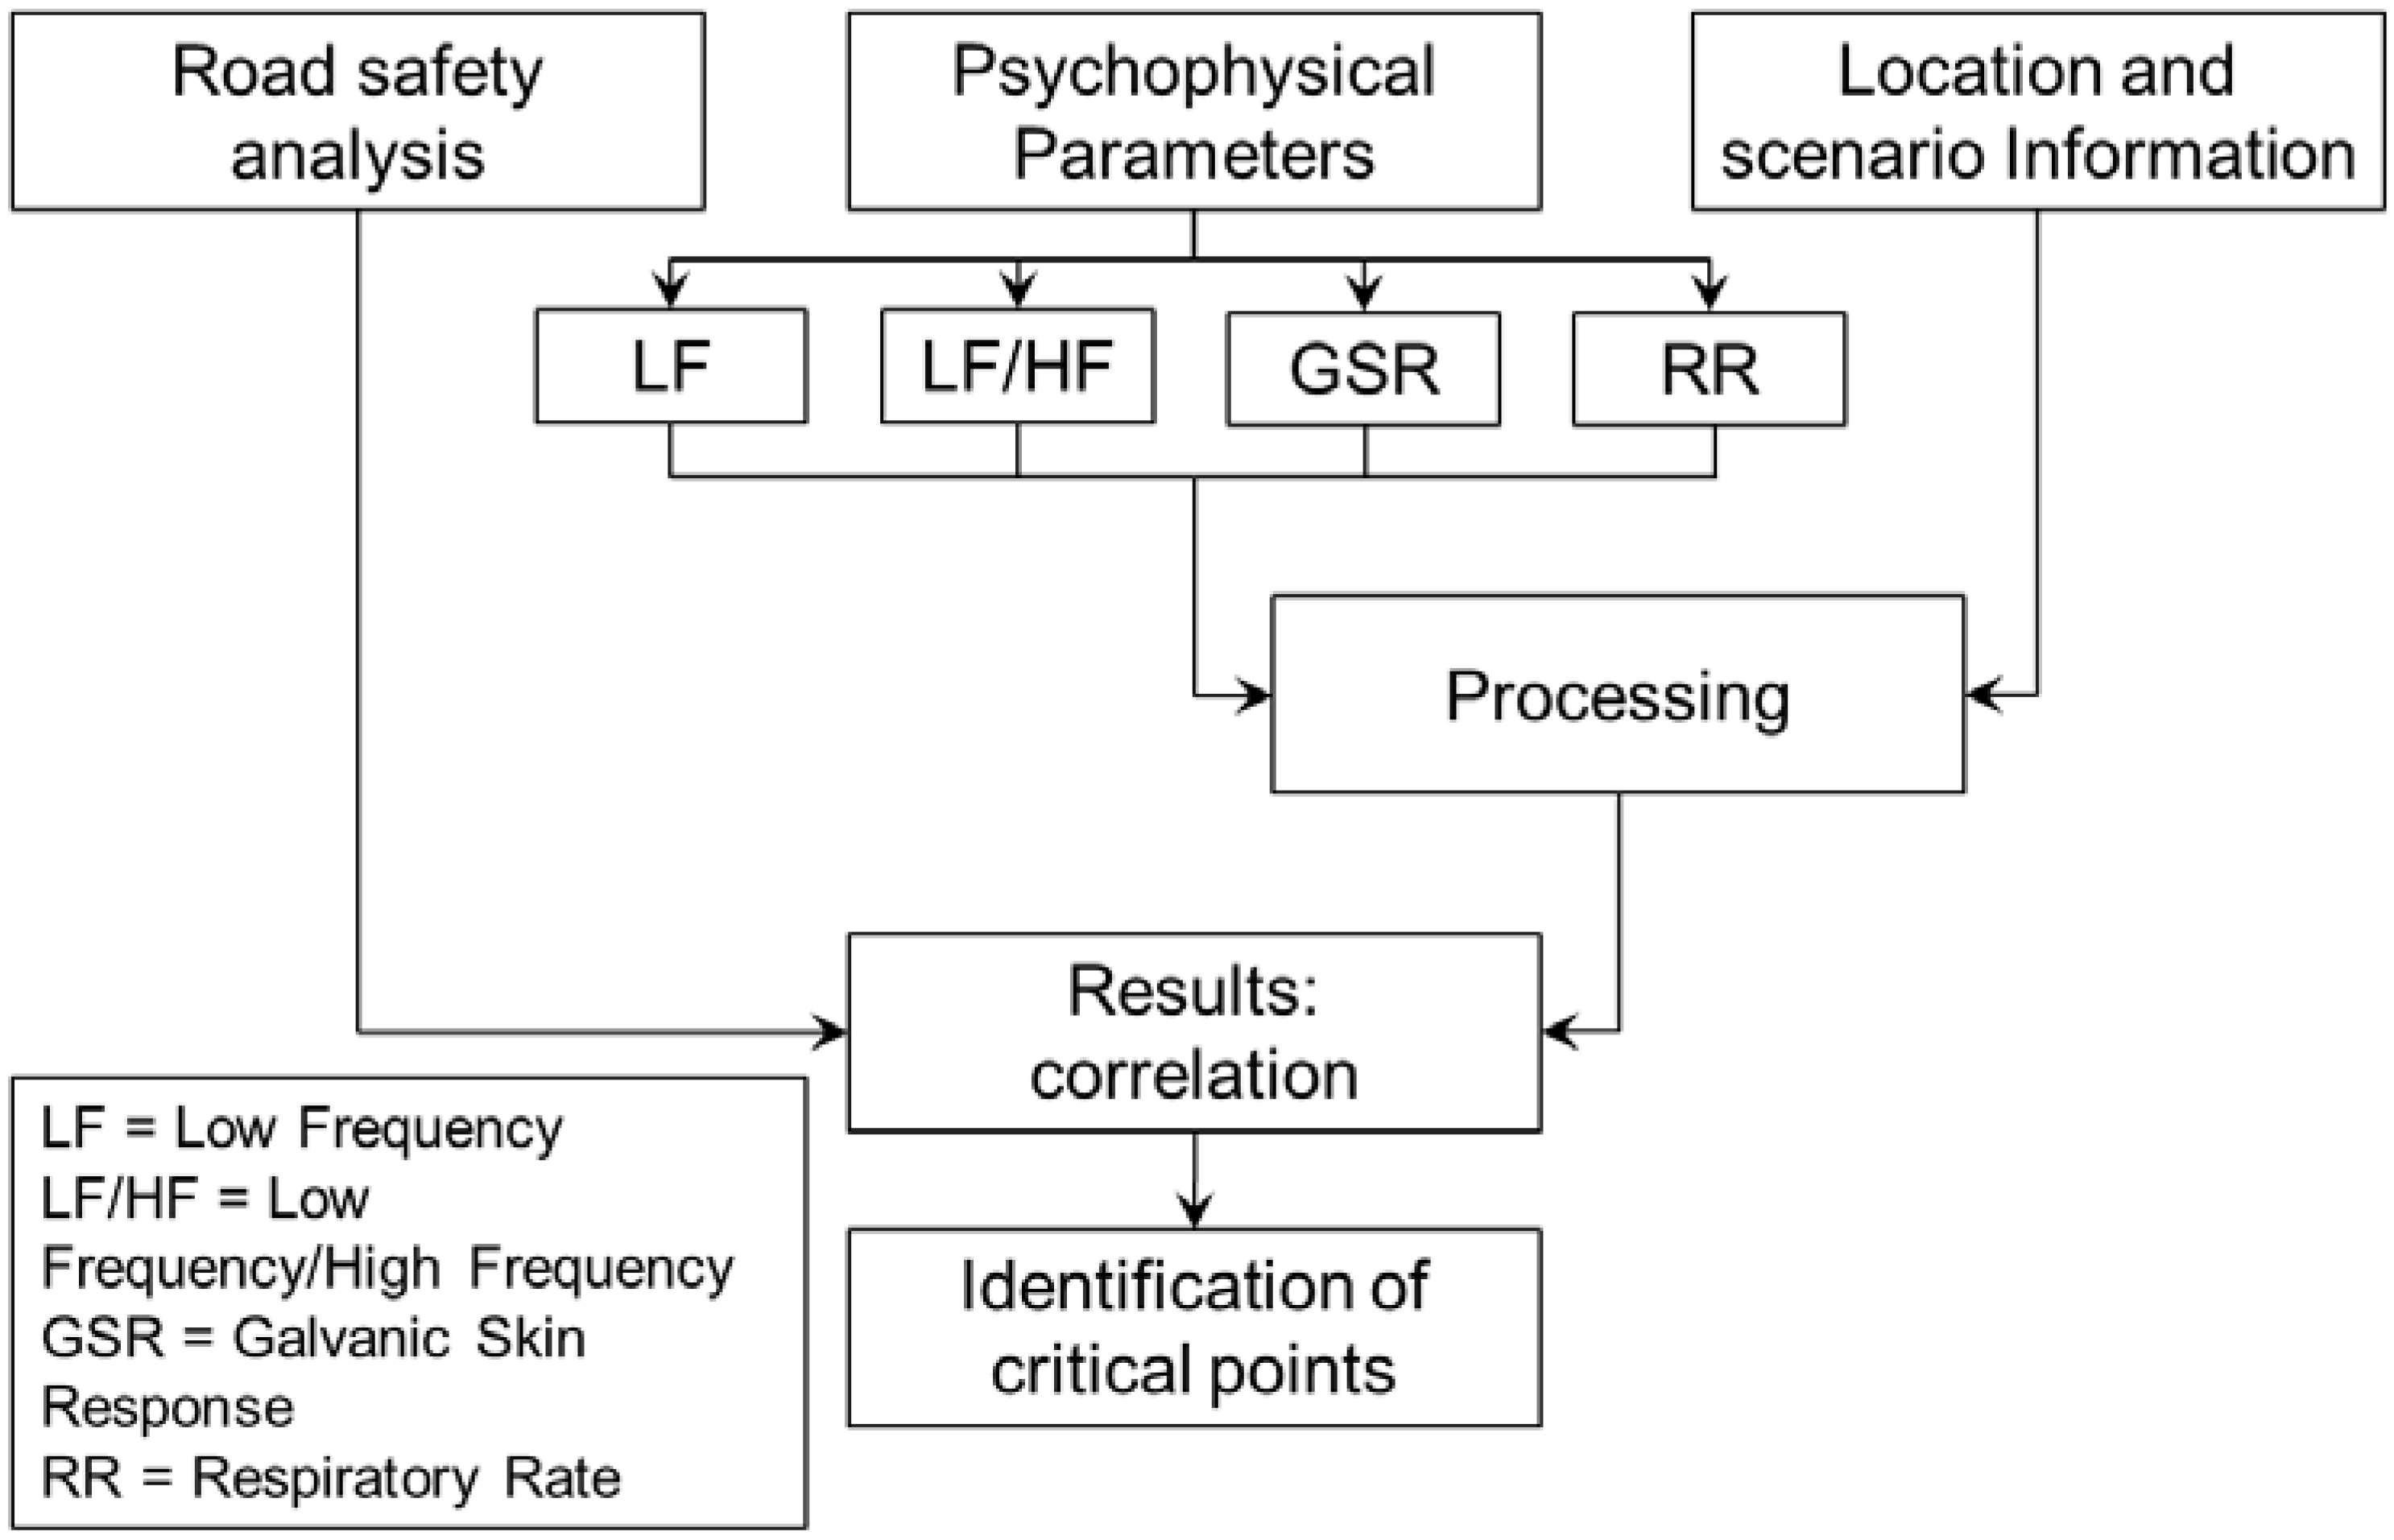
From the methodological point of view, the approach adopted in this study can be summarized by the diagram reported in
Figure 1.
As reported, three main inputs were required, and they are presented and described in the upcoming sections. These inputs are as follows:
2.1. Parameters Related to the Psychophysical State of the Driver
Within the first set of experiments, to gather information about the psychophysical state, and particularly, to investigate the stressful situations of a user driving their vehicle, the physiological parameters of heart rate variability (HRV), respiratory rate (RR), and galvanic skin response (GSR) were selected.
Heart rate variability (HRV) is the natural variability of the heartbeat, thus representing the change in heart rate as a consequence of emotional factors, including stress. It can be divided into three frequency bands: very low frequency (VLF; between 0.01 and 0.04 Hz), low frequency (LF; between 0.04 and 0.15 Hz), and high frequency (HF; between 0.15 and 0.4 Hz). For the purposes of the first test phase, the component considered as most significant was LF, since several studies indicated it as a parameter closely related to the stress state of a person [
12,
13].
Respiratory rate (RR) represents the number of breaths performed by a subject in one minute. In the case of abnormal conditions, particular moods, or physical states, an increase in respiratory rate may be recorded [
20]. Typically, while a subject is in rest condition, the value of this parameter is around 12–20 breaths per minute [
21].
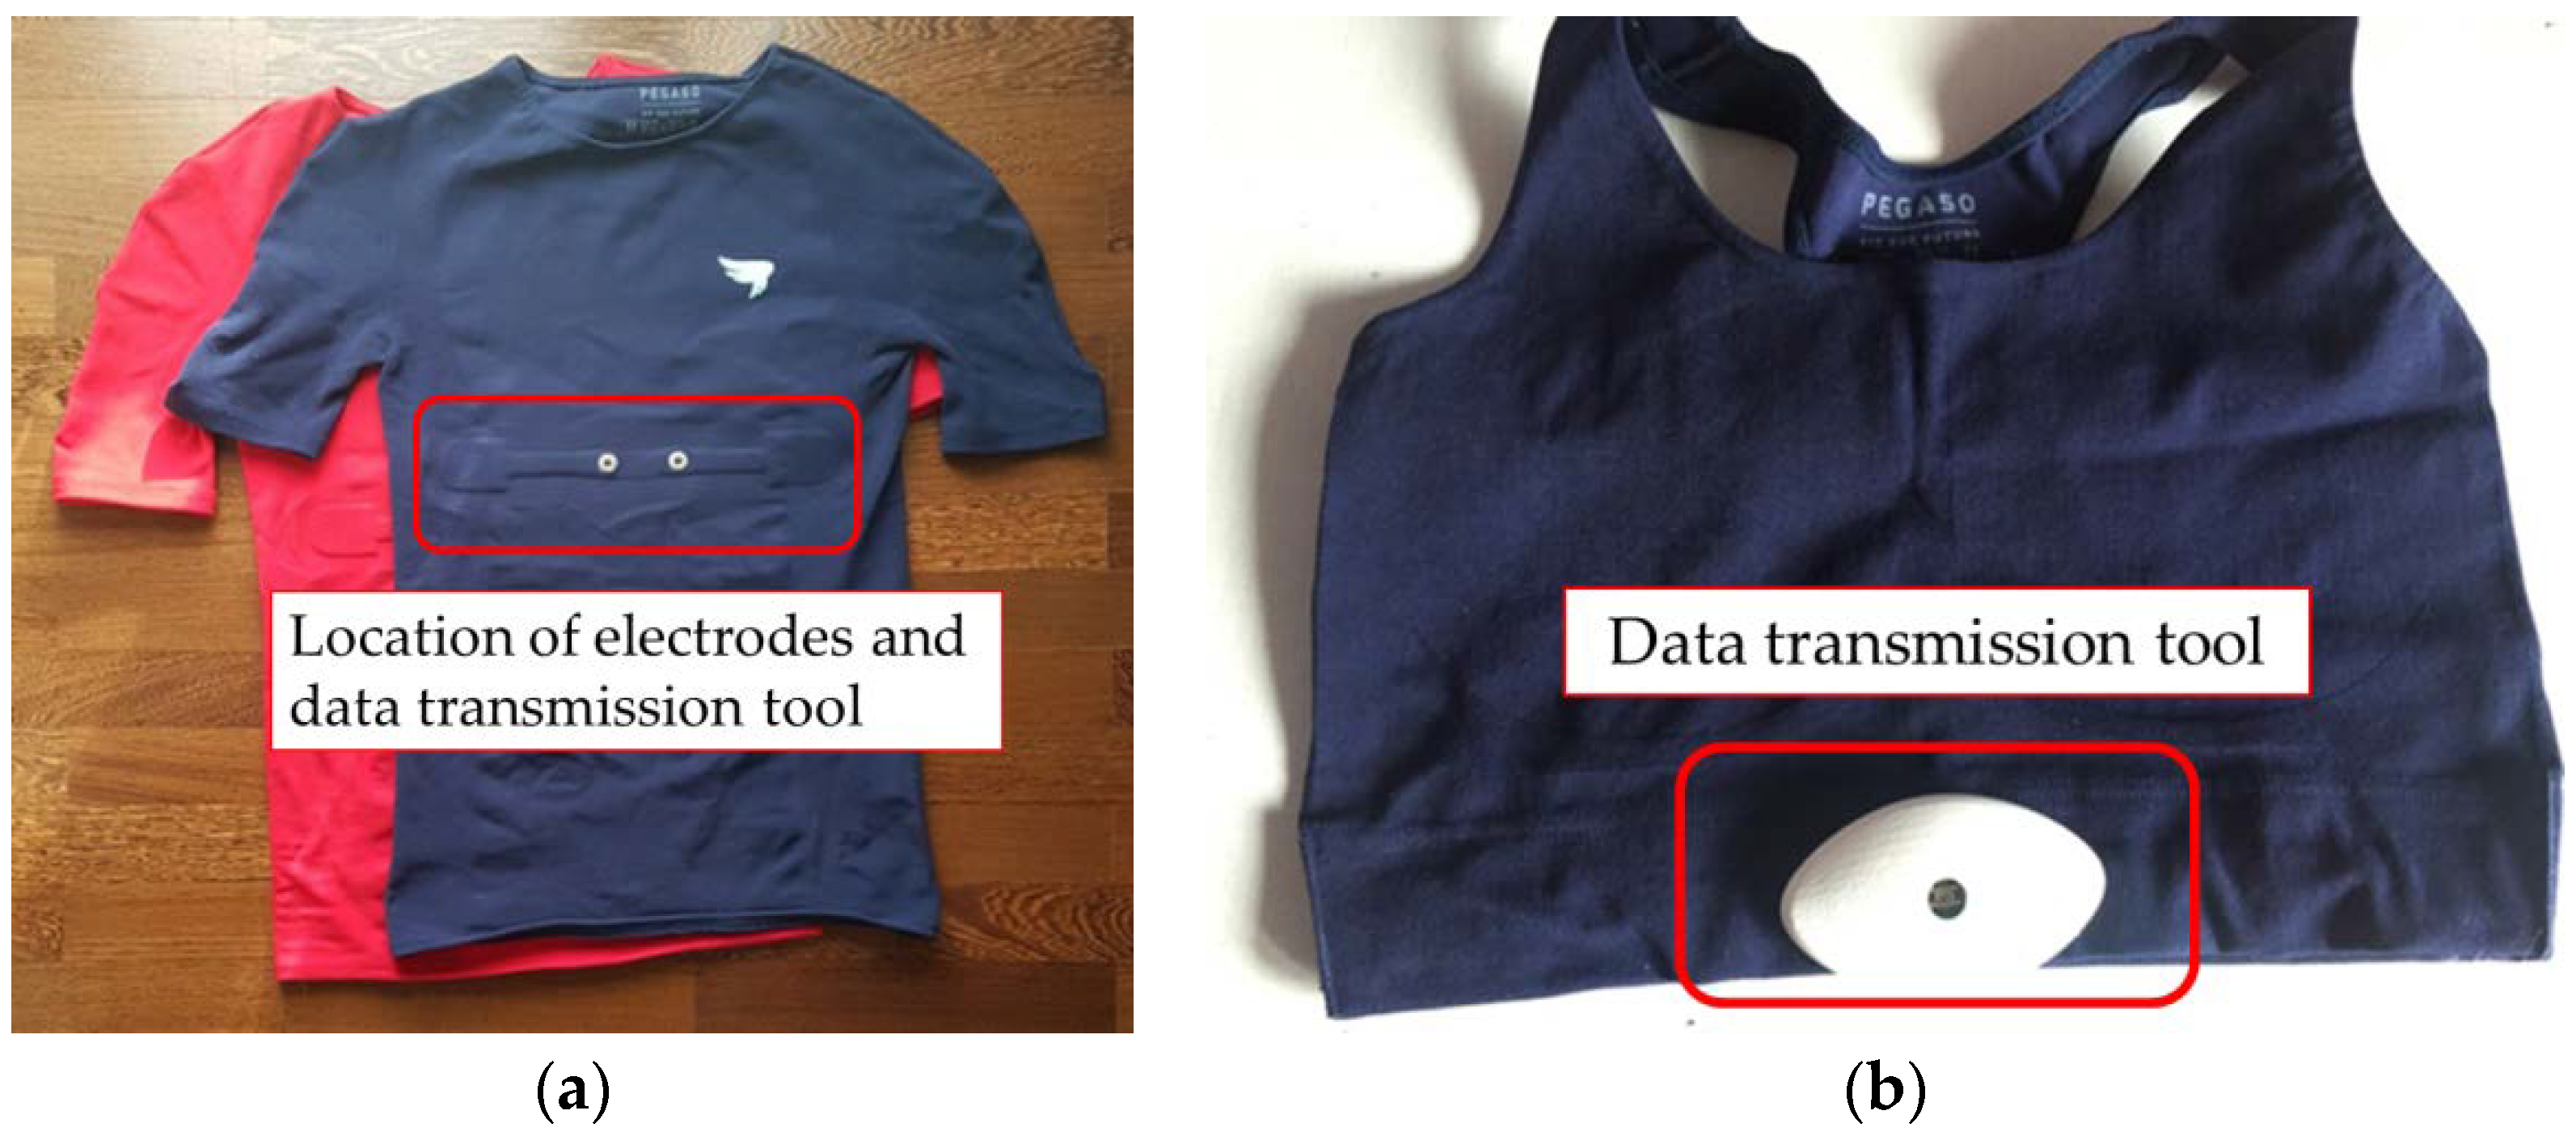
The data collection and the analysis of HRV and RR were developed through the use of a wearable instrument consisting of a T-shirt (or a top for the female version) equipped with two sensors placed at the lower limit of the chest, where the tool equipped with a battery was fixed. This device allowed the measurement of an electrocardiogram (ECG) and the transmission of data collected via Bluetooth to a smartphone application, or their collection in a dedicated internal storage.
The devices, shown in
Figure 2, were developed by a working group coordinated by the Sensibilab Laboratory of the Design Department—Politecnico di Milano. These tools were created for research purposes, and therefore, they are not directly comparable with commercial devices, as the precision and reliability of the outputs allow overcoming some limits of commercial tools, well described in the literature [
32].
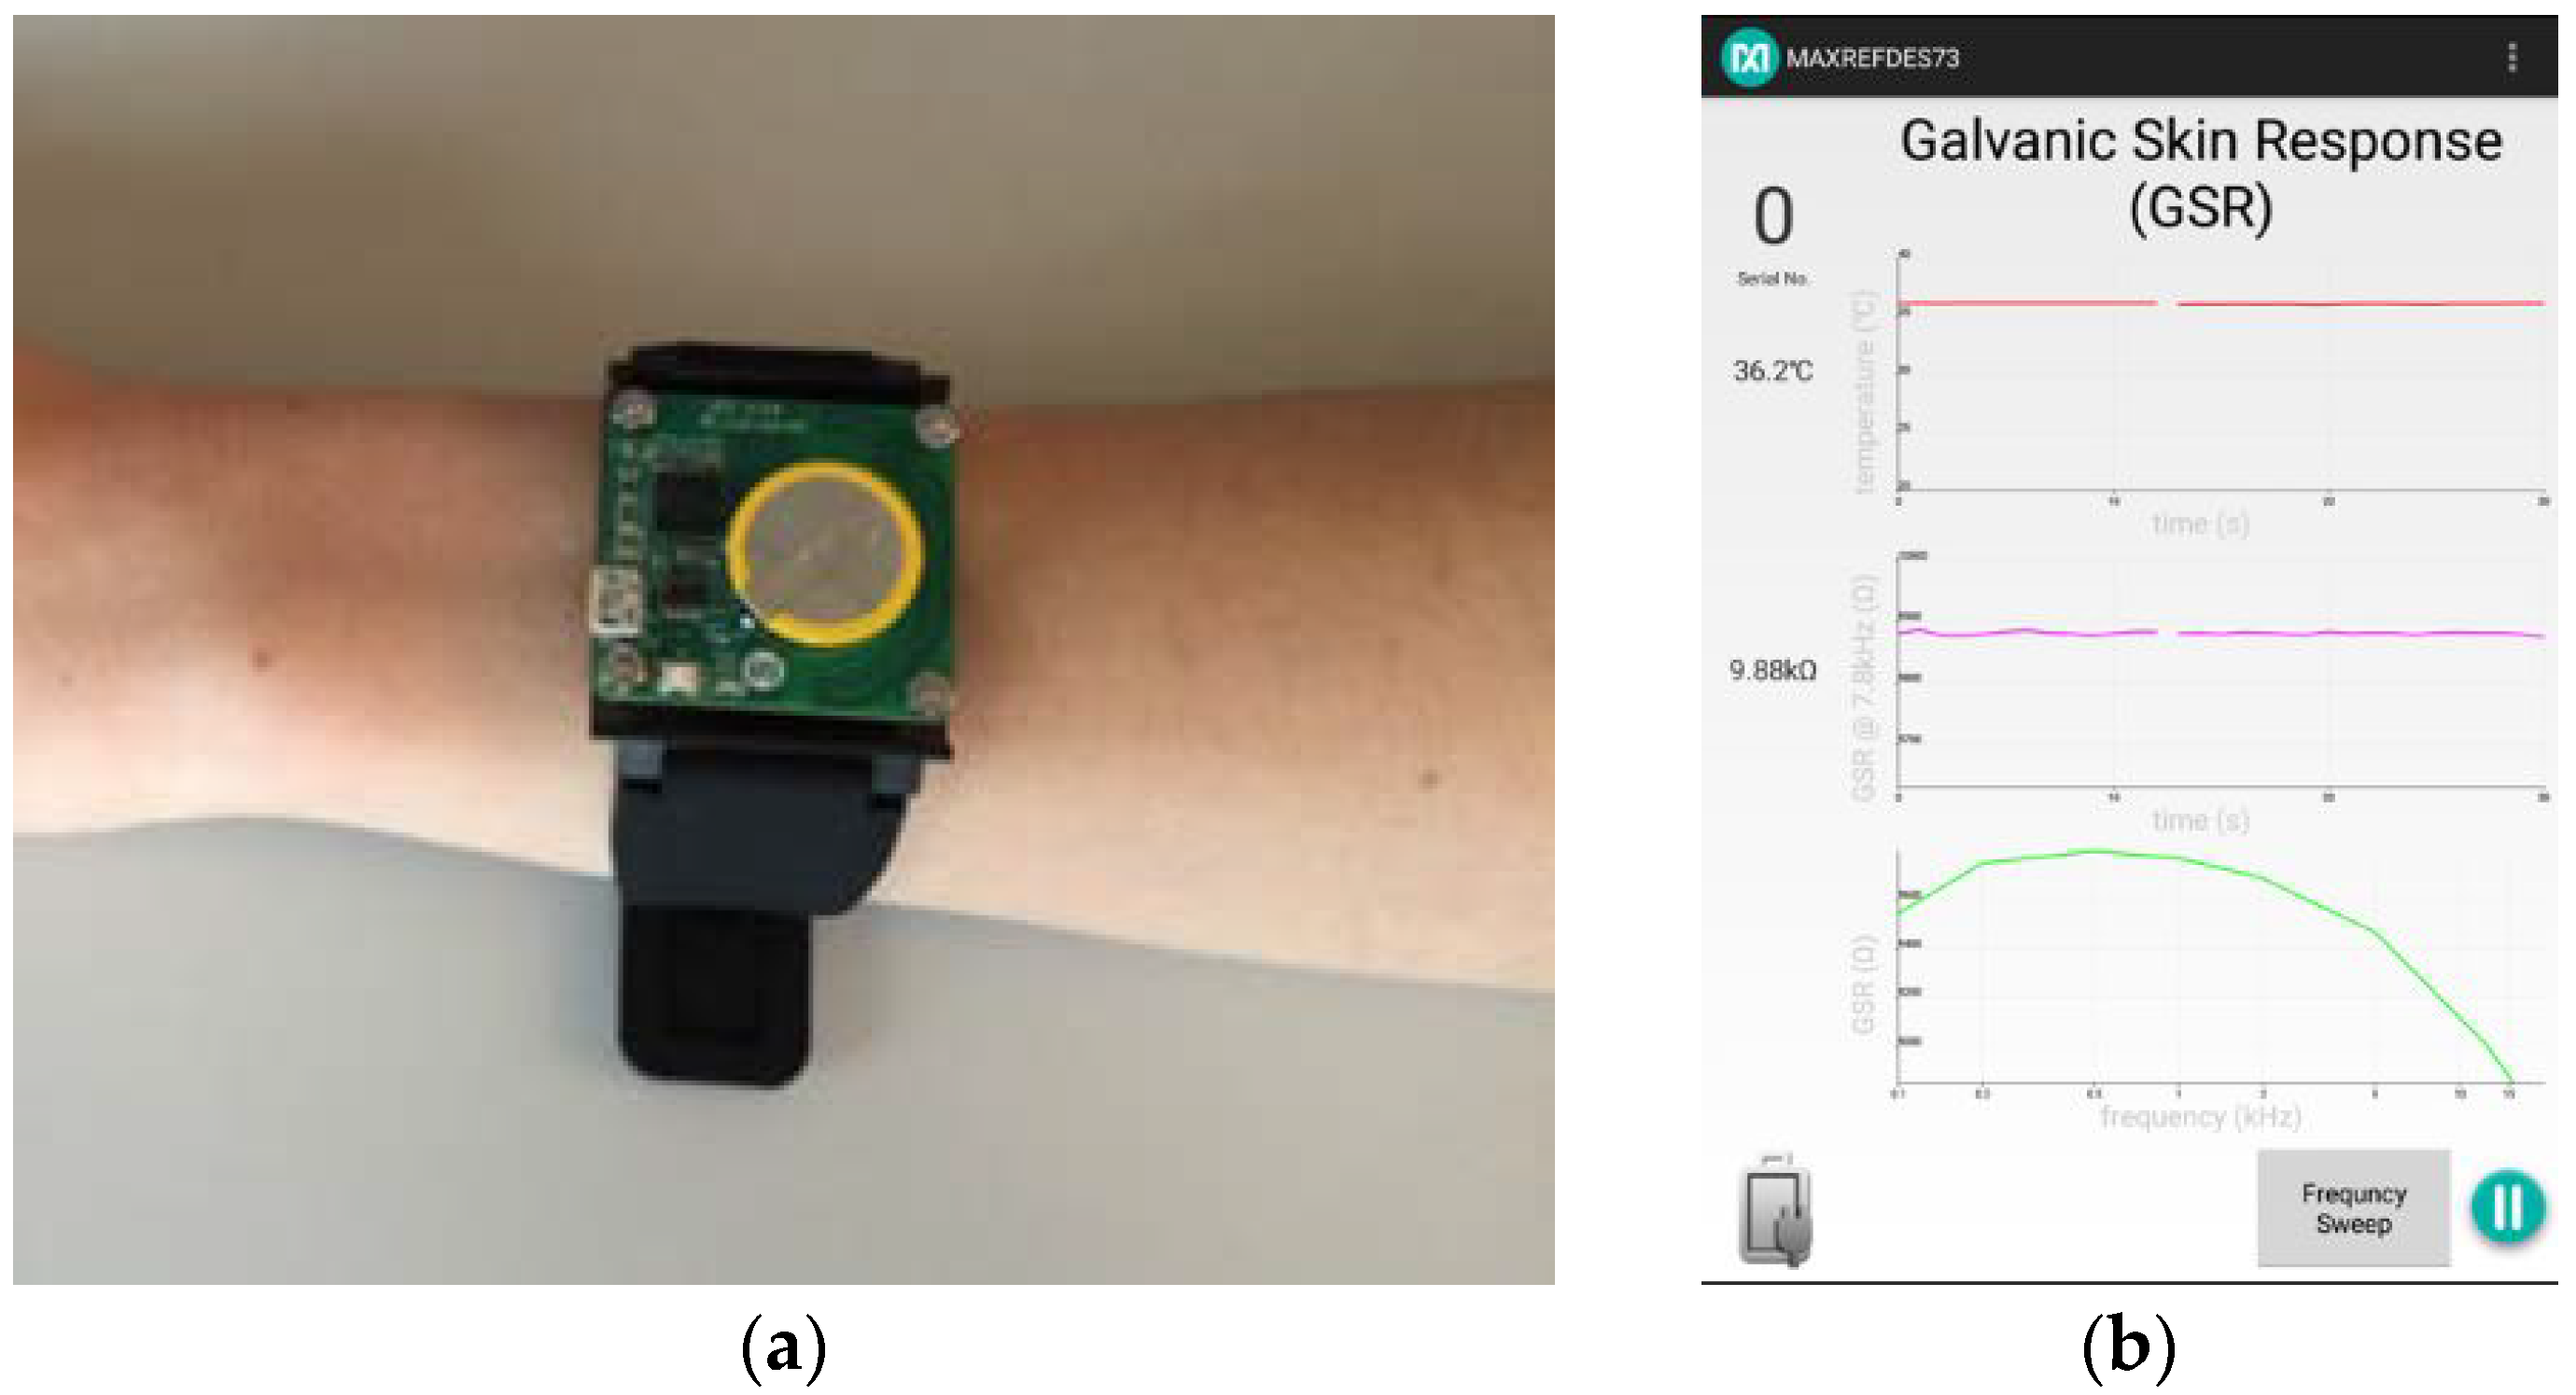
Another parameter considered significant is the galvanic skin response (GSR), which represents the conduction ability of the skin; in the case of emotional agitation or stress, the electrical resistance of the skin decreases progressively, while, on the contrary, the conductance increases [
33,
34]. This parameter, together with HRV low frequency and the LF/HF ratio, appears to be one of the most valid indicators for the acquisition of information regarding the autonomic nervous system and stress levels [
24]. The measures of GSR are usually performed with sensors placed on the fingers of the hand and/or on the feet; however, to avoid interference with driving maneuvers, a bracelet with electrodes for the measurement of skin conductance was adopted (
Figure 3) [
33]. The values recorded by the instrument during the test can be displayed on a smartphone application called MAXREFDES#73, developed by Maxim Integrated (San Jose, CA, USA), and they were collected in a text file.
For the second set of experiments, the HRV parameter was confirmed as a fundamental parameter for the assessment of the psychophysical state of the driver. In particular, in this second stage, the LF/HF ratio was considered, being able to provide information on the balance between the sympathetic and parasympathetic activity of the autonomic nervous system. High values of this ratio are linked to stressful situations involving greater activity of the sympathetic system, while low values are related to relaxed conditions, with a predominance of parasympathetic activity [
15,
17,
18,
19]. The threshold values for this parameter were 0.5 and 2; thus, if the LF/HF ratio was included within this interval, the system was balanced and the subject was in a “normal” condition [
35]. The tool for recording data used in this case was very similar to the one described above. It is called PegasoWes437, and it was also developed by the Sensibilab Laboratory (Lecco, LC, Italy).
2.2. Location and Scenario Information
To support the evaluation of the physiological indicators listed, the proposed method also considered the collection of further information. In particular, it was necessary to record the position, as well as a range of contextual information useful for the characterization of the road environment, and of the situations and scenarios that may occur within it. This information was collected using a Global Positioning System (GPS) device and a video camera.
The GPS was fundamental for the continuous spatial location of the data collected, and for the correlation between these and the black spots identified through the analysis of accidents. Several smartphone apps can fulfill this requirement and ensure instant car location data, including MotionXGPS (developed by Fullpower Technologies, Inc., Santa Cruz, CA, USA) and GeoTracker—GPS tracker (developed by Ilya Bogdanovich, Moscow, Russia). These applications allow saving files in .gpx format, manageable with Google Earth. For each point, longitude, latitude, altitude, speed, and time can be displayed.
The use of a video camera was needed to effectively record the contextual features of the environment during the experimental driving tests, to identify events and situations that may indicate the potential causes of stress for the driver. During the field tests, different tools were used. In the first phase, a GoPro camera was used, positioned on the head of the driver (to record what he was actually seeing) or on the dashboard of the car. In the second phase, Camera Sunglasses (produced by Risest Technology Co., Futian District, Shenzhen, China) were used.
Further information could be collected through a recall test, carried out by the testers in both phases of the test (at the end of each driving test). The purpose of the questionnaire was to evaluate how stress was perceived by the user during the path, based on the perceptions declared by the testers. The recall test also allowed the collection of general information concerning the driving experience in the analyzed context.
Similar to the approach adopted in the study by Healey J.A. and Picard R.W. [
24], two types of evaluation were requested in the recall test, shown below.
The individual user was asked to remember the events considered most stressful during the test and was asked to give each one a score from 1 (no stress) to 5 (very high stress).
Participants were asked to list the causes of perceived stress from most stressful to least stressful.
The results of the questionnaires were then compared with the data collected during the different tests.
2.3. Road Safety Analysis
To evaluate the possible correlations between the elements emerging from the study of the described parameters and the accidental events, it was necessary to develop a road safety analysis.
Currently, the analysis of accidents on a road network involves a first phase of historical data collection, over an extended time horizon (three or five years). These data are typically managed by institutes and bodies that deal with statistics at the national level. Considering the Italian context, accidental data are collected, processed, and published by ISTAT in collaboration with Automobile Club d’Italia (ACI). It must be highlighted that these data concern only serious accidents (i.e., the ones that require the intervention of the police authority), and that they do not always provide all the necessary information. Despite some limits, such as the ones mentioned, the statistical analysis of accidents allows a first understanding of these phenomena and supports the identification of the most critical areas (the black spots) located on a network.
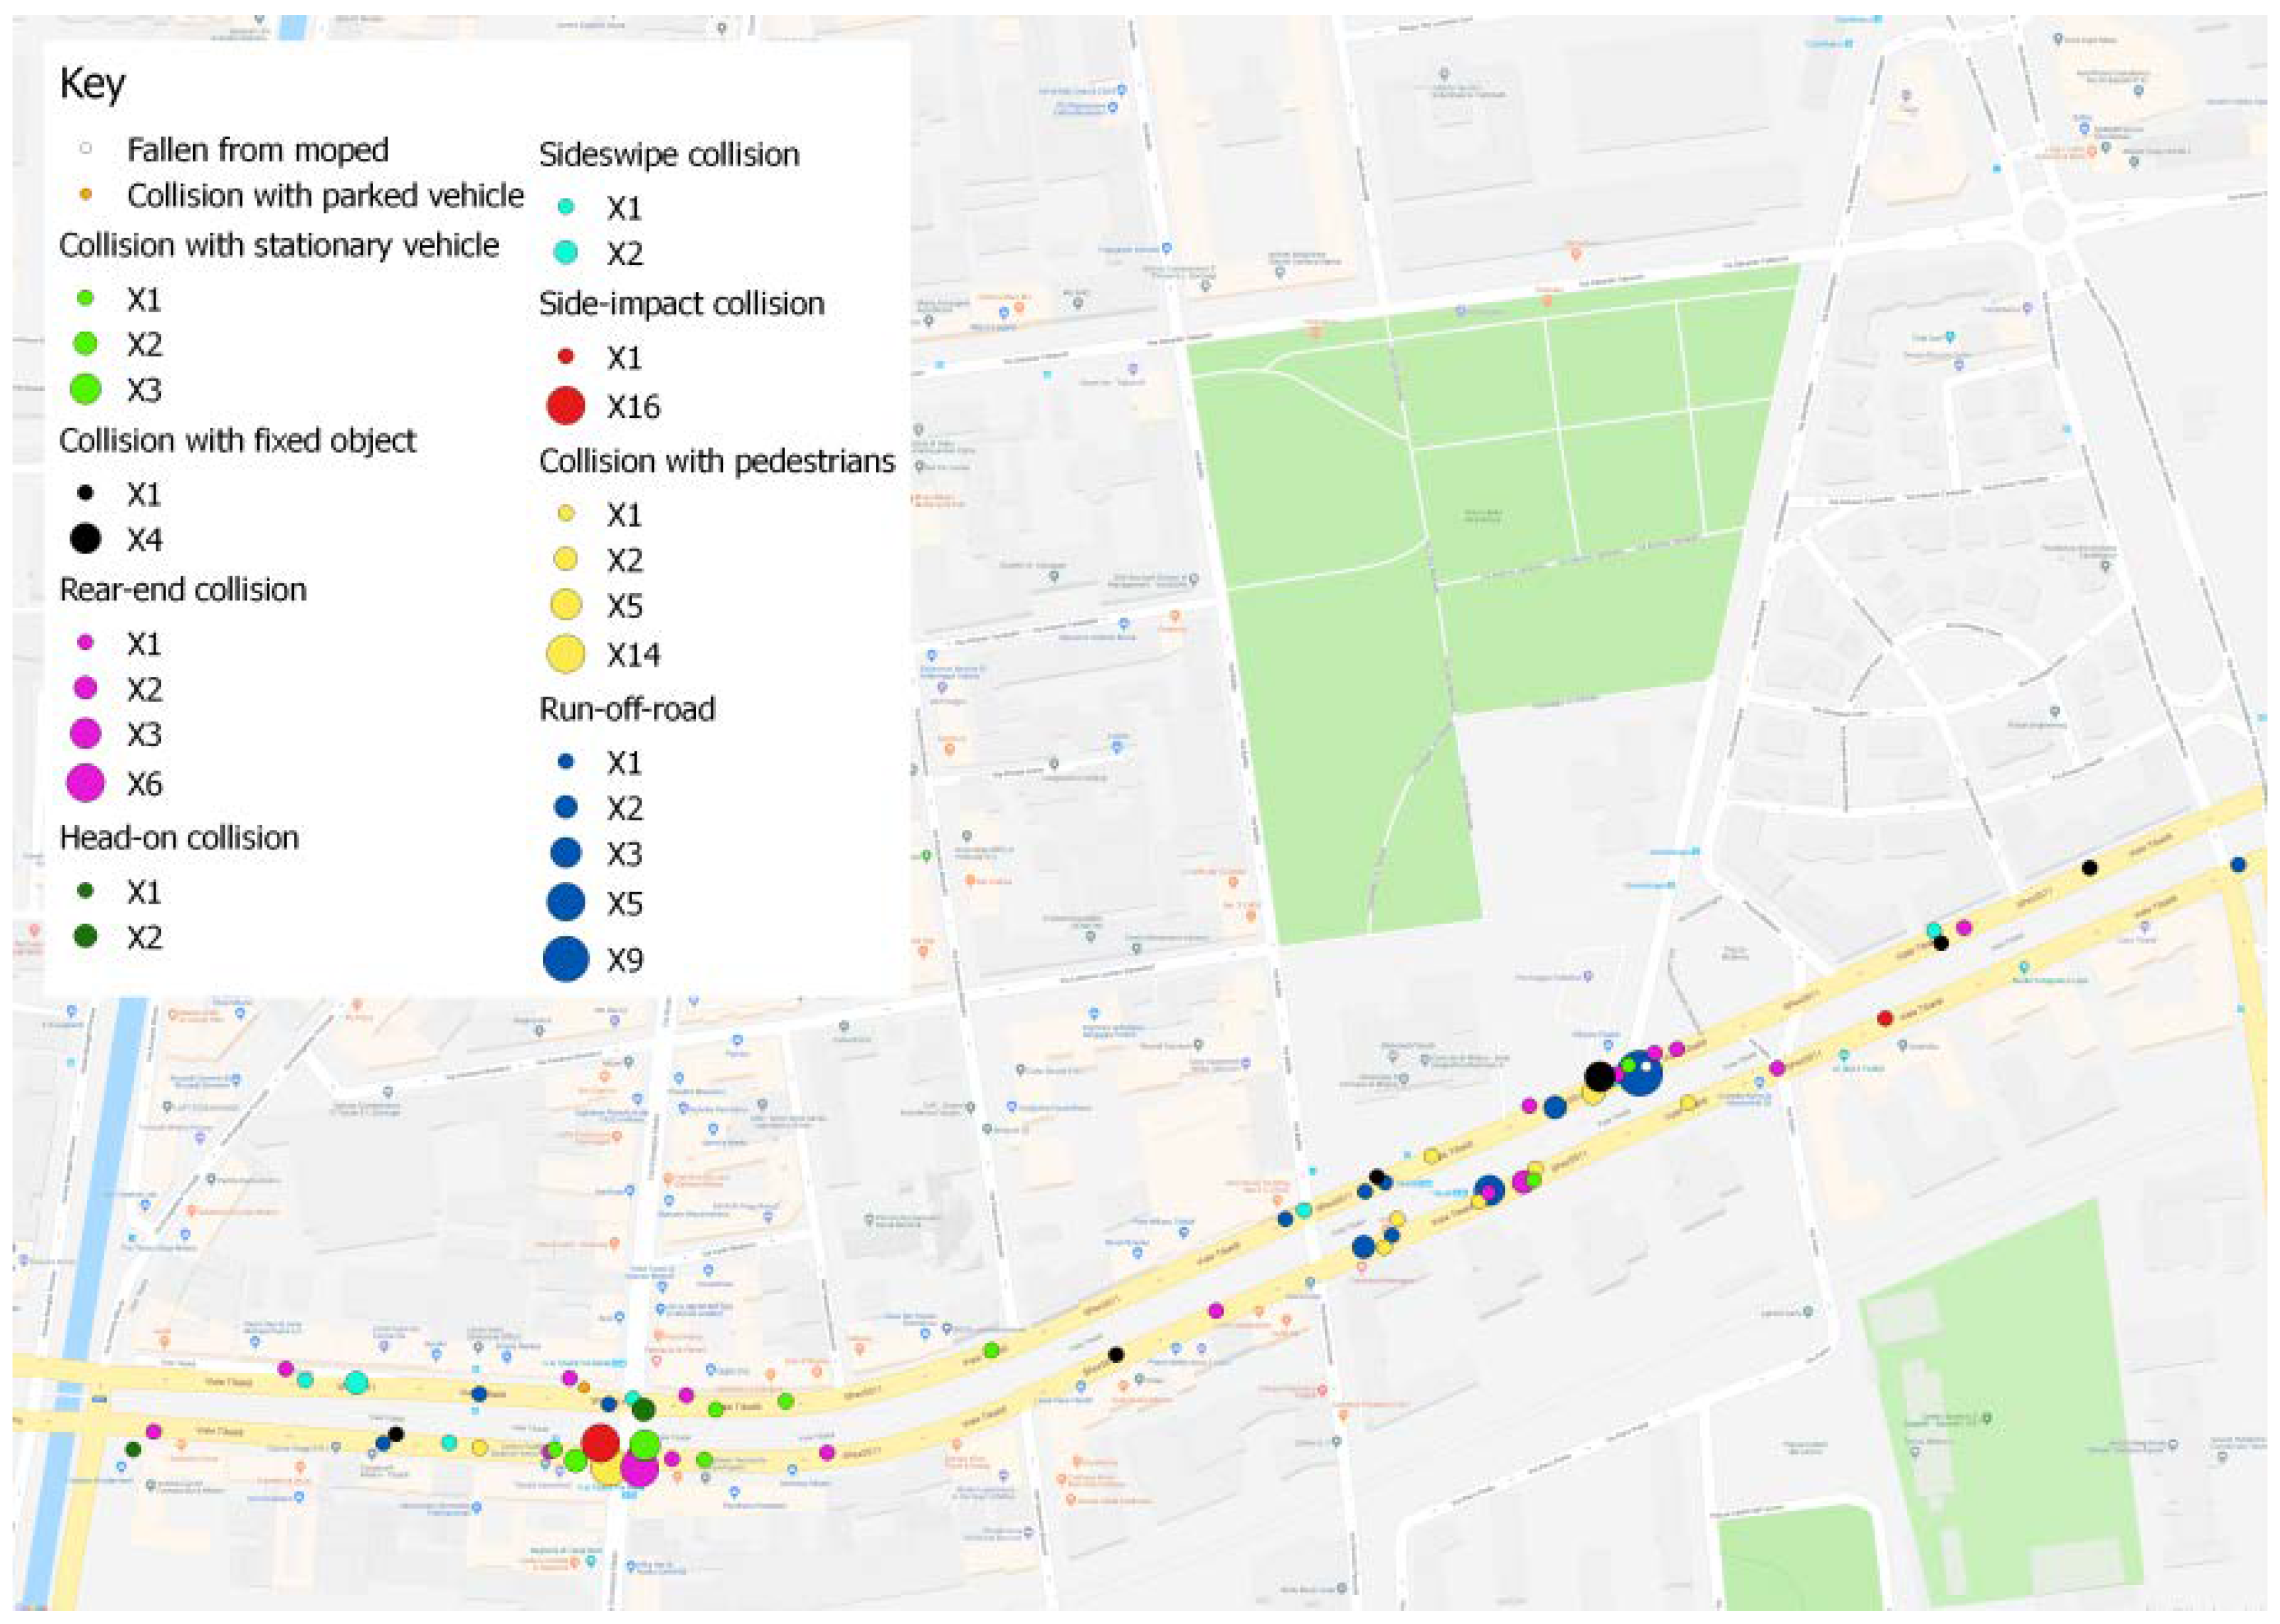
The traditional approach is based on an initial aggregated analysis, with the aim of assessing the extent of the phenomenon, the types of events, the factors of accidents, and the location of critical points. A more in-depth investigation involves subsequent disaggregated analysis. It analyzes, for a particular location, the factors that caused accidents, so as to identify the possible countermeasures necessary to face critical issues.
Figure 4 shows an example of a result of an accident analysis.
2.4. Tests
The methodological approach described was applied to a series of experimental driving tests, so as to evaluate its applicability to a real case, and to develop an initial calibration.
The driving tests were carried out on the road network in the city of Milan. All participants were properly informed, and they signed a declaration of informed consent to take part in the study.
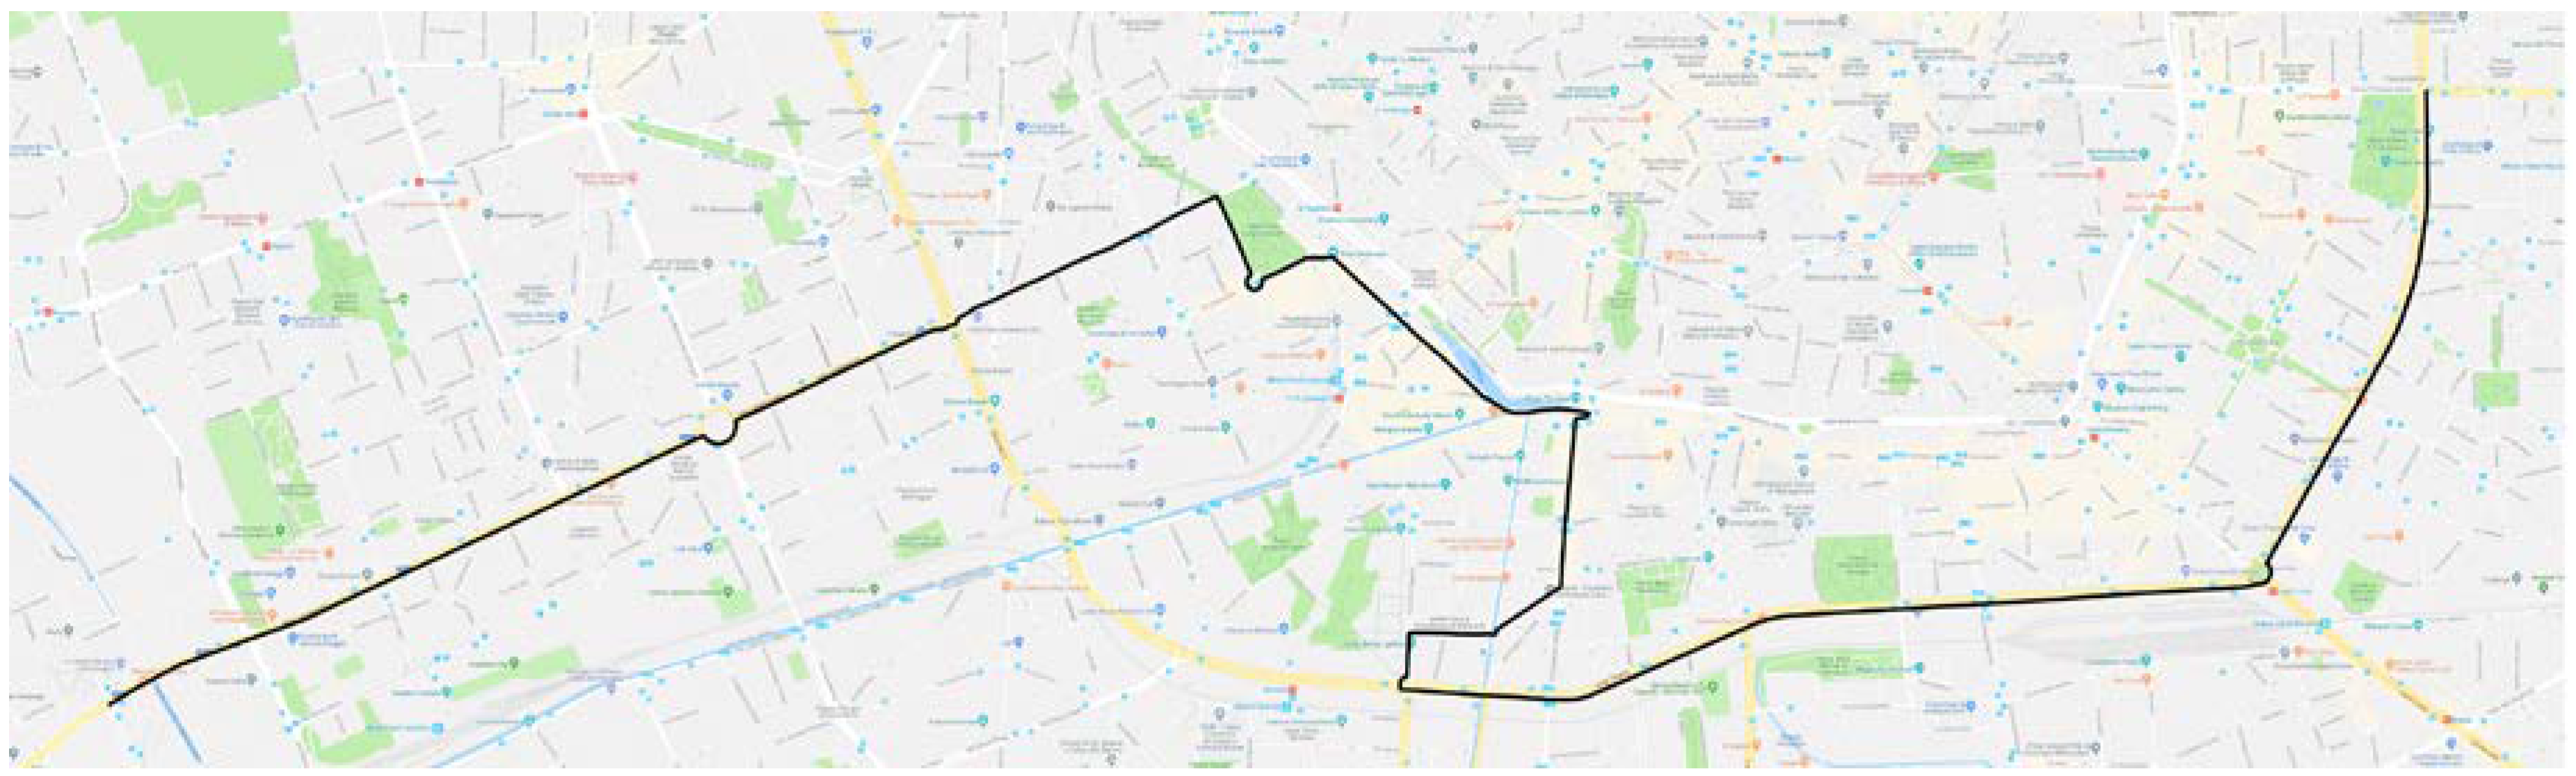
In the first set of experiments, two tests were carried out, both with drivers between the ages of 25 and 35, who were used to driving in large urban centers and using their own vehicles, so as to avoid the arising of further stress during the test. The experiments were carried out on “standard” days, avoiding anomalous situations (holidays or strikes, and, as much as possible, rush hours). Data collection took place over a time interval of about 1 h and 40 min for each test, for about 26 km of overall travelled distance. The path is reported in
Figure 5.
Each driver was equipped and monitored by means of the previously presented wearable devices (T-shirt/top with electrodes, GSR bracelet, and video camera on the head or on the dashboard), and was instructed about the path to follow. The tests were carried out with other people on board to activate the instruments and to use the connected applications.
In the second set of experiments, seven participants aged between 20 and 30 were involved, carrying out nine tests. Each driver drove his own car; however, unlike the first experimental set, some testers were not used to driving within an urban environment. As described before, the testers were instructed on the path to follow, and were monitored with the same wearable devices used in the first test. To record the environmental conditions, glasses with an integrated video camera were used instead of the video camera mounted on the head/dashboard. Before the actual driving test, the drivers were subjected to a test in rest conditions, lasting about 5 min, for the calibration of LF/HF ratio ranges for each driver. This baseline was fundamental to remove, as much as possible, the subjective components of the each driver’s stress. In fact, knowing the range of values for each tester at rest allows obtaining objective results regarding values that exceed those recorded in rest conditions.
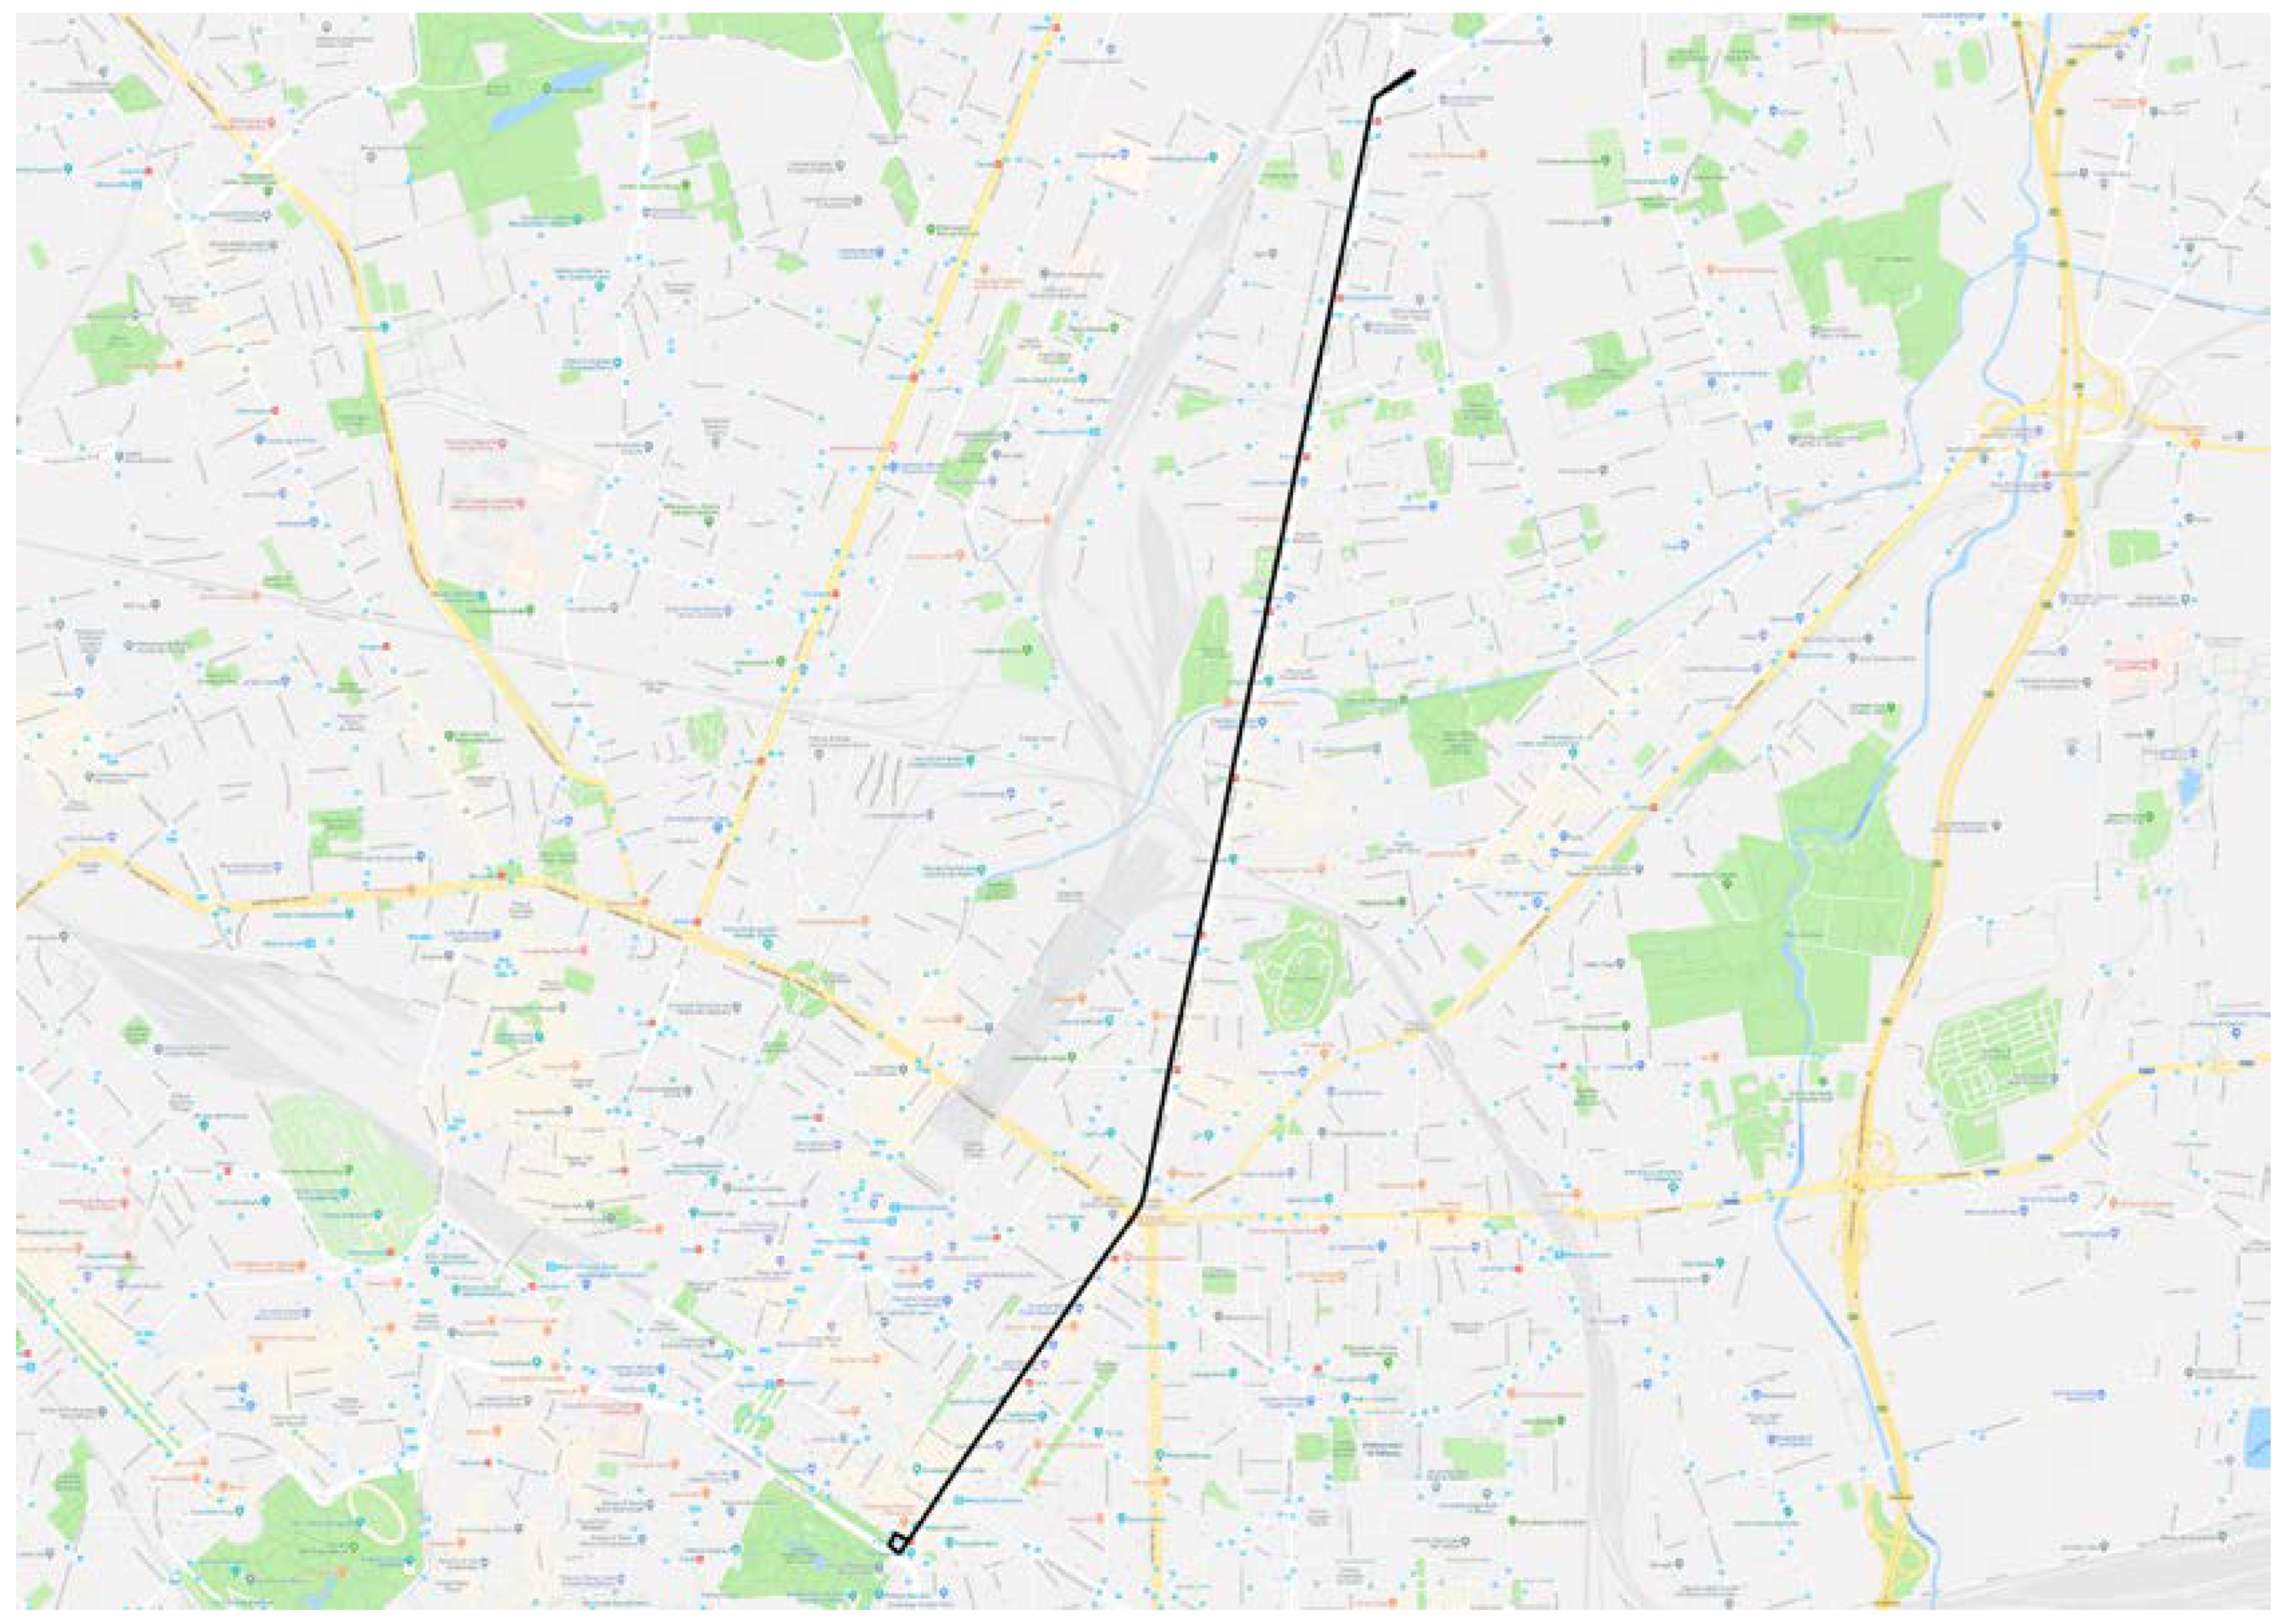
The tests were carried out during the daytime hours, along an 11-km path, reported in
Figure 6, for a duration of about 45 min.
Both phases of experimentation allowed the identification of solutions to the operational problems that emerged. In particular, it was necessary to define an appropriate protocol for the synchronization of the different tools, since some complications in their simultaneous start-up arose.
The developed test in rest conditions or the tests of the second experimental phase allowed, instead, referring all values recorded for the parameters to the specific feature of each driver.
It was not possible, at this first level of research, to carry out long-term experiments, both because of the temporary availability of the used devices, and the complications that arose during the tests. In fact, the simultaneous activation of wearable tools, the GPS, and the video camera, as well as the checking of data collection, required the presence of at least two operators in the vehicle, making the independent management of tools by the drivers themselves difficult on various days.
2.5. Elaboration
2.5.1. Elaboration of the Psychophysical Parameters
The data processing phase was developed with different approaches for the two test phases considered. In the first set of experiments, the data collected by the heart-rate measurement sensor were sent in real time to the smartphone application, also developed by the Sensibilab Laboratory. This app made it possible to obtain and manage information on HRV and RR. The data collected by the tool were then used as input to a specific software for the calculation and processing of the HRV parameter—Kubios—developed by the Biosignal Analysis and Medical Imaging Group of the University of Kuopio, Finland [
36,
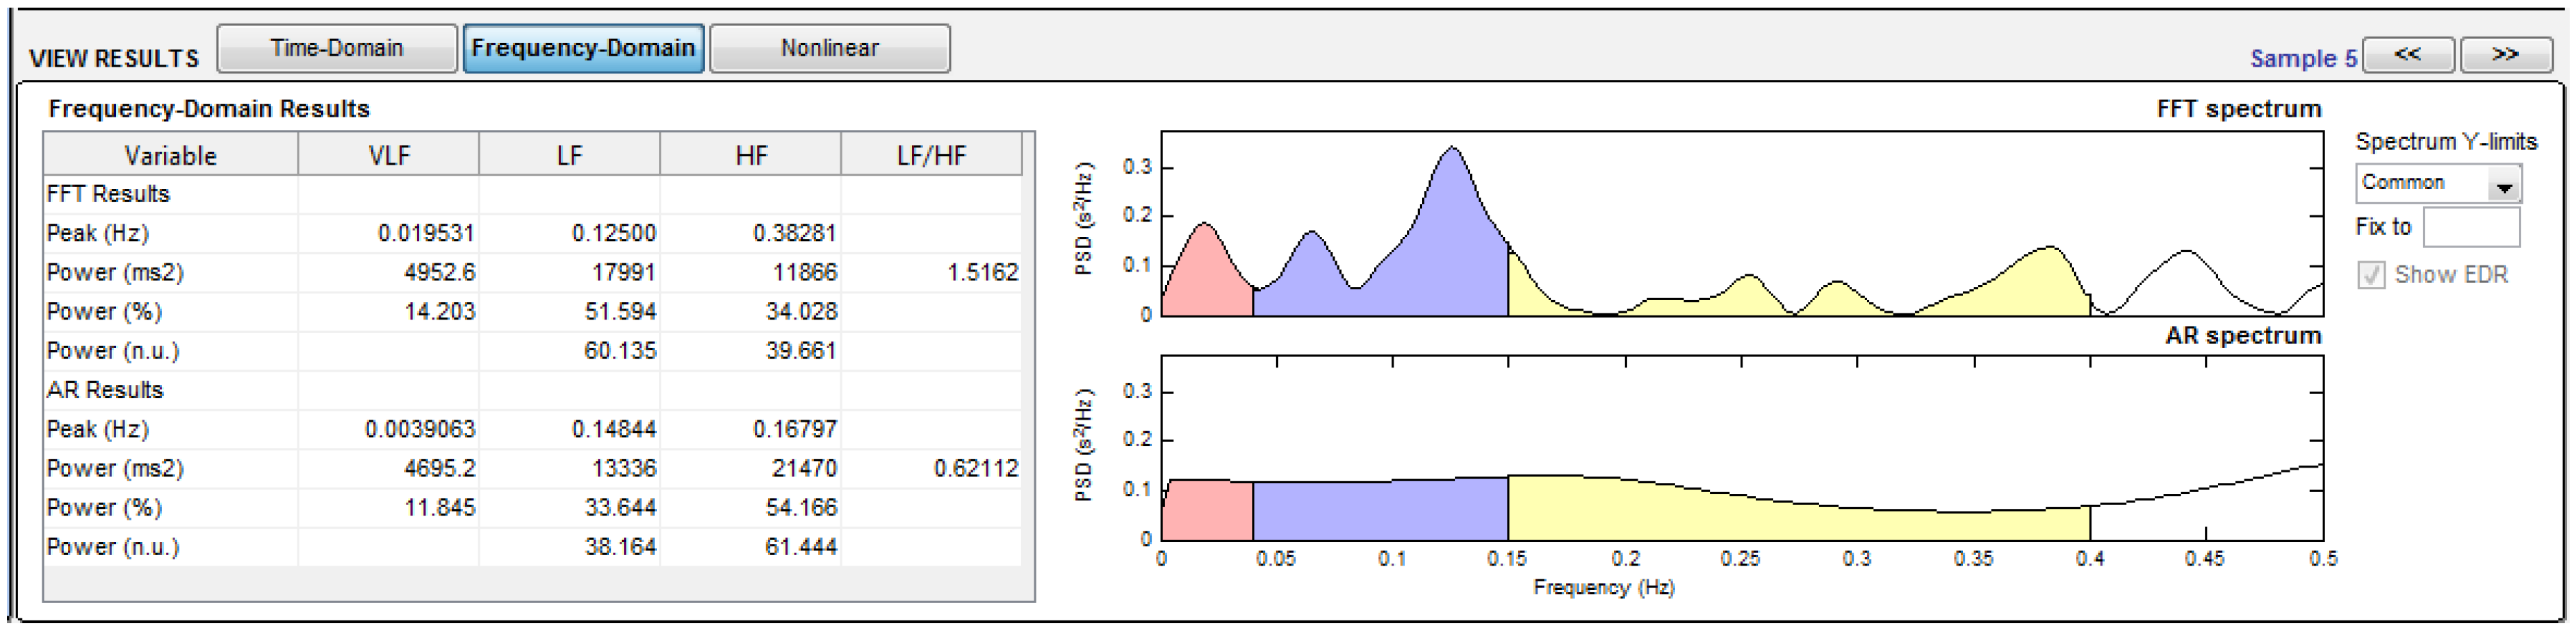
37]. This software allows the analysis of HRV and its components over discrete time intervals (with a minimum time interval of 30 s). Both the values of the different frequency components, i.e., VLF, LF, HF, and the LF/HF ratio, and the parameters in the time domain are provided. The latter values were not considered in the analysis as they are less related to stress conditions [
16,
17]. An example of the information collected and processed is shown in
Figure 7.
Concerning the GSR parameter, the values recorded by the instrument during the test, after being collected and analyzed by the application MAXREFDES#73, were consulted and processed as text files.
The values of the LF, RR, and GSR parameters were reported on three graphs that illustrate their trends over time. By overlapping these graphs, thanks to the output synchronization, it was possible to identify the instances, or more correctly, the time intervals, in which a coincidence of the LF and GSR peaks was recorded. The comparison between several indicators provides further confirmation and allows overcoming the potential errors of the single device. For this reason, the points that were considered as stressful were those in which both parameters presented peak values. This condition allowed the identification of a first set of points in which the values of altered psychophysical status were recorded. However, for the identification of the points chosen for the comparison with black spots, the RR parameter recorded at the identified locations was also considered (its value must be greater than 20 breaths/minute to be considered as anomalous [
21]), and a video-recording check of what the driver was seeing and perceiving during the test drive was made.
In the second test phase, the data relating to the HRV parameter were collected and processed on the personal computer (PC) using the Mx Viewer software (developed by CSEM, Nazartel, Switzerland within the Pegaso project) [
38], before being analyzed with the Kubios software, as in the first experimental phase. The HRV component considered for the analyses was the LF/HF ratio. Thresholds were defined, different for each driver, and four bands of stress/relaxation states were considered: stress, neutral–stress, neutral–relaxation, and relaxation. Each road section, defined in the road safety analysis phase, featured the following:
One of the four bands of accidents (high, medium–high, medium–low, low);
The number of times (N) in which the parameter, LF/HF, fell into one of the four bands of stress/relaxation (for each of the bands: stress, neutral–stress, neutral–relaxation, or relaxation)
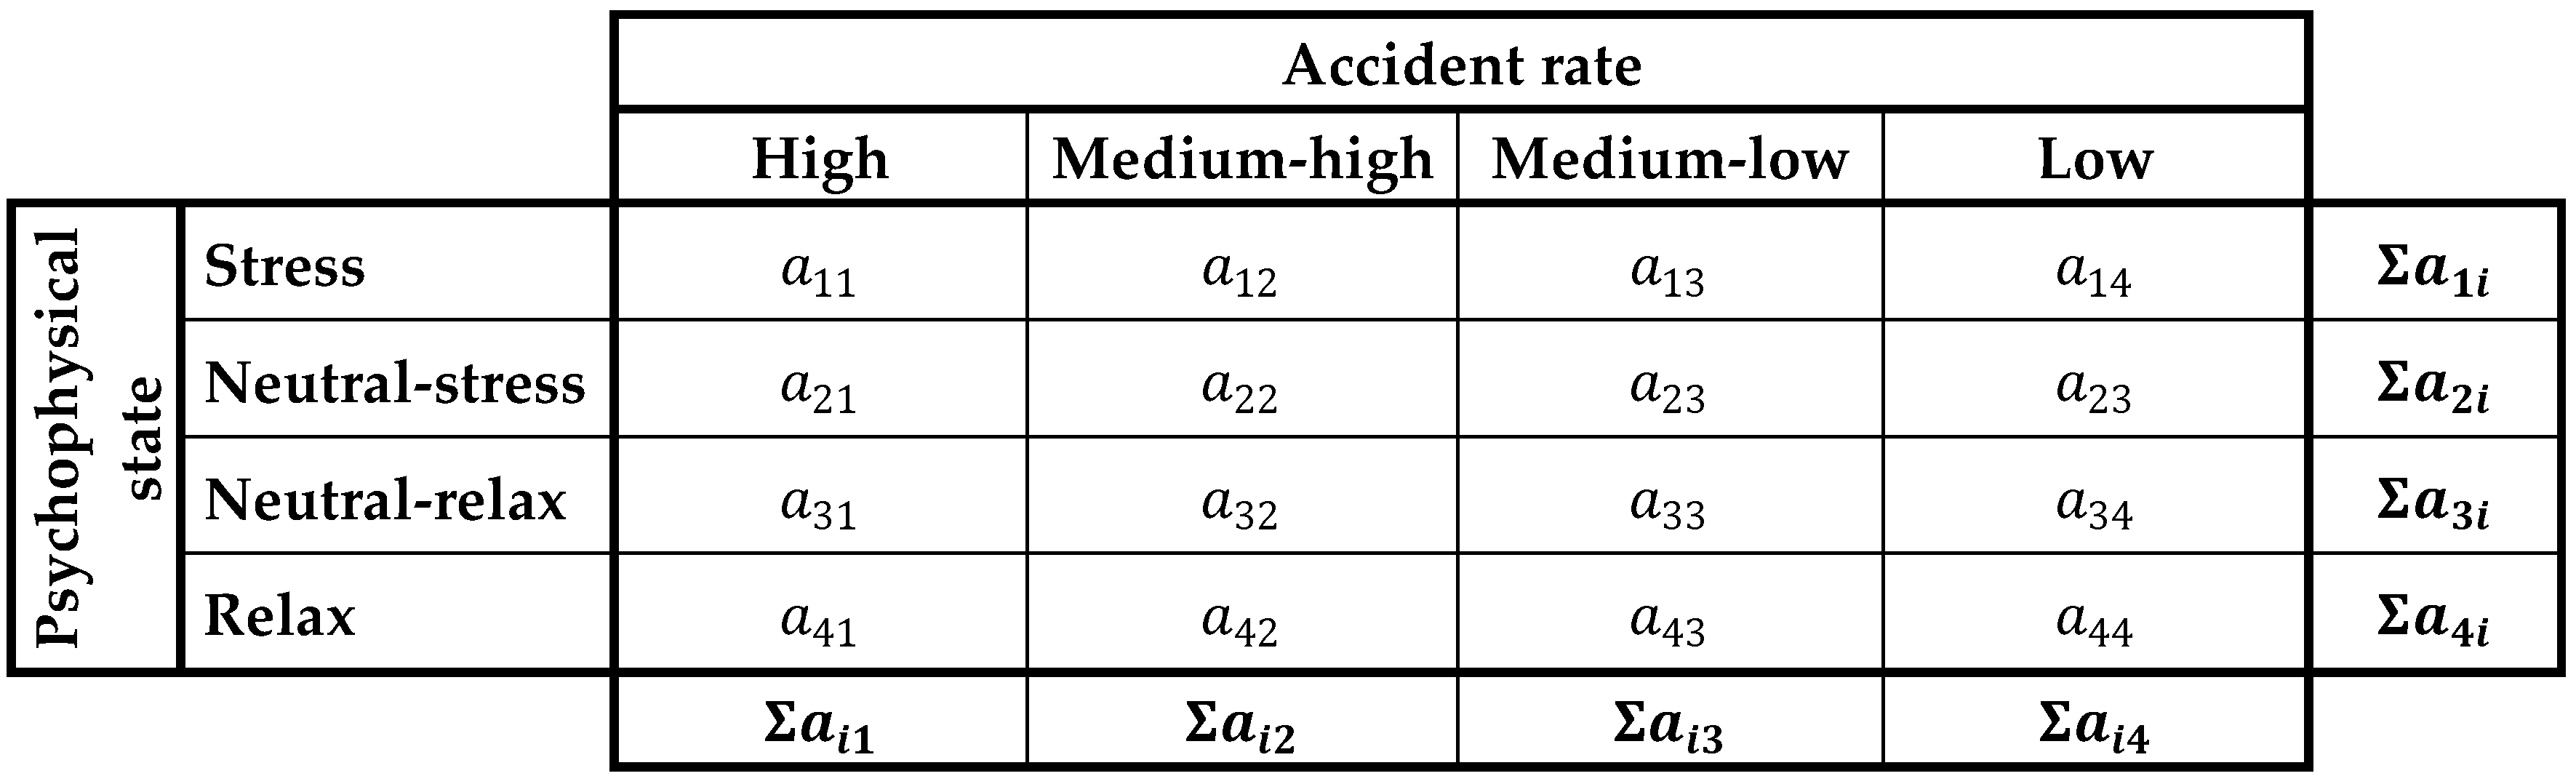
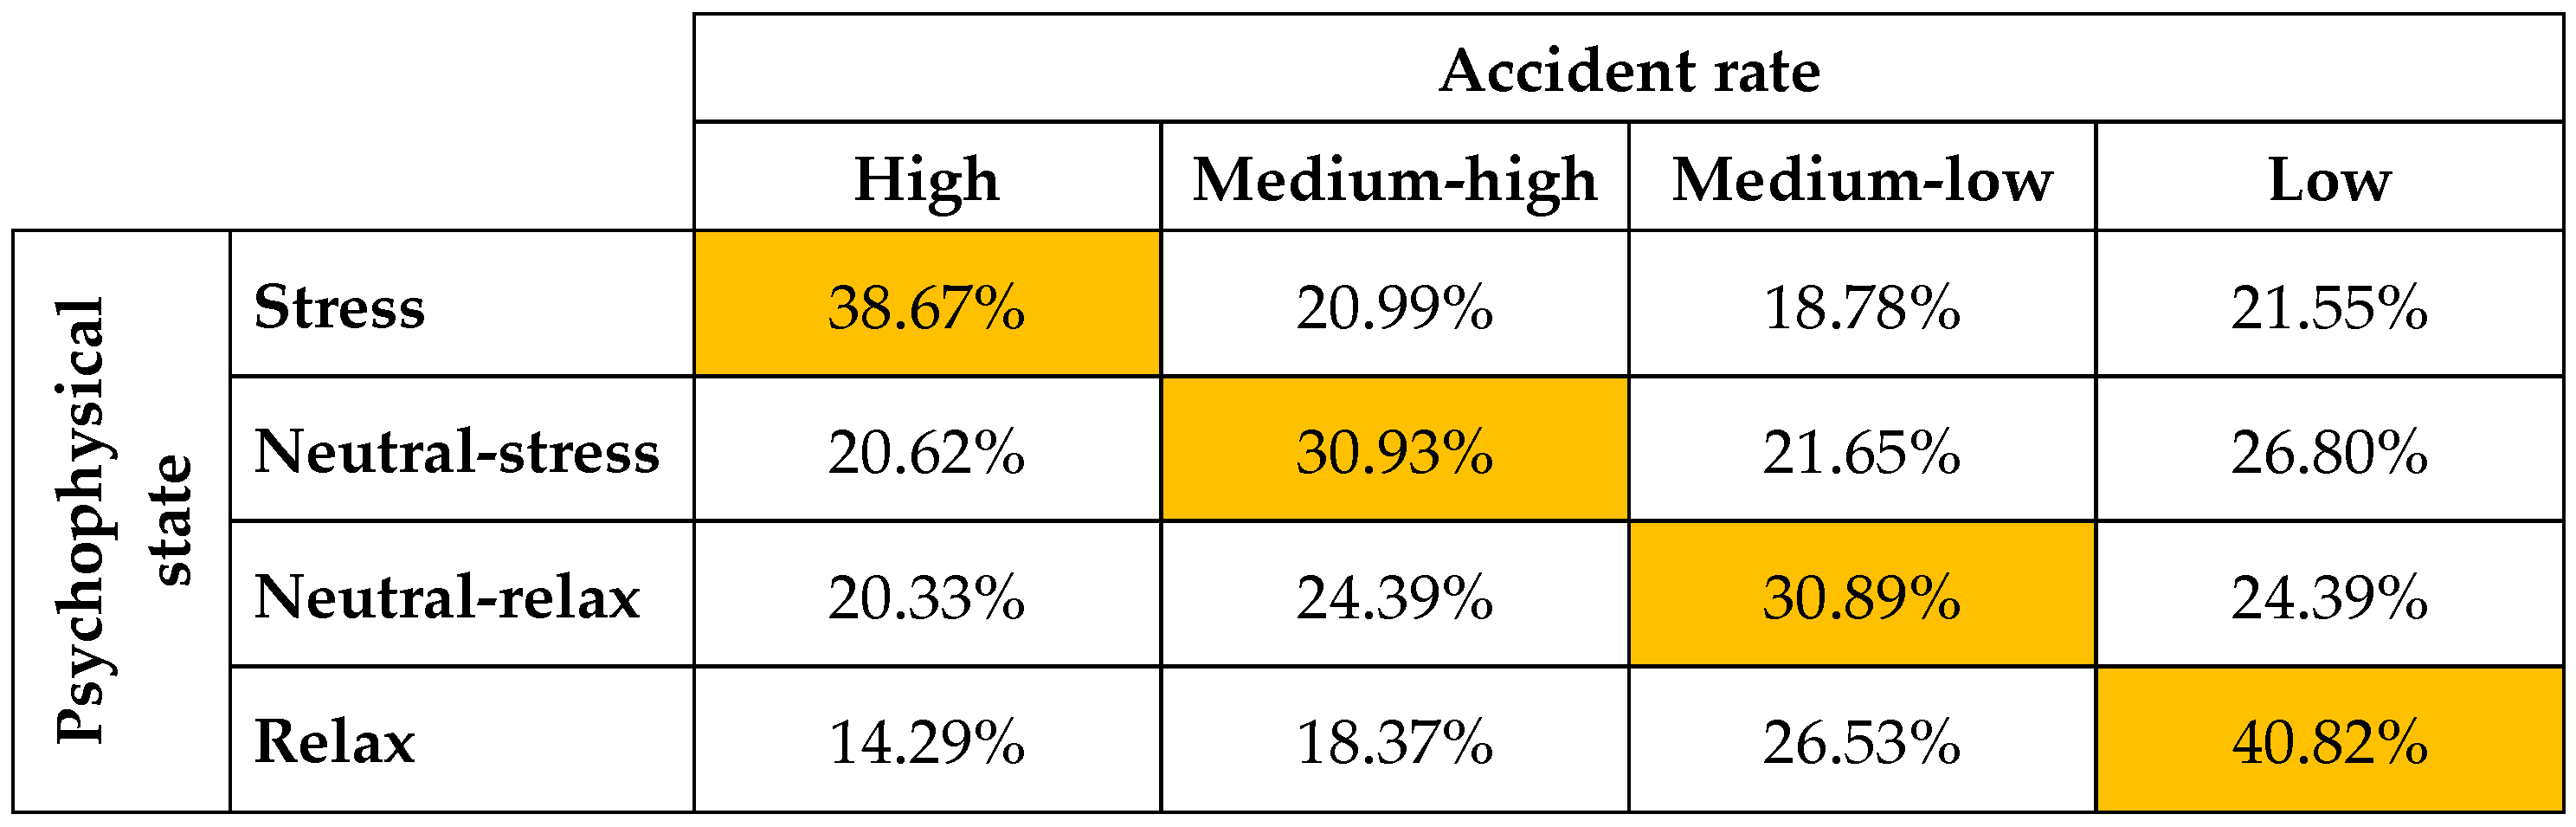
As an initial and quick analysis, a correlation matrix was developed to assess whether high stress levels corresponded to high accident rates and vice versa (
Figure 8).
Each cell of the matrix contains the number of cases in which the level of stress reported in each row was recorded within a specific area characterized by a specific accidental level indicated in each column. For example, the a11 coefficient represents the total number of times in which the high stress condition occurred within the areas featured by a high accident rate.
A scoring method was used, implying a score for each area equal to the sum of the individual scores related to the four levels of psychophysical state (i.e., 3 for stress, 1 for neutral–stress, and 0 for neutral–relaxation and relaxation). By setting a threshold for the score of the zones, the areas that exceeded this threshold could be considered as actually stressful and potentially risky zones.
2.5.2. Elaboration of Accidental Data
For both sets of experiments, the accidental data used for the elaboration were provided by the Agenzia Mobilità Ambiente e Territorio—Comune di Milano (AMAT) and concerned accidents with injuries to people occurring in the three-year period of 2011–2013 (experimental phase 1) and in the period of 2011–2017 (experimental phase 2, with partial data for the final year).
In the first experimental phase, both aggregate and disaggregated analysis of all the available data were performed, while, in the second phase of the research, the data were previously filtered, based on the type of accident and vehicles involved. All accidents not involving cars were excluded from the elaboration, following the choice of performing tests with cars only. In addition, isolated accidents were excluded, i.e., those that did not show a feature of recursion.
In both cases, accidents were located, reporting their spatial coordinates on a map with the QGIS software (QGIS Development Team (2018). QGIS Geographic Information System. Open Source Geospatial Foundation Project.
http://qgis.osgeo.org).
In the first experiment, the individual points of accident were not considered, but rather, an area of influence (buffer) of 60 m in diameter around them. This choice allowed partially overcoming the inaccuracies relating to the location of the data, and, at the same time, appropriately considering also the area surrounding the points in which the events were recorded. The possible causes of an accident could, in fact, also be researched in the neighborhood of the point where it happened.
In the second experimental phase, as a conclusion of the analysis of accidents, the route was divided into zones of about 100–400 m length, as reported in the example in
Figure 9. The division was developed starting from the points that presented numerous incidents, and by setting around them an initial and a final section, so as to create a homogeneous subdivision of the route. A homogeneous zone can be defined as a spatial interval that presents a homogeneous infrastructural features (i.e., intersection area or road link in urban areas), in which it is assumed that behavior is similar for all drivers.
This approach allowed transforming the analysis from punctual to areal, partially overcoming possible localization errors.
3. Results
Different results were obtained from the two experimental phases.
3.1. Results of the First Experimental Phase
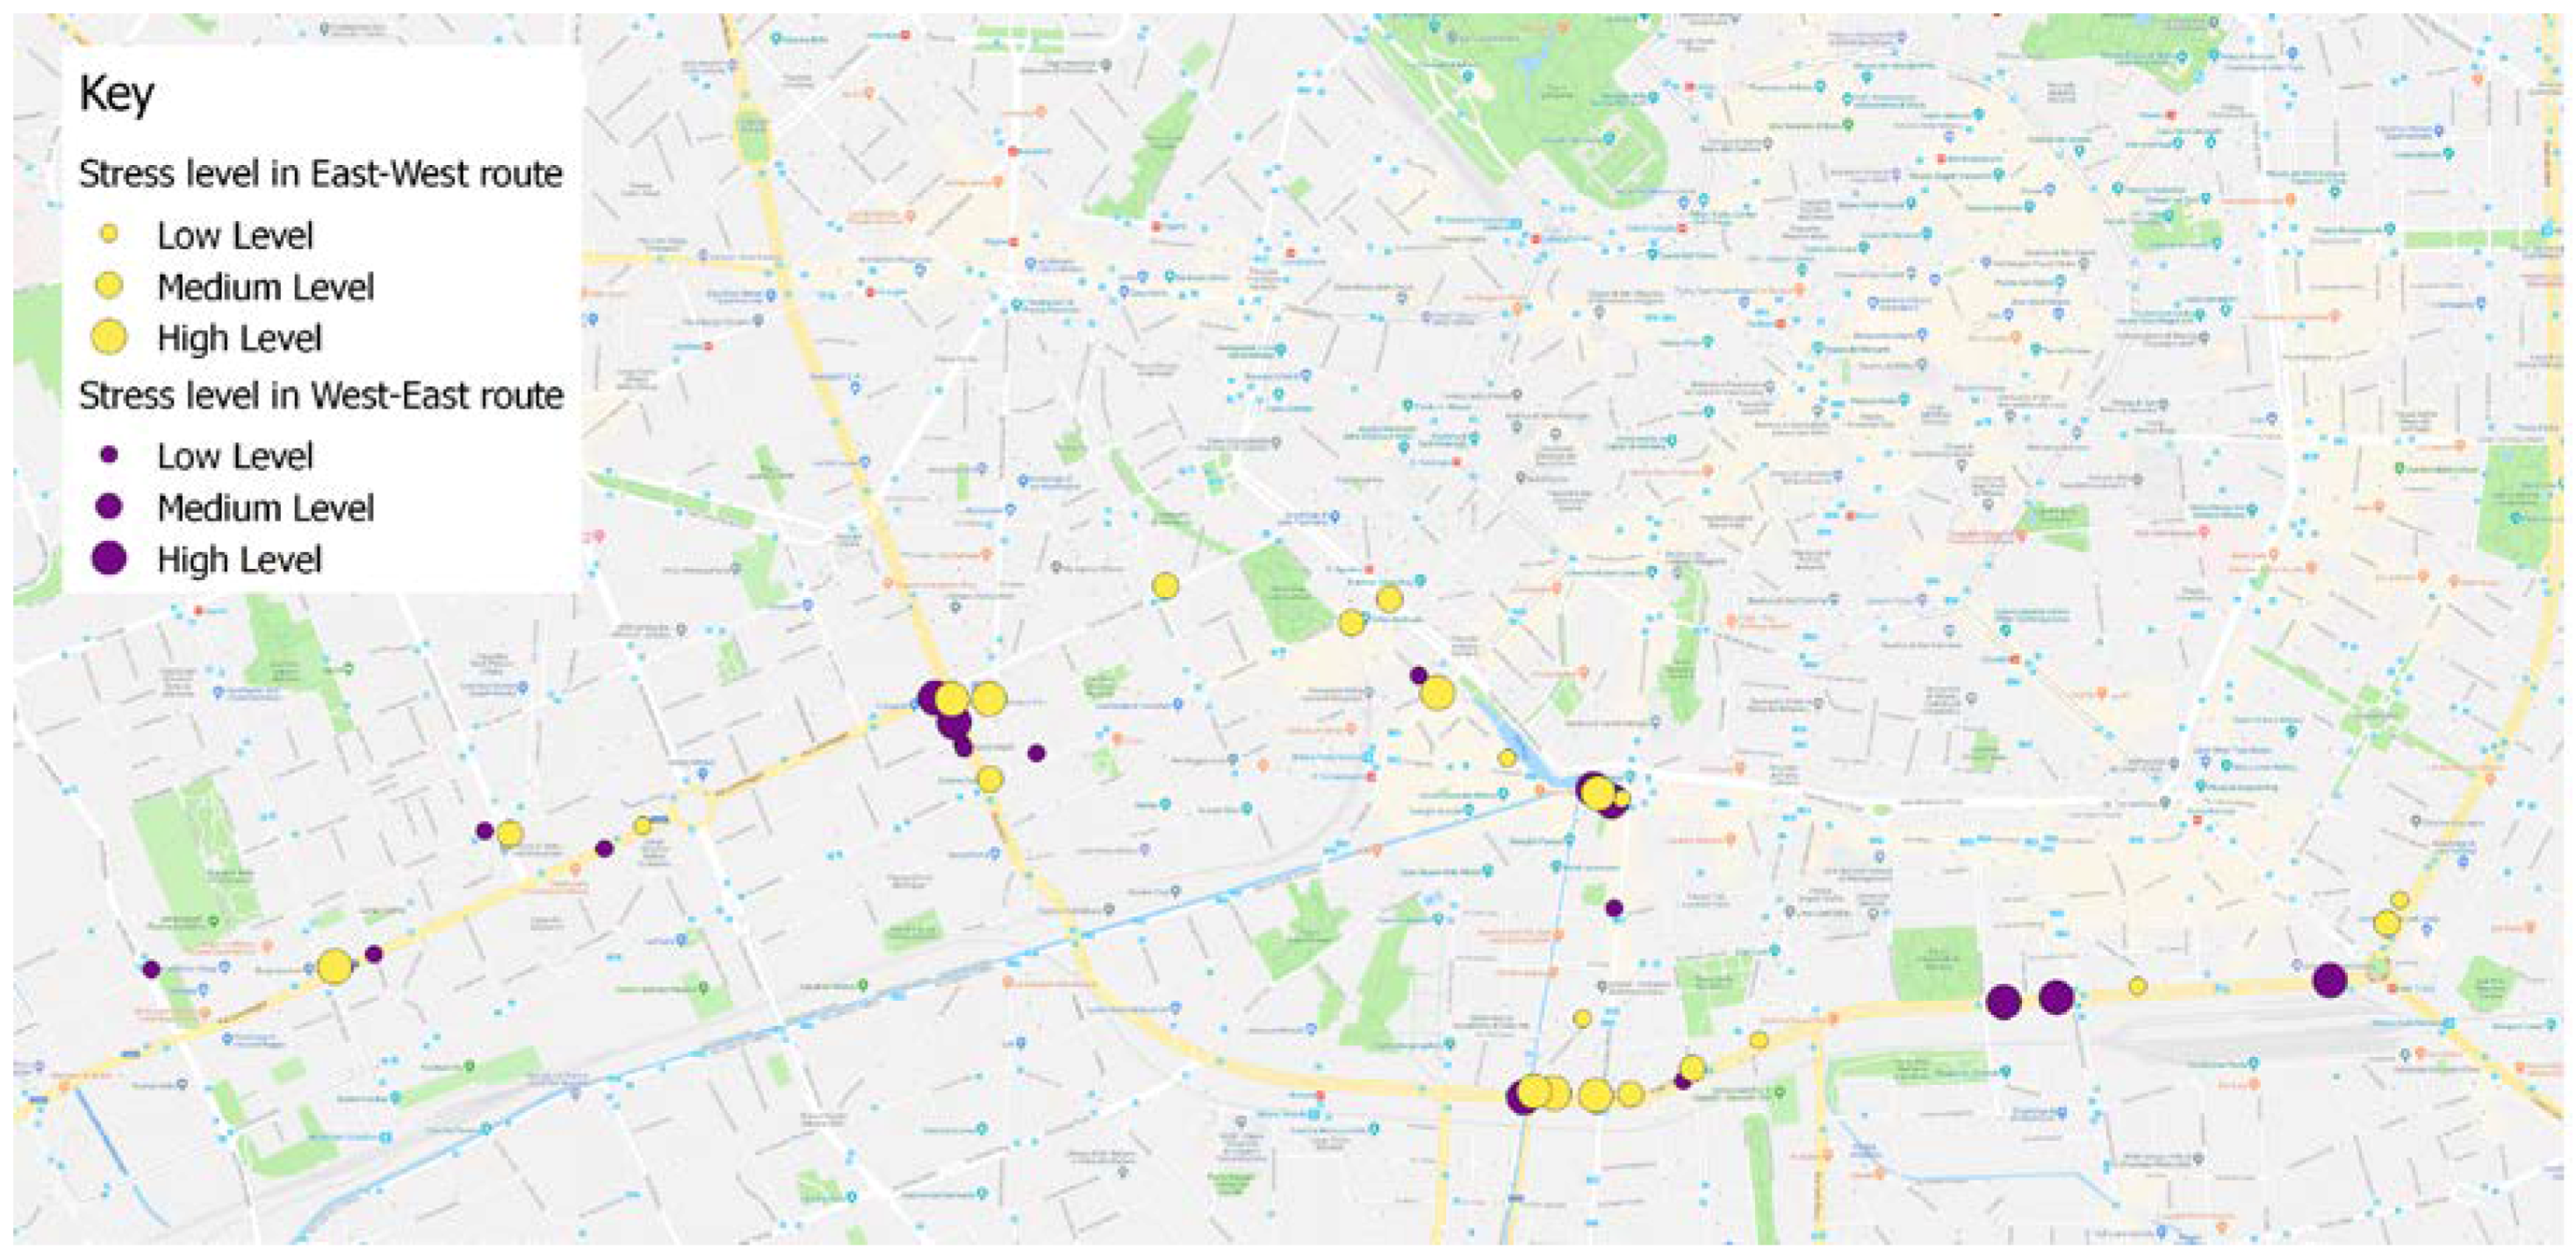
At the end of the first set of tests, after the selection and location of the peak stress points, maps were provided for each driver involved in the test, as shown in
Figure 10.
Three main results were achieved, as follows:
Some of the points identified during the tests were stressful for both involved drivers. Even on the basis of two tests only, it was, therefore, possible to highlight road areas for which it would be advisable to investigate the causes of an increase in stress, so as to carry out possible interventions;
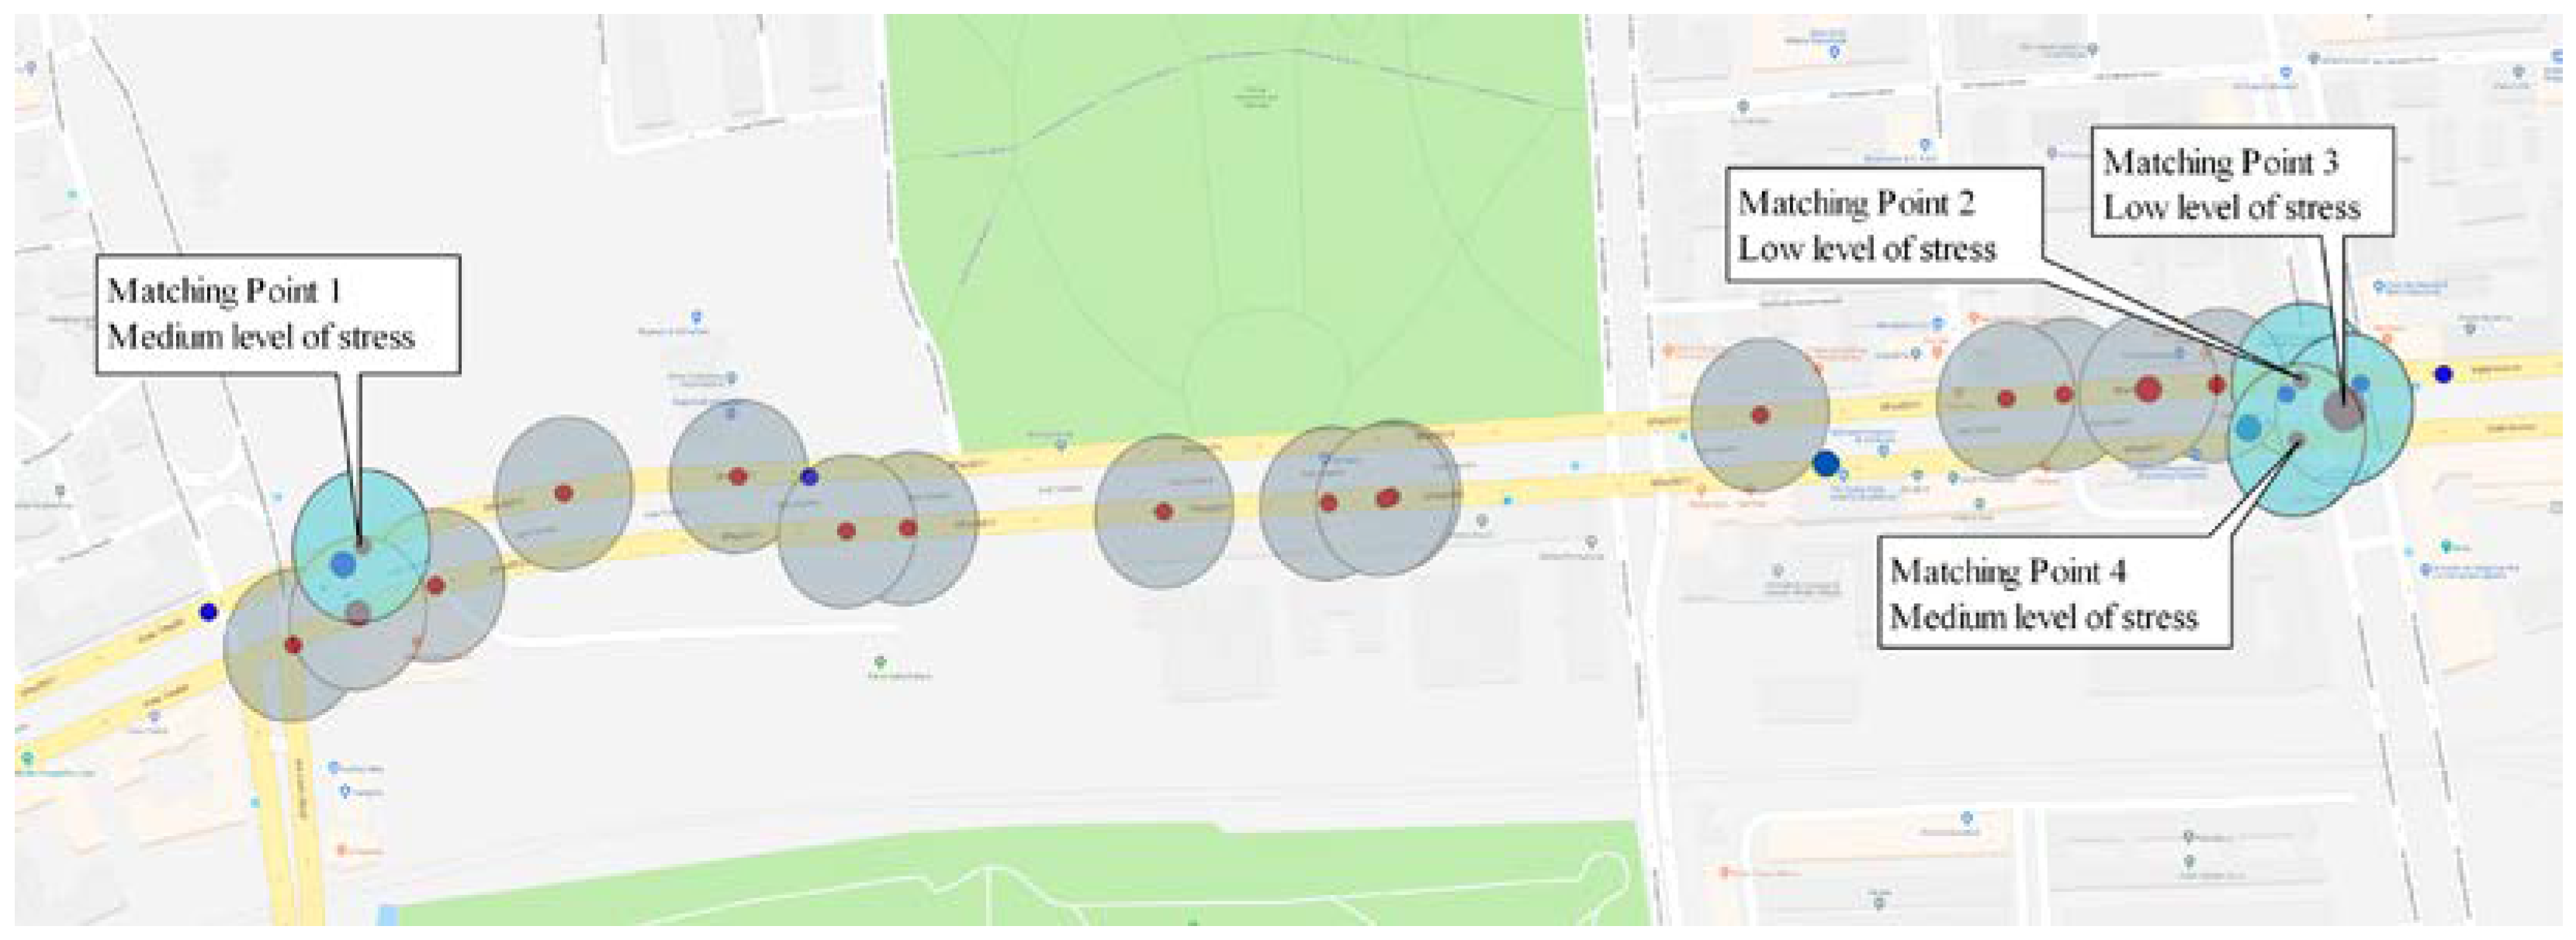
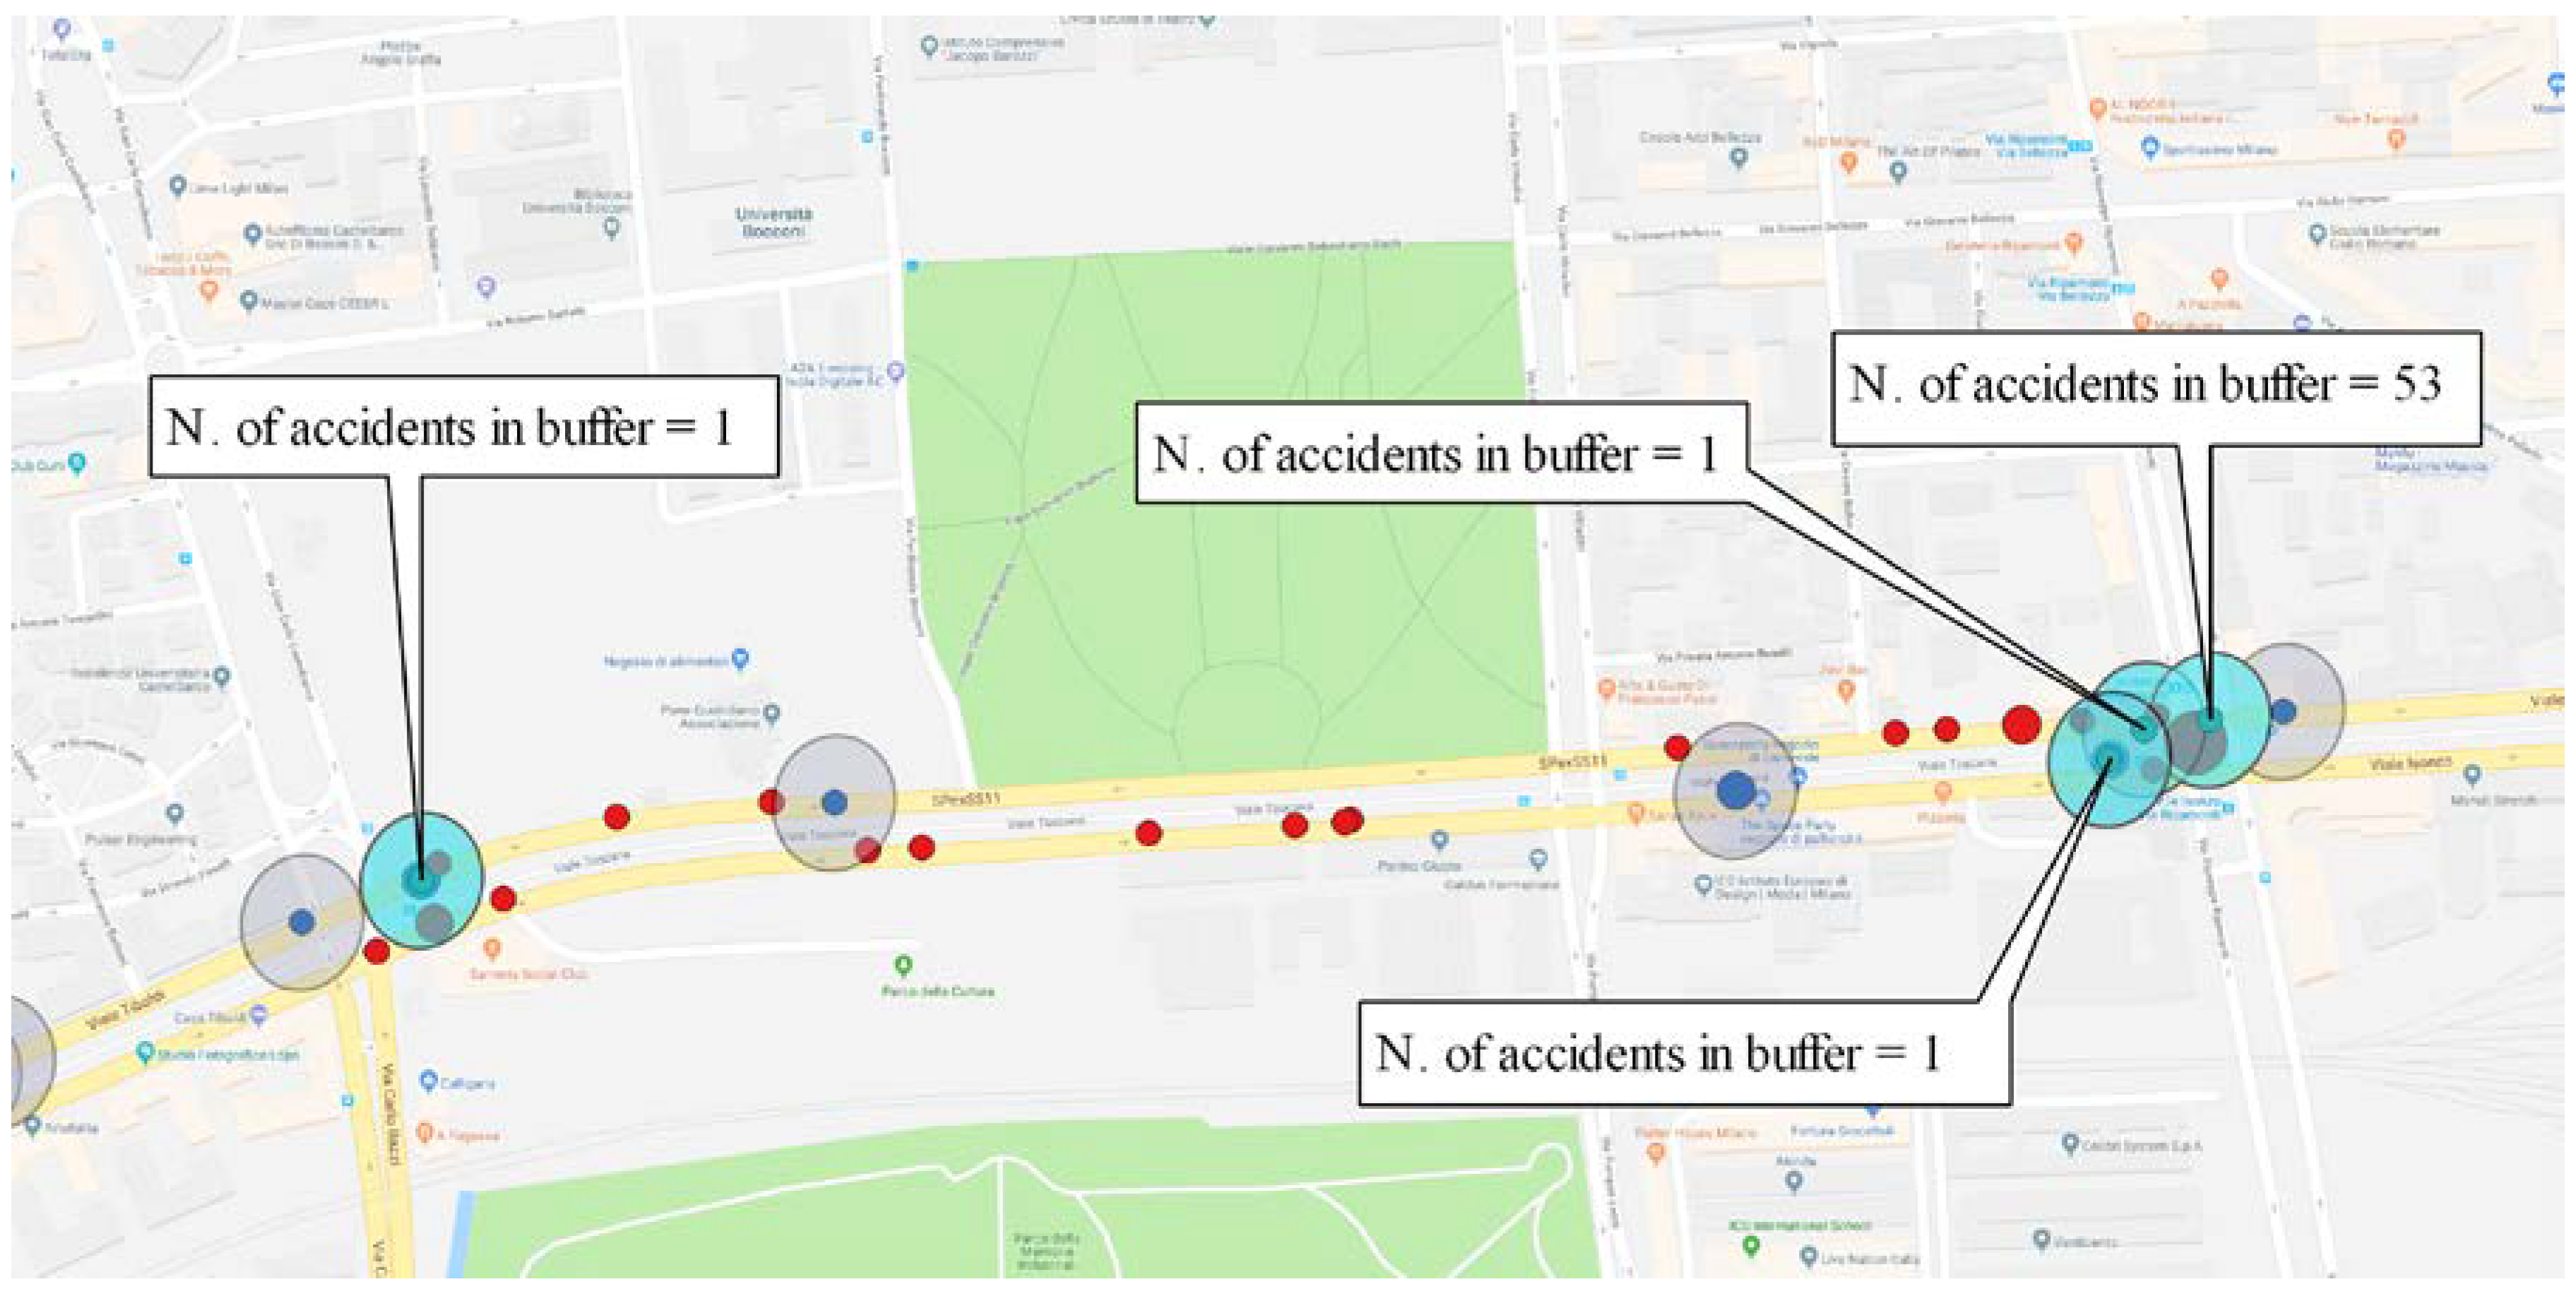
A correlation between stress points and accident points was found. By creating a buffer of 60 m in diameter around the points in which the accident occurred, 50% of the recorded stress points were located within this buffer. On the contrary, considering the same buffer around stress points, the 56% of the points in which the accident occurred were within the defined area. Even considering the limited number of tests, the recorded corresponding values appear as an initial interesting element for the validation of the method.
Figure 11 and
Figure 12 show two examples of results, whereby incidental points are displayed in red and stress peaks in blue. The buffers highlighted in yellow show the areas in which there was a correspondence between stress condition and accidents, while the various dimensions of red and blue points are associated with the different number of accidents or with the different level of stress encountered (low, medium, or high);
The data elaboration highlighted the relevant effect related to the presence of construction sites, road works, and detours along the path investigated. In fact, it emerged that many of the points defined as stressful were located in areas with unclear indications of deviations or with bottlenecks due to the presence of road works.
3.2. Results of the Second Experimental Phase
In this phase, after the division of the path into homogeneous zones and the assignment of levels based on the accident rate and on the levels of stress, it was possible to fill the correlation matrix. This matrix, described in
Section 2.5.1, takes into account all accidents selected. At this time, two important results become evident, as follows:
The outputs highlighted that this second experiment allowed the identification, in a more defined way, of a correlation between stress and accidents. The result obtained made it possible to define a scoring method useful to support the identification of the sections that may require interventions to reduce the risk of accidents.
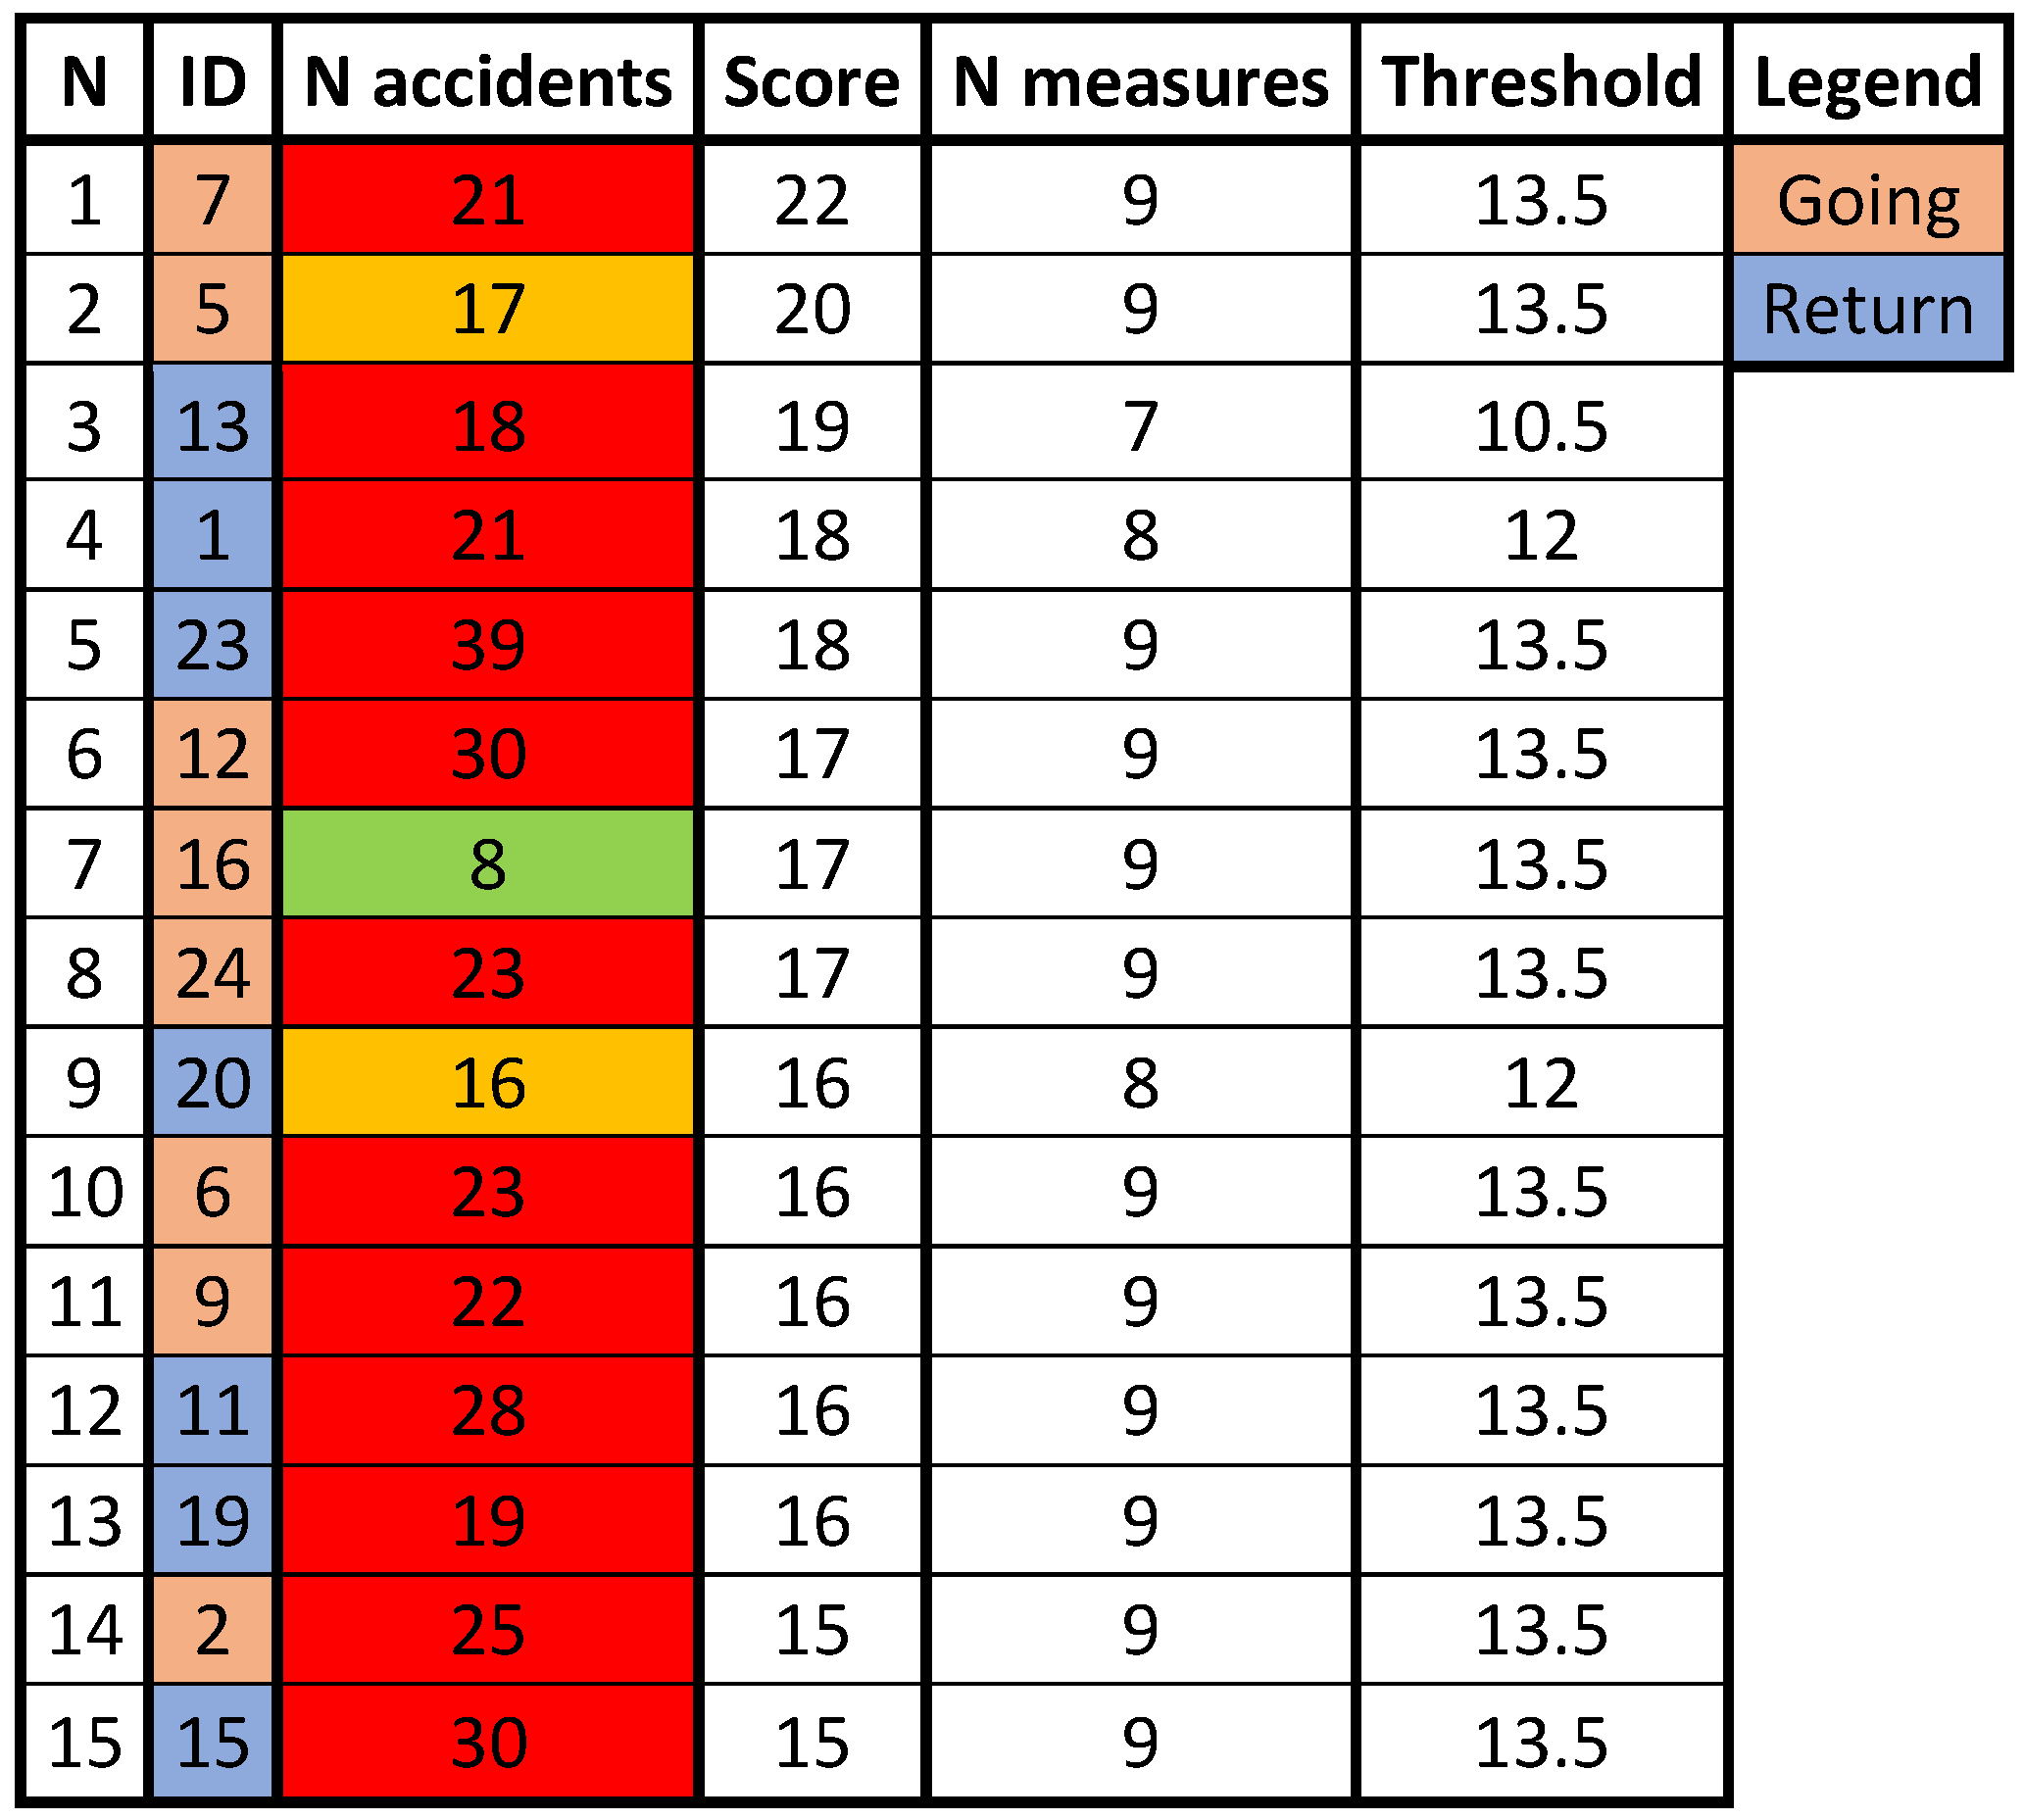
Relying on the scoring method, it was possible to make the two following observations:
Considering the total number of stressful zones (28 zones were classified as stressful), representing 45% of the total zones of the path, it can be observed that, among these, 14 are located in areas with high accident rates. It follows that half of the zones characterized by stress have a direct correspondence with high-accident areas;
By sorting the 62 zones by their respective stress scores, and by selecting the 15 sections with a higher stress score (more stressful), 12 of these areas (80%) were represented by high-accident areas, as reported in
Figure 14.
This represents an appreciable and promising result that shows how this method, referring to the test developed, is able to provide an effective tool to support preventive road safety analysis.
3.3. General Observations
Finally, a mention about the outcomes of the recall test, reported in
Section 2.2, should be provided. By definition, this questionnaire was submitted to the driver at the end of the test, asking him to list and order the most stressful situations met while driving.
By locating the points in which the events declared by the participants occurred, and by consequently identifying the moment or time interval in which they actually happened, it was possible to compare them with the values of the physiological parameters. A good correspondence was recorded between the situations considered stressful by the user and high values of LF, GSR, or RR that defined the stress points selected in the elaboration.
Considering the high subjectivity intrinsic in the compilation of the questionnaire by the participants, the information that could be deduced was considered only as partial or supporting. These data are, thus, not strictly necessary and not sufficiently objective to be used as an effective reference for a study concerning accidents; however, they should be considered useful complementary materials.
4. Discussion
This study intended to define a method of collecting unbiased information on the psychophysical state of the driver, with the aim of investigating the possible correlations between road safety and their emotional state. In particular, this study focused on the possibility that either stressful or particularly relaxing conditions could be correlated with road accidents.
The first phase of the research was oriented to the identification of physiological parameters related to stress, thus defining the methods of collection and comparison, which were later useful to define stress peaks. Data collection showed that the most interesting indicators were the LF component of heart rate variability, the LF/HF ratio (always linked to HRV), and the skin conductance (GSR). Following this introductory phase, two different experiments were carried out on the streets in the city of Milan.
The first experimental phase represented a useful warm-up and made it possible to evaluate and test the tools, as well as revealing how to operate and manage them during the driving phases. At the same time, the test allowed the identification of stress points along a path and a comparison across data collected for each driver. These points were then spatially correlated with the locations where road accidents occurred, previously identified by techniques of road safety analysis. Taking into consideration the areas of linear influence around the incident point, it was found that 50% of the detected stress points also corresponded to incidental points; vice versa, about 56% of the incidental points were a part of the zones of influence around stress points. Another element of interest that emerged from the first experimental phase concerns the rise in stressful conditions associated with the presence of important road works (due to the construction of the new underground line M4). In fact, even during uncongested traffic hours, the user was stressed due to the continuous deviations. In particular, a considerable number of stressful points (identified as such on the basis of the monitored parameters) were recorded where the deviations and the alternative route were not adequately indicated.
The second experimental phase represented a development and a deepening of the first phase; for this part, a significantly different approach was adopted, especially considering the data elaboration step. On the basis of the monitored parameters, it emerged that 38.7% of the cases reported stressful conditions in high-accident areas. On the other hand, the state of relaxation was registered in zones of low accidents in 40.8% of the overall sections considered. These results give an indication of the actual correlation between the psychophysical state of the drivers and the safety conditions. With the development of a scoring method, it was possible to combine the results of all the drivers undertaking the test, eliminating, as much as possible, the elements of uncertainty, and identifying the most stressful areas. Each area was given a score that conveyed information about the level of stress. It emerged that, among the 15 sections with the highest score, 12 of them were also sections with high accident rates. In terms of preventive road safety analysis, it is also possible to proceed by reversing the correlation. Out of 14 high-accident sections, 12 of them were also subject to high stress. This means that, if we want to apply the method for prevention, intervening on 25% of the route (i.e., limiting the possible interventions to a selection of more critical areas from the stress point of view) would identify 80% of the critical areas for car accidents, even without historical data.
Assuming that the emerged relationship between stressful points and accident points also features the routes where no accident historical data is available, the method can prove to be a useful support to preventive analysis on road safety, which is currently mainly oriented toward problems concerning the infrastructure.
The use of wearable devices allowed the collection of the physiological parameters described in
Section 2.1, enabling the effective investigation of the correlation between the psychophysical state of the driver and the results of the accident analysis, and demonstrating how it is possible to integrate, in a more explicit way, the elements related to human behavior within these techniques.
The research gave encouraging results, with many possible future developments. Among the possible investigations, there are those concerning the analyzed parameters and the related tools used for collection and monitoring. The impossibility of collecting second-by-second the values of LF and LF/HF (not just at time intervals) is a limitation that makes it difficult to identify precisely the stressful path areas. Therefore, the association of these parameters with additional elements, such as the GSR, proved to be an effective solution to the problem. Monitoring and gathering additional parameters could contribute to a refinement of the results. For example, of great importance could be the recording of the variation of pupil diameter over time, measurable through eye-tracking devices; this parameter is able to return information about the psychophysical state of the tester [
39,
40], and it would allow obtaining interesting information.
A further development could concern the devices used. These could be designed so as to grant the opportunity for management and synchronization by a simple user as the tester, in order to develop an experiment in which data are collected for weeks or months. The tools should become more user friendly while maintaining the quality standards of the recorded data, which was a feature of the non-commercial devices used in the tests presented. A useful indication for this purpose, even considering issues of user acceptance, can be found in the literature [
32,
41,
42].
The purpose of this work was to investigate whether or not there is a correlation between driver stress and road accidents. The results showed the existence of such a correlation. To deeper investigate this topic, an important future development will surely be an increase in the number of tests and a better characterization of the experiments and testers. In fact, one of the main future goals could be the creation of a database of tests that allows a varied and complete clustering (for example, based on variables such as the time of the day, traffic conditions, road environment, vehicle typologies, driver age, gender, and driving experience) and a cross-check between all these variables.
Also, a study with a more complete correlation could be carried out using accident data collected by insurance companies, which also concern accidents without deaths or injuries. Of notable interest could be to have different kinds of users (such as cyclists and motorcyclists) undertaking the tests, even in contexts different from the urban environment, such as suburban roads or motorways.


