A Heterogeneous Ensemble Approach for Activity Recognition with Integration of Change Point-Based Data Segmentation

1
College of Information, Mechanical and Electrical Engineering, Shanghai Normal University, Shanghai 200234, China
2
College of Information Science and Technology, Donghua University, Shanghai 201620, China
*
Author to whom correspondence should be addressed.
Appl. Sci. 2018, 8(9), 1695; https://0-doi-org.brum.beds.ac.uk/10.3390/app8091695
Submission received: 30 August 2018
/
Revised: 12 September 2018
/
Accepted: 14 September 2018
/
Published: 19 September 2018
(This article belongs to the Special Issue Body Area Networks)
Abstract
:One of the main topics of Smart Home (SH) research is the recognition of activities performed by its inhabitants, which is considered to be one of the bases to foster new technological solutions inside the home, including services to prolong independent living of the elderly. However, current activity recognition proposals still find problems when considering all the different types of activities that can be performed at home, namely static, dynamic, and transitional activities. In this paper, we consider recognition of transitional activities, which is often ignored in most studies. In addition, we propose a novel dynamic segmentation method based on change points in data stream and construct an ensemble of heterogeneous classifiers to recognize twelve activities (of all types). The experiment is conducted on the dataset collected over ten hours by a wearable accelerometer placed on the person’s wrist. The base classifiers selected to form this ensemble are support vector machine (SVM), decision tree (DT) and k-nearest neighbors (KNN). As a result, the proposed approach has achieved an overall classification accuracy equal to 96.87% with 10-fold cross-validation. Moreover, all activity types considered have been similarly well identified.
1. Introduction
Recent advances in wireless sensor network and ambient intelligence technologies have resulted in a rapid emergence of smart environments. Among these, the Smart Home (SH) has gained an increasing attention for its potential in providing enhanced quality of life within the home area. One of the motivations for SH research is the worldwide increase of the aging population, since the elderly have specific health issues that must be considered. This cohort is the focus, even though much of our work is equally applicable for other people who face similar difficulties. If, based on SH, it is possible to detect and interpret what this population do in their homes, we could think about enhancing their quality of life, prolonging independent living and reducing caregivers’ necessary time and healthcare costs in general, without losing the safety that a continuous and unobtrusive monitoring provides. A proper detection and understanding of activities will enable an adequate handling of the inhabitants’ habits promoting the development of more suitable solutions to foster the aforementioned quality of life.
Activities of interest within an SH may include Activities of Daily Life (ADLs) relating to self-care and domestic tasks that are routinely performed by the inhabitant, and ambulatory activities relating to either specific motions or postures of the person. The capacity of the person to perform these activities without assistance can be considered as a reference for the estimation of the independent living level of the elderly [1]. The ADLs include self-care activities, such as sleeping, bathing, dressing, eating, taking medicine, and domestic tasks, such as preparing meals, housekeeping, or watering plants. Ambulatory activities, including sitting, standing and transitional activities (e.g., stand-to-sit), are very useful for detecting the physical activity level, promoting health (e.g., doing exercise) and detecting hazardous situations such as falls. There are different types of these activities, but the common ground to all of them is that they should be recognizable as such by a non-technician. The ability to correctly and automatically identify human activities, has the potential to lend itself to a wide range of application, such as detection of health emergencies [2], recommendation services for correct performance of activity steps [3], professional advice on routine lifestyle [4], anomaly detection [5] or help in treatment prescription [6]. Nowadays there are several devices and platforms available that can provide a good amount of quantitative data related to the activities performed by the SH inhabitants. However, the transitions between multiple activities are usually ignored due to their short duration [7]. These transitions would affect the final performance of activity recognition system since they would be misclassified as the available classes, thus, the reliable translation from the quantitative data to the specific activity being carried out remains a challenging task. In this paper, we focus on recognition of three types of activities (static activity, dynamic activity, and transitional activity) and further improvement of activity recognition performance, which aim to provide more reliable activity recognition system in SH.
There are two main issues preventing the further improvement of activity recognition performance. Firstly, due to the diverse time intervals of three types of activities, the optimal value of the time interval for data segmentation is difficult to define. Too small a time interval may divide one activity into two adjacent windows, which may result in a lack of sufficient information to an accurate activity classification. Too wide a time interval may gather two or more activities into one segment and introduce extra noise. To address this issue, we introduce the change point detection method to divide the data stream adaptively, the change point refers to the time point that can be identified in which the characteristic of a model is subject to sudden change at previous time interval. Secondly, the single classifier has limited ability to classify the instances for all activity classes. Therefore, combining the proper various base classifiers can make use of their own strengths and improve the classification performance.
In this paper, a heterogeneous ensemble approach by combining various base classifiers is proposed to improve the activity recognition performance. The main contributions of this paper are:
- Design an experiment protocol to collect data of static activities, dynamic activities as well as transitional activities by using a small, low-cost, and non-intrusive wrist-worn accelerometer. The data are collected from a group of participants in a real home setting scenario.
- Propose a change point-based segmentation method to dynamically identify a window’s starting point and end point such that it contains the same activity samples.
- Build an ensemble classification model by combining various base classifiers using majority voting combination function. The selection of base classifiers is based on the analysis of the classification performance on activity classes.
The rest of the paper is organized as follows: Section 2 introduces the related work in activity recognition area. Section 3 describes the experiment protocol and data collection. Section 4 concentrates the methods adopted in the development of the heterogeneous ensemble activity recognition approach including signal preprocessing, feature extraction, and ensemble classifier construction. Section 5 discusses experimental results and performance on activity recognition. Section 6 provides the conclusions and future work.
2. Related Work
Researchers have made significant progress in human activity recognition by using wearable accelerometer. Another issue in most current literature is that transitions between multiple activities are usually ignored due to their short duration. If this issue is not addressed properly, these transitions would affect the final performance of activity recognition system since they would be misclassified as the available classes. Ortiz et al. [8] proposed a transition-aware human activity recognition system for the recognition of six physical activities (walking, walking upstairs, walking downstairs, sitting, standing and lying) and six transitional activities (stand-to-sit, sit-to-stand, sit-to-lie, lie-to-sit, stand-to-lie and lie-to-stand) using the accelerometer embedded in a smartphone. The result showed the support vector machine could achieve high classification accuracy with heuristic filtering approach. Zhang et al. [9] proposed an offline unobtrusive system for monitoring basic activities as well as a joint class of posture transitions. A novel hierarchical classification that combines rule-based reasoning with support vector machine was adopted rather than using a single classifier. Due to the very short duration of transitional activities compared to static activities and dynamic activities, the proper selection of segmentation techniques has great potential impact on the success of feature extraction and classification algorithms, directly resulting in the accuracy of activity recognition.
The sliding window-based segmentation method is probably the most common used segmentation method for activity recognition. It adopts either fixed window size or dynamic window size to divide the continuous sensor data stream into segments. To determine the most appropriate sliding window size, Achumba et al. [10] conducted an experiment to compare the activity classification performance of different sliding window segmentation methods with diverse window overlap values varying from 0% to 90%. Their study illustrated that the 90% overlapping sliding window segmentation with window size of 12 s contributed the optimal activity recognition accuracy of 98.38%. Dynamic sliding windows segmentation method employs differing window sizes on activity duration based on different sensor features. Noor et al. [11] presented a novel approach for dynamic sliding window technique applied for recognition of static activities, dynamic activities as well as transitional activities. The proposed approach specified a small initial window size which enables to segment dynamic and static activity signals, and then expanded the window size to accommodate signal which is longer than the initial window size. Krishnan et al. [12] combined the static and dynamic sliding window sizes and improved the sliding window segmentation method by obtaining the adaptive size of the window depending on the environment, the sensor data, and the monitored activity, to cope with the sensor events within one window and between adjacent windows. Generally, the sliding window-based segmentation method has the advantage of low computation complexity so that is suitable for continuous sensor data stream over a long period of time. However, the determination of the optimal value for the window size remains a critical issue. Too small window size may divide one activity into two adjacent windows and result in the loss of effective information, especially for the activity with long duration, such as cooking. Too wide window size may combine two or more activities into one window and introduce extra noise for accurate activity classification. The novelty of this paper lies in dynamically detecting change points in data stream and subsequently using these change points as window start position and end position.
Data-driven approaches have been widely used in accelerometer data analysis for activity recognition. These approaches commonly adopted machine learning algorithms and can be categorized into three types: generative approaches, discriminative approaches, and heuristic approaches [13]. Generative approaches, such as naïve Bayes [14] and hidden Markov model [15], are flexible, capable of dealing with uncertainty in the data. However, they suffer from the requirement of a large amount of data for training. Discriminative approaches, such as decision tree (DT) [16], K-nearest neighbor [17], conditional random fields [18], support vector machine (SVM) [19] and artificial neural network [20], learn the features mappings to activity labels by creating the decision boundaries in the feature space. For example, DT classification models have been successfully adopted for separating static activities from dynamic activities [21]. In terms of dealing with more complex activates, SVM and artificial neural network classification methods have been concerned due to their capability of separating non-linearly separable classes [22]. Recent literatures have witnessed the increasing application of deep learning on activity recognition task [23]. They have advantages of robustness in prediction and computationally efficient; however, they face the problem of overfitting. Heuristic methods use a combination of both, which can generally achieve better performance than any single one [24]. In addition, recent results in addressing multi-class classification problems has indicated that the adoption of ensembles of classifier models leads to increased classification performance over using only single classifier models [25]. However, much of the previous work on ensembles of classifier models considered only the same type of classifier models [26]. The single classifier has its own strengths as well as weakness when dealing with the different classes during the learning process. Moreover, the voting of various algorithms can decrease the bias among the classes occurring in the usage of a single learning algorithm, therefore result in a relatively generalized classification [27]. In this study, we focus on heterogeneous ensemble of classifiers, which consist of classifiers are not of the same type. Our goal is to determine if heterogeneous ensemble can be used to improve the classification performance by combining various classifiers though the analysis of their classification performance on different activity classes. Our approach is based on an ensemble of heterogeneous classifiers. We have created a dataset with measurements related to different activities (of all types, including transitional activities) and have compared the performance of using isolated classifiers with several topologies of ensemble classifiers.
3. Data Collection
In this section, the experiment design and data acquisition process are presented in order to obtain the acceleration dataset of twelve activities in SH. The acquired dataset is then annotated manually for the following classification tasks.
3.1. Experiment Design
The purpose of this study is recognizing activities that are commonly taking place in real daily life and necessary in taking care of oneself independently. Thus, twelve activities, that can be mainly categorized into three types—static activities, dynamic activities, and transitional activities—are considered in experiment design. The static activities, such as watching TV and sleeping, and dynamic activities, such as sweeping and running, are not limited by performed duration. Transitional activities, such as sit-to-lie and lie-to-sit, are usually taken place within a limited performed duration, they are characterized by start time and end time which vary slightly from one person to another [28]. Based on this, static activities and dynamic activities can be designed to perform continuously, while transitional activities can be designed to execute repeatedly to get separately samples. Twelve activities that purposed to be recognized in this study are: standing, sleeping, watching TV, walking, running, sweeping, stand-to-sit, sit-to-stand, stand-to-walk, walk-to-stand, lie-to-sit and sit-to-lie. Table 1 shows the brief description of the twelve activities into three types performed in the experiment.
Ten participants (7 males and 3 females) are recruited to take part in the experiment from the University of Ulster. The participants are guided to perform the twelve activities by following the experiment protocol in the home area of smart lab. A tri-axial accelerometer embedded into a custom wrist-belt is attached at each participant’s left wrist. This placement is selected since it is unobtrusive and comfortable for the participant and is one of the most common locations to place accelerometers in activity monitoring research [29]. Previous research has proven sensors attached at the wrist provide relatively high rates of accuracy and sensitivity for fine grain activities [30]. The Shimmer wireless sensor platform is used to record and collect the raw signals. Due to the small size and light weight, The Shimmer wireless sensor platform can be worn by the users comfortably and appropriate for long-term monitoring during the users’ activity performance. It contains an on-board tri-axial accelerometer, with a configurable sampling rate up to 1 kHz and an amplitude range up to ±6 g [31].
The experiment protocol consists of guiding participants to perform a sequence of twelve activities (as listed in Table 1) by using voice instruction of the researcher. Participants are guided which activity to execute but not restricted the way to perform, which ensures the natural variability during the experiment execution. For static activities, each participant is guided to execute standing in the home area, sleeping on the bed, and watching TV in the home area with the posture that they feel comfortable. For dynamic activities, each participant is guided to execute walking in the home area, running on treadmill with a set speed, as well as sweeping by using the vacuum cleaner. All static and dynamic activities are executed for 5 min. For transitional activities, each participant is guided to execute stand-to-sit and sit-to-stand for 45 s (repeated 15 times), stand-to-walk and walk-to-stand for 45 s (repeated 15 times), lie-to-sit and sit-to-lie for 45 s (repeated 15 times), respectively. The whole experiment takes more than one hour for each participant to finish.
3.2. Data Collection and Annotation
Acceleration dataset are collected in the smart lab located in Ulster University. Prior to data collection, the device is calibrated when placed in orthogonal orientations by using standard calibration techniques described in [32]. Raw acceleration dataset is collected with a sampling rate of 102.4 Hz and an amplitude range of ±2.0 g (g = 9.8 m/s2). Previous work has shown that human activities can be captured by signals below 18 Hz [33]. Therefore, the sampling rate of 102.4 Hz is more than enough for capturing activities of daily living as well as transitional activities. The sensed data are stored in the format of {time, acceleration-x, acceleration-y, acceleration-z}. Consequently, the raw acceleration dataset is collected over ten hours, which contains 4,020,288 data samples.
The acquired data are then annotated with activity class according to the voice instruction, then labeled with start time and stop time of each activity manually. Previous study has demonstrated that transitional activities usually occur during the time interval from 1.45 s to 3.49 s [34], thus, take the relatively short duration of the transitional activity and the possible delay in the activity execution when following the verbal command from the researcher into consideration, 4 s is used as activity duration to label the transitional activities that ensures to cover the whole transitional phase of an activity. As a result, 2160 s dataset is labeled with twelve activity classes, which can be used in activity classification tasks later.
4. Methodology
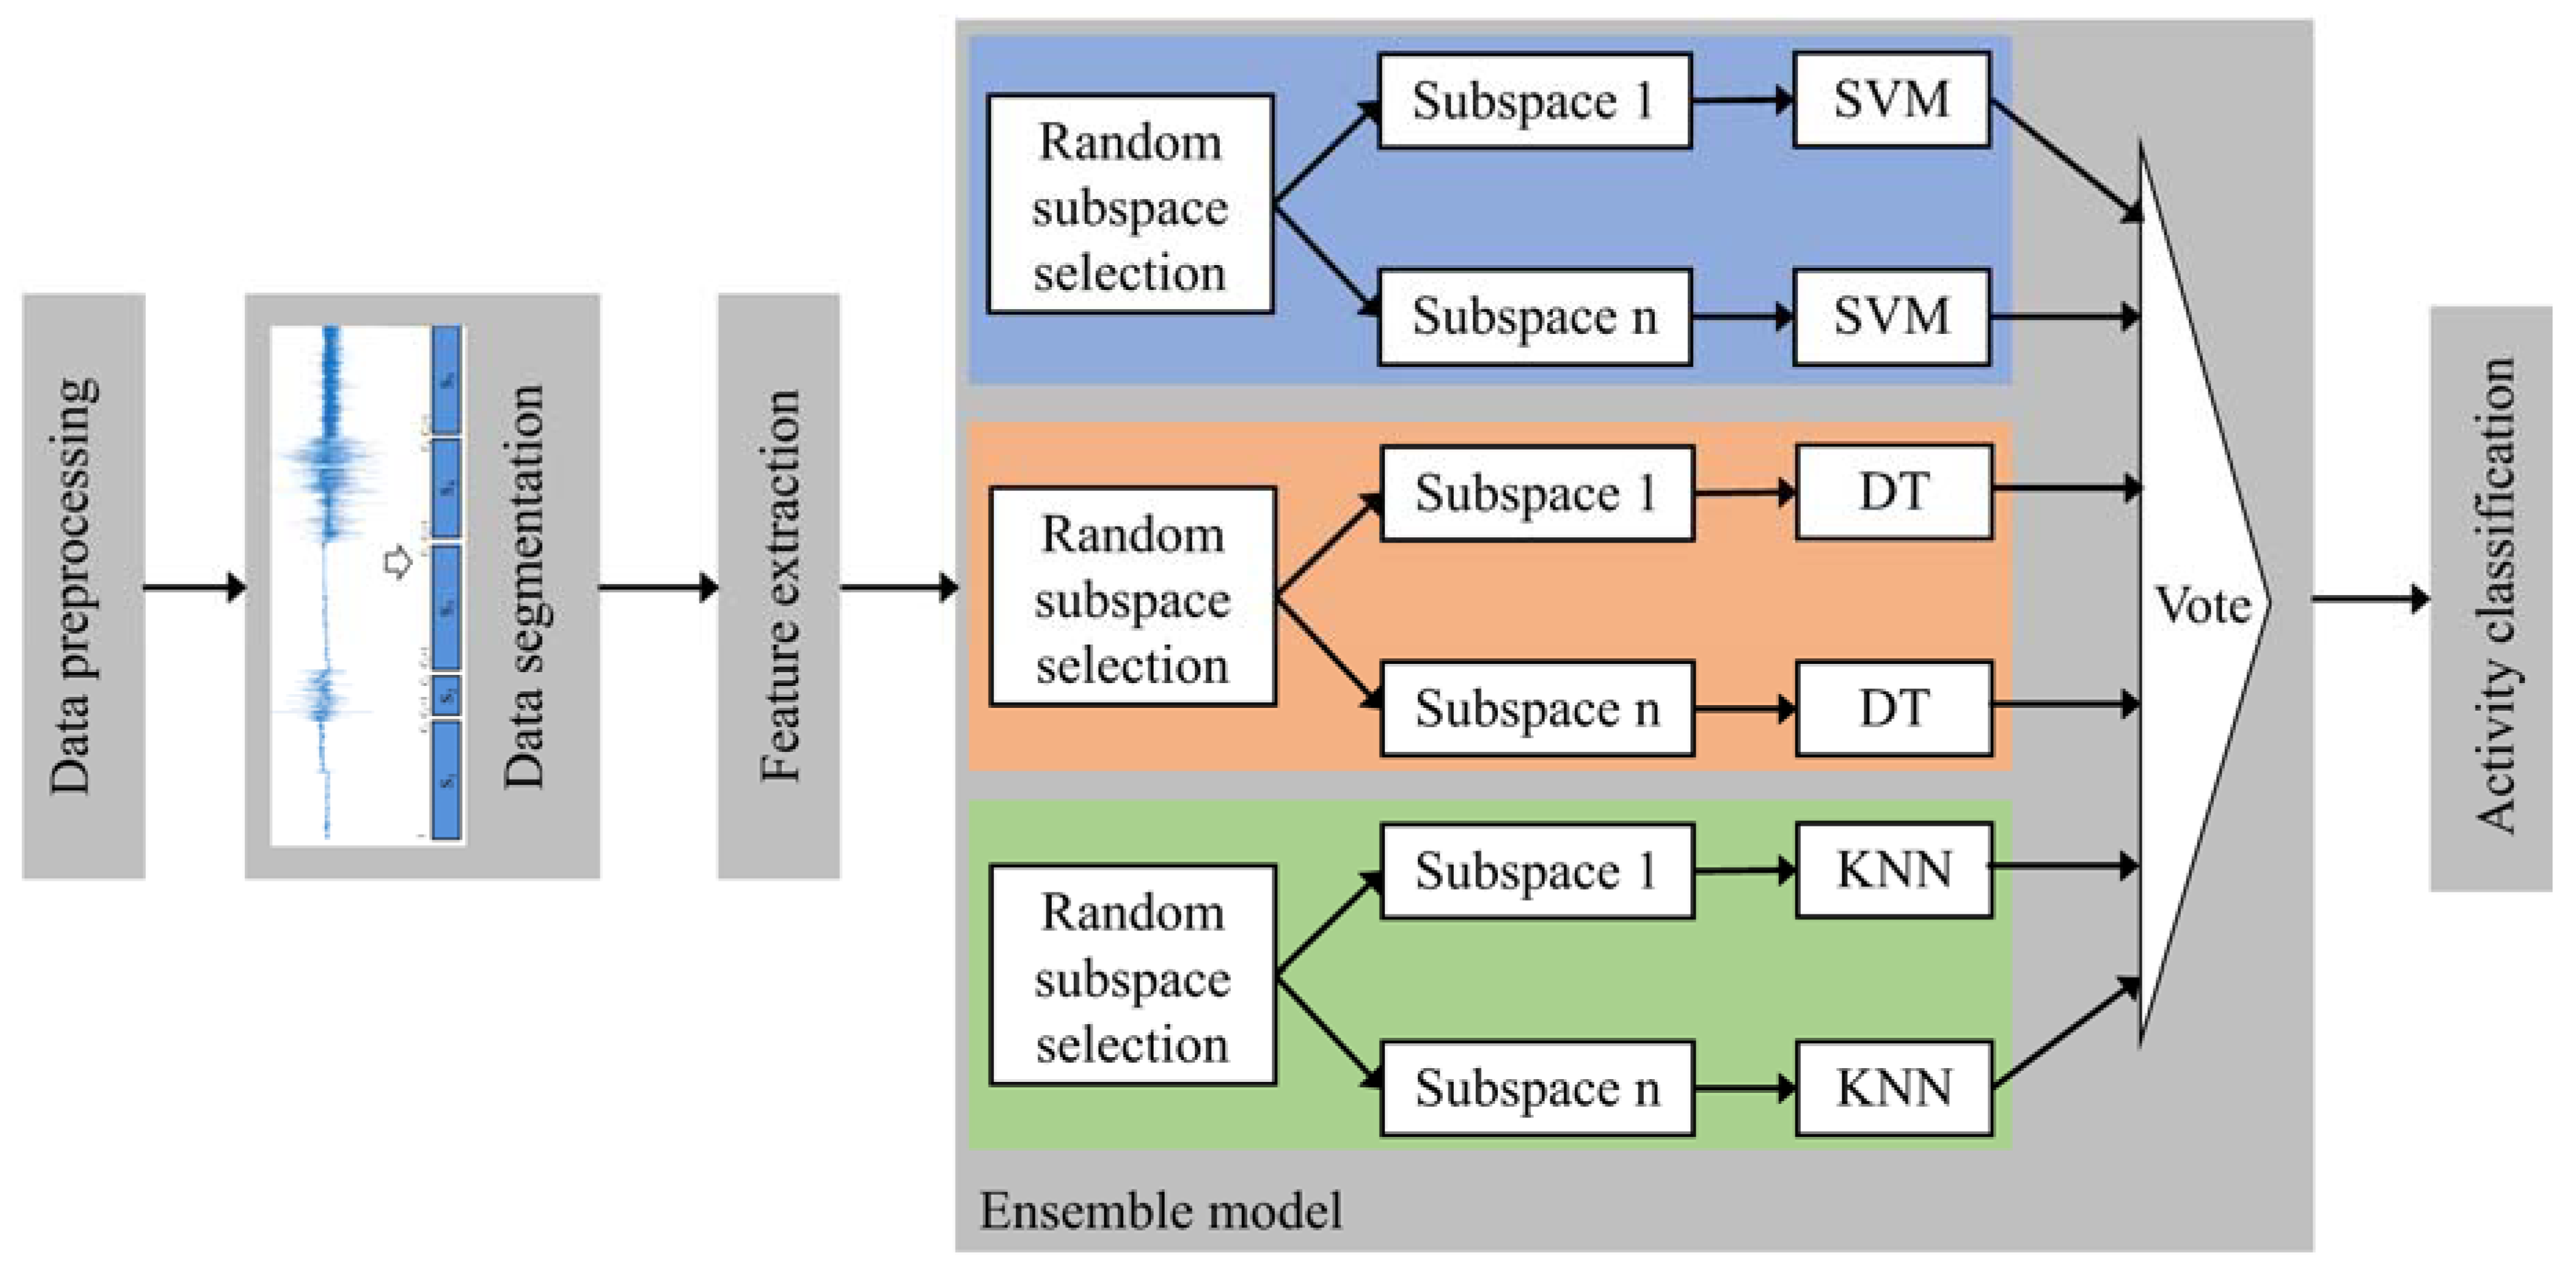
The collected acceleration dataset from the wrist wearable accelerometer are processed and analyzed using MATLAB R2018a (MathWorks, Natick, MA, USA). Figure 1 depicts the computational procedure of the proposed ensemble classification approach. The raw signals are firstly preprocessed to remove the noise and to separate the body acceleration from gravity acceleration. Then the time-series signals are segmented into windows by using the change point-based segmentation method, each window is extracted as an input of 77 features. Afterwards, the heterogeneous ensemble classification model is constructed by combing the heterogeneous base classifiers with the majority voting combination function.
4.1. Data Preprocessing
In general, the acquired raw dataset contains unwanted noise, which may be introduced by either external vibration or movement of the sensor against the body due to loose coupling. Essentially, all measured body movements are contained within frequency components below 20 Hz [35], thus, we use a third-order low-pass Butterworth filter to remove the high frequency noise with cutoff frequency at 20 Hz. Afterwards, the dataset is filtered by a third-order median filter to remove abnormal noise spikes.
4.2. Data Segmentaion
After data preprocessing, the data stream, which consists of the body acceleration component, gravity acceleration component and the activity labels, is divided into windows by adopting the change point-based segmentation method. The novel segmentation method is clarified as a two-step procedure (as shown in Algorithm 1), which aims to map the accelerometer data segment with the corresponding activity label to the most accurate extent (detailed in [36]).
| Algorithm 1. Chang Point-Based Data Segmentation. |
| Input: Acceleration data stream Output: A set of segments of ,
|
At the first step, the proposed change point-based segmentation method is developed based on the Multivariate Online Change detection Algorithm (MOCA) to detect transitions through the multivariate data stream, and the aim of change point detection is to identify transitions in a user’s activity so that determining the starting position of windows [37]. MOCA detects change points autonomously through an input data stream as follows: consider an input data stream of length , which consisting of a set of sensor observations . Each sensor observation is treated as one element vector, here, donates the number of sensor observations for each activity. The input data stream may include sensor observations with multiple distributions, for instance, may follow data distribution while may follow data distribution . Therefore, the overall goal of the algorithm is to identify the position in the input data stream of significant change points .
Let represents the sensor observations in the acceleration data stream acquired from the wearable accelerometer. The result of MOCA is a set of change point indices, With the assumption that there exists a maximum of one change point per window, an analysis window of length is passed over the input data stream. The movement of the analysis window passing over the input data stream may be distinct, for example, the start position of a new window is at ( donates the padding size and donates the number of previous windows). Conversely, the sliding window may be implemented with the start position that increased by a predetermined number of sensor observations. The sensor observations within a window are donated as despite their original position within the input data stream. Following the padding method described in [38], the side of the analysis window with sensor observations is padding so that the analysis window contains sensor observations with a total number of . This padding guarantees enough data to calculate the summary statistics at the window extremities, as well as results in a minimum latency of sensor observations when executing a distinct window version of the algorithm.
Within each window, an index variable, , is slid to subsequently calculate the summary statistics of the component distributions before and after . Particularly, we calculate the means of data samples, and , as well as variance-covariance matrices, and , which include the variance of data samples in the diagonals and the covariance in the off-diagonals. Having computed summary statistics before and after , the statistic at position , , is calculated according to Equation (1), where donates the number of variables and donates the Hotelling T-squared statistic (calculated as Equation (2)), donates the pooled variance-covariance matrix (calculated as Equation (3)). The point which maximises is finally selected as the most likely change point within a window.
At the second step, the data steam is formally divided into segments of , , in accordance with the indices of change points. As a result, the segment contains the sensor observations .
4.3. Feature Extration
Based on segmented data, the feature vector composed of time-domain features and frequency-domain features is extracted on each window. The features are extracted by calculating on three values of x-axis, y-axis, and z-axis of both body acceleration component and gravity acceleration component. Moreover, the signal magnitude vector (SMV) is also used to extract features since the SMV offers a measurement degree of activity intensity [39].
The widely used time-domain features including mean, standard deviation, root mean squared, median absolute deviation and correlation coefficient, are also used in this work [40]. In addition, the signal magnitude area (SMA), which provides the energy expenditure when performing the activities [41], and tilt angle, which offers the informative knowledge of the user orientation, are also used in our study. The SMA can be used to distinguish a rest state and dynamic activity, and the tilt angle is useful for transitional activities classification. The frequency-domain features used in this study include spectral energy, spectral entropy, kurtosis, skewness, signal weighted average and largest frequency component. Both time-domain features and frequency-domain features are extracted from x-axis, y-axis, z-axis and SMV of body acceleration component and gravity acceleration component. Table 2 shows the list of 77 features extracted in this study.
4.4. Ensemble Model Construction
The ensemble classifier model within in the activity recognition framework is constructed by following a two-step procedure. The first step is to determine the diverse and accurate set of base classifiers by comparing the performance of various single classifiers on twelve activities classification. In this step, the extracted features are randomly selected to form the feature subspaces, using a small training dataset rather than all feature as input to the classifier can avoid overfitting problem and reduce the computation load. To construct the ensemble model, five commonly used classifiers: decision tree (DT), support vector machine (SVM), k-nearest neighbors (KNN), neural network (MLP) and naïve Bayes (NB), are considered as ensemble members [42] These six classifiers are selected since they belong to different classifier types, which have different internal representations and biases. The different outputs of the base classifiers represent the extent to which they disagree about the probability distribution for the test data. This diversity would result in the disagreement with each other over the instances covering a range of feature space.
The second step is to combine the base classifiers into the heterogeneous ensemble model by using combination functions. The combination functions make the best use of the information gained from the base classifiers for producing class labels predictions as accurate as possible. There are two general categories of combination functions: fusion function and selection function. Since the output of the selection function typically relies on the characteristic of data instance whose class is being predicted, which is not suitable in our work. We select majority voting function (defined as Equation (4)), which is a typical fusion function, to combine the outputs of base classifiers. In majority voting, the outputs from base classifiers are treated as votes on the predicted class, and the prediction with the most votes is outputted as the final predicted class of the ensemble model.
As a result, 3 base classifiers (RF, KNN and DT) are selected to generate the ensemble model. The predictions of these four classifiers, which are the results of 3 algorithms applied on 12 class distribution datasets, are finally voted to get the final classification result.
5. Results and Discussion
To evaluate the classification performance of the proposed change point-based segmentation method, we conducted the performance comparison with the common used non-overlapping segmentation method and 50% overlapping segmentation method. The preprocessed dataset was divided into windows. Here, both non-overlapping segmentation method and 50% overlapping segmentation method used 2.56 s as the sliding window size. Afterwards, the features extracted from segmented windows are used as input to classifier. We investigated and compared the performance of various classifiers: SVM, KNN, DT, artificial neural network (MLP) and naïve Bayes (NB), on three segmented datasets with the 10-fold cross-validation. To evaluate the performance of proposed ensemble model, we used the following metrics: (1) Accuracy: the probability that an activity is identified the same as the ground truth. (2) Sensitivity: the probability that actual positives are correctly identified. (3) Specificity: the probability that actual negatives that are correctly identified. (4) F-measure: the measure of a test’s accuracy.
The average accuracy of five classifiers on three segmented datasets were showed in Table 3, and the performance of DT was used as the baseline for comparison. The performance of RF contributed the highest accuracy of 94.21% on the segmented dataset obtained by using change detection-based segmentation, which significantly better than the baseline, even higher than the highest accuracy obtained from [12]. The classification results of MLP and NB were not good (72.21% and 63.45, respectively), even worse than the baseline. In terms of each segmented dataset, the average accuracy of change point-based segmentation method, 50% overlapping segmentation method and non-overlapping segmentation method by applying SVM classifier were 94.21%, 92.87% and 90.54%, respectively.
Figure 2 depicted the sensitivity of each activity class obtained by applying SVM classifier on three segmented datasets. Generally, both non-overlapping segmentation method and 50% overlapping segmentation method performed well in identifying static activities and dynamic activities, while performed less well in identifying transitional activities, probably due to the durations of transitional activities were relatively short, the windows segmented by using non-overlapping segmentation method and 50% overlapping segmentation method contained more than one activities, resulting in misclassification of the transitional activities. The results indicated that change point-based segmentation method achieved better performance in terms of both overall classification accuracy and the specific classification accuracy of transitional activities. However, compared to static activities and dynamic activities, change point-based segmentation method still had the relatively worse performance on identifying transitional activities. Thus, we adopted ensemble model with random feature subspace to enhance the performance on transitional activities classification in the next steps.
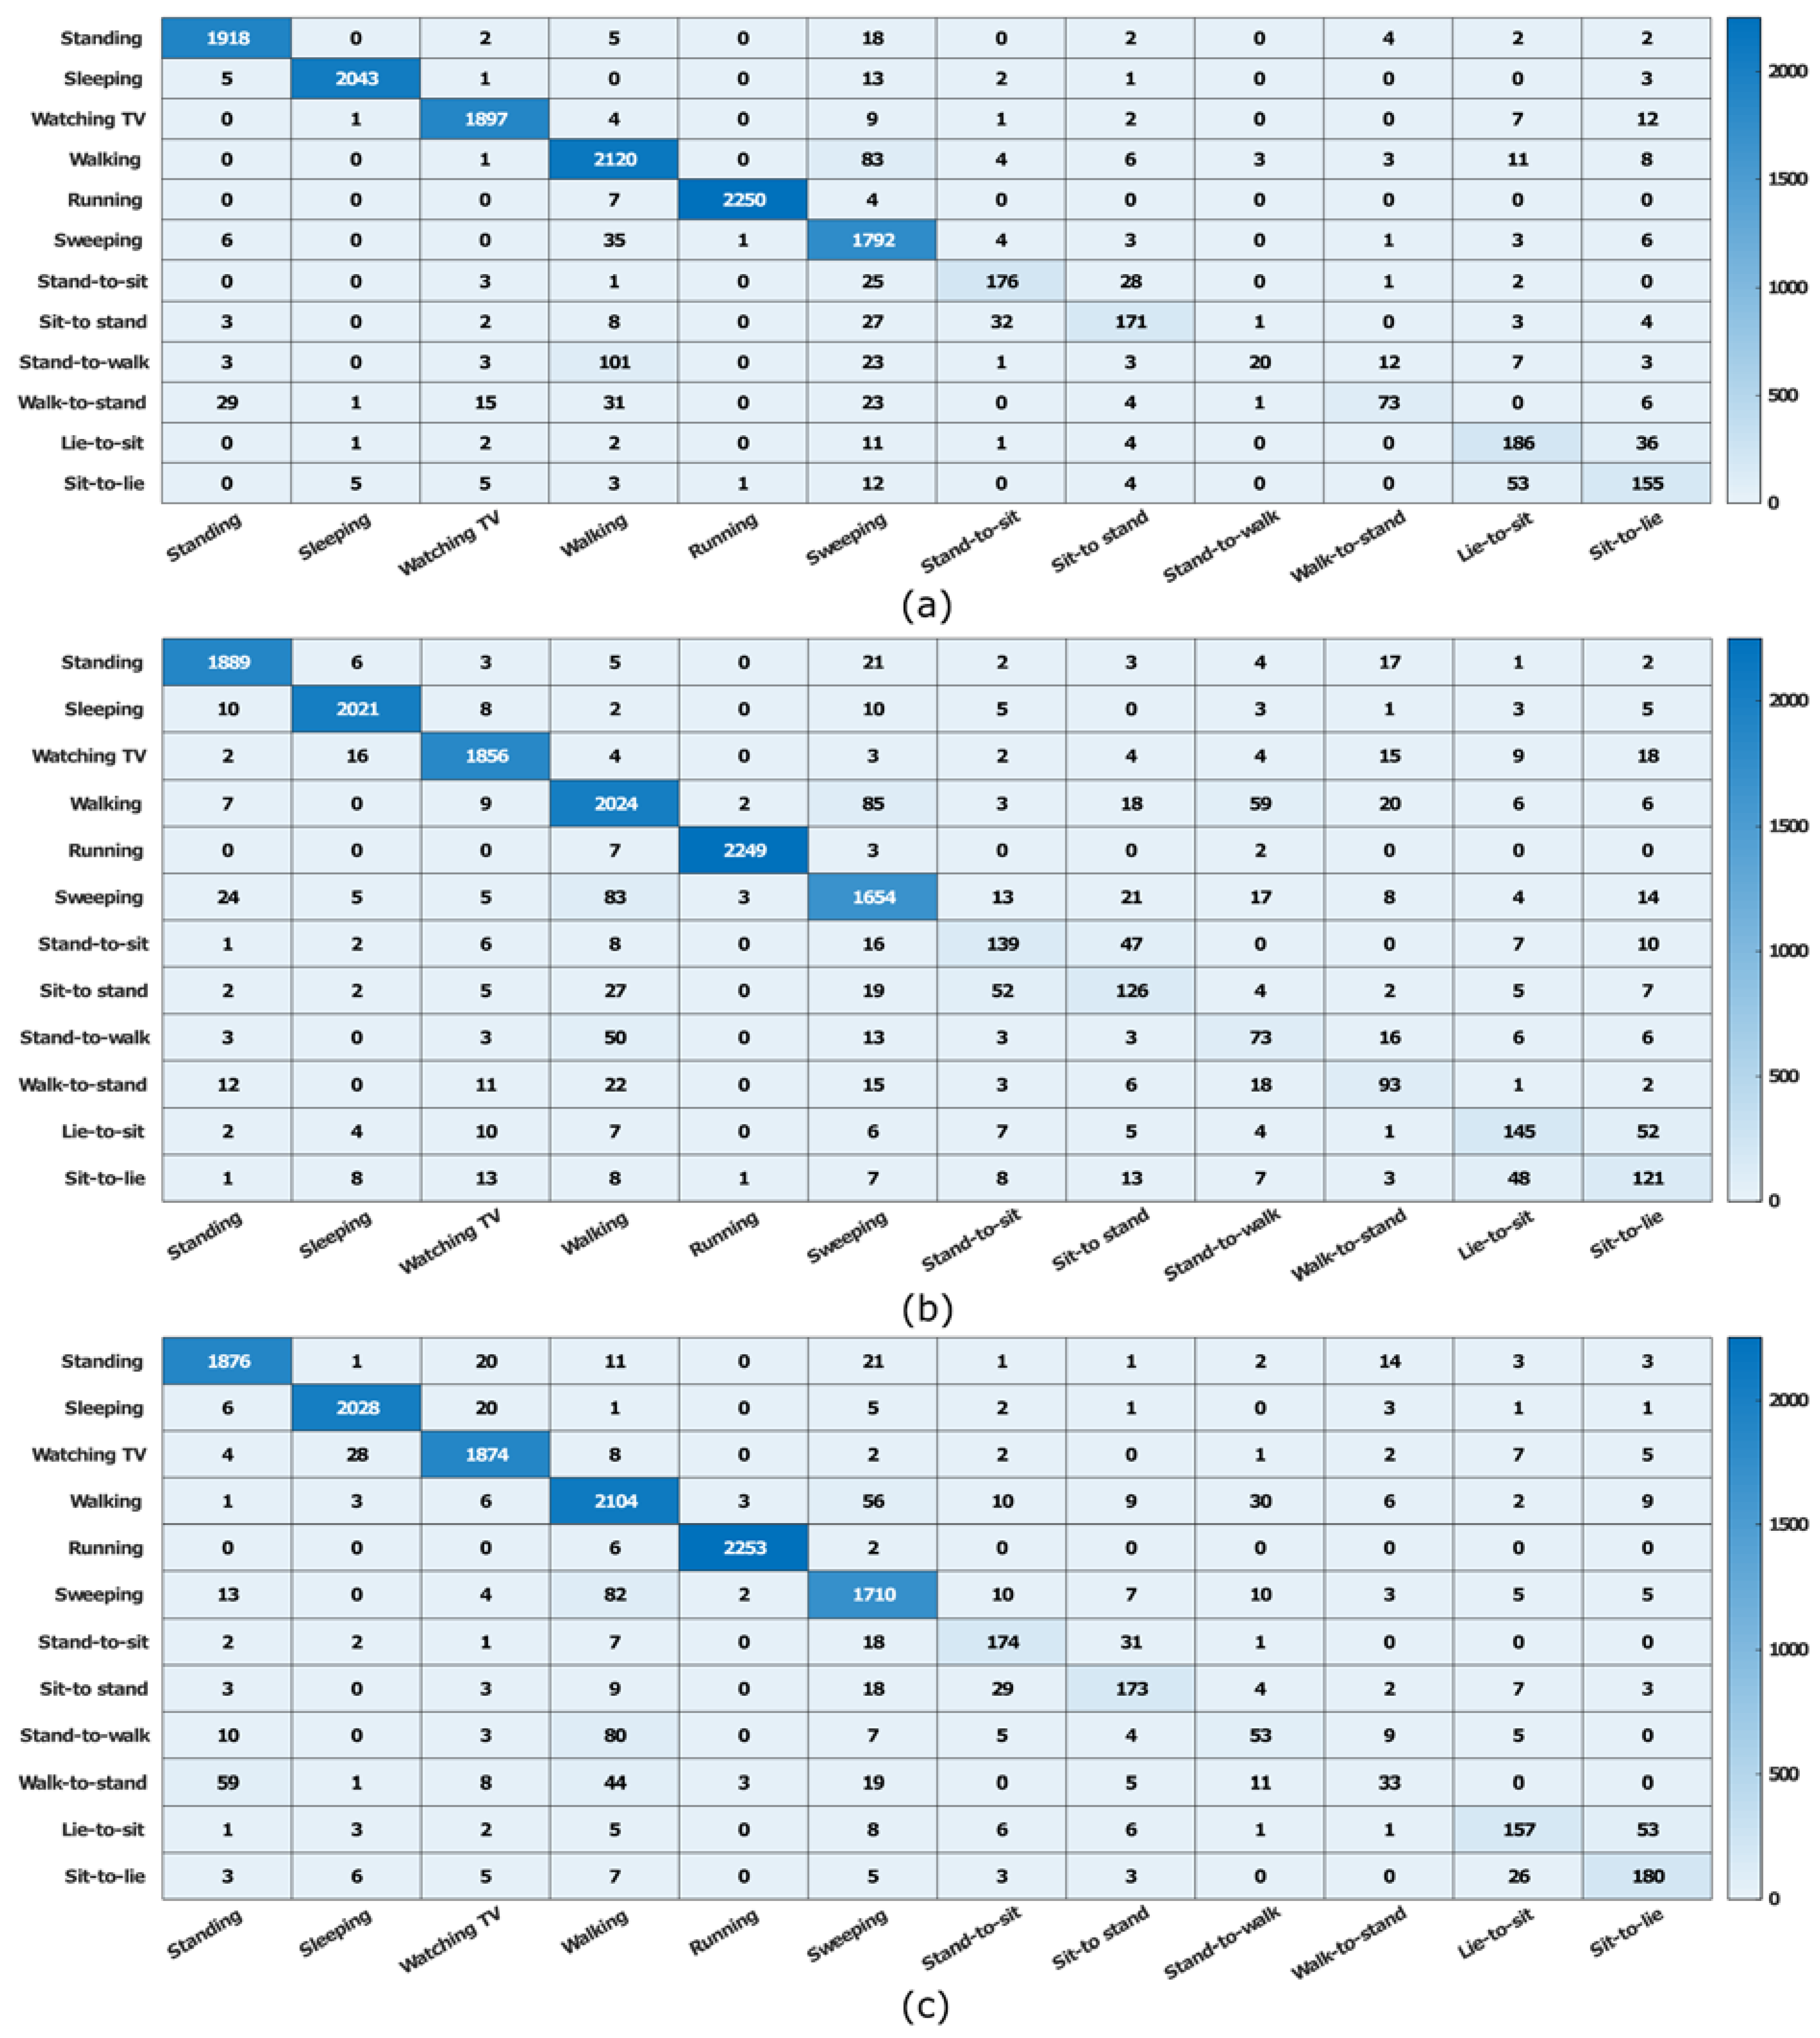
To determine the best classification performance for each activity class, we analyzed the confusion matrices of each activities obtained from SVM, KNN and DT (showed in Figure 3). The confusion matrices revealed that SVM often misclassified walking class (83 instances), stand-to-sit (25 instances) and sit-to-stand (27 instances) to sweeping. Stand-to-walk class was frequently confused with walking (101 instances). Sit-to-lie class was misclassified to lie-to-sit (53 instances). This may be due to these activities share similar movements. The result showed these three classifiers have quite different misclassifications. DT contributed less misclassified instances of stand-to-sit and sit-to-stand compared to SVM. KNN also contributed less misclassified instances of lie-to-sit. The result illustrated that the single classifiers cannot perform best in all evaluation measures, thus combining three single classifiers could contribute better classification performance. Based on this, SVM, KNN and DT were selected as ensemble members due to their excellent performance in evaluation measures. These three classifiers had their own strengths on classifying different activities, they also provided different disagreement with each other, which can used by majority voting to obtain a final prediction.
We evaluated the classification performance of the ensemble model constructed with SVM, DT and KNN by applying it on the feature subspaces. The overall accuracy on twelve activity classes achieved 96.87%. Table 4 presented high sensitivity and specificity (sensitivity was from 0.898 to 0.995, specificity was from 0.993 to 1.000) on each activity class, which illustrated that ensemble model performed well both in identifying the positive class and negative class. The proposed ensemble model performed extremely well in identifying running and achieved the highest F-measure score of 0.997. The results showed that not only adopting adaptive data segmentation method, but also combining the heterogeneous base classifiers by majority voting could significantly improve the performance of activity recognition.
6. Conclusions
Detecting ADLs at home constitutes one of the key elements to enhance people’s quality of life through technology. By reviewing the existing literature, we have observed that most of the proposed activity detection solutions are not equally well adjusted for the different types of activities. In fact, the so-called transitional activities present a lower detection rate than the rest, due to characteristics such as the quickness and difficulty to be predicted. This lower detection rate causes a higher imprecision when it comes to infer a person’s behavior, which in turn may lead to wrong decisions being made.
In this work, we have proved the feasibility of detecting all types of common activities, including transitional activities, by using a single non-intrusive data acquisition device together with a data processing mechanism consisting on segmenting dataset based on change points and using heterogeneous ensemble classifiers. The empirical results show how, even though the detection precision we have obtained is moderately lower for some static and dynamic activities, it is higher for transitional activities up to values comparable to the other types of activities. Thus, we conclude that our proposed solution can attain high success rates and, equally importantly, shows a balanced performance throughout all activity types.
One important issue to be tackled is the assessment of the precision that we would obtain under real-life conditions. In fact, all presented experiments contained activities that were adequately timed so that the classifiers did not face windows containing mixed activities samples. Our hypothesis on this is that it is unlikely that the number of non-homogeneous windows (i.e., windows containing samples from different activities) in a real-life deployment would be significant with respect to the number of homogeneous windows. This would facilitate to filter out non-homogeneous windows and thus minimize their distortional effects.
Finally, we would like to stress that, since all our experiments have included only one non-intrusive device, any contextual information has been left out. The addition of context information to the output of the ensemble classifiers is something worth investigating to assess the possible benefits on both the detection precision and the tolerance to classification errors.
Author Contributions
Q.N. and L.Z. conceived and designed the experiments; Q.N. performed the experiments; Q.N. and L.Z. analyzed the data; Q.N. wrote the paper; L.L. contributed the paper review and editing.
Funding
This research was funded by National Natural Science Foundation of China (61572326, 61802258, 61702333), Natural Science Foundation of Shanghai (18ZR1428300), and Initial Research Funds for Young Teachers of Donghua University (104-07-0053048).
Conflicts of Interest
The authors declare no conflict of interest.
References
- Ni, Q.; García Hernando, A.B.; de la Cruz, I.P. The elderly’s independent living in smart homes: A characterization of activities and sensing infrastructure survey to facilitate services development. Sensors 2015, 15, 11312–11362. [Google Scholar] [CrossRef] [PubMed]
- Lloret, J.; Canovas, A.; Sendra, S.; Parra, L. A smart communication architecture for ambient assisted living. IEEE Commun. Mag. 2015, 53, 26–33. [Google Scholar] [CrossRef]
- Roy, P.C.; Abidi, S.R.; Abidi, S.S.R. Possibilistic activity recognition with uncertain observations to support medication adherence in an assisted ambient living setting. Knowl.-Based Syst. 2017, 133, 156–173. [Google Scholar] [CrossRef]
- Singh, A.; Bianchi-Berthouze, N.; Williams, A.C.C. Supporting everyday function in chronic pain using wearable technology. In Proceedings of the 2017 CHI Conference on Human Factors in Computing Systems, Denver, CO, USA, 6–11 May 2017; pp. 3903–3915. [Google Scholar]
- Ghayvat, H.; Mukhopadhyay, S.; Shenjie, B.; Chouhan, A.; Chen, W. Smart home based ambient assisted living: Recognition of anomaly in the activity of daily living for an elderly living alone. In Proceedings of the 2018 IEEE International Instrumentation and Measurement Technology Conference (I2MTC), Houston, TX, USA, 14–17 May 2018. [Google Scholar]
- Meditskos, G.; Plans, P.M.; Stavropoulos, T.G. Multi-modal activity recognition from egocentric vision, semantic enrichment and lifelogging applications for the care of dementia. J. Vis. Commun. Image Represent. 2018, 51, 169–190. [Google Scholar] [CrossRef]
- Martinez-Hernandez, U.; Dehghani-Sanij, A.A. Probabilistic identification of sit-to-stand and stand-to-sit with a wearable sensor. Pattern Recognit. Lett. 2018, in press. [Google Scholar] [CrossRef]
- Reyes-Ortiz, J.-L.; Oneto, L.; Samà, A.; Parra, X.; Anguita, D. Transition-aware human activity recognition using smartphones. Neurocomputing 2016, 171, 754–767. [Google Scholar] [CrossRef] [Green Version]
- Zhang, S.; McCullagh, P.J.; Zheng, H.R.; Nugent, C. Situation Awareness Inferred from Posture Transition and Location; derived from smart phone and smart home sensors. IEEE Trans. Hum.-Mach. Syst. 2017, 47, 814–821. [Google Scholar] [CrossRef]
- Achumba, I.E.; Bersch, S.; Khusainov, R.; Azzi, D.; Kamalu, U. On time series sensor data segmentation for fall and activity classification. In Proceedings of the 14th International Conference on e-Health Networking, Applications and Services, Beijing, China, 10–13 October 2012; pp. 427–430. [Google Scholar]
- Noor, M.H.M.; Salcic, Z.; Wang, K.I.K. Dynamic sliding window method for physical activity recognition using a single tri-axial accelerometer. In Proceedings of the 2015 IEEE 10th Conference on Industrial Electronics and Applications (ICIEA), Auckland, New Zealand, 15–17 June 2015; pp. 102–107. [Google Scholar]
- Fida, B.; Bernabucci, I.; Bibbo, D.; Conforto, S.; Schmid, M. Varying behavior of different window sizes on the classification of static and dynamic physical activities from a single accelerometer. Med. Eng. Phys. 2015, 37, 705–711. [Google Scholar] [CrossRef] [PubMed]
- Chen, L.; Hoey, J.; Nugent, C.D.; Cook, D.J.; Yu, Z. Sensor-based activity recognition. Systems, Man, and Cybernetics, Part C: Applications and Reviews. IEEE Trans. 2012, 42, 790–808. [Google Scholar]
- Liu, L.; Wang, S.; Su, G.; Huang, Z.G.; Liu, M. Towards complex activity recognition using a Bayesian network-based probabilistic generative framework. Pattern Recognit. 2017, 68, 295–309. [Google Scholar] [CrossRef]
- Safi, K.; Mohammed, S.; Attal, F.; Khalil, M.; Amirat, Y. Recognition of different daily living activities using hidden markov model regression. In Proceedings of the 2016 3rd Middle East Conference on Biomedical Engineering (MECBME), Beirut, Lebanon, 6–7 October 2016; pp. 16–19. [Google Scholar]
- Nunes, U.M.; Faria, D.R.; Peixoto, P. A human activity recognition framework using max-min features and key poses with differential evolution random forests classifier. Pattern Recognit. Lett. 2017, 99, 21–31. [Google Scholar] [CrossRef] [Green Version]
- Ren, X.; Ding, W.; Crouter, S.E.; Mu, Y.; Xie, R. Activity recognition and intensity estimation in youth from accelerometer data aided by machine learning. Appl. Intell. 2016, 45, 512–529. [Google Scholar] [CrossRef]
- Bharti, P.; De, D.; Chellappan, S.; Das, S.K. HuMAn: Complex Activity Recognition with Multi-modal Multi-positional Body Sensing. IEEE Trans. Mob. Comput. 2018. [Google Scholar] [CrossRef]
- Mazumder, O.; Kundu, A.S.; Lenka, P.K.; Bhaumik, S. Ambulatory activity classification with dendogram-based support vector machine: Application in lower-limb active exoskeleton. Gait Posture 2016, 50, 53–59. [Google Scholar] [CrossRef] [PubMed]
- Suto, J.; Oniga, S. Efficiency investigation of artificial neural networks in human activity recognition. J. Ambient. Intell. Humaniz. Comput. 2018, 9, 1049–1060. [Google Scholar] [CrossRef]
- Liu, Y.; Nie, L.; Liu, L.; Rosenblum, D.S. From action to activity: Sensor-based activity recognition. Neurocomputing 2016, 181, 108–115. [Google Scholar] [CrossRef]
- Abidine, B.M.; Fergani, L.; Fergani, B.; Oussalah, M. The joint use of sequence features combination and modified weighted SVM for improving daily activity recognition. Pattern Anal. Appl. 2018, 21, 119–138. [Google Scholar] [CrossRef]
- Wang, J.; Chen, Y.; Hao, S.; Peng, X.; Hu, L. Deep learning for sensor-based activity recognition: A survey. Pattern Recognit. Lett. 2018. [Google Scholar] [CrossRef]
- Hu, C.; Chen, Y.; Peng, X.; Yu, H.; Gao, C.; Hu, L. A Novel Feature Incremental Learning Method for Sensor-based Activity Recognition. IEEE Trans. Knowl. Data Eng. 2018. [Google Scholar] [CrossRef]
- Krawczyk, B. Active and adaptive ensemble learning for online activity recognition from data streams. Knowl.-Based Syst. 2017, 138, 69–78. [Google Scholar] [CrossRef]
- Hu, C.; Chen, Y.; Hu, L.; Peng, X. A novel random forests based class incremental learning method for activity recognition. Pattern Recognit. 2018, 78, 277–290. [Google Scholar] [CrossRef]
- Barshan, B.; Yüksek, M.C. Recognizing daily and sports activities in two open source machine learning environments using body-worn sensor units. Comput. J. 2014, 57, 1649–1667. [Google Scholar] [CrossRef]
- Reyes-Ortiz, J.-L.; Oneto, L.; Ghio, A.; Samá, A.; Anguita, D.; Parra, X. Human activity recognition on smartphones with awareness of basic activities and postural transitions. In Proceedings of the Artificial Neural Networks and Machine Learning (ICANN 2014), Hamburg, Germany, 15–19 September 2014; pp. 177–184. [Google Scholar]
- Mannini, A.; Intille, S.S.; Rosenberger, M.; Sabatini, A.M.; Haskell, W. Activity recognition using a single accelerometer placed at the wrist or ankle. Med. Sci. Sports Exerc. 2013, 45, 2193–2203. [Google Scholar] [CrossRef] [PubMed]
- Mehrang, S.; Pietilä, J.; Korhonen, I. An Activity Recognition Framework Deploying the Random Forest Classifier and A Single Optical Heart Rate Monitoring and Triaxial Accelerometer Wrist-Band. Sensors 2018, 18, 613. [Google Scholar] [CrossRef] [PubMed]
- Burns, A.; Greene, B.R.; McGrath, M.J.; O’Shea, T.J.; Kuris, B.; Ayer, S.M.; Stroiescu, F.; Cionca, V. ShimmerTM—A wireless sensor platform for noninvasive biomedical research. IEEE Sens. J. 2010, 10, 1527–1534. [Google Scholar] [CrossRef]
- Ferraris, F.; Grimaldi, U.; Parvis, M. Procedure for effortless in-field calibration of three-axial rate gyro and accelerometers. Sens. Mater. 1995, 7, 311–330. [Google Scholar]
- Gupta, P.; Dallas, T. Feature selection and activity recognition system using a single triaxial accelerometer. IEEE Trans. Biomed. Eng. 2014, 61, 1780–1786. [Google Scholar] [CrossRef] [PubMed]
- Van Lummel, R.; Ainsworth, E.; Lindemann, U.; Zijlstra, W.; Chiari, L.; Van Campen, P.; Hausdorff, J. Automated approach for quantifying the repeated sit-to-stand using one body fixed sensor in young and older adults. Gait Posture 2013, 38, 153–156. [Google Scholar] [CrossRef] [PubMed]
- Karantonis, D.M.; Narayanan, M.R.; Mathie, M.; Lovell, N.H.; Celler, B.G. Implementation of a real-time human movement classifier using a triaxial accelerometer for ambulatory monitoring. IEEE Trans. Inf. Technol. Biomed. 2006, 10, 156–167. [Google Scholar] [CrossRef] [PubMed]
- Ni, Q.; Patterson, T.; Cleland, I.; Nugent, C. Dynamic detection of window starting positions and its implementation within an activity recognition framework. J. Biomed. Inform. 2016, 62, 171–180. [Google Scholar] [CrossRef] [PubMed]
- Patterson, T.; Khan, N.; McClean, S.; Nugent, C.; Zhang, S.; Cleland, I.; Ni, Q. Sensor-based change detection for timely solicitation of user engagement. IEEE Trans. Mob. Comput. 2017, 16, 2889–2900. [Google Scholar] [CrossRef]
- Jain, A.; Wang, Y. A New Framework for On-Line Change Detection. Available online: http://citeseerx.ist.psu.edu/viewdoc/summary?doi=10.1.1.62.5929 (accessed on 16 October 2016).
- Cheng, W.-C.; Jhan, D.-M. Triaxial accelerometer-based fall detection method using a self-constructing cascade-adaboost-svm classifier. IEEE J. Biomed. Health Inform. 2013, 17, 411–419. [Google Scholar] [CrossRef] [PubMed]
- Figo, D.; Diniz, P.C.; Ferreira, D.R.; Cardoso, J.M. Preprocessing techniques for context recognition from accelerometer data. Pers. Ubiquitous Comput. 2010, 14, 645–662. [Google Scholar] [CrossRef] [Green Version]
- Mathie, M.; Celler, B.G.; Lovell, N.H.; Coster, A. Classification of basic daily movements using a triaxial accelerometer. Med. Boil. Eng. Comput. 2004, 42, 679–687. [Google Scholar] [CrossRef]
- Catal, C.; Tufekci, S.; Pirmit, E.; Kocabag, G. On the use of ensemble of classifiers for accelerometer-based activity recognition. Appl. Soft Comput. 2015, 37, 1018–1022. [Google Scholar] [CrossRef]
Figure 1.
The conceptual procedure of the ensemble classification approach for activity recognition.
Figure 1.
The conceptual procedure of the ensemble classification approach for activity recognition.

Figure 2.
The sensitivity of each activity class obtained from three segmentation methods by applying SVM classifier.
Figure 2.
The sensitivity of each activity class obtained from three segmentation methods by applying SVM classifier.

Figure 3.
The confusion matrices of twelve activities obtained by SVM (a), DT (b) and KNN (c).


Table 1.
The taxonomy and brief description of monitored activities.
| Type | Activities | Description |
|---|---|---|
| Static Activities | Standing | Standing in the home area for 5 min |
| Sleeping | Sleeping on the bed for 5 min | |
| Watching TV | Watching TV in the home area for 5 min | |
| Dynamic Activities | Walking | Walking in the home area for 5 min |
| Running | Running on the treadmill with a set speed for 5 min | |
| Sweeping | Sweeping by using the vacuum cleaner for 5 min | |
| Transitional Activities | Stand-to-sit | Standing for 15 s and then sit down, keep sitting for 15 s, repeat 15 times |
| Sit-to-stand | Sitting for 15 s and then stand up, keep standing for 15 s, repeat 15 times | |
| Stand-to-walk | Standing for 15 s then change to walk, keep walking for 15 s, repeat 15 times | |
| Walk-to-stand | Walking for 15 s then change to standing, keep standing for 15 s, repeat 15 times | |
| Lie-to-sit | Lying on the bed for 15 s and change to sit on the bed, repeat 15 times | |
| Sit-to-lie | Sitting on the bed for 15 s and change to lie down, repeat 15 times |
Table 2.
Features extracted from both time domain and frequency domain.
| Features Domain | Feature | Formulation | Values |
|---|---|---|---|
| Time-domain feature | Mean | Body acceleration-x, Body acceleration-y, Body acceleration-z, Body acceleration-SMV, Gravity acceleration-x, Gravity acceleration-y, Gravity acceleration-z, Gravity acceleration-SMV | |
| Root mean squared | |||
| Standard deviation | |||
| Median absolute deviation | |||
| Range | |||
| Signal magnitude area | Body acceleration, Gravity acceleration, Body acceleration-SMV, Gravity acceleration-SMV | ||
| Correlation coefficient | Body acceleration-xy, Body acceleration-xz, Body acceleration-yz, Gravity acceleration-xy, Gravity acceleration-xz, Gravity acceleration-yz | ||
| Tilt angle | Body acceleration-x, Body acceleration-y, Body acceleration-z | ||
| Frequency-domain feature | Spectral energy | Body acceleration-x, Body acceleration-y, Body acceleration-z, Body acceleration-SMV | |
| Spectral entropy | |||
| Skewness | |||
| Kurtosis | |||
| Largest frequency component | |||
| Frequency signal weighted average |
Table 3.
Performance evaluation for the change point-based segmentation method.
| Method | DT | SVM | KNN | MLP | NB |
|---|---|---|---|---|---|
| Non-overlapping segmentation | 86.44 | 90.54 | 92.40 | 69.38 | 60.77 |
| 50% overlapping segmentation | 89.32 | 92.87 | 93.70 | 69.81 | 62.30 |
| Change point-based segmentation | 90.71 | 94.21 | 93.64 | 72.21 | 63.45 |
Table 4.
Performance evaluation for the heterogeneous ensemble model (A1 = Standing, A2 = Sleeping, A3 = Watching TV, A4 = Walking, A5 = Running, A6 = Sweeping, A7 = Stand-to-sit, A8 = Sit-to-stand, A9 = Stand-to-walk, A10 = Walk-to-stand, A11 = Lie-to-sit, A12 = Sit-to-lie).
Table 4.
Performance evaluation for the heterogeneous ensemble model (A1 = Standing, A2 = Sleeping, A3 = Watching TV, A4 = Walking, A5 = Running, A6 = Sweeping, A7 = Stand-to-sit, A8 = Sit-to-stand, A9 = Stand-to-walk, A10 = Walk-to-stand, A11 = Lie-to-sit, A12 = Sit-to-lie).
| Performance | A1 | A2 | A3 | A4 | A5 | A6 | A7 | A8 | A9 | A10 | A11 | A12 |
|---|---|---|---|---|---|---|---|---|---|---|---|---|
| Accuracy | 99.21 | 98.80 | 98.96 | 97.56 | 99.56 | 98.76 | 72.33 | 75.76 | 61.28 | 69.11 | 77.08 | 68.80 |
| Sensitivity | 0.995 | 0.987 | 0.982 | 0.973 | 0.995 | 0.987 | 0.735 | 0.757 | 0.610 | 0.691 | 0.768 | 0.684 |
| Specificity | 1.000 | 1.000 | 1.000 | 0.998 | 1.000 | 0.986 | 0.723 | 0.756 | 0.622 | 0.688 | 0.770 | 0.690 |
| F-measure | 0.991 | 0.979 | 0.984 | 0.970 | 0.997 | 0.988 | 0.773 | 0.792 | 0.635 | 0.716 | 0.788 | 0.688 |
© 2018 by the authors. Licensee MDPI, Basel, Switzerland. This article is an open access article distributed under the terms and conditions of the Creative Commons Attribution (CC BY) license (http://creativecommons.org/licenses/by/4.0/).
Share and Cite
MDPI and ACS Style
Ni, Q.; Zhang, L.; Li, L. A Heterogeneous Ensemble Approach for Activity Recognition with Integration of Change Point-Based Data Segmentation. Appl. Sci. 2018, 8, 1695. https://0-doi-org.brum.beds.ac.uk/10.3390/app8091695
AMA Style
Ni Q, Zhang L, Li L. A Heterogeneous Ensemble Approach for Activity Recognition with Integration of Change Point-Based Data Segmentation. Applied Sciences. 2018; 8(9):1695. https://0-doi-org.brum.beds.ac.uk/10.3390/app8091695
Chicago/Turabian StyleNi, Qin, Lei Zhang, and Luqun Li. 2018. "A Heterogeneous Ensemble Approach for Activity Recognition with Integration of Change Point-Based Data Segmentation" Applied Sciences 8, no. 9: 1695. https://0-doi-org.brum.beds.ac.uk/10.3390/app8091695
Note that from the first issue of 2016, this journal uses article numbers instead of page numbers. See further details here.