Reactive Black 5 Degradation on Manganese Oxides Supported on Sodium Hydroxide Modified Graphene Oxide


Laboratory of Chemical and Environmental Technology, Department of Chemistry, Aristotle University of Thessaloniki, 54124 Thessaloniki, Greece
*
Author to whom correspondence should be addressed.
Appl. Sci. 2019, 9(10), 2167; https://0-doi-org.brum.beds.ac.uk/10.3390/app9102167
Submission received: 10 March 2019
/
Revised: 17 May 2019
/
Accepted: 17 May 2019
/
Published: 27 May 2019
(This article belongs to the Special Issue Innovative Approaches for Drinking- and Waste-Water Treatment)
Abstract
:Sodium hydroxide-modified graphene oxide was used as manganese oxides support for the preparation of nanocomposites via a one-pot preparation route for the degradation of Reactive Black 5. The nanocomposites were characterized for their structure by X-ray diffraction, for their textural properties by Nitrogen adsorption, and for their surface chemistry by Fourier transform infrared spectroscopy, potentiometric titration, and thermal analysis measurements. The nanocomposites prepared showed to possess high activity for the degradation/oxidation of Reactive Black 5 at ambient conditions, without light irradiation, which was higher than that of the precursors manganese oxides and can be attributed to the synergistic effect of the manganese oxides and the modified graphene oxide.
1. Introduction
The textile industries effluents contain dyes, provoking several effects on ecosystems and effects on human health [1,2,3,4,5,6,7]. Most industries use synthetic azo dyes with one or more azoic groups (-N=N-) that may form aromatic amines causing mutagenic and carcinogenic effects on aquatic organisms [8,9,10,11,12,13,14].
Many research papers have focused on the removal methods of azo dyes in order to decrease their effect on environment and human health. These techniques could be classified in biological (biodegradation, biosorption, bioaccumulation, applying bacteria, or algae) [15,16,17,18], chemical (ozonation, advanced oxidation processes (AOPs), electrochemical degradation, photocatalysis) [19,20,21,22] and physical methods (adsorption, ion exchange) [23,24,25], depending on the type of process. Adsorption is considered to be quite attractive in terms of effectiveness and ultimate removal, while catalytic oxidation in terms of cost and of a high degree of dye elimination [26,27,28].
Recently, significant research efforts have been focused on the environmental application of manganese oxides MnOx (x = 1, 2, 4/3), because of their low cost, abundance, environmental friendliness, and high adsorption capacity [29,30]. In particular, manganese oxide/nanomaterials demonstrated oxidative and catalytic activity for the degradation of dyes and organic compounds from aqueous waste [31,32]. Furthermore, manganese oxides are powerful oxidizing/catalytic agents [33].
Carbonaceous materials like activated carbon and graphene oxide have been used for dye removal due to the advantage of their selective adsorption capacity through a strong π-π interaction of the benzene rings [34,35,36]. Recently, activated carbon and graphene oxide were used as support for manganese oxides for the synthesis of nanocomposites for a dye degradation [37,38] while sodium hydroxide modified graphene oxide was used as support of manganese oxides for the preparation of novel nanocatalysts applied to the catalytic degradation of bisphenol A [39,40]. The novel nanocomposites presented a sufficient performance of bisphenol A degradation attributed to a synergetic effect of adsorption onto the carbonaceous support and the oxidation onto the manganese oxides’ surface.
In the current study, sodium hydroxide modified graphene oxide was used as support of manganese oxides (MnO2 and Mn3O4) and were tested for the degradation of the azo dye Reactive Black 5. The nanocomposites showed to possess high activity for the degradation/oxidation of the dye at ambient conditions, without light irradiation, which was higher than that of the precursors’ manganese oxides. The increased degradation can be attributed to the synergistic effect of the adsorption onto modified graphene oxide and oxidation onto manganese oxides. The presence of radicals further increased the dye degradation.
2. Experimental
2.1. Materials and Reagents
Reagents of graphite powder, potassium permanganate (KMnO4), sulfuric acid (H2SO4) as well as sodium hydroxide (NaOH) and manganese sulphate (MnSO4·7H2O) were purchased from Sigma-Aldrich. Reactive Black 5 (assigned as RB5) was obtained from ChemLab (NV).
2.2. Preparation of Graphite Oxide (GO)
The modified Hummers’ method was used for the synthesis of graphite oxide (GO) by oxidation of graphite [41]. Briefly, graphite powder (10 g) was added under stirring in 230 mL of sulfuric acid at 0 °C. Potassium permanganate (KMnO4, 30 g) were slowly added in the mixture in order to prevent the increase of temperature (<20 °C). The reaction mixture was cooled to 2 °C and stirring was followed at ambient temperature for 30 min. Distilled water (230 mL) was added to the mixture at a slow rate under stirring for 15 min, maintaining the temperature under 98 °C and then, it was further diluted with 1.4 L of distilled water. Finally, 100 mL of hydrogen peroxide (30 wt% solution) was added into the mixture which was left overnight. The GO particles were separated by decantation and were freeze-dried. It is referred to as GO.
2.3. Preparation of Modified Graphene Oxide
For the synthesis of NGO, a specific amount of previously prepared graphite oxide (2 g) was dispersed in 175 mL of distilled water at an ultrasonic bath for 1 h. The synthesis was followed by the dropwise addition of NaOH aqueous solution (35 mL, 0.5 M) into the mixture under vigorous stirring. The suspension was transferred into a round bottom flask and kept at 90 °C for 1 h under reflux. The solid product was separated by centrifugation, double washed with deionized water and ethanol and freeze-dried. The material is referred to as NGO.
2.4. Preparation of MnO2 and Mn3O4
For the preparation of MnO2, a quantity of MnSO4 (0.2 M) was added to KMnO4 (0.21 M) and was dissolved in distilled water (30 mL). Three followed steps included the 30-min stirring, centrifugation and freeze-drying. For the preparation of Mn3O4, the previously produced MnO2 was calcinated at 1000 °C for 10 h with an increased temperature rate 10 °C/min [42].
2.5. Synthesis of NGO–Mn3O4, and NGO–MnO2 Nanocomposites
For the synthesis of NGO–Mn3O4, a specific amount of previously prepared graphite oxide (8 g) was dispersed in distilled water with ultrasonication for 1 h. Potassium permanganate (3.2 g) was dissolved in distilled water (400 mL) and was dropwise added to the GO suspension under vigorous stirring. The mixture was left overnight in the dark. After that, the mixture was ultrasonicated for 60 min and freshly prepared NaOH solution (0.5 M, 35 mL) was added dropwise under stirring. The suspension was refluxed at 90 °C for 1h. The solid product was washed with deionized water and ethanol and freeze-dried. For the preparation of the NGO–MnO2 composite, the amount of KMnO4 added was triple (9.6 g) than that used for NGO–Mn3O4.
2.6. Materials Characterization
The morphology of the nanocomposite surface was investigated using a scanning electron microscope Zeiss Supra 55VP (Jena, Germany) at an increasing voltage of 15.00 kV while, X-ray diffraction (XRD) was determined by a Philips PW 1820 diffractometer with a Cu Ka radiation from 20° to 80°. In order to identify the functional groups of carbon surface, FTIR spectra (4000 to 400 cm−1) was depicted by a Perkin-Elmer 2000 FTIR spectrometer (Dresden, Germany) using KBr disks. The surface charge of materials was illustrated by potentiometric titration using an automatic titrator (Mettler Toledo T50). The measurements of Thermal Analysis (TA) were carried out with a Thermal Analyzer SDT 2960 under specific conditions (25 °C to 1000 °C, increasing temperature rate 10 °C/min and helium atmosphere at 100 mL/min). The total percentage of Mn concentration of NGO–MnO2 and NGO–Mn3O4 nanocomposites was performed using ICP-MS (Agilent 7500s-Agilent Technologies, Waldbronn, Germany).
2.7. Degradation Experiments
The removal of Reactive Black 5 from the aqueous phase, by NGO–Mn3O4 and NGO–MnO2 nanocomposites, was studied by batch experiments. Firstly, the effect of the solution pH on the catalytic performance of the composites prepared was investigated. Solutions of the dye were prepared with initial concentrations of 100 mg/L, same volume (20 mL) and the same amount of catalysts (0.01 g) and the pH was adjusted between 3–9 with a pH-meter (CRISON basic 20), by micro-additions of dilute HCl and NaOH solutions. The adjusted suspensions were shaken (at agitation rate 150 rpm) for 24 h at 25 °C in a water bath with a shaker (JULABO SW-21C) and they were filtrated through a 0.45 μm pore size membrane syringe filter (obtained by Schleicher–Schuell Micro Science). The remaining concentration of the dye was measured by UV—Vis. The removal percentage (R%) of RB5 was calculated according to the Equation (1):
where Co and Ce (mg/L) are the initial and equilibrium concentrations of Reactive Black 5, respectively. The optimum pH for the degradation experiments was found to be 3.
Kinetic experiments took place by mixing 0.01 g of catalyst and 20 mL of RB5 solution (Co = 40 and 100 mg/L), at optimum pH value. The suspensions were shaken in a water bath at 25 °C (agitation rate = 150 rpm) in various adsorption time (5 min–24 h), filtrated through 0.45 μm pore size syringe filter and the remaining RB5 concentrations were measured by UV-Vis. All experiments were performed triplicate and the results presented are the mean value.
3. Results and Discussion
3.1. Materials Characterization
The nanocomposites prepared were characterized for their manganese concentration and the form of the impregnated manganese oxide, as well as their texture. The total Mn content for the NGO–Mn3O4 and NGO–MnO2 nanocomposites, estimated by ICP-MS found to be 10.4 and 19.2% w/w.
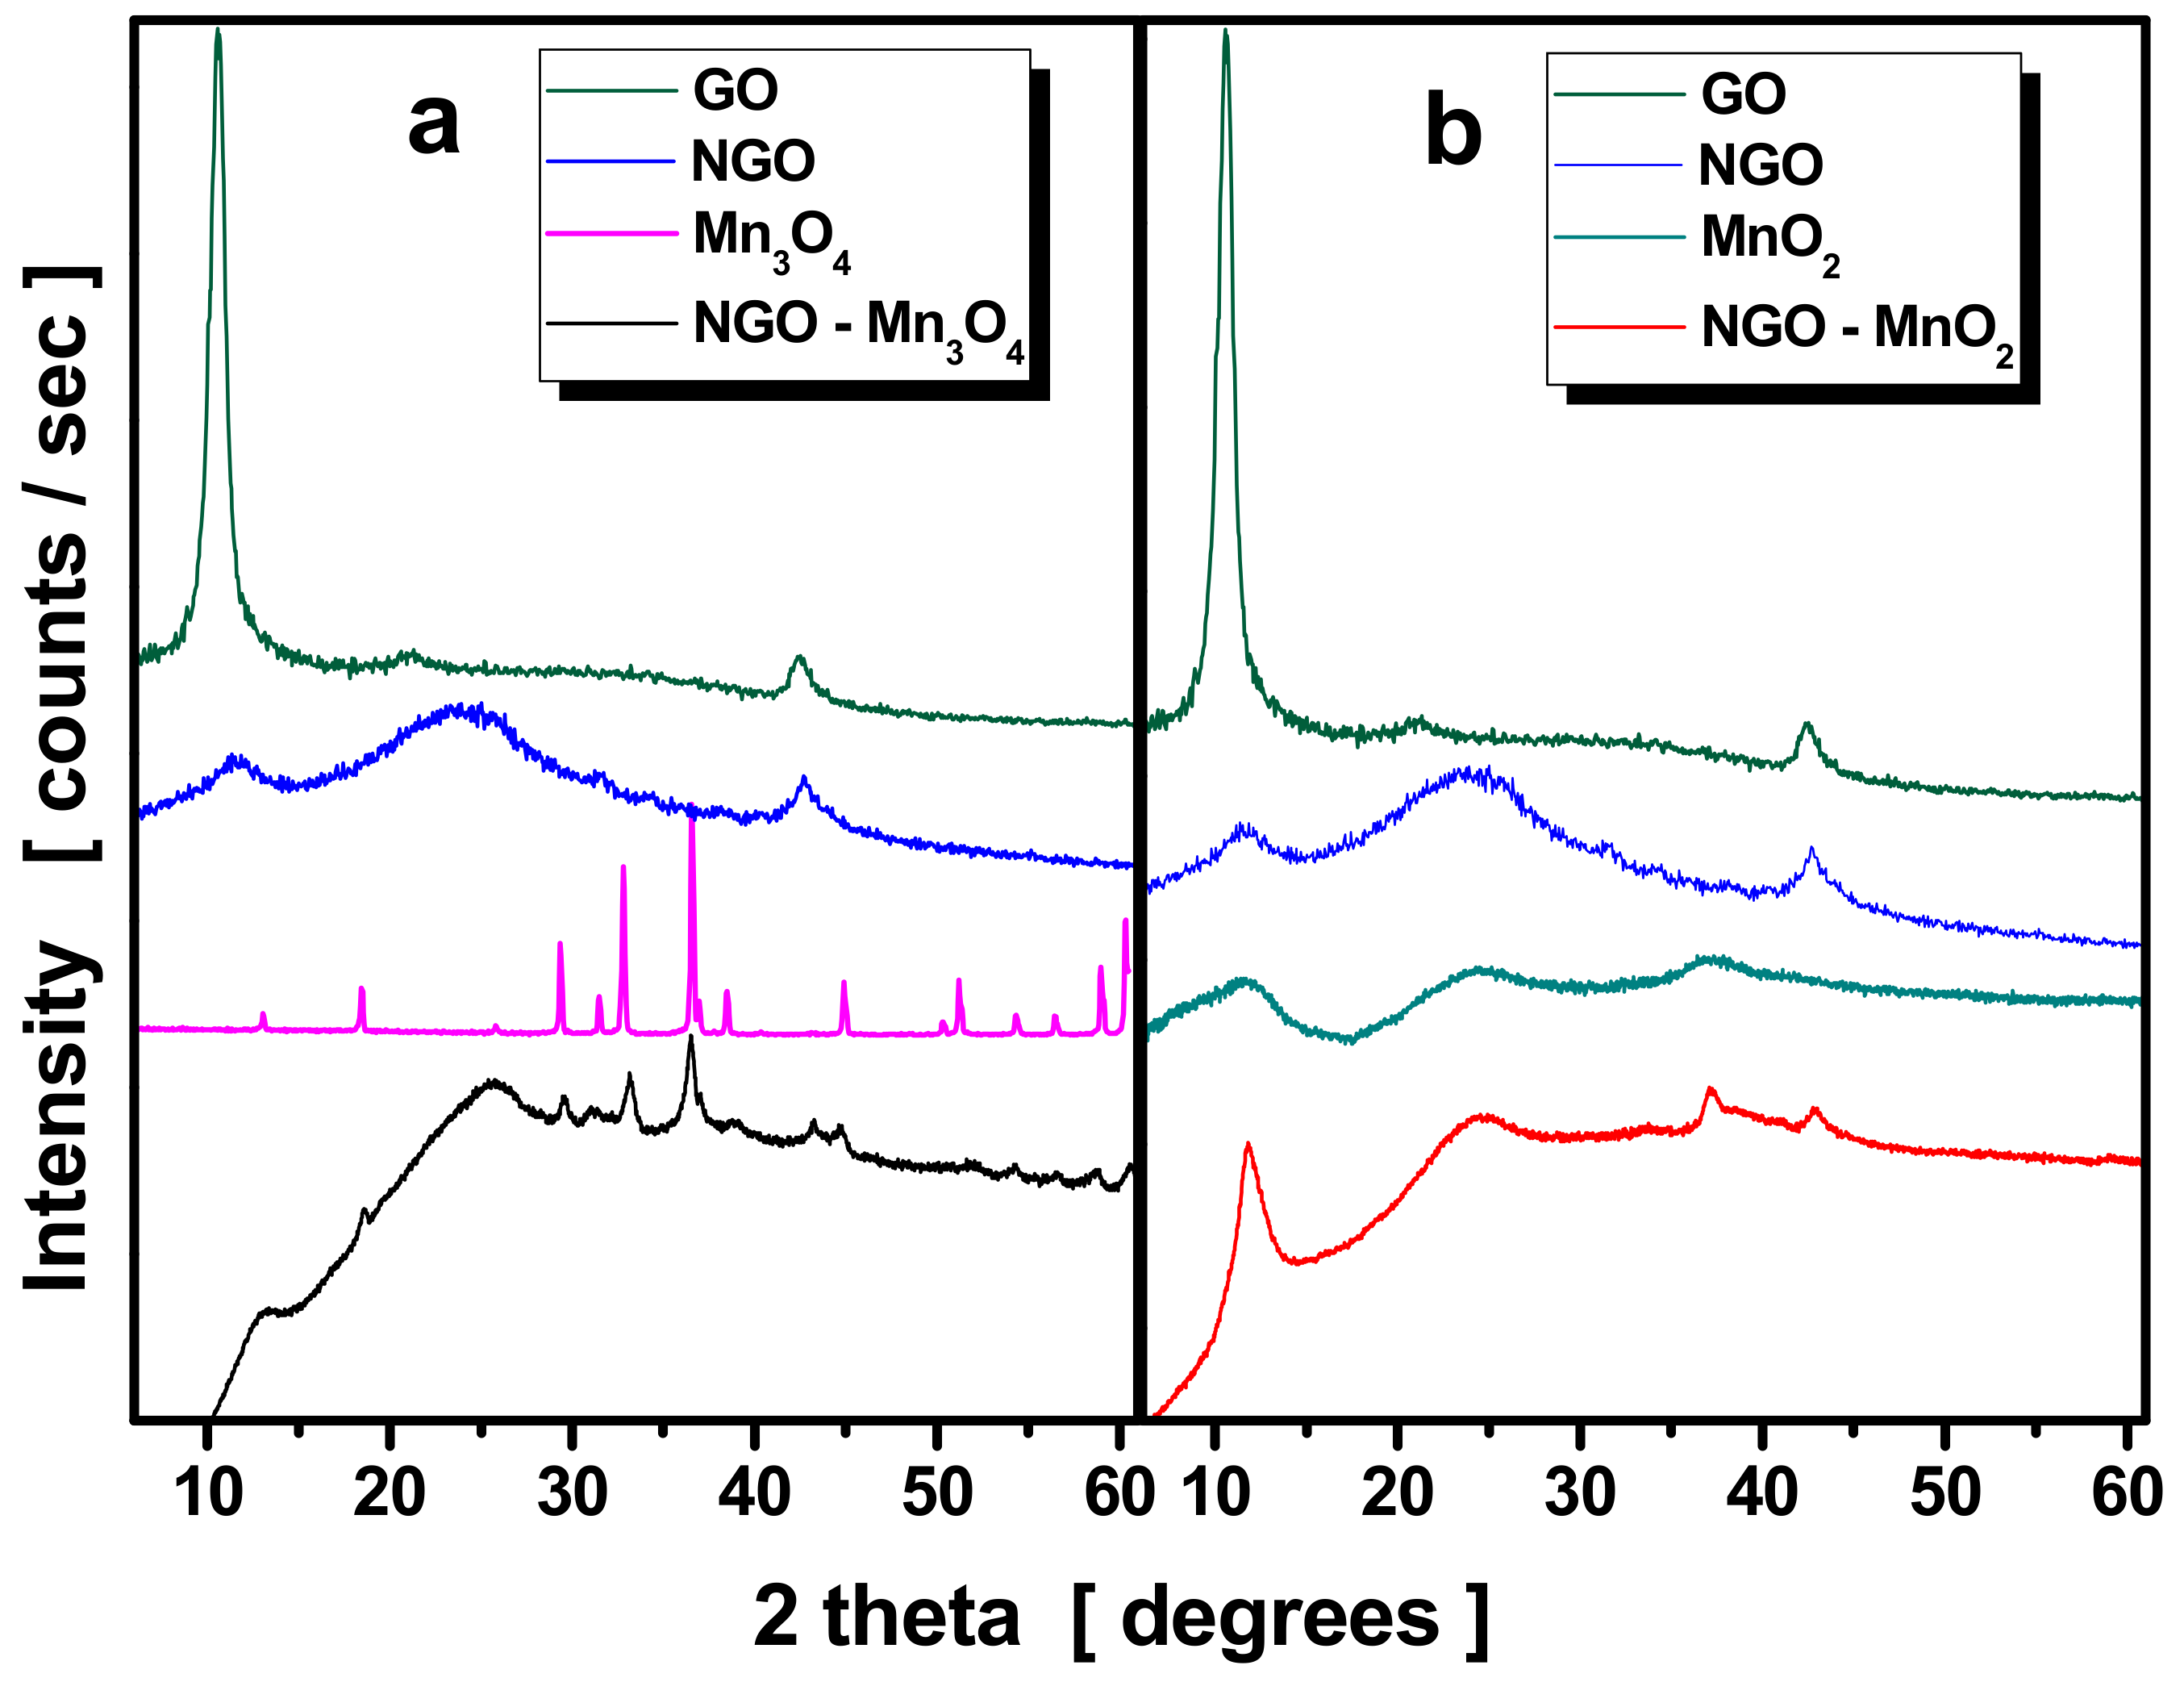
The XRD patterns of MnO2, NGO, NGO–MnO2 and Mn3O4, Mn3O4, NGO–Mn3O4, in comparison with the pattern of GO, are shown in Figure 1a,b, in order to provide information about their structure. The characteristic (001) peak of graphite oxide, obtained at 2θ = 10.3°, is indicative of the successful transformation of graphite into graphite oxide [43]. This peak appeared to be lower in the pattern for NGO, indicative of a partial exfoliation of GO.
In the diffraction pattern of MnO2, the main reflections at 2θ = 11.4°, 25°, 37.2°, and 66.7° could be attributed to the (001), (002), (111) and (312) lattice planes of δ-MnO2 (birnessite) respectively [44,45].
In addition, the broadened peaks indicated the low crystallinity of the manganese oxide. The average crystallite size (D) of MnO2 as calculated applying Debye Scherrer’s equation for the (121) peak found to be about 35 nm [46]. The XRD pattern for the NGO–MnO2 composite presented the characteristic peaks of δ-MnO2. Besides, the absence of the peak at 2θ = 10.3°, indicated the complete exfoliation of GO during the preparation of the nanocomposite. The XRD pattern of Mn3O4 presented peaks at 2θ 18° (101), 29° (112), 32.5° (103), 37.2° (211), 45° (220) and 60° (224), characteristic for Mn3O4 [47]. For the NGO–Mn3O4 composite, similar peaks to those appeared in the diffraction pattern for Mn3O4 [48] revealed the formation of Mn3O4. The diffraction peak at 25.6° indicated a partial reduction of graphene oxide [49,50].
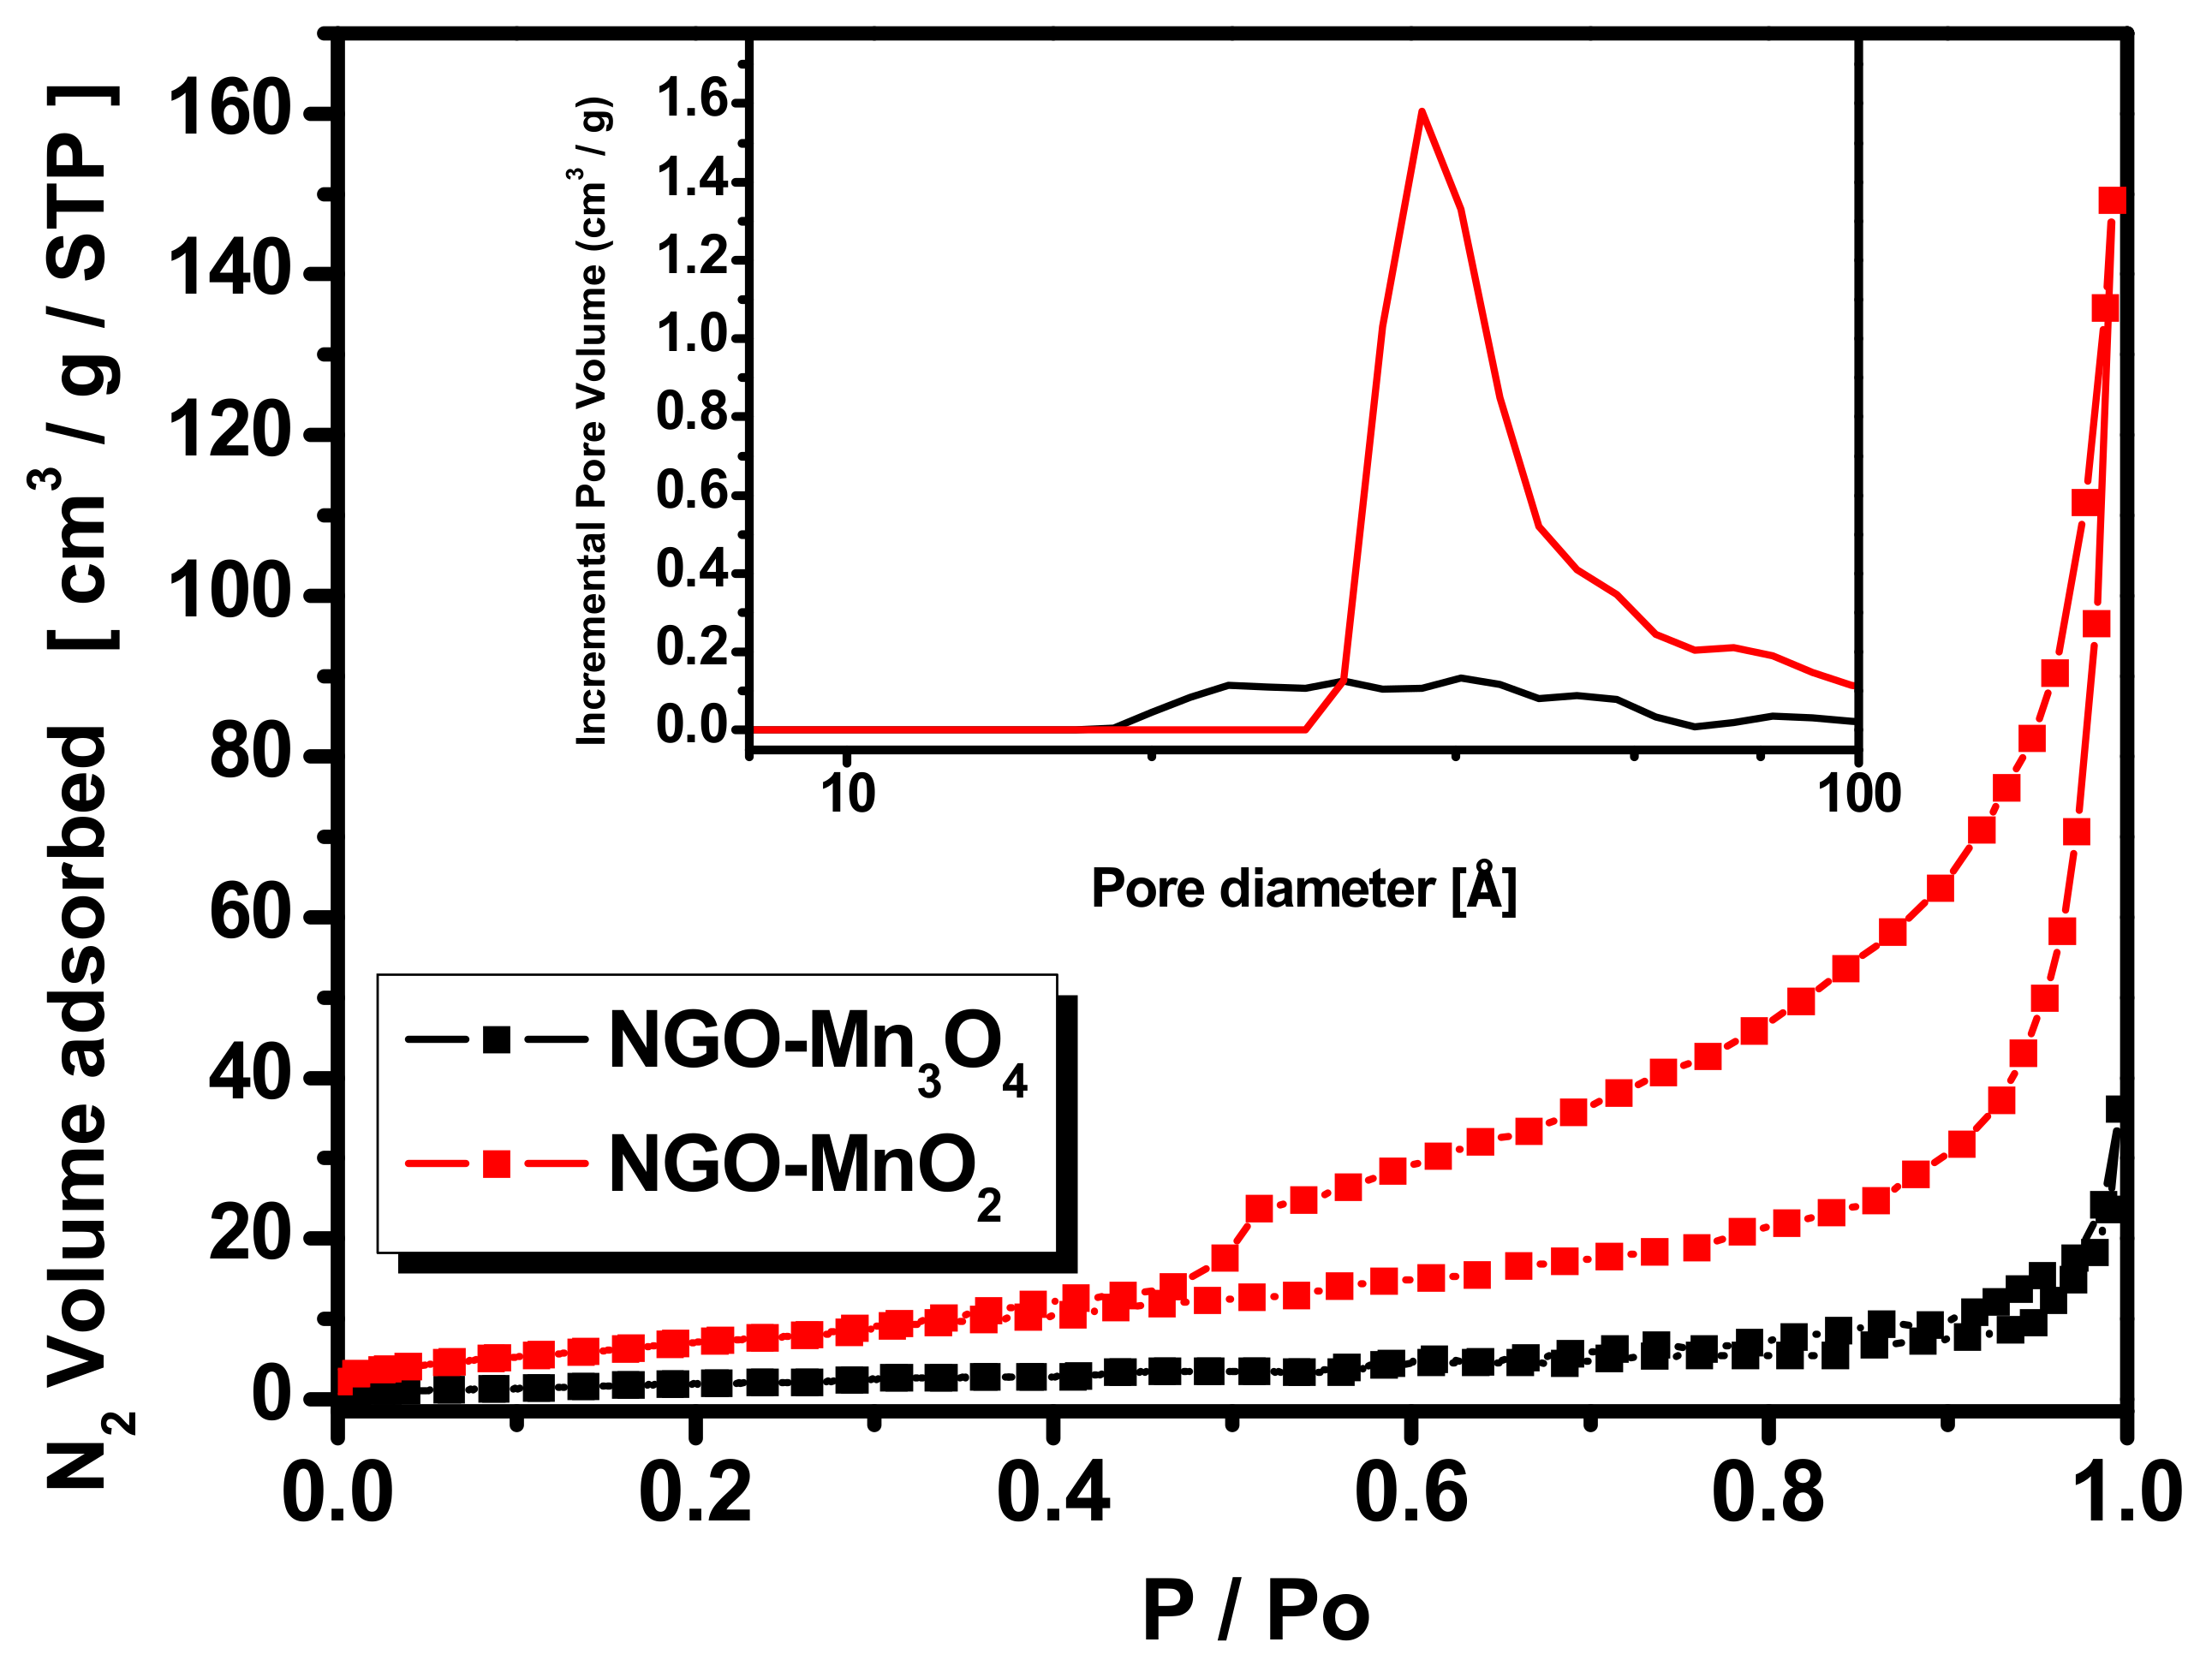
The N2 adsorption isotherms for the NGO–Mn3O4 and NGO–MnO2 nanocomposites are shown in Figure 2 while the pore size distribution in the inset of Figure 2. The isotherms of the nanocomposites indicate an absence of variation in nitrogen uptake, corresponding to a deficiency of micropores. The nanocatalyst NGO–Mn3O4 presented an isotherm of type IV, according to the IUPAC classification, indicative of the presence of mesopores. Furthermore, the isotherm exhibited a hysteresis loop at relative pressure P/Po = 0.70–0.99, classified as H3. The specific surface area was measured by the BET method and found to be 7.52 m2/g, while the pore volume found to be 0.056 cm3/g. These values are in agreement with the characteristics of hysteresis loop, indicative of lack of micropores. The N2 adsorption/desorption isotherms for NGO–MnO2 revealed lack of micropores while the increased N2 uptake presented at P/Po > 0.95 is indicative of external surface area and the hysteresis loop at relative pressure P/Po = ~0.50–0.99 is indicative of the mesopores.
The textural parameters of NGO–Mn3O4 and NGO–MnO2 nanocomposites are presented in Table 1 along with the parameters of NGO, Mn3O4 and MnO2, for the sake of comparison. From the Table, it is seen that the NGO–MnO2 nanocomposite presented increase mesopores volume as well as increase Specific Surface Area. This can be due to the fact that NaOH modification tuned the oxygen surface functional groups and expanded the graphene layers resulting in more decays and porous structure [51]. From the above results, it can be concluded that the better catalytic performance of the NGO–MnO2 composite may be attributed to the increased specific surface area and mesopores volume, that contributed to an increase RB5 adsorption.
3.2. Degradation of Reactive Black 5
The prepared nanocomposites were tested for the RB5 degradation efficiency. Thus, the effect of parameters such as pH, initial RB5 concentration and contact time were examined.
3.2.1. Effect of pH
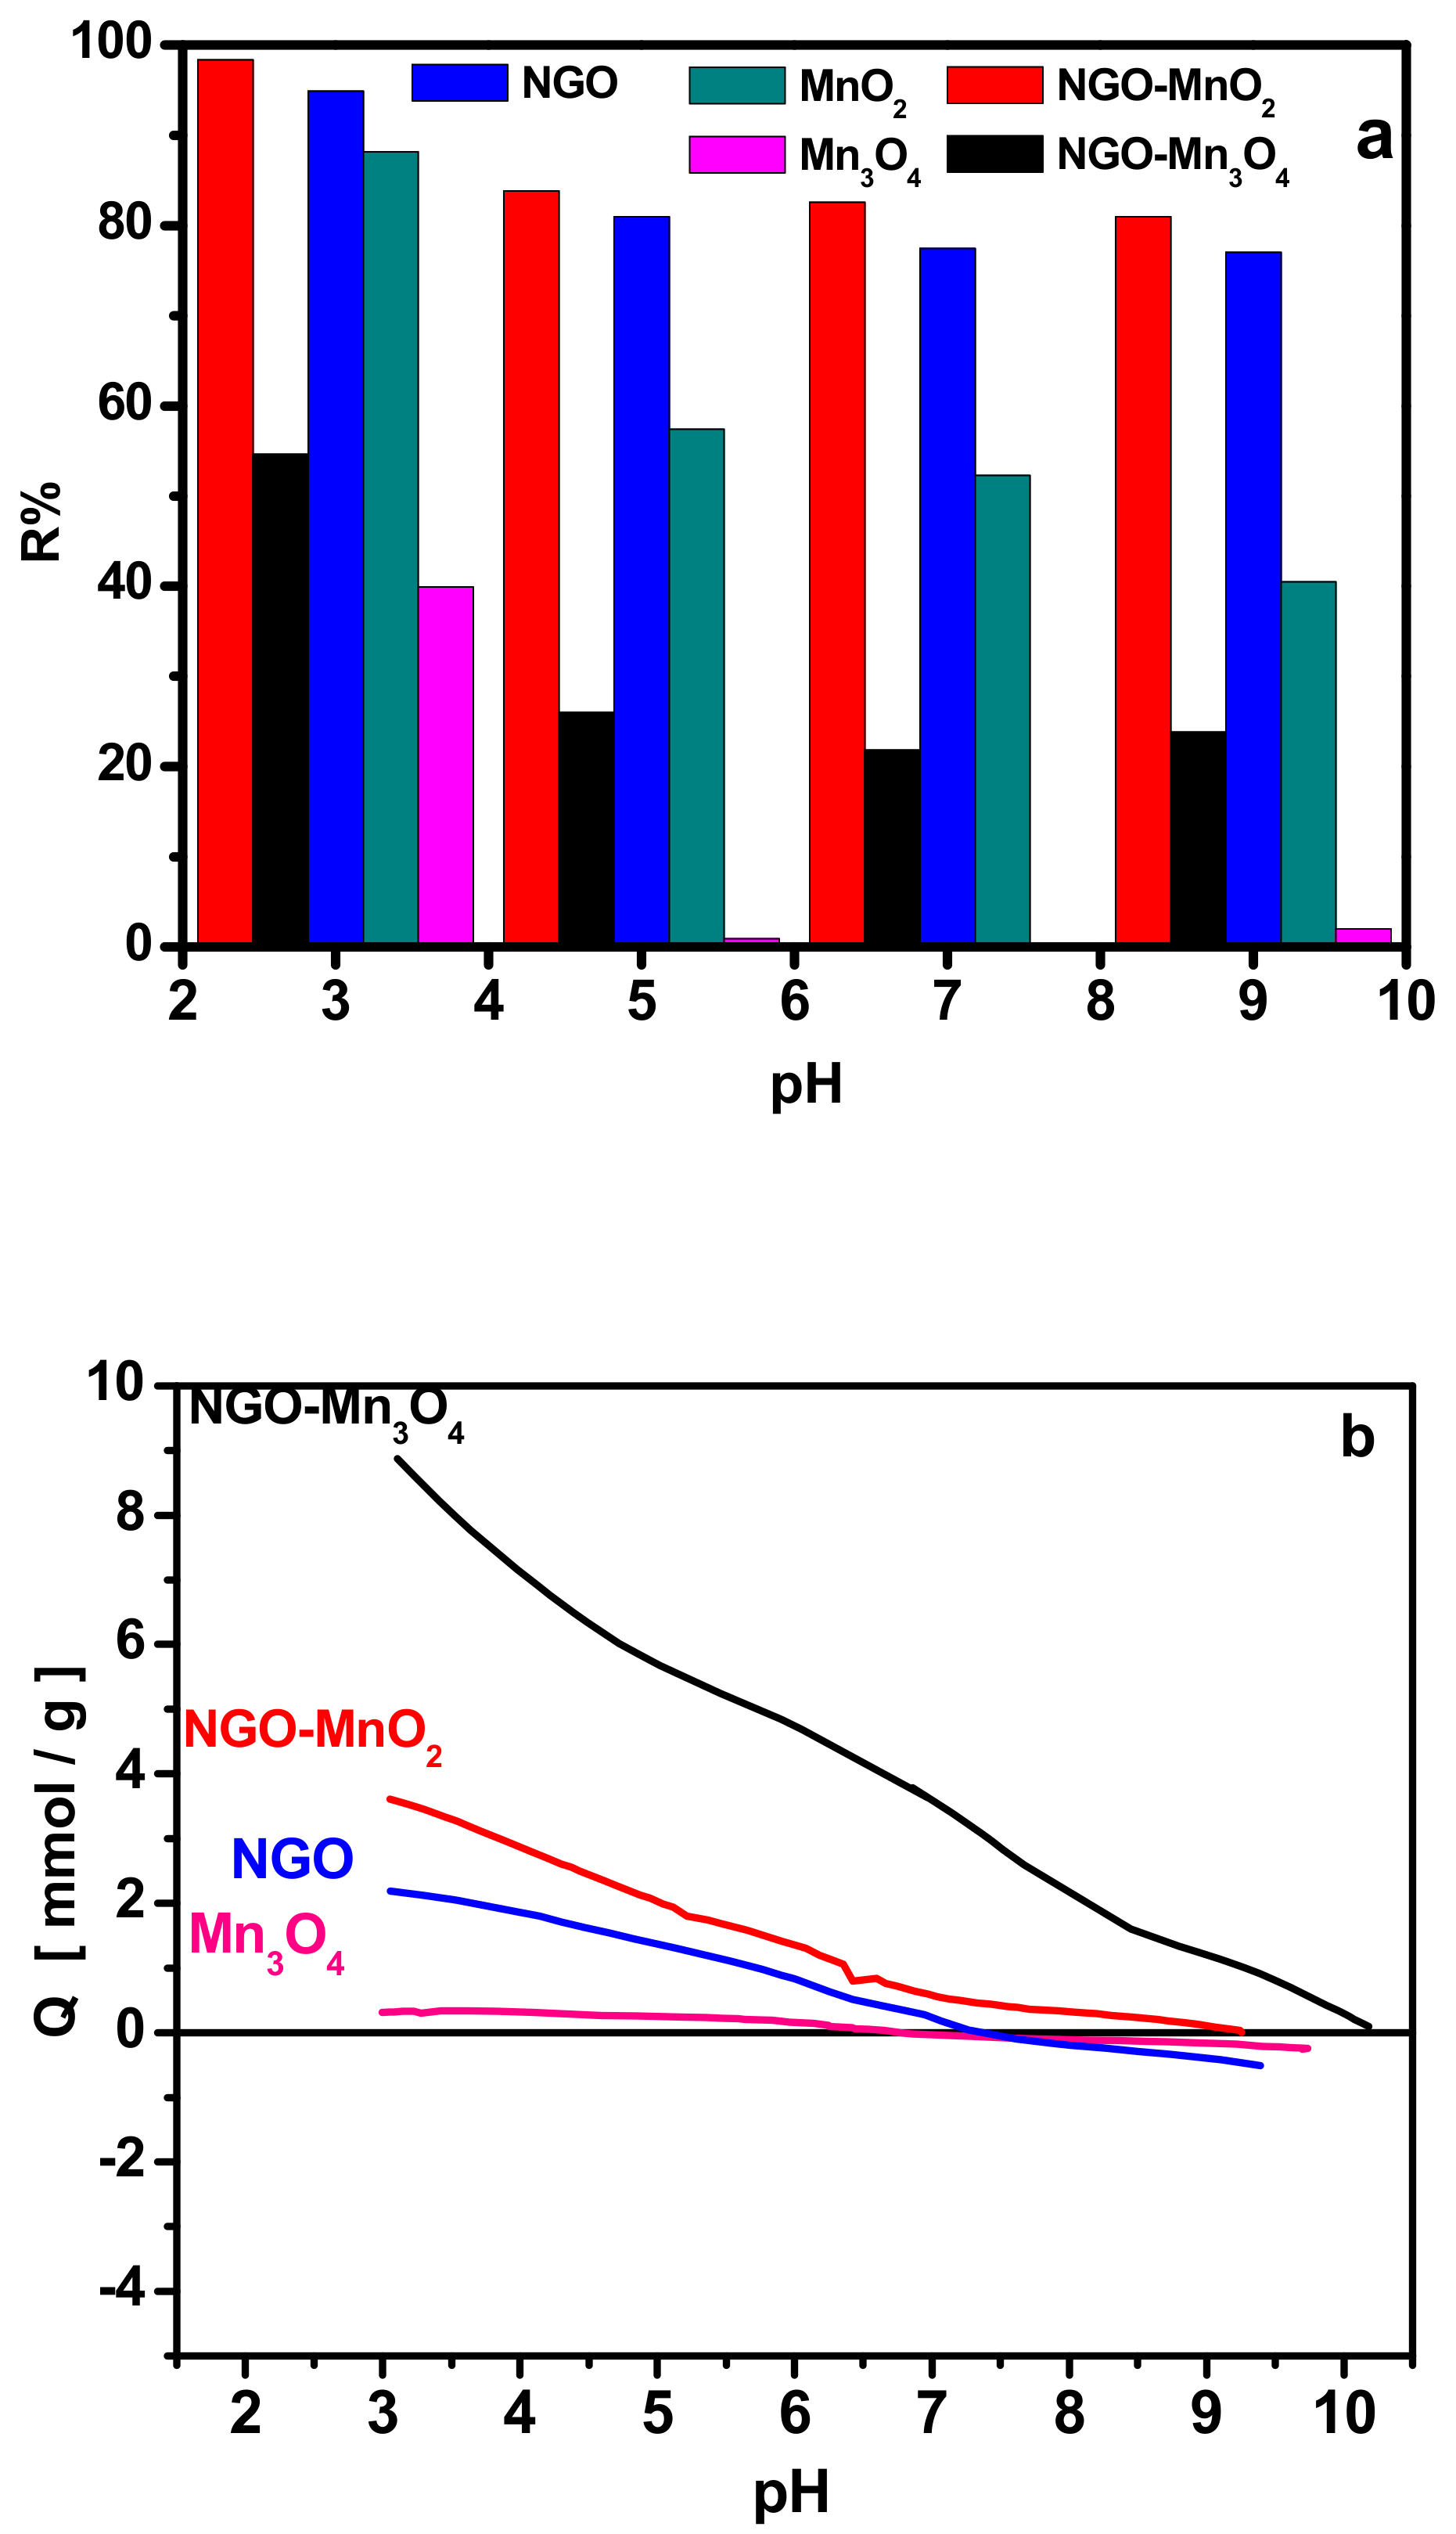
The effect of solution pH on RB5 removal/degradation was examined in the pH range of 3–9 and the results are illustrated in Figure 3. From the Figure it is seen that the degradation efficiency decreased with the pH increase (89% at pH 3.0 to 43% at pH 9.0 for MnO2), indicating that the degradation of RB5 by the under-examination materials is facilitated in acidic solutions. Oxidation of organic pollutants by Mn3O4 and MnO2 is usually pH-dependent, because of the pH-dependent redox potential of MnO2/Mn2+ and the speciation of organic pollutants [52]. This dependence may be attributed to the fact that MnO2 requires the involvement of protons to be reduced to Mn2+ and/or to the fact that the RB5 oxidation is considered a surface reaction connected to the surface chemistry and charge of the materials involved [53].
The importance of the solution pH is due to the fact that it impacts the surface charge of the supporting material that acts as adsorbent (NGO). The pKa values of RB5 found to be almost close to 3.8 and 6.9. The pKa of the sodium sulfonate groups (-SO3Na i. e. sulfonic groups) attached to the dye molecules are known to be very low and can reach negative values, while the pKa value of 3.8 is close to the pKa of aniline (i.e., 4.6) and can be attributed to the –NH2 groups of the dye molecules. This means that at pH lower than 3.8 and higher than the pKa of the sulfonate groups, the dye molecules are in their anionic forms and have got the highest negative charge. From the potentiometric titrations results the nanocomposites’ surface is positively charged at pH lower than this value [40]. Thus, in acidic medium, the electrostatic attractions between the anionic dyes and the positively charged surface of the nanocomposites are maximized, so that the pH-dependent adsorption isotherms of the dye show nanocomposites’ surface by π-π and hydrophobic interactions as well as by electrostatic attractions. Since the maximum decolorization occurred at pH 3, equilibrium and kinetic experiments were performed at this pH.
3.2.2. Effect of Initial Concentration of RB5
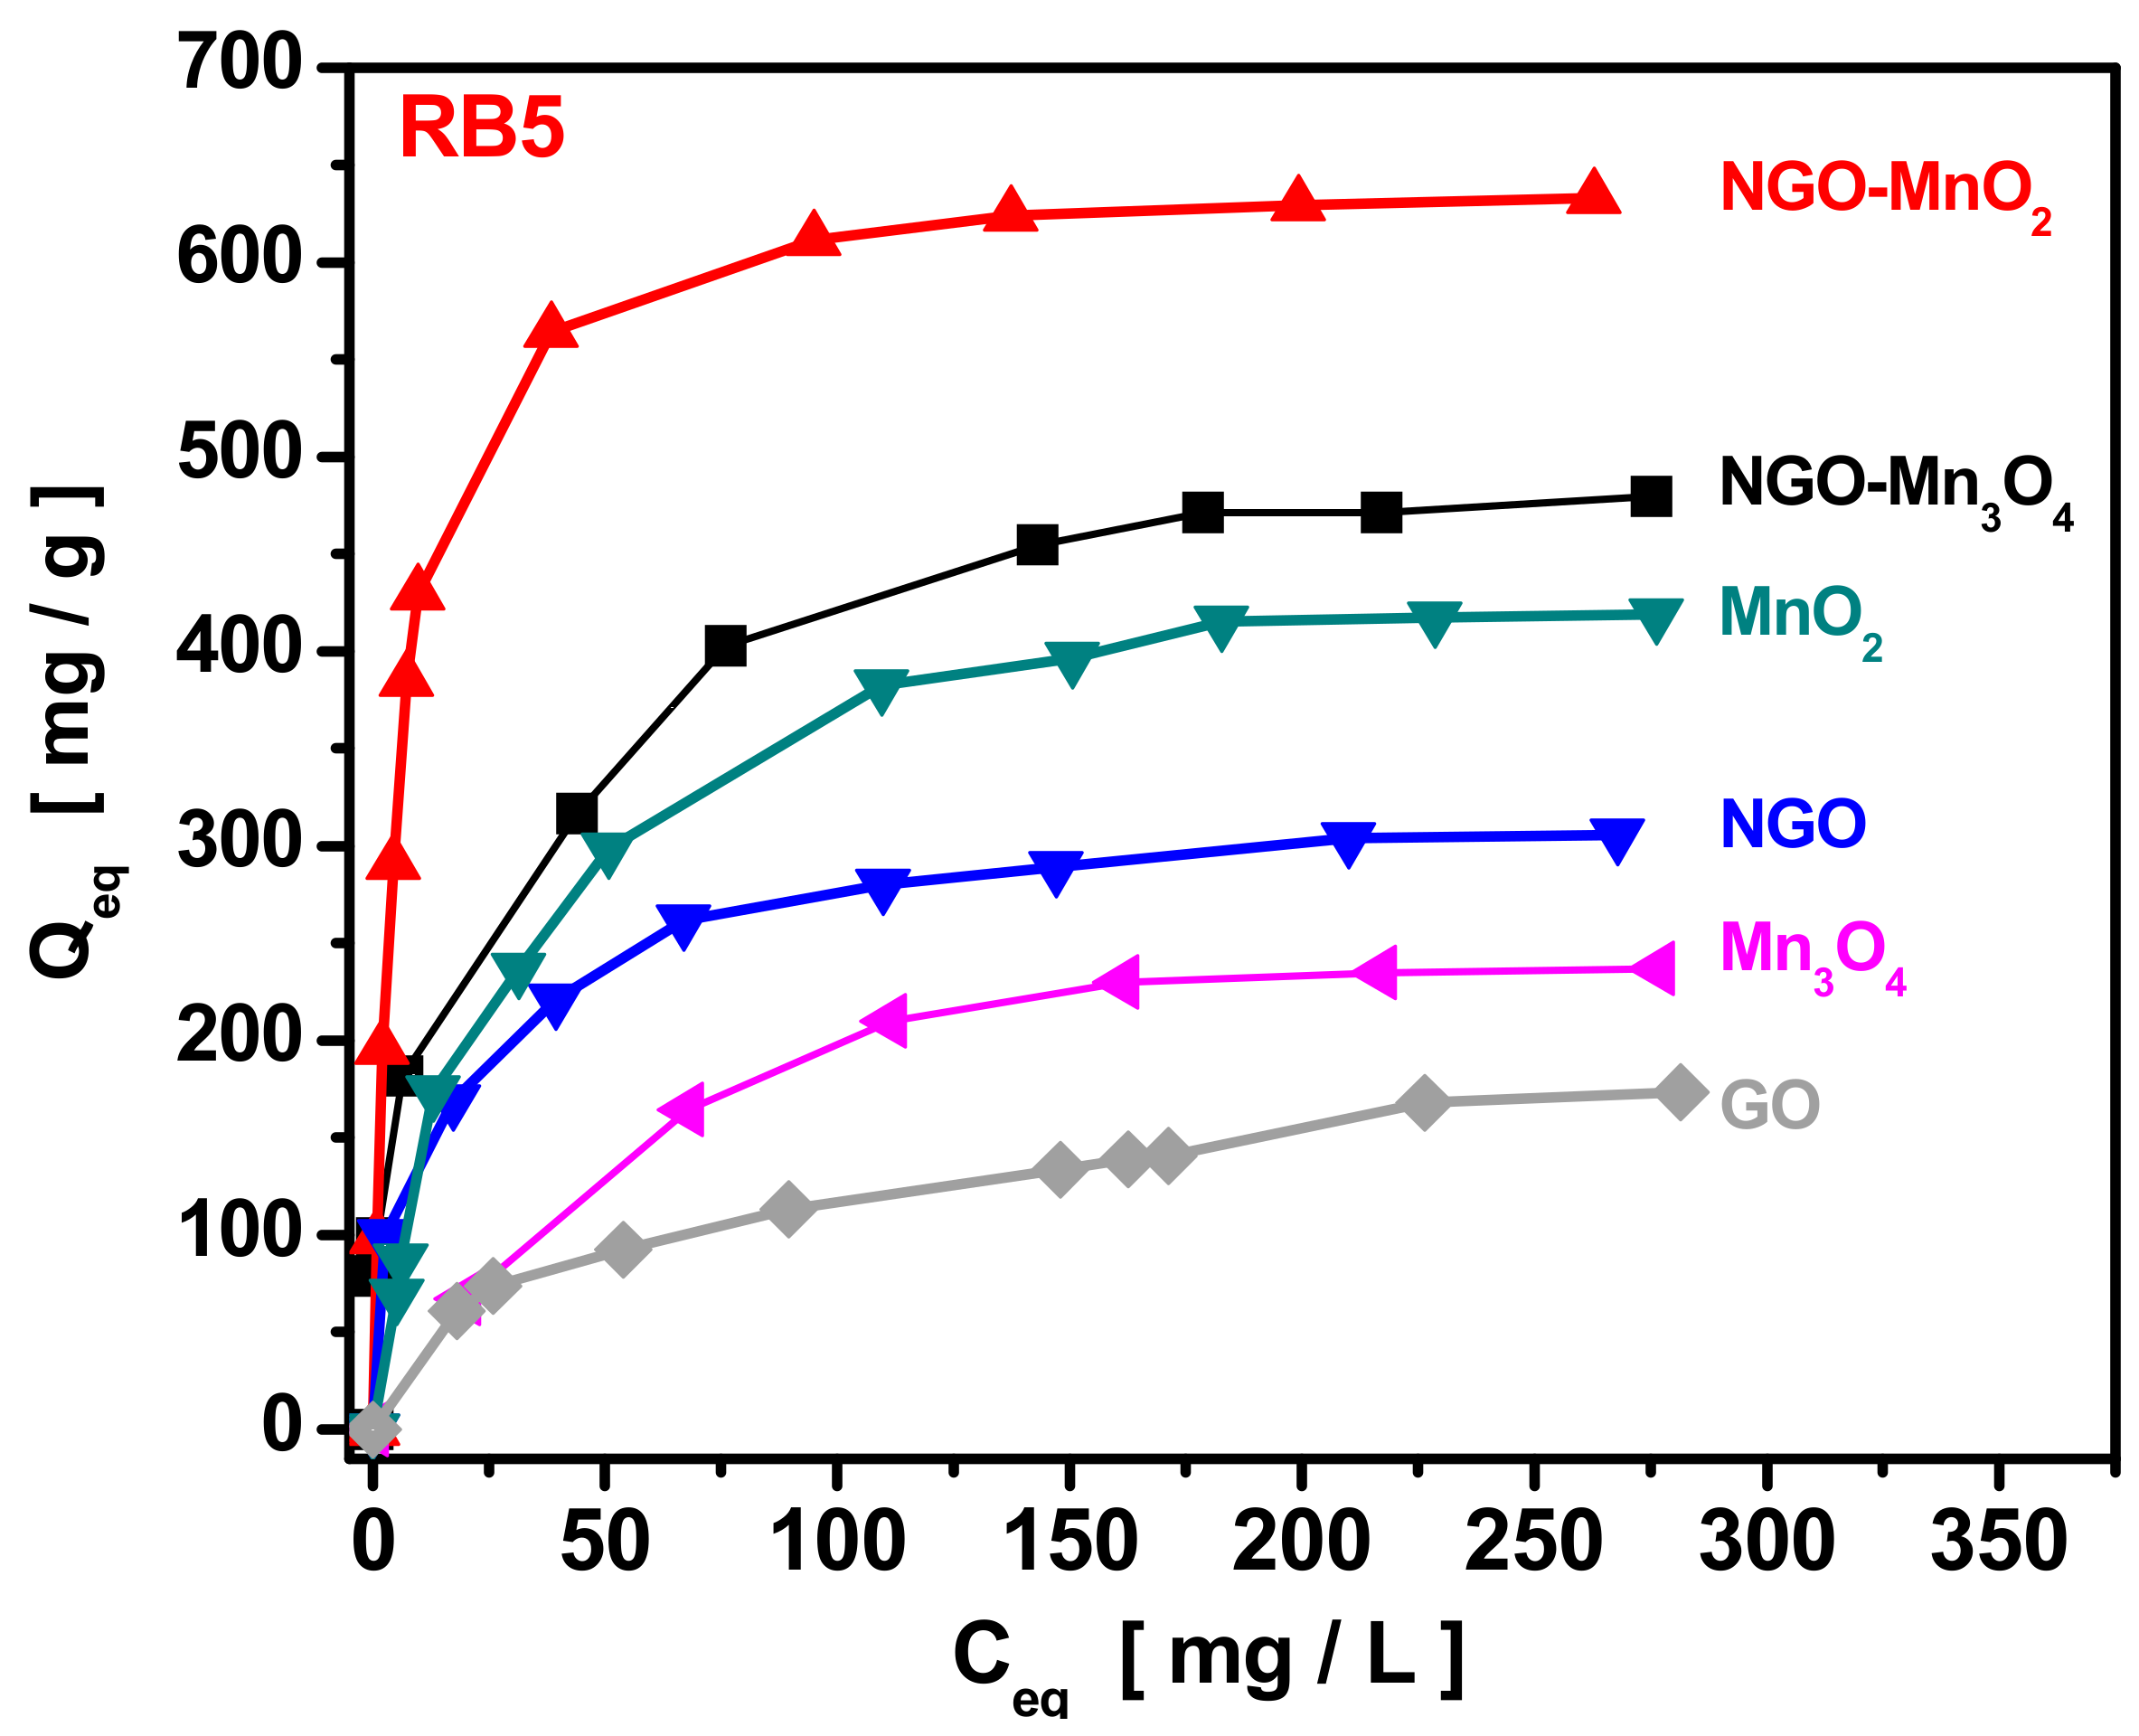
Experiments addressing the effect of the RB5 initial concentration were performed for pure manganese oxides (MnO2 and Mn3O4), pure GO (for comparison) and NGO as well as for NGO–Mn3O4 and NGO–MnO2 nanocomposites in order the maximum removal ability of the catalysts to be estimated; the results are presented in Figure 4. Since the RB5 removal mechanism on the nanocomposite is expected to be complex and to involve adsorption and degradation, the RB5 removal curves were not fitted to any theoretical isotherm. The removal results in Figure 4 indicate that the application of the nanocatalysts at pH 3 presented an increase dye removal with the NGO–MnO2 to present the highest one. The removal for NGO–MnO2 was about 600 mg RB5 per gram of the solid material while the order of the removal was GO, Mn3O4 < NGO < MnO2 < NGO–Mn3O4 < NGO–MnO2. The removal for NGO found to be about 300 mg RB5/g while for pure GO was about 150 mg/g this increase can be due to the surface chemistry changes of GO after the NaOH modification that led to lower oxygen surface functional groups enhancing this way the adsorption of RB5 molecules. For both nanocomposites, the maximum removal they achieved was higher than that of their precursors.
3.2.3. Effect of Contact Time
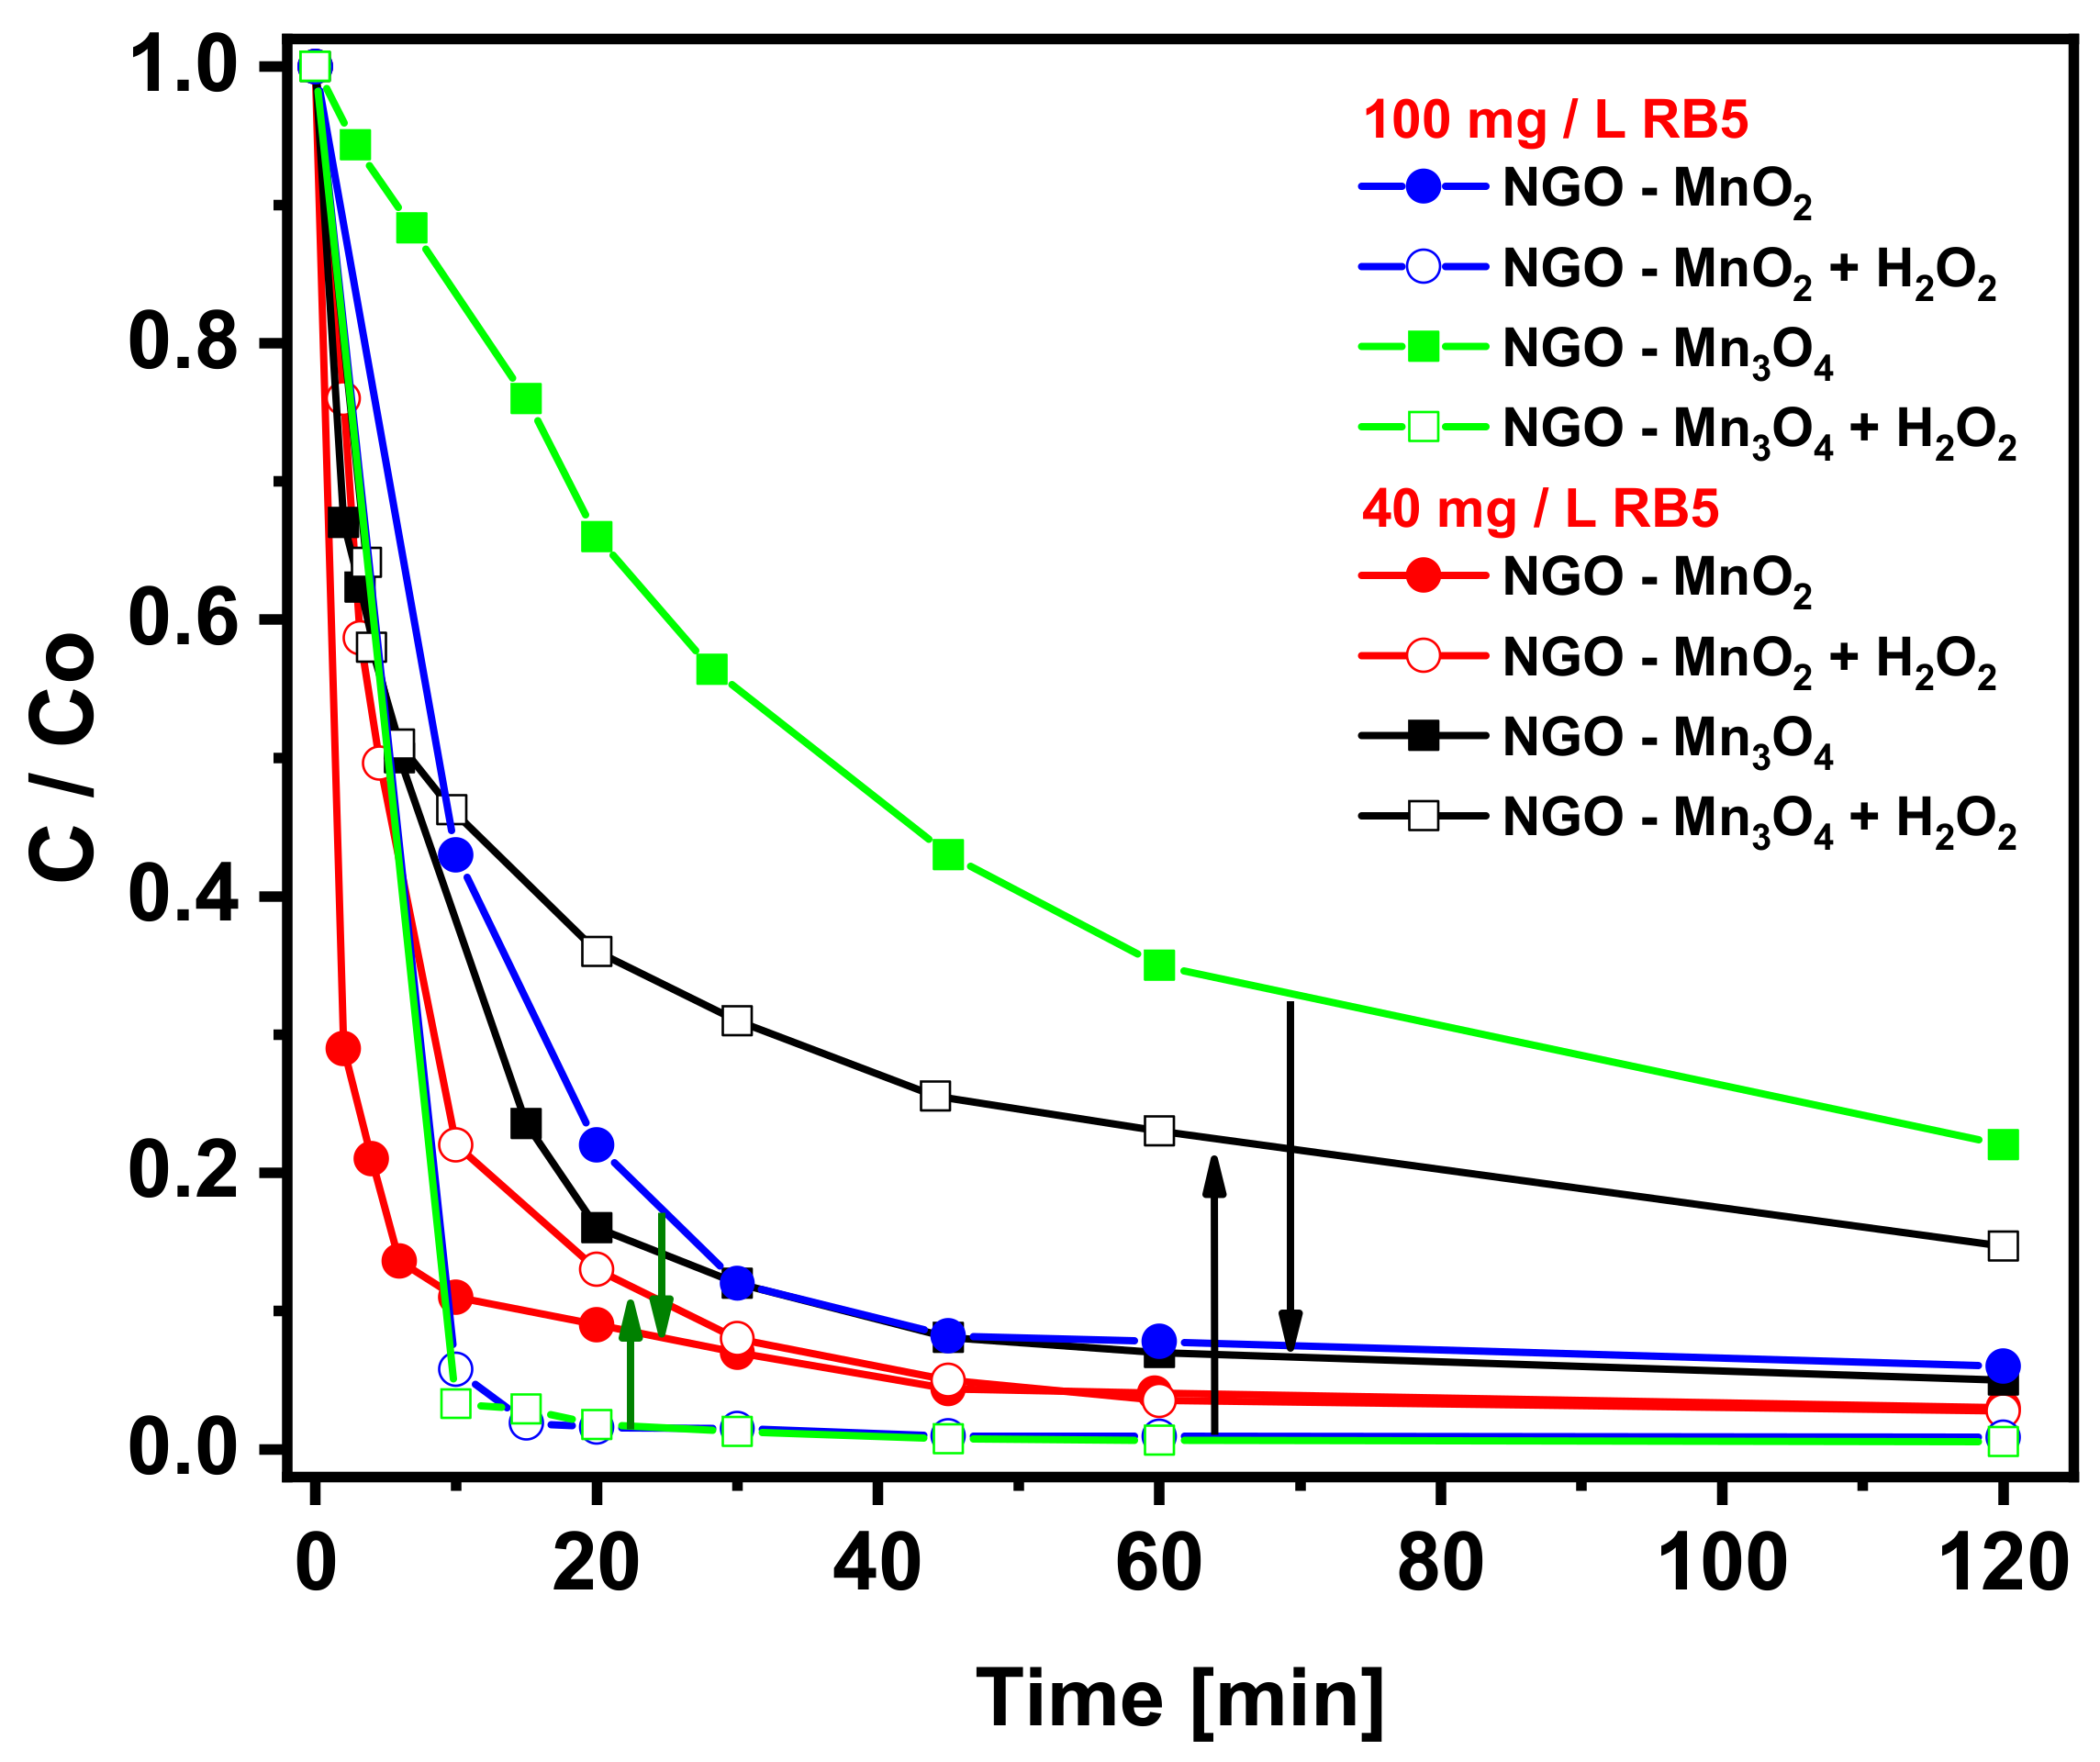
The kinetic experiments were carried out in aqueous solutions of RB5 for two different initial concentrations (40 and 100 mg/L) in absence (non radical oxidation) and presence (radical oxidation) of H2O2. The appropriate for complete mineralization concentration of H2O2 found to be 0.15 M, estimated from the equation:
2C26H21O19N5S6Na4 + 87H2O2 → 52CO2 + 108H2O + 8Na + 10N + 12S
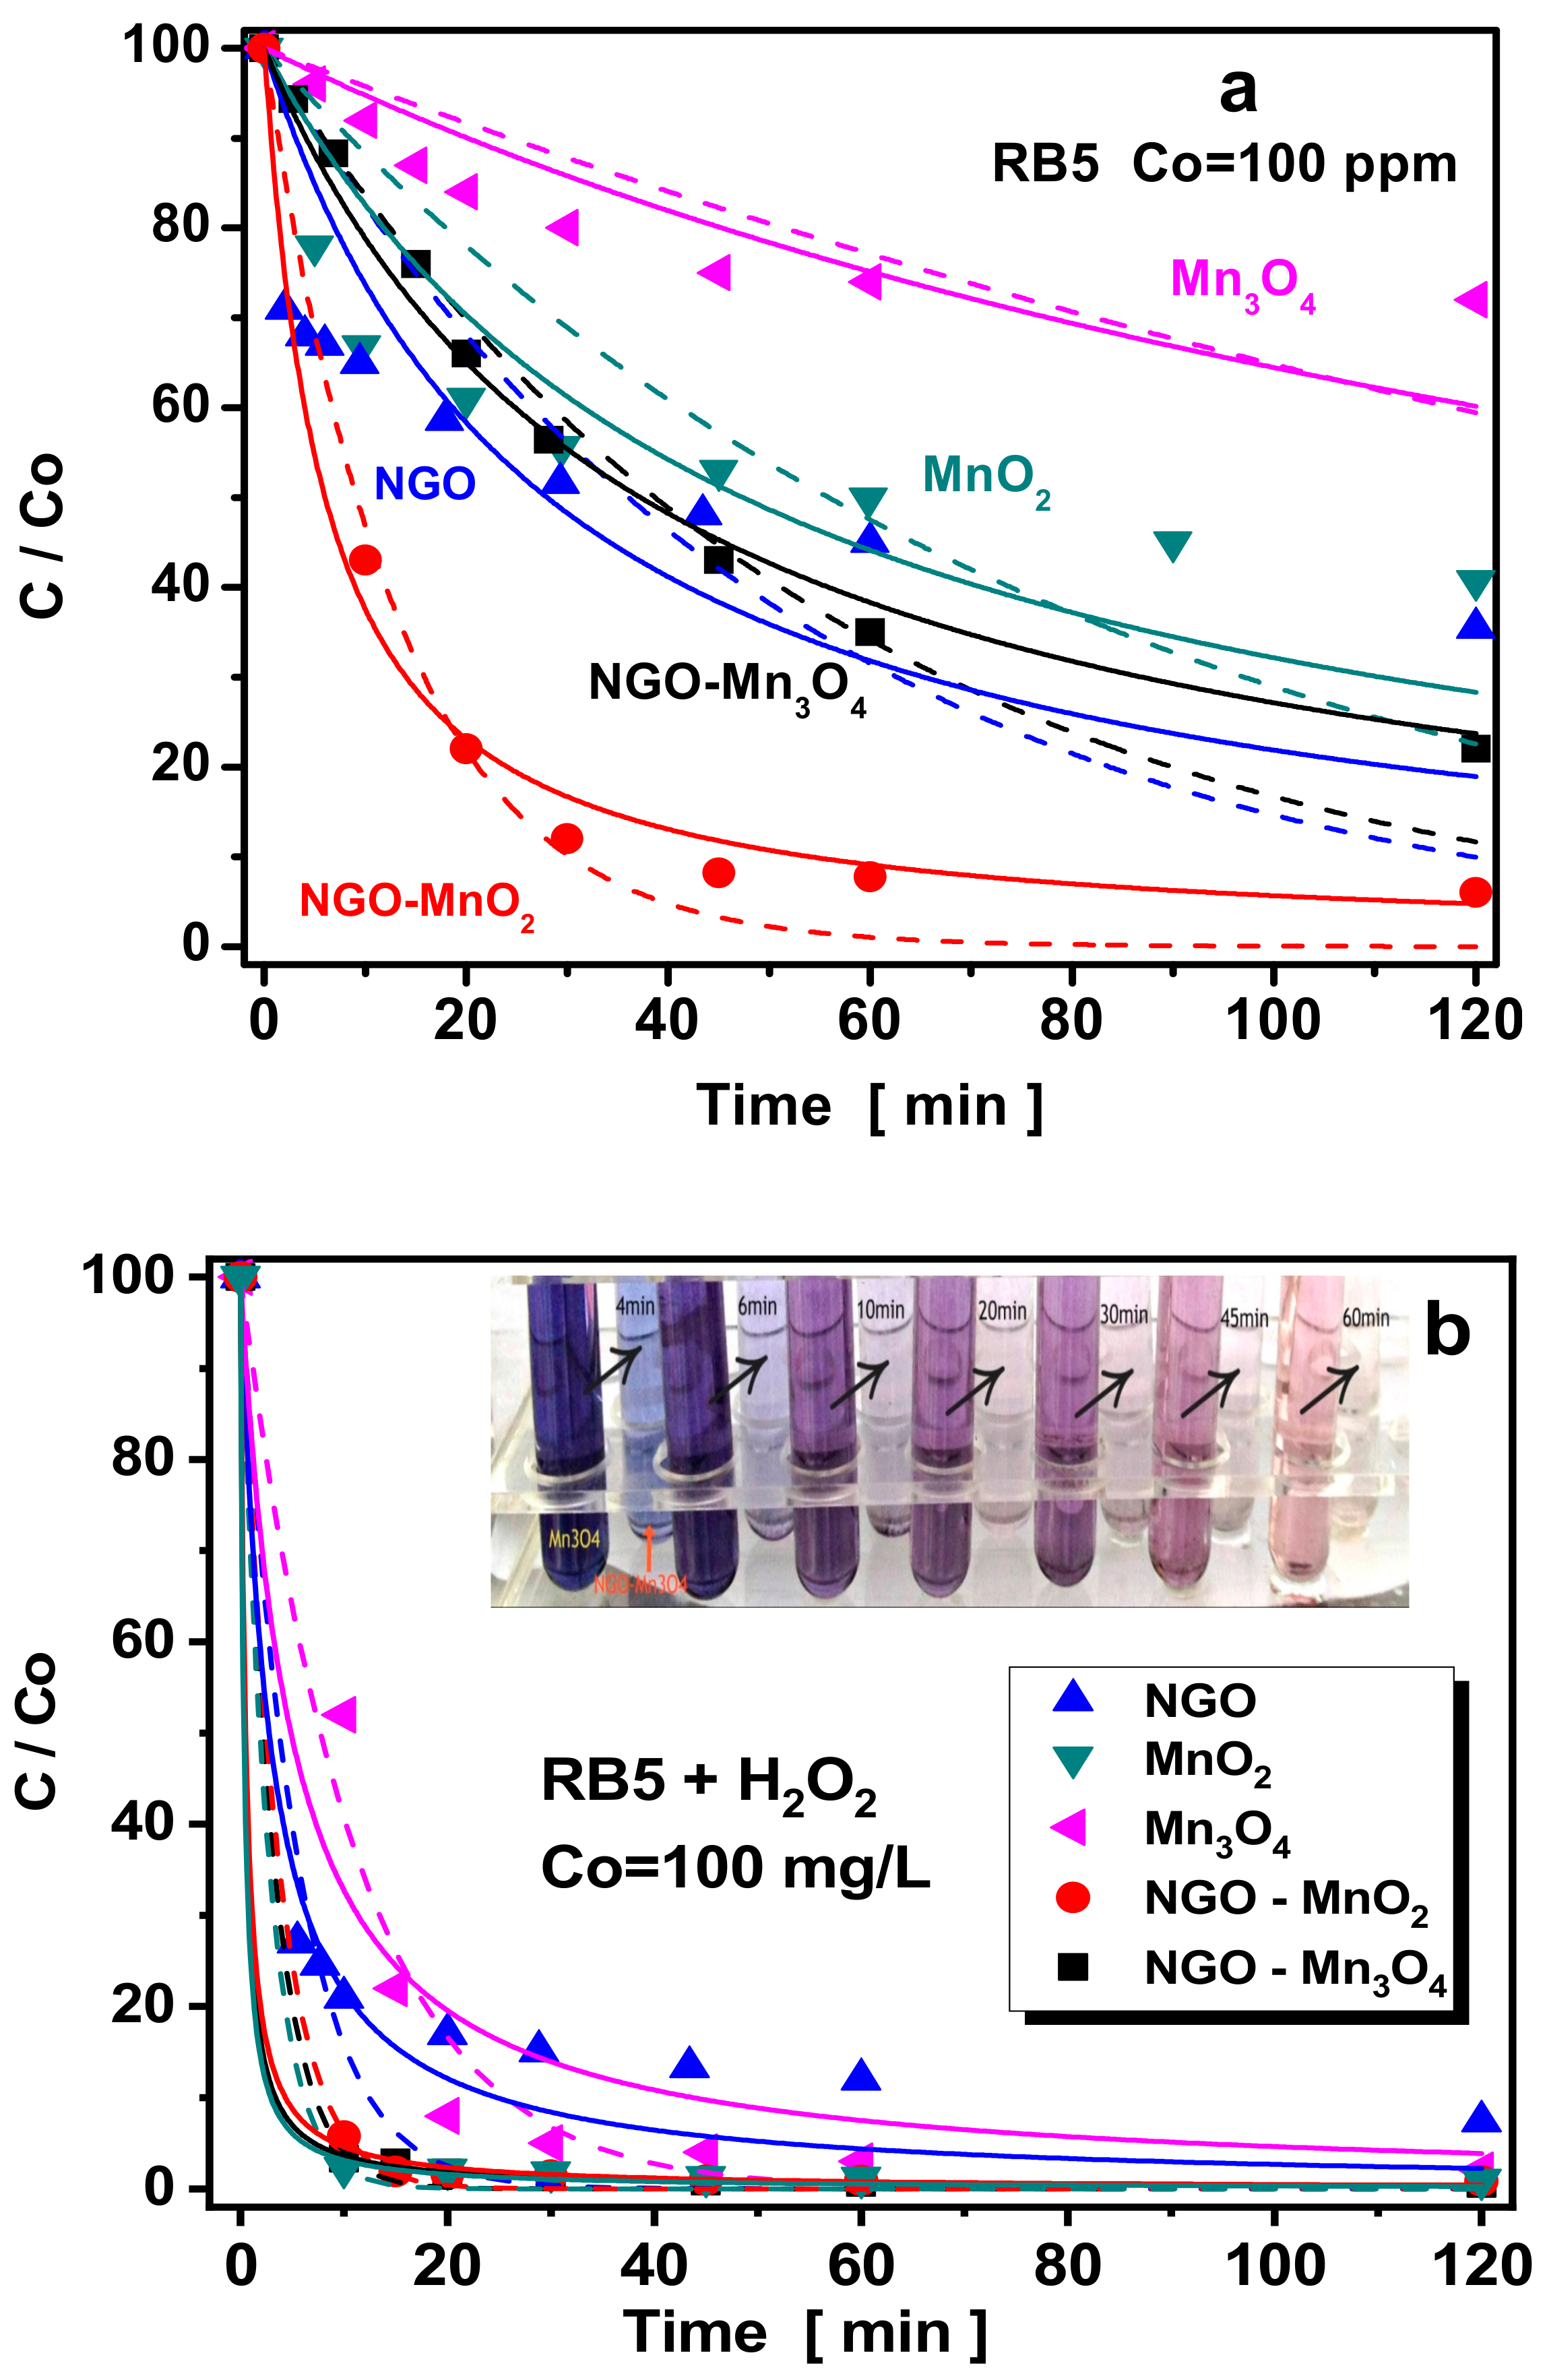
From the experimental results shown in Figure 5 and Figure 6, equilibrium was attained at 60 min for all samples. The nanocomposites presented higher removal than the pure manganese oxides, indicating an improved decolorization, may be due to the synergetic effect of adsorption-oxidation.
The pseudo-first order (dashed lines) and pseudo-second order (compact lines) kinetic models were fitted to the experimental results and the kinetic parameters, as well as the goodness of the fit, are presented in Table 2. From the Table, it is concluded that pseudo-second order kinetic model presented a better fit and R2 indicative of a synergetic adsorption-degradation mechanism and not a neat degradation.
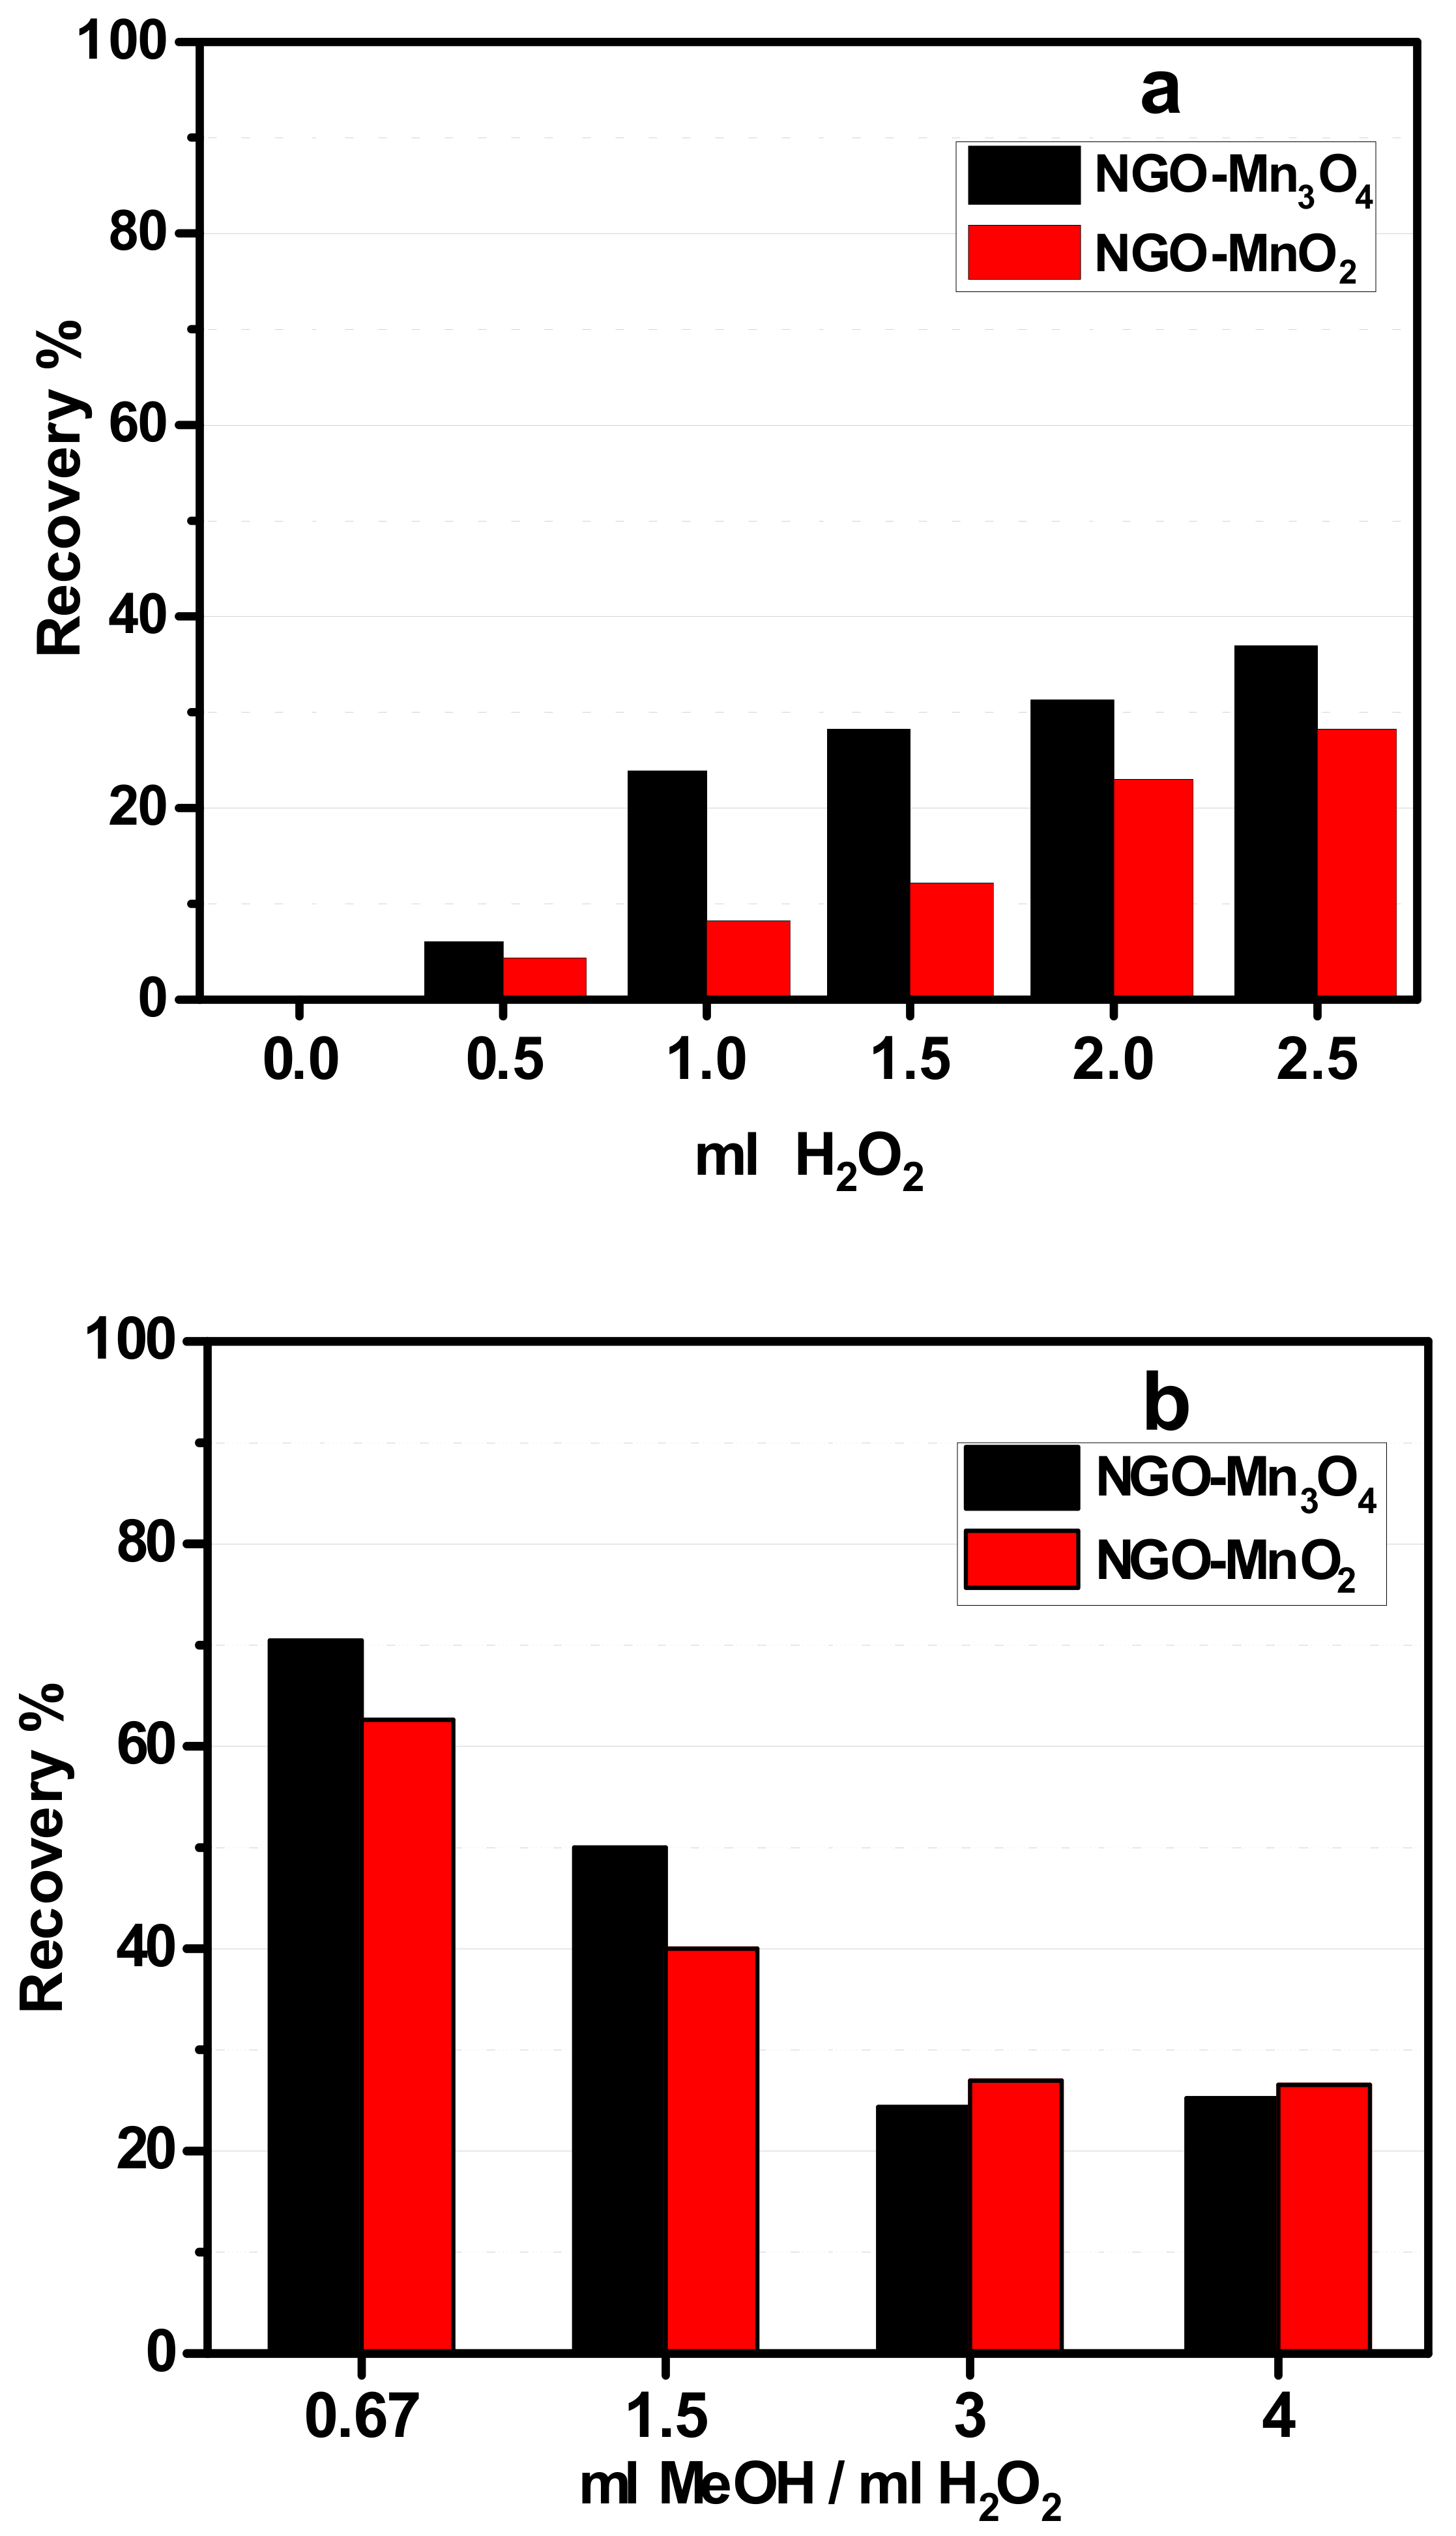
As presented in Figure 5b the presence of H2O2 increased the RB5 degradation. This could be attributed to the effect of •OH radicals that could be enhanced by the increase concentration of H2O2. For this reason, the influence of different doses of H2O2 concentration on RB5 oxidative degradation was investigated, and the results are presented in Figure 7a. From this Figure, it is concluded that with the increase of H2O2 dose from 0.05 mM until the concentration of 0.15 mM, the RB5 degradation increases. In non-radical oxidation, the nanocomposites presented a better performance than the respective manganese oxides while in radical oxidation their performance was similar (Figure 5b).
The contribution of OH radicals to RB5 degradation was examined by adding methanol to the suspension as scavenger. In Figure 7b the influence of different concentrations of methanol as a quenching agent is presented. As seen from the Figure, the increase of methanol volume results to a decrease of RB5 degradation. It can be concluded that OH• radicals are generated during the reaction, react rapidly with methanol, resulting in the decrease of RB5 oxidation. Both nanocomposites showed similar decrease. The effect of the scavenging leads to the conclusion that surface-bound OH• play the dominant role in the RB5 degradation.
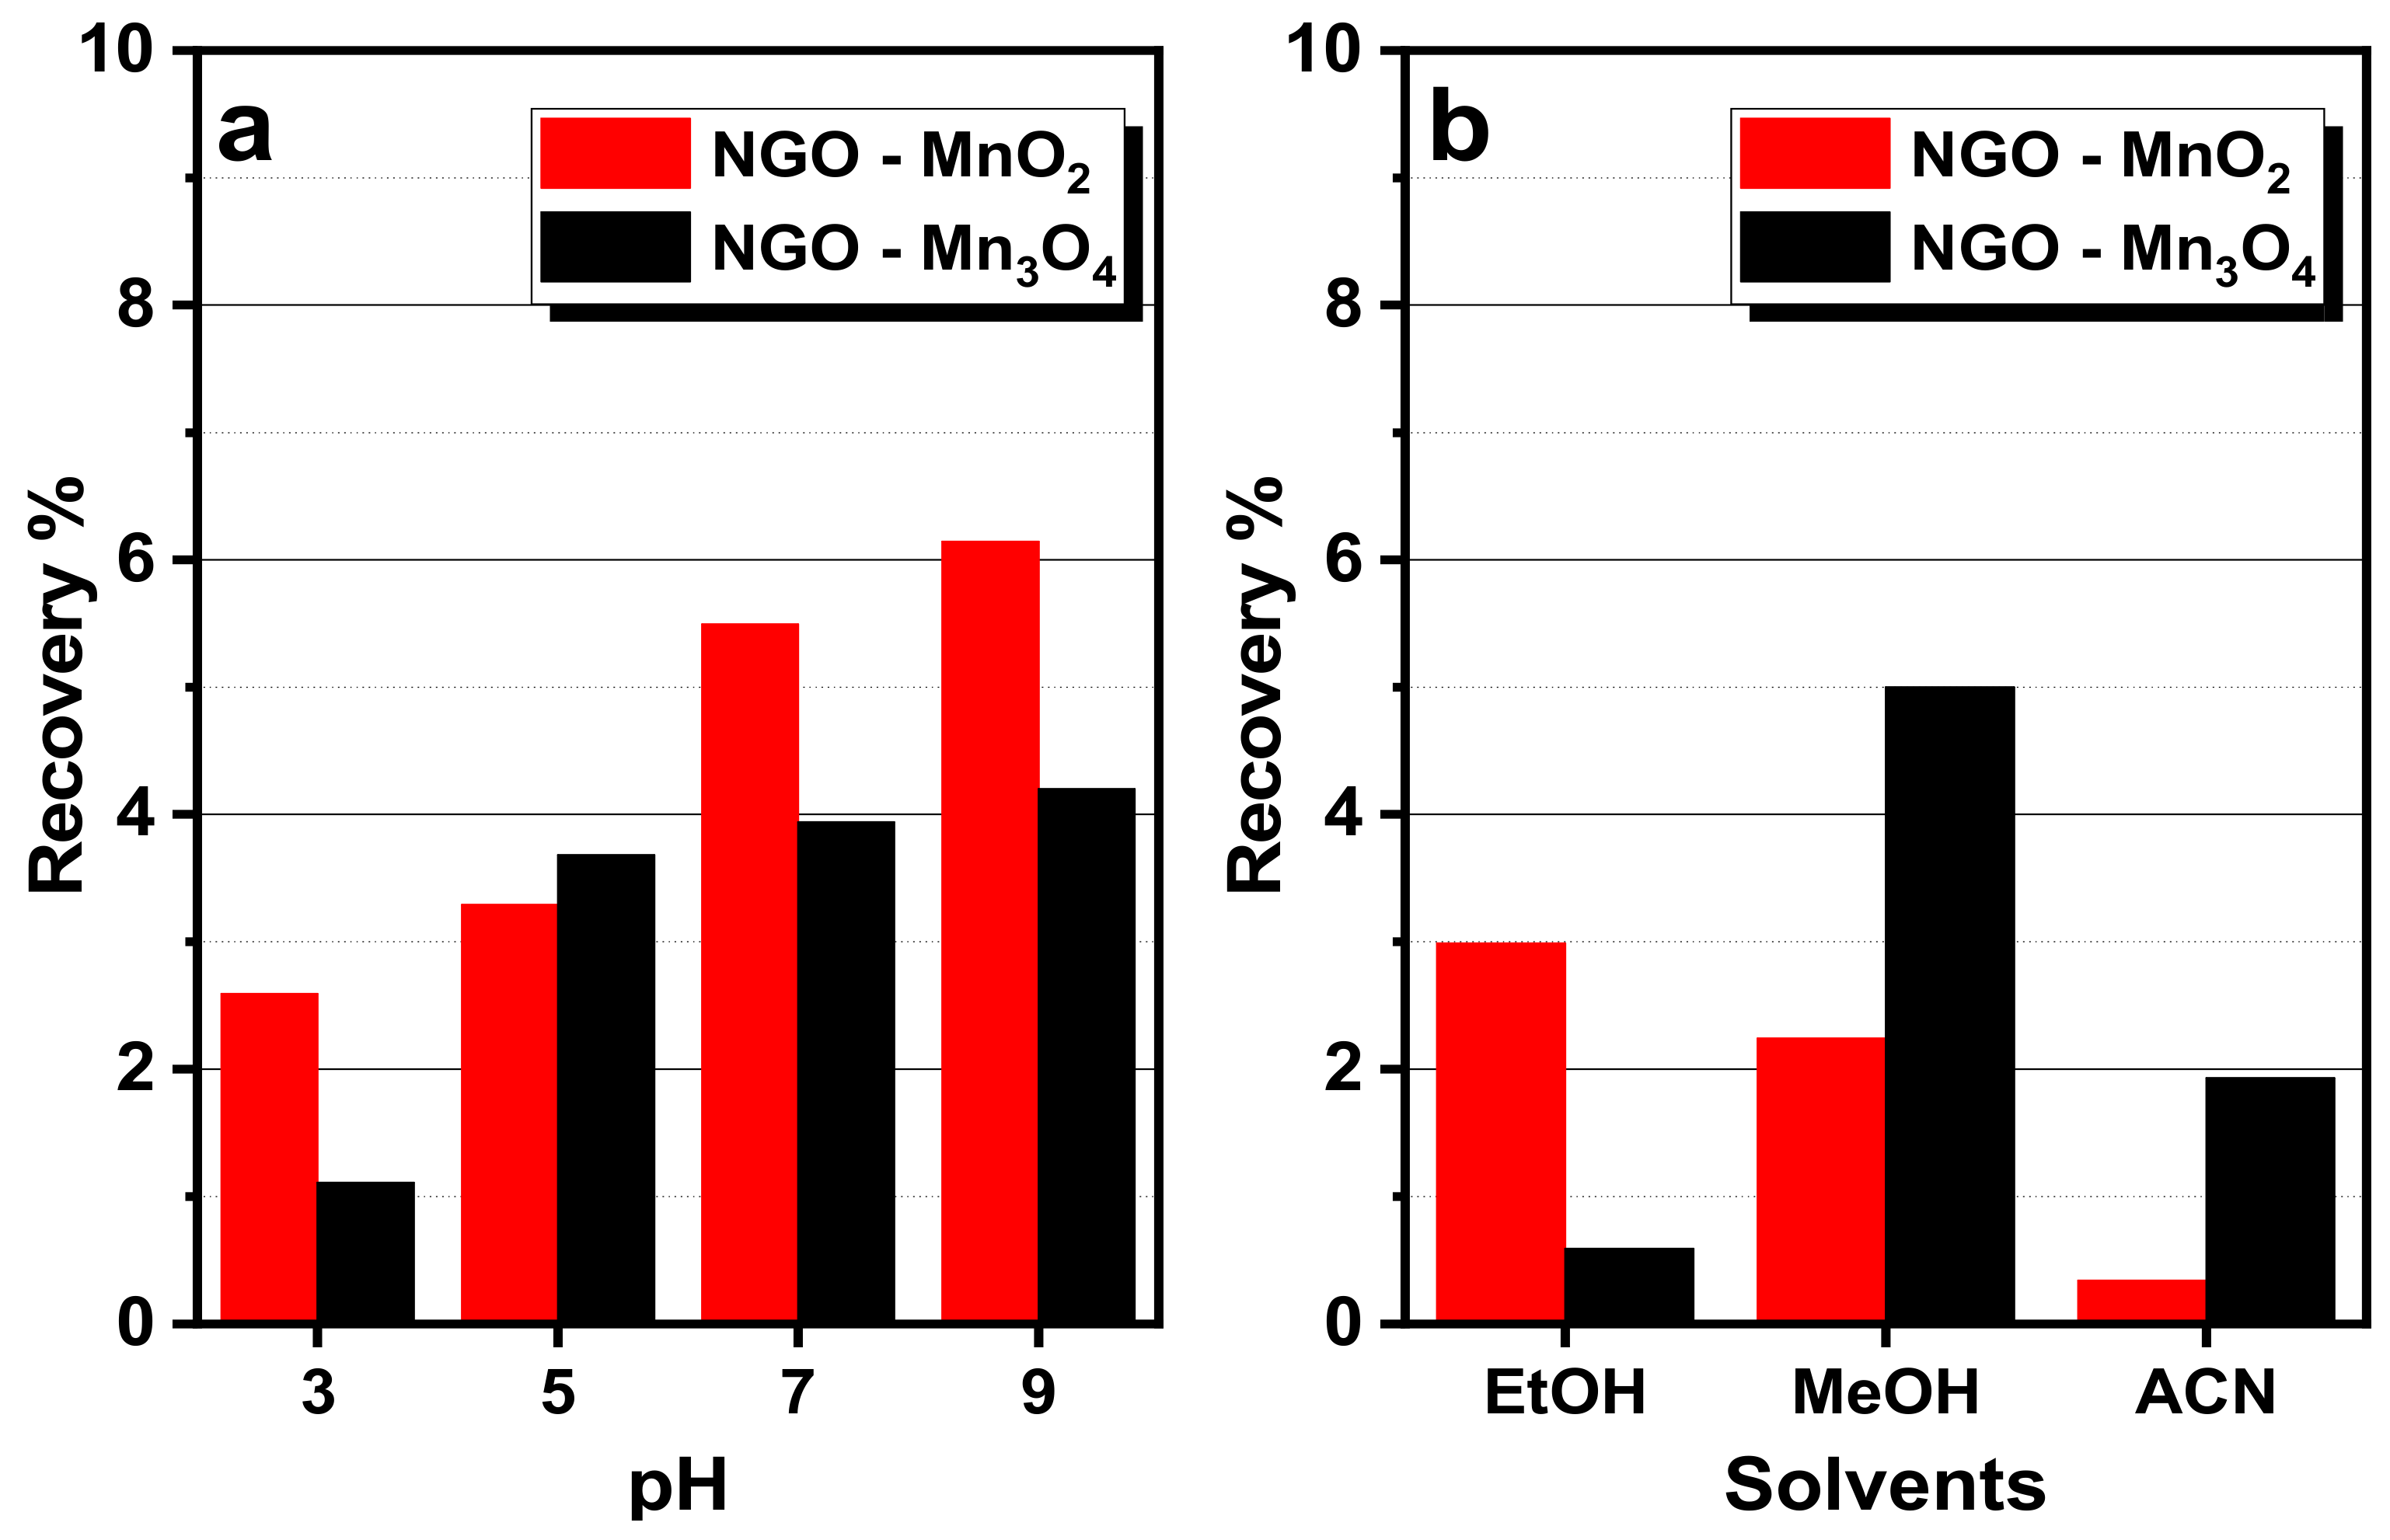
The possible reuse of the loaded materials was studied, in order to assess the environmental safety of the composites, for this reason, the elution ability was tested for the nanocomposites and the results are presented in Figure 8. Deionized water, at a range of pH values (Figure 8a), as well as ethanol, methanol and acetonitrile (Figure 8b) were used as eluents for RB5 elution from loaded NGO–Mn3O4 and NGO–MnO2 nanocomposites. The maximum desorption capacity for NGO–Mn3O4 and NGO–MnO2 that was found about 4.2% and 6.1% of the removed RB5 respectively, was noticed at pH 9.0, where the RB5 retention forces were deteriorated, conflicting to adsorption that found to be more effective at pH 3.0.
The organic solvents that were also tested for RB5 elution from the nanocomposites, found to be less effective than deionized water at pH = 9.0, with methanol to be the optimal eluent. The low desorption capacity led to the conclusion that the amount of RB5 eluted from the used nanocomposites are in agreement with the total non-degradated dye.
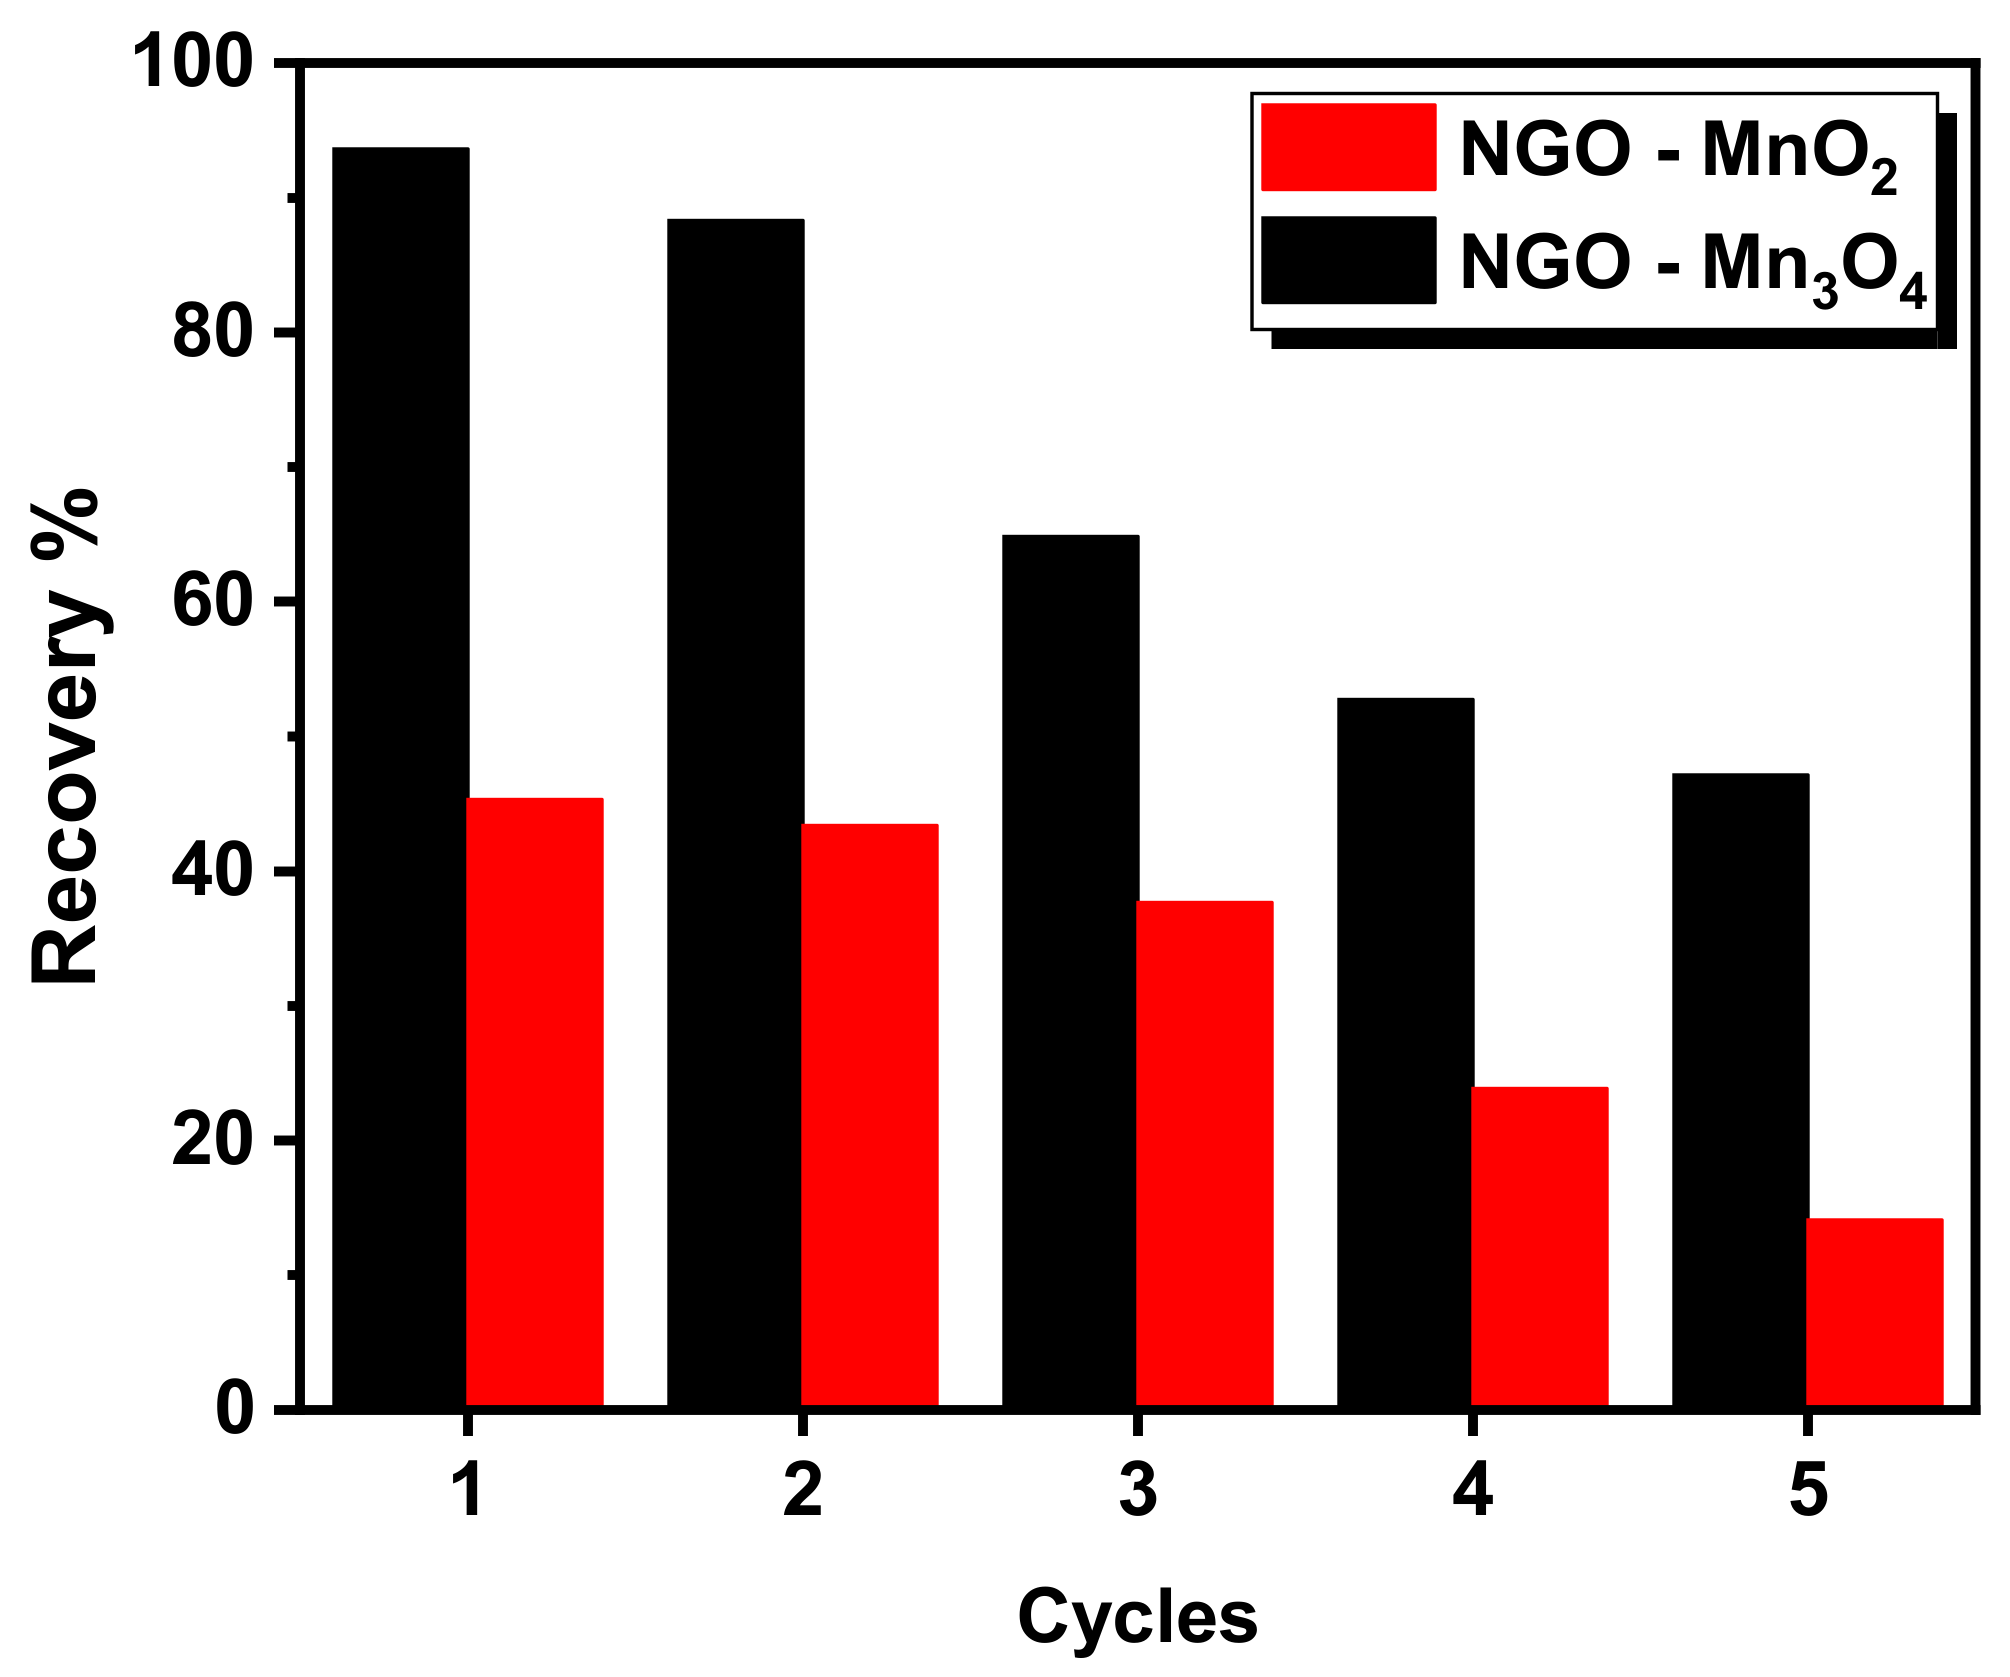
For the examination of the reuse of the nanocomposites, the spent materials were eluted with methanol and reused for further application for 5 cycles. The results are presented in Figure 9. The decrease of their gradual degradation ability during the 5 cycles may be attributed either to the elution of Mn in the solution during the degradation that resulted to the reduction of their efficiency or to the oxidation of the RB5 into smaller molecules that were adsorbed on the nanocomposites’ surface, having as a consequence their pore blocking and the decrease of their further adsorption ability.
For the examination of the materials’ stability the leaching of manganese in the solution, after RB5 degradation for 2 h, was examined and the measurements of the manganese in the reaction solutions were performed by ICP. From the results, presented in Table 3, it is shown the low percentage of the eluted manganese in the solution compared to the Mn concentration in the material, as well as the stability of the materials and the beneficial effect of the NGO support during the RB5 degradation.
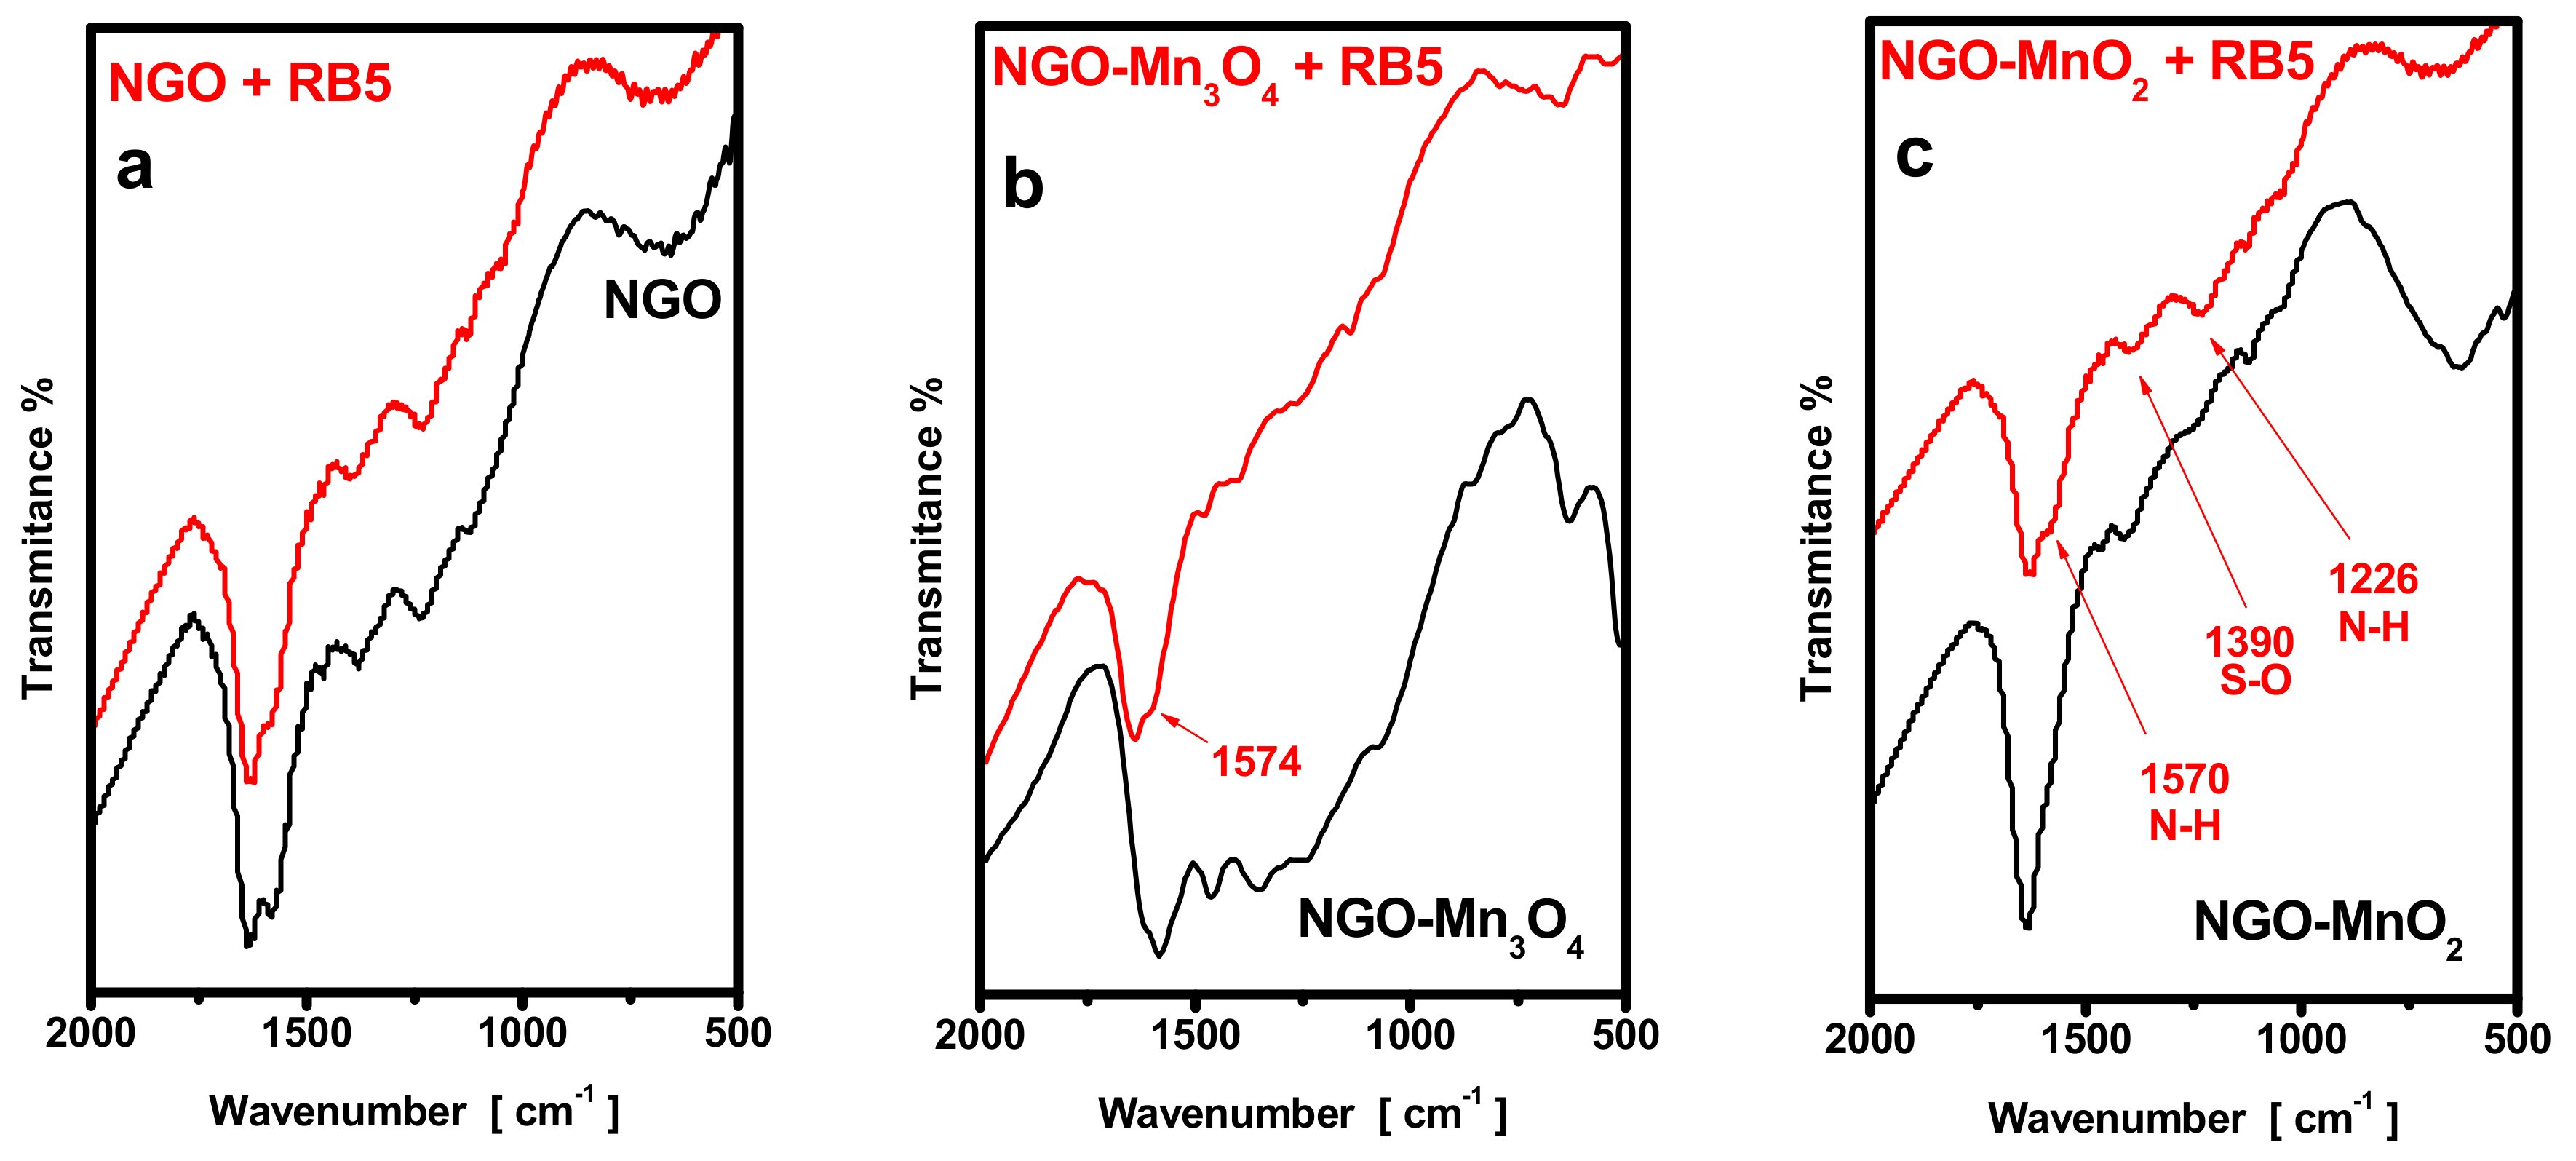
The FT-IR spectra of NGO support and of the nanocomposites prepared, presented in Figure 10, provide information about their surface chemistry before (black line) and after the degradation of RB5 (red line). For the NGO support, the spectrum shows bands at 1110, 1228, 1370, 1460, and 1580 cm−1 that may correspond to alkoxy, epoxy and carboxyl groups, respectively [54]. The spectrum of NGO–Mn3O4 nanocomposite, revealed that the carboxyl bands of NGO were not visible, may be due to their participation as nucleation centers and/or as a consequence of the thermal treatment during the synthesis. The broadness of the band at about 1200 cm−1, attributed to C–O bonds, may illustrate the presence of -OH groups on the surface of NGO. The peaks at 1450 cm−1 are indicative of stable forms of chemisorbed oxygen, while the bands at 621 and 592 cm−1 are characteristic of the Mn–O stretching modes of the manganese oxide nanoparticles and reveal the successful impregnation of manganese oxide into the carbon matrix.
The spectra of the nanocomposites after the degradation of RB5, reveals bands that may be attributed to reaction products formed after the reaction between the dye and their functional groups. The shoulder appeared at ~1574 cm−1 and the bands at ~1226 cm−1 could be attributed to N-H bending and C-N bond respectively, as a result of the cleavage of the -N=N- bond of the dye that resulted to the formation of primary amines. The bands at ~1390 cm−1 revealed the presence of surface species with sulfone and/or sulfonate groups indicative of RB5 degradation. Similar results have been presented by Mbarek et al. after degradation of RB5 by Mn85Al15 particles [55] as well as by Méndez-Martınéz et al., [56] after electrochemical treatment of RB5 solution.
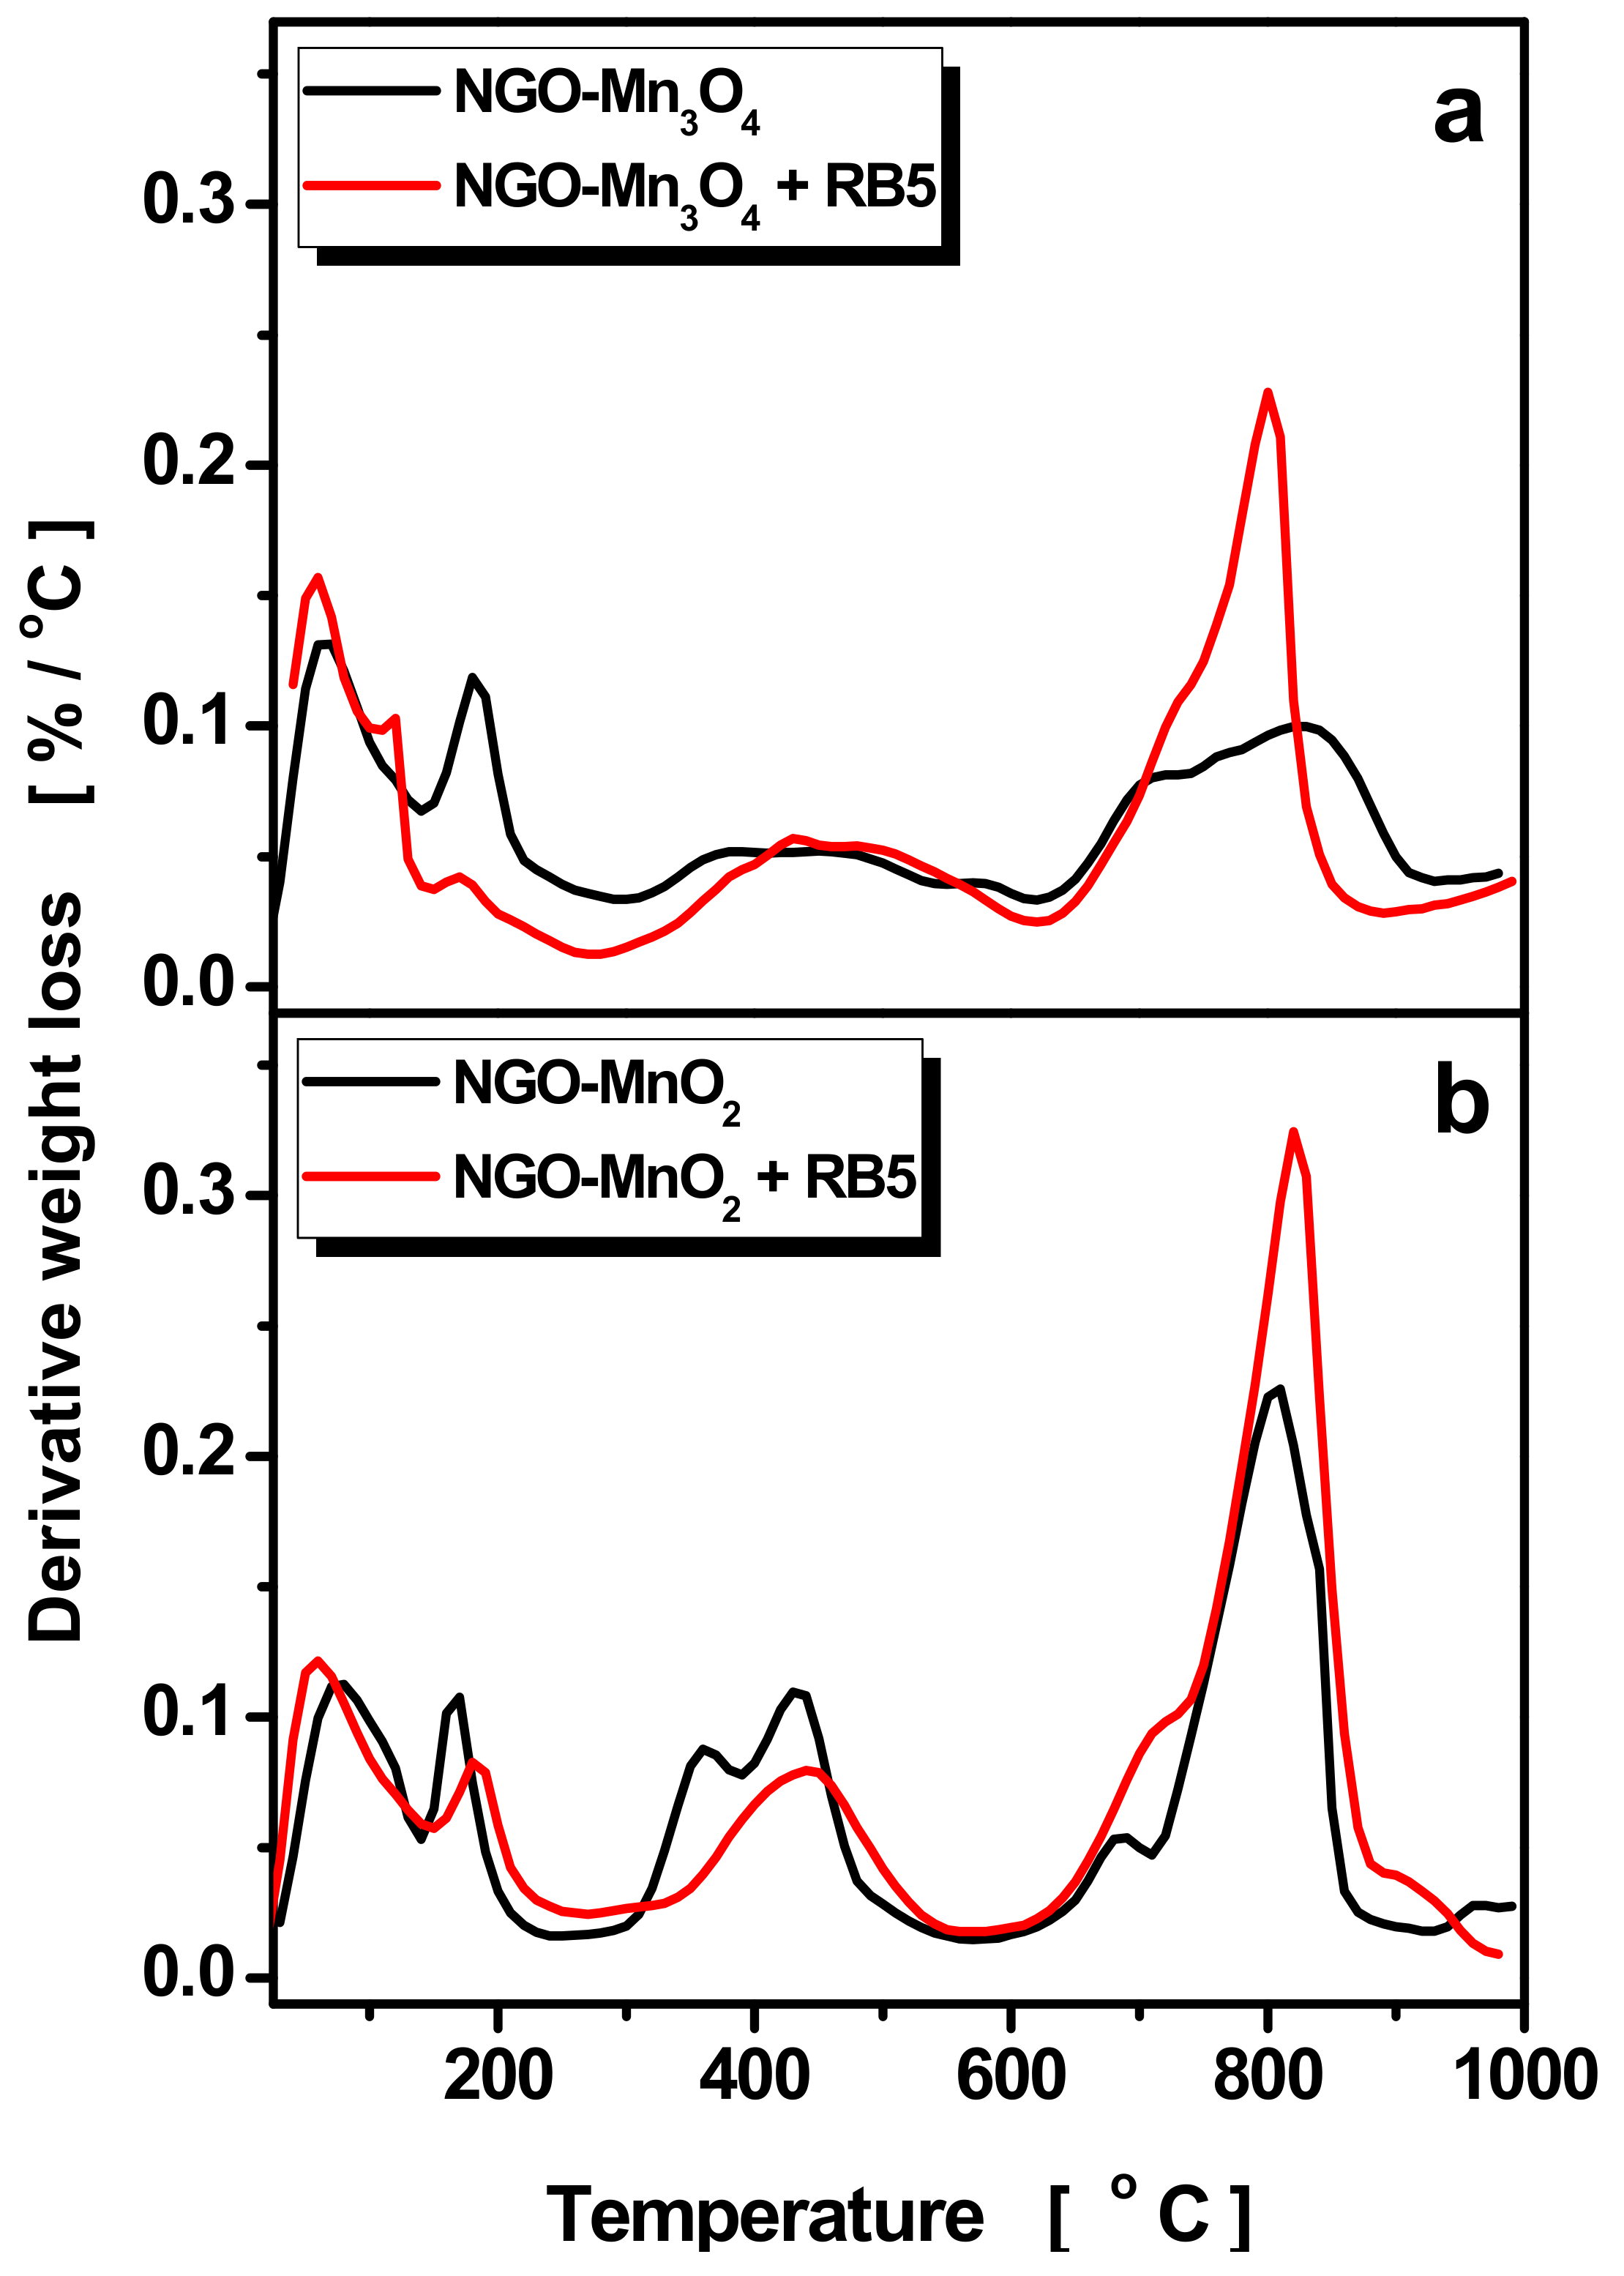
In order to further investigate the nature of nanocomposites and the alterations of the surface chemistry after the degradation of RB5, differential thermal gravimetric measurements (DTG) were implied between 25 and 1000 °C in nitrogen (Figure 11). For all samples, the peaks appeared at 100 and 200 °C represented the removal of physically adsorbed water and the dehydration of crystal water interlayer water in the nanostructure of manganese oxide phase/and or NGO, [57] respectively.
In Figure 11, the peaks representing the changes for the NGO–Mn3O4 nanocomposite are presented. The peak at about 430 °C could be attributed to reduction of Mn3O4 to Mn(II). Mn3O4 (Mn1 +II, Mn2 +III) can be transformed into Mn5O8 (Mn2 +II, Mn3 +IV) in the temperature range of 450–500 °C [58]. After release of oxygen, due to the reduction of Mn5O8 to Mn2O3 occurs and Mn(II) is finally reduced to Mn° at about 740 °C. For the modified graphene oxide supported nanocomposites, the patterns appeared complex since the graphene phase is expected to participate in the reduction. In Figure 11a, the changes for the NGO–Mn3O4 nanocomposite, after the degradation of RB5, are also shown.
After the degradation of RB5, the relative intensity of the peaks corresponding to Mn3O4 and Mn(II) was different than that for the initial sample. Also, a peak corresponding to the reduction of Mn(II) to Mn° was detected.
Concerning the nanocomposite NGO–MnO2, a peak at the 800–840 °C, related to Mn(II), is shown. The complex peaks between 300 and 600 °C may present the reduction of Mn(IV) to Mn(II) with loss of oxygen [59]. MnO2 is reduced to Mn2O3 and then to Mn3O4 and MnO. Then, Mn(II) is reduced between 750 and 800 °C. There is no peak at about 200–250 °C indicative to the mass loss from the removal of the oxygen- containing functional surface groups.
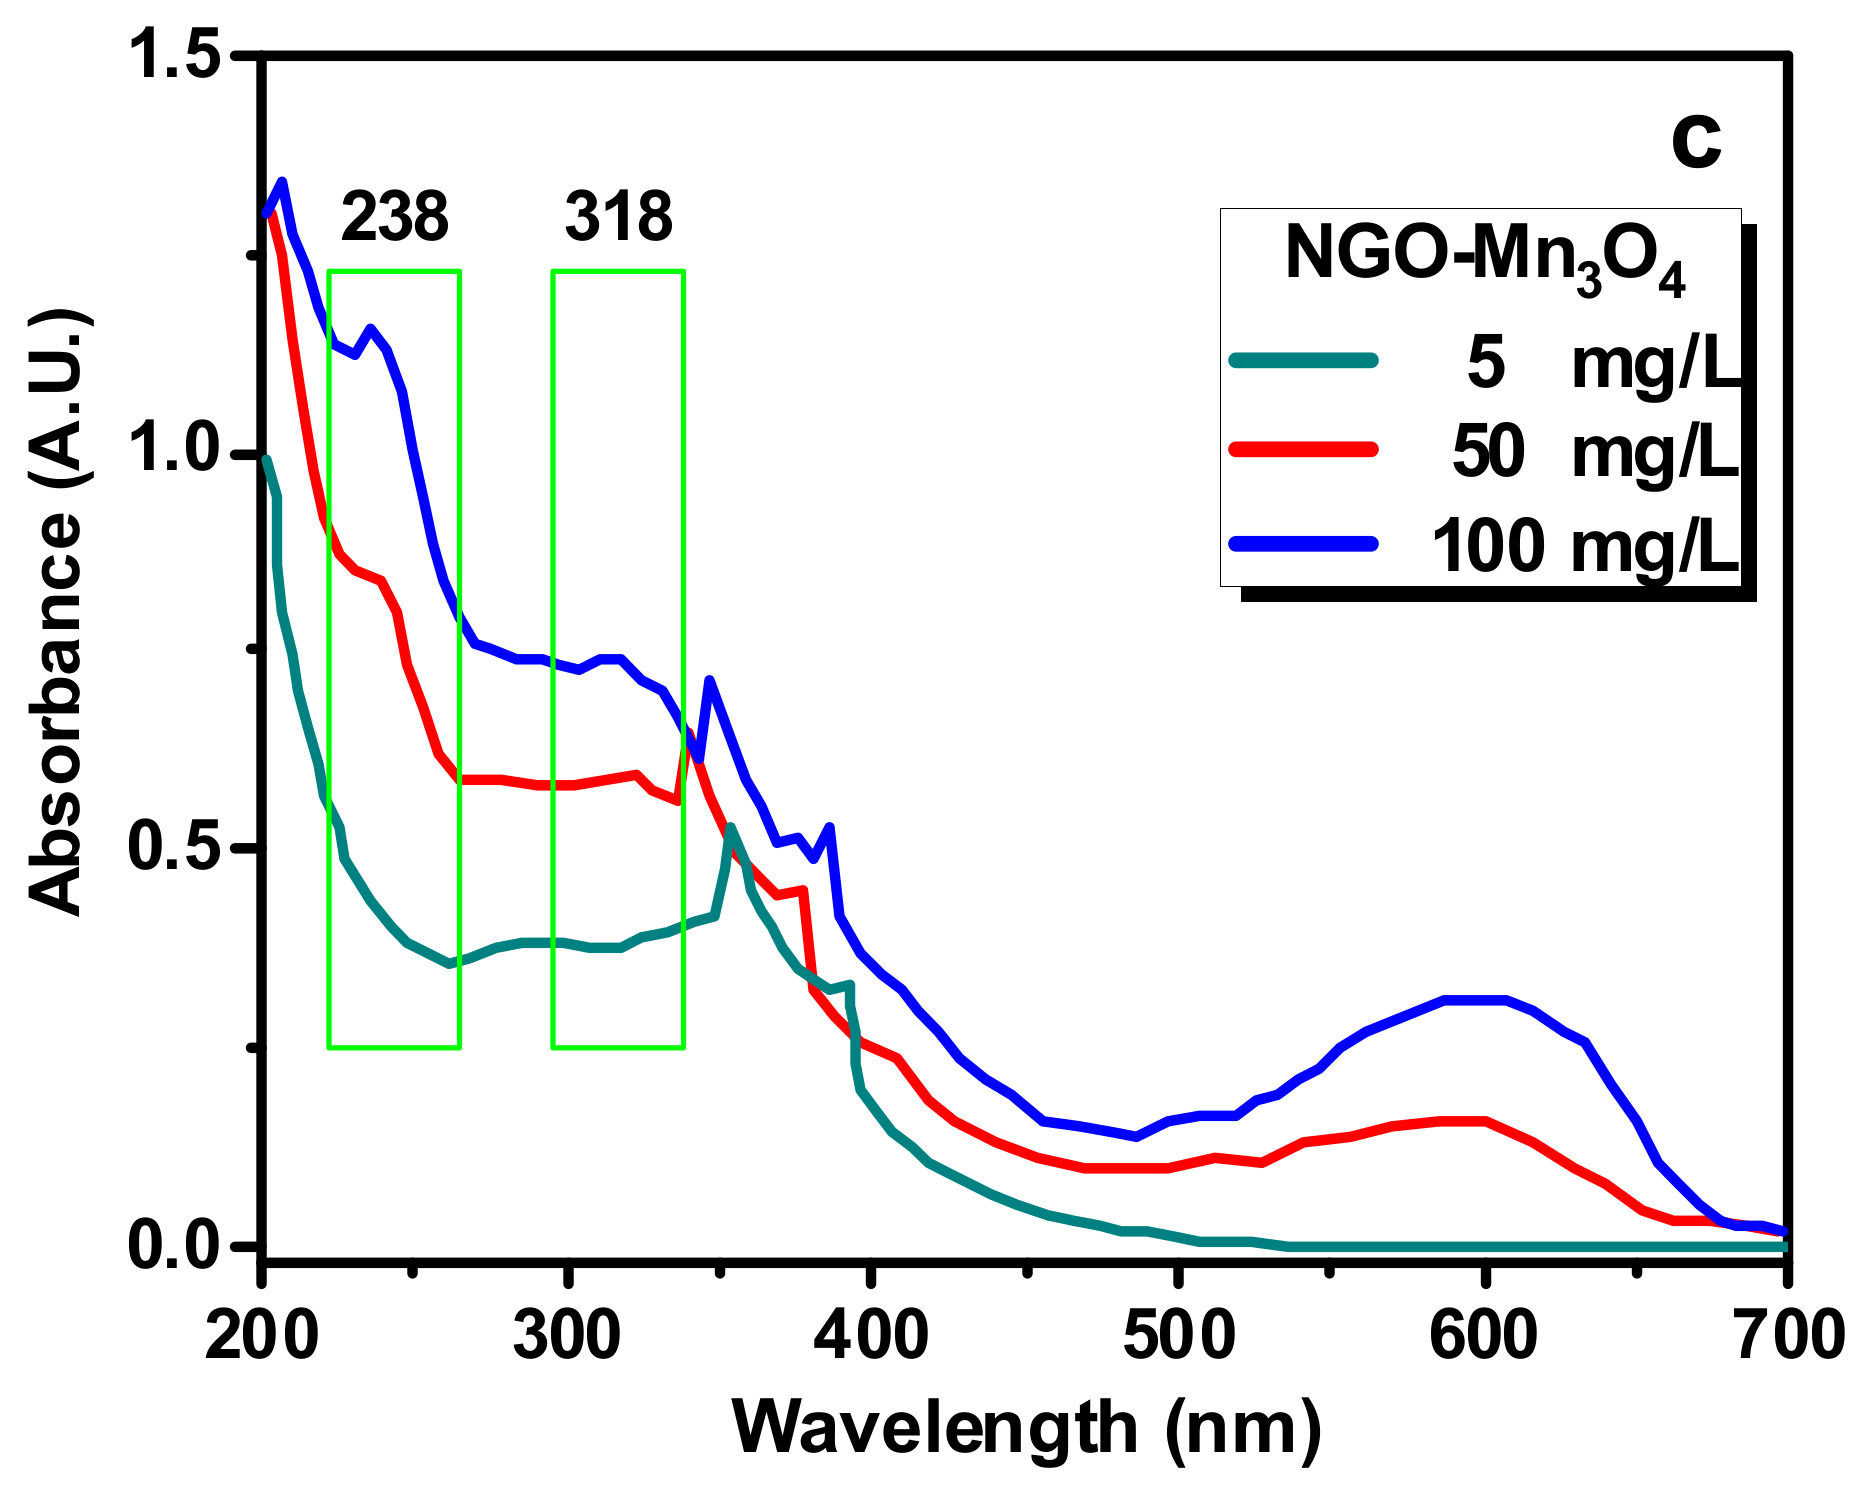
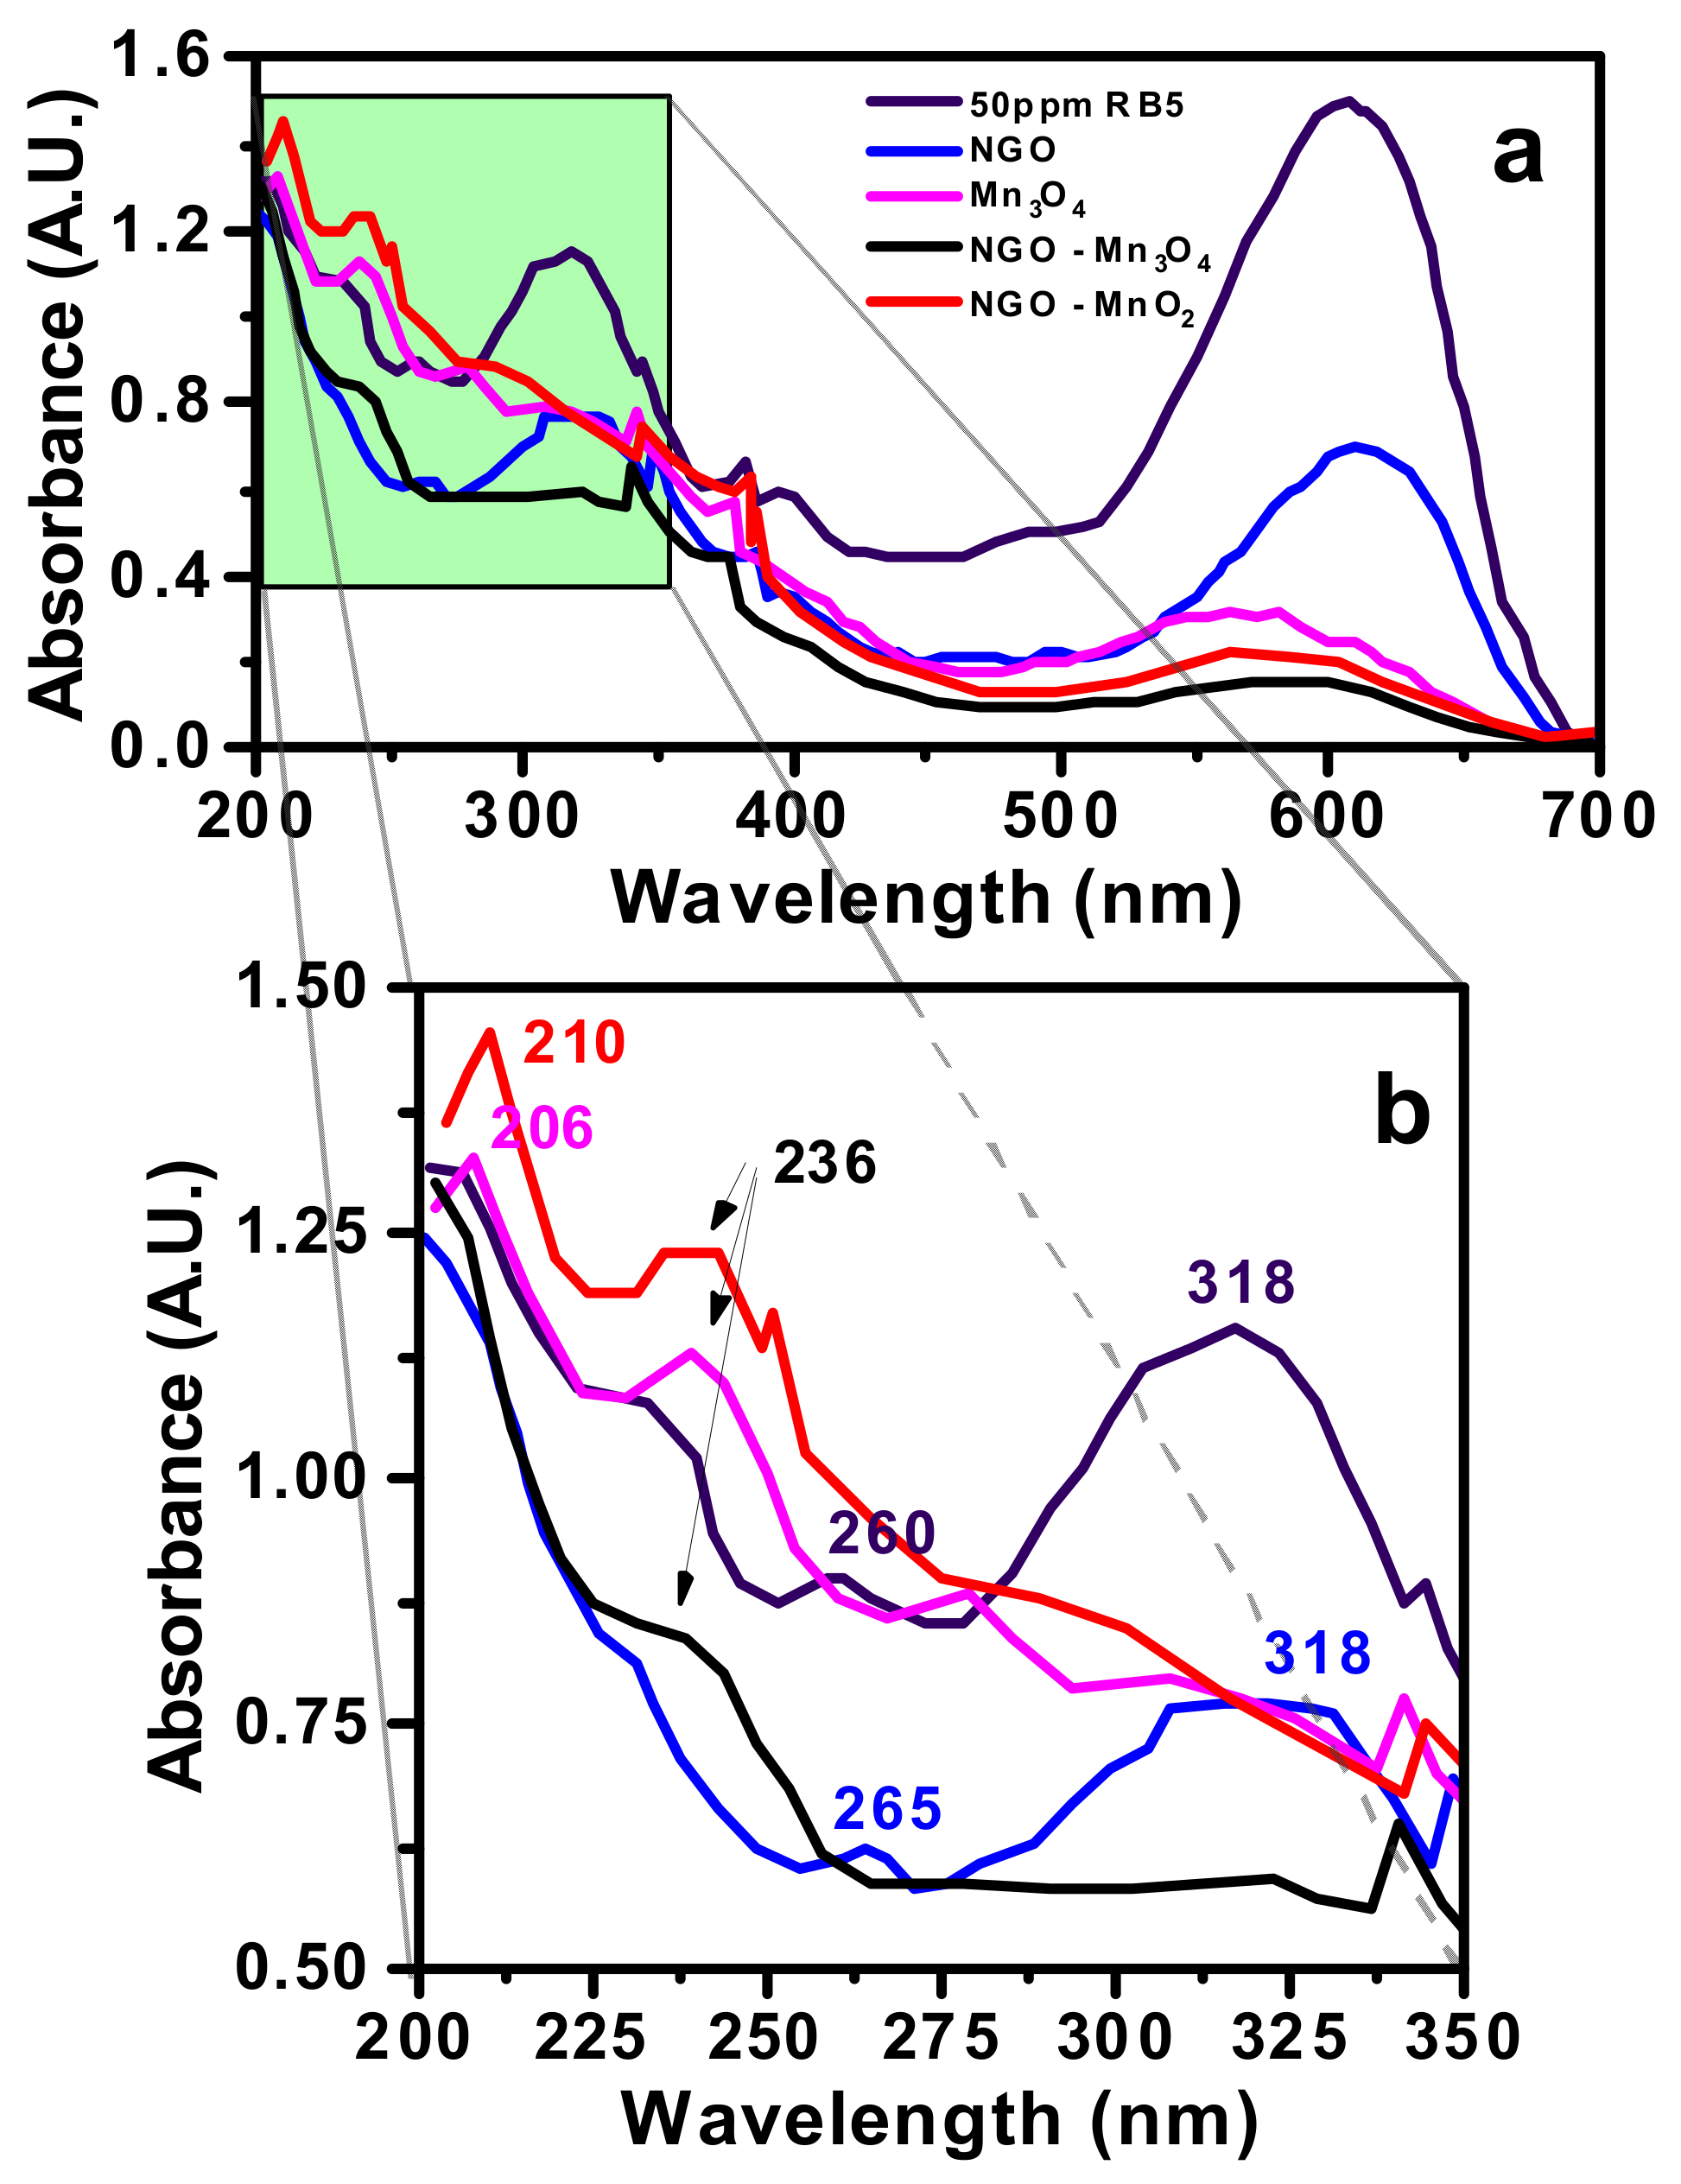
The degradation activity of the NGO-MnO nanocomposites was also investigated spectroscopically, by monitoring their decolorization efficiency with the UV-Vis spectra (250–750 nm) of the solution. Figure 12 presents the UV-vis spectra of the RB5 aqueous solutions after 2 h contact time with NGO–MnO2 and NGO–Mn3O4 nanocomposites, at pH 3, for initial solutions of 5, 50 and 100 mg/L RB5. From the Figure, it is seen that for the pure RB5 solution, the maximum of absorbance was presented at λmax ~ 593 nm, in the visible region, that can be attributed to the -N=N- azo bond of the dye [60]. The intensity of this peak is relative to the azo dye concentration in the solution and the blue color of the dye that is attributed to the n→p transition of the non-bonding electrons to the anti-banding pi-group orbital of the double bond system. Absorbances were also detected at λ = 230 and 318 nm that are due to the benzene and naphthalene aromatic rings of RB5, respectively [61]. With the decrease of the initial concentration, the UV-vis spectra indicated a decrease of the band, due to the decolorization of the solution and the possible cleavage of the azo bonds for the formation of -NH2 groups [62], while after degradation different peaks were observed (Figure 13) at 238, 278 and 318 nm attributed to degradation products.
Mechanism of RB5 Degradation
Recently, as concluded from the FTIR spectra based on the disappearance of the band at 1497 cm−1 indicative of the cleavage of the -N=N- bond and the appearance of the band at 1640 cm−1 indicative of the presence of a primary amine as a result of RB5 degradation [38], the non-radical mechanism of RB5 degradation in an acidic environment could be described by the following equations [55]:
Mn → Mn2+ + 2e−
2H2O → H3O+ + OH−
2H3O+ + 2e− → H2 + 2H2O
R-N=N-R + H2 → R-NH-NH-R
R-NH-NH-R + H2 → R-NH2 + R-NH2
In acidic environment the favorable H3O+ concentration increases and facilitate the degradation of RB5 by forming active H2 and therefore the cleavage of the -N=N- bond of the azo-dye. The formation of hydrogen was testified by the appearance of bubbles in the solution during the redox reaction (inset photo in Figure 6). Hydroxyl groups are able to promote catalytic activity [37]. Besides, surface hydroxyl groups of the carbonaceous support facilitate the adsorption of RB5 through hydrogen bonds as well as the RB5 degradation through the intermediate oxidation. Modified graphene oxide, as manganese oxides’ support, possesses a sufficient amount of hydroxylic groups due to the NaOH modification that leads to an increased RB5 degradation.
In the presence of H2O2 and therefore an HO• radicals mechanism, the RB5 degradation increased for higher initial concentrations and decreased for lowered initial concentrations, may be due to a Fenton-like mechanism [63]. Mn ions react with H2O2 and hydroxyl radicals are produced that react and decompose the dye molecules according to the following Eqs. [63]:
Mn(IV) + H2O2 → Mn(IV) H2O2• → Mn(II) + HO2• + H+ → 2H+ + O2•
Mn(II) + H2O2 → Mn(IV) + HO• + OH−
HO•(O2•−) + dye → CO2 + H2O
As discussed above the mole ratio of RB5 initial concentration to H2O2 is a crucial and decisive parameter for the effect of the radicals on the RB5 degradation.
4. Conclusions
From the presented results, we can see the positive effect of the manganese oxide impregnation to sodium hydroxide modified graphene oxide on the efficiency of RB5 oxidative degradation. The efficiency was evaluated by kinetic results for the RB5 removal by MnO2, Mn3O4 and NGO–MnO2 and NGO–Mn3O4 as well as by their chemical surface alterations after the removal process. From experimental as well as UV-vis and FTIR results, it is concluded that RB5 degradation is based on the release of H2, the cleavage of -N=N- bonds and the formation of -NH2 groups. The presence of H2O2 could increase the RB5 degradation; H2O2 could produce hydroxyl radicals that are able to attack and decompose the dye molecules. Modified graphene oxide as manganese oxides’ support possesses a sufficient amount of hydroxylic groups and leads to a more sufficient RB5 degradation.
Author Contributions
This article was written by E.D. after personal invitation for the Special Issue “Innovative Approaches for Drinking- and Waste-Water Treatment”. H.S. contributed to the experimental design and experimental part, D.N. and K.R. contributed to experimental part.
Funding
This research received no external funding.
Conflicts of Interest
The authors declare no conflicts of interest.
References
- Novotný, Č.; Dias, N.; Kapanen, A.; Malachová, K.; Vándrovcová, M.; Itävaara, M.; Lima, N. Comparative use of bacterial, algal and protozoan tests to study toxicity of azo-and anthraquinone dyes. Chemosphere 2006, 63, 1436–1442. [Google Scholar] [CrossRef]
- Liang, J.; Ning, X.A.; Sun, J.; Song, J.; Lu, J.; Cai, H.; Hong, Y. Toxicity evaluation of textile dyeing effluent and its possible relationship with chemical oxygen demand. Ecotoxicol. Environ. Saf. 2018, 166, 56–62. [Google Scholar] [CrossRef] [PubMed]
- Bilal, M.; Iqbal, M.; Hu, H.; Zhang, X. Mutagenicity and cytotoxicity assessment of biodegraded textile effluent by Ca-alginate encapsulated manganese peroxidase. Biochem. Eng. J. 2016, 109, 153–161. [Google Scholar] [CrossRef]
- Seralathan, J.; Salam, A.A.A.; Mohan, H.S.; Balaraman, D.; Pitchai, S.; Sadasivam, S.K. Evaluation of toxicity reduction in textile effluent by different treatment protocols involving marine diatom Odontella aurita on freshwater fish Labeo rohita. J. Water Process. Eng. 2017, 20, 232–242. [Google Scholar] [CrossRef]
- Lademann, J.; Patzelt, A.; Worm, M.; Richter, H.; Sterry, W.; Meinke, M. Analysis of in vivo penetration of textile dyes causing allergic reactions. Laser Phys. Lett. 2009, 6, 759–763. [Google Scholar]
- Rovira, J.; Domingo, J.L. Human health risks due to exposure to inorganic and organic chemicals from textiles: A review. Environ. Res. 2019, 168, 62–69. [Google Scholar] [CrossRef]
- Hatch, K.L.; Maibach, H.I. Textile dye dermatitis. J. Am. Acad. Dermatol. 1995, 32, 631–639. [Google Scholar] [CrossRef]
- Kiriakidou, F.; Kondarides, D.I.; Verykios, X.E. The effect of operational parameters and TiO2-doping on the photocatalytic degradation of azo-dyes. Catal. Today 1999, 54, 119–130. [Google Scholar] [CrossRef]
- Pagga, U.; Brown, D. The degradation of dyestuffs: Part II. Behaviour of dyestuffs in aerobic biodegradation tests. Chemosphere 1986, 15, 479–491. [Google Scholar] [CrossRef]
- Brown, D.; Laboureur, P. The aerobic biodegradability of primary aromatic amines. Chemosphere 1983, 12, 405–414. [Google Scholar] [CrossRef]
- Ziarani, G.M.; Moradi, R.; Lashgari, N.; Kruger, H.G. Chapter 4—Azo Dyes; Ziarani, G.M., Moradi, R., Lashgari, N., Kruger, H.G.B.T.-M.-F.S.O.D., Eds.; Elsevier: Amsterdam, The Netherlands, 2018; pp. 47–93. [Google Scholar]
- Leme, D.M.; de Oliveira, G.A.R.; Meireles, G.; de Santos, T.C.; Zanoni, M.V.B.; de Oliveira, D.P. Genotoxicological assessment of two reactive dyes extracted from cotton fibres using artificial sweat. Toxicol. Vitr. 2014, 28, 31–38. [Google Scholar] [CrossRef]
- Venturini, S.; Tamaro, M. Mutagenicity of anthraquinone and azo dyes in Ames’ Salmonella typhimurium test. Mutat. Res. Toxicol. 1979, 68, 307–312. [Google Scholar] [CrossRef]
- Akhtar, M.F.; Ashraf, M.; Anjum, A.A.; Javeed, A.; Sharif, A.; Saleem, A.; Akhtar, B. Textile industrial effluent induces mutagenicity and oxidative DNA damage and exploits oxidative stress biomarkers in rats. Environ. Toxicol. Pharmacol. 2016, 41, 180–186. [Google Scholar] [CrossRef]
- Kabra, A.N.; Khandare, R.V.; Govindwar, P.S. Development of a bioreactor for remediation of textile effluent and dye mixture: A plant–bacterial synergistic strategy. Water Res. 2013, 47, 1035–1048. [Google Scholar] [CrossRef]
- Bumpus, J.A. Microbial degradation of azo dyes. In Biotransformations; Singh, V.P.B.T.-P.i.I.M., Ed.; Elsevier: Amsterdam, The Netherlands, 1995; Volume 32, pp. 157–176. [Google Scholar]
- Yang, P.; Shi, W.; Wang, H.; Liu, H. Screening of freshwater fungi for decolorizing multiple synthetic dyes. Braz. J. Microbiol. 2016, 47, 828–834. [Google Scholar] [CrossRef] [Green Version]
- Jinqi, L.; Houtian, L. Degradation of azo dyes by algae. Environ. Pollut. 1992, 75, 273–278. [Google Scholar] [CrossRef]
- Shu, H.-Y.; Chang, M.-C. Decolorization effects of six azo dyes by O3, UV/O3 and UV/H2O2 processes. Dye. Pigment. 2005, 65, 25–31. [Google Scholar] [CrossRef]
- Fernandes, N.C.; Brito, L.B.; Costa, G.G.; Taveira, S.F.; Cunha-Filho, M.S.S.; Oliveira, G.A.R.; Marreto, R.N. Removal of azo dye using Fenton and Fenton-like processes: Evaluation of process factors by Box–Behnken design and ecotoxicity tests. Chem. Biol. Interact. 2018, 291, 47–54. [Google Scholar] [CrossRef]
- Duarte, F.; Morais, V.; Maldonado-Hódar, F.J.; Madeira, L.M. Treatment of textile effluents by the heterogeneous Fenton process in a continuous packed-bed reactor using Fe/activated carbon as catalyst. Chem. Eng. J. 2013, 232, 34–41. [Google Scholar] [CrossRef]
- Chun, H.; Yizhong, W. Decolorization and biodegradability of photocatalytic treated azo dyes and wool textile wastewater. Chemosphere 1999, 39, 2107–2115. [Google Scholar] [CrossRef]
- Wang, H.-D.; Yang, Q.; Niu, C.H.; Badea, I. Adsorption of azo dye onto nanodiamond surface. Diam. Relat. Mater. 2012, 26, 1–6. [Google Scholar] [CrossRef]
- Konicki, W.; Aleksandrzak, M.; Moszyński, D.; Mijowska, E. Adsorption of anionic azo-dyes from aqueous solutions onto graphene oxide: Equilibrium, kinetic and thermodynamic studies. J. Colloid Interface Sci. 2017, 496, 188–200. [Google Scholar] [CrossRef]
- Hassan, M.M.; Carr, C.M. A critical review on recent advancements of the removal of reactive dyes from dyehouse effluent by ion-exchange adsorbents. Chemosphere 2018, 209, 201–219. [Google Scholar] [CrossRef]
- Ouyang, J.; Zhao, Z.; Suib, S.L.; Yang, H. Degradation of Congo Red dye by a Fe2O3@CeO2-ZrO2/Palygorskite composite catalyst: Synergetic effects of Fe2O3. J. Colloid Interface Sci. 2019, 539, 135–145. [Google Scholar] [CrossRef]
- Natarajan, S.; Bajaj, H.C.; Tayade, R.J. Recent advances based on the synergetic effect of adsorption for removal of dyes from waste water using photocatalytic process. J. Environ. Sci. 2018, 65, 201–222. [Google Scholar] [CrossRef]
- Rong, X.; Qiu, F.; Zhang, C.; Fu, L.; Wang, Y.; Yang, D. Adsorption–photodegradation synergetic removal of methylene blue from aqueous solution by NiO/graphene oxide nanocomposite. Powder Technol. 2015, 275, 322–328. [Google Scholar] [CrossRef]
- Nagpal, M.; Kakkar, R. Use of metal oxides for the adsorptive removal of toxic organic pollutants. Sep. Purif. Technol. 2019, 211, 522–539. [Google Scholar] [CrossRef]
- Islam, M.A.; Morton, D.W.; Johnson, B.B.; Mainali, B.; Angove, M.J. Manganese oxides and their application to metal ion and contaminant removal from wastewater. J. Water Process. Eng. 2018, 26, 264–280. [Google Scholar] [CrossRef]
- Salam, M.A. Synthesis and characterization of novel manganese oxide nanocorals and their application for the removal of methylene blue from aqueous solution. Chem. Eng. J. 2015, 270, 50–57. [Google Scholar] [CrossRef]
- Peng, H.H.; Chen, J.; Jiang, D.Y.; Li, M.; Feng, L.; Losic, D.; Zhang, Y.X. Synergistic effect of manganese dioxide and diatomite for fast decolorization and high removal capacity of methyl orange. J. Colloid Interface Sci. 2016, 484, 1–9. [Google Scholar] [CrossRef]
- Dang, T.-D.; Banerjee, A.N.; Tran, Q.-T.; Roy, S. Fast degradation of dyes in water using manganese-oxide-coated diatomite for environmental remediation. J. Phys. Chem. Solids 2016, 98, 50–58. [Google Scholar] [CrossRef] [Green Version]
- Saroyan, H.S.; Giannakoudakis, D.A.; Sarafidis, C.S.; Lazaridis, N.K.; Deliyanni, E.A. Effective impregnation for the preparation of magnetic mesoporous carbon: Application to dye adsorption. J. Chem. Technol. Biotechnol. 2017, 92, 1899–1911. [Google Scholar] [CrossRef]
- Gupta, K.; Khatri, O.P. Reduced graphene oxide as an effective adsorbent for removal of malachite green dye: Plausible adsorption pathways. J. Colloid Interface Sci. 2017, 501, 11–21. [Google Scholar] [CrossRef]
- Minitha, C.R.; Lalitha, M.; Jeyachandran, Y.L.; Senthilkumar, L. Adsorption behaviour of reduced graphene oxide towards cationic and anionic dyes: Co-action of electrostatic and π–π interactions. Mater. Chem. Phys. 2017, 194, 243–252. [Google Scholar]
- Saroyan, H.S.; Arampatzidou, A.; Voutsa, D.; Lazaridis, N.K.; Deliyanni, E.A. Activated carbon supported MnO2 for catalytic degradation of reactive black 5. Colloids Surf. A Physicochem. Eng. Asp. 2019, 566, 166–175. [Google Scholar] [CrossRef]
- Saroyan, H.; Kyzas, Z.G.; Deliyanni, A.E. Effective Dye Degradation by Graphene Oxide Supported Manganese Oxide. Processes 2019, 7, 40. [Google Scholar] [CrossRef]
- Saroyan, H.S.; Bele, S.; Giannakoudakis, D.A.; Samanidou, V.F.; Bandosz, T.J.; Deliyanni, E.A. Degradation of endocrine disruptor, bisphenol-A, on an mixed oxidation state manganese oxide/modified graphite oxide composite: A role of carbonaceous phase. J. Colloid Interface Sci. 2019, 539, 516–524. [Google Scholar] [CrossRef]
- Saroyan, H.; Ntagiou, D.; Samanidou, V.; Deliyanni, E. Modified graphene oxide as manganese oxide support for bisphenol A degradation. Chemosphere 2019, 225, 524–534. [Google Scholar] [CrossRef]
- Hummers, W.S.; Offeman, R.E. Preparation of Graphitic Oxide. J. Am. Chem. Soc. 1958, 80, 1339. [Google Scholar] [CrossRef]
- Yang, Z.; Zhang, Y.; Zhang, W.; Wang, X.; Qian, Y.; Wen, X.; Yang, S. Nanorods of manganese oxides: Synthesis, characterization and catalytic application. J. Solid State Chem. 2006, 179, 679–684. [Google Scholar] [CrossRef]
- Cao, D.; Li, H.; Wang, Z.; Wei, J.; Wang, J.; Liu, Q. Synthesis, nanostructure and magnetic properties of FeCo-reduced graphene oxide composite films by one-step electrodeposition. Thin Solid Films 2015, 597, 1–6. [Google Scholar] [CrossRef]
- Xu, R.; Wang, X.; Wang, D.; Zhou, K.; Li, Y. Surface structure effects in nanocrystal MnO2 and Ag/MnO2 catalytic oxidation of CO. J. Catal. 2006, 237, 426–430. [Google Scholar] [CrossRef]
- Ren, Y.; Yan, N.; Wen, Q.; Fan, Z.; Wei, T.; Zhang, M.; Ma, J. Graphene/δ-MnO2 composite as adsorbent for the removal of nickel ions from wastewater. Chem. Eng. J. 2011, 175, 1–7. [Google Scholar] [CrossRef]
- Patterson, A.L. The Scherrer Formula for X-Ray Particle Size Determination. Phys. Rev. 1939, 56, 978–982. [Google Scholar] [CrossRef]
- Laffont, L.; Gibot, P. High resolution electron energy loss spectroscopy of manganese oxides: Application to Mn3O4 nanoparticles. Mater. Charact. 2010, 61, 1268–1273. [Google Scholar] [CrossRef]
- Lee, C.H.; Lee, S.; Yeo, J.S.; Kang, G.S.; Noh, Y.J.; Park, S.M.; Lee, D.C.; Na, S.I.; Joh, H.I. Hybrid materials of upcycled Mn3O4 and reduced graphene oxide for a buffer layer in organic solar cells. J. Ind. Eng. Chem. 2018, 61, 106–111. [Google Scholar] [CrossRef]
- Yang, Y.J. One-pot synthesis of reduced graphene oxide/zinc sulfide nanocomposite at room temperature for simultaneous determination of ascorbic acid, dopamine and uric acid. Sens. Actuators B Chem. 2015, 221, 750–759. [Google Scholar] [CrossRef]
- Xu, Y.; Bai, H.; Lu, G.; Li, C.; Shi, G. Flexible Graphene Films via the Filtration of Water-Soluble Noncovalent Functionalized Graphene Sheets. J. Am. Chem. Soc. 2008, 130, 5856–5857. [Google Scholar] [CrossRef] [PubMed]
- Duan, X.; Sun, H.; Ao, Z.; Zhou, L.; Wang, G.; Wang, S. Unveiling the active sites of graphene-catalyzed peroxymonosulfate activation. Carbon 2016, 107, 371–378. [Google Scholar] [CrossRef]
- Xu, L.; Xu, C.; Zhao, M.; Qiu, Y.; Sheng, G.D. Oxidative removal of aqueous steroid estrogens by manganese oxides. Water Res. 2008, 42, 5038–5044. [Google Scholar] [CrossRef]
- Khaled, A.; Nemr, A.E.; El-Sikaily, A.; Abdelwahab, O. Removal of Direct N Blue-106 from artificial textile dye effluent using activated carbon from orange peel: Adsorption isotherm and kinetic studies. J. Hazard. Mater. 2009, 165, 100–110. [Google Scholar] [CrossRef]
- Pfaffeneder-Kmen, M.; Casas, I.F.; Naghilou, A.; Trettenhahn, G.; Kautek, W. A Multivariate curve resolution evaluation of an in-situ ATR-FTIR spectroscopy investigation of the electrochemical reduction of graphene oxide. Electrochim. Acta 2017, 255, 160–167. [Google Scholar] [CrossRef]
- Mbarek, W.B.; Azabou, M.; Pineda, E.; Fiol, N.; Escoda, L.; Suñol, J.J.; Khitouni, M. Rapid degradation of azo-dye using Mn–Al powders produced by ball-milling. RSC Adv. 2017, 7, 12620–12628. [Google Scholar] [CrossRef]
- Méndez-Martínez, A.J.; Dávila-Jiménez, M.M.; Ornelas-Dávila, O.; Elizalde-González, M.P.; Arroyo-Abad, U.; Sirés, I.; Brillas, E. Electrochemical reduction and oxidation pathways for Reactive Black 5 dye using nickel electrodes in divided and undivided cells. Electrochim. Acta 2012, 59, 140–149. [Google Scholar] [CrossRef]
- Feng, Q.; Kanoh, H.; Miyai, Y.; Ooi, K. Metal ion extraction/insertion reactions with todorokite-type manganese oxide in the aqueous phase. Chem. Mater. 1995, 7, 1722–1727. [Google Scholar] [CrossRef]
- Kapteijn, F.; Singoredjo, L.; Andreini, A.; Moulijn, J.A. Activity and selectivity of pure manganese oxides in the selective catalytic reduction of nitric oxide with ammonia. Appl. Catal. B Environ. 1994, 3, 173–189. [Google Scholar] [CrossRef]
- Singu, B.S.; Yoon, K.R. Exfoliated graphene-manganese oxide nanocomposite electrode materials for supercapacitor. J. Alloys Compd. 2019, 770, 1189–1199. [Google Scholar] [CrossRef]
- Ferreira, L.C.; Lucas, M.S.; Fernandes, J.R.; Tavares, P.B. Photocatalytic oxidation of Reactive Black 5 with UV-A LEDs. J. Environ. Chem. Eng. 2016, 4, 109–114. [Google Scholar] [CrossRef] [Green Version]
- Santos, P.B.; Santos, J.J.; Corrêa, C.C.; Corio, P.; Andrade, G.F.S. Plasmonic photodegradation of textile dye Reactive Black 5 under visible light: A vibrational and electronic study. J. Photochem. Photobiol. A Chem. 2019, 371, 159–165. [Google Scholar] [CrossRef]
- Wanyonyi, W.C.; Onyari, J.M.; Shiundu, P.M.; Mulaa, F.J. Effective biotransformation of Reactive Black 5 Dye Using Crude Protease from Bacillus Cereus Strain KM201428. Energy Procedia 2019, 157, 815–824. [Google Scholar] [CrossRef]
- Ramesh, M.; Nagaraja, H.S.; Rao, M.P.; Anandan, S.; Huang, N.M. Fabrication, characterization and catalytic activity of α-MnO2 nanowires for dye degradation of reactive black 5. Mater. Lett. 2016, 172, 85–89. [Google Scholar] [CrossRef]
Figure 1.
XRD patterns of: (a) graphene oxide (GO), modified graphene oxide (NGO), manganese oxide (Mn3O4) and NGO–Mn3O4 nanocomposite; (b) GO, modified graphene oxide (NGO), manganese oxide (MnO2) and NGO–MnO2 nanocomposite.
Figure 1.
XRD patterns of: (a) graphene oxide (GO), modified graphene oxide (NGO), manganese oxide (Mn3O4) and NGO–Mn3O4 nanocomposite; (b) GO, modified graphene oxide (NGO), manganese oxide (MnO2) and NGO–MnO2 nanocomposite.

Figure 2.
N2 adsorption isotherms and pore diameter distribution (inset) for NGO–Mn3O4 and NGO–MnO2 modified composites.
Figure 2.
N2 adsorption isotherms and pore diameter distribution (inset) for NGO–Mn3O4 and NGO–MnO2 modified composites.

Figure 3.
(a) Effect of initial pH on RB5 adsorption/degradation onto NGO, MnO2, Mn3O4, NGO–Mn3O4 and NGO–MnO2 nanocomposites (Co = 100 mg/L, m = 0.01 g, V = 0.02 L); (b) potentiometric titration results for the nanocomposite catalysts.
Figure 3.
(a) Effect of initial pH on RB5 adsorption/degradation onto NGO, MnO2, Mn3O4, NGO–Mn3O4 and NGO–MnO2 nanocomposites (Co = 100 mg/L, m = 0.01 g, V = 0.02 L); (b) potentiometric titration results for the nanocomposite catalysts.

Figure 4.
Effect of initial concentration of RB5 (pH = 3, m = 0.01 g, V = 0.02 L).

Figure 5.
(a,b) Effect of contact time on the degradation of RB5 on NGO, MnO2, Mn3O4, NGO–Mn3O4 and NGO–MnO2 nanocomposites for initial RB5 concentration of 100 mg/L (a) in presence and (b) absence of H2O2 (Co = 100 mg/L, pH = 3, m = 0.01 g, V = 0.02 L). (inset: decolorization after 60 min for Mn3O4 in the first row and NGO–MnO2 in the second row).

Figure 6.
Effect of contact time on the degradation of RB5 on NGO–Mn3O4 and NGO–MnO2 nanocomposites for initial RB5 concentration of 40 mg/L and 100 mg/L in presence (radical) and absence (non-radical) of H2O2 (pH = 3, m = 0.01 g, V = 0.02 L).
Figure 6.
Effect of contact time on the degradation of RB5 on NGO–Mn3O4 and NGO–MnO2 nanocomposites for initial RB5 concentration of 40 mg/L and 100 mg/L in presence (radical) and absence (non-radical) of H2O2 (pH = 3, m = 0.01 g, V = 0.02 L).

Figure 7.
Effect of (a) H2O2 concentration and (b) methanol/H2O2 ratio on RB5 degradation by NGO–Mn3O4 and NGO–MnO2 nanocomposites (Co = 100 mg/L, pH = 3, m = 0.01 g, V = 0.02 L).
Figure 7.
Effect of (a) H2O2 concentration and (b) methanol/H2O2 ratio on RB5 degradation by NGO–Mn3O4 and NGO–MnO2 nanocomposites (Co = 100 mg/L, pH = 3, m = 0.01 g, V = 0.02 L).

Figure 8.
Elution experiments by (a) deionized water (b) ethanol, methanol and acetonitrile of the loaded the NGO–MnO2 and NGO–Mn3O4 nanocomposites (Co = 100 mg/L, m = 0.01 g, V = 0.02 L).
Figure 8.
Elution experiments by (a) deionized water (b) ethanol, methanol and acetonitrile of the loaded the NGO–MnO2 and NGO–Mn3O4 nanocomposites (Co = 100 mg/L, m = 0.01 g, V = 0.02 L).

Figure 9.
Recovery efficiency of the NGO—MnO2 and NGO—Mn3O4 after 5 cycles of adsorption—desorption (Co = 100 mg/L, pH = 3, m = 0.01 g, V = 0.02 L).
Figure 9.
Recovery efficiency of the NGO—MnO2 and NGO—Mn3O4 after 5 cycles of adsorption—desorption (Co = 100 mg/L, pH = 3, m = 0.01 g, V = 0.02 L).

Figure 10.
FTIR patterns of raw (black line) and after the RB5 degradation (red line) of NGO (a); NGO–Mn3O4 (b) and NGO–MnO2 (c) in presence of H2O2.
Figure 10.
FTIR patterns of raw (black line) and after the RB5 degradation (red line) of NGO (a); NGO–Mn3O4 (b) and NGO–MnO2 (c) in presence of H2O2.

Figure 11.
DTG curves for (a) NGO–Mn3O4 and (b) NGO–MnO2 modified composites in absence and presence of RB5.
Figure 11.
DTG curves for (a) NGO–Mn3O4 and (b) NGO–MnO2 modified composites in absence and presence of RB5.

Figure 12.
UV-Vis curves for RB5 on NGO–Mn3O4 in 3 different RB5 concentrations (pH = 3, m = 0.01 g, V = 0.02 L).
Figure 12.
UV-Vis curves for RB5 on NGO–Mn3O4 in 3 different RB5 concentrations (pH = 3, m = 0.01 g, V = 0.02 L).

Figure 13.
UV-Vis curves for RB5 (a,b) after degradation on NGO, MnO2, Mn3O4, NGO–Mn3O4 and NGO–MnO2 nanocomposites for Co = 50 mg/L (pH = 3, m = 0.01 g, V = 0.02 L).
Figure 13.
UV-Vis curves for RB5 (a,b) after degradation on NGO, MnO2, Mn3O4, NGO–Mn3O4 and NGO–MnO2 nanocomposites for Co = 50 mg/L (pH = 3, m = 0.01 g, V = 0.02 L).


Table 1.
Textural parameters of the manganese oxides, of NGO and of NGO–Mn3O4 and NGO–MnO2 nanocomposites.
Table 1.
Textural parameters of the manganese oxides, of NGO and of NGO–Mn3O4 and NGO–MnO2 nanocomposites.
| Samples | SBET (m2/g) | Vt (cm3/g) | Vmeso (cm3/g) | Vmic (cm3/g) |
|---|---|---|---|---|
| NGO | 9.10 | 0.080 | 0.080 | 0 |
| Mn3O4 | 2.38 | 0.014 | 0.014 | 0 |
| MnO2 | 38.50 | 0.336 | 0.336 | 0 |
| NGO–Mn3O4 | 7.52 | 0.056 | 0.056 | 0 |
| NGO–MnO2 | 118.12 | 0.231 | 0.231 | 0 |
Table 2.
Kinetic parameters.
| Samples | Co | Pseudo-First Order | Pseudo-Second Order | ||
|---|---|---|---|---|---|
| K1 | R2 | K2 | R2 | ||
| NGO | 100 | 1.92 × 10⁻² | 0 | 3.60 × 10⁻⁴ | 0.393 |
| 100 + H2O2 | 1.85 × 10⁻¹ | 0.857 | 3.63 × 10⁻³ | 0.961 | |
| MnO2 | 100 | 1.91 × 10⁻² | 0.371 | 2.10 × 10⁻⁴ | 0.691 |
| 100 + H2O2 | 3.73 × 10⁻¹ | 0.998 | 3.09 × 10⁻² | 0.999 | |
| Mn3O4 | 100 | 4.30 × 10⁻³ | 0.504 | 5.00 × 10⁻⁵ | 0.66 |
| 100 + H2O2 | 8.97 × 10⁻² | 0.972 | 2.10 × 10⁻³ | 0.924 | |
| NGO–MnO2 | 100 | 7.60 × 10⁻² | 0.982 | 1.60 × 10⁻³ | 0.999 |
| 100+ H2O2 | 2.80 × 10⁻¹ | 0.999 | 2.08 × 10⁻² | 0.999 | |
| 40 | 4.78 × 10⁻¹ | 0.939 | 2.58 × 10⁻² | 0.991 | |
| 40 + H2O2 | 1.47 × 10⁻¹ | 0.984 | 0.61 × 10⁻² | 0.983 | |
| NGO–Mn3O4 | 100 | 1.79 × 10⁻² | 0.977 | 2.70 × 10⁻⁴ | 0.999 |
| 100 + H2O2 | 3.20 × 10⁻¹ | 0.998 | 2.66 × 10⁻² | 0.999 | |
| 40 | 1.14 × 10⁻¹ | 0.950 | 0.52 × 10⁻² | 0.993 | |
| 40 + H2O2 | 0.67 × 10⁻¹ | 0.590 | 0.29 × 10⁻² | 0.898 | |
Table 3.
Leaching of manganese in the solution after RB5 degradation.
| Mn % Leaching in the Solution | ||
|---|---|---|
| + H2O2 | ||
| Mn3O4 | 8.5 | 6.6 |
| NGO–Mn3O4 | 1.6 | 3.3 |
| MnO2 | 8.4 | 9.5 |
| NGO–MnO2 | 1.0 | 4.8 |
© 2019 by the authors. Licensee MDPI, Basel, Switzerland. This article is an open access article distributed under the terms and conditions of the Creative Commons Attribution (CC BY) license (http://creativecommons.org/licenses/by/4.0/).
Share and Cite
MDPI and ACS Style
Saroyan, H.; Ntagiou, D.; Rekos, K.; Deliyanni, E. Reactive Black 5 Degradation on Manganese Oxides Supported on Sodium Hydroxide Modified Graphene Oxide. Appl. Sci. 2019, 9, 2167. https://0-doi-org.brum.beds.ac.uk/10.3390/app9102167
AMA Style
Saroyan H, Ntagiou D, Rekos K, Deliyanni E. Reactive Black 5 Degradation on Manganese Oxides Supported on Sodium Hydroxide Modified Graphene Oxide. Applied Sciences. 2019; 9(10):2167. https://0-doi-org.brum.beds.ac.uk/10.3390/app9102167
Chicago/Turabian StyleSaroyan, Hayarpi, Dimitra Ntagiou, Kyriazis Rekos, and Eleni Deliyanni. 2019. "Reactive Black 5 Degradation on Manganese Oxides Supported on Sodium Hydroxide Modified Graphene Oxide" Applied Sciences 9, no. 10: 2167. https://0-doi-org.brum.beds.ac.uk/10.3390/app9102167
Note that from the first issue of 2016, this journal uses article numbers instead of page numbers. See further details here.