1. Introduction
Corrosion of steel is one of the main mechanisms limiting the service life of reinforced and pre-stressed concrete structures, both in buildings and civil infrastructure [
1]. The expansive character of the steel corrosion products is at the origin of the damage suffered by concrete [
2], whose early symptoms are micro and macro cracking [
3,
4], which is followed by spalling or delamination of the concrete cover. Further consequences of the corrosion of embedded steel are the following: loss of bond between concrete and steel, loss of steel ductility, and loss of cross-sectional area of steel [
5]. These phenomena contribute to reducing the serviceability and load bearing capacity of the structures.
Usually the appearance of cracking is considered as the limit state regarding the durability of concrete structures affected by steel reinforcement corrosion [
6,
7]. Thus, great effort on cracking the understanding has been done [
8,
9,
10,
11,
12,
13,
14,
15,
16]. Corrosion products’ volume is higher than metal volume, and most of the corrosion products remain as a solid layer around the rebar [
2,
17]. Thus, corrosion implies a rebar volume increase that causes concrete cracking [
2]. Moreover, as metal converts in its corrosion products, the structure’s strength weakens due to a metal section loss [
5].
Cracking is experimentally studied usually by accelerated corrosion tests [
9,
12,
17,
18,
19,
20]. Additionally, mechanical models have been developed to obtain numerical simulations [
8,
10,
11,
13,
14,
15,
16,
21]. A key factor on mechanical modelling is the rebar shape time-evolution, which will determine the applied loads on concrete. Some authors accept a uniform expansion along the rebar perimeter [
22,
23]. Nevertheless, the corrosion rate can vary along the rebar perimeter depending on the exposure conditions. When corrosion is due to a depassivating agent that ingress into concrete from the environment, the corrosion rate of the outer part of the rebar will be higher. The corrosion rate along the rebar perimeter in a forced corrosion test will depend on the cathode location. This non-uniform corrosion has been observed experimentally [
19,
20] and has also been modelled [
10,
11,
13,
14,
15,
16,
21]. Usually, geometrical models are used to describe the rebar section and the rebar shape is considered as an ellipsoid [
11,
14,
15,
21], a combination of ellipsoids [
18], or other geometries [
12,
13] depending on exposure conditions. This is a convenient simplification for a modelling purpose, but a more realistic model would be desirable. Some detailed models [
10,
11] have been developed for chloride exposure conditions by taking into account chloride transport in order to estimate the non-uniform corrosion along the rebar perimeter. The present paper focuses on a forced corrosion test method, where an electrical current is applied to induce corrosion. An electrochemical model for the estimation of rebar shape time-evolution is presented in order to get a more realistic approach of the rebar shape during the test. This shape could be taken as input for mechanical models trying to simulate concrete cracking due to embedded steel corrosion under these conditions.
2. Materials and Methods
Prismatic mortar samples with dimensions 8 cm × 8 cm × 35 cm were fabricated using composition shown in
Table 1. Sodium chloride was added to the fresh mix so as to obtain a chloride (Cl
−) content of 2% relative to cement weight [
24]. One 12-mm diameter steel bar was embedded in each sample with a 10-mm mortar cover depth. The ends of the steel bar were protected with vinyl electric tape, which left an exposed steel area of 120 cm
2 (surface of contact steel-mortar). Specimens were cured during seven days in a humid chamber (20 °C and 95% relative humidity). Before starting the forced corrosion test, the spontaneous corrosion rate of the steel bar was measured through the linear polarization technique, using the portable corrosion rate meter Gecor8 (Geocisa, Madrid, Spain).
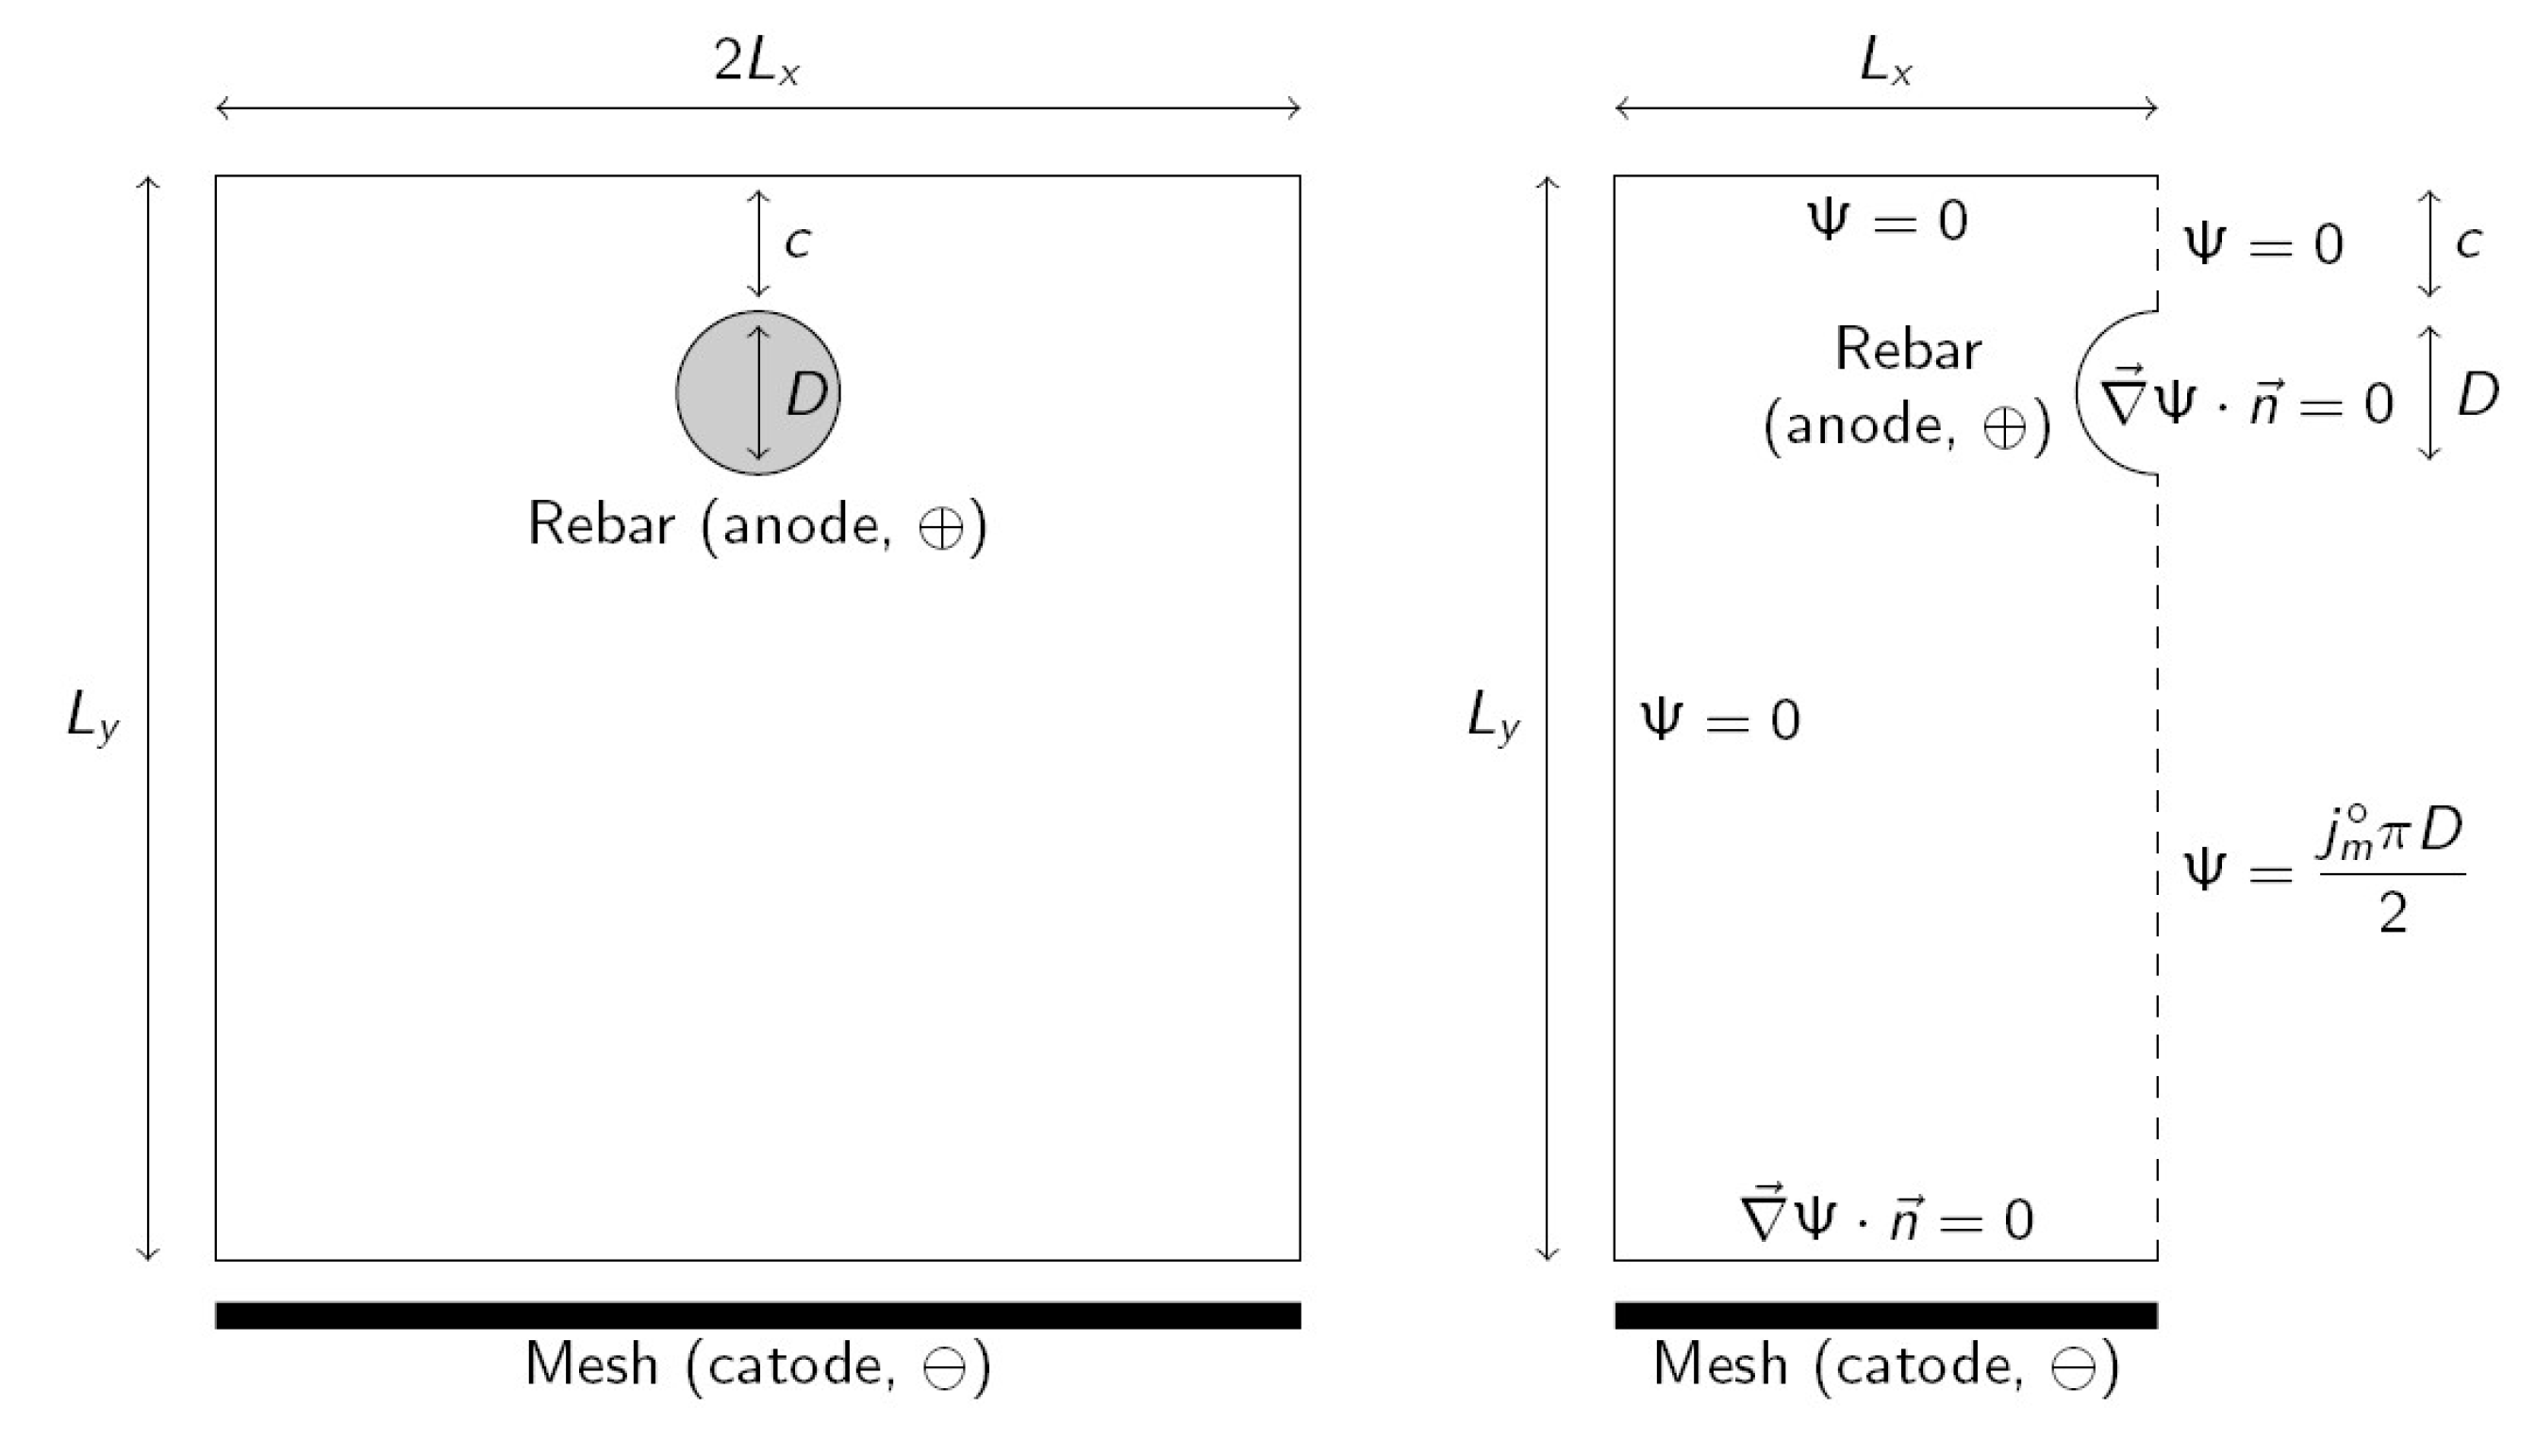
After curing, the sample was submitted to corrosion galvanostatically, i.e., by applying constant current, for 23 days. The rebar (anode) is connected to the positive pole of a power supply and the negative pole is connected to a galvanized steel mesh (cathode) that is located under the mortar sample. The contact of the cathode with the mortar sample is assured with a wet sponge. The cathode and the lower part of the mortar sample were submerged in tap water to assure good conductivity. A section of the mortar sample is shown in
Figure 1 (left). Values of geometric parameters are shown in
Table 2. The applied current density is
referred to as the initial rebar surface. Steel mass loss was measured at the end of the corrosion test using the procedure found in Reference [
26]. More details of the experimental tests can be found elsewhere [
27].
3. Rebar Shape Model
Rebar metal loss is considered to be due to the anodic impressed current of 100 μA/cm
2. The measured open circuit corrosion rate, due to the presence of Cl
− ions, showed values in the range 0.7 μA/cm
2 to 3 μA/cm
2. Since this is much lower than the impressed current during the test, it seems suitable neglecting spontaneous corrosion contribution to metal loss in the model. Moreover, theoretical metal loss (evaluated using Faraday’s law for a 100 μA/cm
2 current density) is consistent with experimentally observed metal loss. Experimental to the theoretical metal loss ratio mean value was found to be 1.05, with a standard deviation of 0.19 (three samples) [
27].
Current density along the rebar perimeter is calculated by solving the appropriate differential equation. The obtained current density is not uniform along the rebar perimeter. Faraday’s law is then used to relate current density with the volume of metal lost. Since current density is not uniform, metal loss is also not uniform along the rebar perimeter, and, therefore, the bar loses its initial circular shape. The dissolved metal is assumed to react to form solid corrosion products that are bulkier than the original metal [
28]. It is assumed that solid corrosion products stay where they are formed, laying a solid layer of corrosion products around the metallic rebar. The thickness of this layer is also not uniform along the rebar perimeter. As a result, in comparison with the original circular section, a narrower non-circular metal section covered by a non-uniform layer of corrosion products is obtained, which yields, as a whole, a thicker non-circular bar. The bar will become thicker when the current density is higher. This expanded bar will be the cause of mortar cracking.
3.1. Initial Current Density
Current exits from the rebar surface (anode) perpendicular to it and arrives to the mesh (cathode) perpendicular to it. Current density along the rebar perimeter is not uniform. Current density in the lower part of the rebar is higher because it is closer to the cathode. Then, metal loss is faster in the lower part of the rebar. In order to determine the current density distribution along the rebar perimeter, an appropriate differential equation must be solved. The problem is solved in terms of the current function
whose level curves are the current streamlines [
19]. Laplace Equation (1) must be solved [
29].
Due to the symmetry, Equation (1) can be solved in a half section of the mortar sample, as shown in
Figure 1 (right). Boundary conditions are applied as follows (see
Figure 1 right). Current flows perpendicular to the rebar surface and then a natural or Neumann boundary condition (null flux of the variable through the boundary) is applied (
, being
vector normal to the surface). The same boundary condition is applied on the cathode since current also flows perpendicular to it. The symmetry line (dashed line in
Figure 1 right) is now considered. Due to symmetry, the current does not traverse this boundary and this implies that essential or a Dirichlet boundary condition (fixed variable value) can be applied, and current function
is constant on the boundary. Nevertheless, the
value will be different above and below the rebar. The value
can be arbitrarily assigned to the upper part of the symmetry line. For the lower part, it is taken into account that the integral of current density along a curve equals the difference in
values between both extremes of the line [
29].
Integrating along the rebar perimeter between the top and bottom, and recalling that at the top, the value is obtained for the bottom part of the symmetry line. For the remaining boundaries (top and left surfaces of the mortar sample), Dirichlet boundary conditions are applied since current does not flow through them. They are a continuation of the upper part of the symmetry line and then must have the same value ().
A differential Equation (1) is solved using a standard finite elements method [
30] and the software Matlab R2013b [
31]. The mesh of triangular elements has been constructed as follows. (i)
equally spaced nodes are defined in the rectangular domain of size
. (ii) Nodes at a distance less or equal to
from rebar center are eliminated, where
is a chosen distance. (iii) The rebar boundary is defined with
with equally spaced nodes on the semi-circumference of the radius
. (iv)
equally spaced nodes are added on the semi-circumference of the radius
. This procedure assures more regular elements around the rebar, where a higher precision is required. (v) Mesh is generated with the defined nodes using the Delaunay algorithm (function delaunay from Matlab [
32]). (vi) Generated elements that lay inside the rebar are eliminated.
is obtained by solving Equation (1) in the domain. Now, current density along the rebar perimeter must be calculated. In order to do this, the integration curve in Equation (2) is taken along the rebar perimeter from the top to an arbitrary point on the perimeter. The current density on the perimeter is obtained after deriving Equation (2), which yielded the expression below.
where
is the angle between the rebar top and an arbitrary point on the perimeter of the rebar. Current density will be related to metal loss in
Section 3.3. Thus, metal loss will be obtained along the rebar perimeter as a function of angle
.
3.2. Current Density Time-Evolution
Current density time-evolution is obtained by solving Equation (1) in small time intervals . The equation to be solved does not change during the test, but boundary conditions will change because the rebar shape changes. After each time step, the rebar shape is recalculated using Faraday’s law, which relates current density with metal loss (see Equation (6)). As the rebar shape changes over time, when defining the elements’ mesh, it is necessary to replace the initial semi-circumference of radius that defines the initial rebar by the curve of radius , which defines the rebar shape. Thus, the procedure to define the elements’ mesh is the same as in the previous section but replacing by in steps (ii), (iii), (iv), and (vi). After solving Equation (1) in each time step, the current density along the rebar perimeter is now calculated as Equation (4) instead of Equation (3).
3.3. Rebar Shape Time-Evolution
The rebar corrosion causes metal loss and the reduction of the radius of the rebar. The radius loss is not uniform along the rebar perimeter because the current density is not uniform. On the other hand, corrosion products precipitate as oxides that are bulkier than the original metal [
2]. In this paper, it is accepted that these corrosion products remain attached to the bar, giving rise to a metal rebar narrower than the original but covered with a layer of oxides that gives the whole a volume greater than the original. The remaining metal radius
and the radius of the rebar as a whole
(including the oxide layer) are determined in this section. Both depend on the angle
since the current density
depends on it.
Let be a differential rebar angle. The surface subtended by it is , where is the rebar length. The current traversing this surface is , and the circulated charge during an interval is . Faraday’s constant gives the charge of a mole of electrons, then circulated moles of electrons are represented by . It is related with moles of dissolved metal by the oxidation reaction stoichiometry. Being , the moles of electrons needed to dissolve one mole of metal, the moles of dissolved metal during the interval are . Using metal molar mass and metal density , the volume of metal lost is . Additionally, this volume can be expressed geometrically as . Equating both expressions, the following is obtained for the metal radius variation.
That can be integrated to obtain the metal radius.
where
is the initial rebar radius. The oxidation reaction considered is shown below [
2].
For which
. The used values of the other constants are
,
, and
[
33].
The length of the metal perimeter through which corrosion takes place does not remain constant and can be calculated as:
Radius of the rebar as a whole, including the oxide layer,
, is now obtained. Let
be a differential rebar angle, where the variation of radii during an interval
is
for the metal and
for the whole rebar including the oxide layer. Then, the variation of metal volume
and variation of the oxide layer volume
are geometrically given by:
The volume occupied by the oxides is considered to be
times the volume occupied by the original metal. The value
[
28] has been considered. Then:
Using Equation (9) in this case and integrating, the radius of the rebar including the oxide layer is obtained using the formula below.
This radius gives the shape of the rebar that could be used in mortar cracking mechanical models.
4. Results
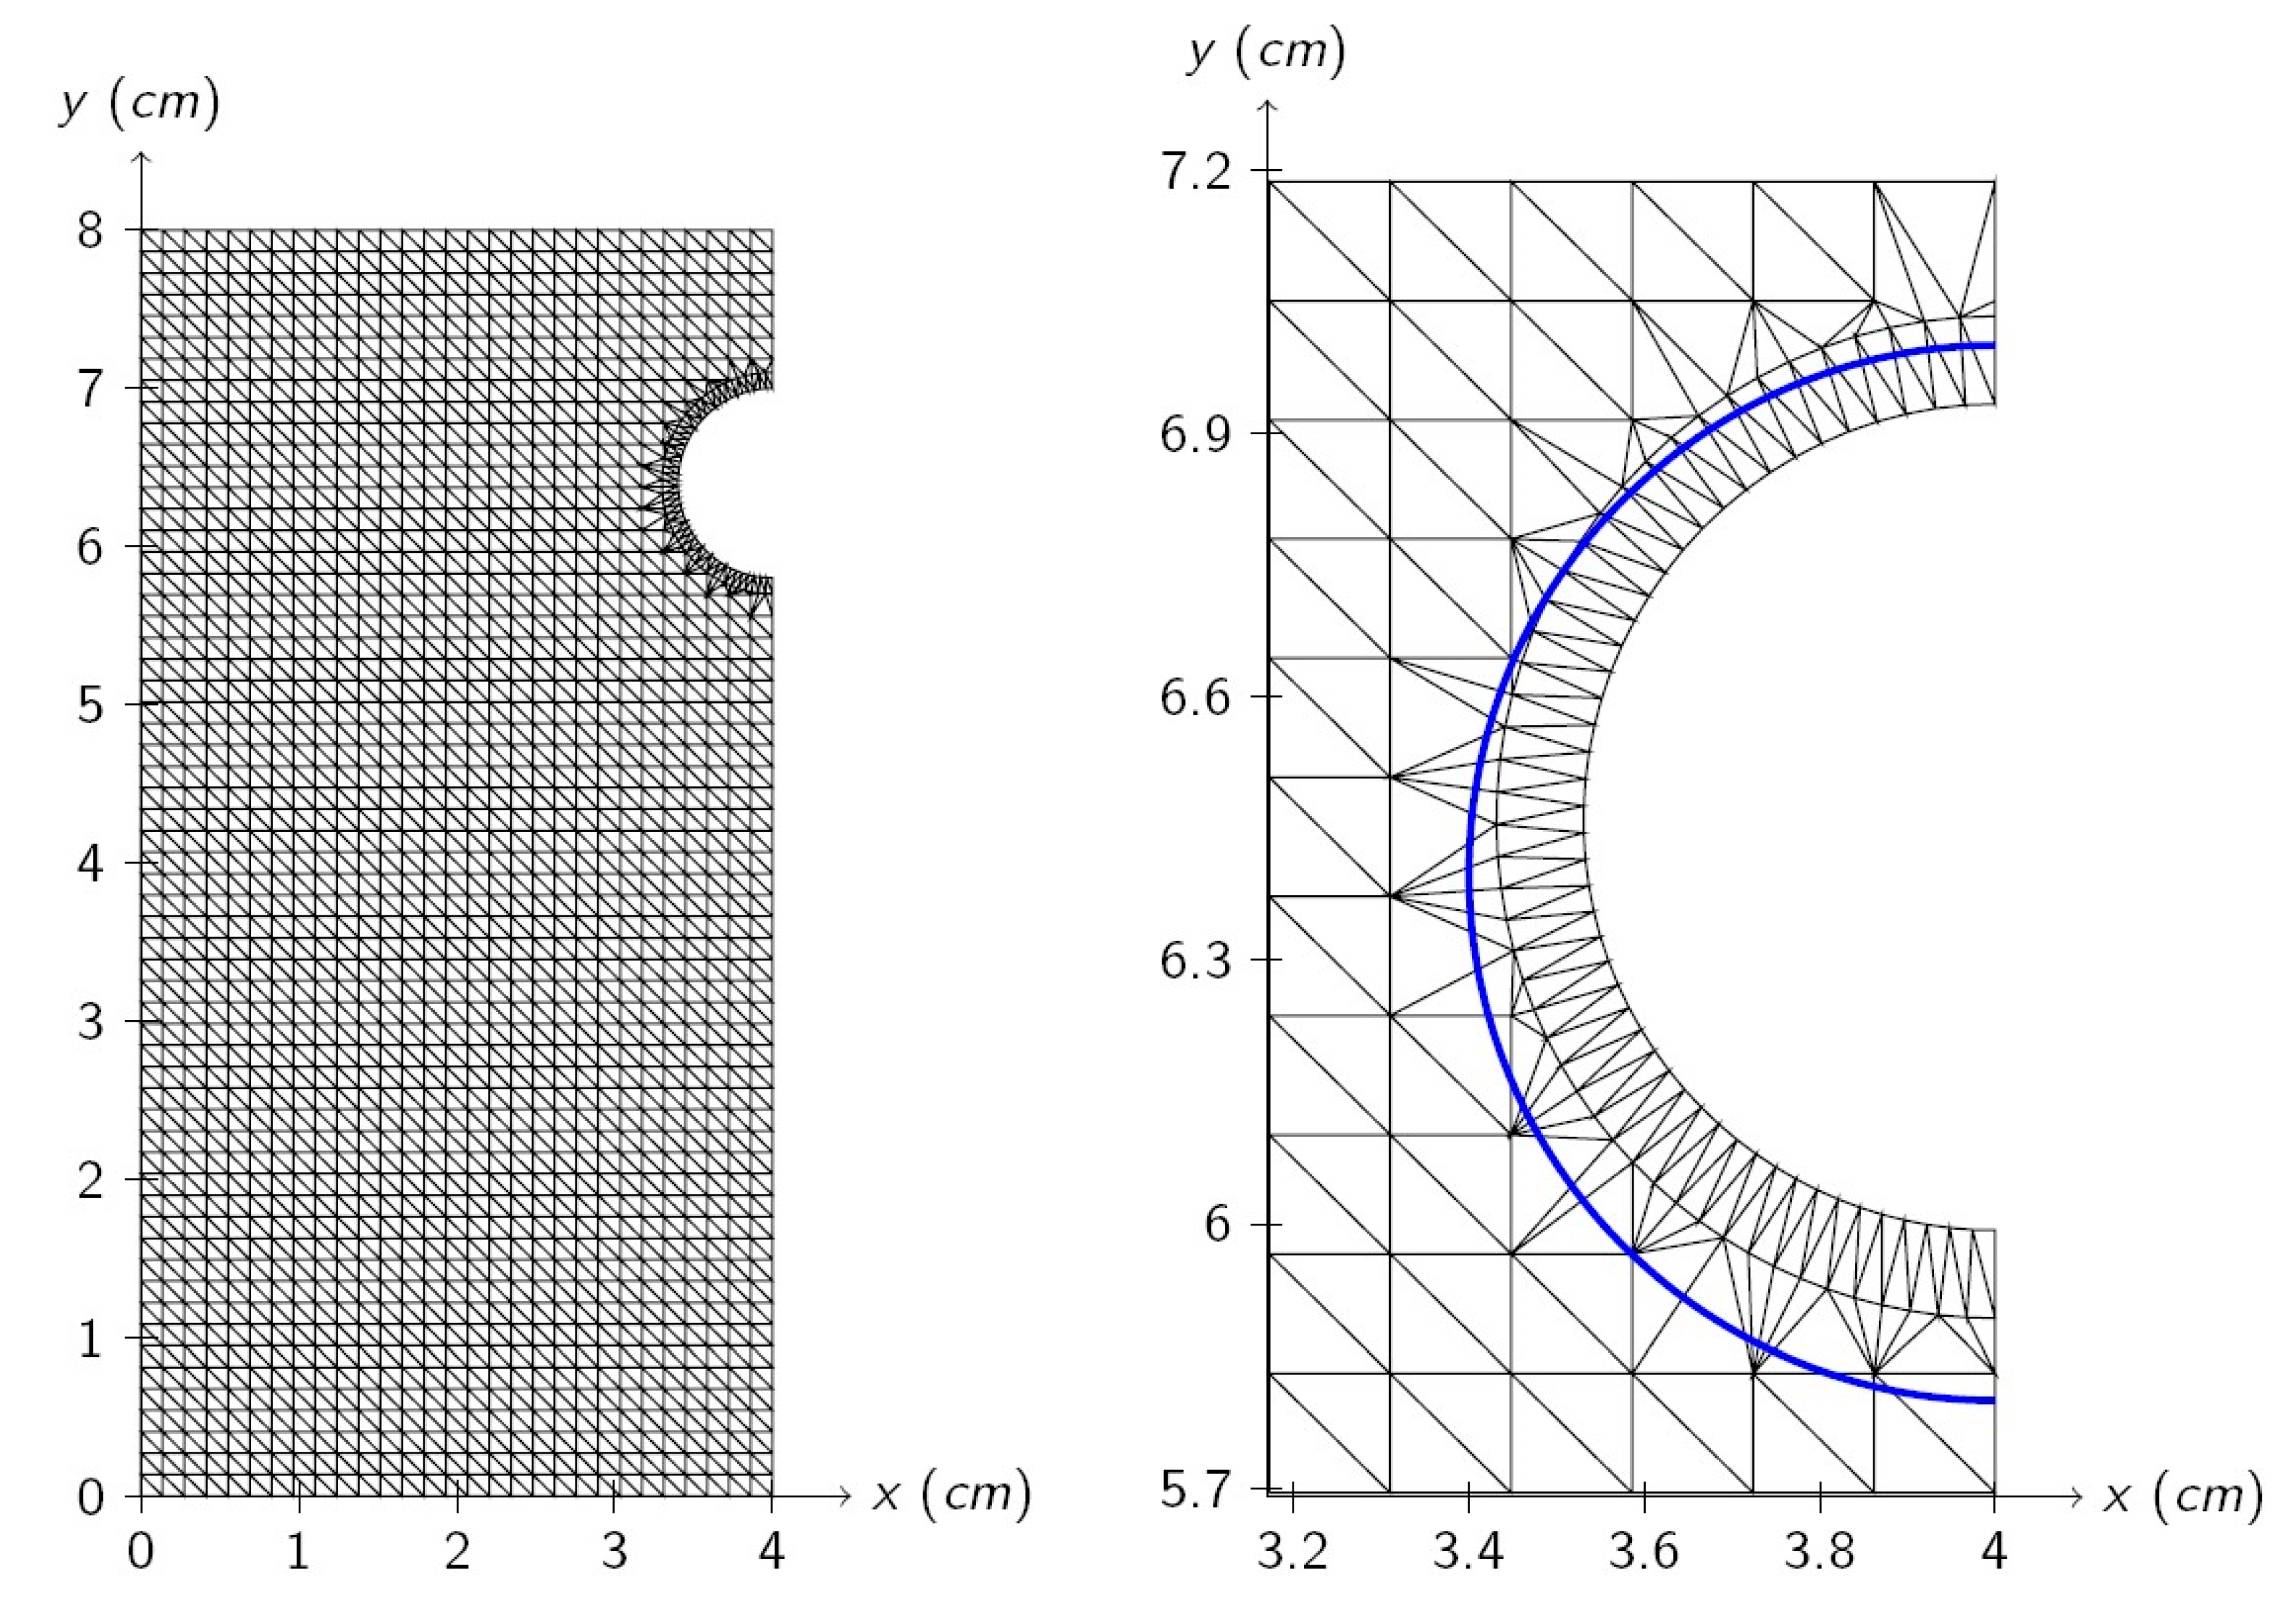
The parameters used for elements mesh definition are shown in
Table 2, where the size of the obtained mesh is also shown. The initial mesh is shown in
Figure 2 (left) and a detail of the mesh obtained after one year of corrosion is shown in
Figure 2 (right), where the solid line shows the initial rebar shape. In this case, a metal section reduction and a shape change can be seen. The radius decrease is higher on the bottom. This is the expected behavior because the bottom part is closer to the cathode.
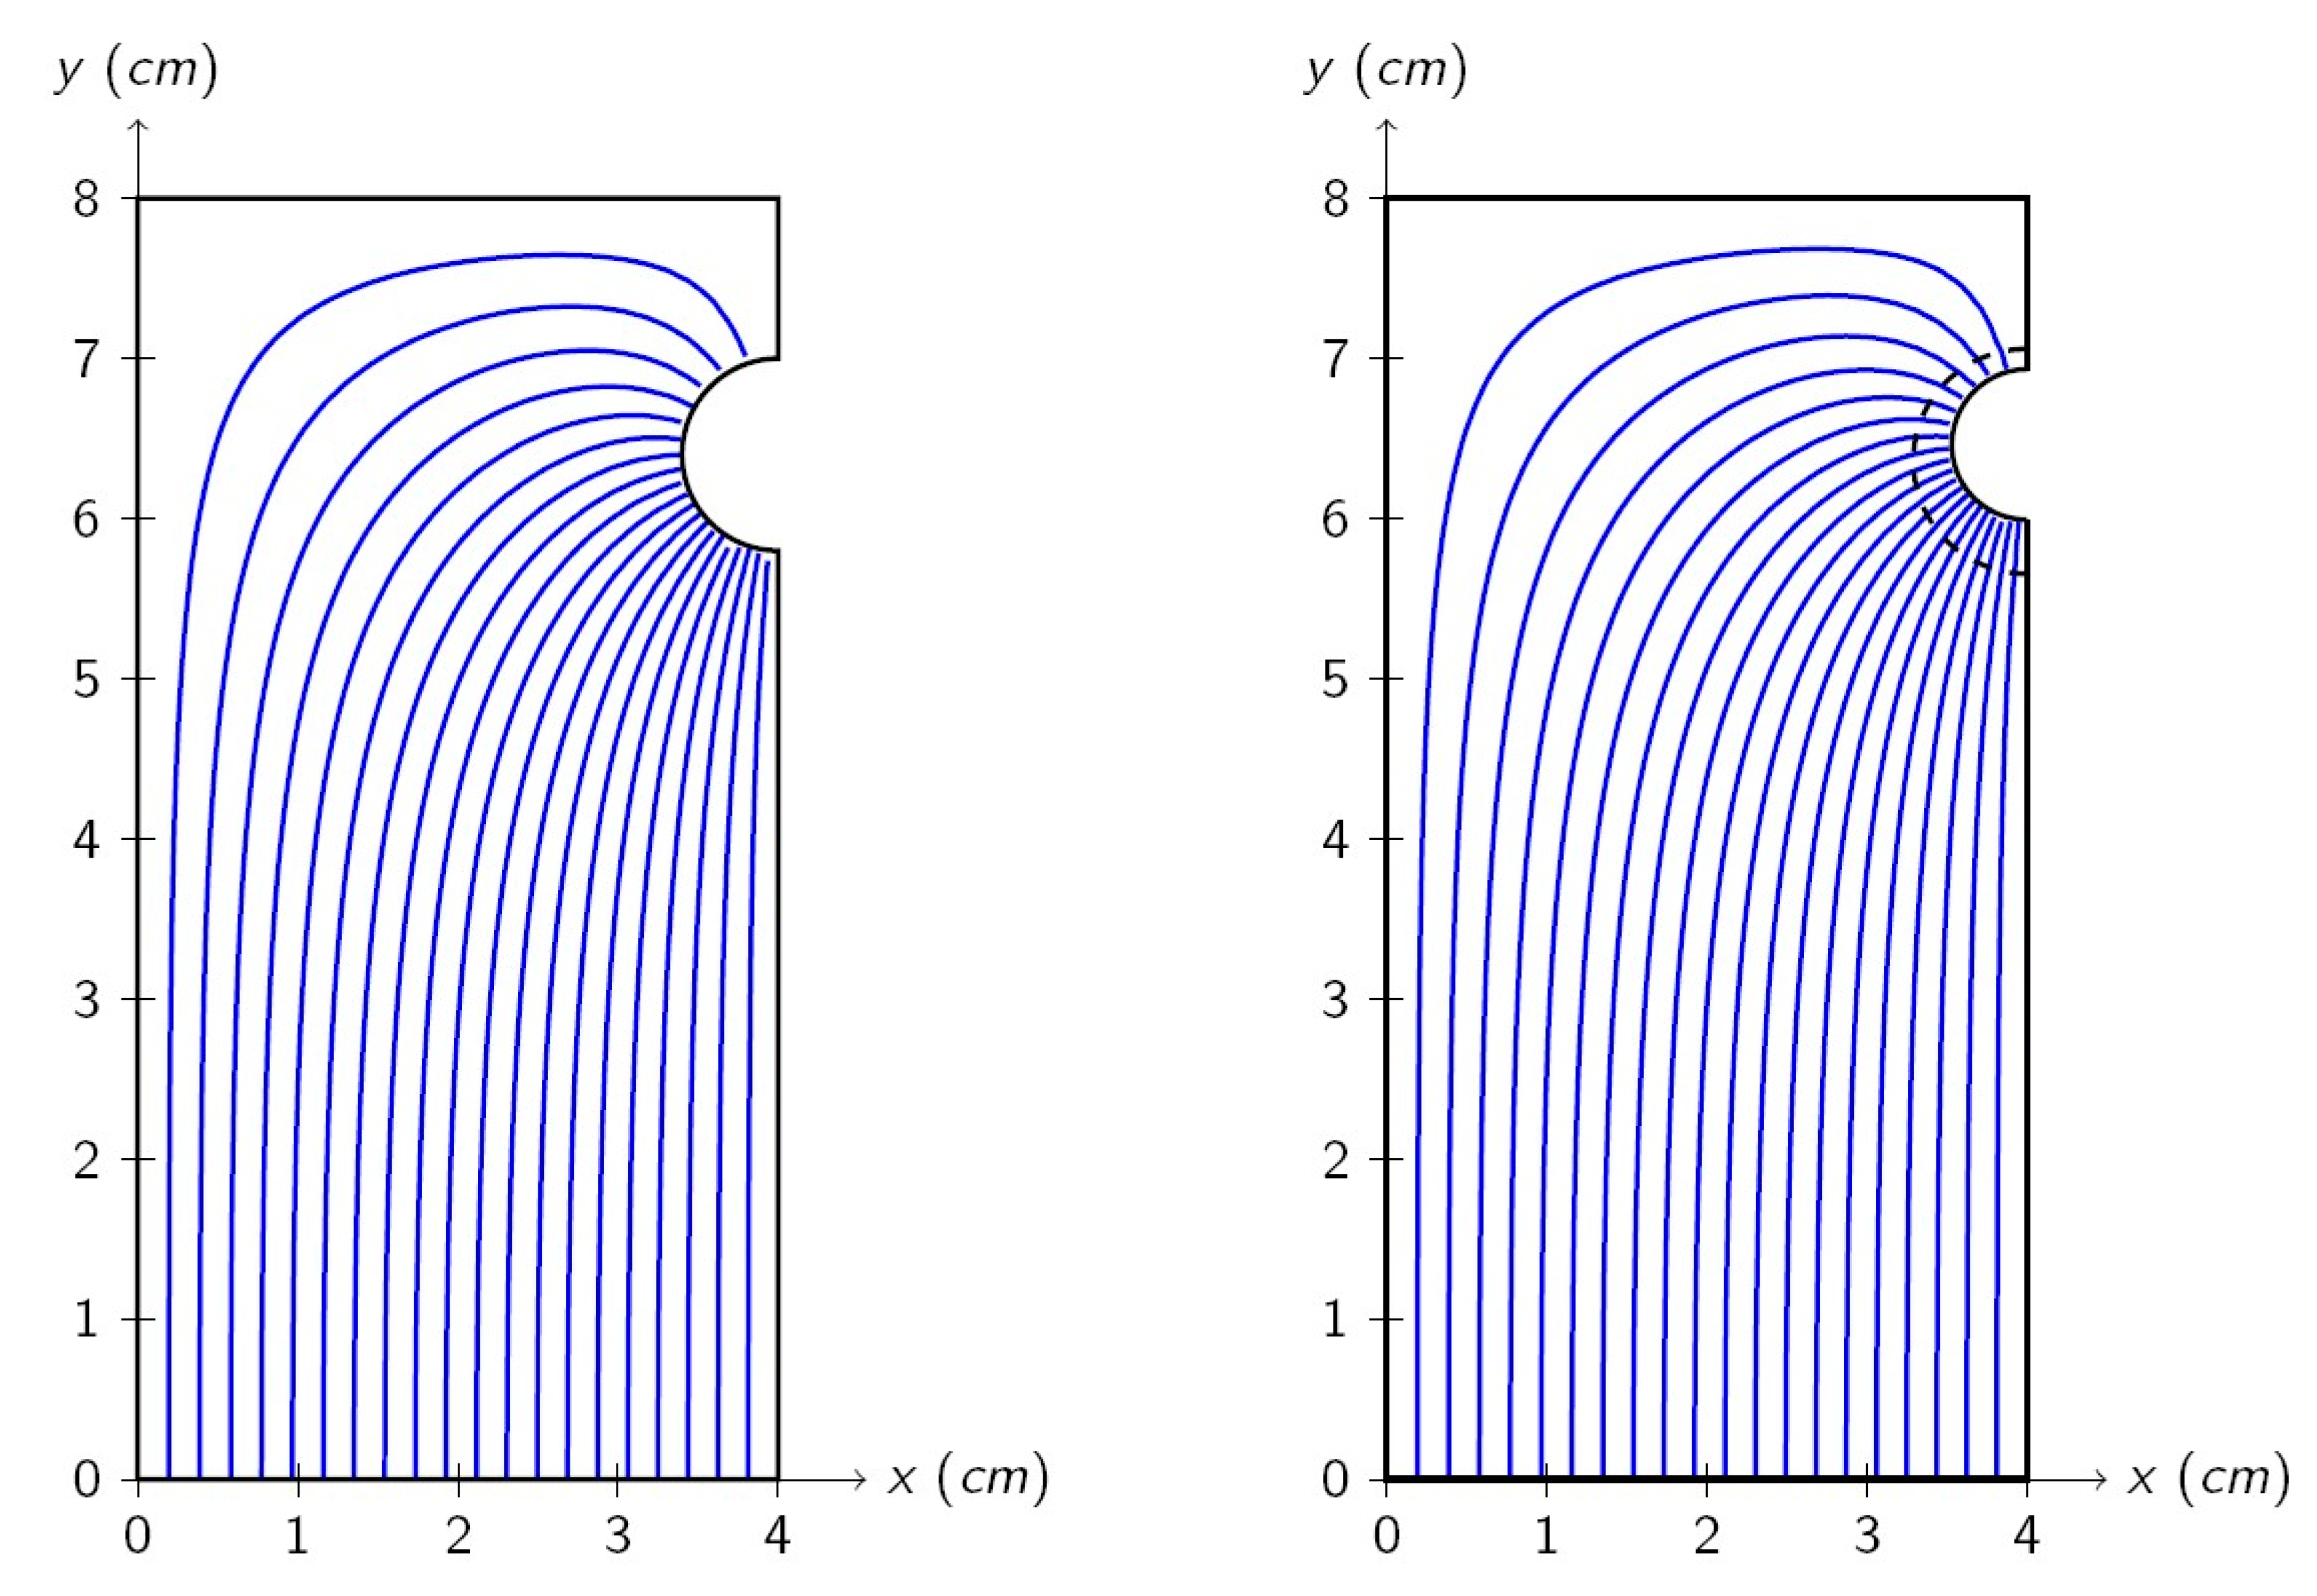
Level curves of
(20 of them are shown), i.e., current streamlines, are shown in
Figure 3 for the beginning of the corrosion test (left) and after one year of corrosion (right). The dashed line shows the oxide layer. The upper part of the rebar is farther from the cathode, and a higher ohmic drop is expected, which causes a lower current density. This is confirmed by the model, which shows a higher density of current streamlines on the lower part of the rebar. It can also be seen in
Figure 3 that the shape of the streamline does not change a lot during time. Nevertheless, the reduction of the metal section implies that the current streamlines are closer on the metal perimeter, which indicates a higher current density on the corroding surface.
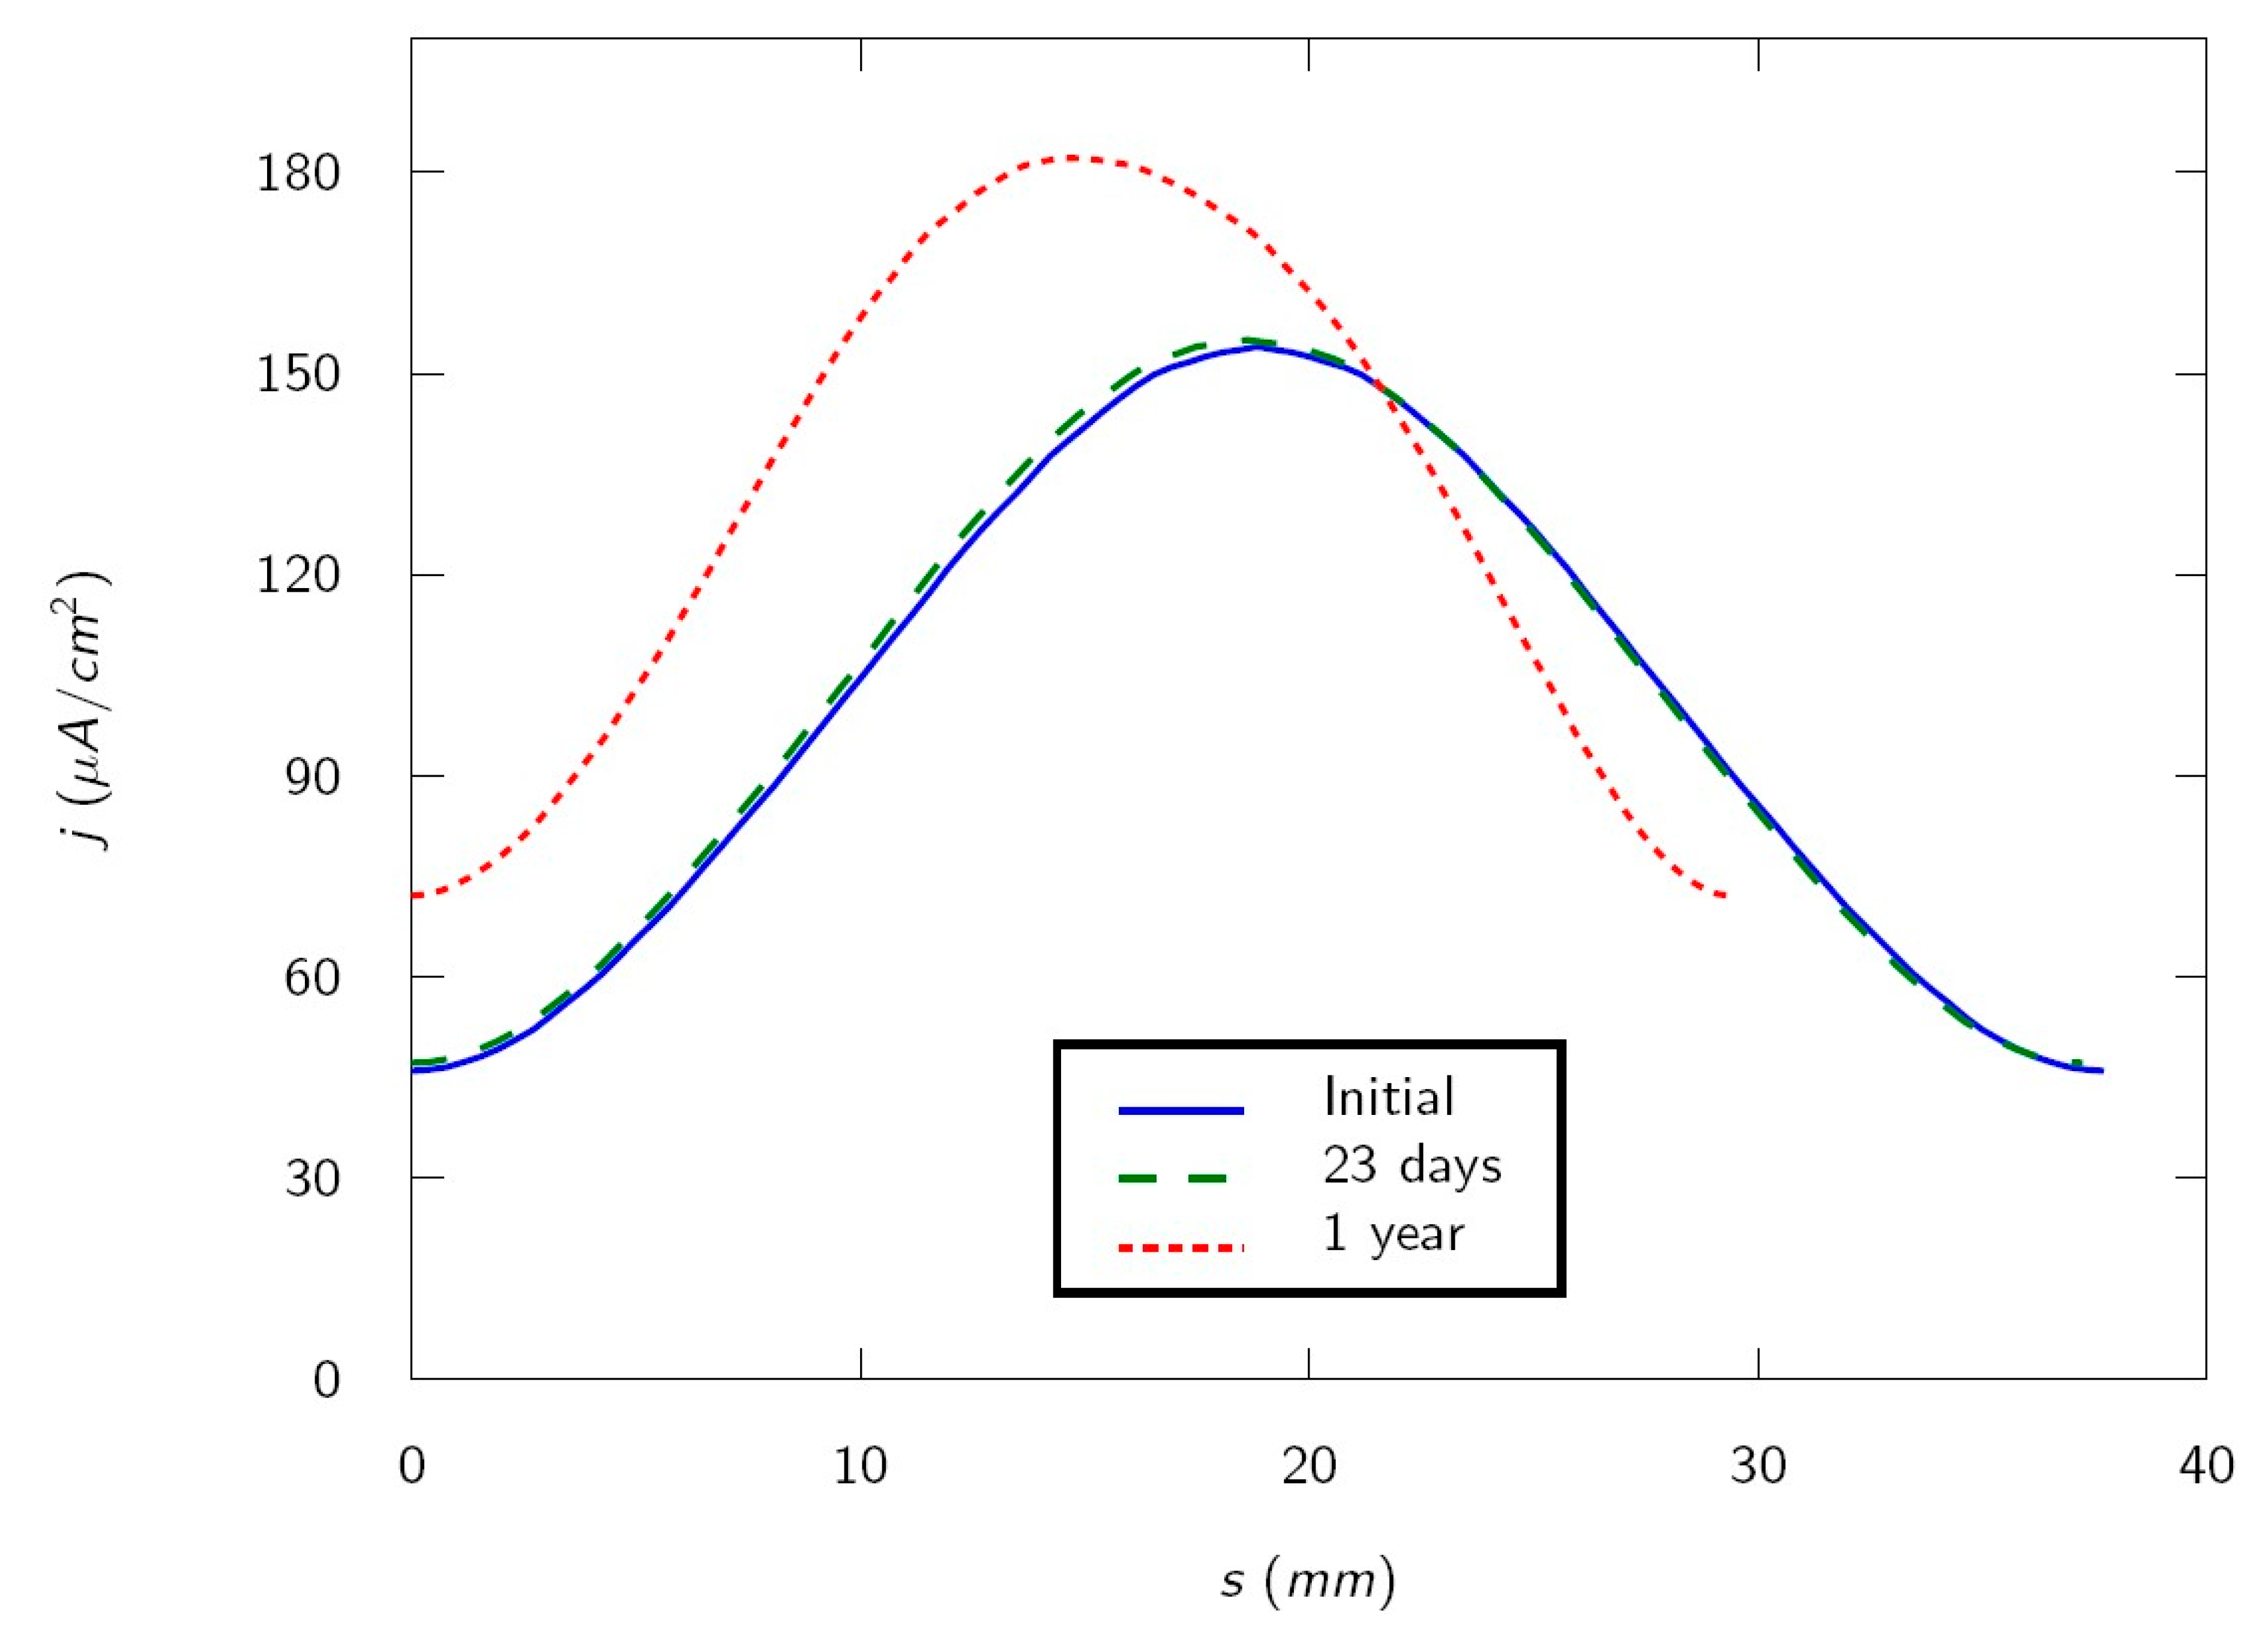
The current density on the rebar perimeter is shown as a function of the length of the perimeter of the metal
in
Figure 4 for 0 days (initial), 23 days (duration of the test), and one year. Note that the curves shorten with time because the perimeter of the metal decreases, according to Equation (8). This is accompanied by a current density increase. This is expected because the experiment is carried out galvanostatically i.e., with constant current. Then a surface reduction implies a current density increase. The maximum current density occurs on the rebar bottom (
, nearest to the cathode) and the minimum on the rebar top (
, farthest from the cathode). Experimentally, it is observed that the first cracks appears on the sample surface at four days, when current distribution is very similar to the initial [
27]. Calculated current density on the rebar bottom and the rebar top when the first cracks occur are, respectively, 154.13 μA/cm
2 and 46.14 μA/cm
2. It is worth noting that, due to the reinforced mortar specimen geometry, cracks appear first on the side where the current density is lower.
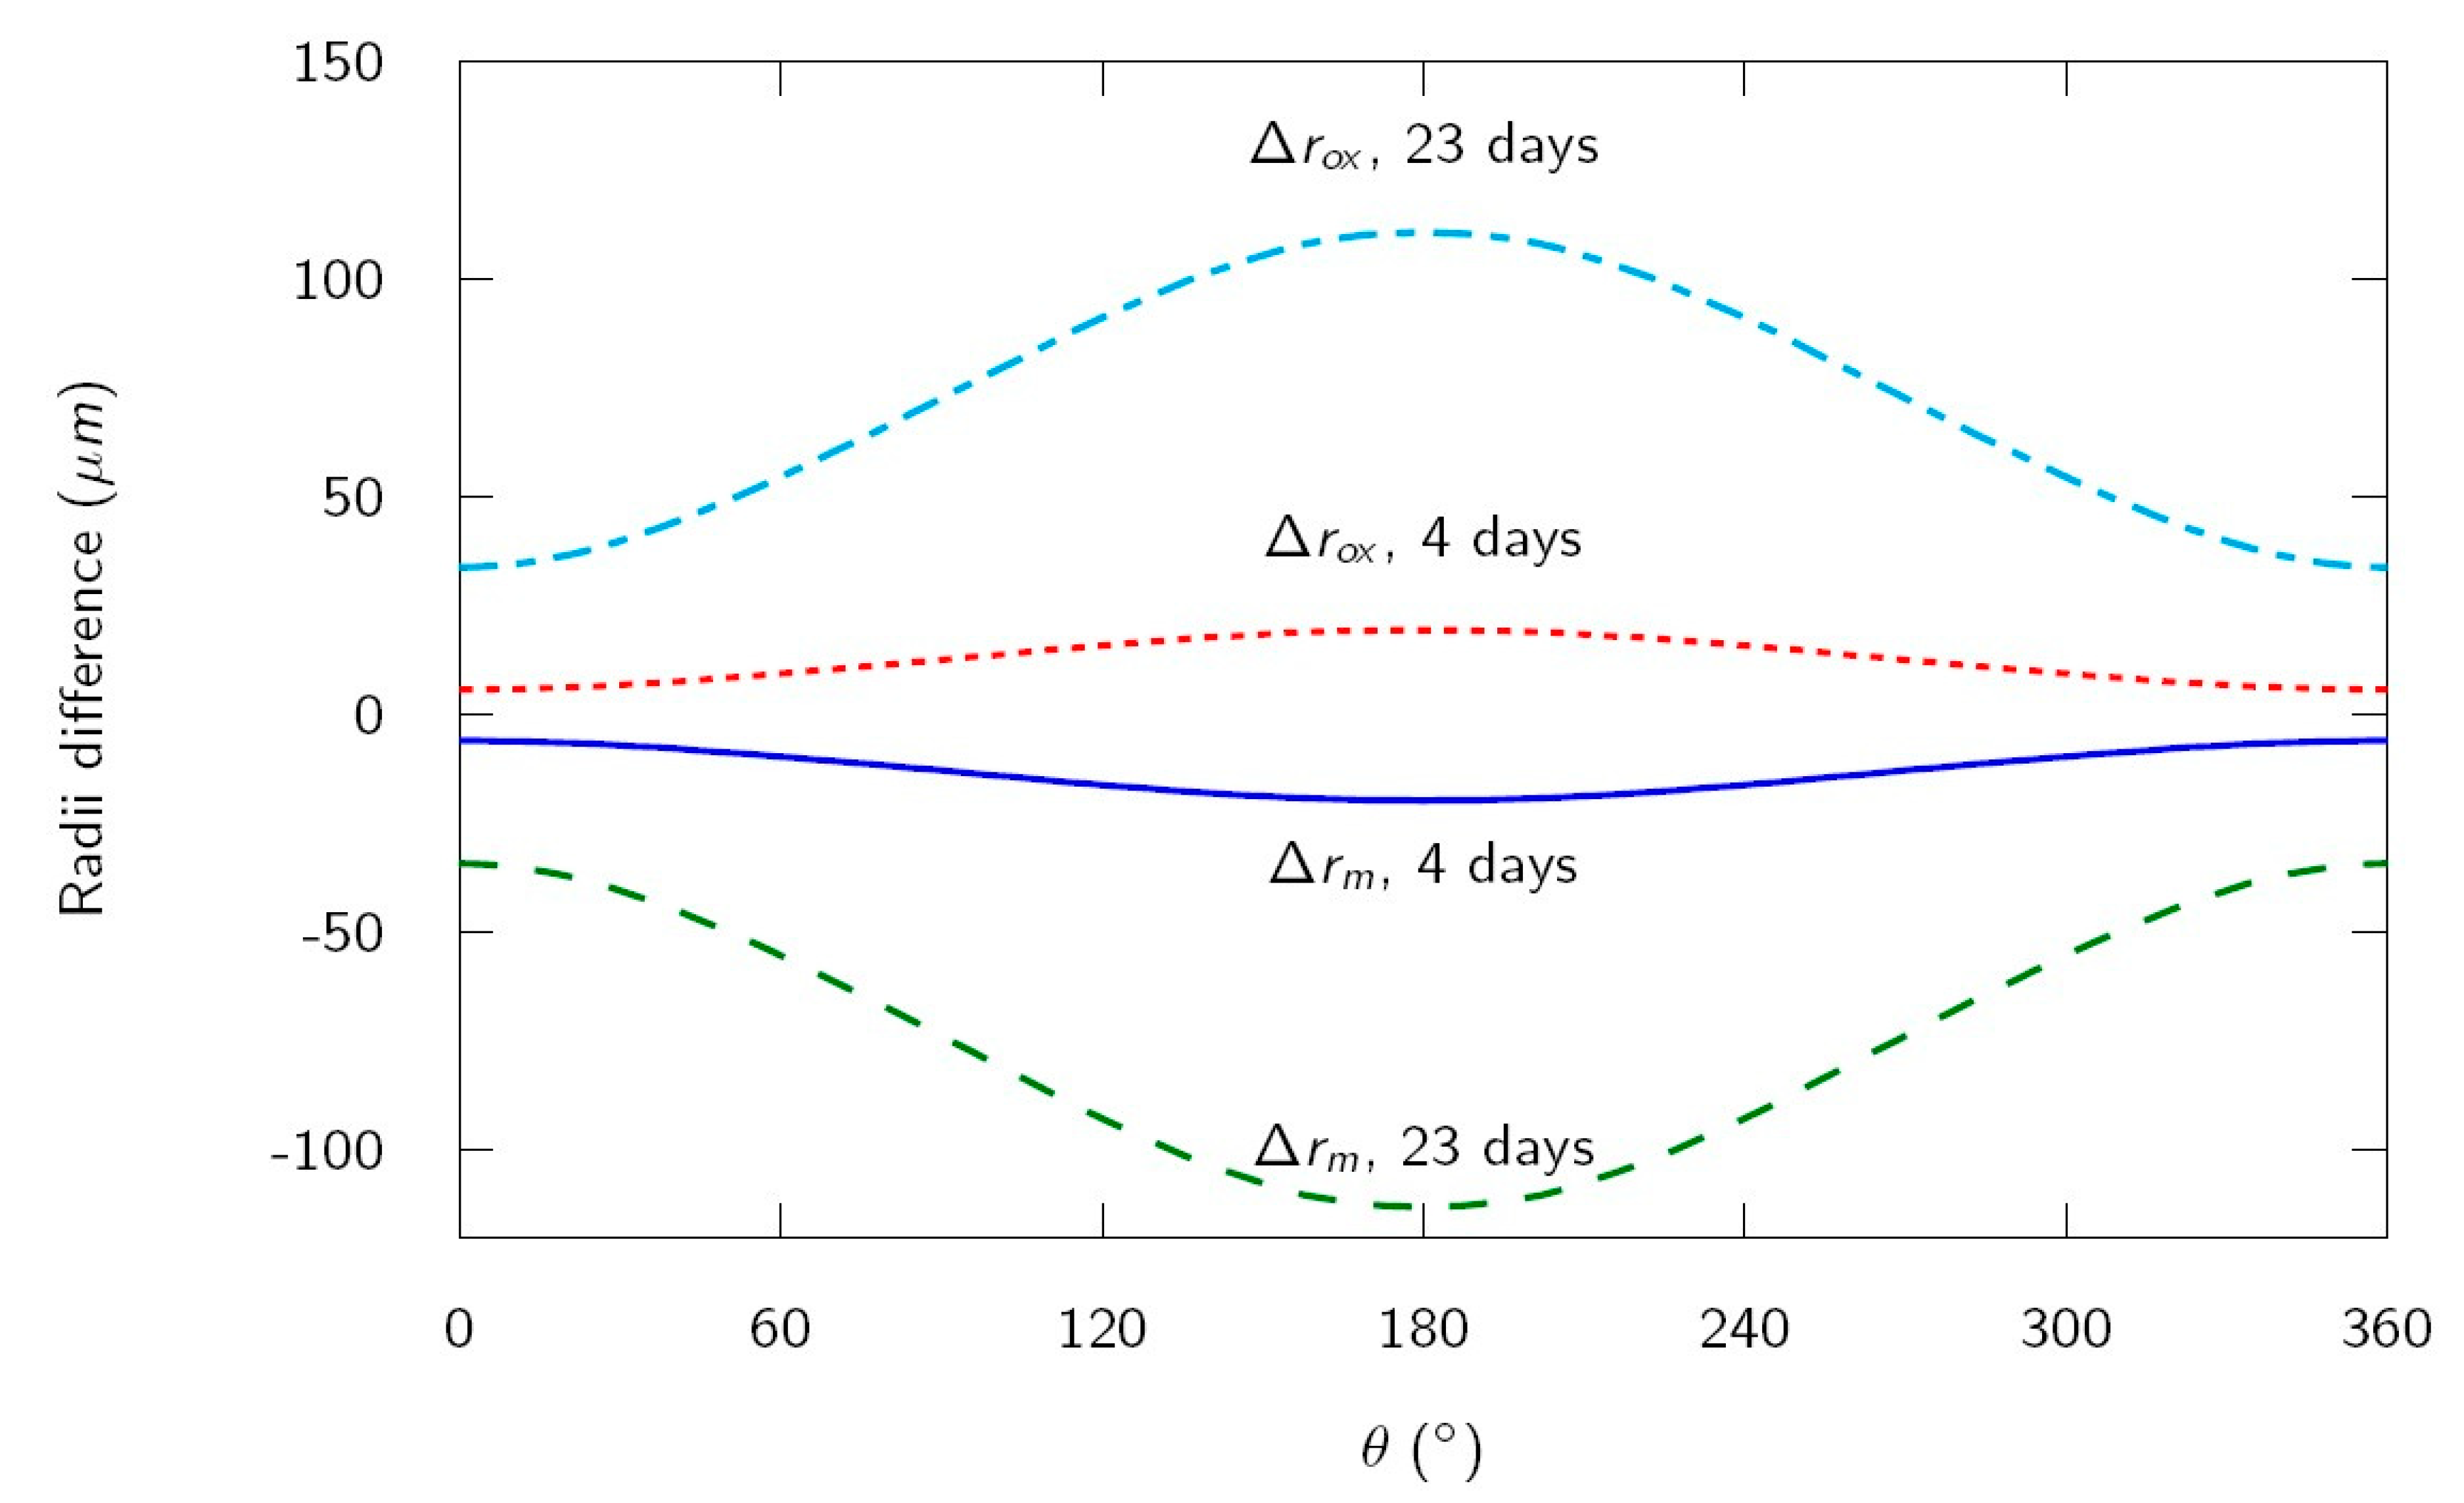
The difference of radii with respect to the initial radius of the rebar for the metal
and for the oxide
are shown in
Figure 5 for four days (appearance of the first cracks on the sample surface) and 23 days (test duration). The values for
(rebar top, minimum radius difference) and for
(rebar bottom, maximum radius difference) for several times are listed in
Table 3. In this case, it can be seen that, according to the simulation, the first cracks on the sample surface appear with a decrease of rebar radius about 20 μm on the bottom side of the bar, but only about 6 μm on the side toward the cracked mortar surface. This estimation is in good agreement with results of experimental works, which concluded that only a few micrometers of loss in rebar radius are needed to induce visible concrete cover cracks, in experimental conditions similar to those modelized in this case [
9].
Graph of
in
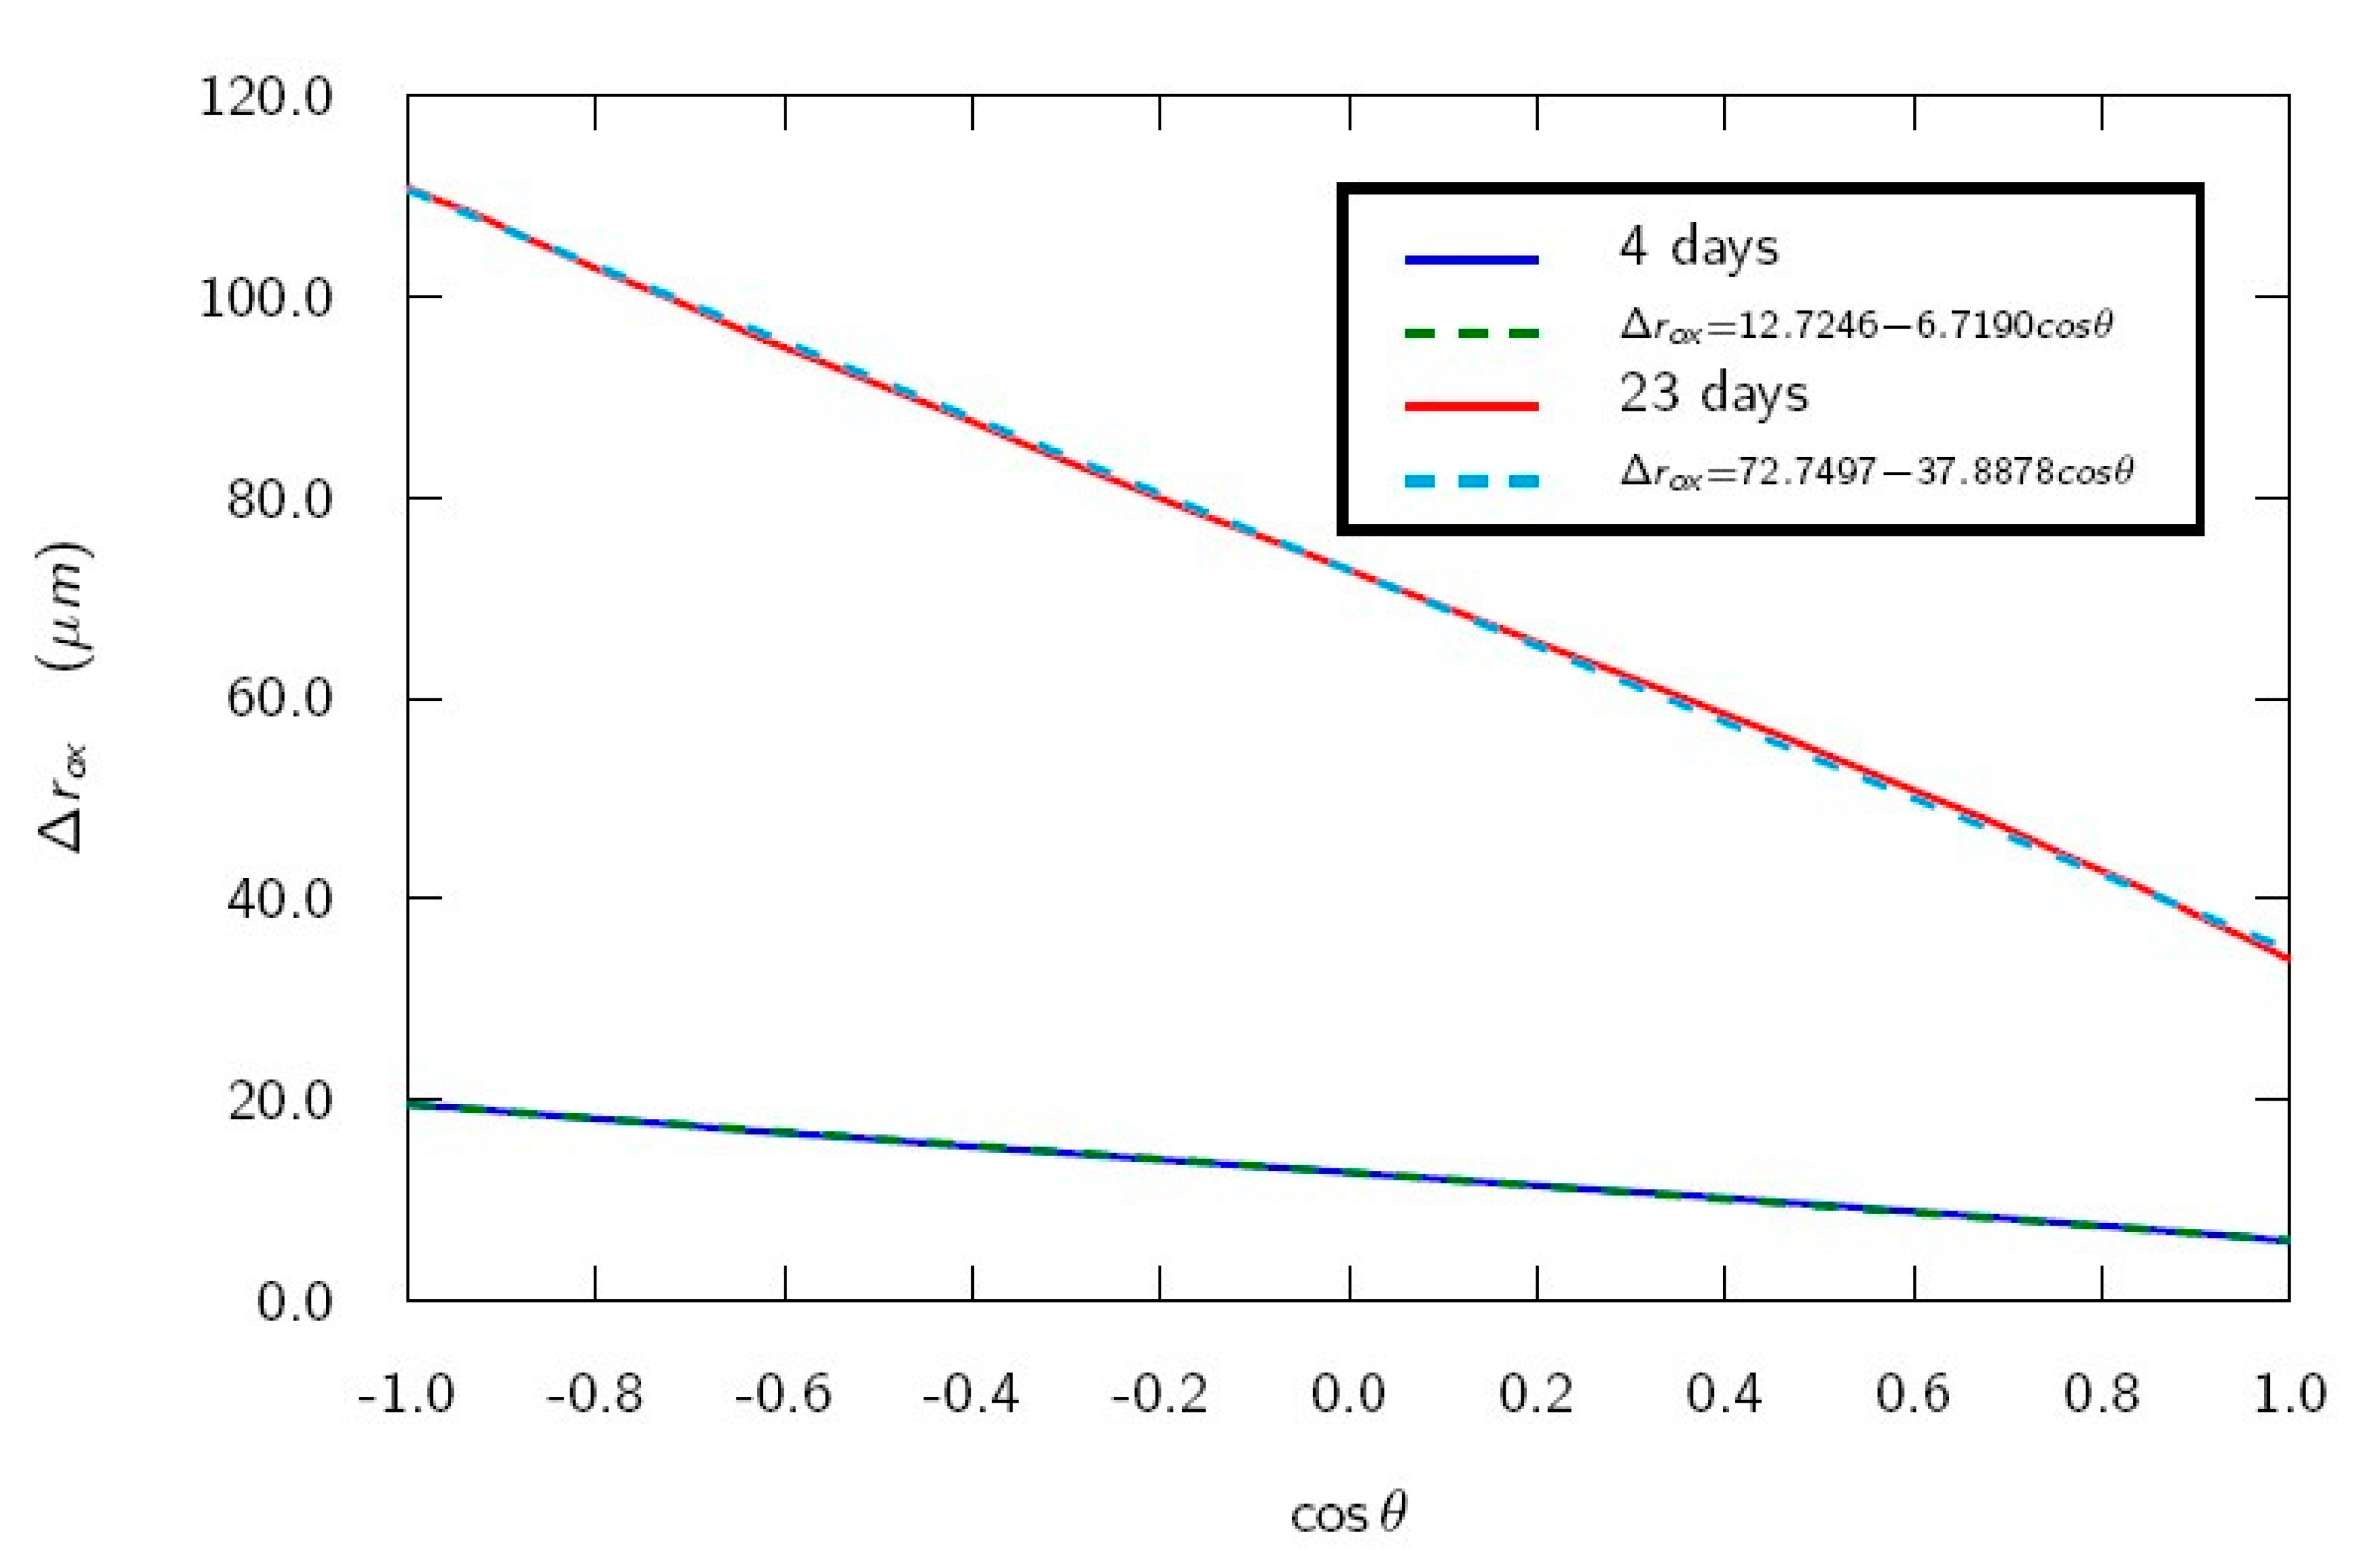
Figure 5 resembles a sinusoidal function of the form (12).
Figure 6 shows a linear fit of
versus
for four days (when the first cracks appear) and 23 days (test duration). A good fit is obtained (r = 0.9998 in both cases). Fitting goodness decreases for longer times (r = 0.9962 for 1 year). Therefore, it can be stated that an increase of the rebar diameter depends on angle
in approximately a sinusoidal way for not long times. A cracking model with a radius dependence of the corroded bar linear with a vertical coordinate has been proposed [
13]. It is worth noting that the proposed dependence (12) with
is equivalent to the dependence used in Reference [
13], and, thus, the presented electrochemical model supports the use of this dependence in the cracking model.

 ,
, 


