Article

New Implant Macrogeometry to Improve and Accelerate the Osseointegration: An In Vivo Experimental Study

by
Sergio Alexandre Gehrke
1,2,*,
Jaime Aramburú Júnior
1,
Leticia Pérez-Díaz
3,
Tiago Luis Eirles Treichel
4,
Berenice Anina Dedavid
5,
Piedad N. De Aza
6 and
Juan Carlos Prados-Frutos
7
1
Department of Research, Biotecnos, Cuareim 1483, 11100 Montevideo, Uruguay
2
Department of Biotechnology, Universidad Católica de Murcia (UCAM), 30107 Murcia, Spain
3
Laboratorio de Interacciones Molecular, Facultad de Ciencias, Universidad de la Republica, Calle Iguá 4225, 11400 Montevideo, Uruguay
4
Department of Surgery, Faculty of Medicine Veterinary, University of Rio Verde, 75.901-970 Rio Verde, Brazil
5
Department of Materials Engineering, Pontificial Catholic University of Rio Grande do Sul, 90619-900 Porto Alegre, Brazil
6
Instituto de Bioingenieria, Universidad Miguel Hernández, Avda. Ferrocarril s/n. 03202- Elche, (Alicante), Spain
7
Department of Medicine and Surgery, Rey Juan Carlos University, Alcorcón, 28922 Madrid, Spain
*
Author to whom correspondence should be addressed.
Submission received: 17 July 2019 / Revised: 31 July 2019 / Accepted: 1 August 2019 / Published: 5 August 2019
(This article belongs to the Special Issue Current Trends in Biomaterial Scaffolds)

Abstract

:
A new implant design with healing chambers in the threads was analyzed and compared with a conventional implant macrogeometry, both implants models with and without surface treatment. Eighty conical implants were prepared using commercially pure titanium (grade IV) by the company Implacil De Bortoli (São Paulo, Brazil). Four groups were performed, as described below: Group 1 (G1), traditional conical implants with surface treatment; group 2 (G2), traditional conical implants without surface treatment (machined surface); group 3 (G3), new conical implant design with surface treatment; group 4 (G4), new conical implant design without surface treatment. The implants were placed in the two tibias (n = 2 implants per tibia) of twenty New Zealand rabbits determined by randomization. The animals were euthanized after 15 days (Time 1) and 30 days (Time 2). The parameters evaluated were the implant stability quotient (ISQ), removal torque values (RTv), and histomorphometric evaluation to determine the bone to implant contact (%BIC) and bone area fraction occupancy (BAFO%). The results showed that the implants with the macrogeometry modified with healing chambers in the threads produced a significant enhancement in the osseointegration, accelerating this process. The statistical analyses of ISQ and RTv showed a significative statistical difference between the groups in both time periods of evaluation (p ≤ 0.0001). Moreover, an important increase in the histological parameters were found for groups G3 and G4, with significant statistical differences to the BIC% (in the Time 1 p = 0.0406 and in the Time 2 p < 0.0001) and the BAFO% ((in the Time 1 p = 0.0002 and in the Time 2 p = 0.0045). In conclusion, the result data showed that the implants with the new macrogeometry, presenting the healing chambers in the threads, produced a significant enhancement in the osseointegration, accelerating the process.

1. Introduction

According to statistics from the American Association of Oral and Maxillofacial Surgeons, approximately 70% of adults between the ages of 35 and 44 can lose at least one permanent tooth due to trauma, periodontal, or endodontic complications [1]. Approximately 5 million dental implants are being placed every year in the United States of America as per the American Dental Association, with a elevated rate of success (<90%), with low risk and/or complication [2]. Currently, dental implants are used as an alternative in rehabilitative treatments with a good degree of predictability. Several clinical studies have shown good results in treatments in long-term follow-up patients of unitary, partial, or totally edentulous areas [3,4,5]. Despite this, several companies and research centers have invested in the improvement of implants mainly seeking to reduce the time and/or improve the healing of the bone tissue around the implanted surface. However, many events involved in the osseointegration process have not yet been completely elucidated.
Several investigations to improve or accelerate the process of osseointegration have been studied, as well worked on to elaborate new treatments for the surface of the implants (micro topography) with different physical and chemical characteristics [5,6,7,8,9]. These modifications have shown good results, mainly in pre-clinical studies, as reported in the literature [10,11,12,13].
The surgical technique used to elaborate the osteotomy and the macrogeometry of the implant is also a factor considered of great importance in the process of osseointegration. Several models with different macrogeometries and surface treatment have been proposed and are commercialized [14,15,16], with each design following its specific recommendations as to the type of bone where it should be used and the specific surgical technique for its installation [17]. Conventionally, osteotomy is performed with the last drill having a smaller diameter in relation to the implant diameter, so that it is inserted with a high degree of torque. Obviously, the more sub-dimensioned the bed receiving the implant is, the greater the insertion torque. However, it is speculated that high levels of torque can cause a high compression in the bone tissue, which can lead to extensive bone remodeling over time [18]. Several other studies have shown that depending on the insertion torque of the implant and whether it is beyond the physiological tolerance limit, it may present microfractures or osteonecrosis by compression [19,20,21].
Recently, studies have proposed that approaching the diameter of the drilling (during the osteotomy) with the diameter of the implant that will be inserted into the bone, can facilitate and improve osseointegration [22,23]. This fact was demonstrated by Jimbo and collaborators in a study using a dog animal model, where, in the implants placed with high torque, the samples presented a certain amount of necrotic bone inside the implant threads, whereas in the samples where a larger drilling was used, the samples presented a substantial formation of new bone [23]. In this case, the free space created inside the implant threads, resulting from the drill-implant diameter ratio, is called the healing chambers (Figure 1).
Within the consistence of these concepts of the “no bone compression” during the implant installation in the bone tissue, a new implant design with decompression chambers in the threads to improve and accelerate the osseointegration process, was analyzed and compared with a conventional implant macrogeometry, both implants models with and without surface treatment. Histological and biomechanical analyses were performed using the rabbit tibia experimental model. The hypothesis was that the chambers created in the threads can promote decompression of the bone during introduction in the osteotomy and, then, a positive effect on the osseointegration.

2. Materials and Methods

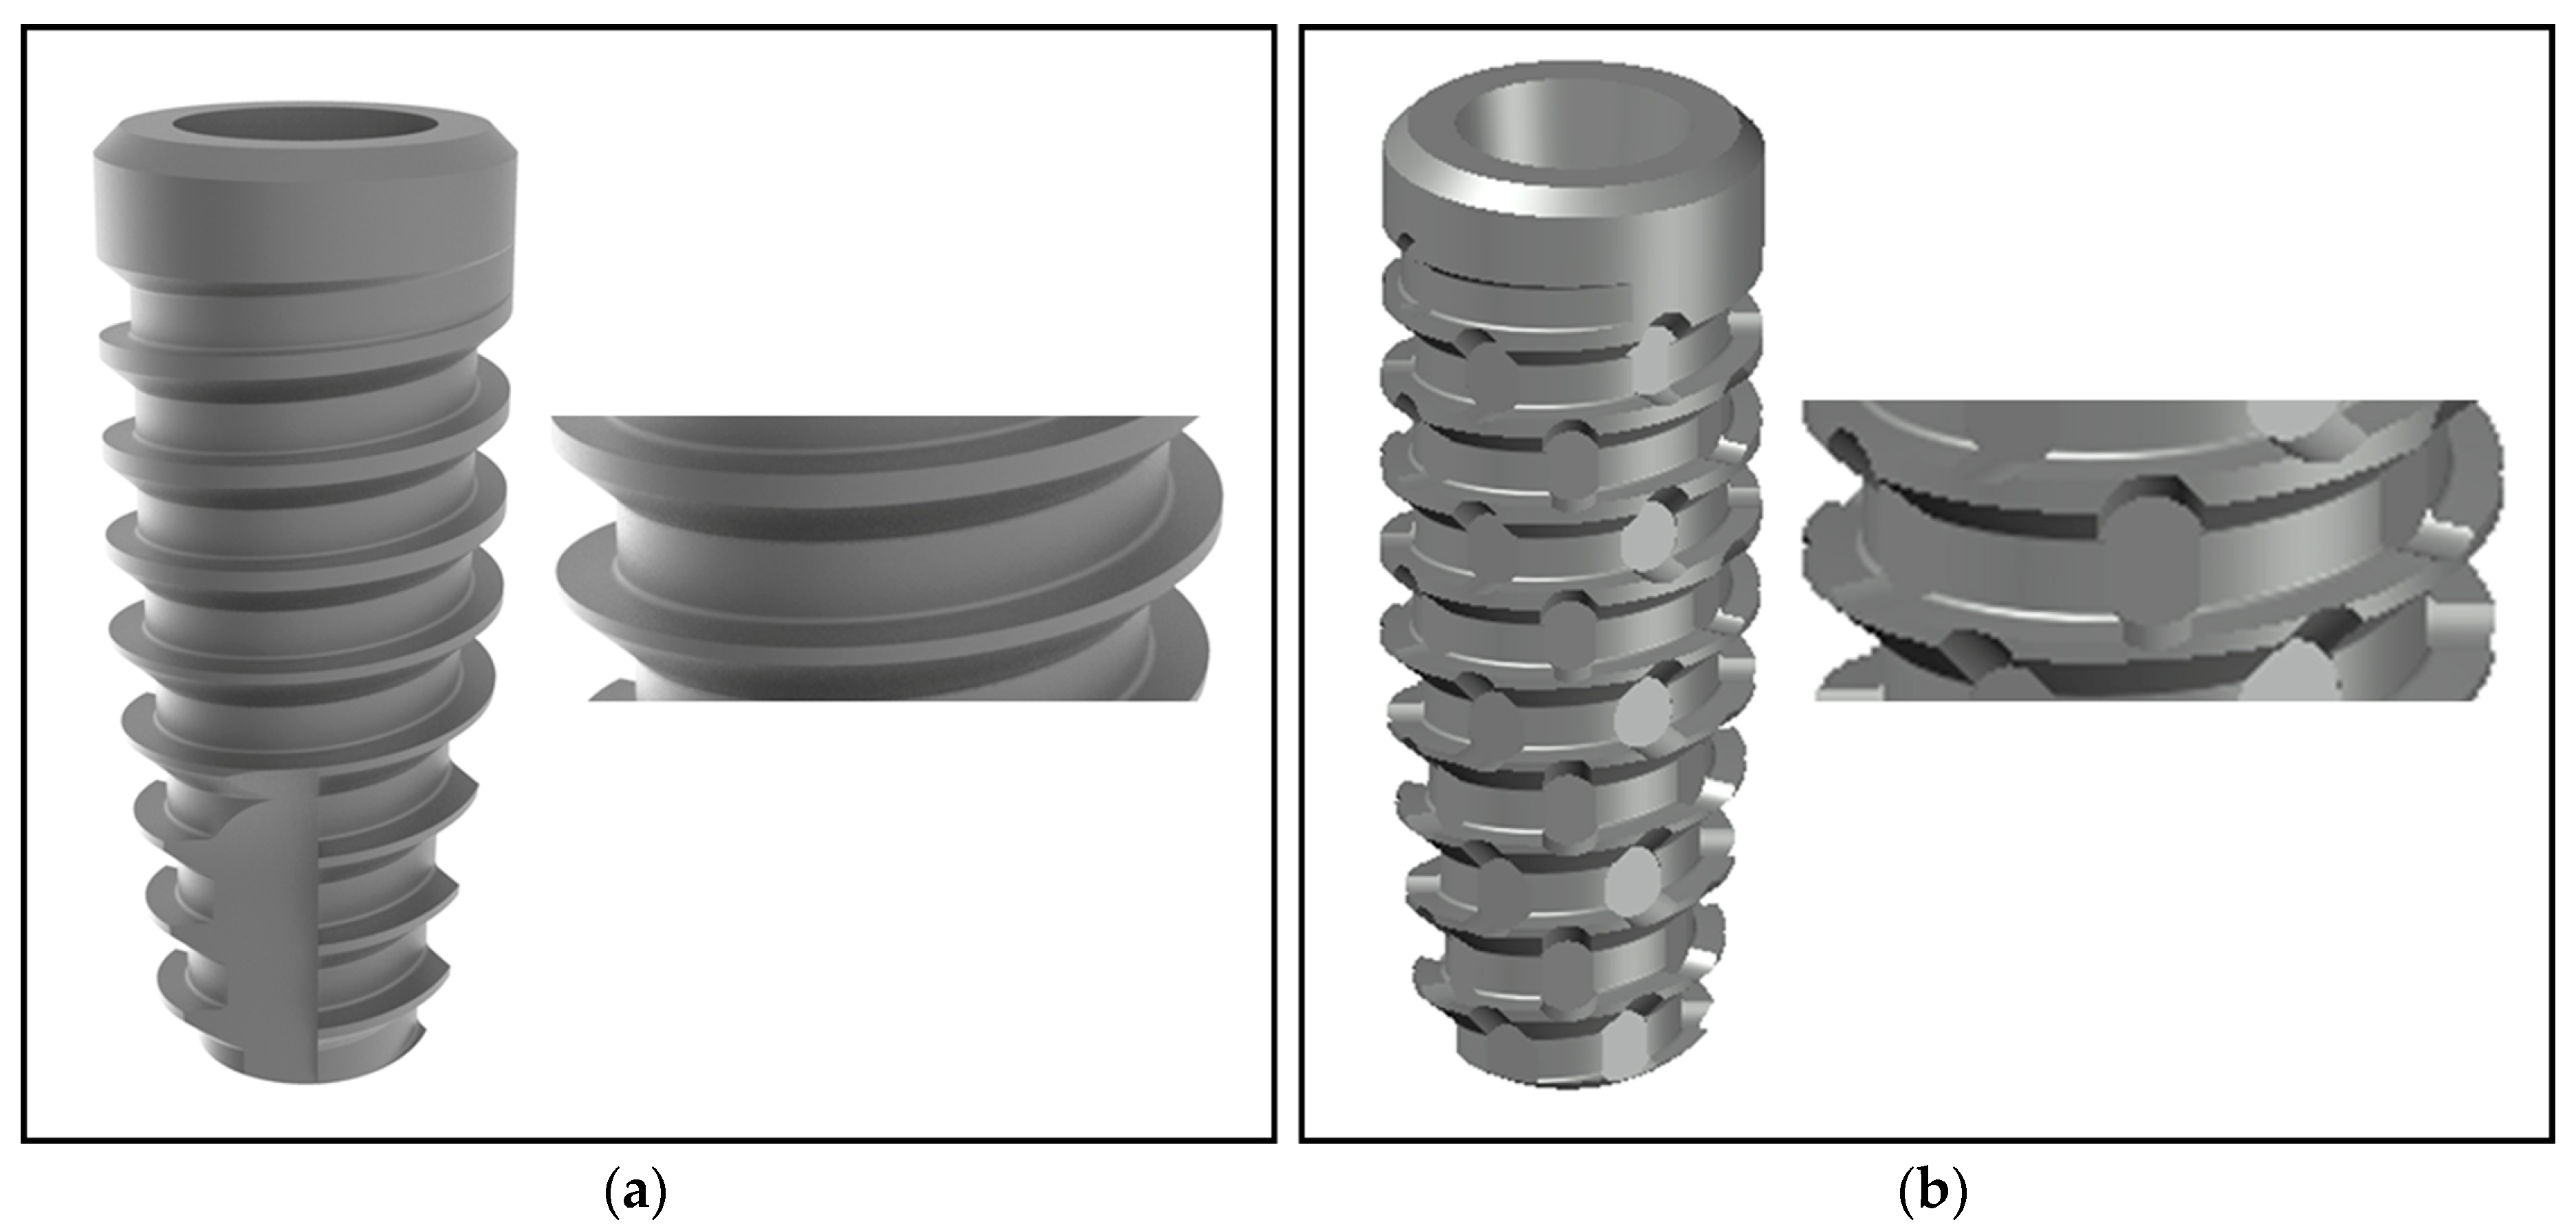
Implants and groups formation: Eighty conical implants were prepared in pure titanium grade IV (Implacil De Bortoli Ltd.a, São Paulo, Brazil) which were 9 mm in length and 4 mm in diameter. The macrogeometry of the implants used presented the traditional design and threads configuration (Figure 2a) and, the new macrogeometry implant with the presence of decompression chambers in the threads design (Figure 2b).
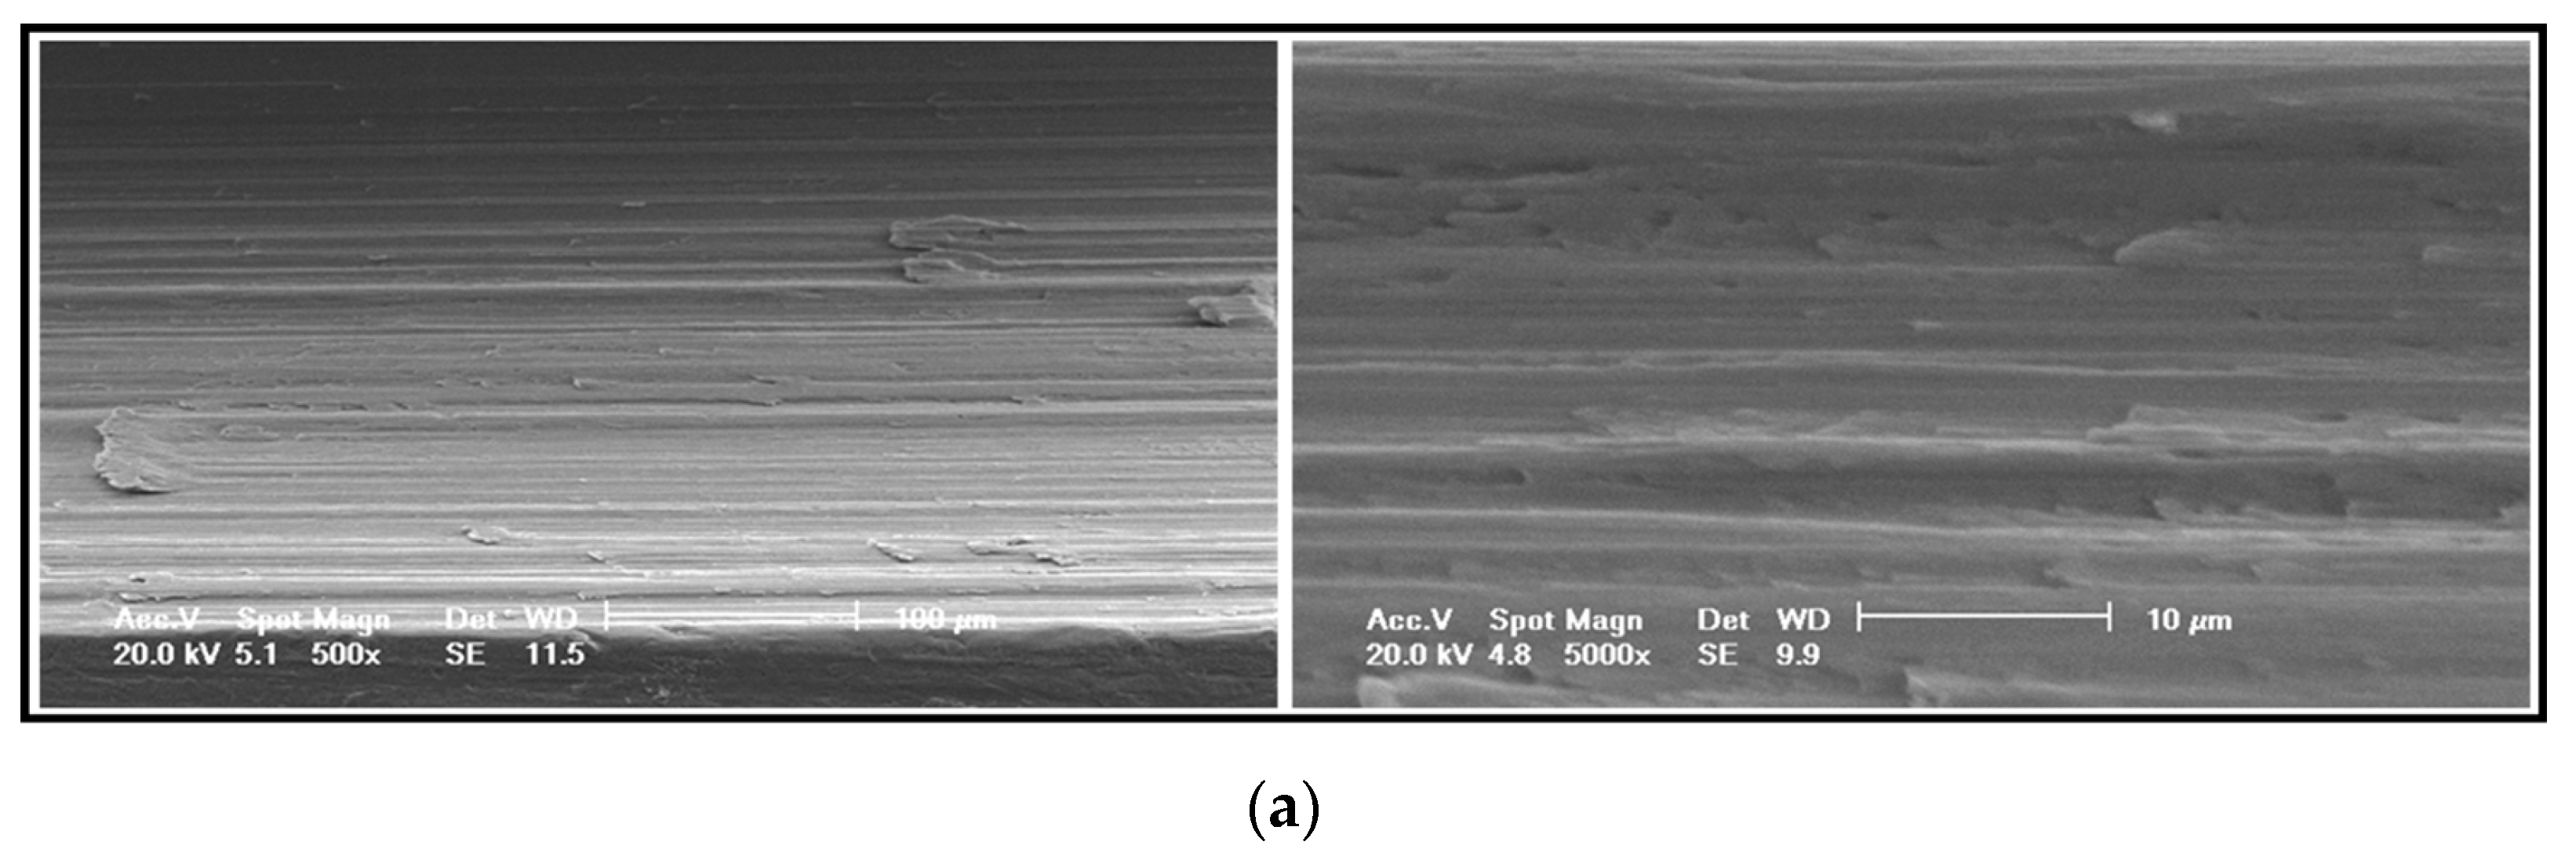
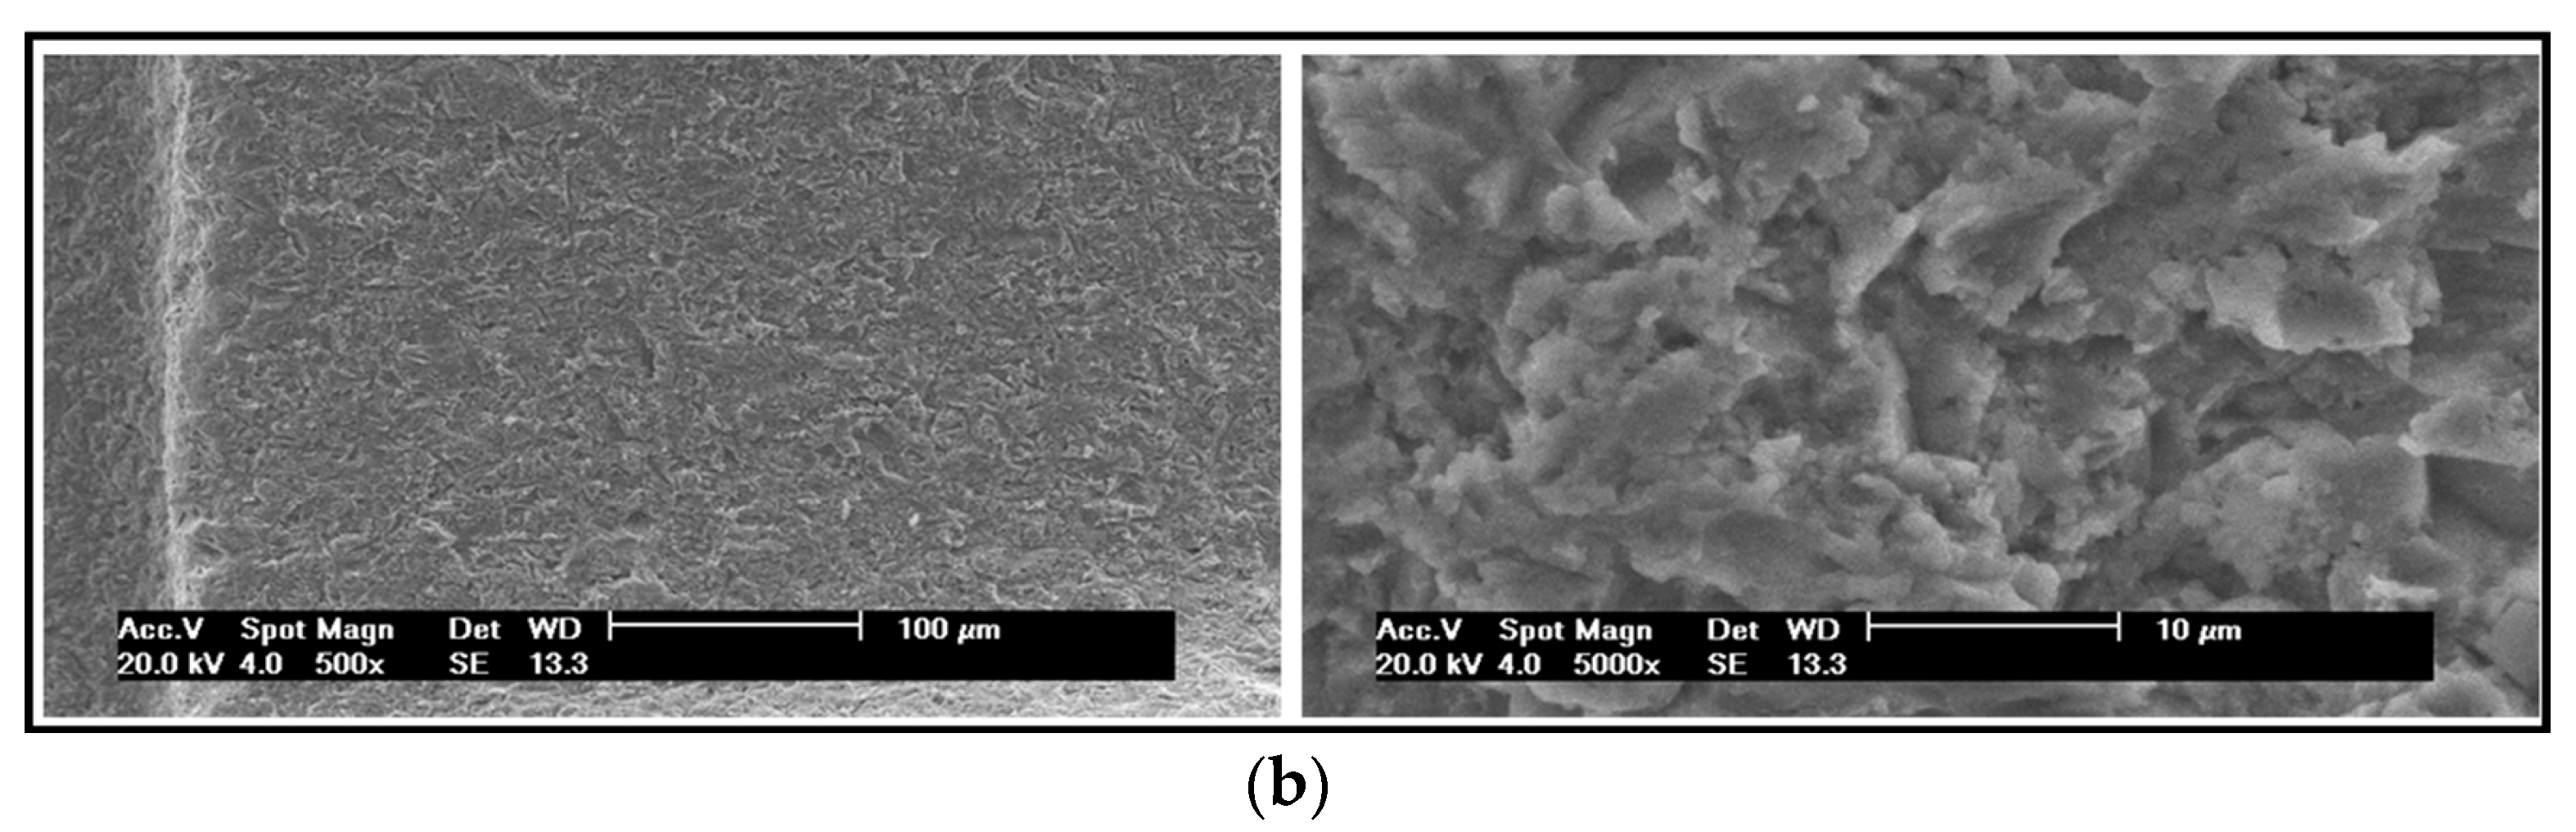
Based on the initial proposed hypothesis, both implant macrogeometries were prepared with and without (machined only) surface treatment. The surface treatment used was performed by blasting with microparticles (~100 µm) of titanium oxide and followed by application of maleic acid, showing a roughness with Ra = 0.56 ± 0.10 µm [8]. Figure 3 shows the scanning electronic microscopy (SEM) of the two surfaces used for the comparison.
Then, the implants were divided into four groups in accordance with the macrogeometry and the surface condition (with or without treatment), as the following: Group 1 (G1), traditional conical implants with surface treatment; group 2 (G2), traditional conical implants without surface treatment (machined surface); group 3 (G3), new conical implant design with surface treatment; group 4 (G4), new conical implant design without surface treatment. All implants were subjected to washing, decontamination, sterilization, and packaging in accordance with the requirements for commercialization of these materials.
Animal procedures: Twenty New Zealand white rabbits, weighing 4 ± 0.5 kg, were used for the present experimental study. The animals received the standards care and management applied in the previous studies performed and described by our research group [10,11]. The international guidelines of animal studies were applied. The study was approved by the Animal Experimentation Committee (Number 02-17UnRV), University of Rio Verde (Rio Verde, Brazil). A total of eighty implants (n = 20 per group) were installed in both tibias (n = 2 per tibia). The implants distribution was made by the randomization program (www.randomization.com). Initially, the animals were anesthetized using a combination of 0.35 mg/kg of ketamine (Ketamina Agener®; Agener União Ltd.a., São Paulo, Brazil) and 0.5 mg/kg of xylazine (Rompum
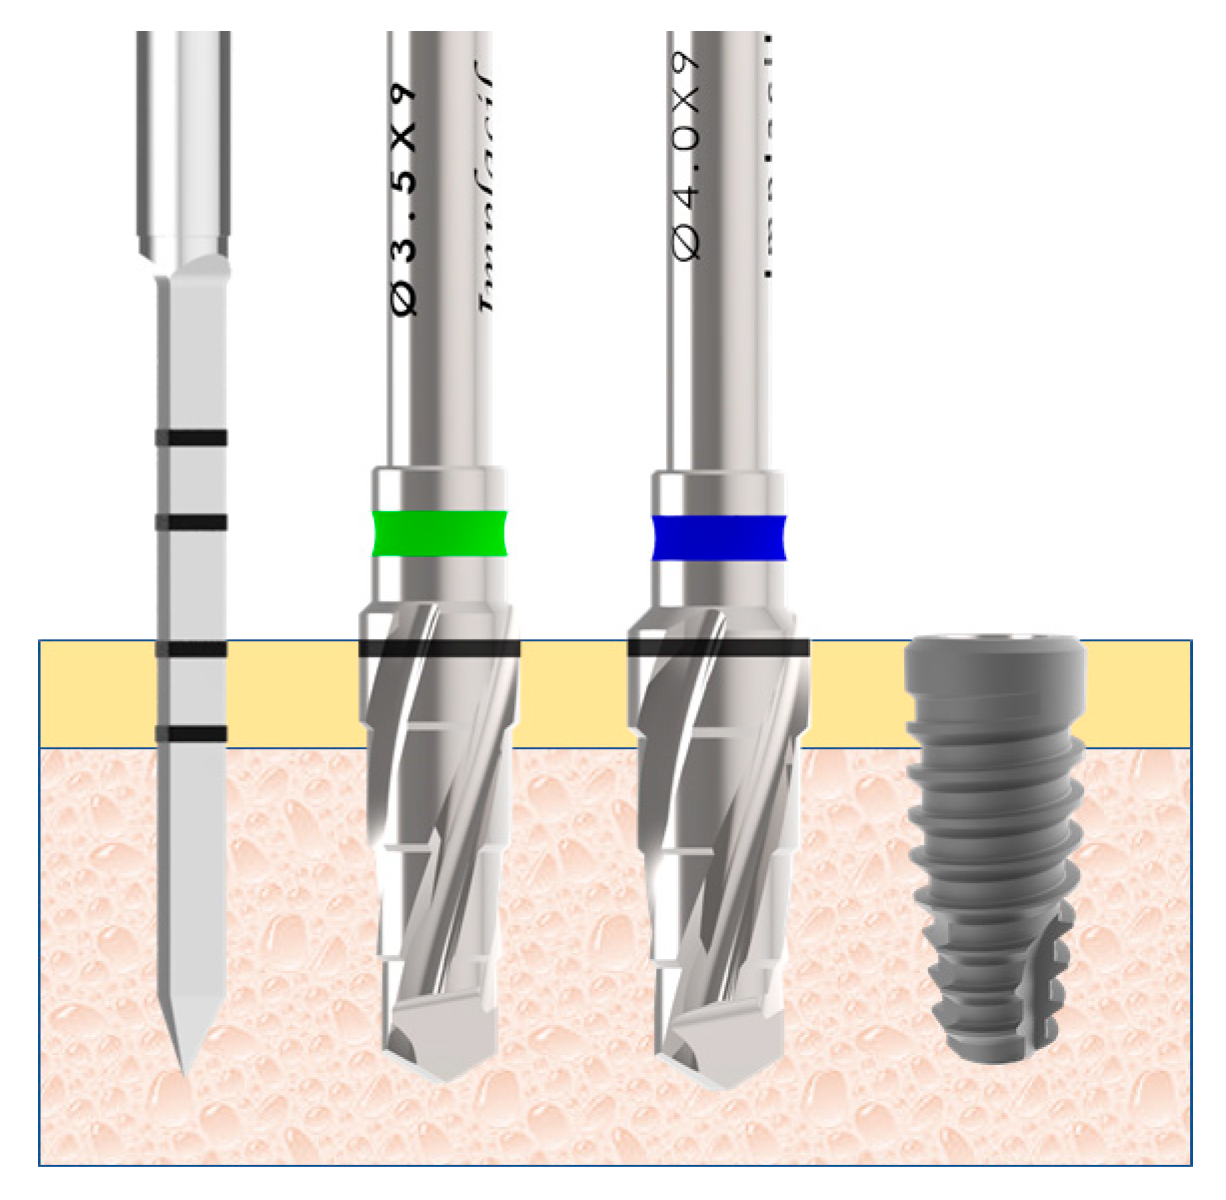
® Bayer S.A., São Paulo, Brazil), with intramuscular application. Both tibias were scraped of hairs and cleansed with antiseptic solutions before the surgical procedures to avoid a contamination. Then, an incision was performed initiating ~10 mm from the knee at distal direction with a length of ~30 mm. The bone tissue was exposed and the osteotomy to install the implant was performed using a predeterminate drilling sequence propria of the implant system (Figure 4), under intense irrigation with saline solution.
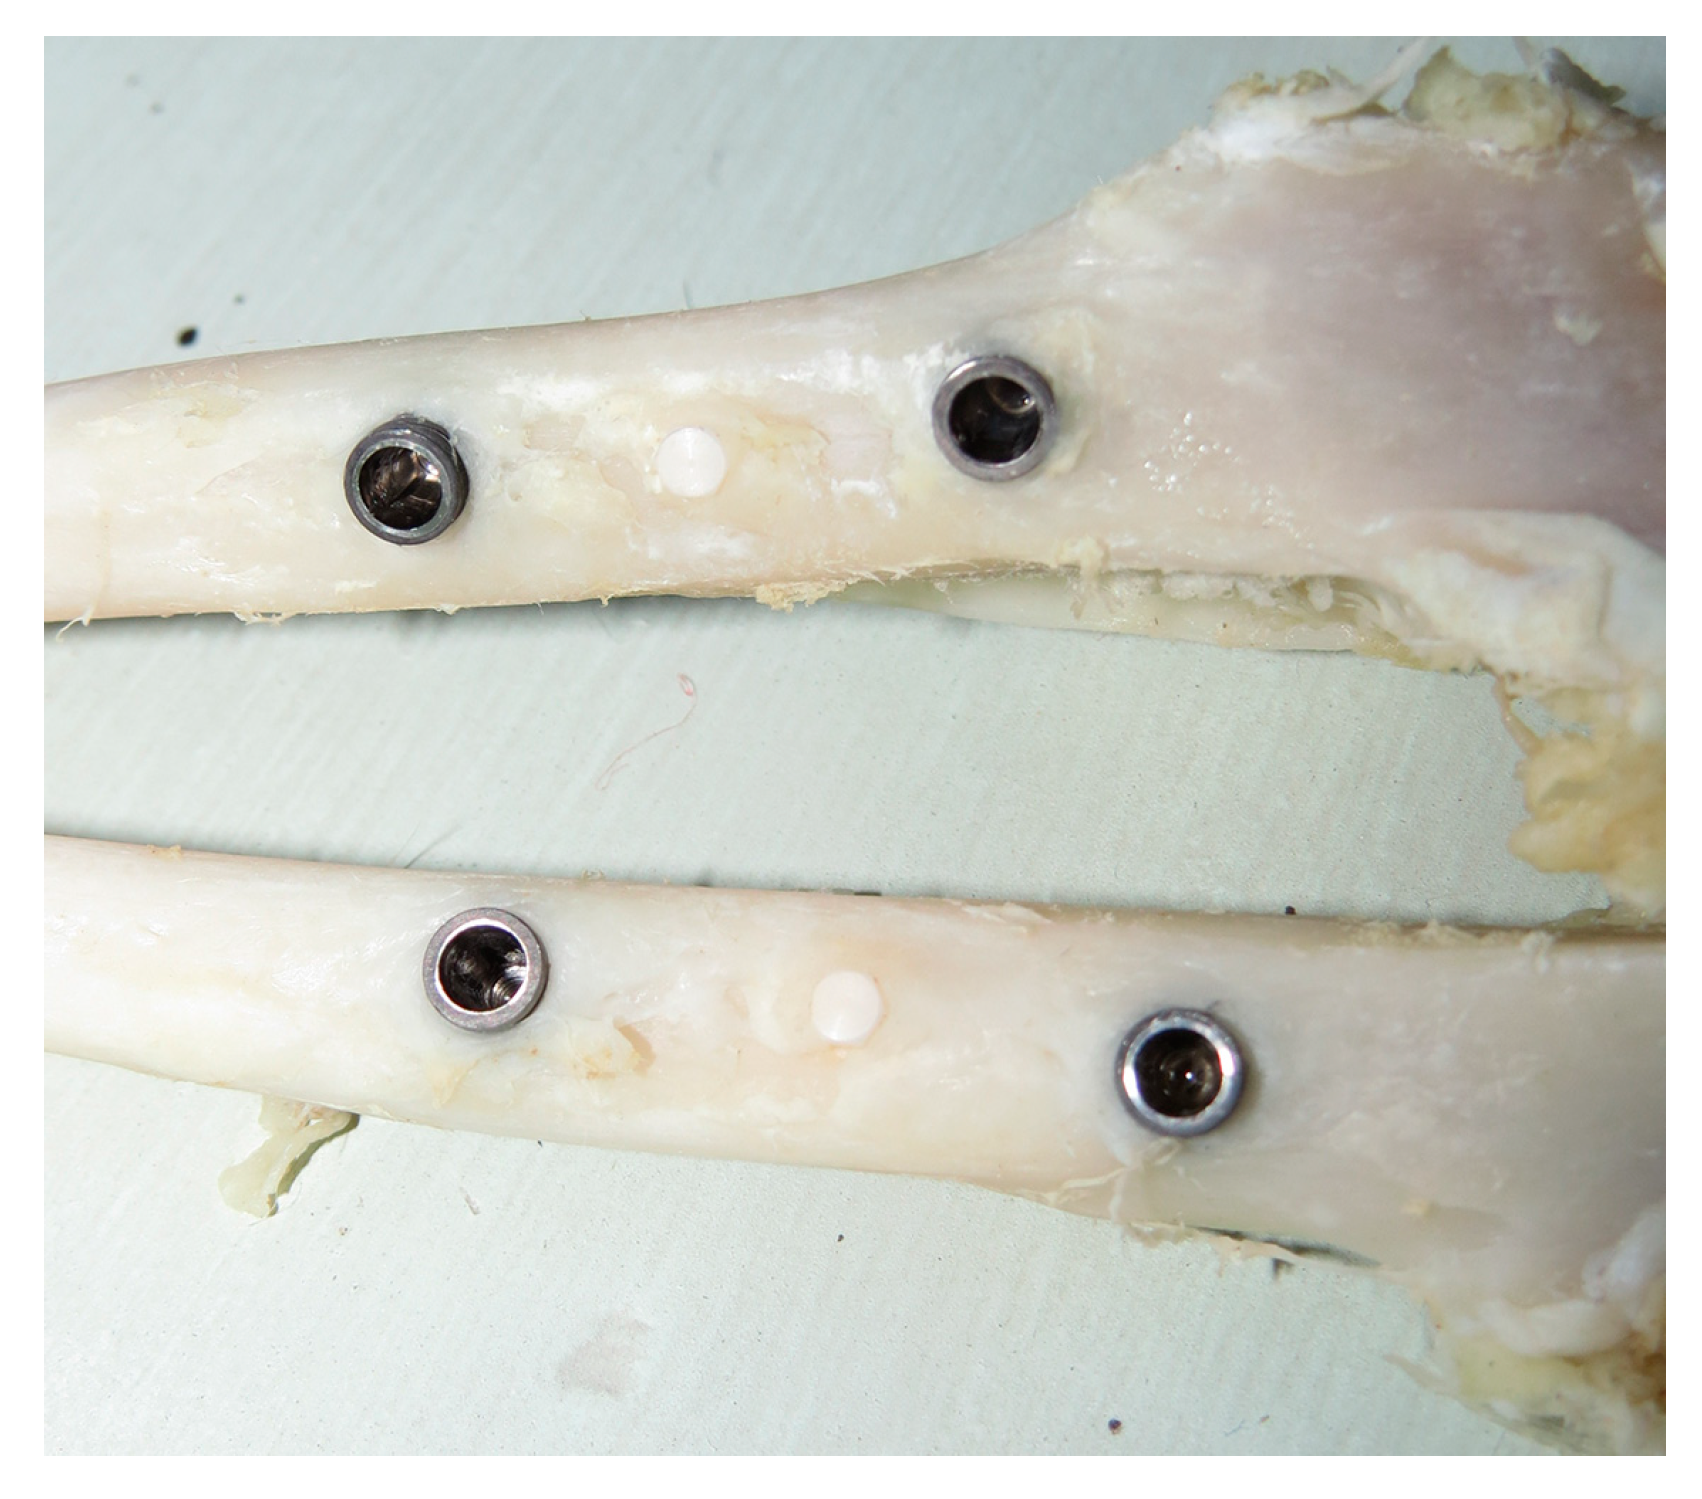
The implant introduction in the bone site was made with manual technique, ending with a torque of ~20 N. Distances of 10 mm between the implants and from the knee articulation were maintained. Finally, a simple point suture was performed using an Ethicon nylon 4-0 (Johnson & Johnson Medical, New Brunswick, NJ, USA). After the surgeries, all medication was administered intramuscularly as follows: A single dose of 0.1 ml/kg of Benzetacil (Bayer, São Paulo, Brazil); three doses (one per day) of 3 mg/kg of ketoprofen (Ketoflex, Mundo Animal, São Paulo, Brazil). Euthanization was performed using an overdose of anesthesia two times after the implantations, at 15 and 30 days. All tibias with the implants (Figure 5) were removed and immediately immersed in a 4% formaldehyde solution.
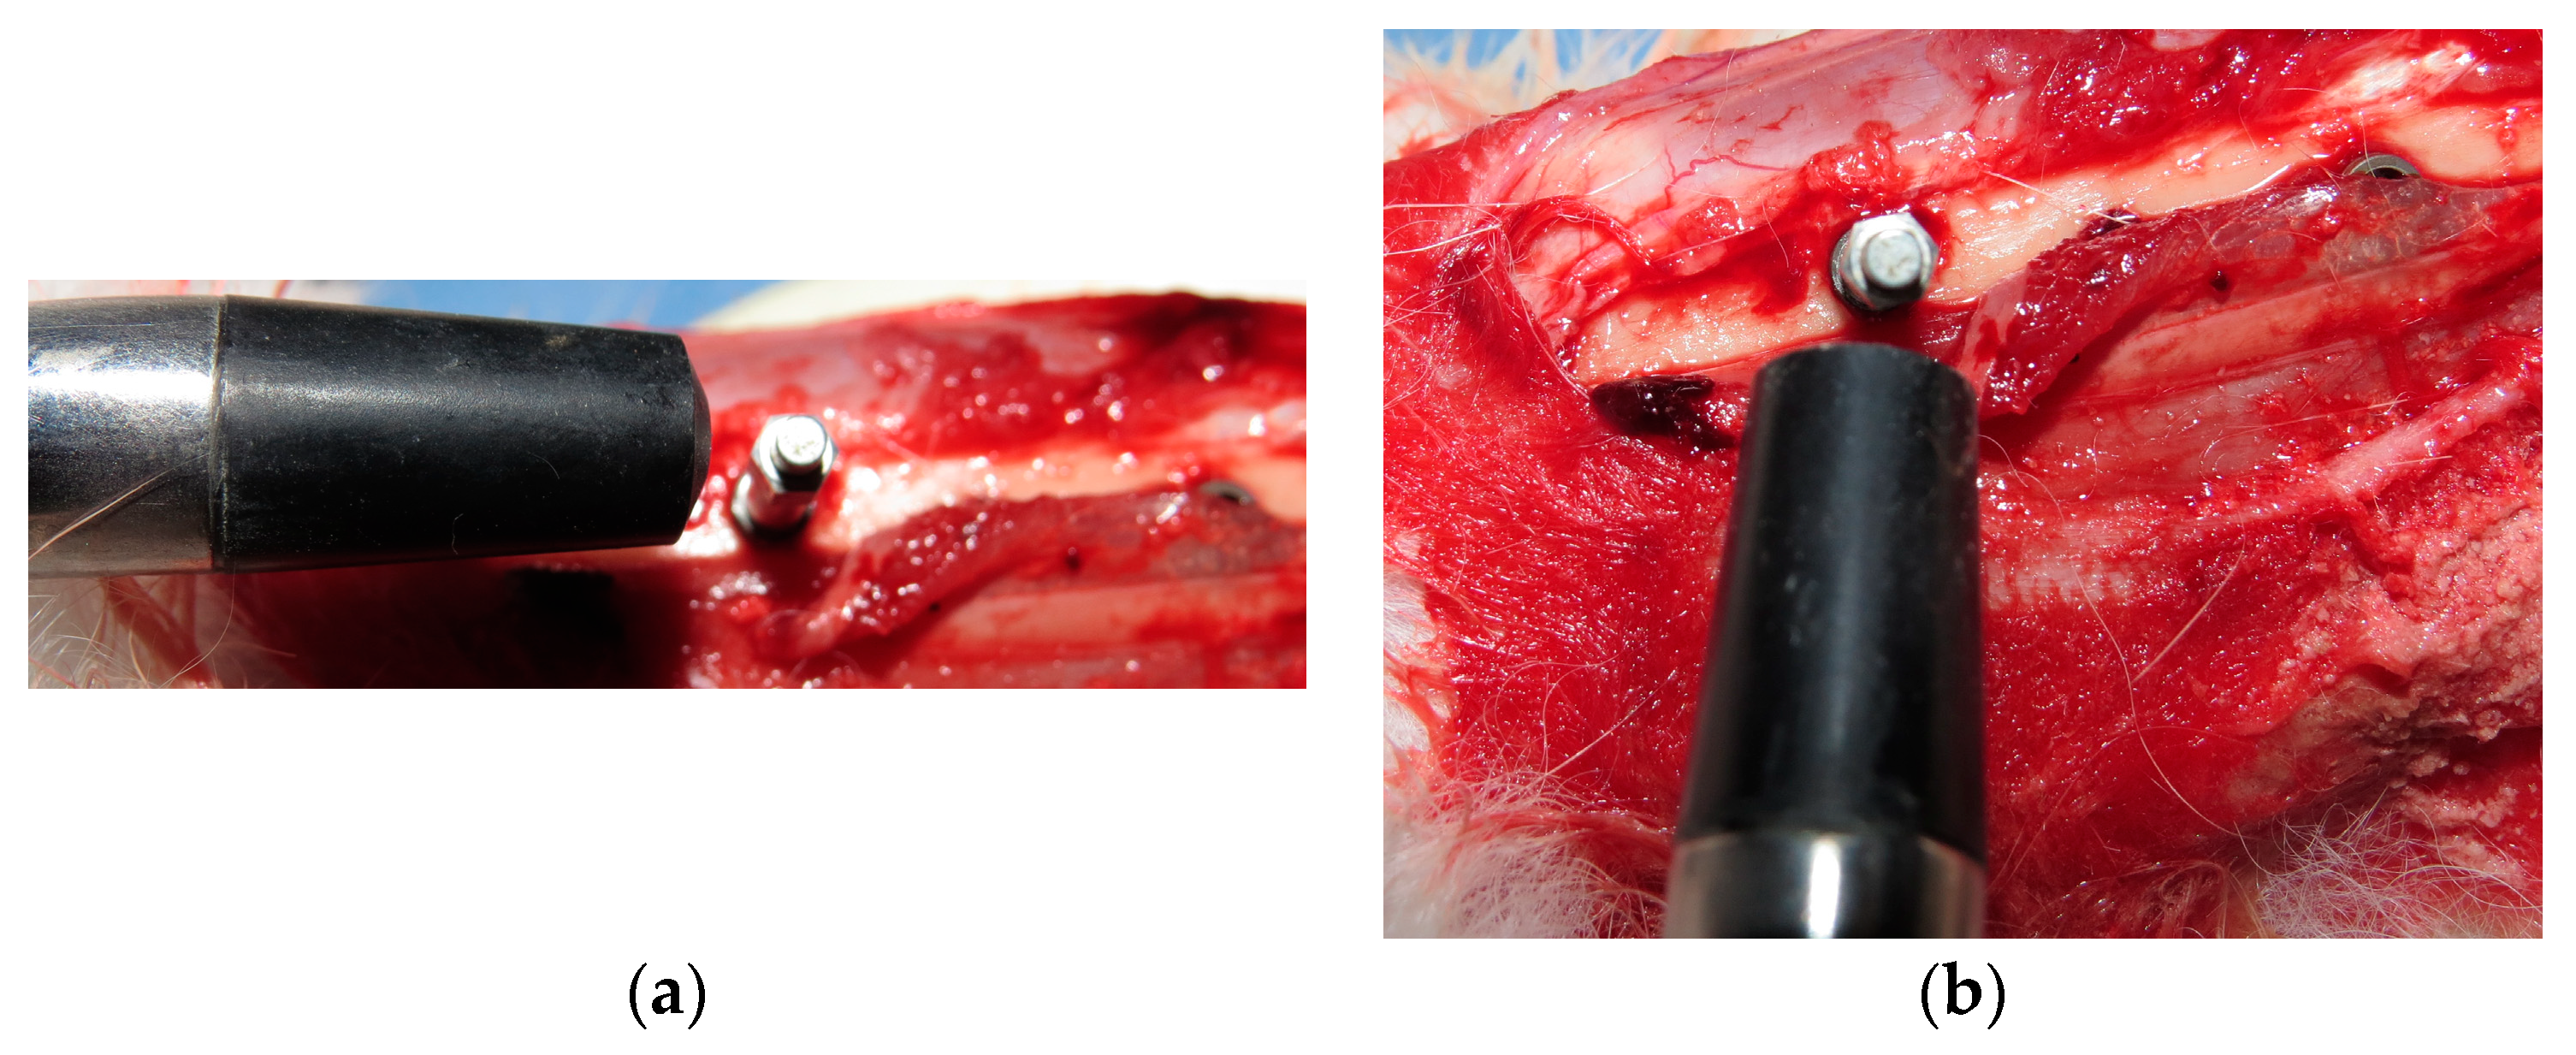
Implant stability measurement: The stability of all implants was measured using the Osstell (Osstell AB, Gothenburg, Sweden) device. A smartpeg sensor was installed in each implant and a controlled torque of 10 Ncm was applied, as recommended by a recent previous study [24]. Measurements were performed in two directions (Figure 6): Proximo-distal and antero-posterior; and, a mean was made for each implant sample. Analysis was conducted three times: Immediately after the implant installation (Time 1), in the first animal lot euthanized after 15 days (Time 2) and, in the second animal lot euthanized after 30 days (Time 3).
Removal torque measurement: Five samples of each group and each time (15 and 30 days) were used to measure the removal torque value (RTv). The analysis was performed in a computed torquimeter machine (Torque BioPDI, São Paulo, Brazil). The blocks (bone and implant) were fixed in the apparatus and the maximum value of removal torque was measured and tabulated. Figure 7 shows the machine during the assay realization.
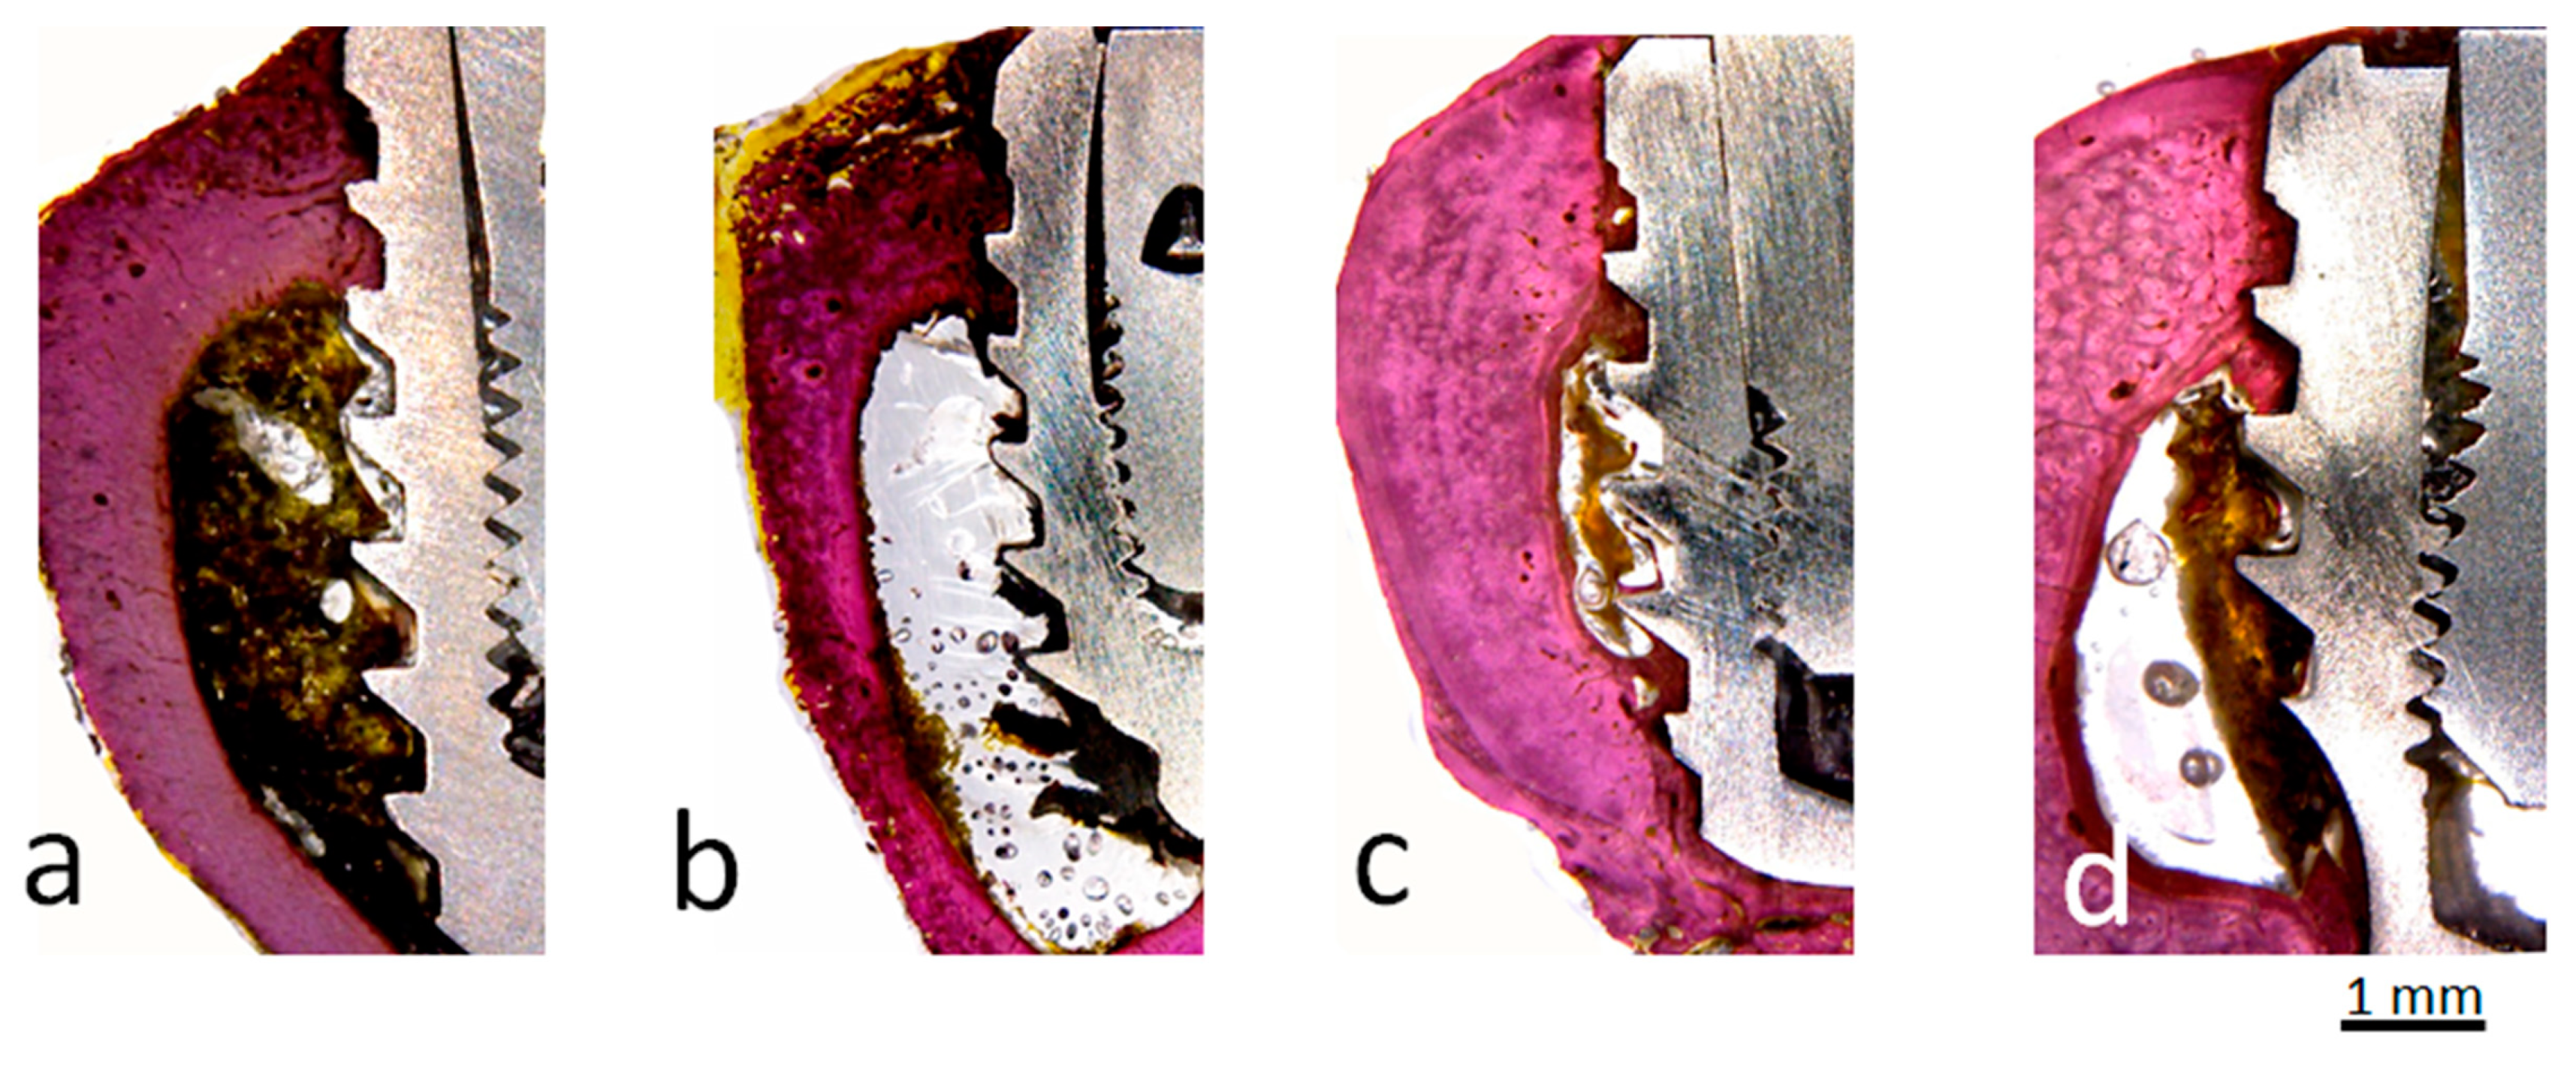
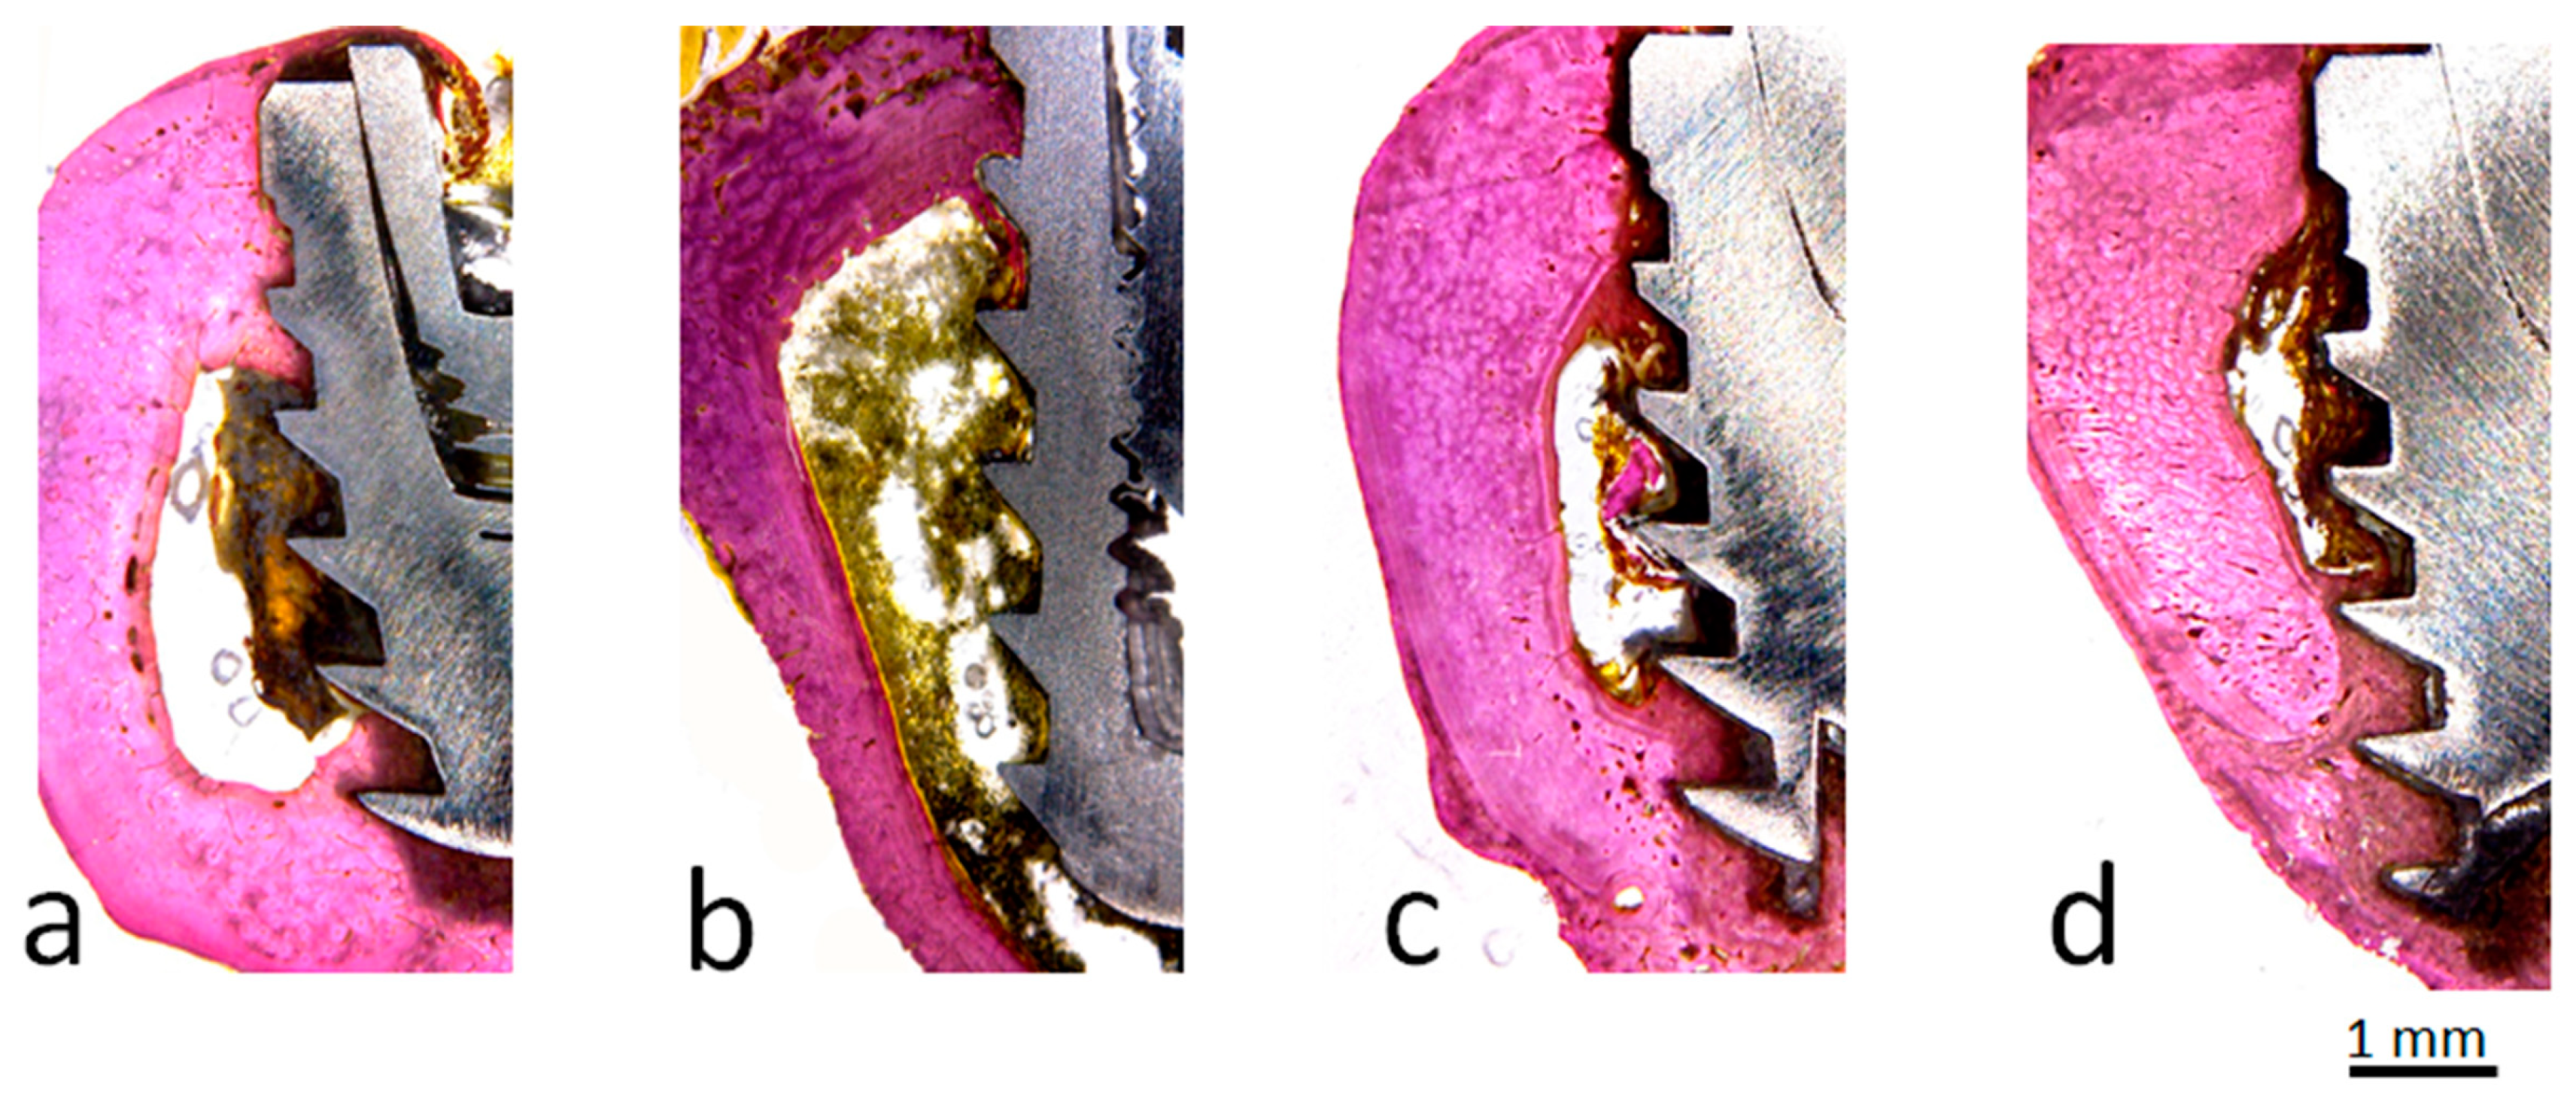
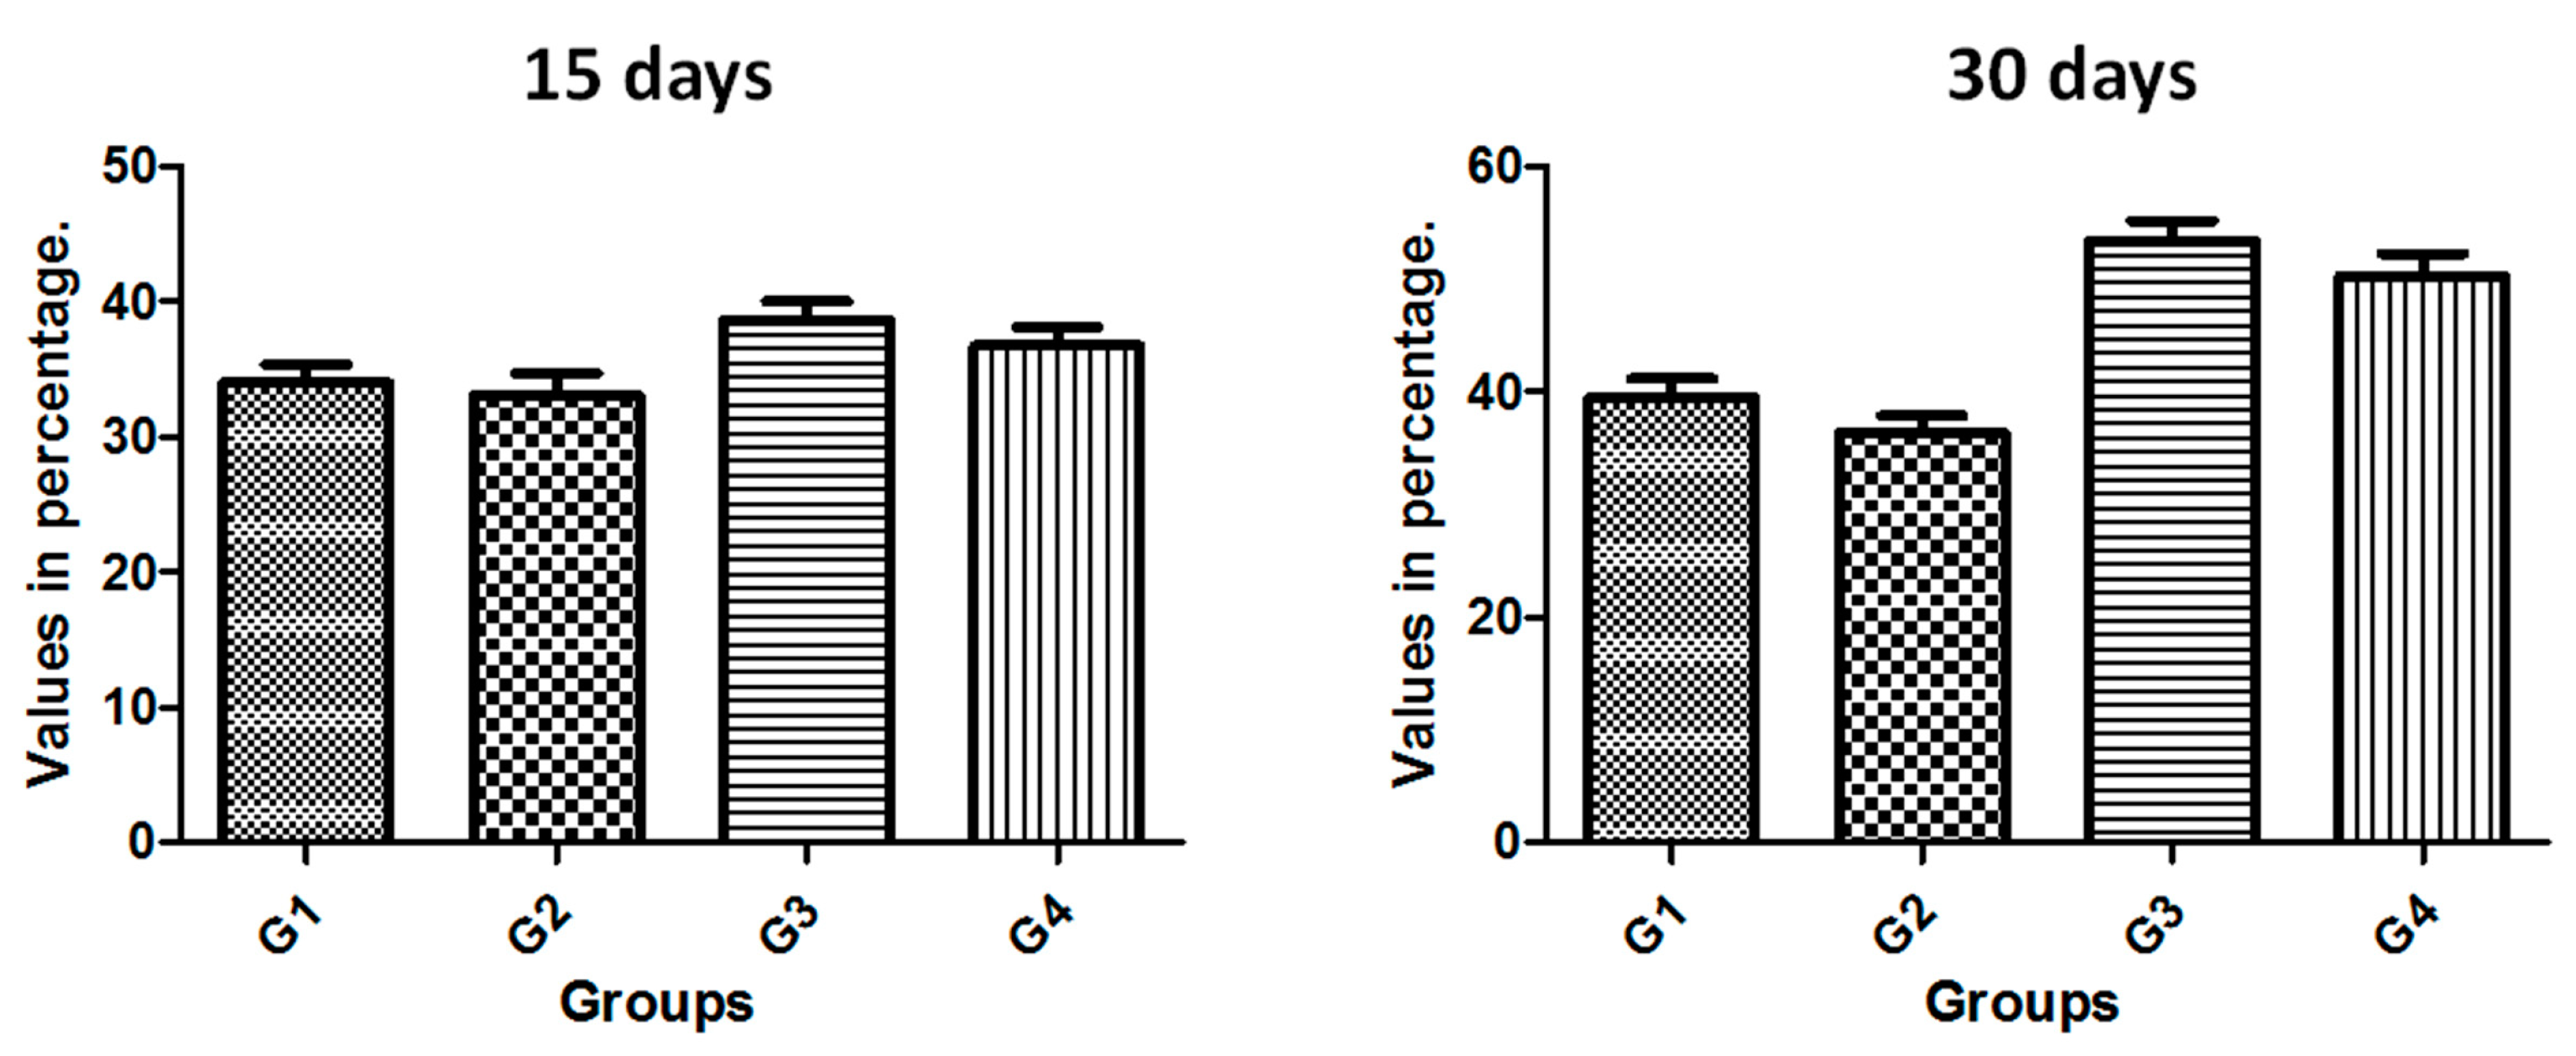
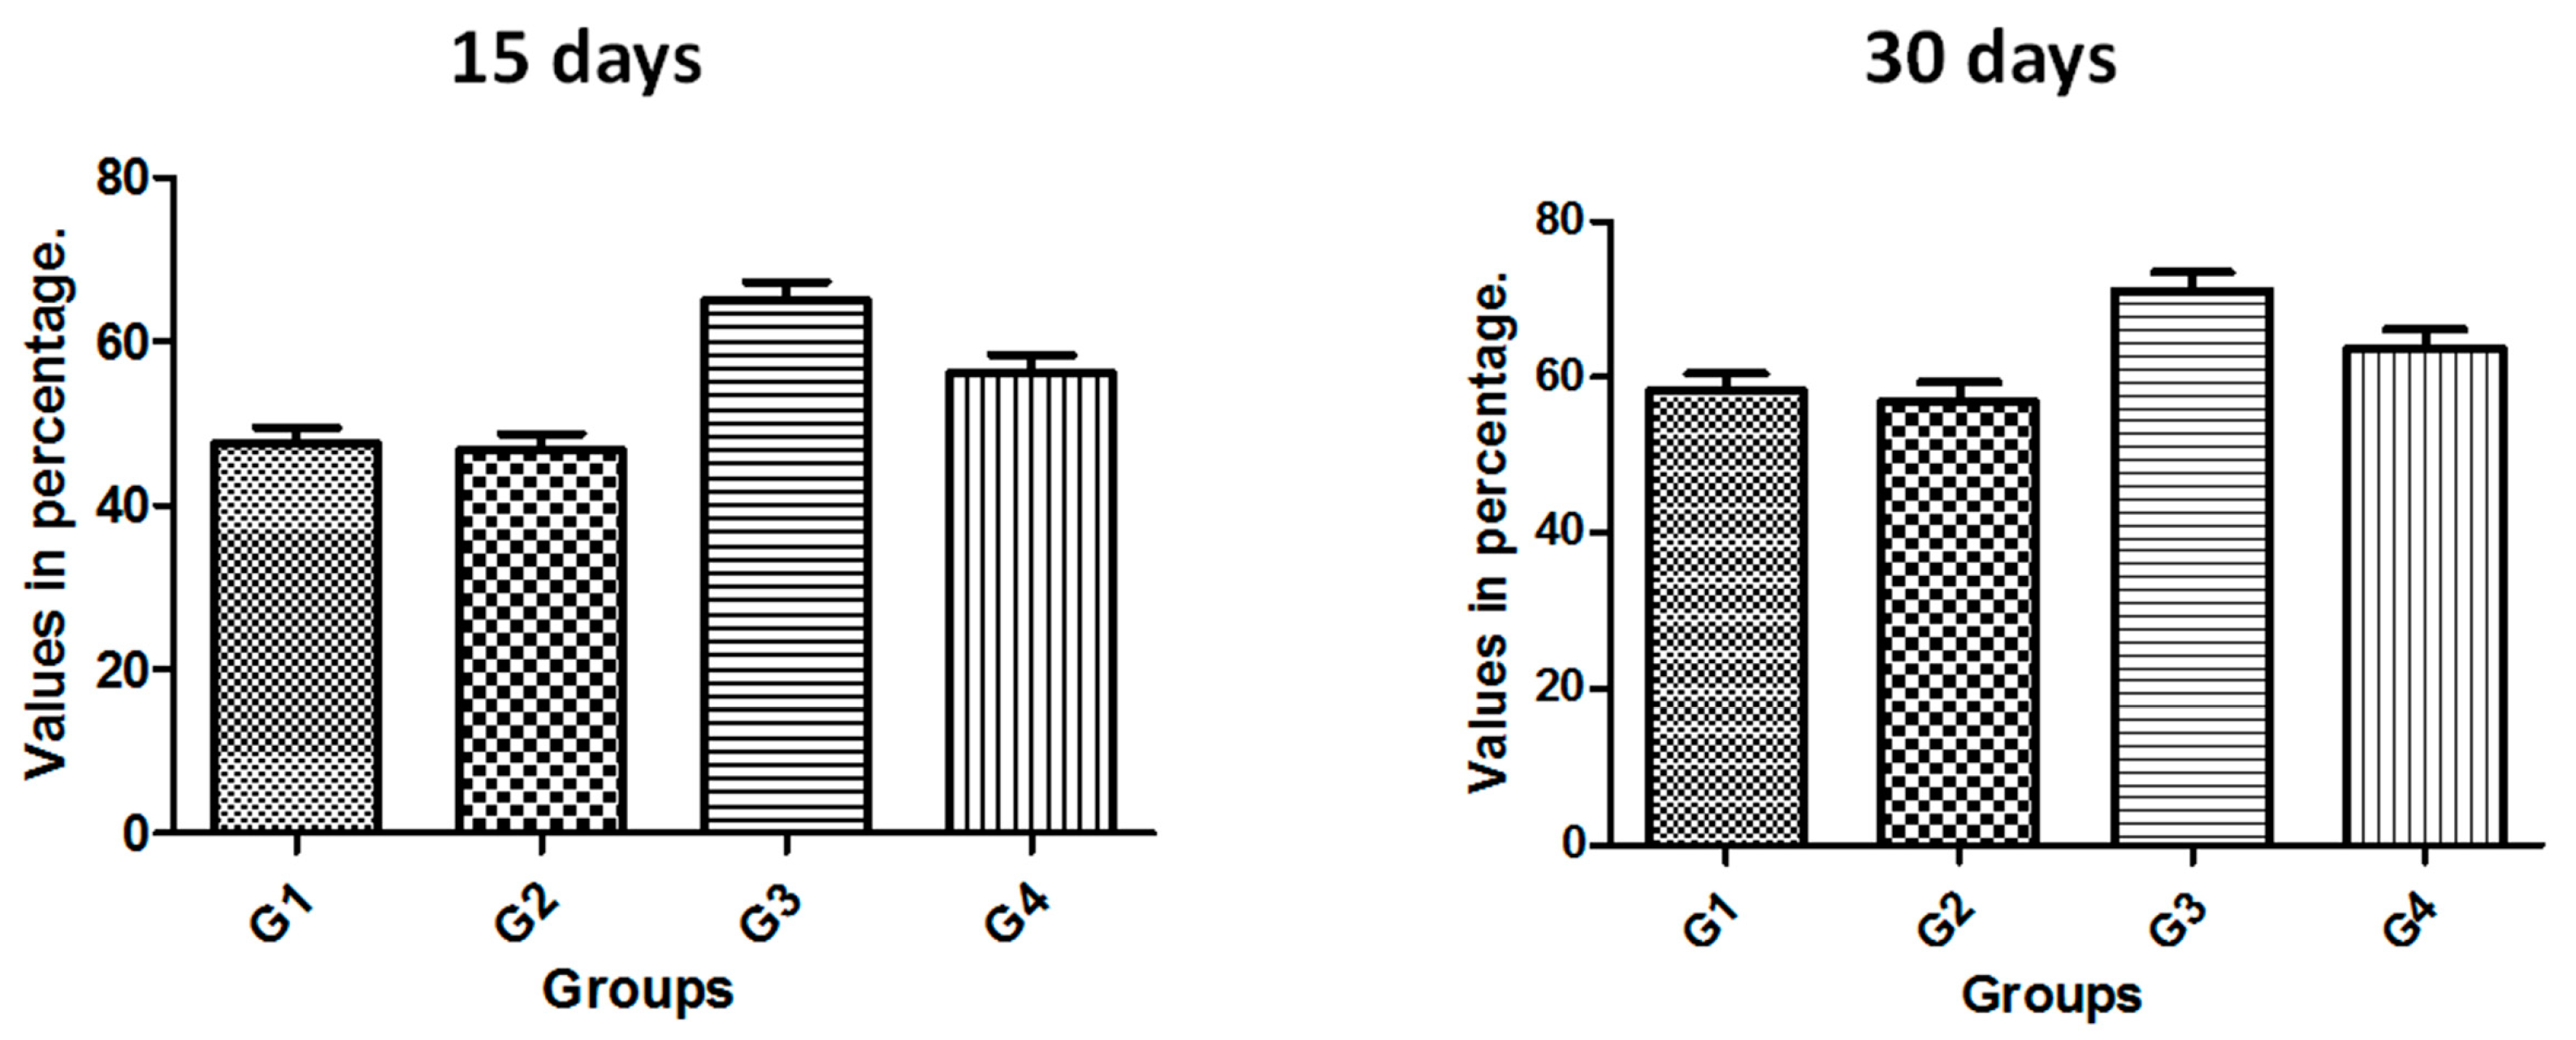
Histomorphometric and histological analysis: Three days after fixation in formaldehyde solution, the samples were washed in running tap water per 12 hours and then gradually dehydrated in a progressive series of ethanol solution (60% to 100%). After the dehydration, the blocks (bone with the implant) were embedded in historesin (Technovit 7200 VLC, Kultzer & Co, Wehrhein, Germany), polymerized, and cut in the central region of the implants using a metallographic cutter machine (Isomet 1000; Buehler, Germany). Then, the samples were polished using a sequence of abrasive paper (180 to 1200 mesh) in a polishing machine (Polipan-U, Panambra Zwick, São Paulo, Brazil). The samples were stained using the picrosirus hematoxylin staining technique. Images using an optical microscopy (Nykon E200, Tokyo, Japan) were obtained around all samples and, the percentage of bone-to-implant contact (BIC%) and bone area fraction occupancy (BAFO%) inside of the threads were measured using the ImageJ program (National Institute of Health, Bethesda, MD, USA). For the BIC% calculation, the total perimeter around the implant was considered 100% and, then, the areas where the bone is in contact with the implant surface were measured. Whereas, for the BAFO% calculation, the total area of threads was measured for the implant model used, and, then, the percentage of this area of threads occupied by the bone.
Statistical analysis: The ANOVA one-way statistical test was used following Bonferoni’s multiple comparison test to determine individual difference among groups. All analyses were performed using GraphPad Prism version 5.01 for Windows (GraphPad Software, San Diego, CA, USA). When p < 0.05, the differences were considered significant.

3. Results

3.1. Clinical Oservations

In both evaluations (15 and 30 days after the implantations), all implants showed a good stability (signal of osseointegration), tested clinically. No clinical evidence of inflammation or infection were detected. Therefore, a total of 80 experimental samples (n = 20 implants per group) were evaluated.

3.2. Implant Stability Measurement

The implant stability was measured in all samples (total of 80 implants) in the three times. Details of values for the groups are depicted in Table 1. In Time 1, the implant stability quotient (ISQ) values measured for all groups do not show statistical difference (p = 0.7668). However, in Times 2 and 3 statistical differences between the groups were detected, which are summarized in Table 2. The line graph of Figure 8 shows the ISQ evolution on the time of each group.

3.3. Removal Torque Measurement

The four groups showed a different mean of RTv values, with statistical difference between them (p < 0.05). The data are summarized in Table 3. Table 4 shows the Bonferroni test and p-values of the comparison between the groups in each time. The bar graph of Figure 9 showed the RTv values to compare the difference between the groups in the two times.
Table 1. Mean and standard deviation (SD) of removal torque values measured for each group in Ncm.

3.4. Histomorphological Analysis and Measurements

After the period determined by the analysis of the bone tissue around the implants (15 and 30 days), all implants samples presented a good stability, without samples signal of loss or not-osseointegration. Therefore, all implants intended for histological analyses were prepared and evaluated. Representative histological section images of the implant behavior of each group and time are presented in Figure 10 and Figure 11.
In general, in the first time of the 15 days, a significant difference in the BIC% was observed between the group G1 X G3 and G2 X G3, with a higher value for the group G3. While in the second time (30 days) there were no statistical differences, only in the comparison between the same implant macrogeometry (G1 X G2 and G3 X G4). The data of measured values are presented in Table 5 and the distribution is shown in the graph attached. The statistical test analysis between groups is presented in Table 6.
The bar graph in Figure 12 shows the BIC% values to compare the difference between the groups in the two time periods.
The mean and standard deviation of BAFO% measured are showed in Table 7. The statistical differences between groups are presented in Table 8 and the bar graph in Figure 13 shows the data to visually compare the groups.

4. Discussion

The search for the development of new micro- and macro-geometries of implants which aim to improve and/or accelerate osseointegration has been a constant research topic in implantology worldwide. However, biological factors involved in the process are poorly considered, such as the intensity of the trauma generated during the surgical maneuvers resulting from each event, especially the steps of drilling and implant installation. It is known that the primary stability of the implants is considered fundamental for osseointegration [25,26,27] and, that there is a high probability of failure in implants (~32%) presenting inadequate initial stability [28]. The achievement of adequate primary stability is directly influenced by bone tissue strength (density), macrogeometry of the implant, and the surgical technique used [26,27,28,29]. Recent studies have shown that decompression of bone tissue by creating healing chambers with the use of an undersized drilling technique may improve the osseointegration process, however, this technique may compromise the implant’s fixation force (stability) on the bone. Then, a new implant macrogeometry was developed where healing chambers were created in the threads, and the purpose of this study was to compare different variables (ISQ, BIC%, BAFO%, and RTv). For this, we compared the conventional implant macrogeometry with the new implant macrogeometry during the initial phase of osseointegration, at 15 and 30 days after the installation in the bone.
The initial hypothesis, that this implant design does not change the values of initial stability, was proven and, the increase of the torque removal, BIC%, and BAFO% values in the tested samples, regardless of whether the surface is treated, showed that this macrogeometry with healing chambers generates a positive influence on the osseointegration process during the early time tested. Other studies have demonstrated the efficacy of healing chambers, however, most of them reported the possibility that there was a decrease in the primary stability of the implants by the technique (undersized drilling) of these spaces (healing chambers) inside the implants’ threads [22,23]. In the measurements obtained in our study there were no statistical differences (p < 0.05) between the two models of implants tested regarding the primary stability values.
The intensity of surgical trauma during implant procedures maneuvers may vary during the drilling or insertion of the implant, as was demonstrated in our previous studies where NF-kB, which is a transcription factor involved in controlling the expression of several genes linked to the inflammatory response, was measured [30]. The excess trauma caused by the inadequate drilling process or the excess compression of the bone tissue during implant installation was reported in some studies [20,31,32]. The bone tissue has its elasticity limitation according to its density, which can dissipate the stress caused by the insertion torque of the implant [
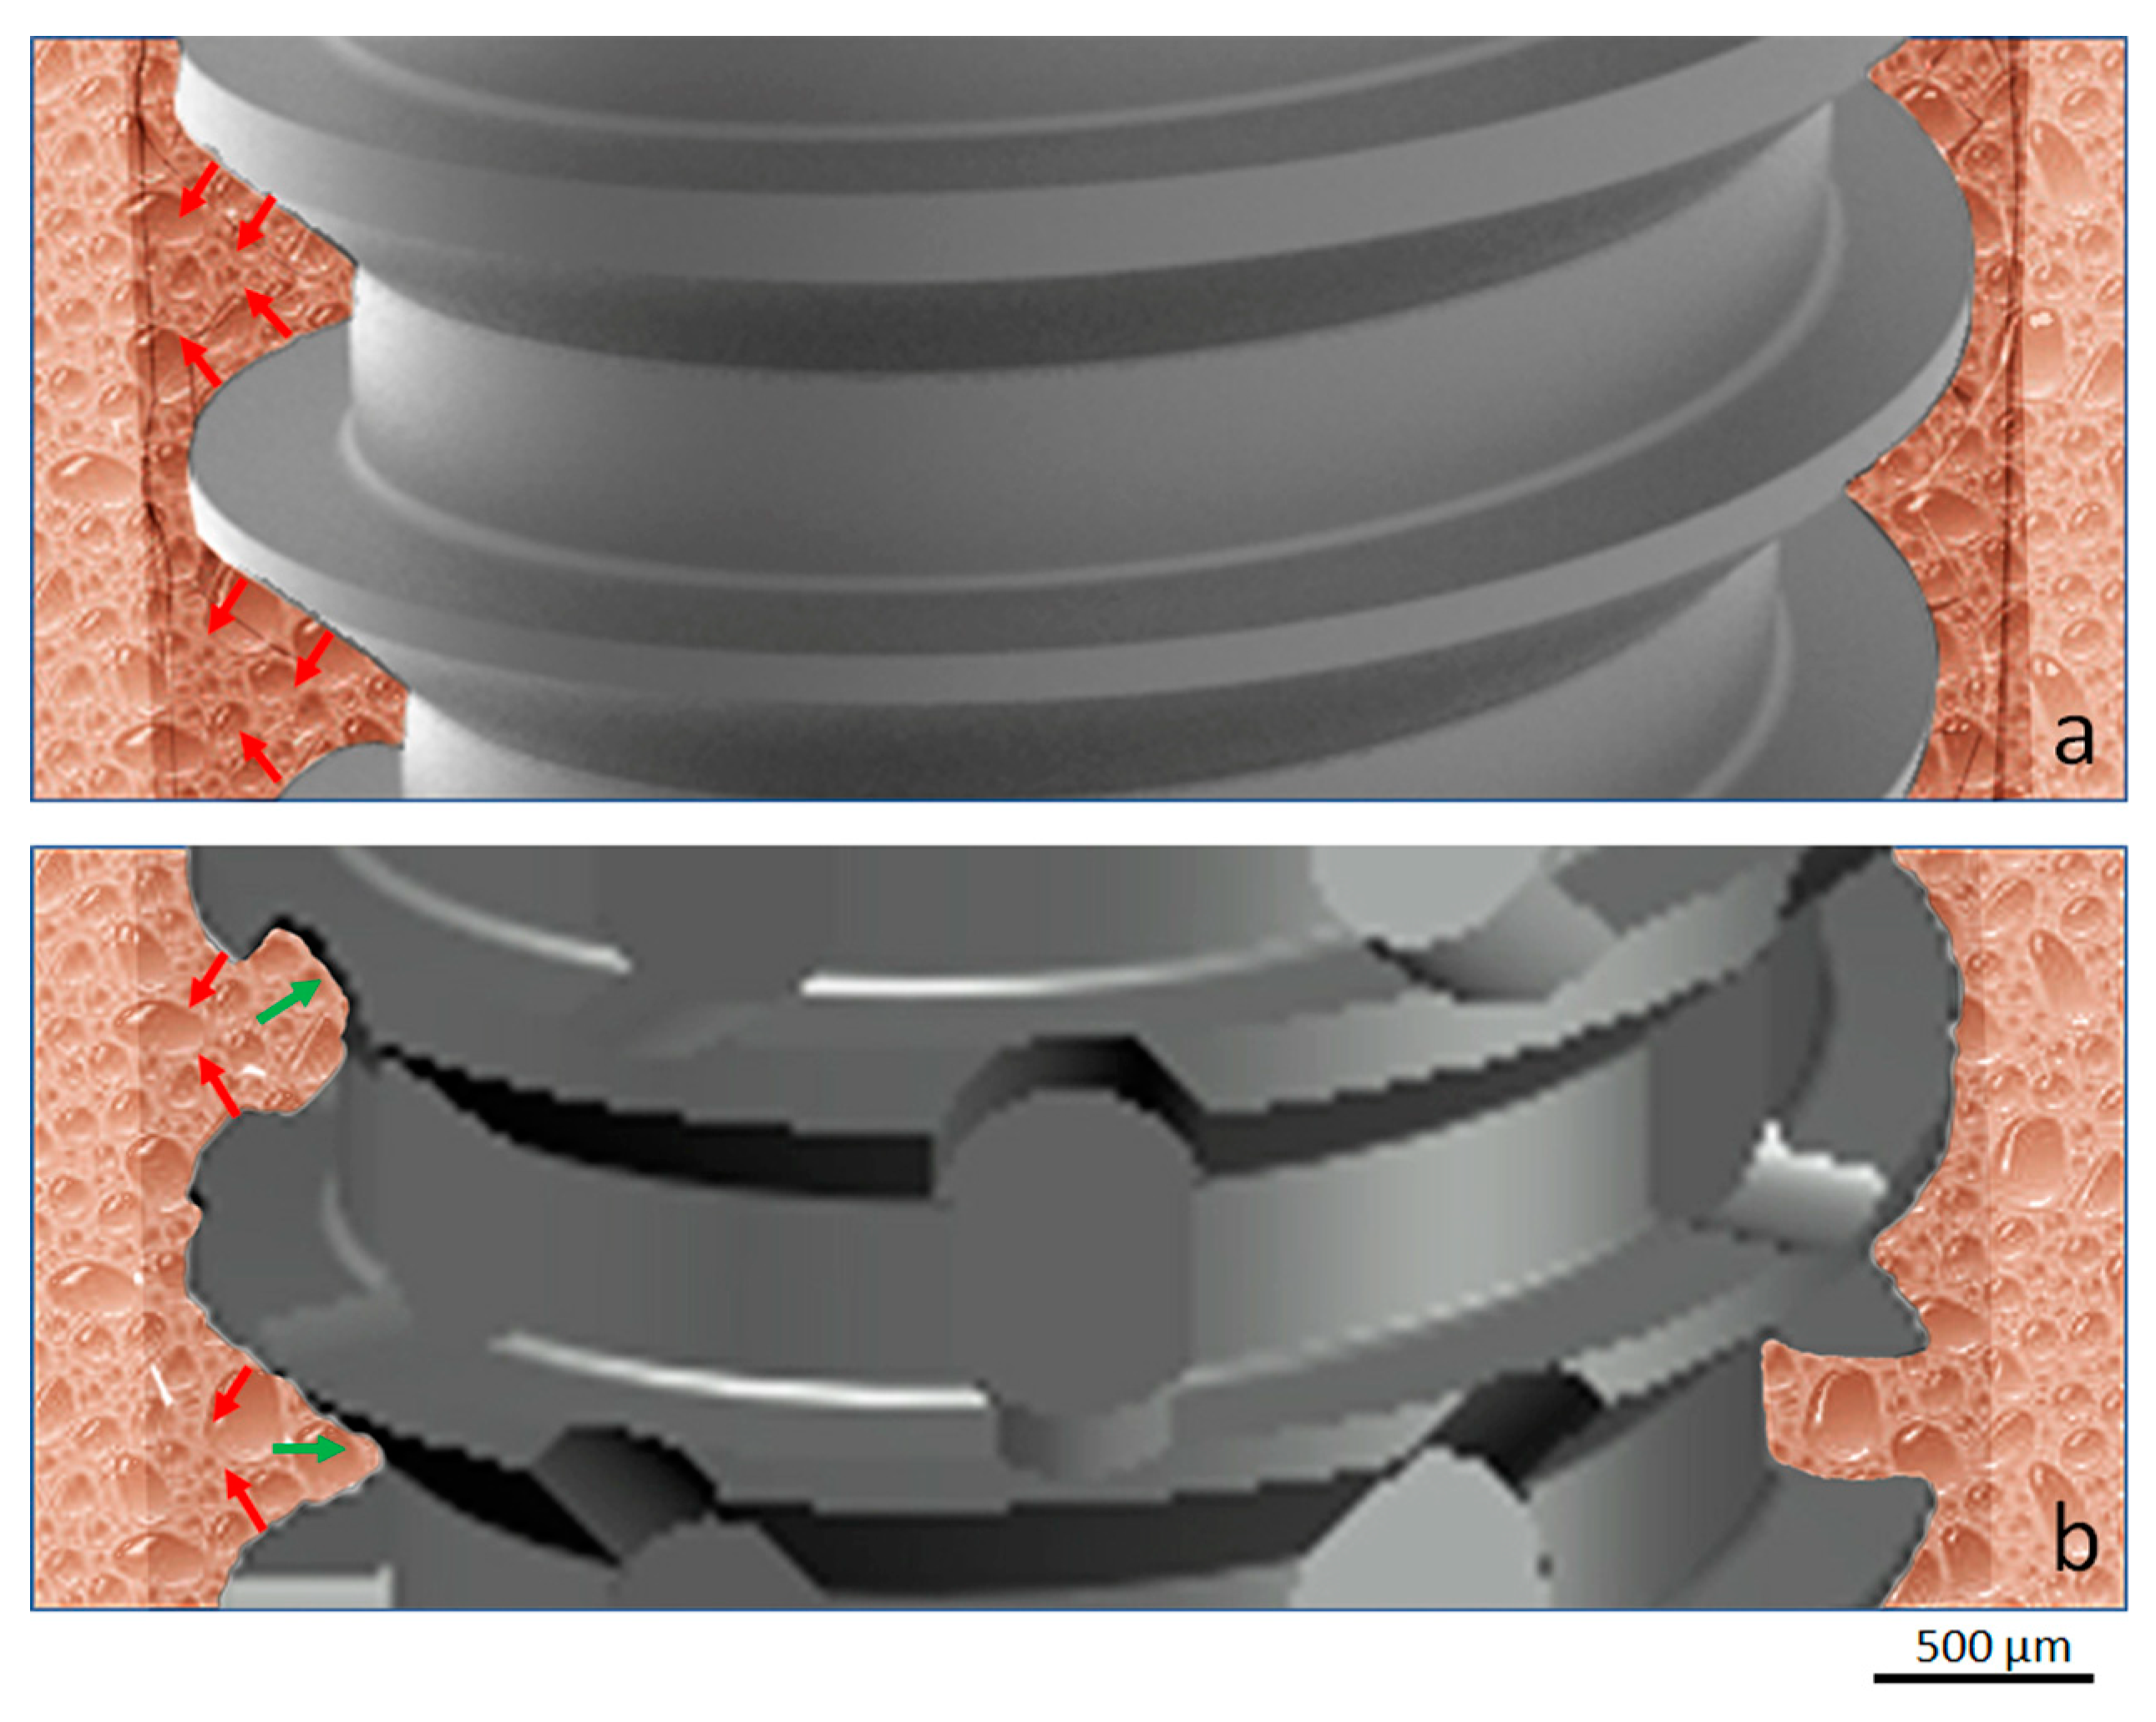
33], which indicates that the bone can withstand a certain amount of compression. Thus, this justifies the possibility of applying a high torque with great initial stability until the implant obtains its biological stability. On the other hand, it was demonstrated that in case the bone tissue is damaged by excessive compression, excessive trauma during osteotomy, the bone may undergo necrosis, causing the implant to lose its stability. In this sense, the new implant design proposed and analyzed in the present study considered the possibility of obtaining an adequate primary stability without generating and/or decreasing the degree of bone compression after its insertion, as shown schematically by the image in Figure 14. In implants with conventional threads, condensation of bone tissue will always occur, whereas in the implant model with healing cameras, these bone particles take place to lodge thereby decreasing compression.
Moreover, certain implant design features allow peri-implant osteocytes to retain a less aged phenotype, despite highly advanced extracellular matrix maturation. Then, the physicochemical properties of the material can stimulate bone formation and remodeling by regulating the expression of RANKL (receptor activator of nuclear factor–κB ligand), RANK, and OPG (osteoprotegerin) from implant-adherent cells. Modulation of certain osteocyte-related molecular signaling mechanisms (e.g., sclerostin blockade) may enhance the biomechanical anchorage of implants [34].
Several studies have proposed that the morphological alterations on the implant surface characteristics can improve and accelerate the processes of healing of the bone tissue [10,11,
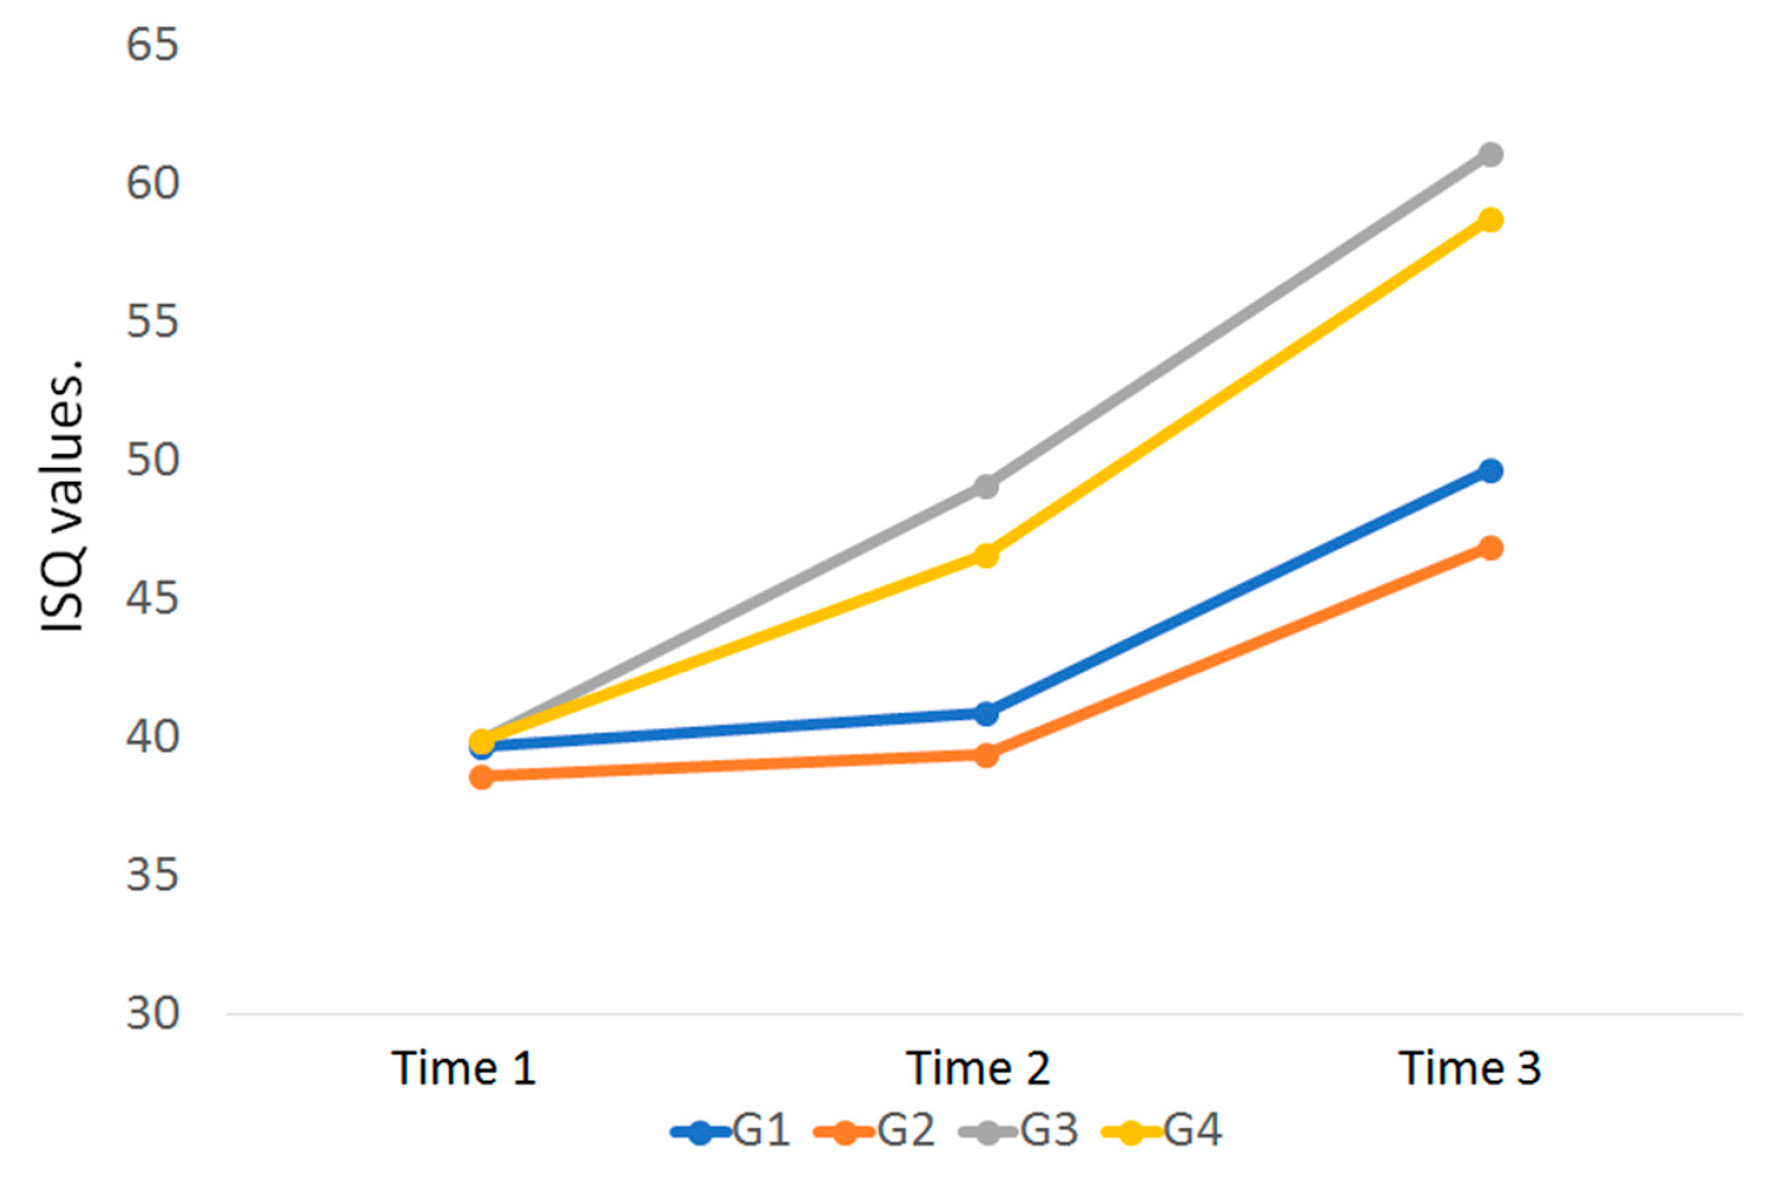
12]. Thus, the present study had the aim to evaluate both implant models (conventional and new implant design) using the same conditions of the surface treatment, with and without treatment, to verify the importance of this factor in the early time period of osseointegration. The results showed that the macrogeometry of the implant had a much higher importance than the surface treatment at the proposed evaluation times (15 and 30 days). Regarding implant stability (ISQ), the G3 and G4 implants had a significant increase in relation to the implants of the G1 and G2 groups, i.e., at 15 days in the general average 19% higher and at 30 days, 25% bigger. In addition, comparing the evolution of ISQ within the same implant model between the 3 measured times, the groups G1 and G2 showed only a time 3 evolution in relation to time 1 (21%), whereas in the G3 and G4 groups the increase was 20% between time 1 and 2, and 25% between time 2 and 3, totaling a 45% increase between time 1 and 3. These data clearly demonstrate the benefit of healing chambers created in the new implant design.
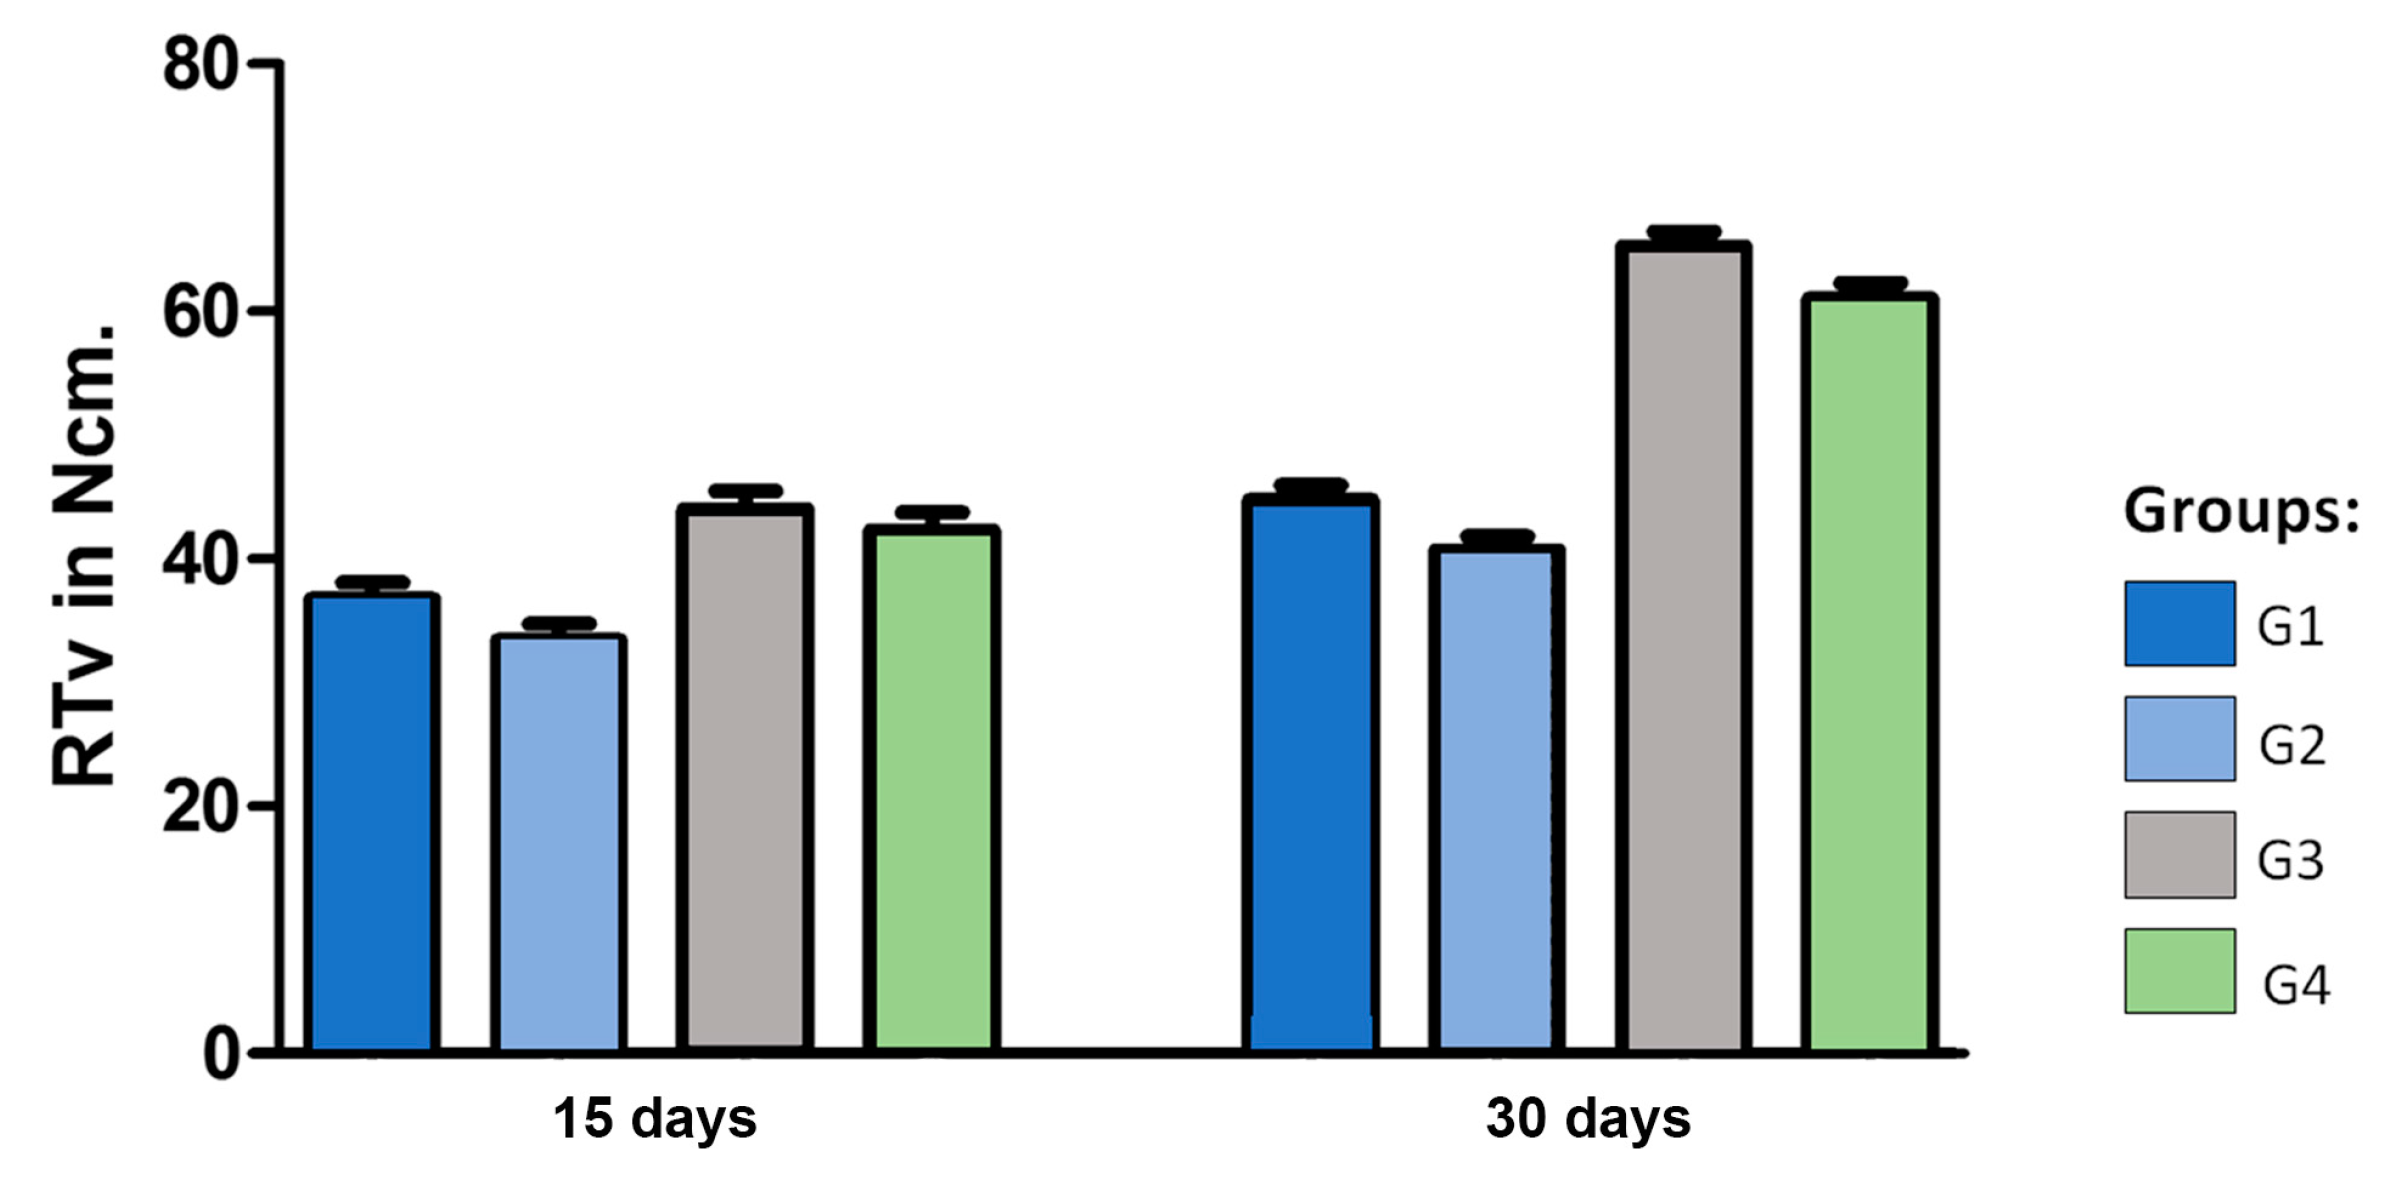
The removal torque measurement is a biomechanical analysis used to analyze the force of the interaction between the implant and bone tissue [35,36], where the higher values to implant removal indicate a good interaction between the bone and implant surface [36], and a signal of good mineralization of the new bone formed. We compared the four groups proposed based on the two time points (15 and 30 days) after implantation, which was highly significant, and it is thus concluded that there is an important effect among the groups (p < 0.05). Thus, as in the comparison made to ISQ values, when comparing the mean values of groups G1 and G2 with the groups G3 and G4, the latter presented a mean value 23% higher after 15 days and 48% higher after 30 days. When comparing the same groups between the times, the groups G1 and G2 had an increase of 21%, while the G3 and G4 groups showed a 47% increase in the removal torque of the implants. Again, the values indicate an acceleration in the process of osseointegration of the implants with the new design. Furthermore, the values compared statistically between the groups (G1 X G2 and G3 X G4) showed no statistically significant differences when evaluated implants were treated and not treated with the same macrogeometry for the time of 15 days and, showed no significant difference after 30 days.
Other studies have shown that implant design can present different osseointegration levels [36,37], depending on its variables presented in the micro- and macrogeometry. Histologically, the values related to the quantity and quality of the bone healing around the implants are evaluated by the percentage of contact of bone to implant (BIC%) and percentage of occupation of the bone area fraction (BAFO%). In the present study, these both analyses showed similar values and evolution on the tested times (15 and 30 days) in all groups. However, the comparison between the groups showed a higher value for the groups with the new implant macrogeometry (G3 and G4 groups) in comparison to the conventional implant macrogeometry (G1 and G2 groups). In the group G3, where the implants presented a new design associated with the surface treatment, the samples showed an important increase in the values of BIC% and BAFO% in the time of 30 days. Still, the healing chamber of group G3 presented a higher amount of BAFO%, indicating that the cellular reaction differed between the implant thread configurations. Other animal studies, where the healing chambers were examined in a longer time period (2 months), showed that healing chambers inserted in the cortical bone did not increase the BIC%, but increased implant biomechanical fixation at early times when compared to the conventional thread design [38]. This data sought in the literature helps to reinforce the initial hypothesis that the new implant design with the healing chambers elaborated in the implant threads more strongly in the initial stages of osseointegration of the implants. However, new in vivo studies are necessary to prove these findings.
Osteocytes are important indicators of bone tissue quality and are also important structural markers of osseointegration. In addition, osteocytes are exceptionally valuable in characterizing bone tissue response to implanted materials [34,39]. Thus, we can cite, one of the limitations of the present study was to evaluate through immunohistochemical assay the amount of osteocytes around the different groups of implants used. This information would be of great importance because in the bone tissue surrounding the implants, osteocytes physically communicate with implant surfaces through the canaliculi and respond to mechanical loading (e.g., bone compression during the implant insertion), leading to changes in osteocyte numbers and morphology [34].

5. Conclusions

Within the limitations of the present study, the results showed that the implants with the macrogeometry modified with healing chambers in the threads produced a significant enhancement in the osseointegration, accelerating this process. The results showed an important increase of the histological parameters (bone-to-implant contact and occupation of the bone area fraction) and the biomechanical parameters (implant stability and torque removal values) for the new implant design.

Author Contributions

Conceptualization, S.A.G., B.A.D. and P.N.D.A.; Data curation, T.L.E.T.; Formal analysis, S.A.G., L.P.-D., B.A.D., P.N.D.A. and J.C.P.F.; Investigation, S.A.G., J.A.J. and T.L.E.T.; Methodology, S.A.G., J.A.J., T.L.E.T. and P.N.D.A.; Project administration, L.P.-D. and B.A.D.; Resources, L.P.-D.; Software, L.P.-D.; Supervision, B.A.D. and J.C.P.F.; Validation, J.A.J.; Visualization, T.L.E.T. and J.C.P.F.; Writing—original draft, S.A.G.; Writing—review & editing, P.N.D.A. and J.C.P.F.

Funding

This research received no external funding.

Acknowledgments

The authors greatly for Implacil De Bortoli Produtos Odontológicos Ltd.a by the material preparation and support.

Conflicts of Interest

The authors declare that they have no conflict of interest.

References

  1. American Association of Oral and Maxillofacial Surgeons. Oral and maxillofacial surgeons: the experts in face, mouth and jaw surgery. Available online: https://myoms.org/procedures/dental-implant-surgery (accessed on 13 July 2019).
  2. Grand View Research, Inc. Dental Implants Market Size, Share & Trends Analysis Report by Product (Titanium Implants, Zirconium Implants), by Region (North America, Europe, Asia Pacific, Latin America, MEA), And Segment Forecasts, 2018–2024. Available online: https://www.grandviewresearch.com/industry-analysis/dental-implants-market (accessed on 13 July 2019).
  3. McGlumphy, E.A.; Hashemzadeh, S.; Yilmaz, B.; Purcell, B.A.; Leach, D.; Larsen, P.E. Treatment of Edentulous Mandible with Metal-Resin Fixed Complete Dentures: A 15- to 20-Year Retrospective Study. Clin. Oral Implants Res. 2019, 27. [Google Scholar] [CrossRef] [PubMed]
  4. Donati, M.; Ekestubbe, A.; Lindhe, J.; Wennström, J.L. Marginal bone loss at implants with different surface characteristics - A 20-year follow-up of a randomized controlled clinical trial. Clin. Oral Implants Res. 2018, 29, 480–487. [Google Scholar] [CrossRef] [PubMed]
  5. Howe, M.S.; Keys, W.; Richards, D. Long-term (10-year) dental implant survival: A systematic review and sensitivity meta-analysis. J Dent. 2019, 84, 9–21. [Google Scholar] [CrossRef] [PubMed]
  6. Lukaszewska-Kuska, M.; Wirstlein, P.; Majchrowski, R.; Dorocka-Bobkowska, B. Osteoblastic cell behaviour on modified titanium surfaces. Micron 2018, 105, 55–63. [Google Scholar] [CrossRef] [PubMed]
  7. Pellegrini, G.; Francetti, L.; Barbaro, B.; Del Fabbro, M. Novel surfaces and osseointegration in implant dentistry. J. Investig. Clin. Dent. 2018, 9, e12349. [Google Scholar] [CrossRef] [PubMed]
  8. Bernardi, S.; Bianchi, S.; Botticelli, G.; Rastelli, E.; Tomei, A.R.; Palmerini, M.G.; Continenza, M.A.; Macchiarelli, G. Scanning electron microscopy and microbiological approaches for the evaluation of salivary microorganisms behaviour on anatase titanium surfaces: In vitro study. Morphologie 2018, 102, 1–6. [Google Scholar] [CrossRef] [PubMed]
  9. Ganbold, B.; Kim, S.K.; Heo, S.J.; Koak, J.Y.; Lee, Z.H.; Cho, J. Osteoclastogenesis Behavior of Zirconia for Dental Implant. Materials 2019, 12, 732. [Google Scholar] [CrossRef]
  10. Gehrke, S.A.; Dedavid, B.A.; Aramburú, J.S., Jr.; Pérez-Díaz, L.; Calvo Guirado, J.L.; Canales, P.M.; De Aza, P.N. Effect of Different Morphology of Titanium Surface on the Bone Healing in Defects Filled Only with Blood Clot: A New Animal Study Design. Biomed. Res. Int. 2018. [Google Scholar] [CrossRef]
  11. Gehrke, S.A.; Maté Sánchez de Val, J.E.; Fernández Domínguez, M.; de Aza Moya, P.N.; Gómez Moreno, G.; Calvo Guirado, J.L. Effects on the osseointegration of titanium implants incorporating calcium-magnesium: a resonance frequency and histomorphometric analysis in rabbit tibia. Clin. Oral Implants Res. 2018, 29, 785–791. [Google Scholar] [CrossRef]
  12. de Lima Cavalcanti, J.H.; Matos, P.C.; Depes de Gouvêa, C.V.; Carvalho, W.; Calvo-Guirado, J.L.; Aragoneses, J.M.; Pérez-Díaz, L.; Gehrke, S.A. In Vitro Assessment of the Functional Dynamics of Titanium with Surface Coating of Hydroxyapatite Nanoparticles. Materials 2019, 12, 840. [Google Scholar] [CrossRef]
  13. Matys, J.; Świder, K.; Flieger, R.; Dominiak, M. Assessment of the primary stability of root analog zirconia implants designed using cone beam computed tomography software by means of the Periotest® device: An ex vivo study. A preliminary report. Adv. Clin. Exp. Med. 2017, 26, 803–809. [Google Scholar] [CrossRef] [PubMed]
  14. Kang, H.G.; Jeong, Y.S.; Huh, Y.H.; Park, C.J.; Cho, L.R. Impact of Surface Chemistry Modifications on Speed and Strength of Osseointegration. Int. J. Oral Maxillofac. Implants 2018, 33, 780–787. [Google Scholar] [CrossRef] [PubMed]
  15. Smeets, R.; Stadlinger, B.; Schwarz, F.; Beck-Broichsitter, B.; Jung, O.; Precht, C.; Kloss, F.; Gröbe, A.; Heiland, M.; Ebker, T. Impact of Dental Implant Surface Modifications on Osseointegration. Biomed. Res. Int. 2016, 2016, 6285620. [Google Scholar] [CrossRef] [PubMed]
  16. Ogle, O.E. Implant surface material, design, and osseointegration. Dent. Clin. North Am. 2015, 59, 505–520. [Google Scholar] [CrossRef] [PubMed]
  17. Tabassum, A.; Meijer, G.J.; Wolke, J.G.; Jansen, J.A. Influence of the surgical technique and surface roughness on the primary stability of an implant in artificial bone with a density equivalent to maxillary bone: A laboratory study. Clin. Oral Implants Res. 2009, 20, 327–332. [Google Scholar] [CrossRef] [PubMed]
  18. Marin, C.; Bonfante, E.; Granato, R.; Neiva, R.; Gil, L.F.; Marão, H.F.; Suzuki, M.; Coelho, P.G. The Effect of Osteotomy Dimension on Implant Insertion Torque, Healing Mode, and Osseointegration Indicators: A Study in Dogs. Implant Dent. 2016, 25, 739–743. [Google Scholar] [CrossRef] [PubMed]
  19. Cha, J.Y.; Pereira, M.D.; Smith, A.A.; Houschyar, K.S.; Yin, X.; Mouraret, S.; Brunski, J.B.; Helms, J.A. Multiscale Analyses of the Bone-implant Interface. J. Dent. Res. 2015, 94, 482–490. [Google Scholar] [CrossRef] [Green Version]
  20. Bashutski, J.D.; D’Silva, N.J.; Wang, H.L. Implant compression necrosis: current understanding and case report. J. Periodontol. 2009, 80, 700–704. [Google Scholar] [CrossRef]
  21. Tabassum, A.; Meijer, G.J.; Walboomers, X.F.; Jansen, J.A. Evaluation of primary and secondary stability of titanium implants using different surgical techniques. Clin. Oral Implants Res. 2014, 25, 487–492. [Google Scholar] [CrossRef]
  22. Campos, F.E.; Gomes, J.B.; Marin, C.; Teixeira, H.S.; Suzuki, M.; Witek, L.; Zanetta-Barbosa, D.; Coelho, P.G. Effect of drilling dimension on implant placement torque and early osseointegration stages: An experimental study in dogs. J. Oral Maxillofac. Surg. 2012, 70, e43–e50. [Google Scholar] [CrossRef]
  23. Jimbo, R.; Tovar, N.; Anchieta, R.B.; Machado, L.S.; Marin, C.; Teixeira, H.S.; Coelho, P.G. The combined effects of undersized drilling and implant macrogeometry on bone healing around dental implants: An experimental study. Int. J. Oral Maxillofac. Surg. 2014, 43, 1269–1275. [Google Scholar] [CrossRef] [PubMed]
  24. Salatti, D.B.; Pelegrine, A.A.; Gehrke, S.; Teixeira, M.L.; Moshaverinia, A.; Moy, P.K. Is there a need for standardization of tightening force used to connect the transducer for resonance frequency analysis in determining implant stability? Int. J. Oral Maxillofac. Implants 2019, 34, 886–890. [Google Scholar] [CrossRef] [PubMed]
  25. Dos Santos, M.V.; Elias, C.N.; Cavalcanti Lima, J.H. The effects of superficial roughness and design on the primary stability of dental implants. Clin. Implant Dent. Relat Res. 2011, 13, 215–223. [Google Scholar] [CrossRef] [PubMed]
  26. Javed, F.; Ahmed, H.B.; Crespi, R.; Romanos, G.E. Role of primary stability for successful osseointegration of dental implants: Factors of influence and evaluation. Interv. Med. Appl. Sci. 2013, 5, 162–167. [Google Scholar] [CrossRef] [PubMed]
  27. Orsini, E.; Giavaresi, G.; Trirè, A.; Ottani, V.; Salgarello, S. Dental implant thread pitch and its influence on the osseointegration process: an in vivo comparison study. Int. J. Oral Maxillofac. Implants 2012, 27, 383–392. [Google Scholar] [PubMed]
  28. Misch, C.E. Implant design considerations for the posterior regions of the mouth. Implant Dent. 1999, 8, 376–386. [Google Scholar] [CrossRef] [PubMed]
  29. Anil, S.; Aldosari, A.A. Impact of bone quality and implant type on the primary stability: an experimental study using bovine bone. J. Oral Implantol. 2015, 41, 144–148. [Google Scholar] [CrossRef] [PubMed]
  30. Salles, M.B.; Allegrini, S.; Yoshimoto, M.; Pérez-Díaz, L.; Calvo-Guirado, J.L.; Gehrke, S.A. Analysis of Trauma Intensity during Surgical Bone Procedures Using NF-κB Expression Levels as a Stress Sensor: An Experimental Study in a Wistar Rat Model. Materials 2018, 12, 2532. [Google Scholar] [CrossRef]
  31. de Souza Carvalho, A.C.G.; Queiroz, T.P.; Okamoto, R.; Margonar, R.; Garcia, I.R.; Filho, O.M. Evaluation of bone heating, immediate bone cell viability, and wear of high-resistance drills after the creation of implant osteotomies in rabbit tibias. Int J. Oral Maxillofac Implants 2011, 26, 1193–1201. [Google Scholar]
  32. Chuang, S.K.; Wei, L.J.; Douglass, C.W.; Dodson, T.B. Risk factors for dental implant failure: A strategy for the analysis of clustered failure-time observations. J. Dent. Res. 2002, 81, 572–577. [Google Scholar] [CrossRef]
  33. Halldin, A.; Jimbo, R.; Johansson, C.B.; Wennerberg, A.; Jacobsson, M.; Albrektsson, T.; Hansson, S. Implant stability and bone remodeling after 3 and 13 days of implantation with an initial static strain. Clin. Implant Dent. Relat. Res. 2014, 16, 383–393. [Google Scholar] [CrossRef]
  34. Shah, F.A.; Thomsen, P.; Palmquist, A. A Review of the Impact of Implant Biomaterials on Osteocytes. J. Dent. Res. 2018, 97, 977–986. [Google Scholar] [CrossRef]
  35. Pearce, A.I.; Richards, R.G.; Milz, S.; Schneider, E.; Pearce, S.G. Animal models for implant biomaterial research in bone: a review. Eur. Cell Mater. 2007, 2, 1–10. [Google Scholar] [CrossRef]
  36. Steigenga, J.; Al-Shammari, K.; Misch, C.; Nociti, F.H., Jr.; Wang, H.-L. Effects of implant thread geometry on percentage of osseointegration and resistance to reverse torque in the tibia of rabbits. J. Periodontol. 2004, 75, 1233–1241. [Google Scholar] [CrossRef]
  37. Sykaras, N.; Iacopino, A.M.; Marker, V.A.; Triplett, R.G.; Woody, R.D. Implant materials, designs, and surface topographies: their effect on osseointegration. A literature review. Int. J. Oral Maxillofac. Implants 2000, 15, 675–690. [Google Scholar]
  38. Gehrke, S.A.; Eliers Treichel, T.L.; Pérez-Díaz, L.; Calvo-Guirado, J.L.; Aramburú Júnior, J.; Mazón, P.; de Aza, P.N. Impact of Different Titanium Implant Thread Designs on Bone Healing: A Biomechanical and Histometric Study with an Animal Model. J. Clin. Med. 2019, 31, 777. [Google Scholar] [CrossRef]
  39. Barros, R.R.; Degidi, M.; Novaes, A.B.; Piattelli, A.; Shibli, J.A.; Iezzi, G. Osteocyte density in the peri-implant bone of immediately loaded and submerged dental implants. J. Periodontol. 2009, 80, 499–504. [Google Scholar] [CrossRef]
Figure 1. Schematic image of the space created after drilling to generate the healing chamber inside of the threads to facilitate the osseointegration.
Applsci 09 03181 g001
Figure 2. Representative image of the implants and thread closed: (a) Traditional conical implant macrogeometry and (b) new conical implant macrogeometry.
Applsci 09 03181 g002
Figure 3. Representative SEM images of the two surface models used in both implant macrogeometry: (a) Without treatment (machined surface) and (b) with surface treatment.
Applsci 09 03181 g003aApplsci 09 03181 g003b
Figure 4. Representative schematic image of the drill sequence used for the osteotomy in all groups.
Applsci 09 03181 g004
Figure 5. Representative image of both tibias after the soft tissue was retrieved and removed.
Applsci 09 03181 g005
Figure 6. Implant stability measurement in two directions: (a) Proximo-distal and (b) in antero-posterior.
Applsci 09 03181 g006
Figure 7. Image of the torque machine used for the torque removal measurements.
Applsci 09 03181 g007
Figure 8. Line graph showing the ISQ evolution on the different times in each group. Time 1 = immediately at the installation; Time 2 = 15 days after the installation; Time 3 = 30 days after the installation.
Applsci 09 03181 g008
Figure 9. Bar graph showing the RTv values on the two times in each group.
Applsci 09 03181 g009
Figure 10. Representative images of the groups 15 days after the implantations. (a) G1 group, (b) G2 group, (c) G3 group, (d) G4 group. Images obtained by light microscopy with magnification of 10×.
Applsci 09 03181 g010
Figure 11. Representative images of the groups 30 days after the implantations. (a) G1 group, (b) G2 group, (c) G3 group, (d) G4 group. Images obtained by light microscopy with magnification of 10×.
Applsci 09 03181 g011
Figure 12. Bar graph of the BIC% mean and standard deviation in the two times proposed.
Applsci 09 03181 g012
Figure 13. Bar graph of the BAFO% mean and standard deviation in the two times proposed.
Applsci 09 03181 g013
Figure 14. Schematic image to show the bone compression during the implant installation (red arrows) and decompression (green arrows) on the healing chambers. (a) Conventional threads design and (b) new threads design with healing chambers.
Applsci 09 03181 g014
Table 1. Table data (mean and standard deviation) of implant stability quotient (ISQ) values measured of each group for each time.
9Time 1Time 2Time 3
G139.7 ± 3.5440.9 ± 4.3949.7 ± 4.89
G238.6 ± 4.0239.4 ± 4.1246.9 ± 4.65
G339.9 ± 3.4649.1 ± 4.5261.1 ± 4.72
G439.9 ± 3.1046.6 ± 4.5858.8 ± 4.58
Table 2. Bonferroni’s multiple comparison test to compare the ISQ values between the two times with statistically significant difference (at 15 and 30 days).
Time 2 Time 3
Group ComparisonMean of Diff.p-Value95% CI Mean of Diff.p-Value95% CI
G1 vs G21.5000.3559−2.599 to 5.5992.7220.0946−1.389 to 6.833
G1 vs G3−8.111 <0.0001 *−12.21 to −4.012−11.39 <0.0001 *−15.50 to −7.278
G1 vs G4−5.667 0.0026 *−9.766 to −1.567−9.167 <0.0001 *−13.28 to −5.056
G2 vs G3−9.611<0.0001 *−13.71 to −5.512−14.11 <0.0001 *−18.22 to −10.00
G2 vs G4−7.167 0.0002 *−11.27 to −3.067−11.89 <0.0001 *−16.00 to −7.778
G3 vs G42.4440.1714−1.655 to 6.5442.2220.1764−1.889 to 6.333
Diff. = Differences; * with difference statistical (p < 0.005); CI = Confidence Interval.
Table 3. Table data (mean and standard deviation) of the removal torque values (RTv) measured of each sample.
Group15 days30 days
G136.8 ± 4.0244.8 ± 3.63
G233.4 ± 3.9140.7 ± 3.57
G344.0 ± 4.5065.2 ± 3.63
G442.3 ± 4.2161.0 ± 3.81
Table 4. Bonferroni’s multiple comparison test to compare the RTv values between the two times with statistically significant difference.
15 days 30 days
Group ComparisonMean of Diff.p-Value95% CI Mean of Diff.p-Value95% CI
G1 vs G23.3330.1020−2.192 to 8.8584.1110.0372 *−0.7437 to 8.966
G1 vs G3−7.2220.0022 *−12.75 to −1.697−20.440.0004 *−25.30 to −15.59
G1 vs G4−5.5560.0230 *−11.08 to −0.030−16.220.0004 *−21.08 to −11.37
G2 vs G3−10.560.0007 *−16.08 to −5.030−24.560.0004 *−29.41 to −19.70
G2 vs G4−8.8890.0014 *−14.41 to −3.364−20.330.0004 *−25.19 to −15.48
G3 vs G41.6670.1840−3.858 to 7.1924.2220.0147 *−0.6326 to 9.077
Diff. = Differences; * with difference statistical (p < 0.005); CI = Confidence Interval.
Table 5. Table data (mean and standard deviation) of bone-to-implant contact percentage (BIC%) measured around the surface of each sample.
Group15 days30 days
G134.0 ± 3.8839.5 ± 4.97
G233.1 ± 4.8336.4 ± 4.36
G338.6 ± 4.2353.4 ± 5.39
G436.8 ± 3.9950.3 ± 5.74
Table 6. Bonferroni’s multiple comparison test to compare the BIC% values between the groups.
15 days 30 days
Group ComparisonMean of Diff.p-Value95% CI Mean of Diff.p-Value95% CI
G1 vs G20.93331.000−4.699 to 6.5663.1000.3086−3.716 to 9.916
G1 vs G3−4.5890.0417 *−10.22 to 1.043−13.900.0003 *−20.72 to −7.084
G1 vs G4−2.7440.1702−8.377 to 2.888−10.830.0008 *−17.65 to −4.017
G2 vs G3−5.5220.0133 *−11.15 to 0.1101−17.000.0004 *−23.82 to −10.18
G2 vs G4−3.6780.1323−9.310 to 1.955−13.930.0004 *−20.75 to −7.117
G3 vs G41.8440.3059−3.788 to 7.4773.0670.5067−3.750 to 9.883
Diff. = Differences; * with difference statistical (p < 0.005); CI = Confidence Interval.
Table 7. Table data (mean, standard deviation, and median) and graph values distribution of the bone-to-implant contact percentage (BIC%) measured around the surface of each sample.
Group15 days30 days
G147.5 ± 5.9258.2 ± 6.77
G246.7 ± 6.2356.8 ± 7.51
G365.0 ± 6.9371.1 ± 7.21
G456.2 ± 6.6263.7 ± 7.29
(1)
Table 8. Bonferroni’s multiple comparison test to compare the bone fraction occupancy inside the threads (BAFO%) values between the groups.
15 days 30 days
Group ComparisonMean of Diff.p-Value95% CI Mean of Diff.p-Value95% CI
G1 vs G20.82220.8252−7.711 to 9.3561.3780.8636−8.167 to 10.92
G1 vs G3−17.490.0005 *−26.02 to −8.955−12.860.0040 *−22.40 to −3.310
G1 vs G4−8.6220.0191 *−17.16 to −0.089−5.5220.1709−15.07 to 4.023
G2 vs G3−18.310.0013 *−26.84 to −9.778−14.230.0012 *−23.78 to −4.688
G2 vs G4−9.4440.0151 *−17.98 to −0.911−6.9000.1116−16.45 to 2.645
G3 vs G48.8670.0142 *0.3332 to 17.407.3330.0503−2.212 to 16.88
Diff. = Differences; * with difference statistical (p < 0.005); CI = Confidence Interval.

