Article

Analysis of a Main Cabin Ventilation System in a Jack-Up Offshore Platform Part I: Numerical Modelling

1
Department of Marine Engineering, School of Engineering, Ocean University of China, Qingdao 266110, China
2
School of Energy and Power Engineering, Shandong University, Jinan 250061, China
3
Department of Electrical, Electronic and Computer Engineering, University of Pretoria, Pretoria 0002, South Africa
4
School of Mechanical, Materials, Mechatronic and Biomedical Engineering, University of Wollongong, Wollongong, NSW 2522, Australia
*
Author to whom correspondence should be addressed.
Submission received: 12 July 2019 / Revised: 30 July 2019 / Accepted: 31 July 2019 / Published: 5 August 2019
(This article belongs to the Special Issue Fault Diagnosis of Rotating Machine)

Abstract

:
This work aims to measure the thermodynamics of a main cabin ventilation system in a JU-2000E jack-up offshore platform. A three-dimensional (3D) physical model of the ventilation system was established, and the computational fluid dynamics (CFD) software (ANSYS FLUENT) was used to calculate the model thermodynamics. Numerical analysis was performed to investigate the influence mechanisms of the ventilation factors such as ventilation temperature and volume on the ventilation performance. The analysis results demonstrate that (1) top-setting of the exhaust vents is more effective than the side-setting in terms of high temperature reduction, (2) small ventilation temperature and volume can improve the ventilation efficiency, and (3) proper shutdown selection of the backup diesel engine can enhance the ventilation performance. Furthermore, the effect of humidity for the ventilation air was investigated. Lastly, an experimental platform was developed based on the simulation model. Experimental tests were carried out to evaluate the shutdown selection of the backup engine and have shown consistent results to that of the simulation model. The findings of this study provide valuable guidance in designing the ventilation system in the JU-2000E jack-up offshore platform.

1. Introduction

The main cabins in offshore platforms are very different from ordinary ship cabins or building rooms [1,2]. The uniqueness of the main cabins in offshore platforms is found in the presence of a set of mechanical equipment such as main engines, pumps, boilers, and heat exchangers in the cabins [3]. Oxygen is essential for both the cabin personnel and power machineries. It is crucial to supply sufficient fresh air to the cabins in order to ensure full oxygen combustion and personnel safety. Furthermore, the normal operation of mechanical equipment will generate a large amount of heat [4], which is difficult to discharge from the relatively narrow and well-sealed cabin structure. More importantly, a small amount of flammable gases will emit from the diesel engines. Therefore, it is necessary to optimally design the ventilation system for the main cabins in order to supply fresh air and take away the heat and flammable gases.
Optimal design of the ventilation system for buildings is always an important task [5]. Many researches have investigated the effectiveness of different ventilation systems for building rooms, but very limited work has been done for ship cabins, let alone to the design of a ventilation system for offshore platforms. Theoretical modelling and numerical simulation have been widely used in optimizing the ventilation systems in various applications. The theoretical modelling often requires mathematical simplification of the cabins. You et al. [6] optimized the ventilation system for an airliner cabin to improve the contaminant removal efficiency and to enhance the cabin thermal comfort. Pang et al. [7] optimized the air distribution of an aircraft cabin using simulation analysis. Farag [8] improved the thermal comfort in an aircraft cabin using computational fluid dynamics (CFD) simulation, and Maier et al. [9] discussed the passengers’ comfort for an aircraft cabin by analyzing empirical data. Kolhe et al. [10] managed the cabin heat in an electric car. Experimental evaluation was carried out to investigate the temperature distribution on the car roof. Literature review indicates that great progress has been made in the ventilation optimization for aircraft cabins, building rooms, and vehicle cabins. However, very limited work has been done to address the ventilation optimization for ships and offshore platforms. He et al. [11] simulated the thermal behaviors in a manned submersible, and Jiang et al. [12] modeled a ship main cabin. To our best knowledge, ventilation optimization for offshore platforms has not been found in literature.
In order to bridge the research gap in ventilation optimization of offshore platforms, this work proposes a novel thermodynamics model of a main cabin in a JU-2000E jack-up offshore platform. To that avail, a 1:1 scaling model of the main cabin was established using the SolidWorks software (SolidWorks 2016, SolidWorks Corporation, Waltham, MA, USA). Different influence factors were then investigated in ANSYS FLUENT (Ansys15.0 2016, Ansys Inc., Canonsburg, PA, USA) based on the SolidWorks model to calculate the thermodynamics of the ventilation system of the main cabin. The temperature field, velocity field, and vector diagram of the airflow [6] in the main cabin were compared using different ventilation designs. The optimal ventilation design scheme was obtained based on a reasonable trade-off between different impact factors. The contribution of this work is that a quantitative analysis of the significance of the impact factors, such as ventilation temperature, volume and humidity, is presented for the ventilation system design of offshore platform cabins.

2. Methodology

Numerical simulation was performed to analyze the cabin thermodynamics of a JU-2000E jack-up offshore platform. The physical model of the cabin was built using SolidWorks, while the thermodynamics analysis was carried out using ANSYS FLUENT.

2.1. Overall of the CFD Design

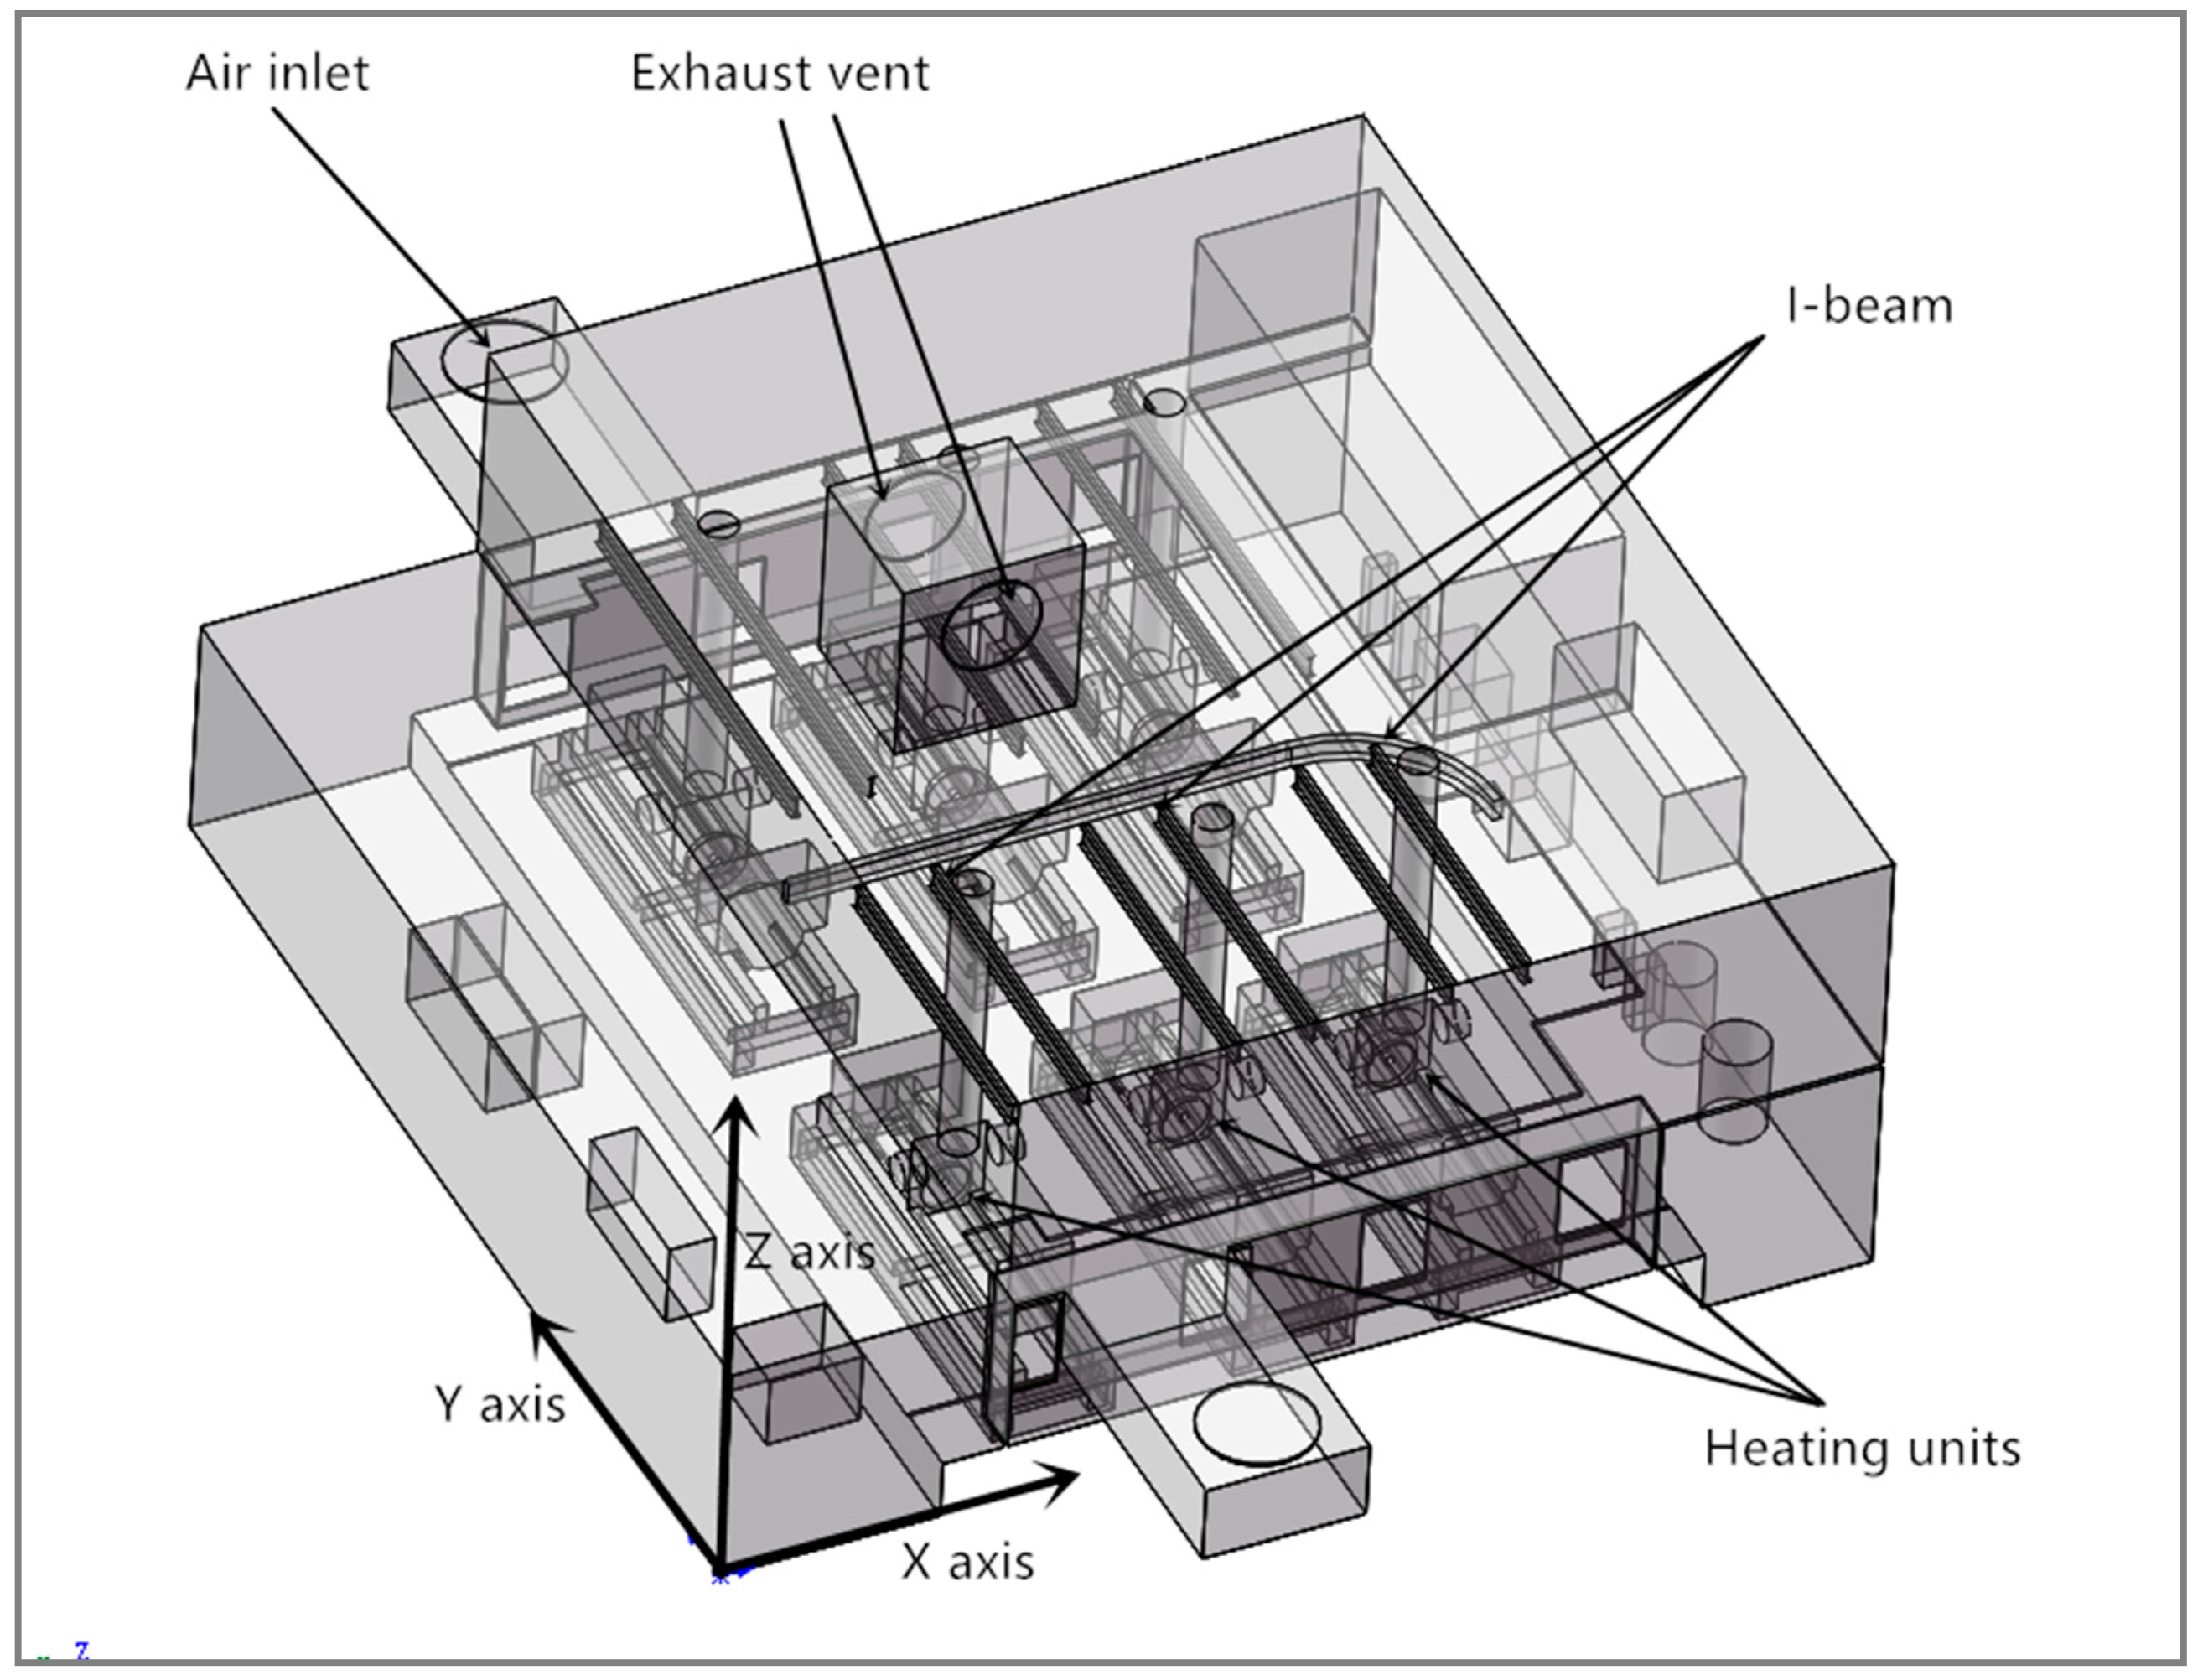
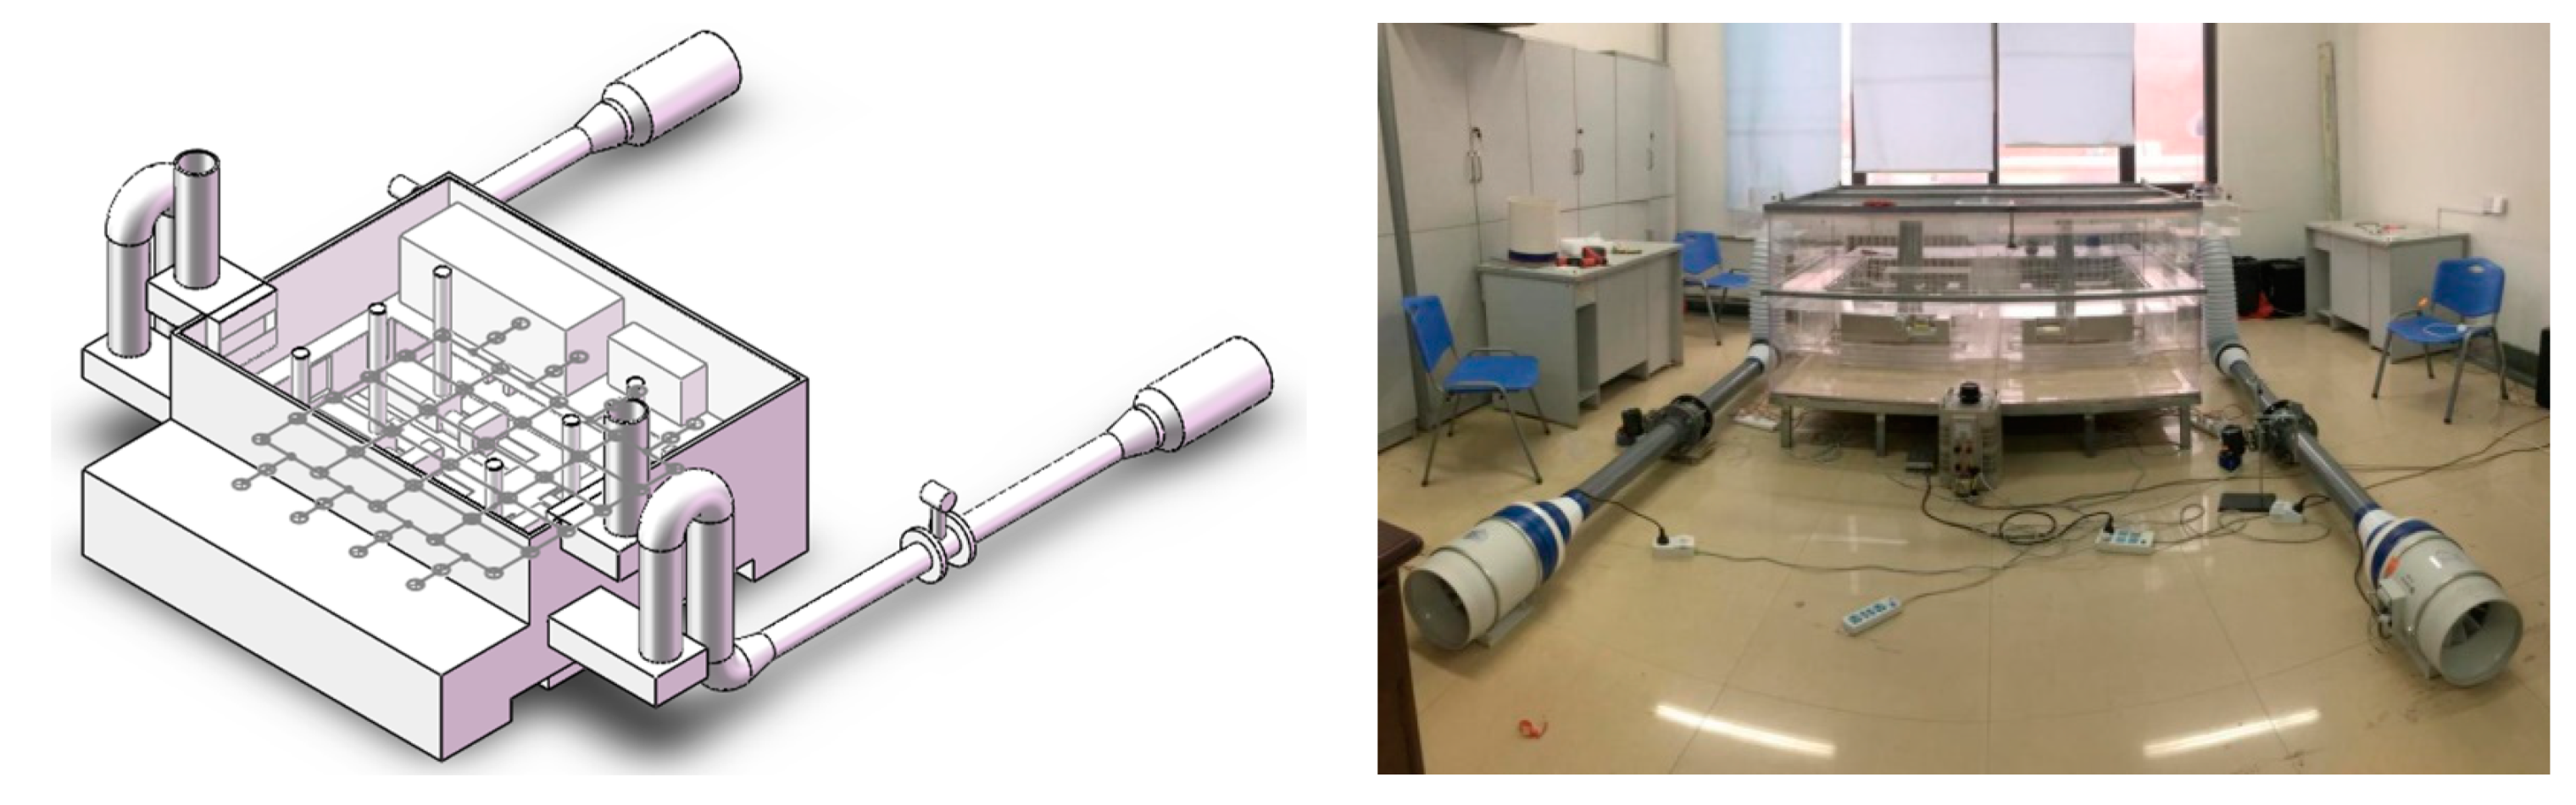
Figure 1 shows the overview of the three-dimensional (3D) simulation model of the offshore cabin, where the ventilation module consists of an air inlet part, a heating unit, and an exhaust vent. The air flow motion follows three laws of conservation in physics [13], namely, the laws of conservation of mass, conservation of momentum, and conservation of energy. These laws provide the theoretical basis of the numerical calculation for the ventilation design.
The dimensions of the 3D model were 18.8 × 18.3 × 7.7 m in length, width, and height. The total volume of the cabin was 2003.26 m
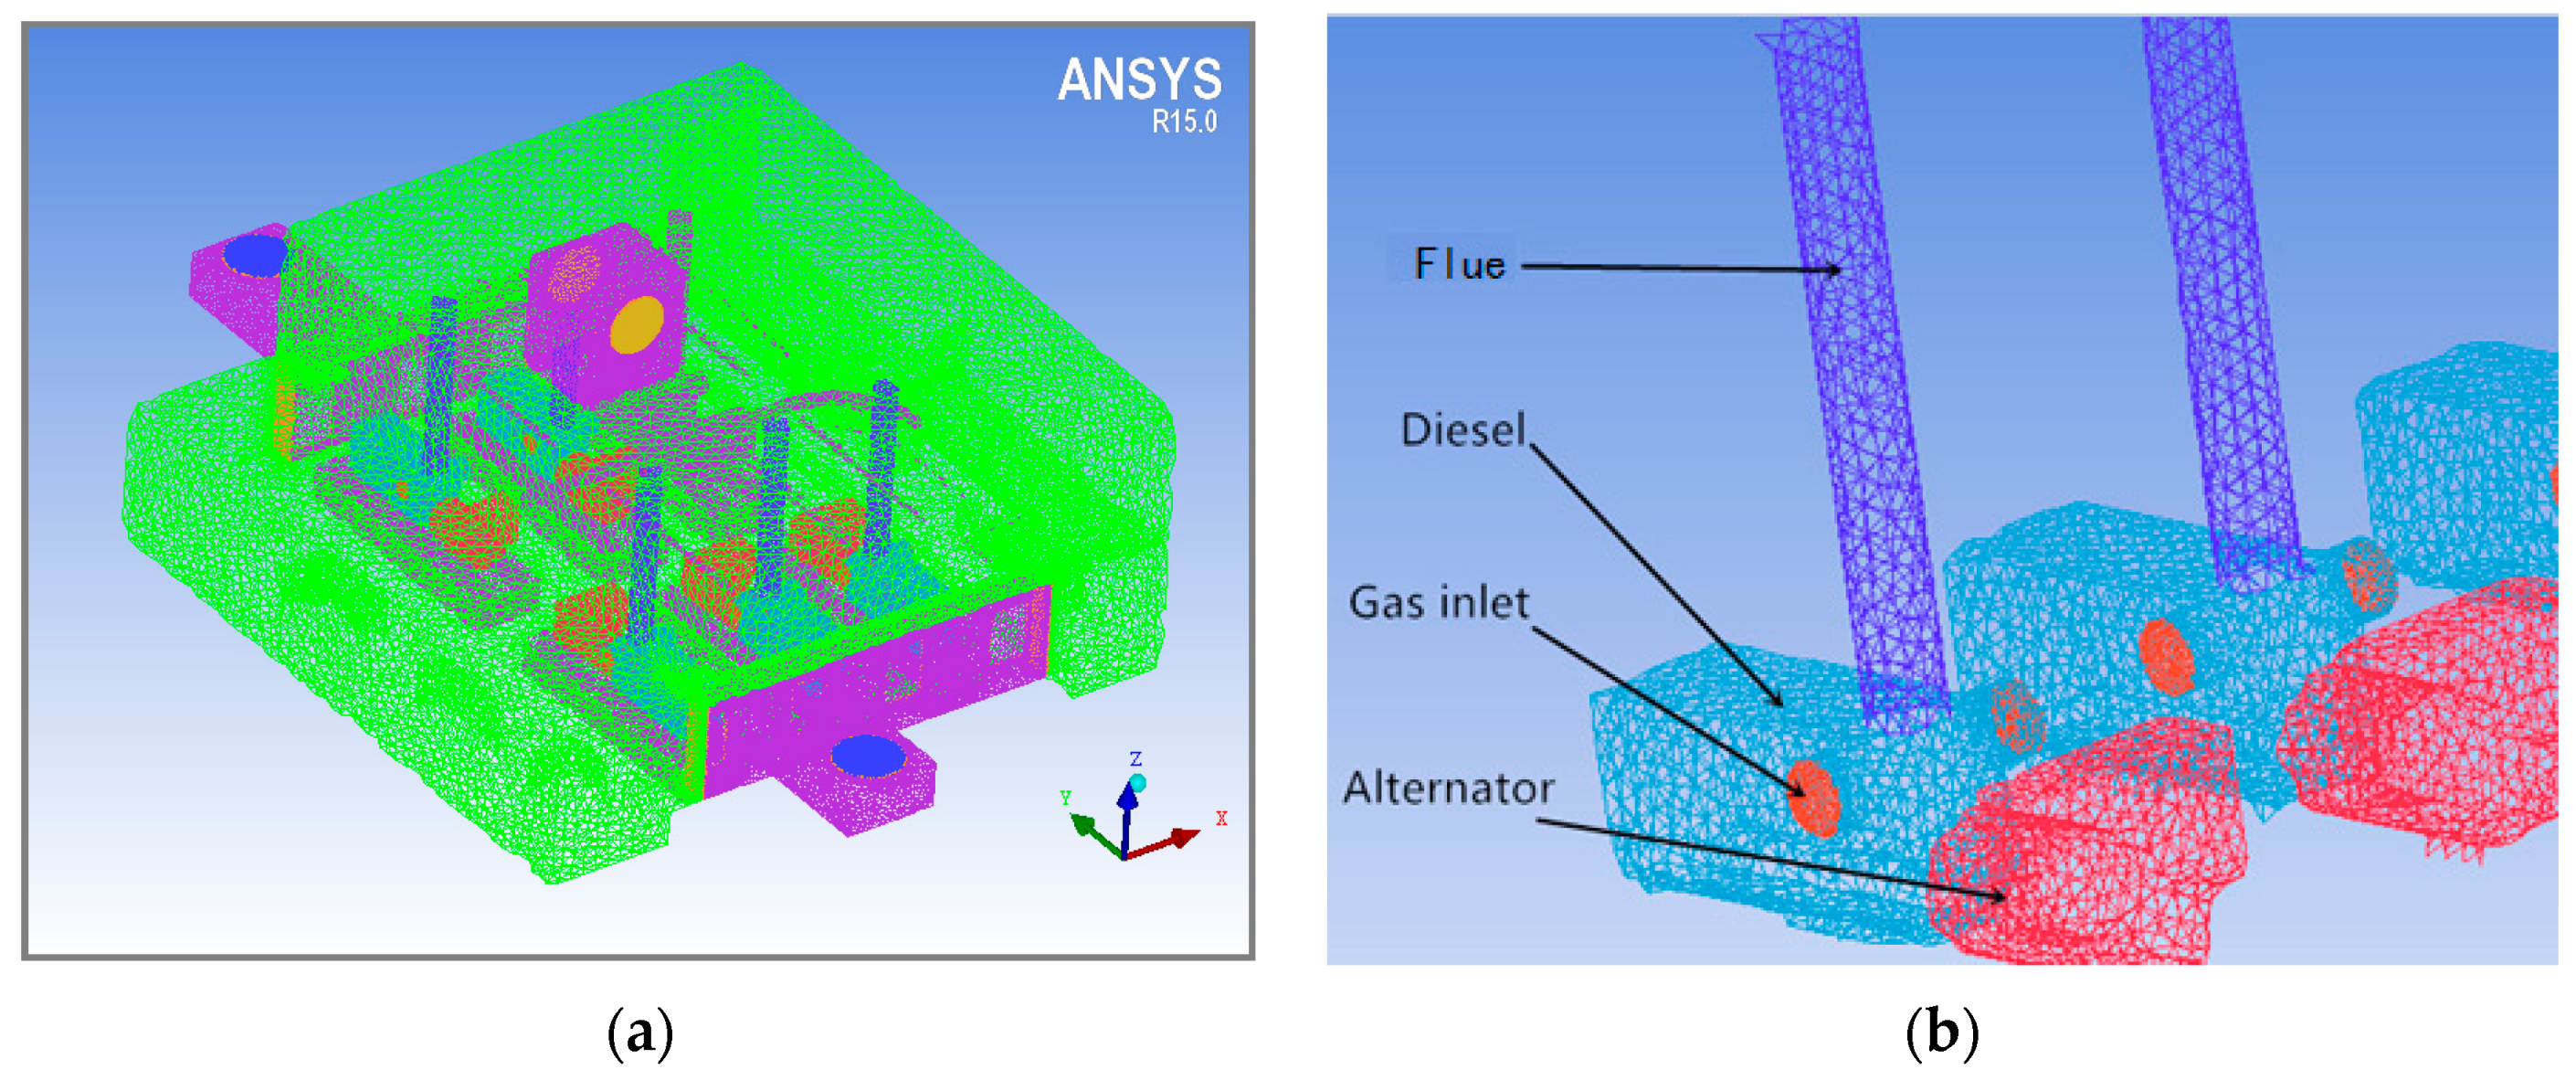
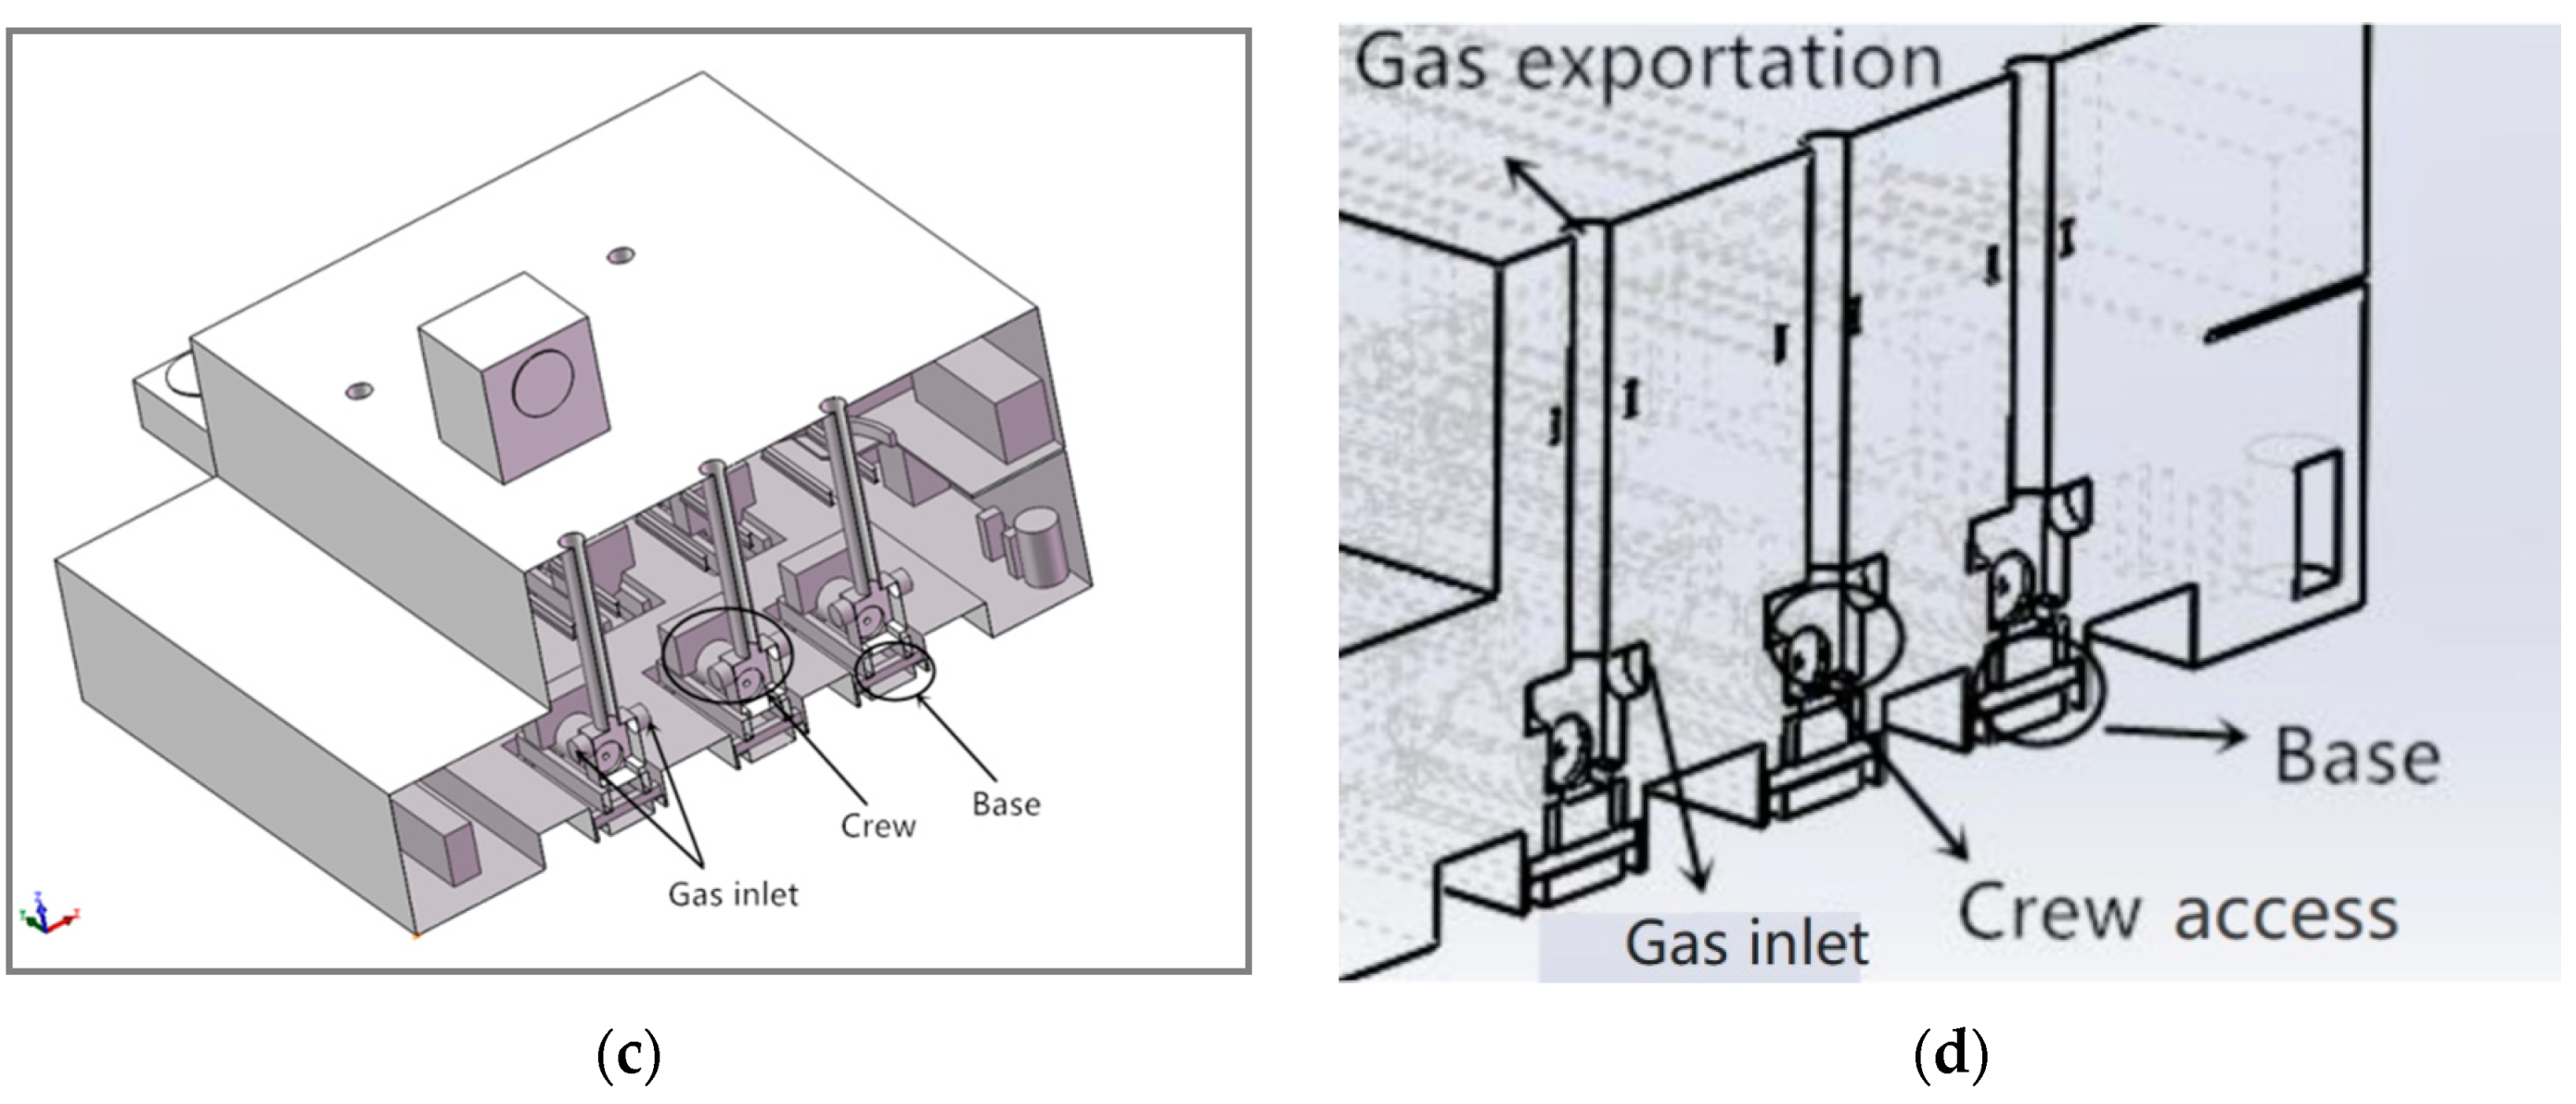
3. In order to make the boundary conditions of the cabin model more realistic, reverse engineering was adopted to establish the 3D model. To be specific, the air basin was an entity in the operation domain, while in the noncomputational domain the heat dissipation path, the base gantry, and the auxiliary equipment were hollowed out. The arrangement inside the cabin model is shown in Figure 2. Considering that the diesel engine in the full load condition inhales 12% of the ventilation air [14], the gas inlets were set to both sides of the diesel engine. Due to the high temperature of the exhaust gas, the exhaust vent was placed at the roof of the model.
In the model meshing process, in order to make a tradeoff between calculation complexity and accuracy, the boundary layer mesh was not adopted. Considering the surface complexity of the heating components and the exhaust port, the unstructured/flexible grid method was adopted, namely, large grid elements were used in the areas where the computing accuracy requirement was low, while grid refinement was adopted in the areas where heat or gradient changes occurred. By doing so, a good tradeoff between the calculation accuracy and complexity can be achieved.
The grid-independence was carried out to determine the grid number of the model. Table 1 shows the evaluation results. As can be seen in the table, when the grid number increased to 1,490,000 the temperature difference ∆T between the inlet and outlet of the ventilation system was 7.54 °C, and the output ventilation volume Vo was 6.94 m/s. When the grid number kept increasing to 1,840,000, the temperature difference ∆T decreased significantly to 6.32 °C, and the ventilation volume Vo increased to 8.37 m/s. However, when further increased the grid number all along to 2,170,000, ∆T and Vo changed a little, which suggested that the ventilation reached a stable condition from the inlet to the outlet. As a result, this study selected a mesh size of 2,192,711 elements and 387,897 nodes in total, to make the CFD solution mesh-independent [15,16,17].
There are four types of turbulence model in FLUENT, namely Standard k-ε model, Re-normalisation group (RNG) k-ε model, Standard k-ω model, and shear stress transport (SST) k-ω model. In order to select the most suitable model for the CFD simulation in this study, a comparison was performed using these four turbulence models with the same CFD setting [16]. The Reynolds number in different regions of the cabin model varied from 5 × 10⁵ to 1 × 10⁶. Table 2 shows the comparison results. As can be seen in the table, the standard k-ε model produced the least temperature difference, ∆T 6.32 °C, while the SST k-ω model generated the largest output ventilation volume, Vo 8.90 m/s, among these four turbulence models. Considering that the computation time of the standard k-ε model is less than that of the SST k-ω model, this study adopted the standard k-ε model in the CFD simulations.
In the CFD simulation, the cabin model was calculated in steady state, the turbulence model employed standard k-ε model, and the tetrahedral cells were used in this study. When setting the model boundaries, for the closed casing and auxiliary equipment of the cabin a wall boundary was used, for the heating wall faces a heat source boundary was adopted, and for other wall surfaces the adiabatic boundary was used [18]. Specific heat flux (W/m²) values were given in the actual surface area of heating power, including the diesel engines, the generators, and the diesel engine chimneys. The actual surface area of heating power was calculated as the ratio of heat dissipation of generator sets to the surface area of equipment. The heat dissipation data were obtained from the generator manufacturer, while the surface area was calculated from the CFD model. Since the scale ratio of the 3D model was 1, the velocity inlet and pressure outlet boundary conditions were adopted. In order to simulate the full load condition, where the generator sets inhale 12% of the ventilation air, a constant airspeed boundary was set to the gas inlet. The airspeed value was calculated based on the full load condition of the generator sets.

2.2. Optimal Shutdown Selection

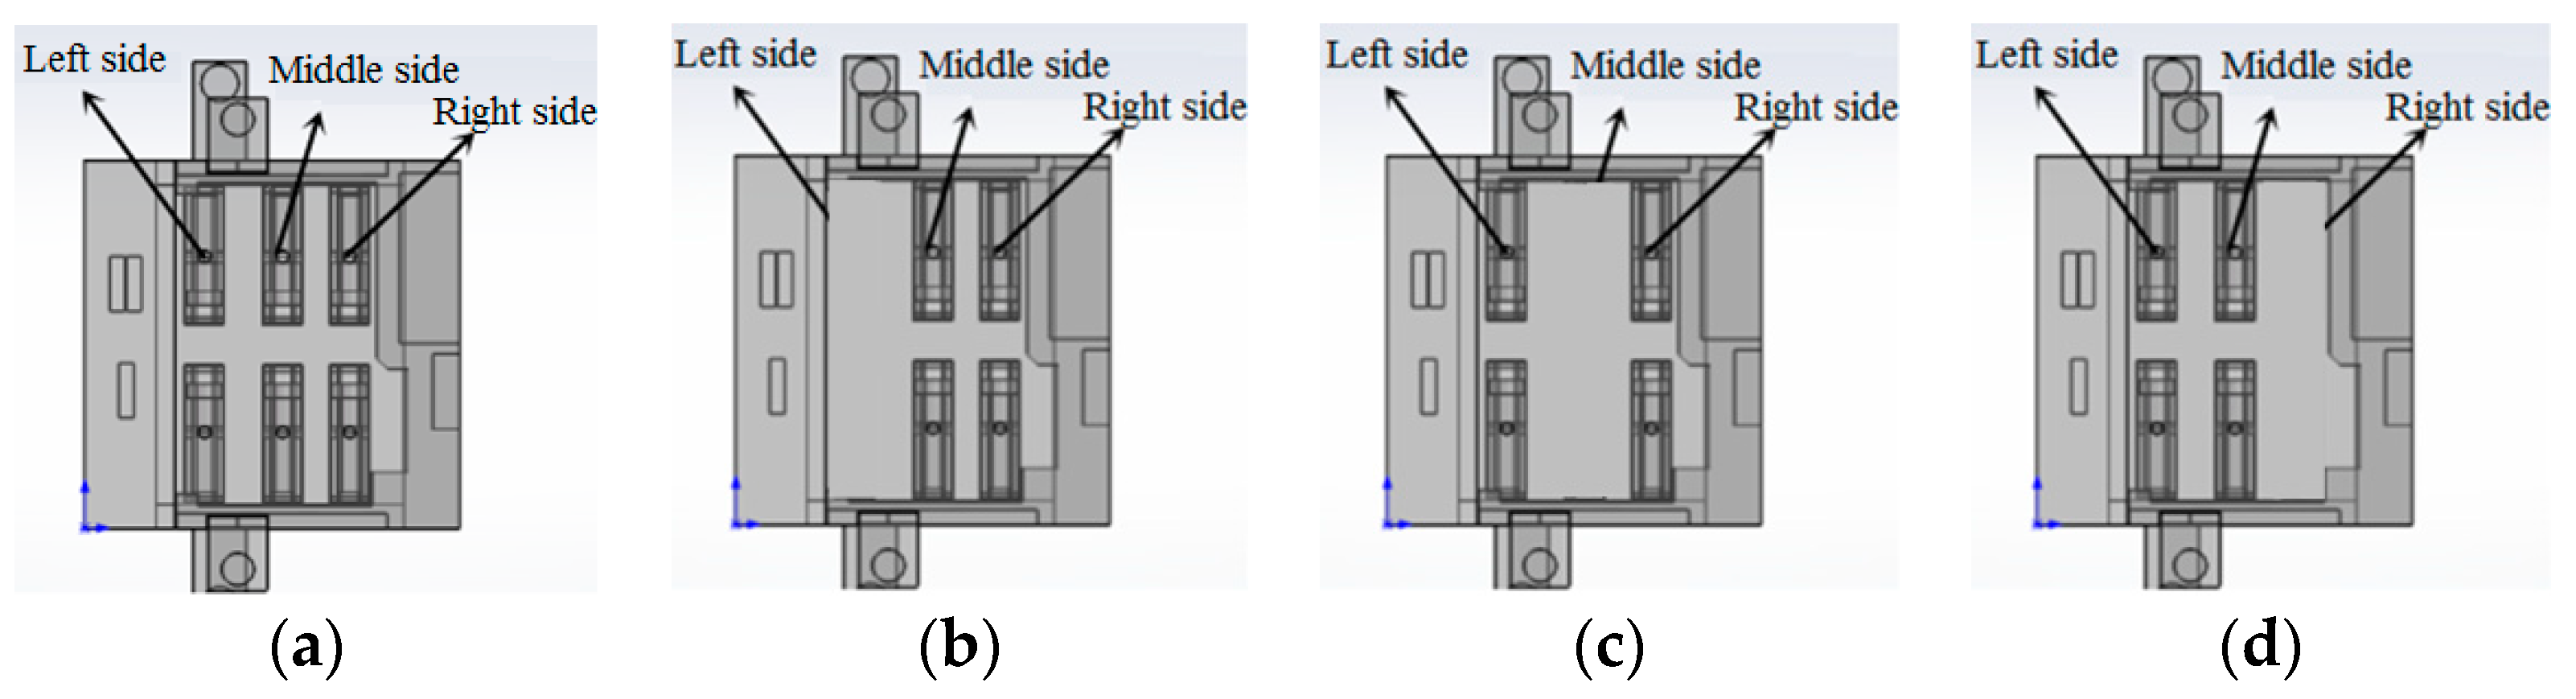
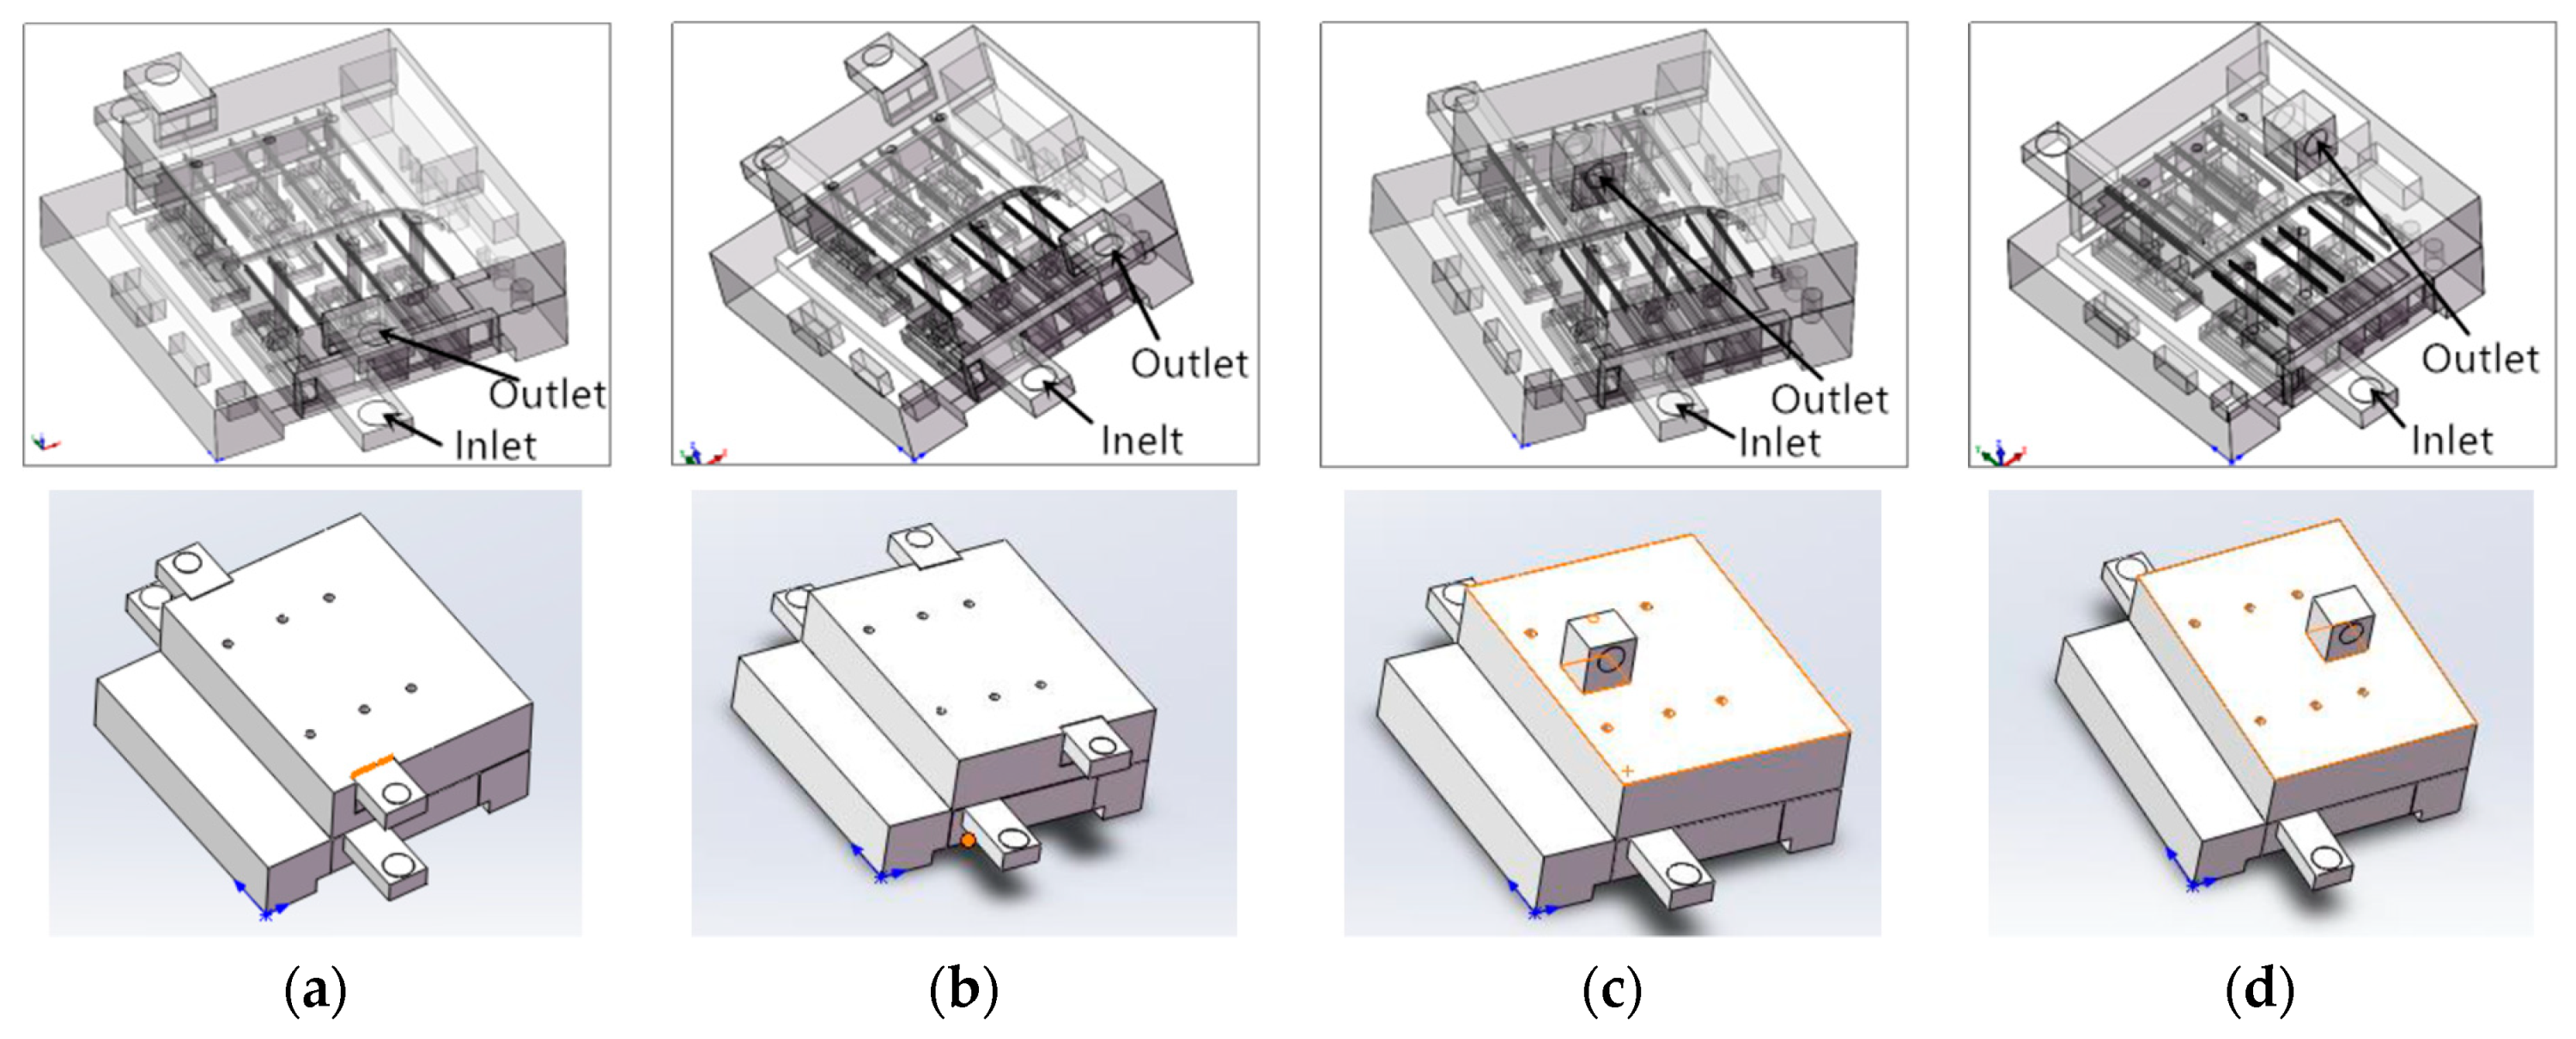
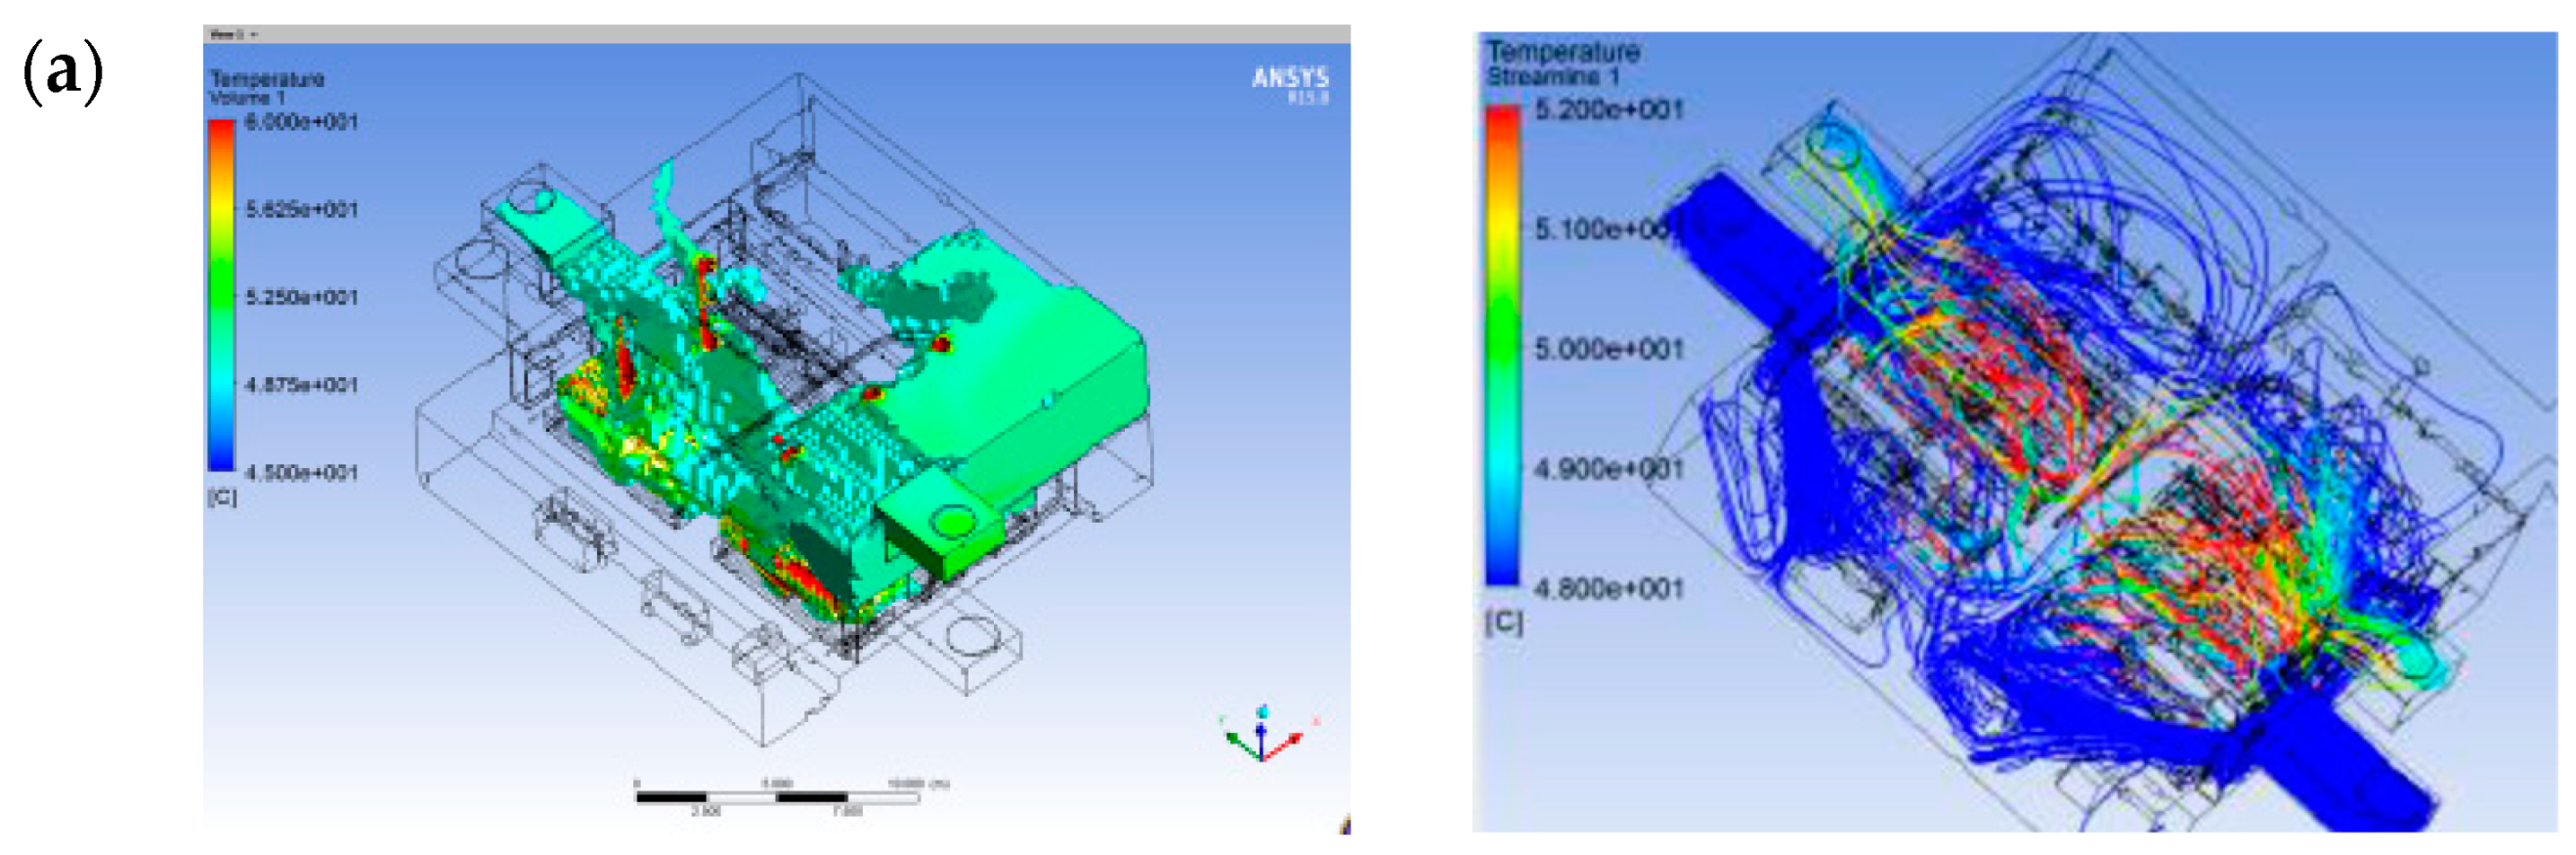
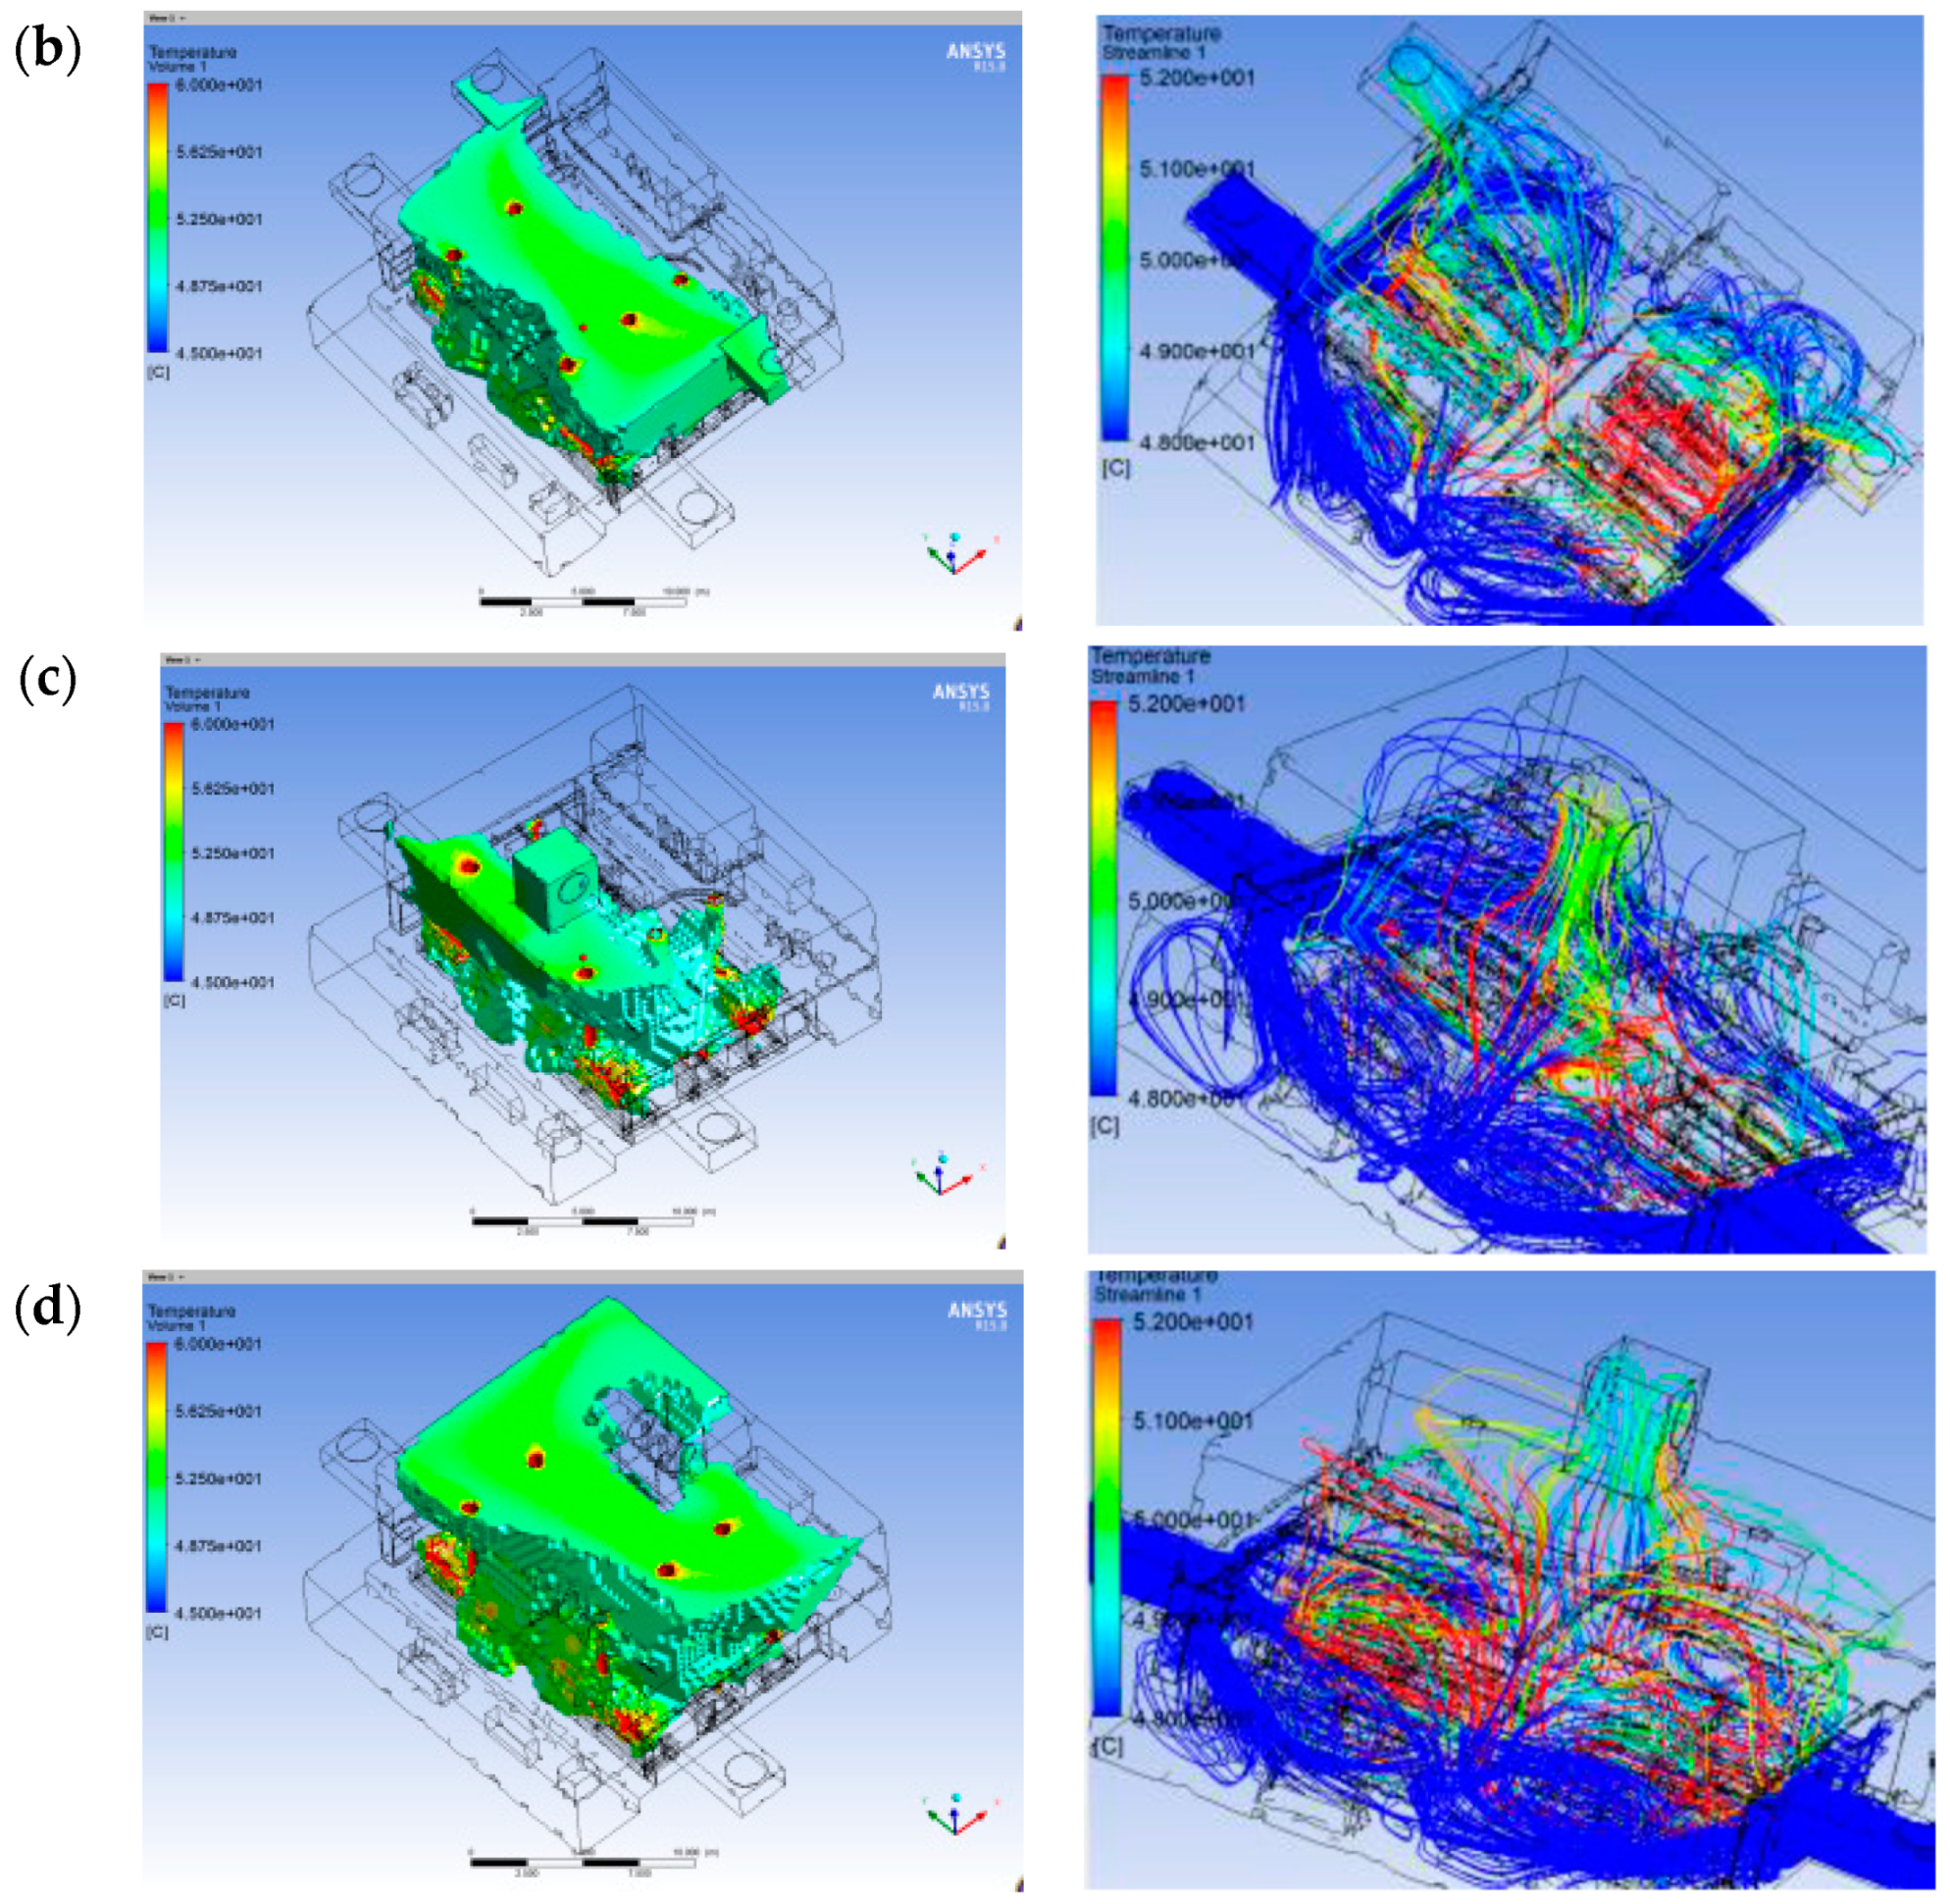
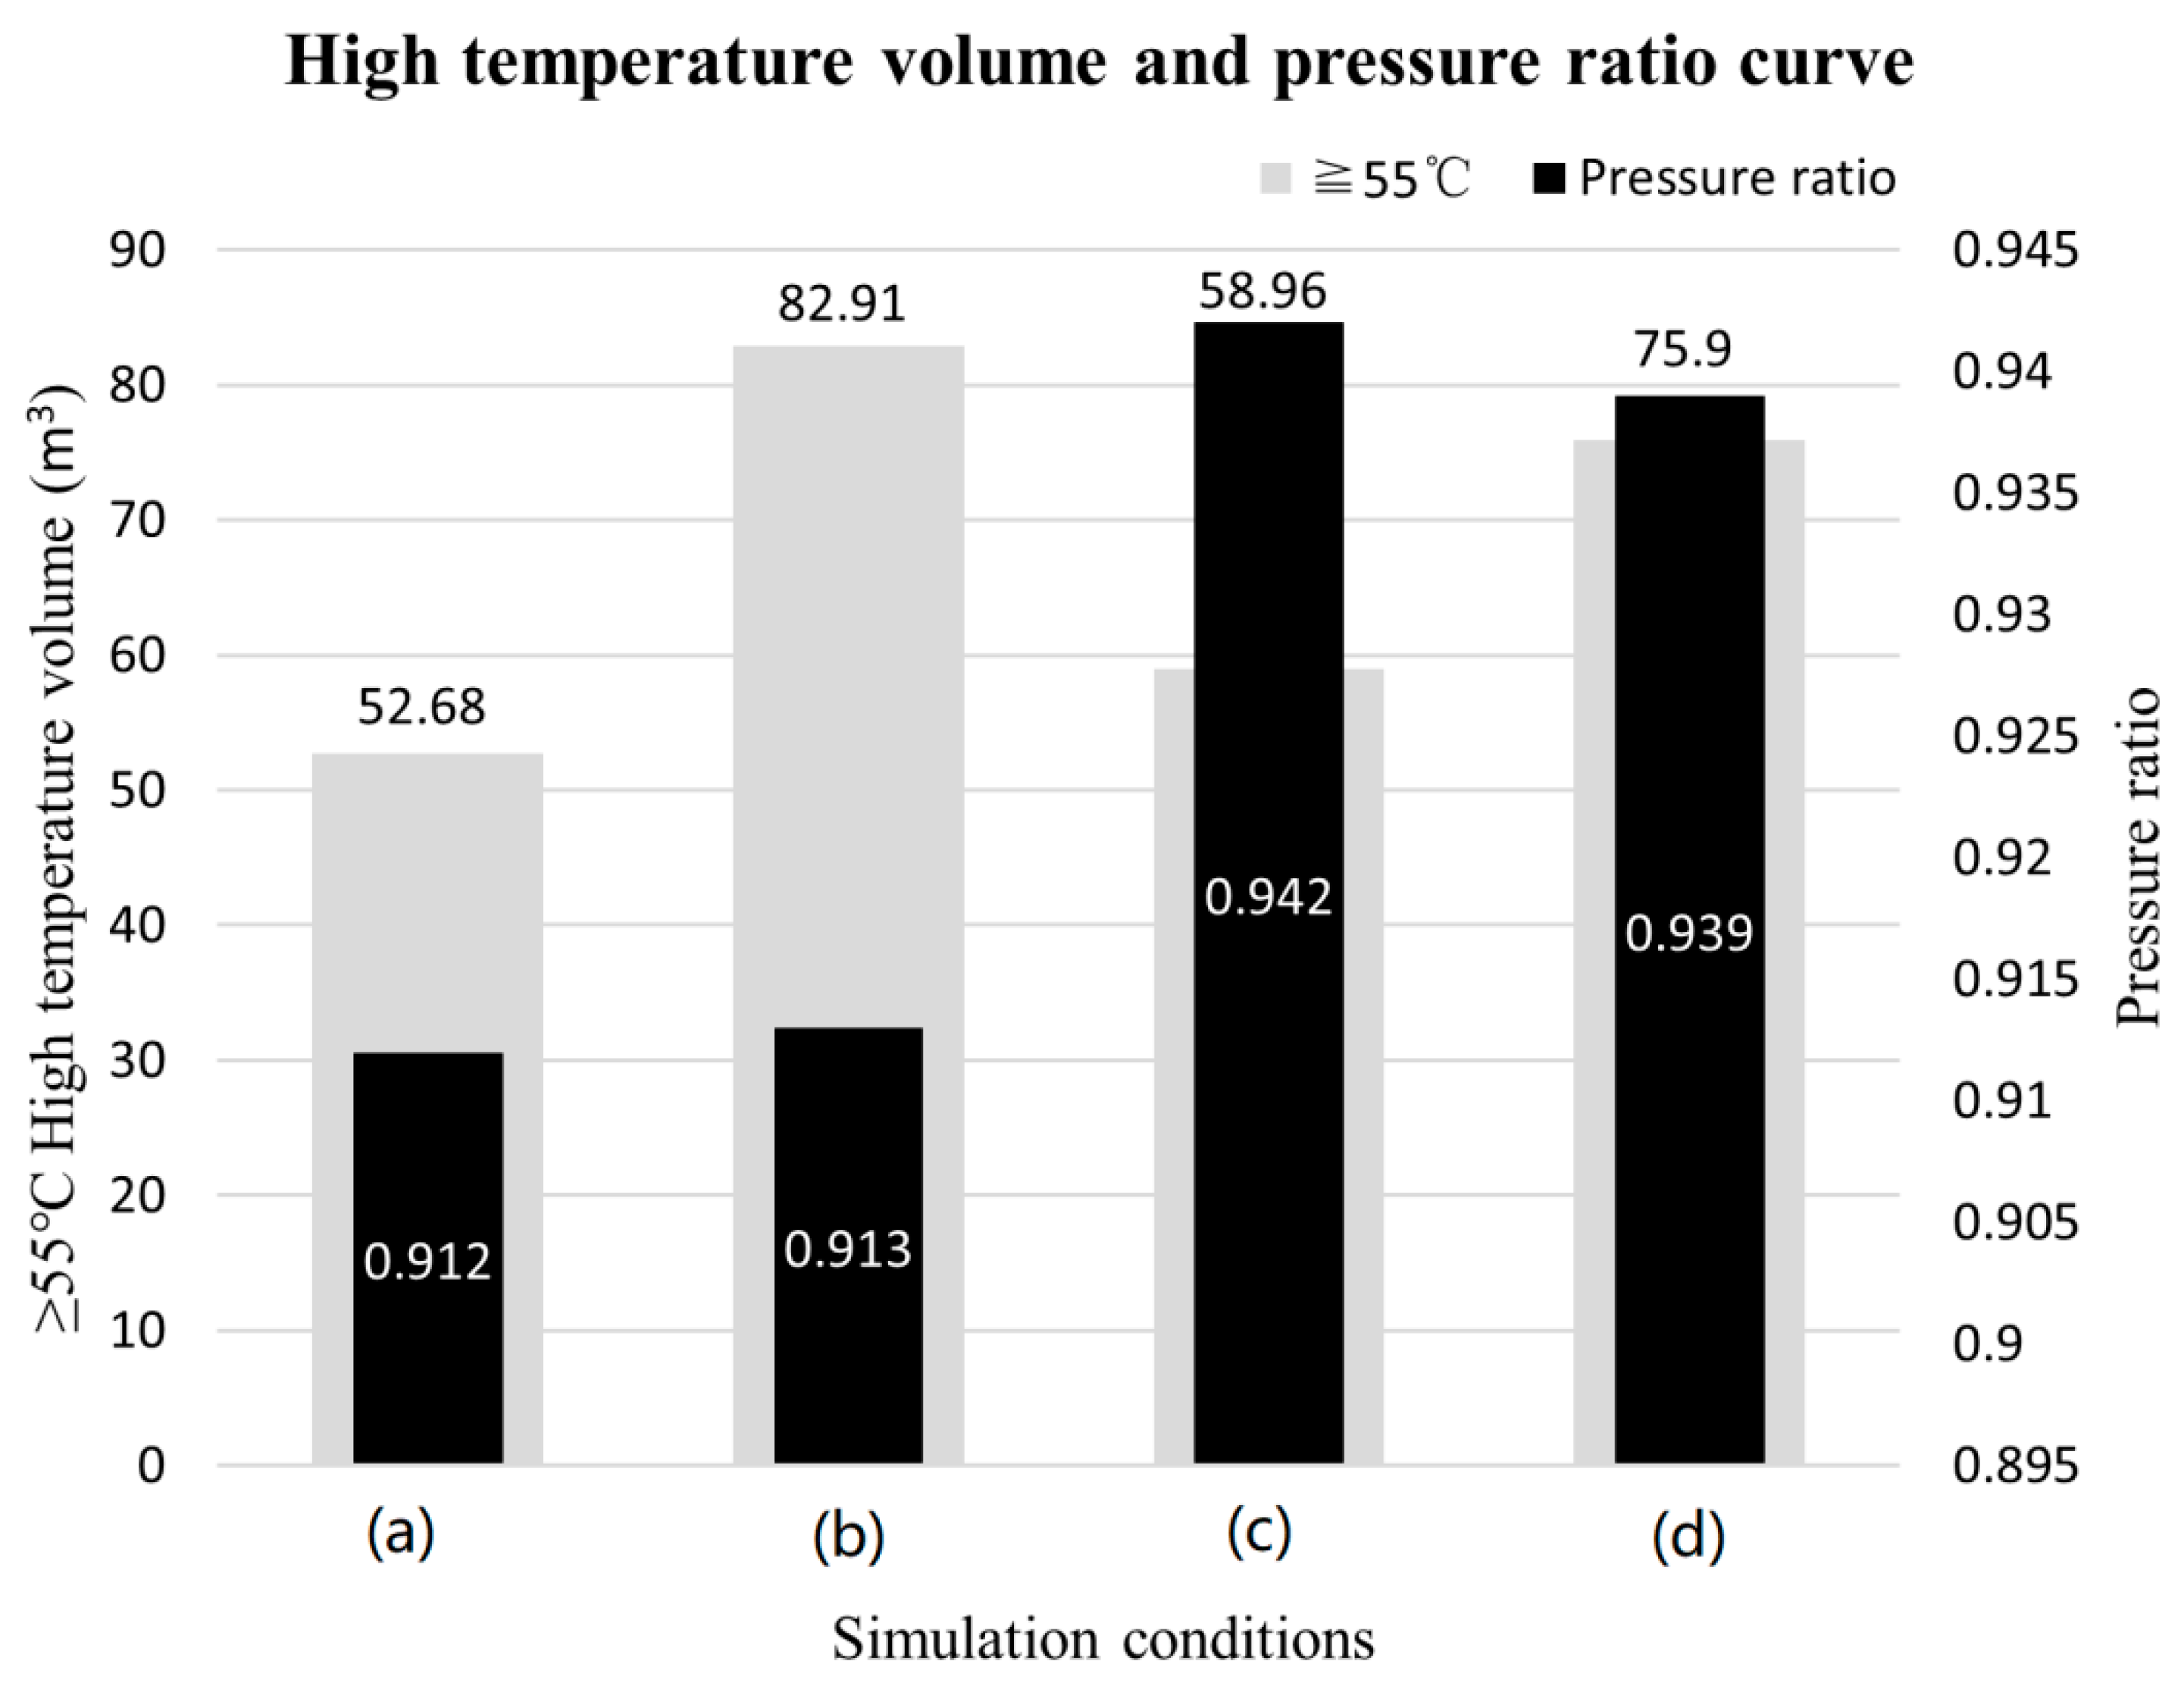
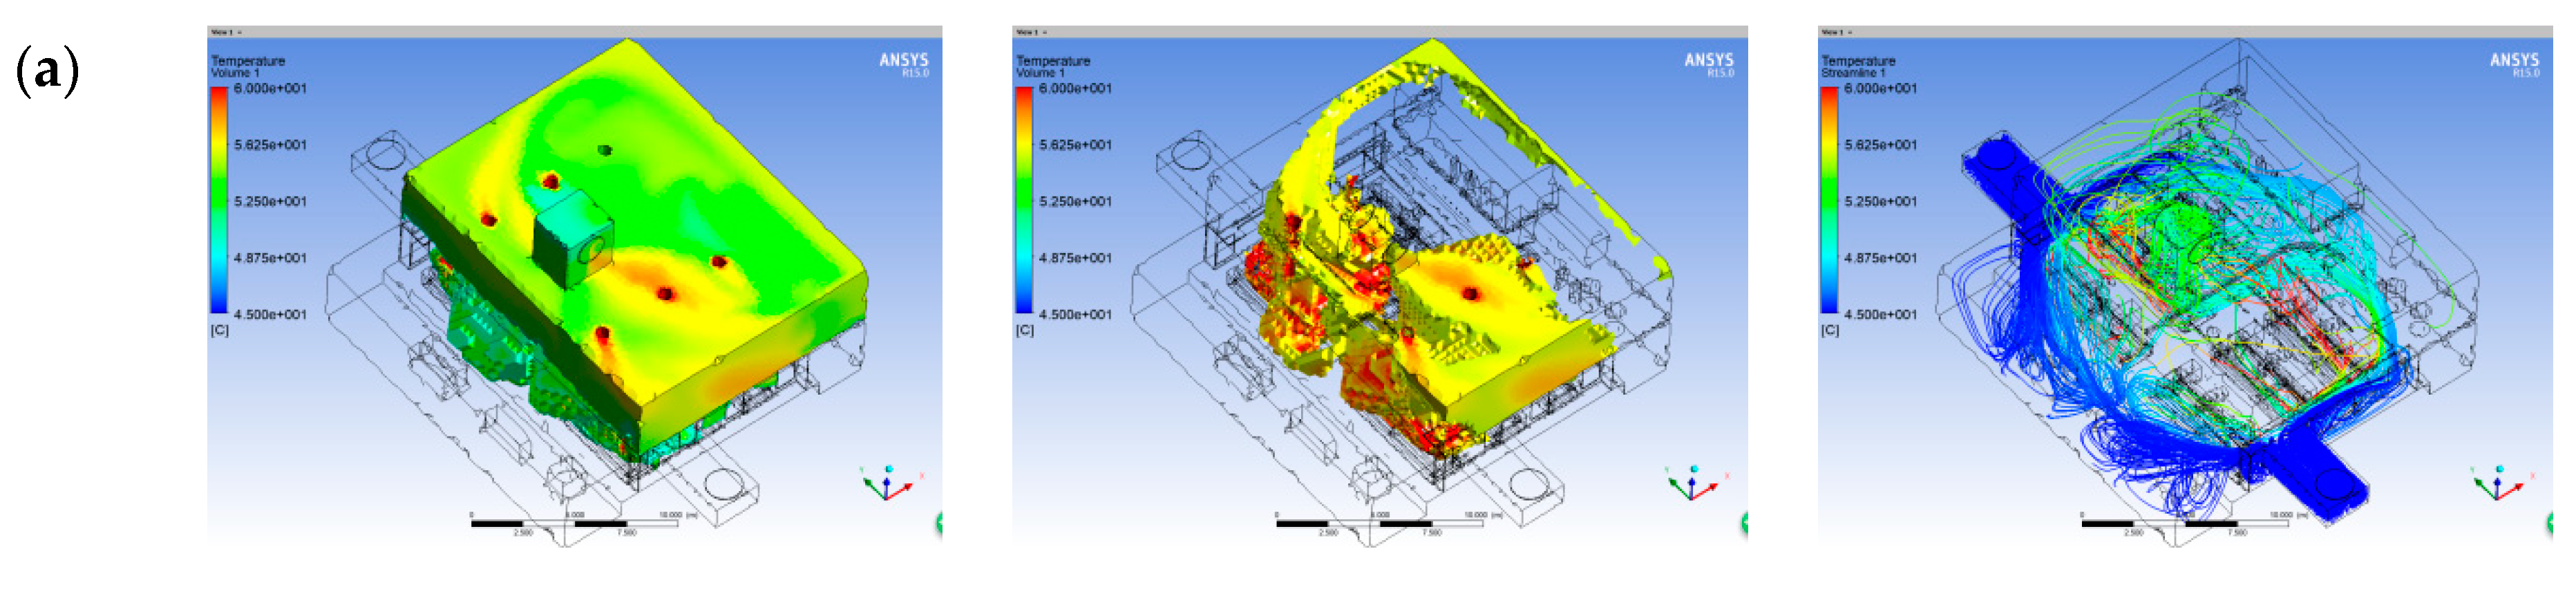
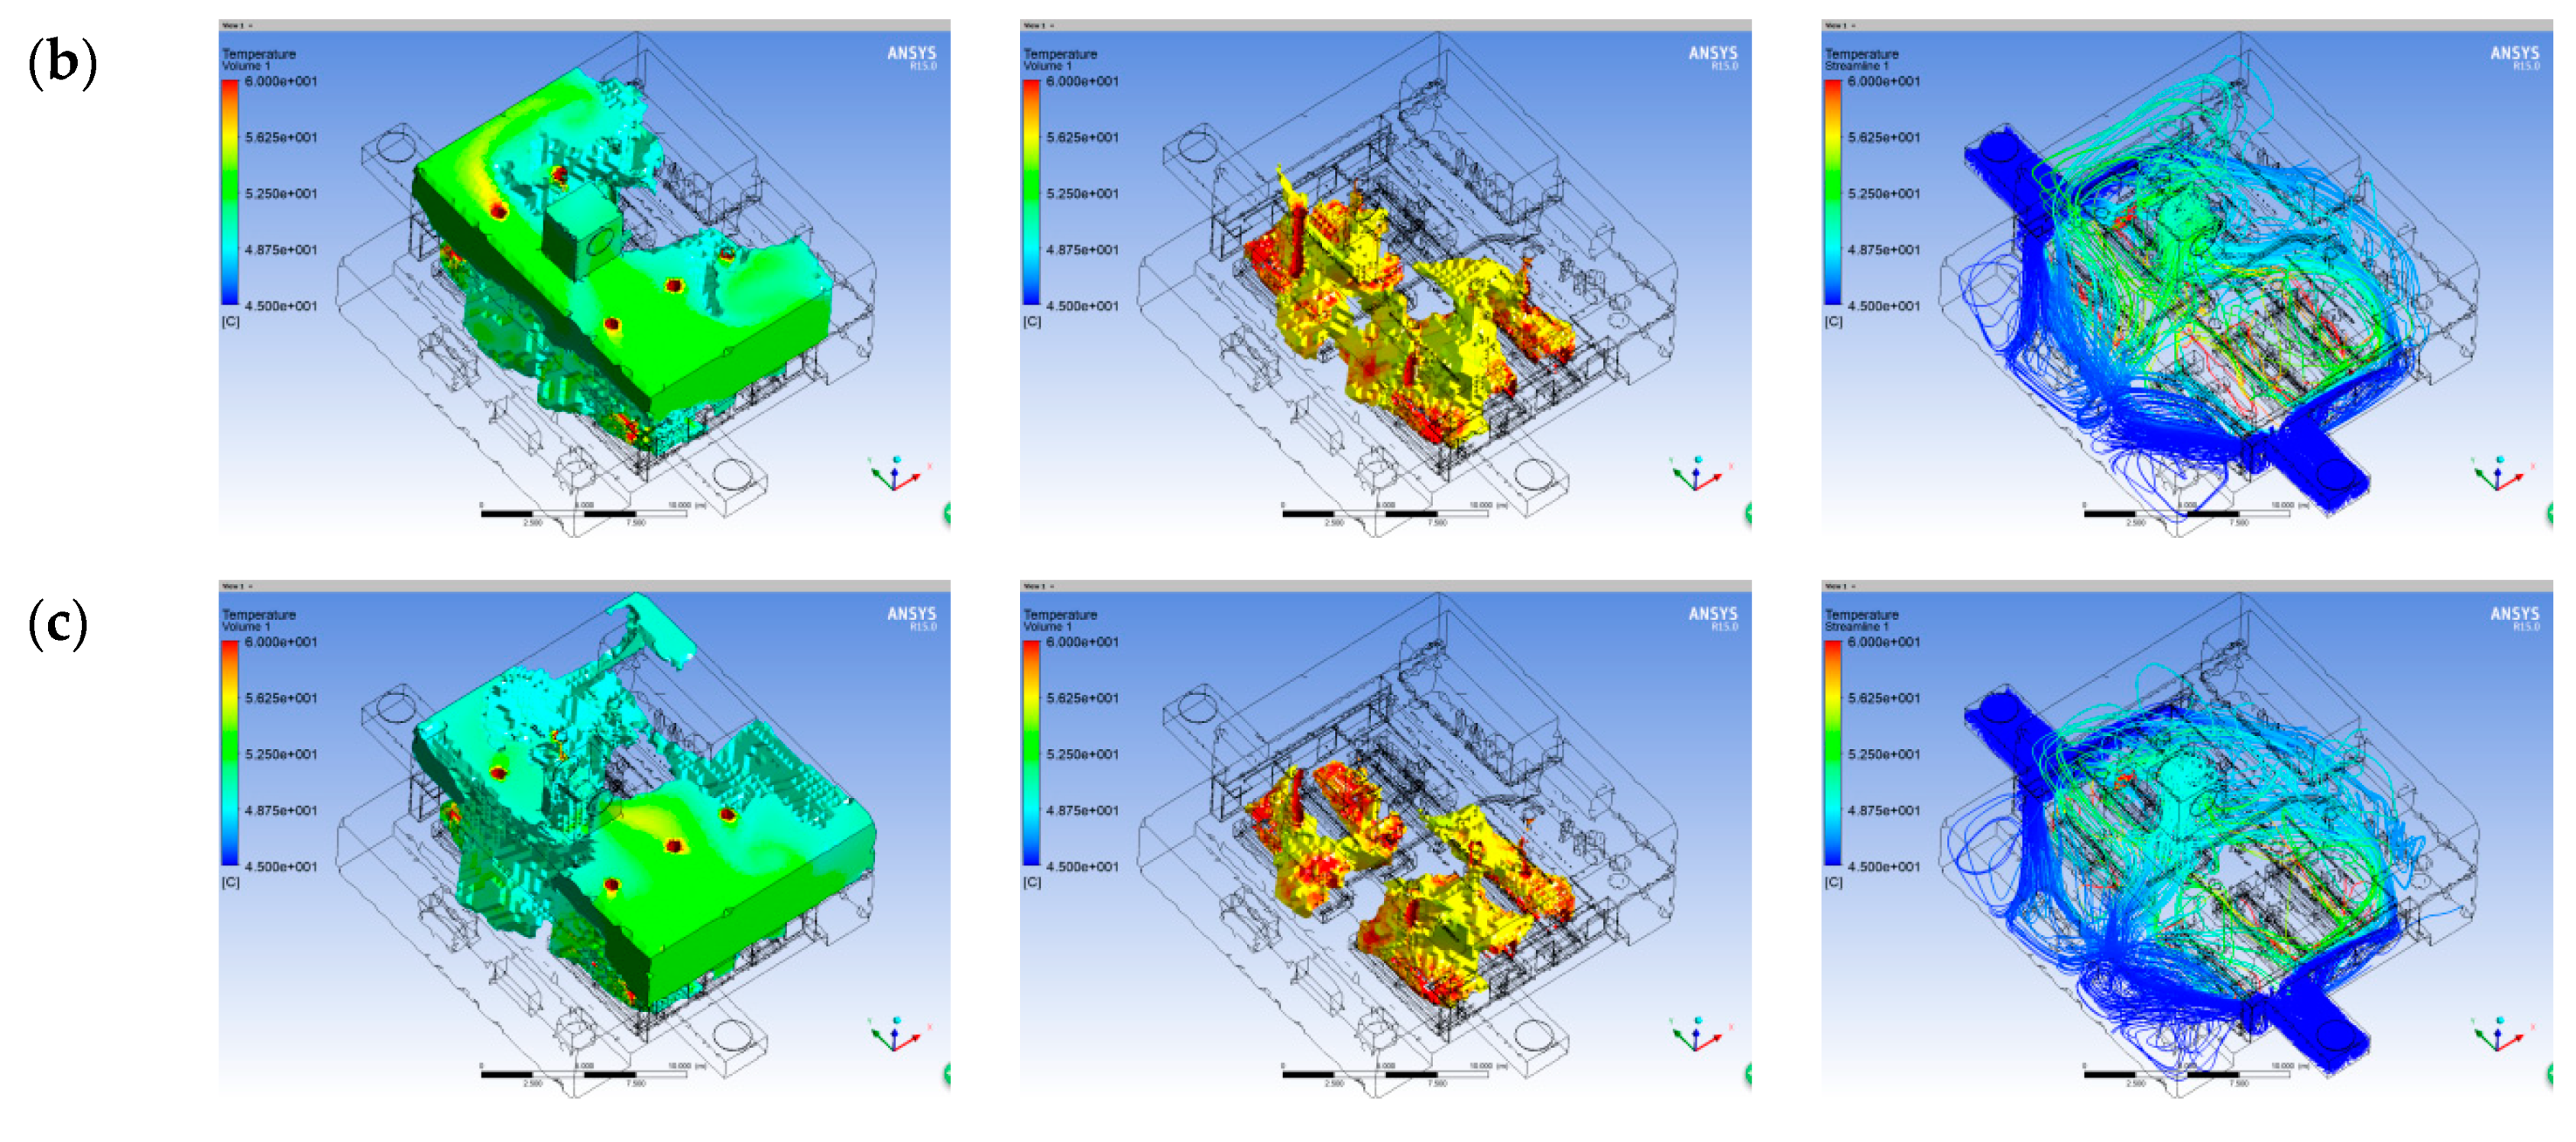
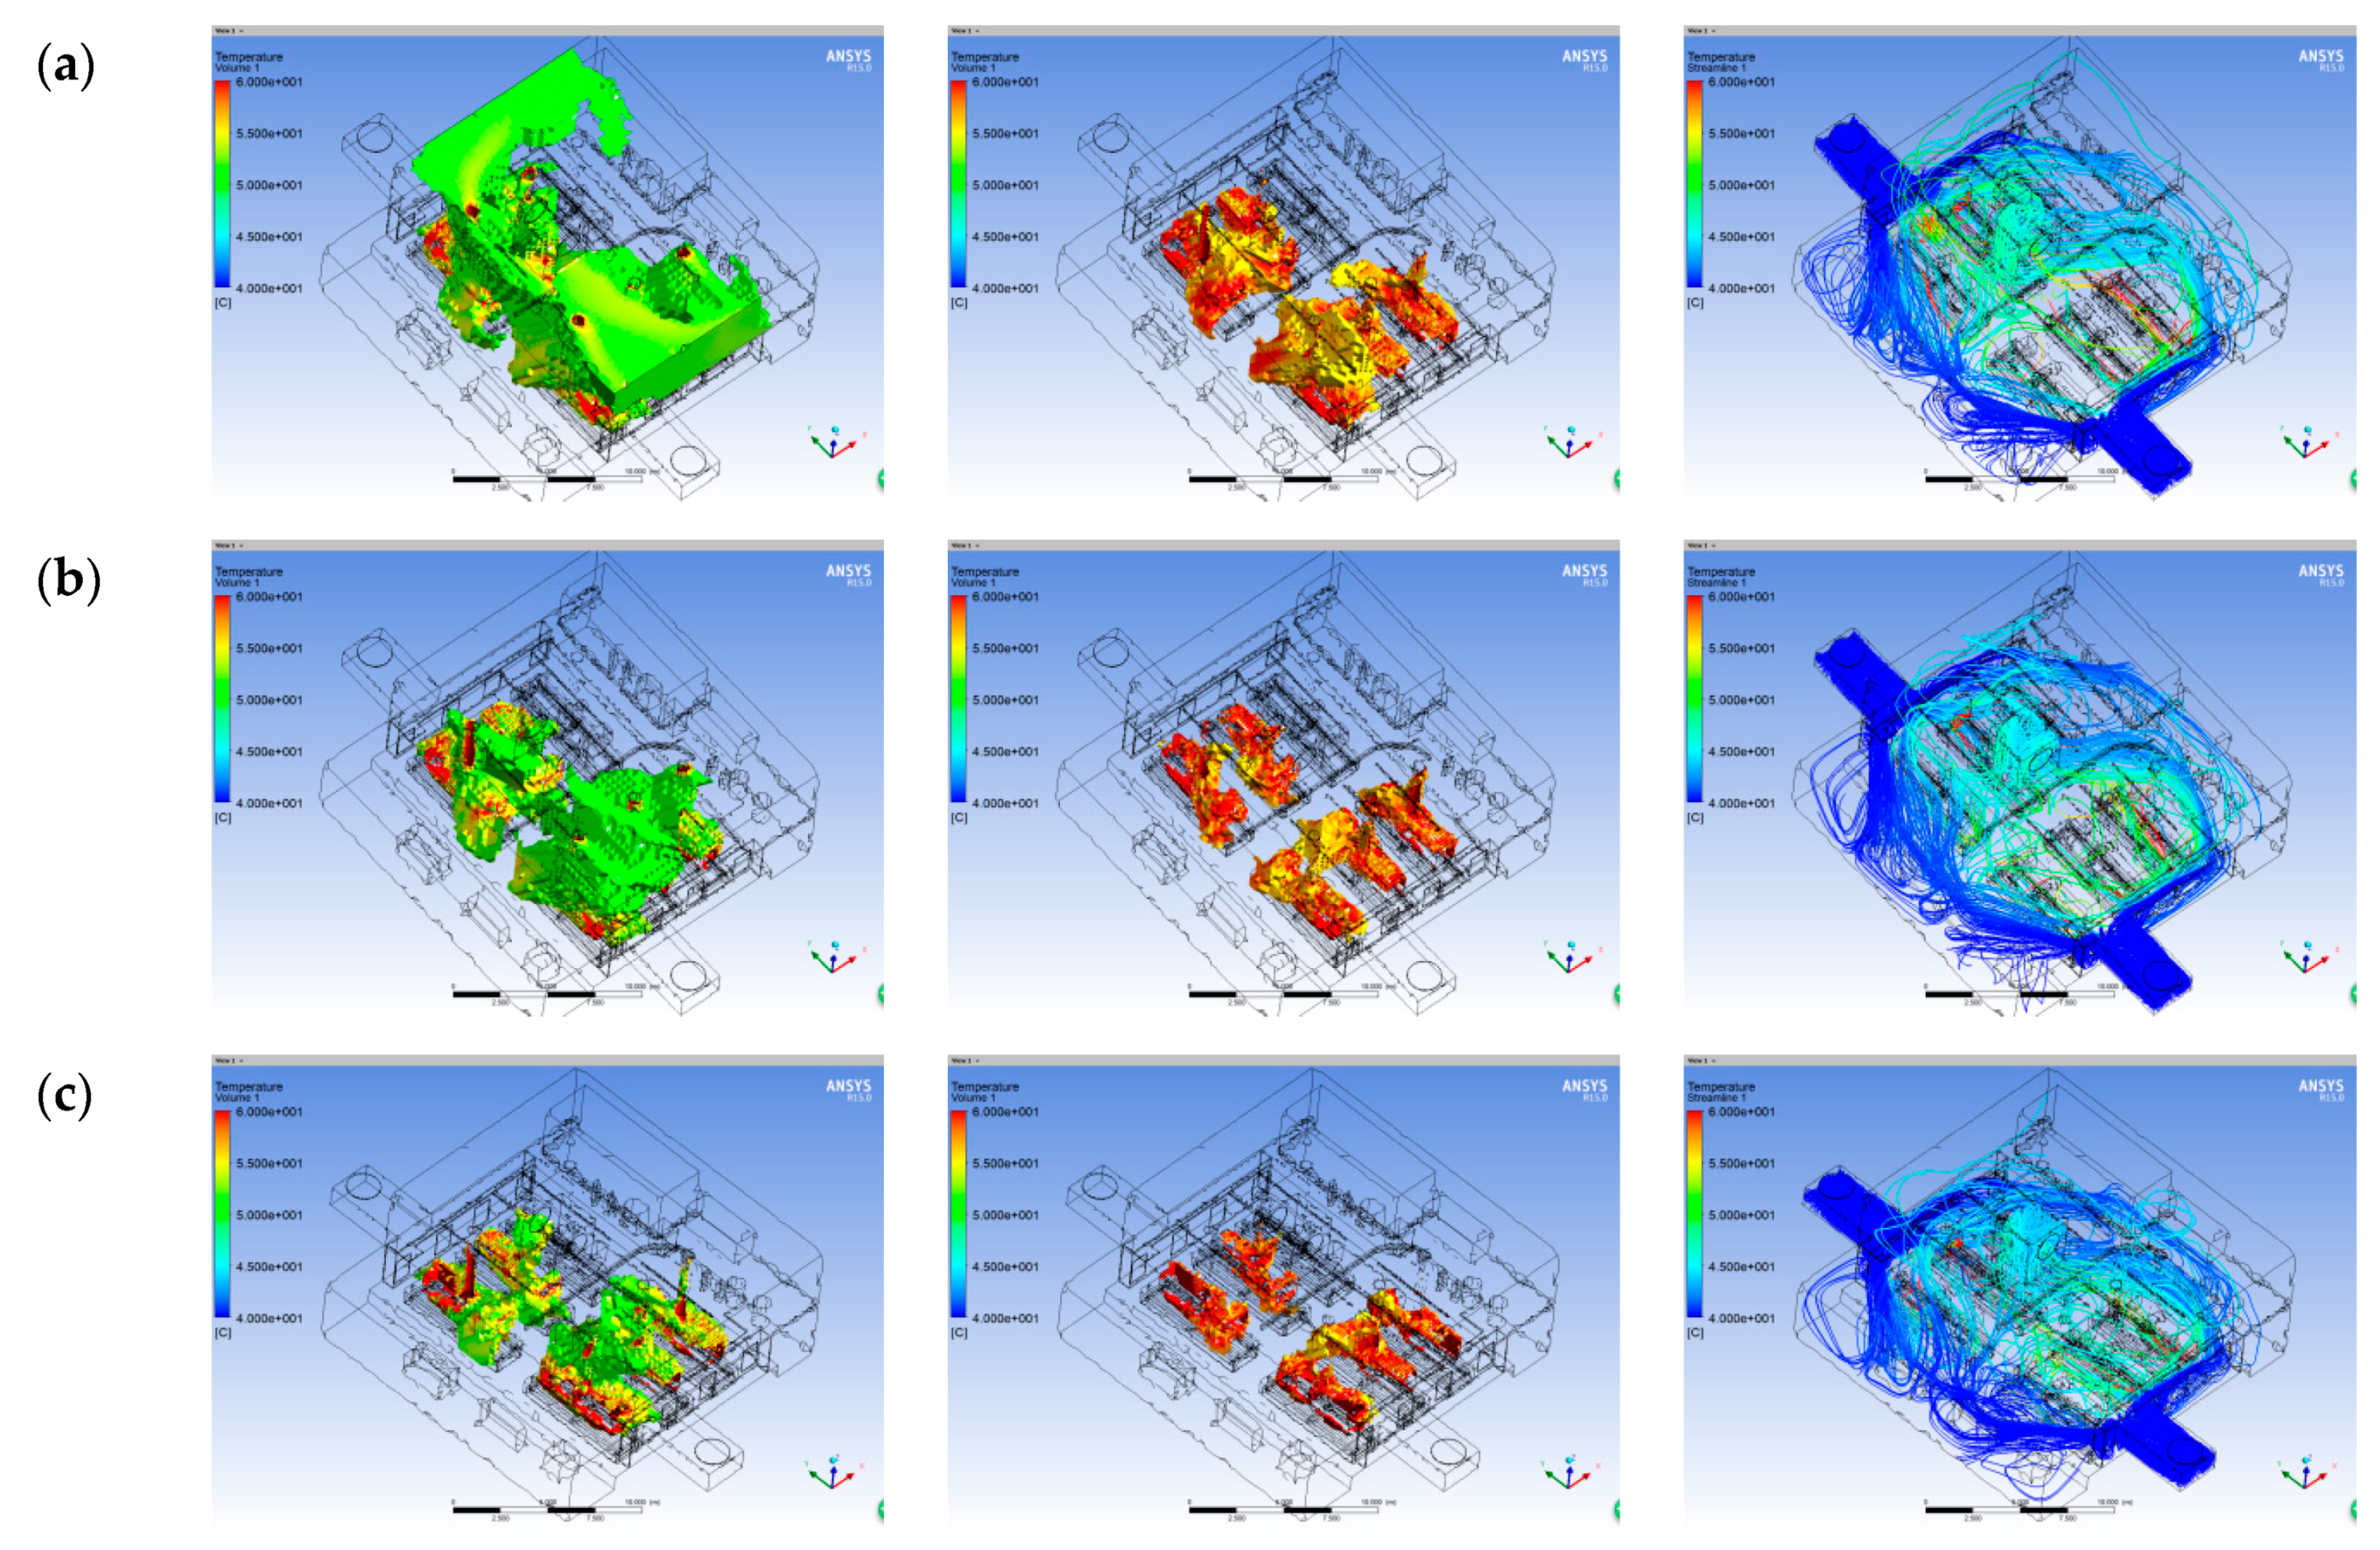
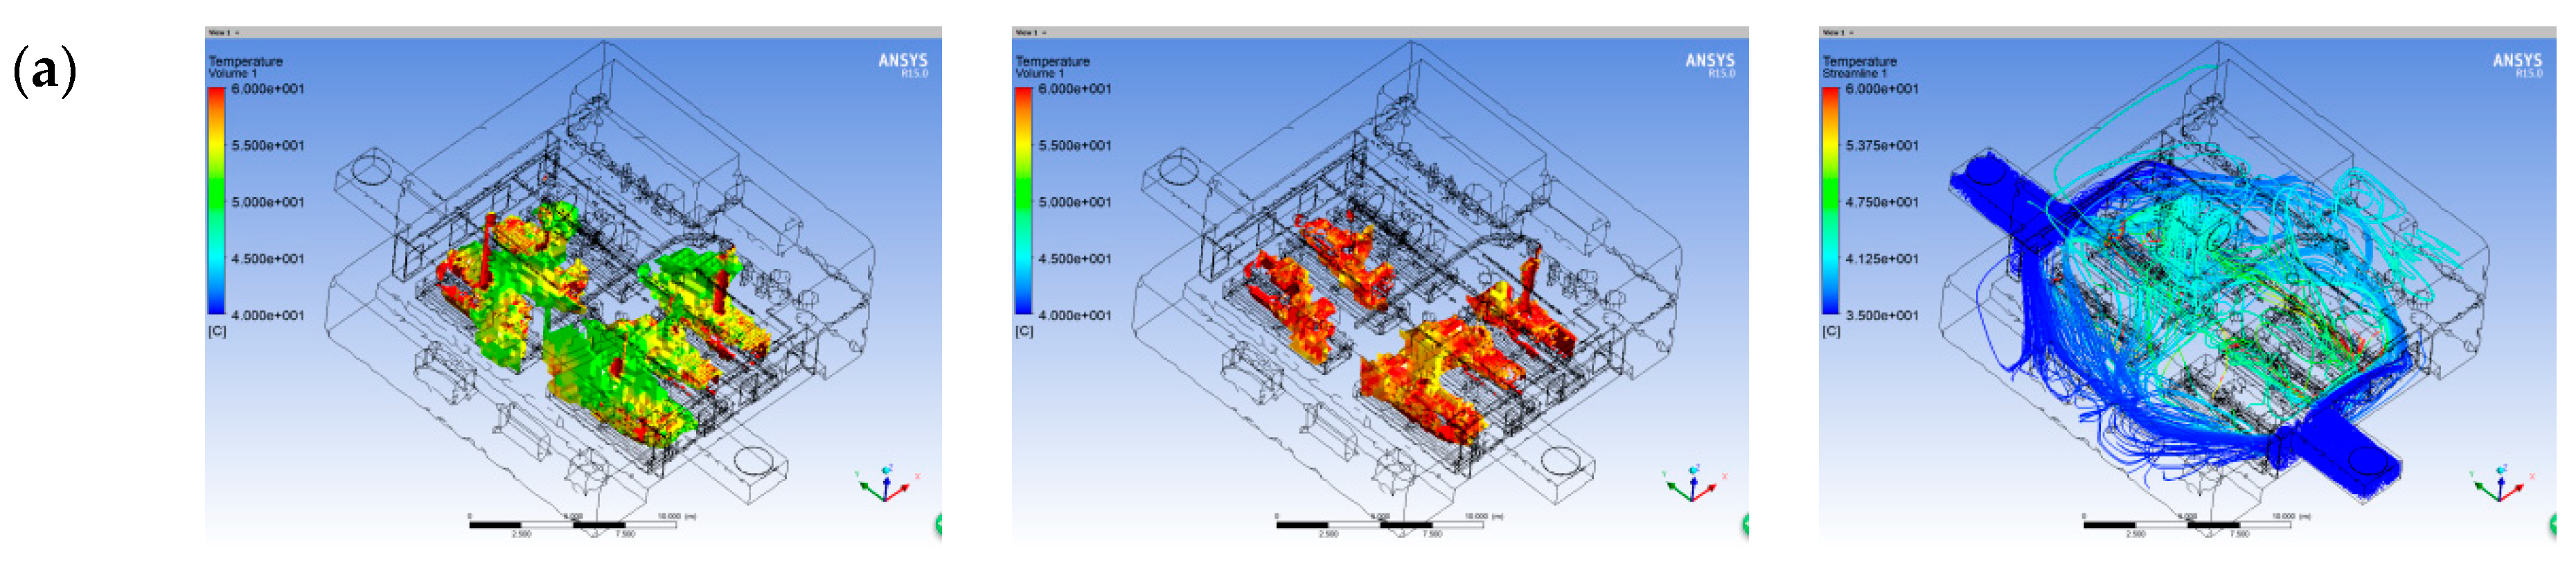
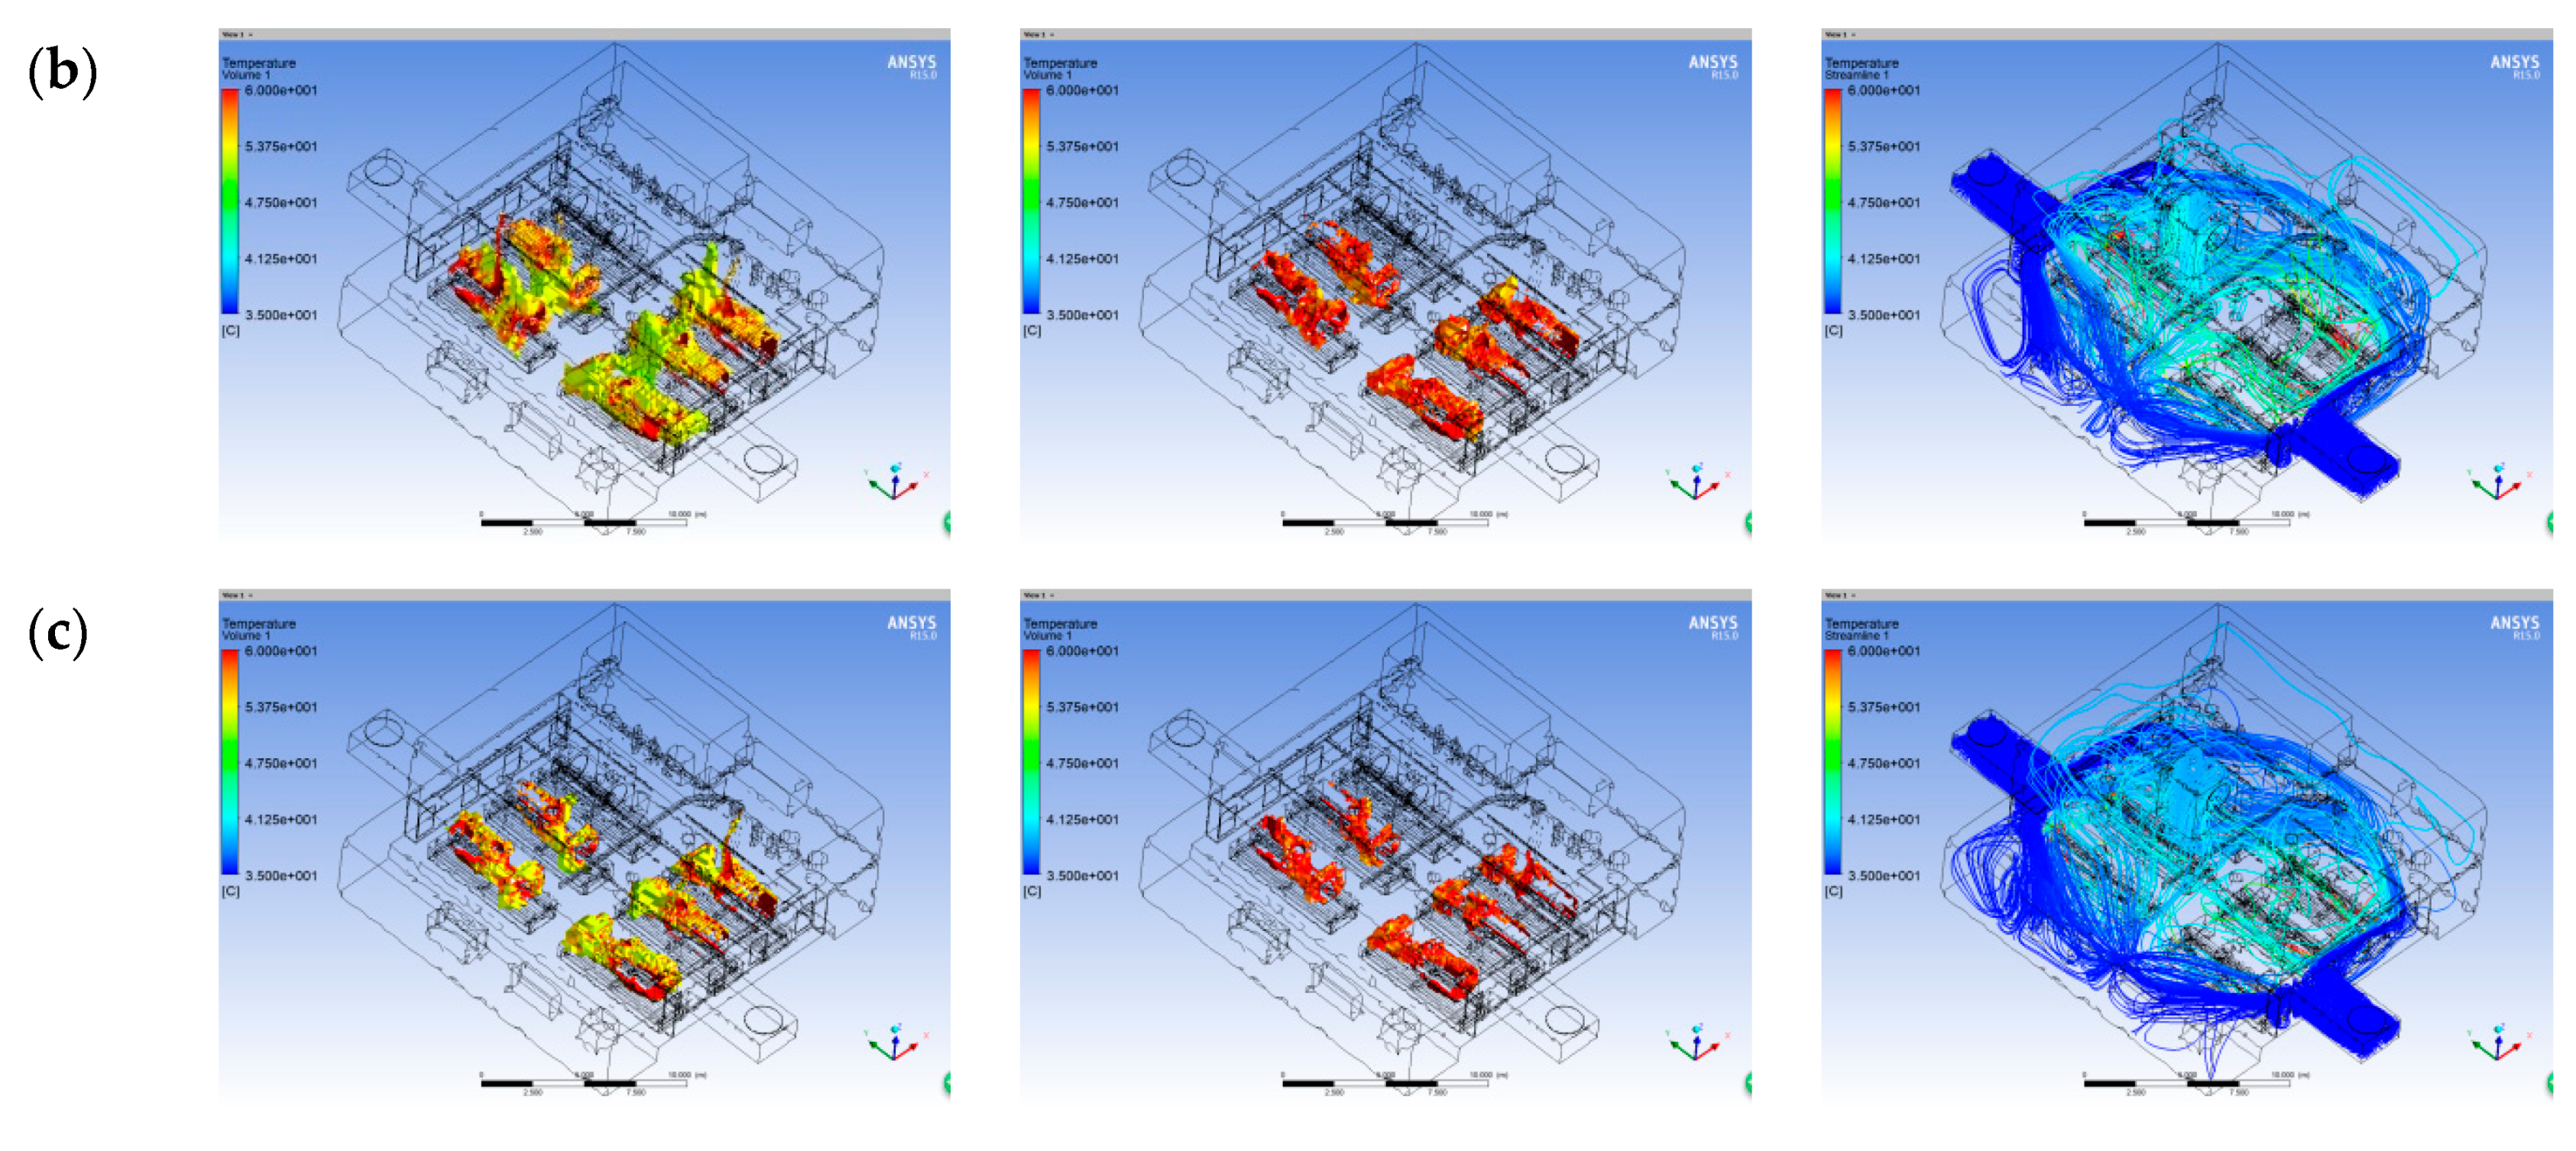
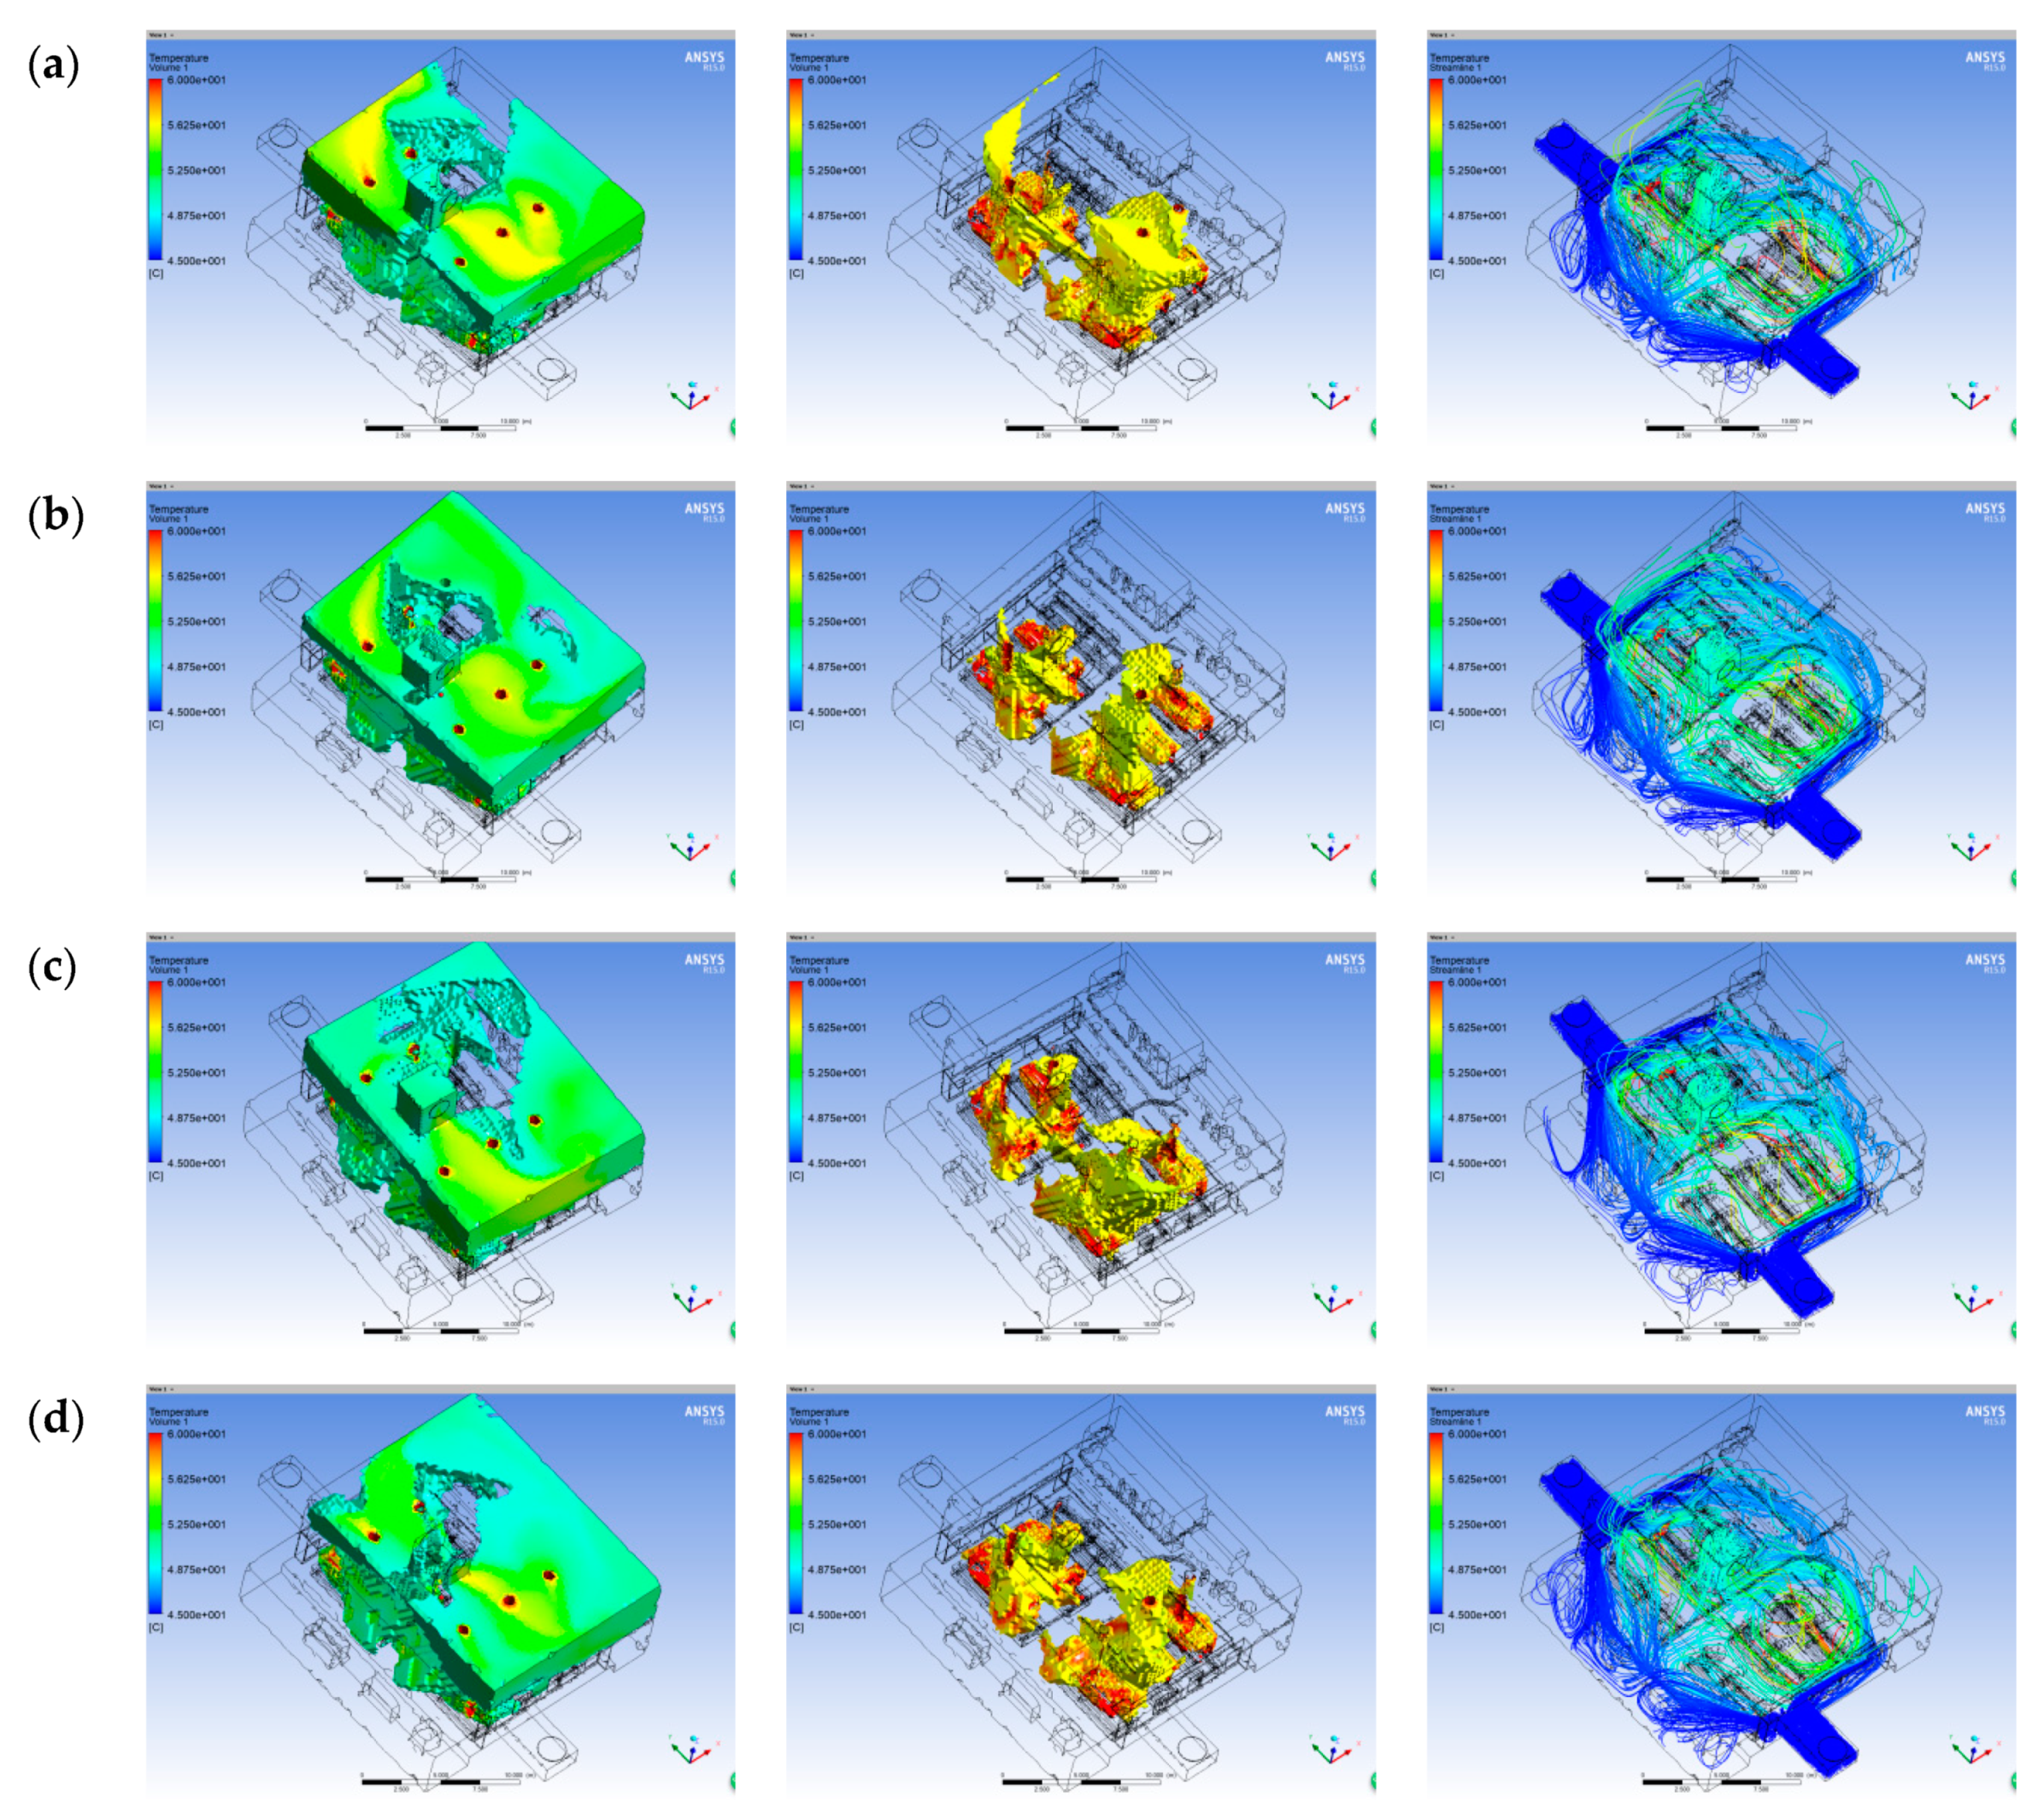
Usually, in the cabin a backup diesel engine is requested. In the present model there were six diesel engines in the cabin. So a backup engine should be selected to minimize the engine thermal effect. Because the engine units in the cabin are usually identically arranged, it is reasonable to shut down the two diesel engines in one side to analyze the heat dissipation performance of the cabin. Then, the backup engine can be selected from the side that produces the least thermal in the cabin. To this end, the engine thermal effect on the cabin temperature was investigated in three operation conditions, i.e., shutting down the two engines (b) on the left, (c) the middle, and (d) the right sides, as shown in Figure 3. The engine room was analyzed based on the high-temperature volume and local temperature. The high-temperature region above 50 °C was identified as 720.2 m3, 777.9 m3, and 610.3 m3, respectively, corresponding to the three conditions.
Furthermore, by intercepting the temperature sections at Z = 2 m and Z = 5.5 m in height as the representative temperatures of the lower and upper parts of the cabin, the average temperatures of these two sections were obtained under the three operating conditions, as shown in Table 3.
As can be seen in Table 3, there is no significant difference in the average temperatures of the two sections under the three operation conditions, which indicates that the change of the position of the shutdown engine will not cause the accumulation of local high temperature. However, the distribution of global high temperature may be significantly influenced by the backup engine position. Because in condition (d) the distribution area (i.e., 610.3 m3) of global high temperature is smaller than that in the other two conditions, it is reasonable to select one engine on the right side as the backup. In the following numerical simulation analysis, the one at the top right corner was chosen as the backup.

3. Results and Discussions

3.1. Effect of Exhaust Vent Position

The position of the exhaust vent may influence the ventilation performance. Figure 4 shows the four different arrangements of the exhaust vent. The six holes in the model represent the chimneys. The arrangement effect on the ventilation efficiency was analyzed by the density of the high-temperature streamlines in the cabin. When the number of streamlines in the cabin is constant, more red-yellow traces in streamline density indicate a larger proportion of high-temperature components in the cabin, longer vortex time in the nacelle, and more unreasonable airflow organization. Figure 5 manifests the analysis results of the streamline density.
As can be seen in Figure 5, the high-temperature traces of the arrangements in Figure 4a,c are significantly less than those of the arrangements in Figure 4b,d. In Figure 4a, the side-setting of the exhaust vents is not conducive to the smooth discharge of the cooling airflow; the airflow stays in the cabin for a long time, resulting in significant accumulation of heated gas. It should be emphasized that Figure 5 only provides the cloud and streamline maps of high temperature (>55 °C), i.e., the cloud map only displays the temperature volumes above 55 °C, while the streamline map only displays the temperature streamlines above 55 °C.
The cloud map (temperature volume > 55 °C) in each arrangement is compared in Figure 6. The temperature volumes above 55 °C in arrangements in Figure 4a,c are significantly smaller than those in arrangements in Figure 4b,d, which indicates that if the distance between the exhaust vent and the air inlet increases, the venting time of high-temperature airflow may increase. In arrangement (a), there were two exhaust vents arranged on the two sides of the cabin. The exhaust went through two sides of the cabin, so that the high-temperature volumes were slightly smaller than that in arrangement (c); however, compared with arrangement (c), the venting time in arrangement (a) was longer.
In addition, Figure 6 shows the pressure ratio between the air outlet and the exhaust vent. The pressure ratios in arrangements in Figure 4c,d increase by more than 3% when comparing with those in arrangements in Figure 4a,b, which shows that the arrangement of the exhaust vent on the cabin roof is more effective than that at the two sides with respect to ventilation performance [16]. This is because the airflow resistance [19] is significantly reduced during the cooling process if placing the exhaust vent on the cabin roof so that the high-temperature gas can be discharged effectively. As a result, arrangement (c) is more reasonable than the others.

3.2. Influence of Ventilation Temperature and Ventilation Volume

Usually, increasing ventilation volume and decreasing ventilation temperature can improve the ventilation efficiency [20]. However, improperly increasing the air volume or reducing the inlet temperature may increase economic cost and discomfort. Therefore, how to choose the optimal combination of ventilation rate and temperature is a worthy research pursuit [21].
A set of comparative simulations was carried out to investigate the effects of the ventilation temperature and ventilation volume on the ventilation performance. According to the operating conditions of the equipment and ventilation specifications, the maximum temperature of the engine room should not exceed 55 °C. As a result, we investigated three different ventilation temperatures and three different ventilation volumes in the simulation analyses. The parameter settings were (1) ventilation temperature 45 °C with three different volumes; (2) ventilation temperature 40 °C with three different volumes; and (3) ventilation temperature 35 °C with three different volumes.
Figure 7, Figure 8 and Figure 9 depict the cloud map of high-temperature volumes in the comparative simulation analyses. The nominal ventilation volume is provided by the engine manufacturer. It can be seen in Figure 7, Figure 8 and Figure 9 that with the increase of ventilation volume, the high-temperature volumes can be effectively reduced. Moreover, with the decrease of ventilation temperature, the ventilation performance can be significantly enhanced. These observations are consistent with common knowledge about the ventilation system. Hence, the present CFD calculation model and boundary settings are correct, which can be further used for control of the ventilation temperature.
When comparing the high-temperature volumes above 50 °C and 55 °C in Figure 7, Figure 8 and Figure 9, it can be seen that the high temperature around the diesel engines increases sharply, especially for three parallel units on the same side. However, the overall temperature of the cabin decreases with the decrease of the settings of the ventilation temperature and volume. Table 4 shows the amount of the high-temperature volumes in Figure 7, Figure 8 and Figure 9. As can be seen in Table 4, the ventilation temperature contributes significantly in cooling the main cabin. However, in practice one should consider the economy-to-temperature ratio. A low ventilation temperature is able to improve the cooling effect but also increases the operation cost. As a result, it is crucial to control the ventilation temperature to make a good tradeoff between in the ventilation performance and cost.

3.3. Ventilation Humidity Effects

In this research, the ventilation humidity effects that simulate the temperature control mechanism of a spray cooling system are investigated. A spray cooling system uses tiny water droplets emitted by atomizing nozzles to take away heat from the surrounding environment. The humidity of the ventilation air can help reduce the ventilation temperature. In order to study the humidity effects, four simulations with different relative humidity (RH) degrees were carried out. The relative humidity (RH) denotes the water spray effect to the ventilation air. Table 5 lists the simulation parameter settings. The ventilation temperature 45 °C and 0.75 nominal ventilation volume were used to investigate the humidity effects. Figure 10 and Table 4 show the simulation results.
As can be seen in Figure 10, when the RH is 30%, the spray cooling performance is not as good as these in the other three RH conditions. However, compared with the high-temperature volumes Figure 7a, the high temperature volumes in Figure 10a have been effectively reduced. It is also can be seen in Table 4 that the RH in the spray cooling influences the ventilation performance. When set to 50% RH, the spray cooling produces the smallest high-temperature volume above 55 °C (i.e., 124.2 m3), while when 90% RH, the smallest high-temperature volume above 50 °C is obtained (i.e., 930.8 m3).
Overall, the spray cooling system can significantly reduce the high-temperature volumes. In the present research we assumed perfect water spray; that is, the water fully and uniformly mixed with the ventilation air, such that the RH of the air can maintain a constant. Based on previous analysis results in Section 3, the lower the ventilation air the better the ventilation effect. When spraying cooling water to the ventilation air, the heat in the air can be taken away and thus the air temperature can be reduced. Generally, the more amounts of cooling water injected to the ventilation air, the lower of the ventilation air temperature. This means if RH of the ventilation air is increased, the air temperature will decrease, which will improve the ventilation performance. The temperature volumes (≥50 °C) shown in Table 6 prove this viewpoint; however, it is not always true for the temperature volumes (≥55 °C). As can be seen in Table 6, with the increase of RH, the temperature volumes above 55 °C vary. This is because with a CFD ideal gas model, the local temperature would influence the local density. In addition, in the high-temperature domain (≥55 °C), the mesh effect may influence the ventilation because the high-temperature domain is a fairly small portion of the overall domain of the simulation model (i.e., 6–11%). As a result, the variations of mesh cell size in the high-temperature cloud may impact the volumetric summation. Hence, it is unnecessary and inefficient to increase the RH value (i.e., cooling water amount) to reduce the high-temperature volumes. Considering the maximum temperature 55 °C of the engine room, a 30% or 50% RH is recommended for the ventilation air in this case study.

4. Experimental Validation

4.1. Experimental Platform

An overview of the experimental platform is illustrated in Figure 11. This platform was designed and manufactured exactly according to the simulation model at a scale of 1:10. There were six diesel engine models in the experimental platform. In order to appropriately simulate the thermal behavior of the engines, the surface geometries and materials were exactly the same as the real diesel engines in the marine cabin. Controllable heating sources (see Figure 12a) were installed on the engine models to heat the engines. Figure 12b shows an engine thermal pack. Two axial flow ventilators (Model HF-100/125, as shown in Figure 12b) were used as the ventilation sources. A digital vortex flowmeter (Model DY110, see Figure 13a) was adopted to measure the air flow, and a thermal Infrared Imager (see Figure 13c) was used to collect the engine temperature. Figure 14 shows the distribution of temperature sensors, where 46 temperature sensors (Model Pt100) were installed. A temperature reader (see Figure 15a) was used to display the sensor measurements.
Figure 15b shows the voltage-controlled power source (Model TDGC2-10KVA), which was used to control the heating sources in the experimental platform. A digital wattmeter (see Figure 15c) was used to calculate the heating power, and an intelligent pressure anemometer (Model JX-1000-1F, as shown in Figure 15d) was used to collect the pressure, air speed, and flow at the output vent.
The reason for choosing a DY-100 digital vortex flowmeter is to address the uncertainty of the measurements, in particular the measurement of the flow rate of the flowing air. Thanks to low wind resistance, the DY-100 flowmeter is capable of measuring the flow rate with very high precision, in the range of [0 3000 m3/h]. In addition, a specially designed structure was fabricated to reduce the effect of measurement uncertainty, as shown in Figure 13b and Figure 16. The tapered tubes were employed at the two ends of the flowmeter to make sure of stable air flow. The length of the flow tube connected to the flowmeter was five times that of the tube diameter, which can decrease the uncertainty of the sensor measurements.

4.2. Experimental Results

We carried out experimental tests and compared the results with the simulation. Because the spray cooling system has not been installed in the platform yet, we only compared the shutdown selection of the backup engine between the simulation and experiment. In Section 2.2, three different shutdown selections were investigated via simulations. Similarly, the same shutdown selections were tested using the experimental platform. The experimental parameter settings are listed in Table 7. In this case study, the Froude scaling law [14] was adopted to determine the volume of the ventilator. Froude scaling law requires that the Archimedes numbers of the scaled platform and the real cabin are equal, i.e.,
λ g λ l λ Δ T λ v 2 λ T = 1
where the length coefficient λ g = 1; the scaling coefficient λ l = 10; the temperature varying coefficient λ Δ T = 1; the temperature coefficient λ T = 1; the wind speed coefficient λ v = 3.16. Thus, the scaling coefficient of the ventilation volume can be calculated as
λ G = λ v λ l 2 = 316
Because the ventilation volume per ventilator in the real JU-2000E jack-up offshore platform is 182,000 m3/h, the ventilation volume per ventilator in the experimental platform is 182,000/316 = 1152 m3/h.
In Table 1, the simulation results gave the temperature sections at Z = 2 m and Z = 5.5 m in height as the representative temperatures of the lower and upper parts of the cabin. Accordingly, in the experimental validation, the temperatures at these two sections were calculated. Table 8 and Table 9 show the temperature calculation results.
As can be seen in Table 8 and Table 9, if shut down the right side engines the average and maximum temperatures at both sections are smaller than these of the other two shutdown choices. As a result, it is better to shut down one of the right side engines for the marine cabin. This conclusion is consistent with that in the simulation analysis. Hence, the simulation results in this study are reliable. We will further investigate various experimental scenarios and report the results once the spray cooling is installed in the experimental platform.

5. Conclusions

This study aims to design the ventilation system for an offshore platform cabin. Typical factors (e.g., ventilation temperature and volume) that influence the ventilation performance have been investigated in the thermodynamics analysis. A series of numerical simulations have been carried out to investigate the influence mechanisms of these factors on the ventilation efficiency. The analysis results demonstrate that (1) the top-setting of the exhaust vents is more effective than the side-setting in terms of high temperature control, (2) small values of the ventilation temperature and volume can improve the ventilation efficiency, and (3) proper shutdown selection of backup diesel engines may improve the ventilation performance. In addition, an experimental platform was established based on the simulation model to verify the shutdown selection of the backup engine. It is noticed in the analysis results that the ventilation temperature may significantly influence the cooling efficiency. Hence, the effect of humidity for the ventilation air was investigated at the nominal operation condition of the engines. The simulation results demonstrate that increasing the humidity of the ventilation air is able to reduce the high-temperature volumes; however, the ventilation performance will not become better when the humidity of the ventilation air exceeds 50% RH. A suitable humidity value is recommended between 30% and 50% RH. In the near future, we will experimentally investigate the effect of output vent position and the humidity of the ventilation air on the ventilation performance.

Author Contributions

Y.X. and Z.X. presented the algorithm; H.W. and Z.L. wrote the paper; Z.Z. and Z.L. performed the revision; R.M. and Z.L. provided analysis tool; H.W., G.L. and R.M. analyzed the data.

Funding

This work was supported by the National Science Foundation of China (No. 51606178), Key R&D project of Shandong province (No. 2017GGX40104), Fundamental Research project of Central Universities (201941008), Taishan Scholar (No. tsqn201812025) and Australia ARC DECRA (No. DE190100931).

Acknowledgments

The authors would like to thank the reviewers for their valuable and constructive comments and suggestions.

Conflicts of Interest

The authors declare no conflict of interest.

References

  1. Liu, H.; Lian, Z.; Gong, Z.; Wang, Y.; Yu, G. Thermal comfort, vibration, and noise in Chinese ship cabin environment in winter time. Build. Environ. 2018, 135, 104–111. [Google Scholar] [CrossRef]
  2. Alexey, V. Innovation and design of cruise ships. Pac. Sci. Rev. 2014, 16, 280–282. [Google Scholar] [Green Version]
  3. Li, F.; Yuan, Y.; Yan, X.; Malekian, R.; Li, Z. A study on a numerical simulation of the leakage and diffusion of hydrogen in a fuel cell ship. Renew. Sustain. Energy Rev. 2018, 97, 177–185. [Google Scholar] [CrossRef] [Green Version]
  4. Anand, M.; Sachin, K.; Shyam, R. Development of ship-specific recycling plan to improve health safety and environment in ship recycling yards. J. Clean. Prod. 2016, 116, 279–298. [Google Scholar]
  5. Cheng, Y.; Zhang, S.; Huan, C.; Oladokun, M.; Lin, Z. Optimization on fresh outdoor air ratio of air conditioning system with stratum ventilation for both targeted indoor air quality and maximal energy saving. Build. Environ. 2019, 147, 11–22. [Google Scholar] [CrossRef]
  6. You, R.; Zhang, Y.; Zhao, X.; Lin, C.H.; Wei, D.; Liu, J.; Chen, Q. An innovative personalized displacement ventilation system for airliner cabins. Build. Environ. 2018, 137, 41–50. [Google Scholar] [CrossRef]
  7. Pang, L.; Li, P.; Bai, L.; Liu, D.; Zhou, Y.; Yao, J. Optimization of air distribution mode coupled interior design for civil aircraft cabin. Build. Environ. 2018, 134, 131–145. [Google Scholar] [CrossRef]
  8. Farag, A.M. Thermal comfort investigation for commercial aircraft cabin by using CFD. In Proceedings of the 2018 IEEE Aerospace Conference, Big Sky, MT, USA, 3–10 March 2018; IEEE: New York, NY, USA, 2018; pp. 1–10. [Google Scholar]
  9. Maier, J.; Marggraf-Micheel, C.; Zinn, F.; Dehne, T.; Bosbach, J. Ceiling-based cabin displacement ventilation in an aircraft passenger cabin: Analysis of thermal comfort. Build. Environ. 2018, 146, 29–36. [Google Scholar] [CrossRef]
  10. Kolhe, M.; Adhikari, S.; Muneer, T. Parked electric car’s cabin heat management using photovoltaic powered ventilation system. Appl. Energy 2019, 233, 403–411. [Google Scholar] [CrossRef]
  11. He, W.; Chen, D.; Fan, H.; Duan, X. Thermal comfort analysis based on PMV/PPD in cabins of manned submersibles. Build. Environ. 2018, in press. [Google Scholar]
  12. Jiang, Y.; Song, F.; Li, Y. Numerical simulation of ventilation and analysis in ship engine room. Ship Sci. Technol. 2012, 34, 52–55. [Google Scholar]
  13. Landsman, J.; Brager, G.; Doctor-Pingel, M. Performance, prediction, optimization, and user behavior of night ventilation. Energy Build. 2018, 166, 60–72. [Google Scholar] [CrossRef] [Green Version]
  14. Zhou, S. Numerical Simulation of Thermal Environment in Diesel Engine Room. Master’s Thesis, Dalian Maritime University, Dalian, China, 2010. [Google Scholar]
  15. Siddique, W.; Shevchuk, I.; El-Gabry, L.; Hushmandi, N.; Fransson, T. On flow structure, heat transfer and pressure drop in varying aspect ratio two-pass rectangular channel with ribs at 45. Heat Mass Transf. 2013, 49, 679–694. [Google Scholar] [CrossRef]
  16. Fasquelle, A.; Pellé, J.; Harmand, S.; Shevchuk, I. Numerical study of convective heat transfer enhancement in a pipe rotating around a parallel axis. J. Heat Transf. 2014, 136, 051901. [Google Scholar] [CrossRef]
  17. Avramenko, A.; Dmitrenko, N.; Shevchuk, I.; Tyrinov, A.; Shevchuk, V. Heat transfer of incompressible flow in a rotating microchannel with slip boundary conditions of second order. Int. J. Numer. Methods Heat Fluid Flow 2019, 29, 1786–1814. [Google Scholar] [CrossRef]
  18. Liu, L.; Huang, H. Ventilation design of ship engine room. Shandong Ind. Technol. 2015, 21, 246. [Google Scholar]
  19. Cai, F. Numerical Simulation of the Influence of Air Distribution on Indoor Air Quality. Master’s Thesis, Huazhong University of Science and Technology, Wuhan, China, 2005. [Google Scholar]
  20. Zeng, H.; Zhou, X. Comparative analysis of design methods for marine engine room ventilation system. Chin. Shipbuild. 2016, 57, 201–205. [Google Scholar]
  21. He, H.; Zhai, G.; Di, J. Discussion on ship ventilation system layout. J. Shanghai Inst. Ship Transp. Sci. 2017, 40, 29–31. [Google Scholar]
Figure 1. Three-dimensional model of the main cabin of the offshore platform.
Applsci 09 03185 g001
Figure 2. (a) Overall layout of engine room; (b) Details of the diesel engine module; (c) Ventilation design; (d) Exhaust gas passage.
Applsci 09 03185 g002aApplsci 09 03185 g002b
Figure 3. Shutdown order: (a) overview, (b) left side, (c) middle side, and (d) right side.
Applsci 09 03185 g003
Figure 4. Four different arrangements of the exhaust vent: (a) left side arrangement, (b) left-right sides arrangement, (c) left-side and left-roof arrangement, and (d) left-side and right-roof arrangement.
Applsci 09 03185 g004
Figure 5. Cloud and streamline maps of the high-temperature distributions (>55 °C). Volume sizes of the four arrangements are: (a) 589.1 m3, (b) 645.3 m3, (c) 418.7 m3, and (d) 593.9 m3.
Applsci 09 03185 g005aApplsci 09 03185 g005b
Figure 6. High-temperature region and air outlet–exhaust vent pressure ratio.
Applsci 09 03185 g006
Figure 7. High-temperature volumes above 50 and 55 °C, and temperature streamlines between 45 and 60 °C in the conditions of (a) ventilation temperature 45 °C with 0.75 nominal ventilation volume, (b) 45 °C with nominal volume, and (c) 45 °C with 1.25 nominal volume.
Applsci 09 03185 g007aApplsci 09 03185 g007b
Figure 8. High-temperature volumes above 50 and 55 °C, and temperature streamlines between 45 and 60 °C in the conditions of (a) ventilation temperature 40 °C with 0.75 nominal volume, (b) 40 °C with nominal volume, and (c) 40 °C with 1.25 nominal volume.
Applsci 09 03185 g008
Figure 9. High-temperature volumes above 50 and 55 °C, and temperature streamlines between 45 and 60 °C in the conditions of (a) ventilation temperature 35 °C with 0.75 nominal volume, (b) 35 °C with nominal volume, and (c) 35 °C with 1.25 nominal volume.
Applsci 09 03185 g009aApplsci 09 03185 g009b
Figure 10. High-temperature volumes above 50 and 55 °C, and temperature streamlines between 45 and 60 °C with different spray cooling settings in Table 5: (a) 30% RH, (b) 50% RH, (c) 70% RH, and (d) 90% RH.
Applsci 09 03185 g010
Figure 11. Diagram and image of the experimental platform.
Applsci 09 03185 g011
Figure 12. Images of (a) heating sources and engine models, (b) engine thermal pack, and (c) axial flow ventilator.
Applsci 09 03185 g012
Figure 13. Images of (a) digital vortex flowmeter, (b) connection of vortex flowmeter and ventilator, and (c) thermal Infrared Imager.
Applsci 09 03185 g013
Figure 14. Illustration of (a) distribution of temperature sensors, (b) sensor locations, and (c) a PT100 temperature sensor.
Applsci 09 03185 g014
Figure 15. Images of (a) temperature display, (b) voltage-controlled power source, (c) digital wattmeter and (d) intelligent pressure anemoscope.
Applsci 09 03185 g015
Figure 16. Installation of the DY-100 digital vortex flowmeter.
Applsci 09 03185 g016
Table 1. Grid-independence validation at the ventilation condition of 20 °C and 600 m3/h.
Grid NumberTVo
1,490,0007.54 °C6.94 m/s
1,840,0006.32 °C8.37 m/s
2,170,0006.40 °C8.51 m/s
Table 2. Performance comparison of different turbulence models.
Turbulence ModelTVo
Standard k-ε6.32 °C8.37 m/s
RNG k-ε6.51 °C8.69 m/s
Standard k-ω6.44 °C8.53 m/s
SST k-ω6.74 °C8.90 m/s
Table 3. Section temperature and working condition.
SectionCondition (b)Condition (c)Condition (d)
Z = 2 m49.75 °C50.55 °C50.55 °C
Z = 5.5 m50.55 °C50.75 °C50.25 °C
Table 4. Isothermal areas of the high-temperature regions.
Ventilation TemperatureNominal VolumeTemperature Volumes
(≥50 °C)
Temperature Volumes
(≥55 °C)
45 °C0.751214.8 m3434.1 m3
1884.7 m3173.2 m3
1.25805.5 m3108.3 m3
40 °C0.75471.2 m3105.6 m3
1242.4 m344.1 m3
1.2575.7 m318.4 m3
35 °C0.7593.2 m336 m3
142.9 m316 m3
1.2518.2 m37.8 m3
Table 5. Settings of the spray cooling simulations.
No.Ventilation TemperatureRHDensity (kg/m3)Specific Heat [kJ/(kg·°C)]Heat Conductivity [W/(m·°C)]Dynamic Viscosity (Pa·s)
(a)45 °C30%1.0981.04190.02741.91 × 10−5
(b)45 °C50%1.091.06630.02741.89 × 10−5
(c)45 °C70%1.08221.0920.02741.876 × 10−5
(d)45 °C90%1.07431.11940.02741.858 × 10−5
Table 6. Isothermal areas of the high-temperature regions.
No.Temperature Volumes (≥50 °C)Temperature Volumes (≥55 °C)
(a) 30% RH996.1 m3220.3 m3
(b) 50% RH976.5 m3124.2 m3
(c) 70% RH947.1 m3152.9 m3
(d) 90% RH930.8 m3158.8 m3
Without spray cooling1214.8 m3434.1 m3
Table 7. Engine shutdown test results.
ShutdownVentilation TemperatureVentilation Volumes
Left side engines22 °C1152 m3/h
Middle engines22 °C1152 m3/h
Right side engines22 °C1152 m3/h
Table 8. Temperatures at Section Z = 2 m.
ShutdownAverageMaximumMinimum
Left side engines35.09 °C47.8 °C26.2 °C
Middle engines36.09 °C47.2 °C21.2 °C
Right side engines33.72 °C40.7 °C22.1 °C
Table 9. Temperatures at Section Z = 5.5 m.
ShutdownAverageMaximumMinimum
Left side engines35.78 °C48.2 °C25.1 °C
Middle engines36.96 °C48.1 °C21.8 °C
Right side engines34.85 °C42.3 °C22.3 °C

