Article

An Improved Method for Estimating Renal Dimensions; Implications for Management of Kidney Disease

Department of Preclinical Research, Angion Biomedica Corp, Uniondale, NY 11553, USA
*
Author to whom correspondence should be addressed.
These authors contributed equally to this work.
Submission received: 23 June 2019 / Revised: 2 August 2019 / Accepted: 2 August 2019 / Published: 6 August 2019
(This article belongs to the Section Applied Biosciences and Bioengineering)

Abstract

:

Featured Application

The study reports an improvement of the ellipse-based formula to better estimate renal dimensions and transform the management of kidney disease. More accurate determination of renal dimensions can inform progression of renal disease including scarring and polycystic kidney disease, can better match a kidney donor with a prospective recipient and guide excision of renal tumors.

Abstract

Changes in renal dimensions, including total kidney volume, not only inform ongoing renal disease but also disease progression. Determination of renal dimensions can inform drug efficacy, is important for matching recipients with potential donors, and to inform debulking of renal tumors. Imaging of kidney and application of the ellipse-based formula has become standard for estimating renal dimensions. Nevertheless, the existing ellipse-based formula underestimates renal dimensions including total kidney volume, regardless of the imaging modality used. Based on a model of murine kidney disease, this laboratory has previously proposed a modification to this formula which exhibits better estimation of renal dimensions. The present study sought to determine whether this modified formula is applicable to additional models of kidney disease. Kidneys were sourced from etiologically distinct murine and rat models of renal scarring. In each case, renal dimensions calculated using the existing ellipse-based formula was significantly lesser than the measured dimensions. By contrast, there was no difference between the measured dimensions and those calculated using the modified formula. In a model of polycystic kidney disease, total kidney volume calculated using the existing formula significantly underestimated measured kidney volume whereas use of the modified formula yielded a calculated kidney volume in excellent agreement with the measured volume. Use of this modified formula provides a better estimate of renal dimensions across a number of disease models.

Graphical Abstract

1. Introduction

Accurate determination of renal dimensions is important in that it can inform presence and progression of chronic kidney disease (CKD) [1,2,3] and polycystic kidney disease (PKD) [4,5,6], inform inclusion criteria in PKD trials, and assessment of response to drugs in those trials [7]. Measurement of renal dimensions is critical to inform suitability of the donor kidney for implantation in the recipient especially within the pediatric population and patency of the transplanted kidney [8,9,10]. Determination of total kidney volume (TKV) is critical for debulking of renal tumors as remnant nephron mass will govern renal function. Due to the significant role that renal dimensions play in monitoring renal disease, accurate determination of renal dimensions is critical.
Renal imaging followed by use of an ellipse-based formula is most frequently used to estimate renal dimensions [11,12,13,14]. Nevertheless, data from a number of studies [11,12,13,15] indicate that use of this formula underestimates actual renal dimensions regardless of the typical imaging modality used i.e., ultrasonography or magnetic resonance imaging (MRI). In fact, the ellipse-based formula underestimates total kidney volume (TKV) by up to 29% [13,15] compared to the kidney volume calculated using the more sophisticated but labor-intensive magnetic resonance imaging-based voxel count method or measured at autopsy using the gold standard fluid displacement method. Using a murine model of kidney disease, this laboratory proposed [16] a modification to the current ellipse-based formula for estimating renal dimensions which demonstrated enhanced fidelity to the measured dimensions. In the present study, we sourced kidneys from multiple models of renal disease and PKD to determine whether the modified ellipse-based formula will produce a more accurate representation of actual renal dimensions.

2. Materials and Methods

2.1. Animal Models

The study protocol (#2016-004), was approved by the animal care and use committee of Angion (Uniondale, NY, USA). All animals were allowed to acclimatize for a minimum of 5 days prior to use and had free access to water and standard rodent chow.
Kidneys (Table 1) were retrieved (under ketamine/xylazine anesthesia (25/5 mg/kg intraperitoneal) from adult male and female obese ZSF1 rats (Charles River, New York, NY, USA) at ~6 mo of age, and adult male and female PCK rats [6] at ~8 mo of age and healthy adult male Sprague-Dawley (SD) rats at ~6 mo of age. Separately, adult male SD rats (Charles River, NY, USA) were injected with purumoycin aminonucleoside (PAN, 100 mg/kg, intraperitoneal or vehicle) and left and right kidneys retrieved 2 mo later when animals were ~6 mo of age. Adult male CD-1 mice (~30 g, Charles River, New York, NY, USA) were administered aristolochic acid (5 mg/kg/week × 3 weeks, intraperitoneal) + NaCl (1% in drinking water) for a total of 2 mo [17]. A sham cohort of CD-1 mice received vehicle injection and regular water. Two months into the study, animals were sacrificed and kidneys were retrieved. Adult male and female 129/Sv mice (Charles River, NY, USA) received an injection of streptocozocin (STZ, 100 mg/kg/week × 3 weeks, intraperitoneal) or vehicle (0.05 M sodium citrate buffer, pH 4.5) [18]. The STZ cohort was provided 1% NaCl in drinking water. Animals were sacrificed 2 mo into the study and kidneys retrieved. All kidneys were sliced coronally and rested in 10% formalin for subsequent sectioning of 5 µm apart. The coronal sections were stained with hematoxylin and eosin (H&E), Masson’s Trichrome or periodic acid Schiff.

2.2. Renal Parenchymal Area Determination

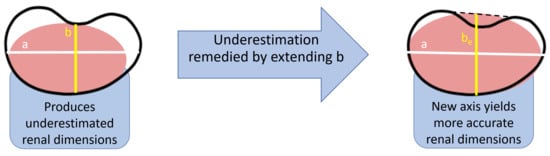
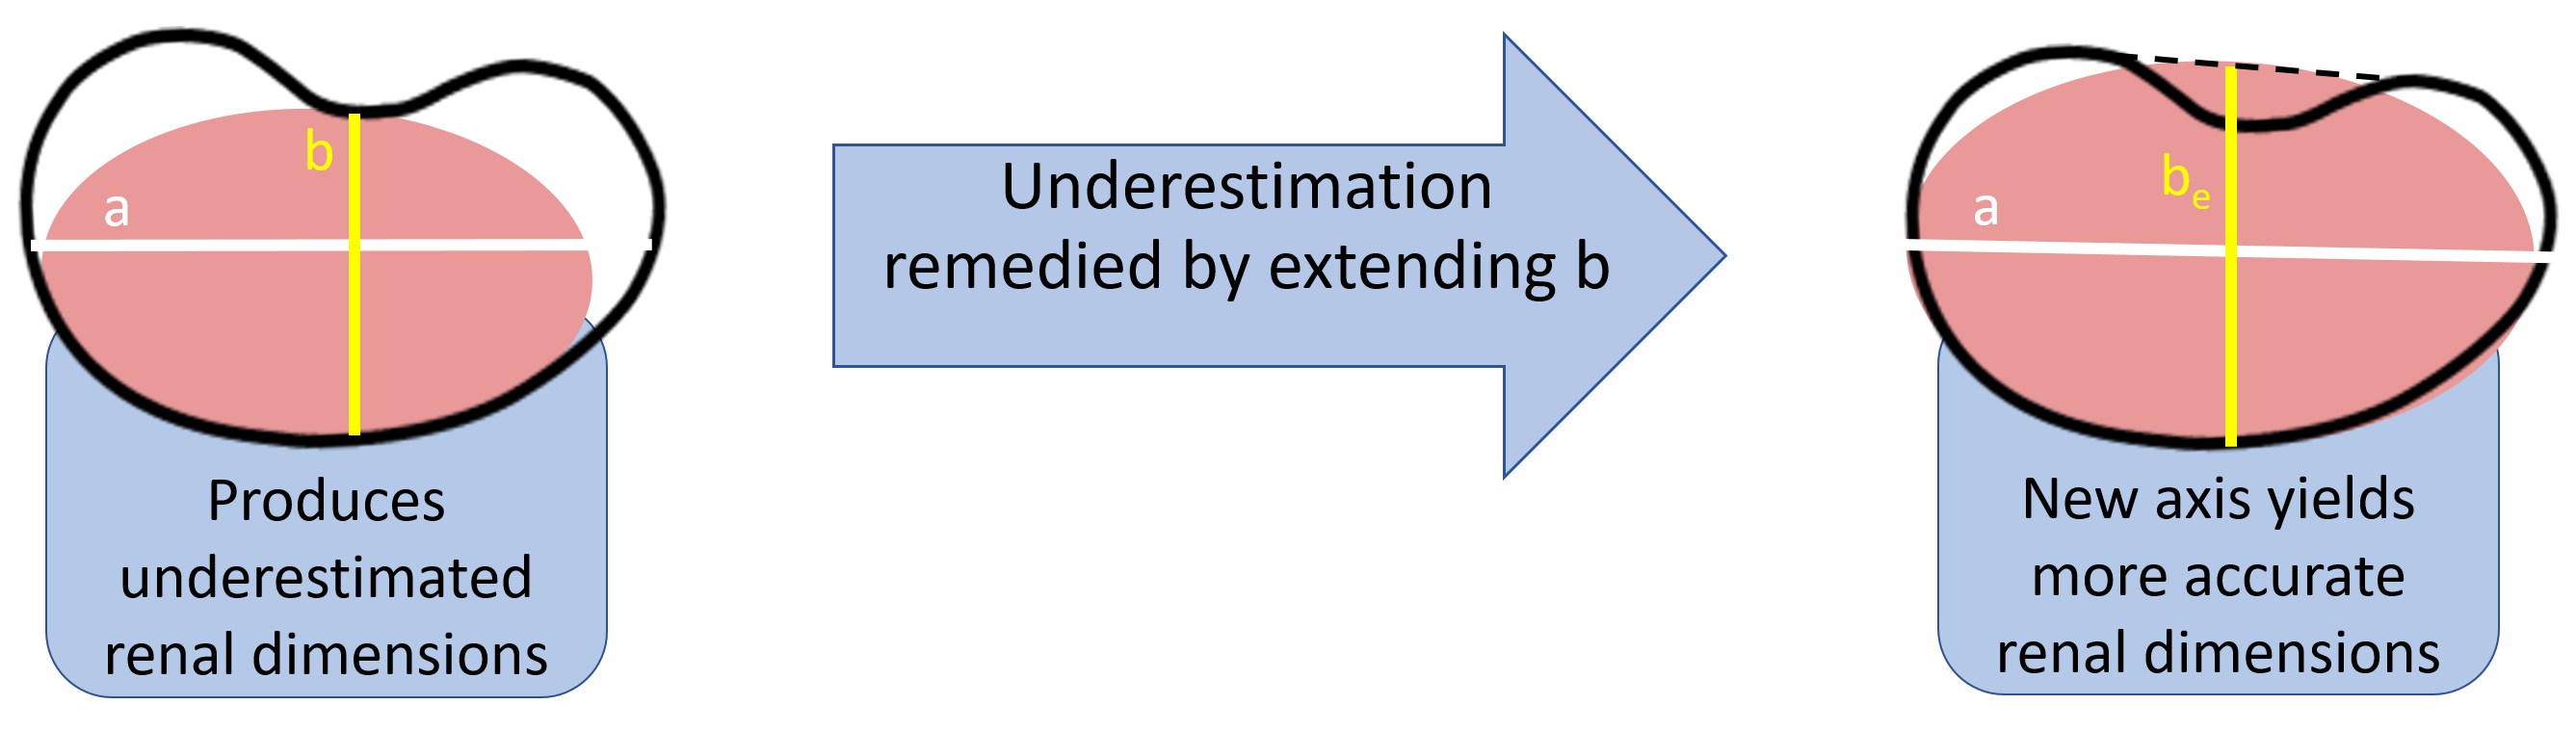
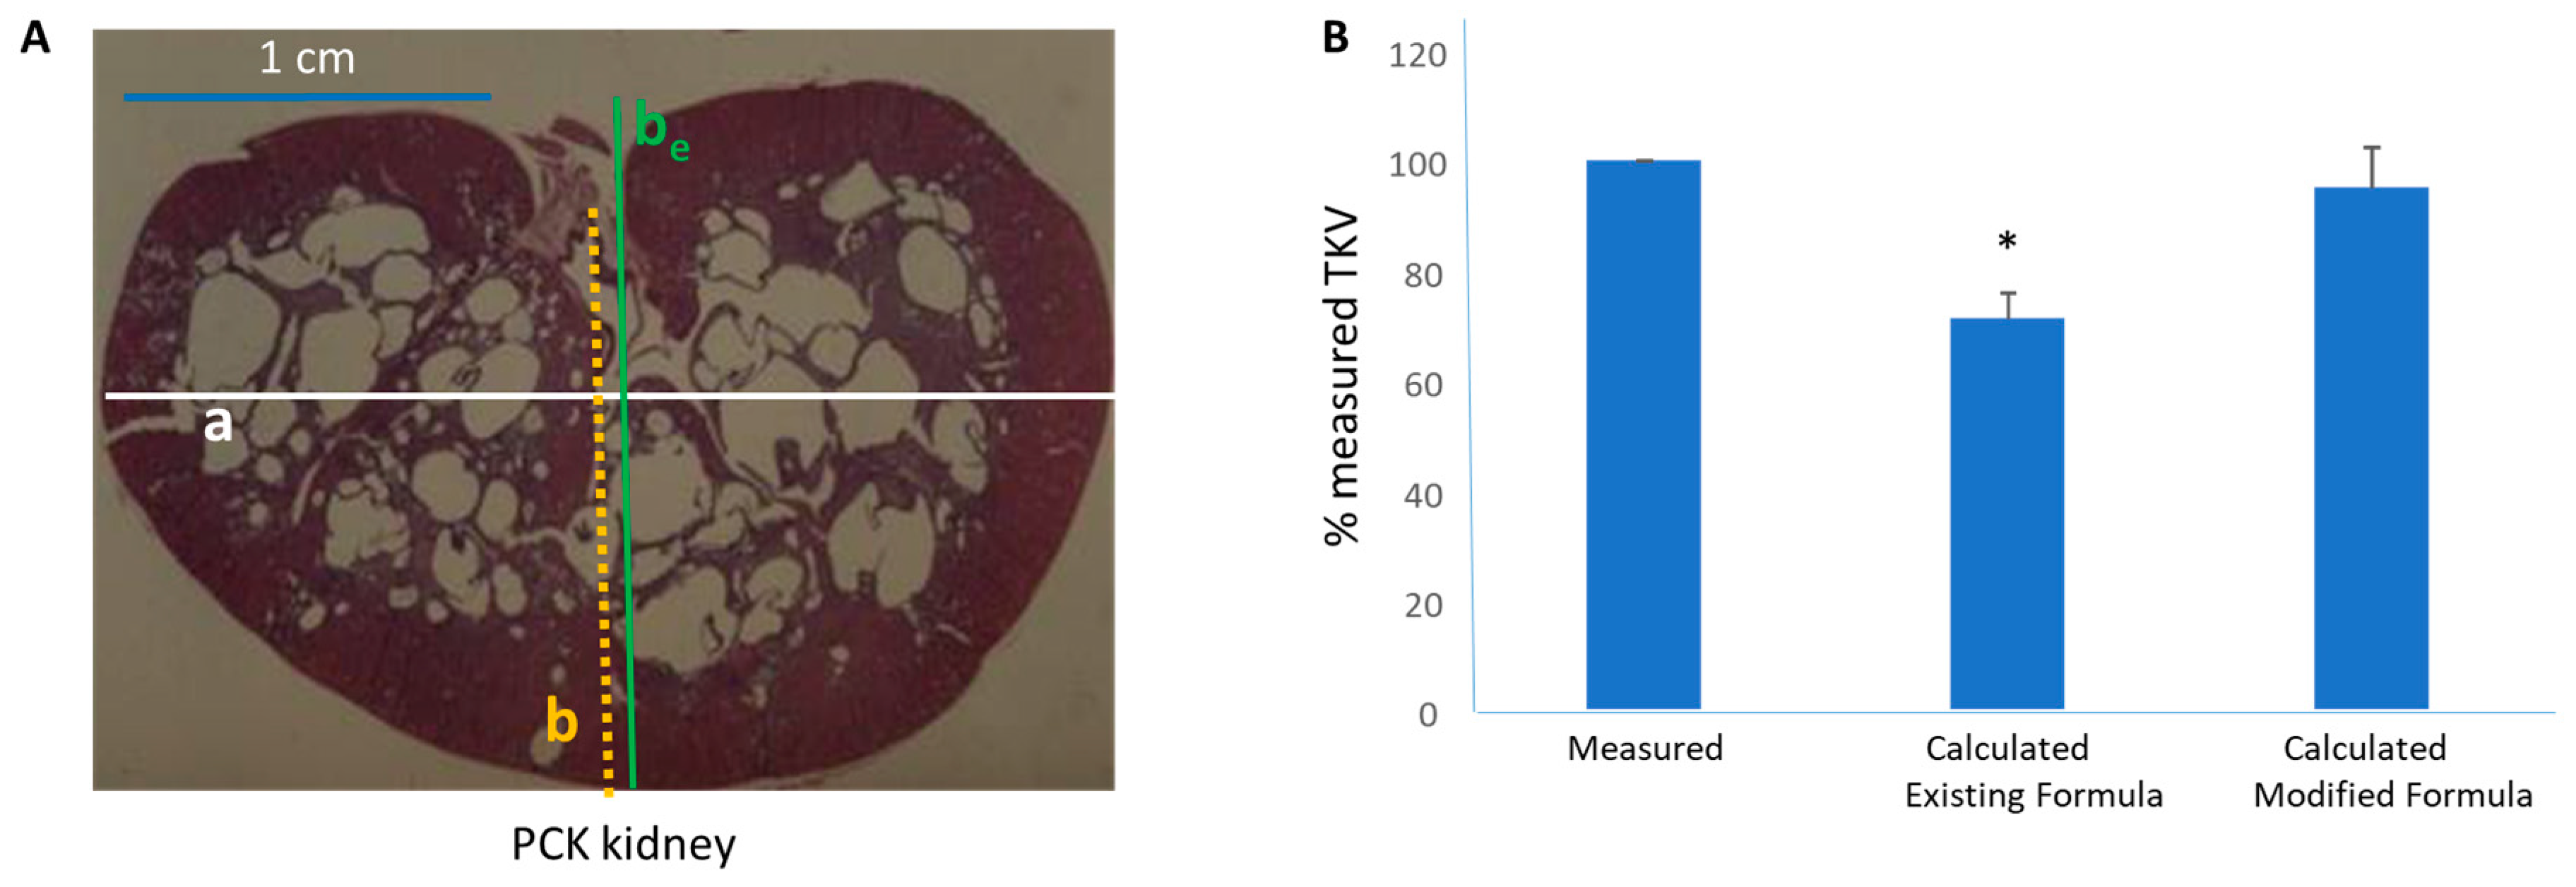
Hematoxylin and eosin (H&E) coronal renal sections were photographed (Nikon, Melville, NY, USA). The images were superimposed on a precalibrated grid of 1 mm resolution, and using NIS-Elements D 3.1 software (Version 3.1, Nikon, Melville, NY, USA, 2011), the major axis (a), minor axis (b), and the extended minor axis (be) was measured for each image as described previously by this laboratory [16]. Briefly, treating the coronal section of the kidney as an ellipse, the major axis (a) represents the renal length and the minor axis (b) represents renal width (Figure 1). The minor axis is extended past the hilar depression to determine the length of the extended minor axis (be). The ellipsoid-based equation, viz.,
A =   ( π a b   or   b e ) / 4
was used to calculate the renal parenchyma area. Calculated renal parenchymal areas, A, using b, or Ae using the extended be, were expressed in mm2. Additionally, renal parenchymal area (in mm2) was measured by planimetry using the “area measurement” tool available in the software.

2.3. Total Kidney Volume (TKV)

Kidneys from SD and PCK rats were immersed in formalin and TKV was measured using the volume of formalin displaced. For calculated TKV, kidney thickness (t) was first determined by using Vernier calipers and then the following ellipse-based formula was used:
T K V c a l c u l a t e d =   ( π a b   or   b e t )   /   8
Measured total kidney volume TKV and calculated total kidney volume TKV were expressed in mm3.

2.4. Renal Scarring

To confirm the presence of disease, Masson’s Trichrome staining was used to visualize the pattern of collagen deposition, typically tubulointerstitial. The collagen deposition was also semi-quantified (% image area) by a blind observer using Bioquant Image Analysis (Life Science, Bioquant, Nashville, TN, USA, 2012). Glomerulosclerosis was visualized using periodic acid Schiff staining.

2.5. Data Analysis

Microsoft Excel 2010 curve fitting software was used to generate scatterplots. Since a linear relation was observed between the 2 variables in each of the scatterplots, Pearson product moment (r) was calculated from the trend line. Differences between groups was identified by Student’s T-test. A p < 0.05 was considered to be statistically significant.

3. Results

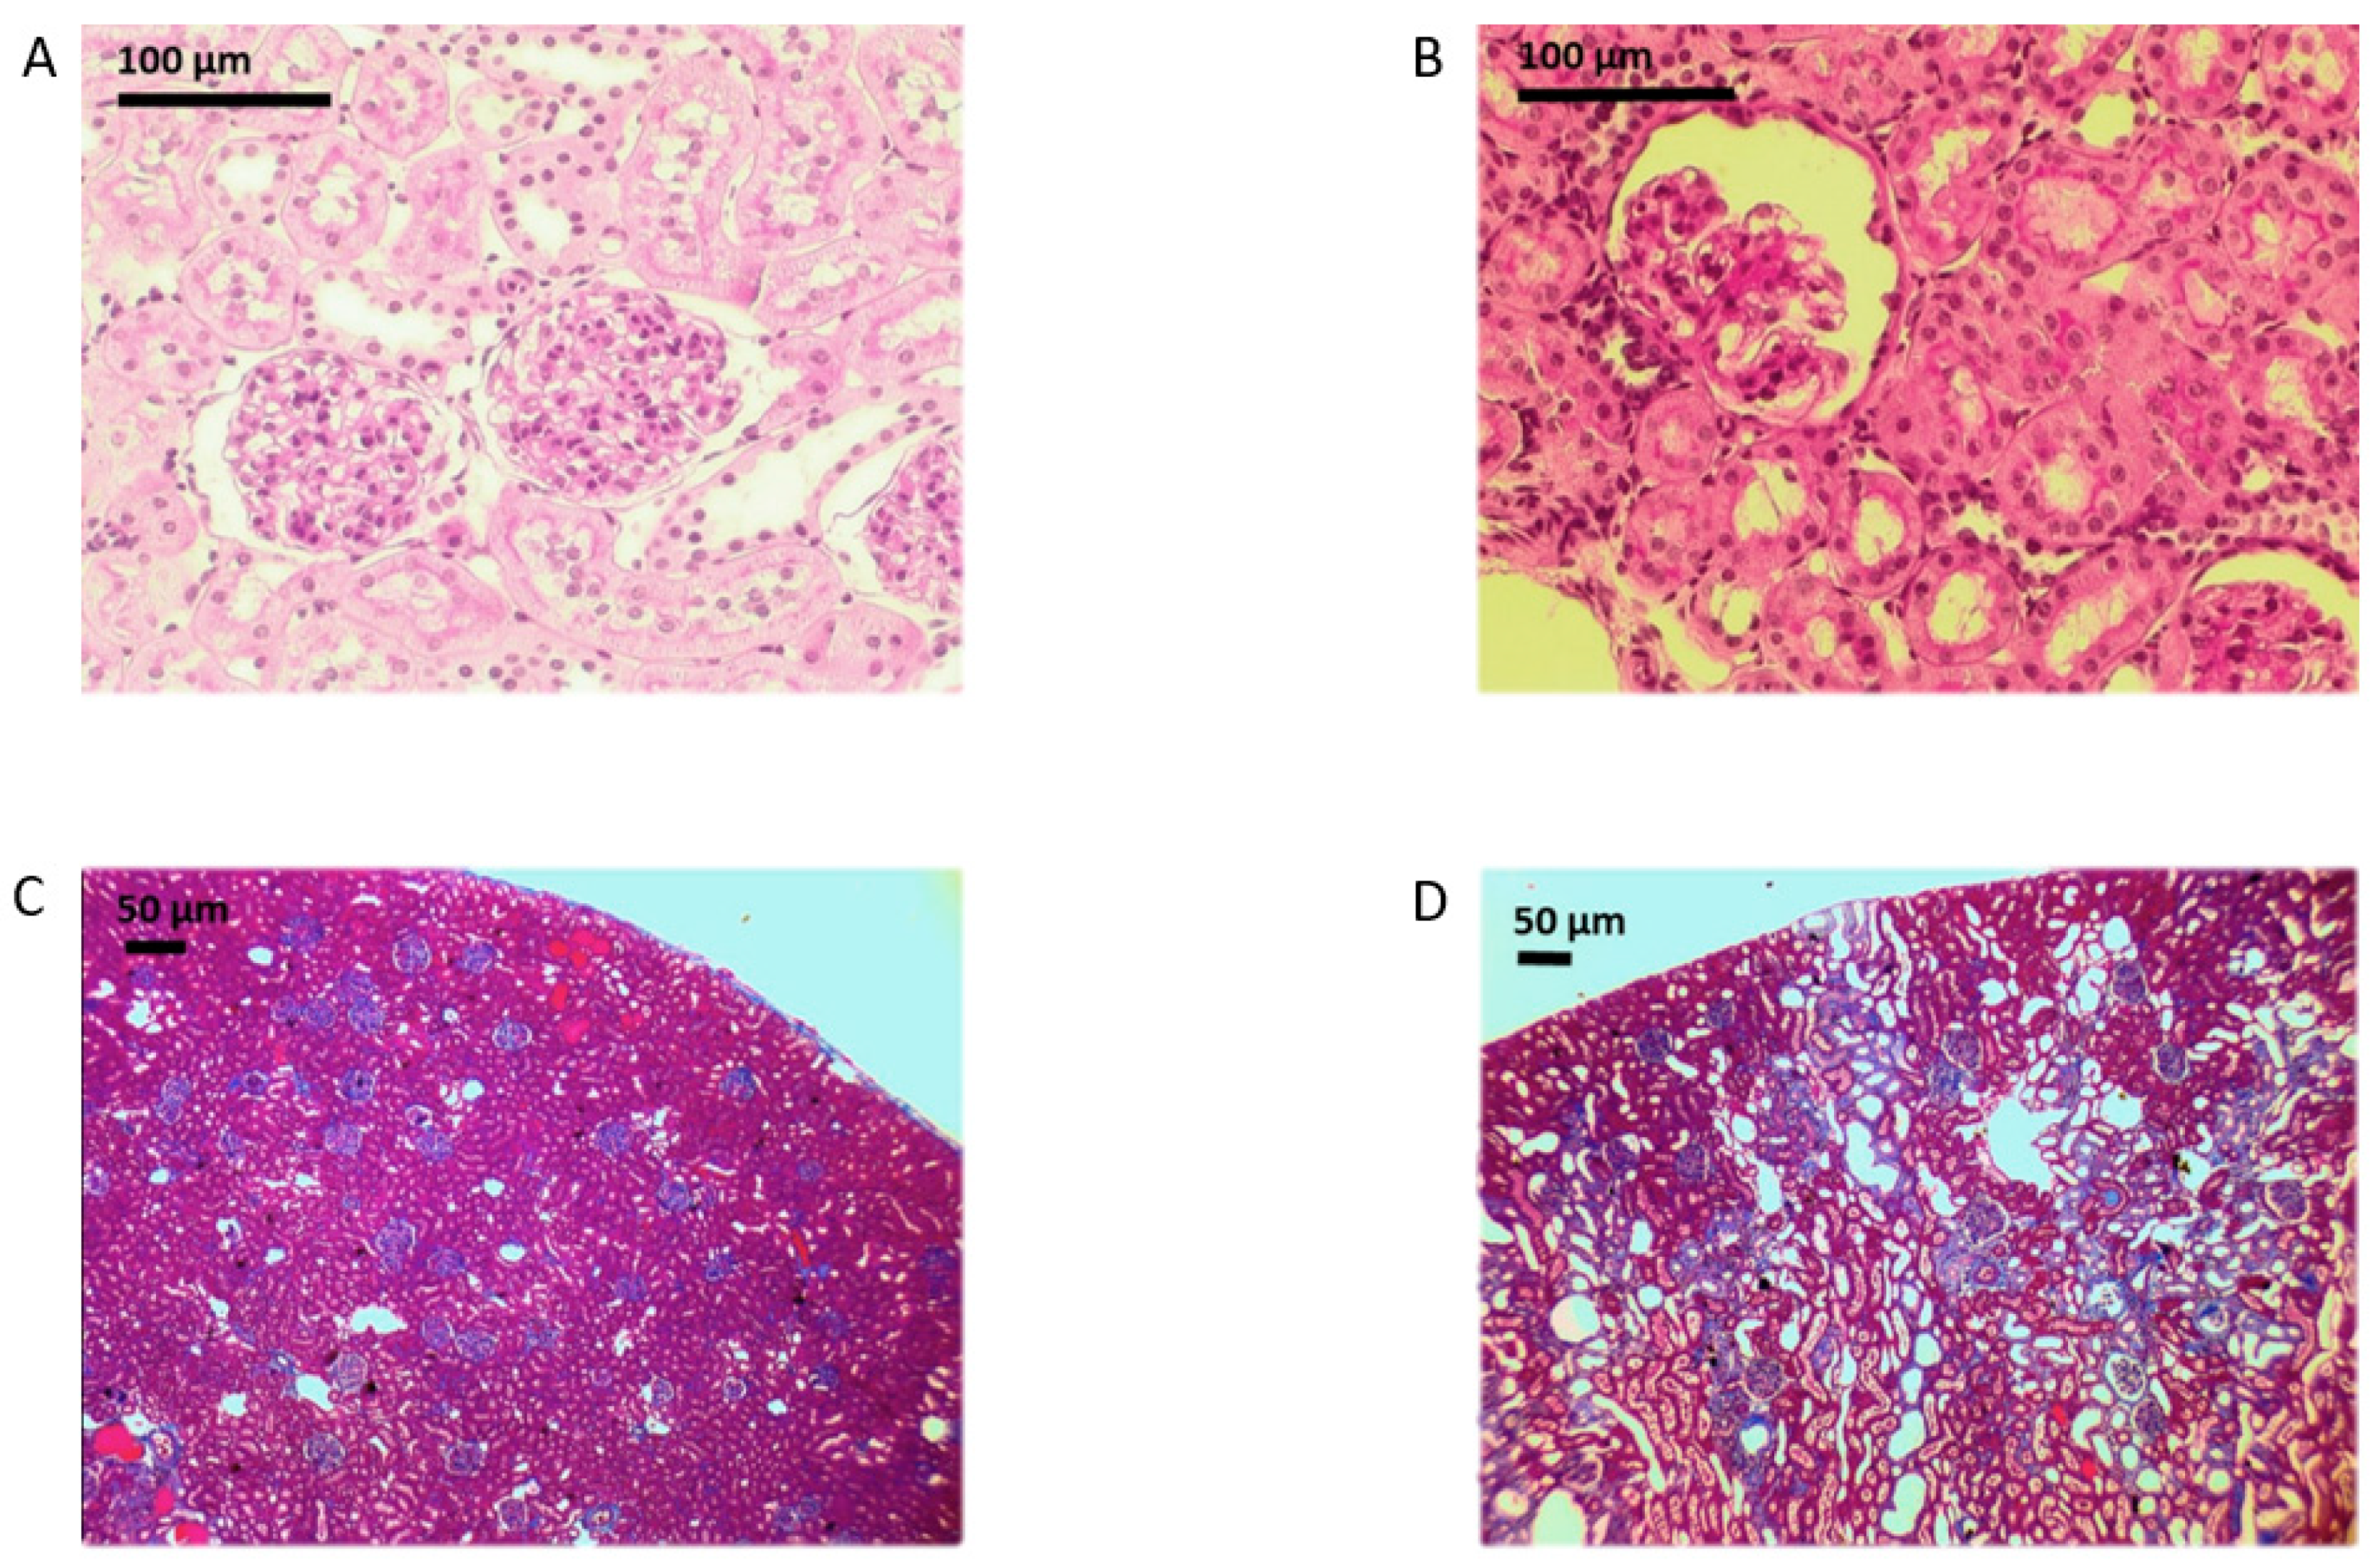
Compared to kidneys from control SD rats, kidneys from SD rats administered PAN exhibited scarring within the glomerulus and kidneys from obese ZSF1 rats exhibited extracellular matrix deposition within the tubulointerstitium (Figure 2).
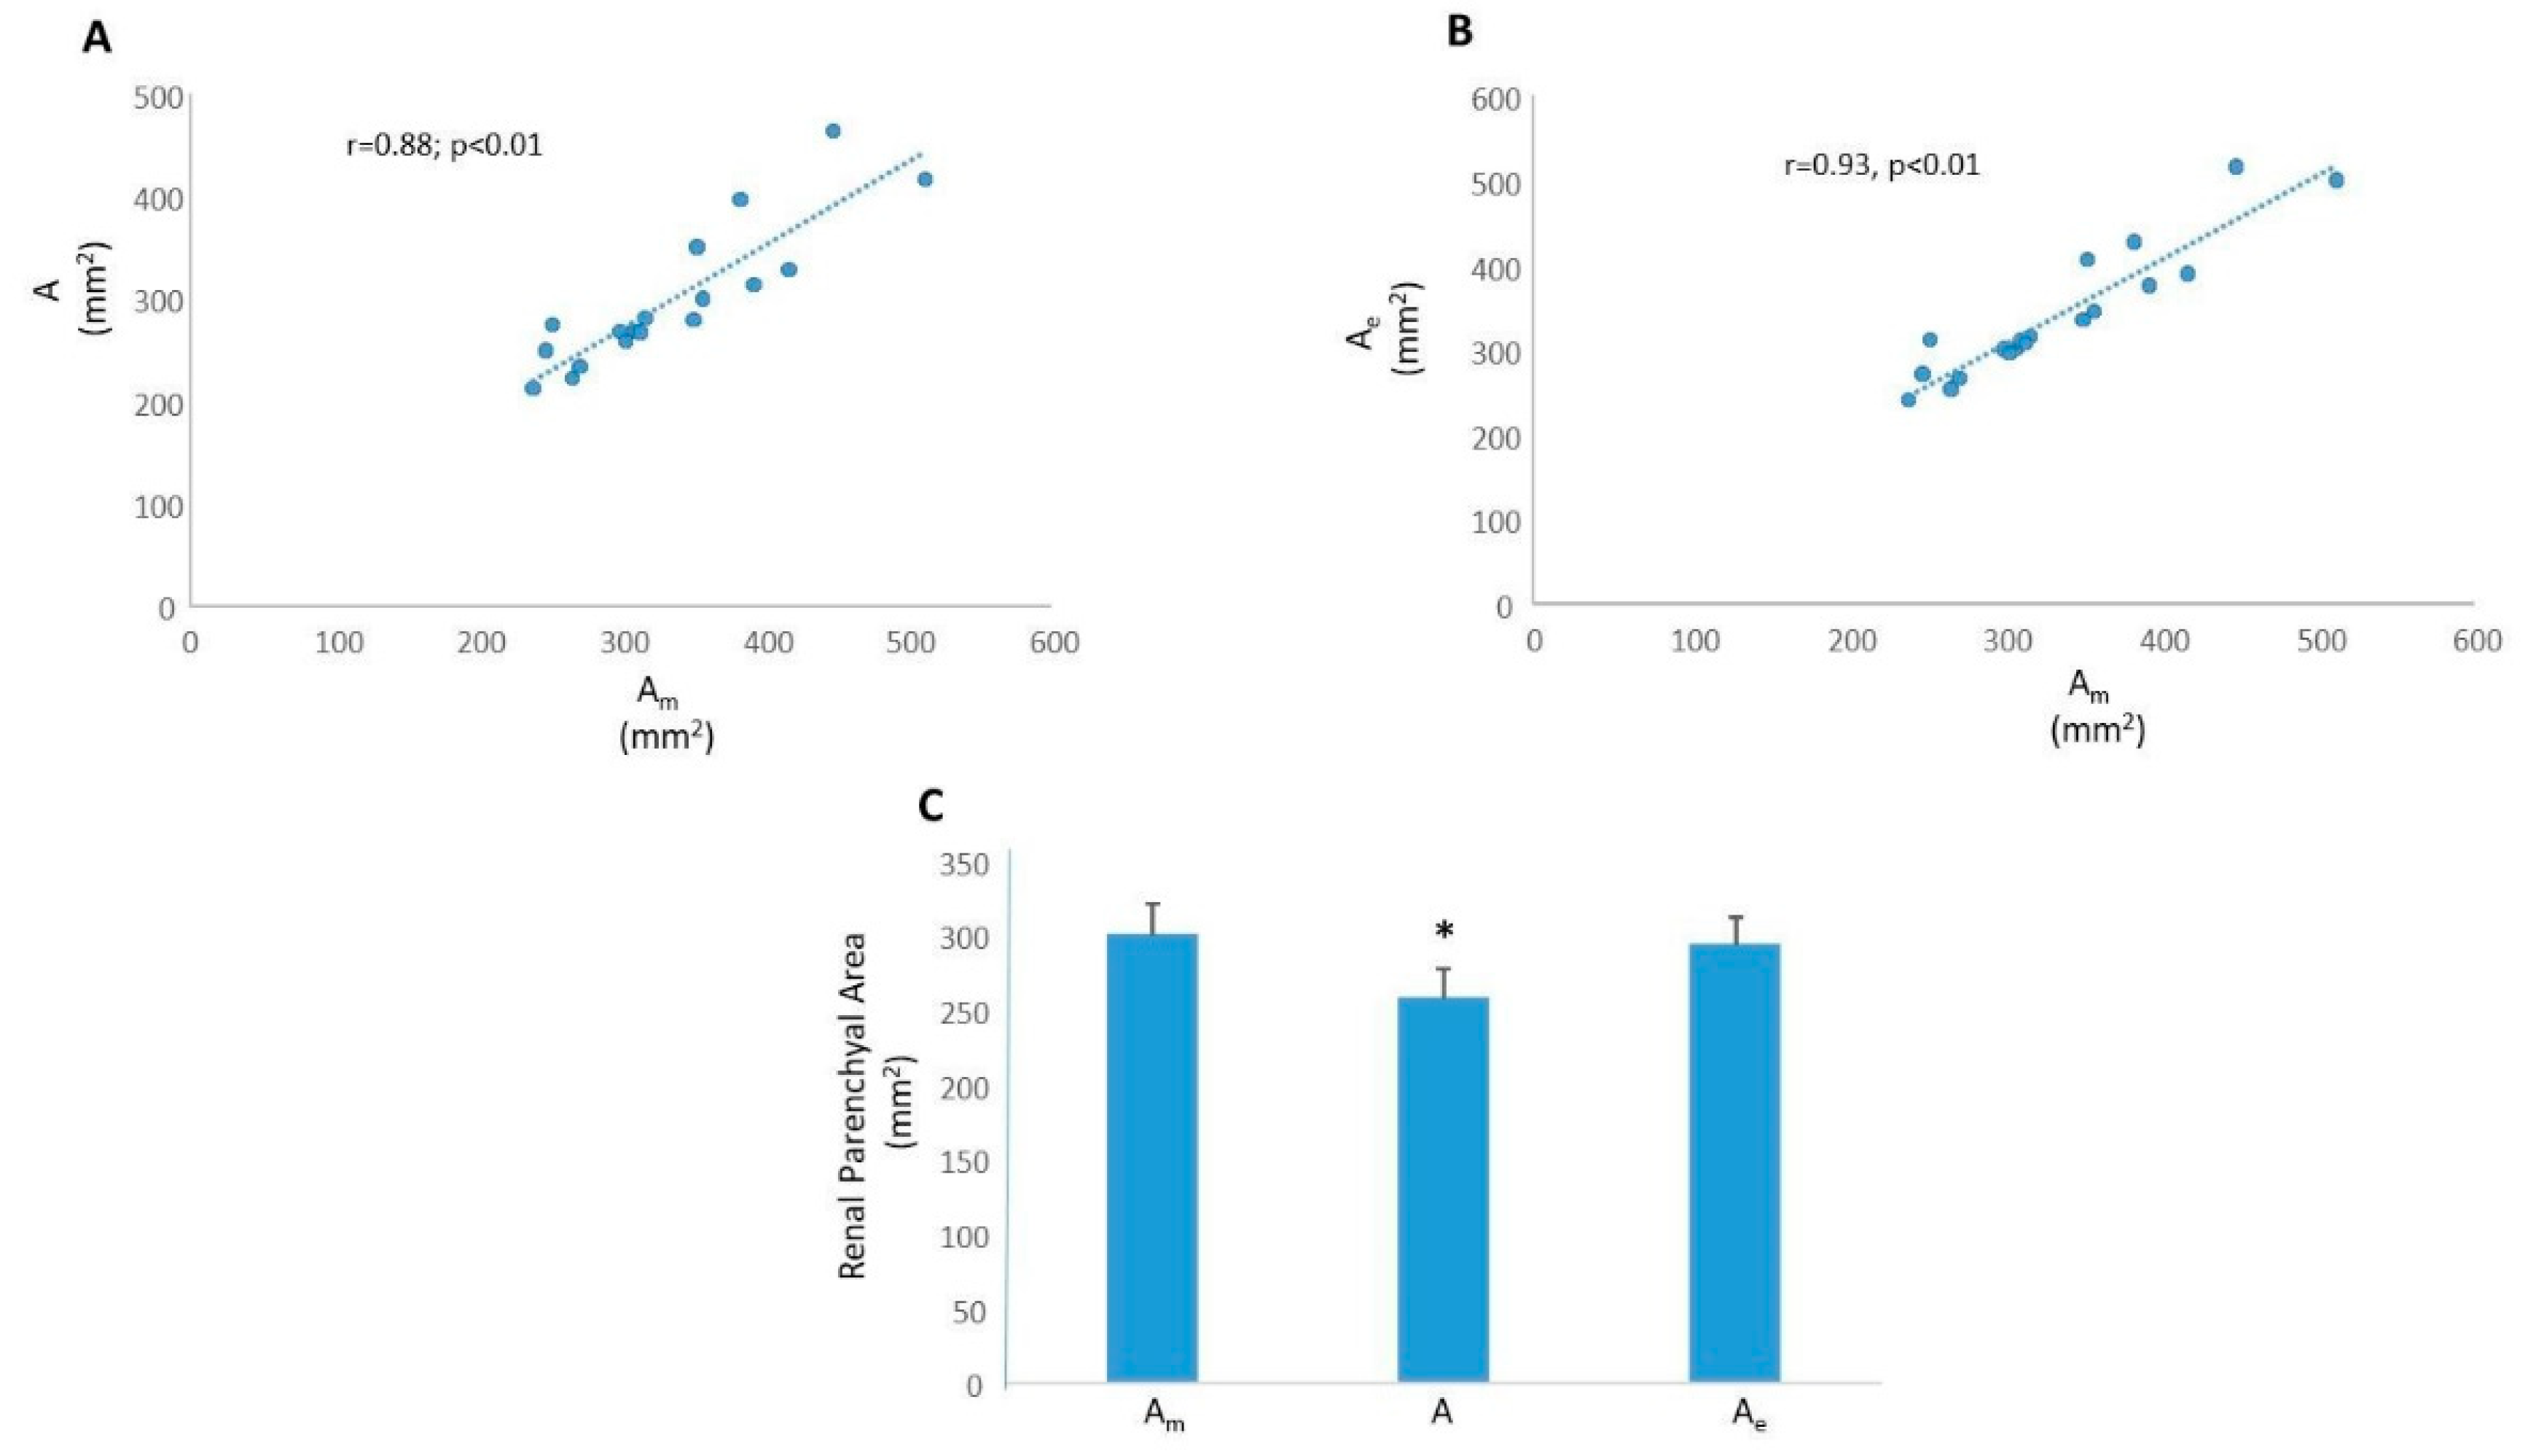
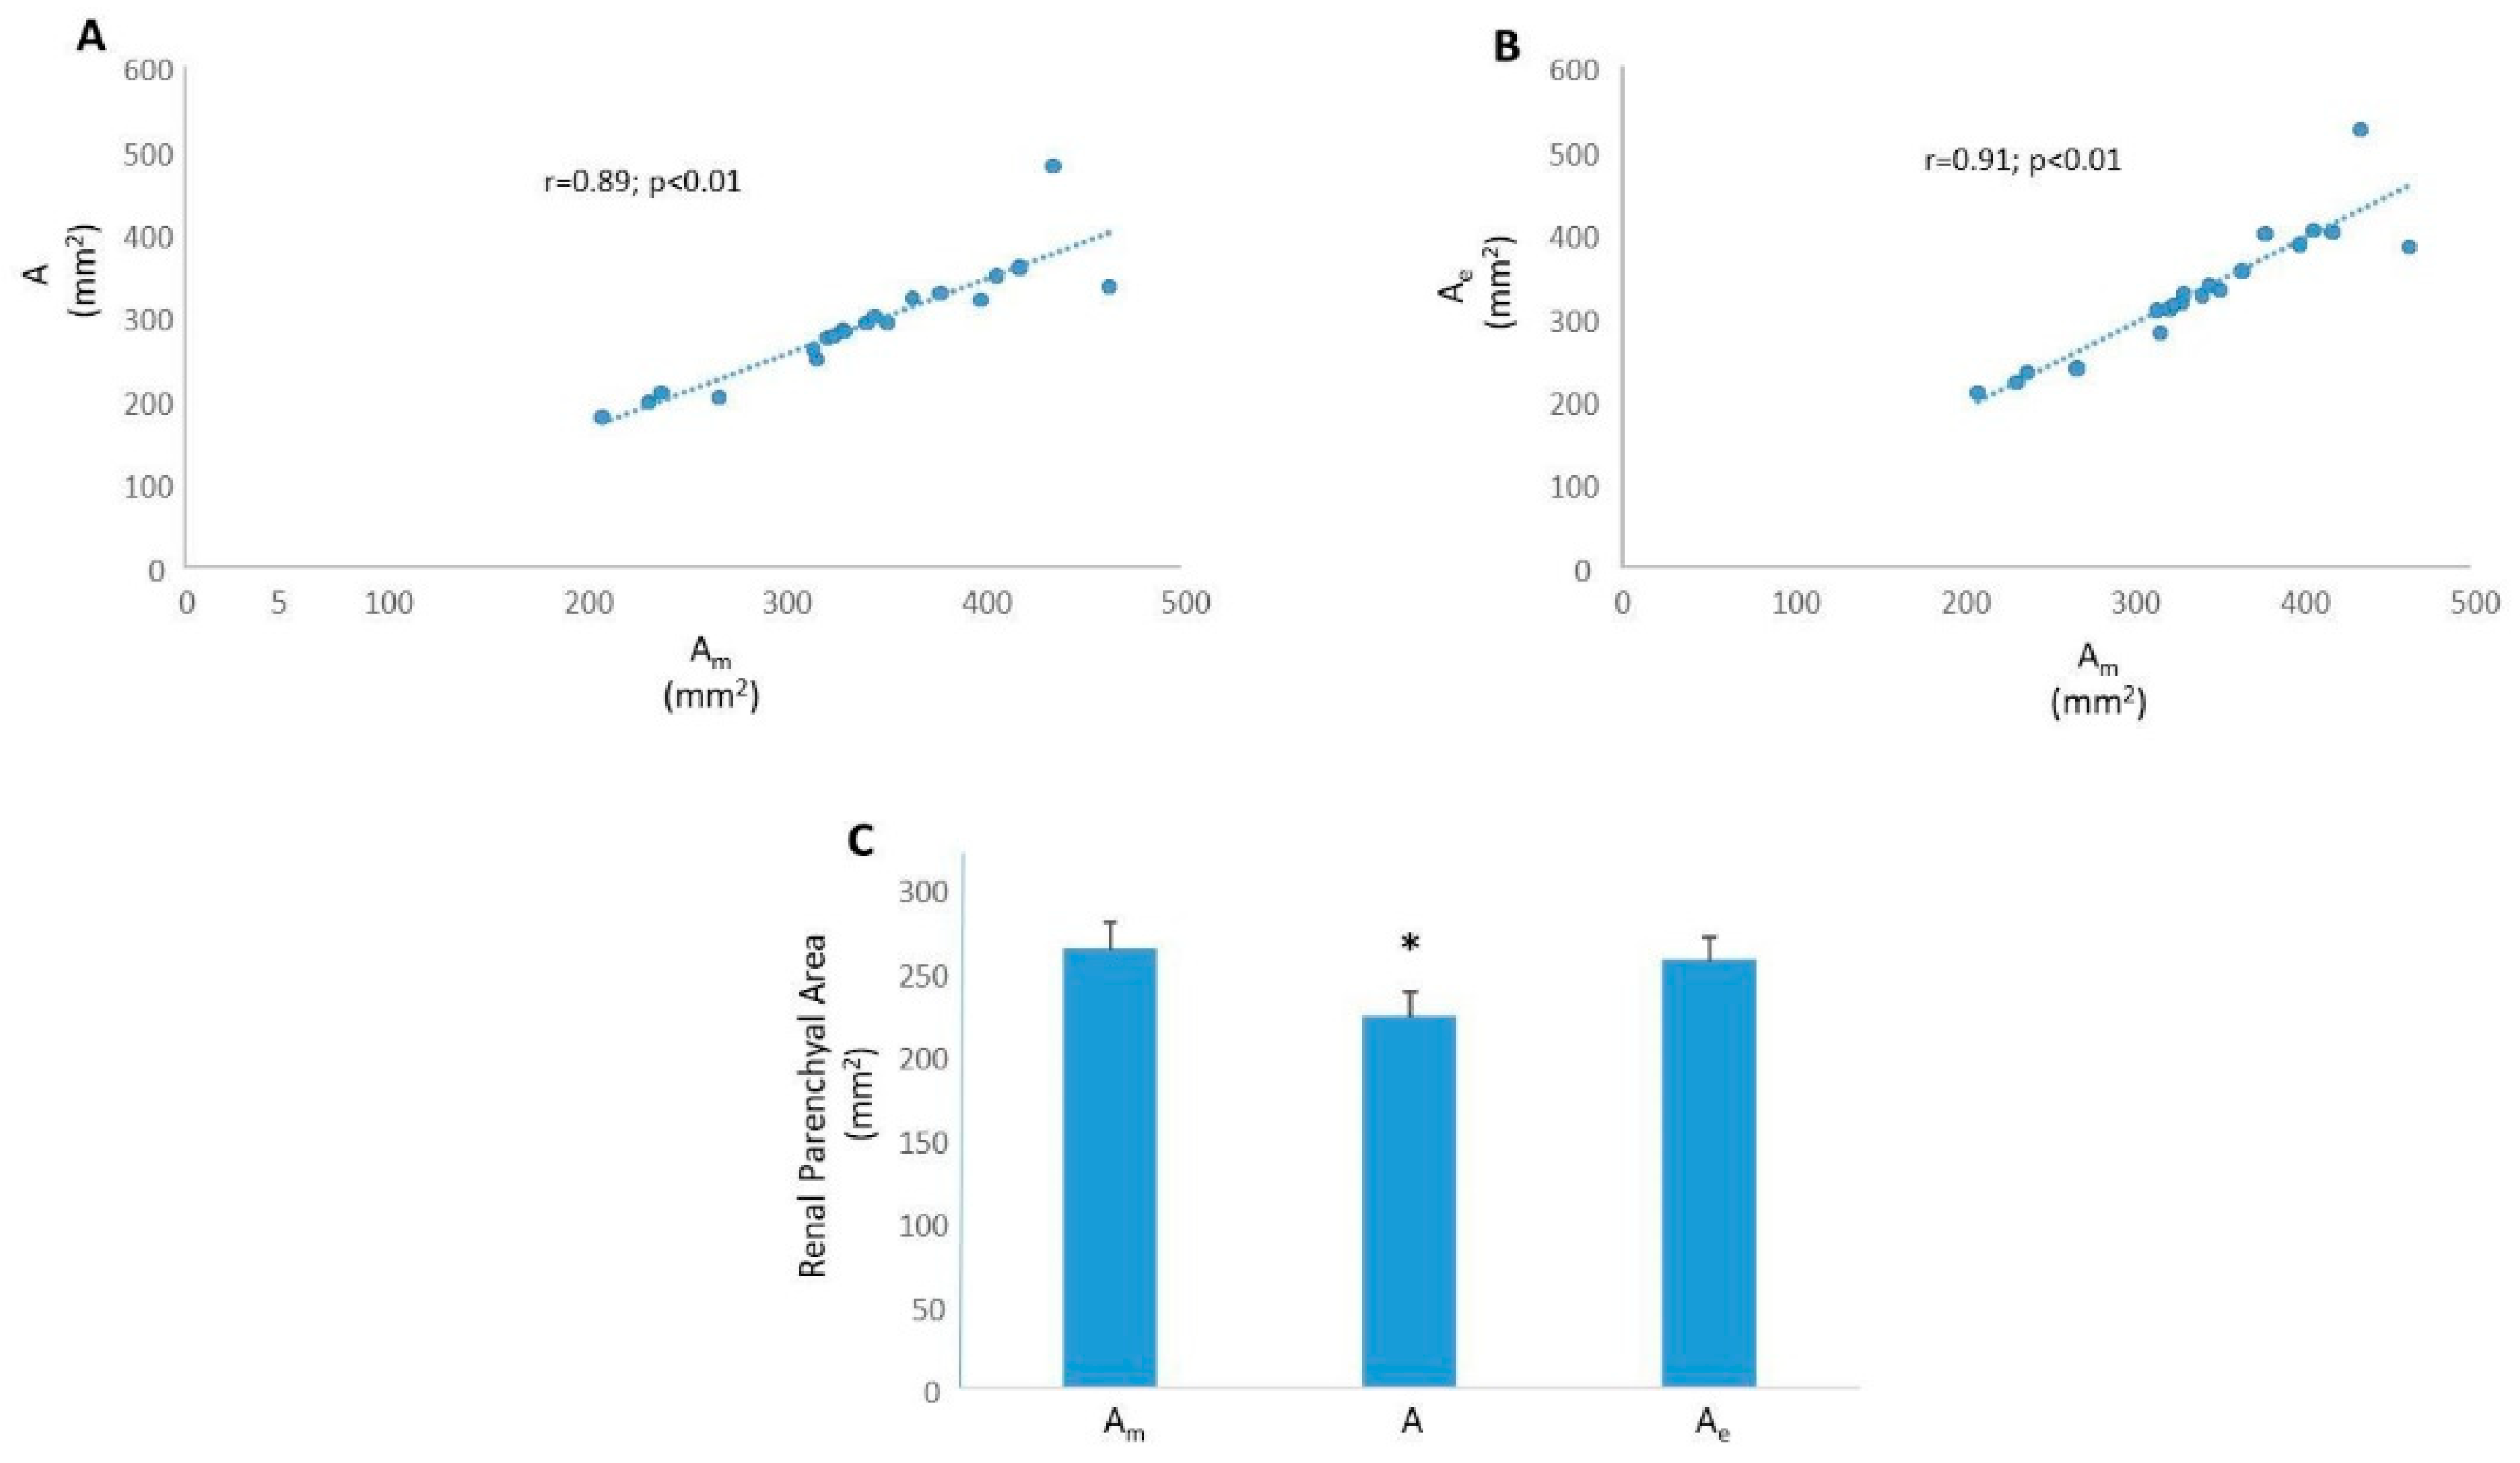
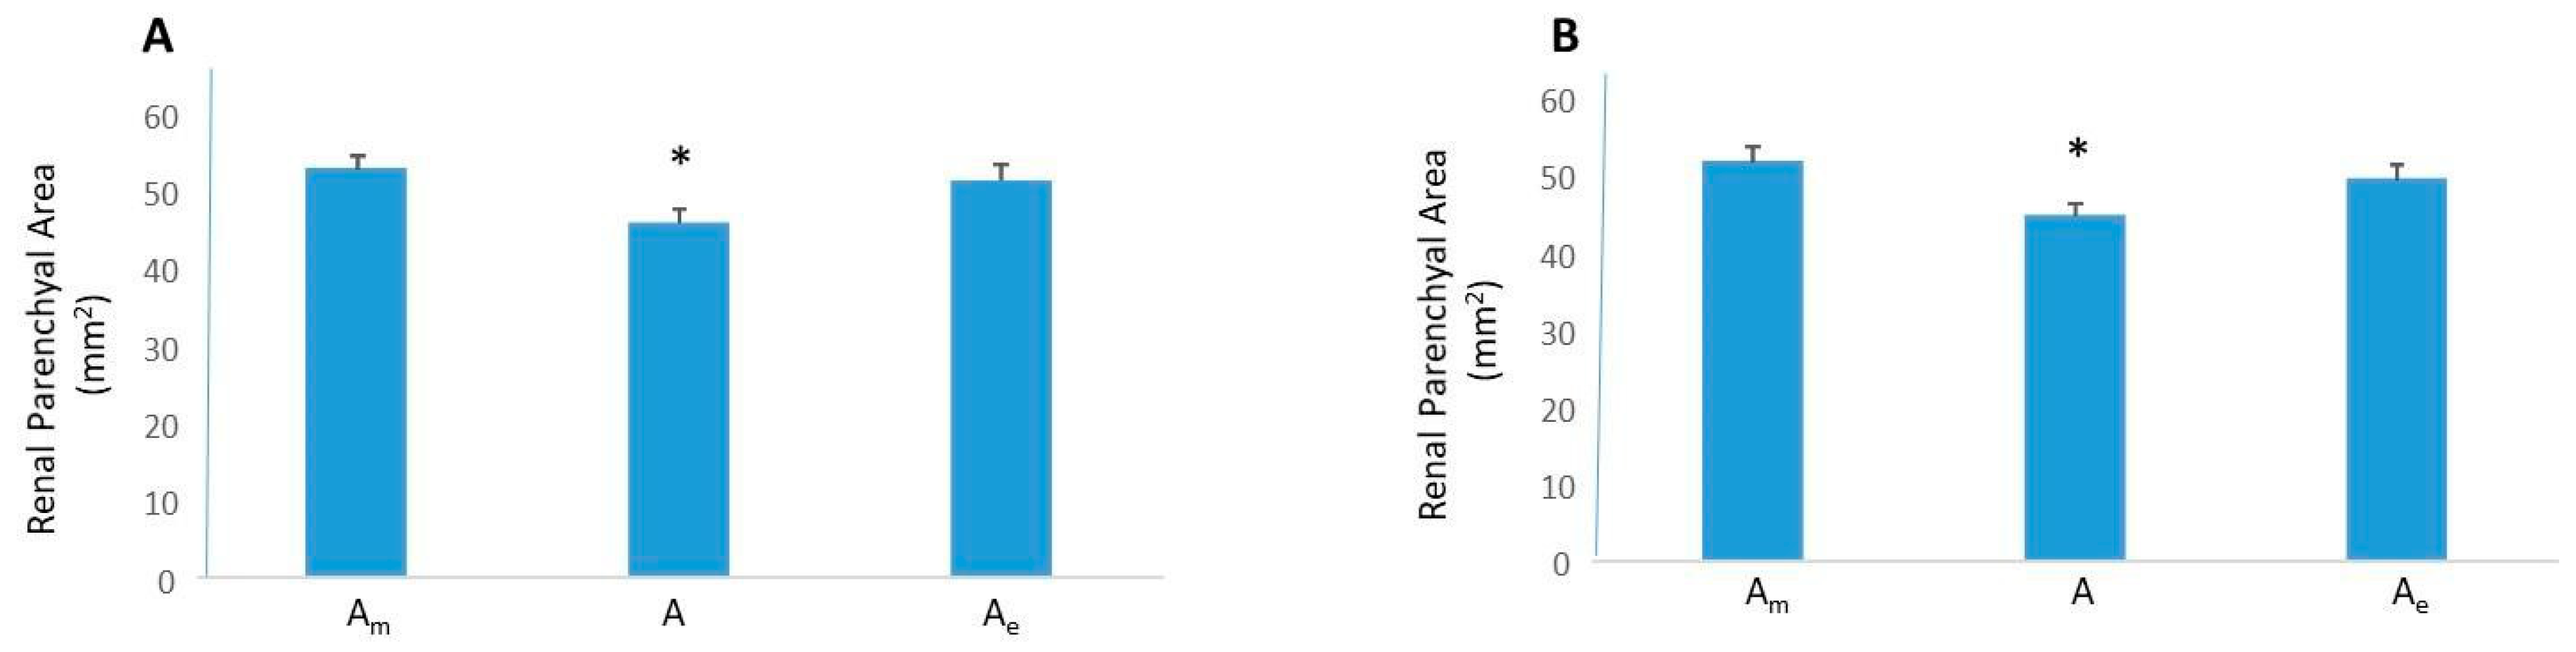
In the left kidneys from SD, SD + PAN and ZSF1 rats, a good correlation (r = 0.88, p < 0.01) was found when A, using minor axis (b), was plotted against Am (Figure 3). However, when the renal parenchymal area was calculated using the modified formula (with extended minor axis be), a plot of Ae against Am exhibited a better correlation (r = 0.93, p < 0.01) (Figure 3), proving greater accuracy with the modification. Calculated renal parenchymal area A using the existing ellipse-based method was significantly smaller than Am, supporting underestimation exhibited by the current formula. By contrast, there was no difference between Am and Ae, the renal parenchymal area calculated using (be) (Figure 3).
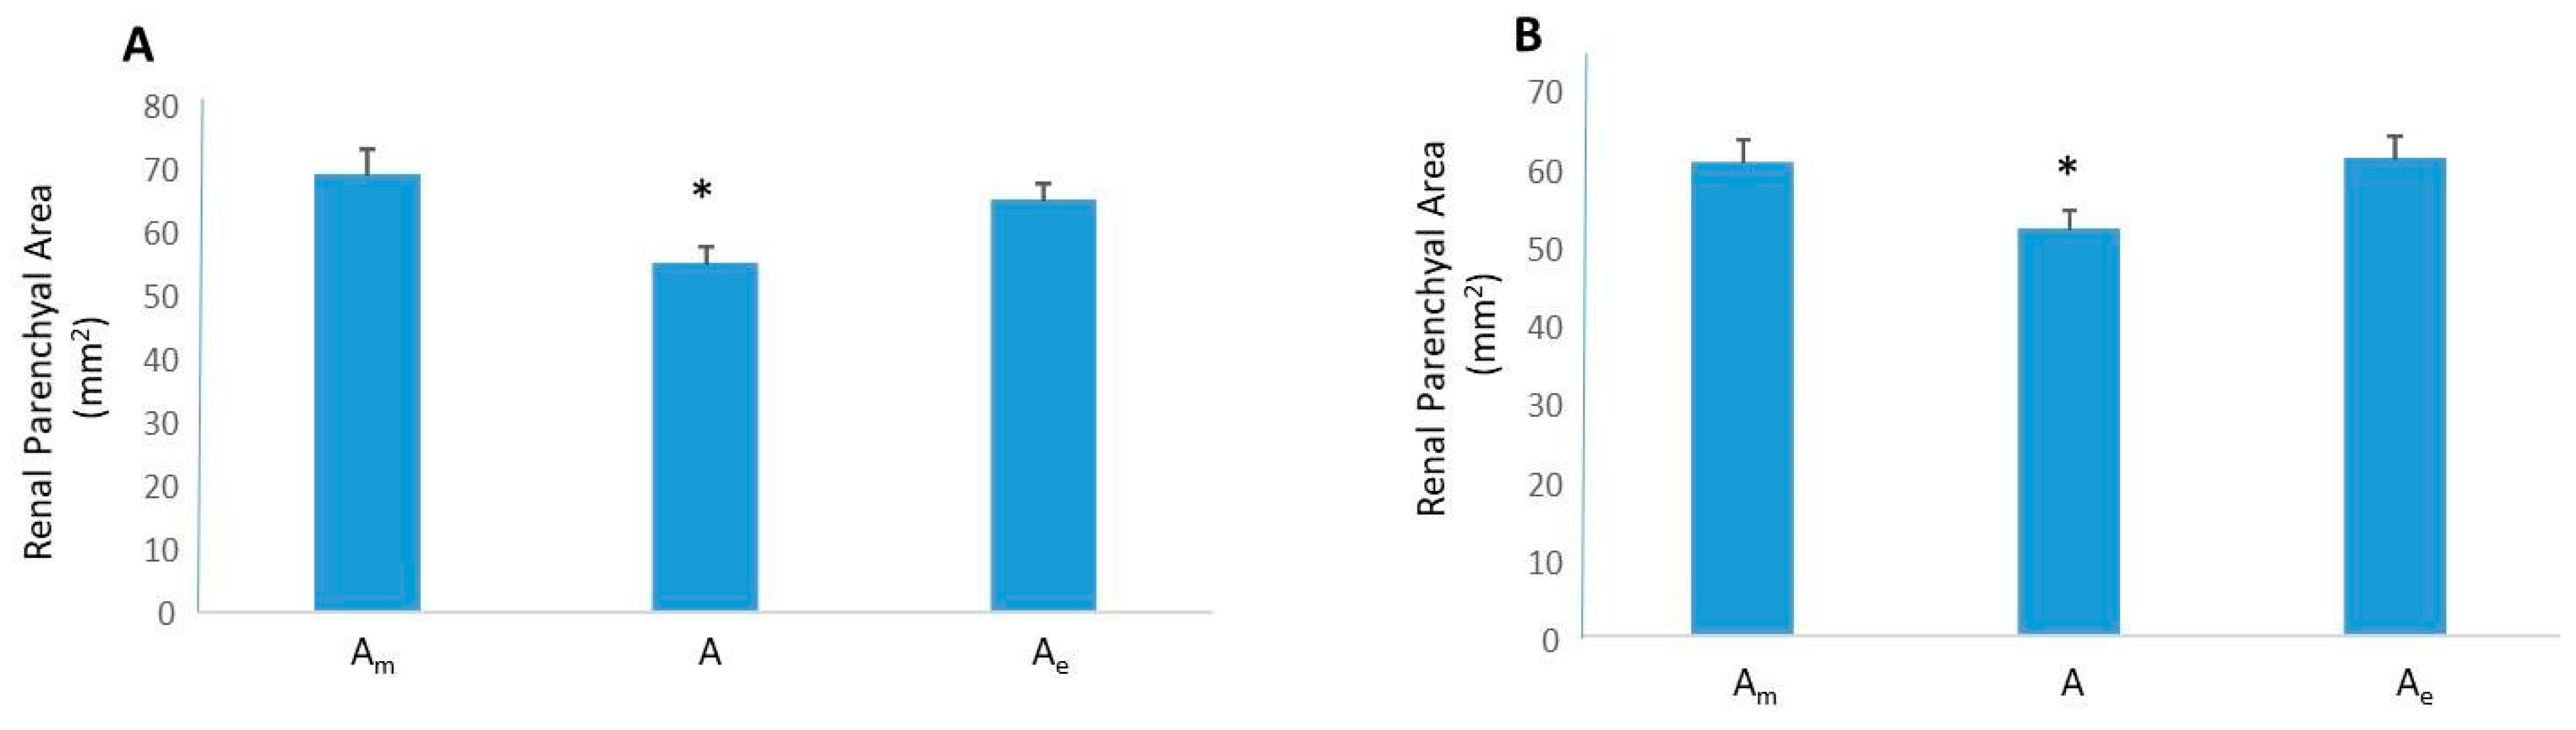
A similar exercise conducted with the right kidneys from SD rats with or without PAN and male and female obese ZSF1 rats yielded similar results (Figure 4). A plot of Ae vs. Am exhibited a better correlation than a plot of A vs. Am. While A was less than Am, there was no difference between Ae and A (Figure 4).
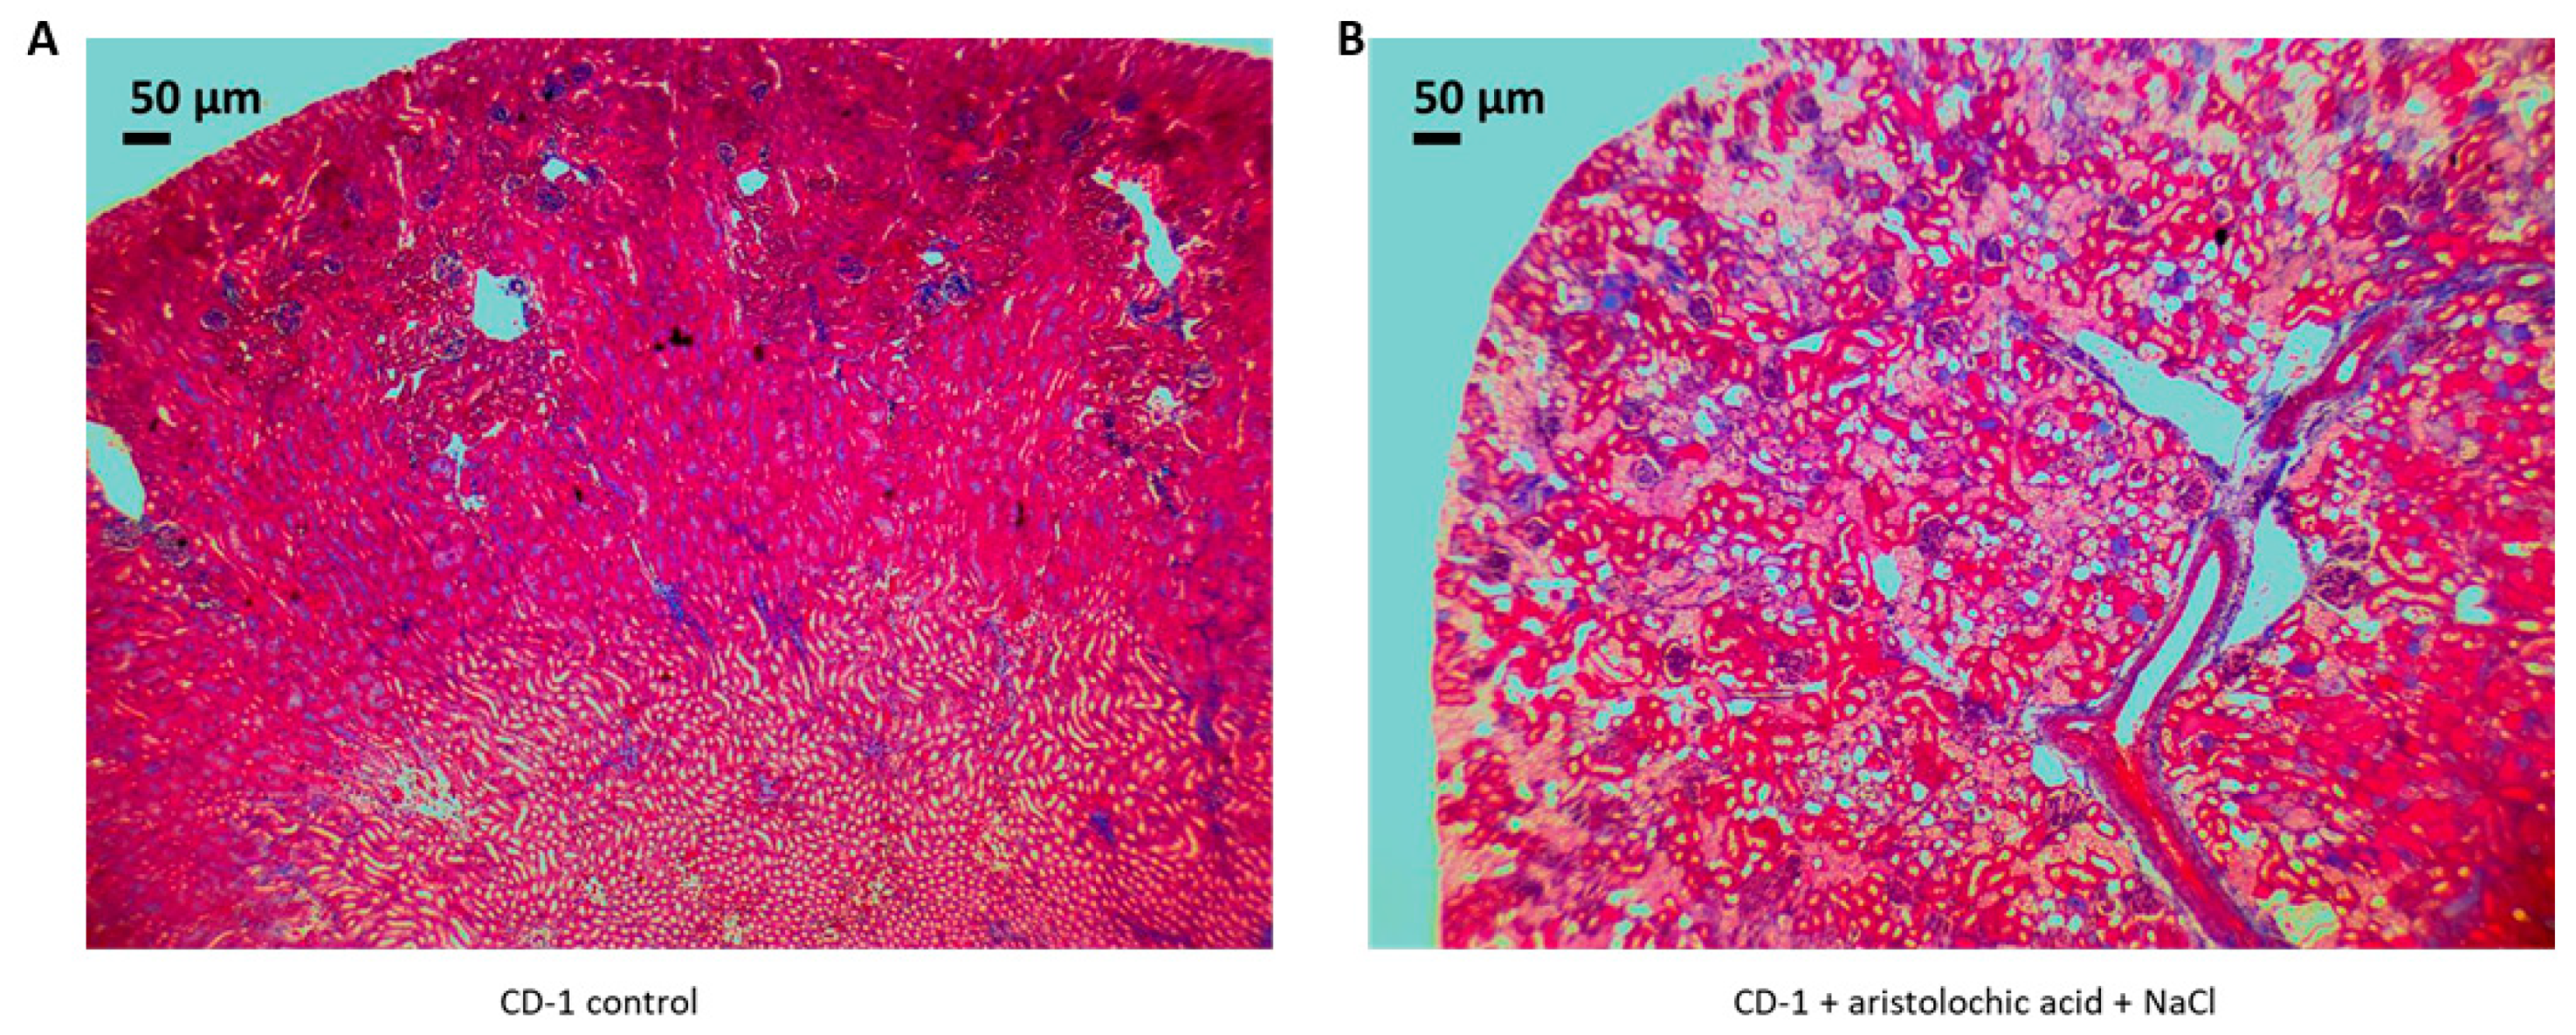
Administration of aristolochic acid + NaCl to CD-1 mice was associated with acute tubular necrosis and renal scarring (Figure 5).
In left and right H&E-stained renal coronal sections in healthy and diseased mice, the use of the ellipse-based equation with minor axis (b) underestimated the measured renal parenchymal area. The use of the modified ellipse-based formula (with be) produced a renal parenchymal area Ae that was no different from Am (Figure 6).
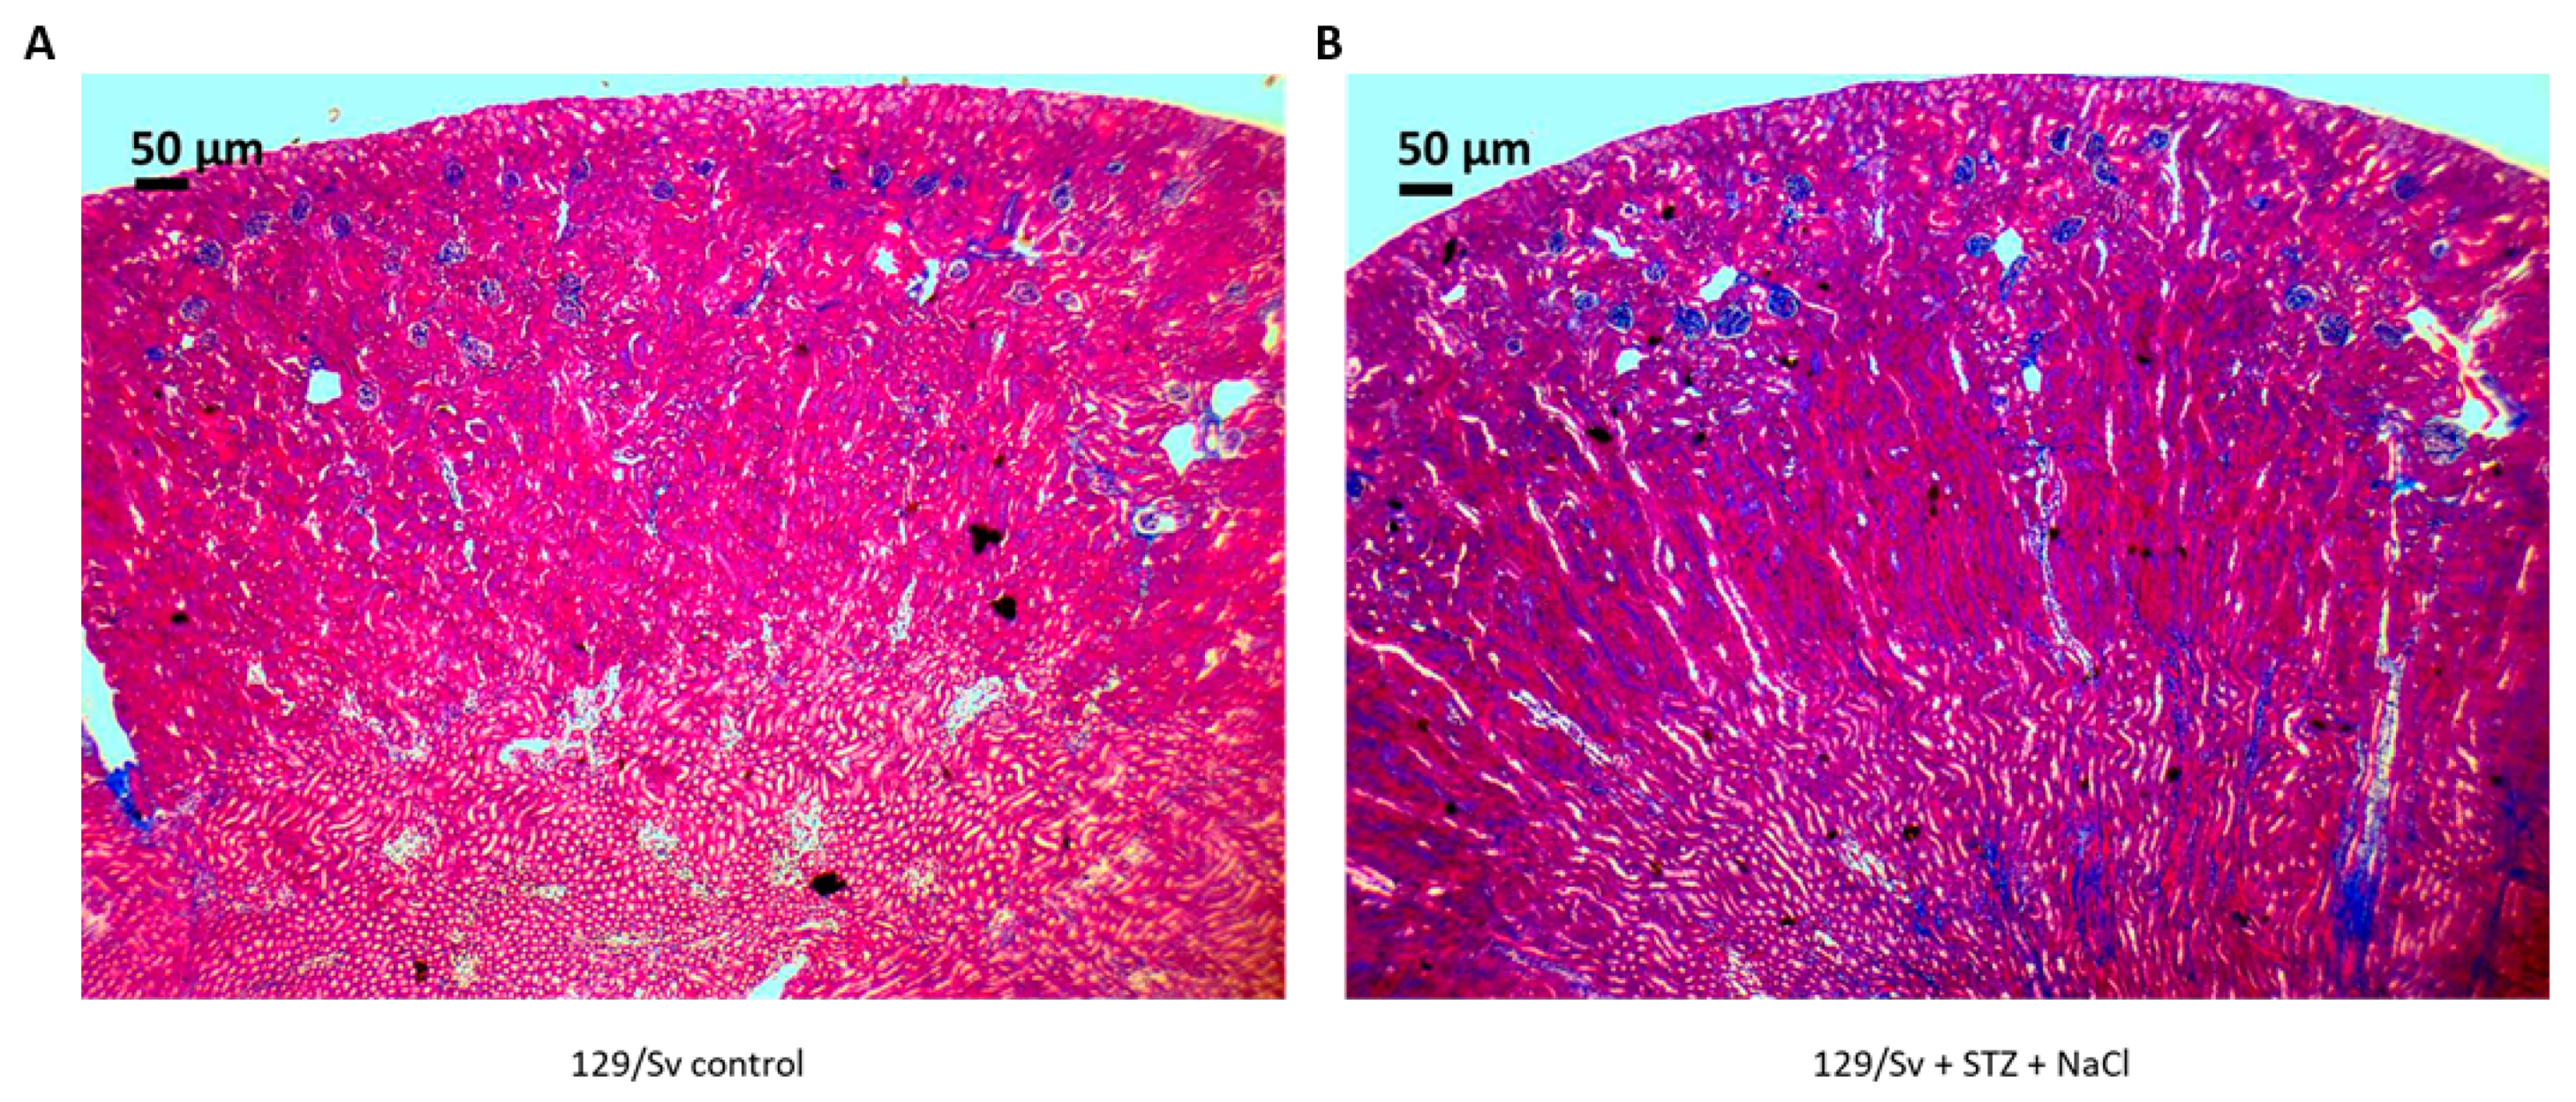
Administration of STZ + NaCl to 129/Sv mice was associated with renal scarring (Figure 7).
In left and right H&E-stained renal coronal sections in healthy and diseased mice, the use of the ellipse-based equation with minor axis (b) underestimated the measured renal parenchymal area. The use of the modified ellipse-based formula (with be) produced a renal parenchymal area Ae that was no different from Am (Figure 8).
Data from these models are summarized in Table 2.
To determine whether use of the modified axial measurement translates to increased accuracy in calculating TKV, kidneys from SD rats and PCK rats (Figure 9) were examined. The volume of kidneys from adult male SD and adult male and female PCK rats determined by the fluid displacement methods spanned an 11-fold range, a range consistent with the range exhibited with clinical samples [19]. Kidney volumes calculated using the existing formula yielded a volume that was on average 87% of measured TKV (p < 0.01). By contrast, use of the modified formula yielded a kidney volume in agreement (p = 0.65) with measured TKV (Figure 9).

4. Discussion

In healthy and diseased left and right kidneys from two genders and two species, we report that calculation of renal dimensions using a modified ellipse-based formula provides a better estimate of both measured renal parenchymal area and measured TKV in comparison to the existing ellipse-based formula.
Accurate determination of renal dimension is critical to a number of subspecialties within nephrology. Accurate measurement of renal metrics is also critical to inform changes in values from previous measurements. In the CKD patient, functional changes are long preceded by extracellular matrix accumulation within the renal interstitium and parenchymal echogenicity, and abnormalities in renal size often inform presence of some disease [1,2,3]. Autosomal dominant and autosomal recessive PKD is characterized by increased TKV with both TKV, and its rate of increase, a prognostic biomarker for outcome in these populations [4,5,6]. Consequently, there is increasing interest within the nephrology community and pharmaceutical companies to use TKV as a surrogate endpoint in PKD trials to define the efficacy of drug candidates [7]. In renal transplantation, organ size is critical to match a donor with the recipient, and is especially the case with pediatric recipients. Kidney size can also inform allograft rejection as it has been reported that transplants with severe rejection had either an abnormal renal length or renal growth rate or both [8,9,10]. Changes in kidney size can also inform vesicoureteral reflux, infections within that organ, renal insufficiency and threats to the prospective mother in the setting of pregnancy [20]. Finally, determination of TKV is important in the debulking of renal tumors as it can dictate margins [21]. Remnant nephron mass governs renal function, especially in kidneys with prior functional impairment.
Given the impracticality of using the gold-standard fluid displacement method, imaging has become the mainstay for reporting kidney volume and changes in kidney volume. Ultrasonography is readily available, cost-effective, non-toxic therefore affording repeated measurements, and requires minimal patient compliance unlike more expensive imaging modalities which might also involve use of a contrast agent that might be nephrotoxic. Kidney volume is calculated using an ellipse-based formula following measurement of renal length, width and thickness [11,12,13,15]. Nevertheless, data from a number of studies [11,12,13,15] have consistently shown that use of this method underestimates kidney size by ~25%. In fact, the existing method underestimates renal size regardless of whether the kidney is healthy or diseased and regardless of whether the image is obtained by ultrasound or magnetic resonance [13,15]. In a seminal study [13] by Cheong and colleagues, porcine kidney volumes measured by the magnetic resonance imaging disc-summation method was within 5% of the actual kidney volume measured by the fluid displacement method. In contrast, applying the existing ellipse-based formula to the magnetic resonance images underestimated TKV by 17% to 29%. A comprehensive clinical study [15] to determine the accuracy and repeatability of ultrasonography and the existing formula to calculate TKV concluded that this formula is neither appropriate for accuracy nor reproducible for such a determination.
Recently, this laboratory [16] reported a modification to this methodology using a murine model of kidney disease. We reported that extending the minor axis length past the hilar depression and substituting that measurement for renal width and entering it into the ellipse-based formula provides a more accurate estimation of renal parenchymal area. In the present study, we sought to confirm this observation by applying this formula to both left and right kidneys, healthy and diseased, from male and female mice and rats. We evaluated kidneys from healthy male CD-1 mice and CD-1 mice with chronic aristolochic acid nephropathy and healthy 129/Sv mice (male and female) and 129/Sv (male and female) submitted to diabetic nephropathy. In the disease models, animals were placed on 1% NaCl to accelerate kidney disease. Tubulointerstitial matrix accumulation, a hallmark sign of renal scarring, was evident in these disease models. Kidneys were also sourced from healthy male rats, male rats with chemically-induced glomerulosclerosis and male and female obese ZSF1 rats representing a model of metabolic syndrome and renal extracellular matrix accumulation [22]. For each kidney, renal parenchymal area measurements were made in H&E-stained coronal sections. In our hands, use of the existing method consistently underestimated renal dimensions by ~15%. Regardless of the source and nature of the kidney, use of our modified formula afforded greater fidelity to the measured renal parenchymal area than use of the existing formula. Given these stringent evaluation conditions, these data suggest that the modified formula is applicable across a range of kidneys and its use is reproducible across operators (KC, KL, MK). Furthermore, we tested the hypothesis that this modified formula for renal parenchymal area can be used as a better estimation of TKV. Indeed, use of the extended minor axis provided an estimate of TKV in excellent agreement with measured kidney volume. Moreover, in this study, kidney volumes spanned an 11-fold range, a range consistent with the TKV of PKD patients in early vs. end-stage disease [19]. Consistent with published reports [11,12,13,15], use of the existing formula in our hands underestimated TKV. Considering that both calculations used the same major axis and renal thickness measurement, it is logical to assume that underestimation of TKV relates to use of the minor axis measurement. Together these data provide a foundation for use of this modified technique to estimate renal dimensions.
However, this study exhibits some limitations. For one, it has yet to be concluded if the findings of this study hold true only in rodents; the accuracy of the formula in calculating renal parenchymal area and TKV in kidneys from higher species including humans remains to be determined. The modified formula does not consider the effects of reverse renal remodeling and potential hysteresis in response to interstitial tissue catabolism on renal parenchymal area. It is entirely possible that the modified formula may not find application with irregular renal contours as a result of a disease like nephrosclerosis. That being said, even the existing ellipse-based formula would fail in such an instance. All findings in this study were concluded from microscopic observations of H&E-stained coronal renal sections. These findings may not fully translate to findings retrieved from the targeted modality: ultrasound.

5. Conclusions

These results produced strengthen the need to reevaluate the existing methodology used to calculate TKV and form the basis for evaluation of this new approach in renal images from clinical subjects. Translation of these findings to the clinical can greatly improve management of kidney disease.

Author Contributions

Conceptualization, P.N.; Methodology, K.C., M.K., C.S., J.L., Formal Analysis, K.C., K.L., M.K. Writing, P.N., Funding, I.D.G.

Funding

This research received no external funding.

Conflicts of Interest

The authors declare no conflict of interest.

References

  1. Tuma, J.; Heynemann, H. Ultrasound differential diagnosis in renal parenchymal disease. Praxis 2006, 95, 721–727. [Google Scholar] [CrossRef] [PubMed]
  2. Khati, N.J.; Hill, M.C.; Kimmel, P.L. The role of ultrasound in renal insufficiency: The essentials. Ultrasound Q. 2005, 21, 227–244. [Google Scholar] [CrossRef] [PubMed]
  3. Fleck, M.; Appenroth, D.; Malich, A.; Stein, G.; Fleck, C. Renal interstitial fibrosis (RIF): II. Ultrasound follow up study of single uranyl nitrate administration causing renal dysfunction in rats–comparison with histologic and functional renal parameters. Exp. Toxicol. Pathol. 2002, 54, 15–23. [Google Scholar] [CrossRef] [PubMed]
  4. Available online: https://pkdcure.org/resource/total-kidney-volume-tkv-pkd/ (accessed on 22 June 2019).
  5. Chapman, A.B.; Bost, J.E.; Torres, V.E.; Guay-Woodford, L.; Bae, K.T.; Landsittel, D.; Li, J.; King, B.F.; Martin, D.; Wetzel, L.H.; et al. Kidney volume and functional outcomes in autosomal dominant polycystic kidney disease. Clin. J. Am. Soc. Nephrol. 2012, 7, 479–486. [Google Scholar] [CrossRef] [PubMed]
  6. Nieto, J.A.; Yamin, M.A.; Goldberg, I.D.; Narayan, P. An Empirical Biomarker-Based Calculator for Cystic Index in a Model of Autosomal Recessive Polycystic Kidney Disease—The Nieto-Narayan Formula. PLoS ONE 2016, 11, e0163063. [Google Scholar] [CrossRef] [PubMed]
  7. Torres, V.E.; Chapman, A.B.; Devuyst, O.; Gansevoort, R.T.; Perrone, R.D.; Koch, G.; Ouyang, J.; McQuade, R.D.; Blais, J.D.; Czerwiec, F.S.; et al. Tolvaptan in later-stage autosomal dominant polycystic kidney disease. N. Engl. J. Med. 2017, 377, 1930–1942. [Google Scholar] [CrossRef] [PubMed]
  8. Poggio, E.D.; Hila, S.; Stephany, B.; Fatica, R.; Krishnamurthi, V.; Del Bosque, C.; Goldfarb, D.; Herts, B.; Dennis, V.W.; Heeger, P.S.; et al. Donor kidney volume and outcomes following live donor kidney transplantation. Am. J. Transplant. 2006, 6, 616–624. [Google Scholar] [CrossRef] [PubMed]
  9. Narasimhamurthy, M.; Smith, L.M.; Machan, J.T.; Reinert, S.E.; Gohh, R.Y.; Dworkin, L.D.; Merhi, B.; Patel, N.; Beland, M.D.; Hu, S.L. Does size matter? Kidney transplant donor size determines kidney function among living donors. Clin. Kidney J. 2016, 10, 116–123. [Google Scholar] [CrossRef]
  10. Absy, M.; Metreweli, C.; Matthews, C.; Al Khader, A. Changes in transplanted kidney volume measured by ultrasound. Br. J. Radiol. 1987, 60, 525–529. [Google Scholar] [CrossRef]
  11. Chapman, A.B.; Wei, W. (Eds.) Imaging approaches to patients with polycystic kidney disease. Semin. Nephrol. 2011, 31, 237–244. [Google Scholar] [CrossRef]
  12. Moorthy, H.K.; Venugopal, P. Measurement of renal dimensions in vivo: A critical appraisal. Indian J. Urol. J. Urol. Soc. India 2011, 27, 169. [Google Scholar]
  13. Cheong, B.; Muthupillai, R.; Rubin, M.F.; Flamm, S.D. Normal values for renal length and volume as measured by magnetic resonance imaging. Clin. J. Am. Soc. Nephrol. 2007, 2, 38–45. [Google Scholar] [CrossRef] [PubMed]
  14. Turco, D.; Busutti, M.; Mignani, R.; Magistroni, R.; Corsi, C. Comparison of Total Kidney Volume Quantification Methods in Autosomal Dominant Polycystic Disease for a Comprehensive Disease Assessment. Am. J. Nephrol. 2017, 45, 373–379. [Google Scholar] [CrossRef] [PubMed]
  15. Bakker, J.; Olree, M.; Kaatee, R.; de Lange, E.E.; Moons, K.G.; Beutler, J.J.; Beek, F.J. Renal volume measurements: Accuracy and repeatability of US compared with that of MR imaging. Radiology 1999, 211, 623–628. [Google Scholar] [CrossRef] [PubMed]
  16. Nieto, J.A.; Zhu, J.; Duan, B.; Li, J.; Zhou, P.; Paka, L.; Yamin, M.A.; Goldberg, I.D.; Narayan, P. A modified elliptical formula to estimate kidney collagen content in a model of chronic kidney disease. PLoS ONE 2018, 13, e0190815. [Google Scholar] [CrossRef] [PubMed]
  17. Dai, X.-Y.; Zhou, L.; Huang, X.-R.; Fu, P.; Lan, H.-Y. Smad7 protects against chronic aristolochic acid nephropathy in mice. Oncotarget 2015, 6, 11930. [Google Scholar] [CrossRef] [PubMed]
  18. Jiang, W.; Xiao, T.; Han, W.; Xiong, J.; He, T.; Liu, Y.; Huang, Y.; Yang, K.; Bi, X.; Xu, X.; et al. Klotho inhibits PKCα/p66SHC-mediated podocyte injury in diabetic nephropathy. Mol. Cell Endocrinol. 2019, 494, 110490. [Google Scholar] [CrossRef]
  19. Grantham, J.J.; Torres, V.E. The importance of total kidney volume in evaluating progression of polycystic kidney disease. Nat. Rev. Nephrol. 2016, 12, 667–677. [Google Scholar] [CrossRef]
  20. Ross, I.; Ahn, H.J.; Roelof, B.; Barber, T.; Huynh, V.; Rockette, A.; Popovic, M.; Chen, J.J.; Steinhardt, G. Sonographic assessment of the effect of vesicoureteral reflux and urinary tract infections on growth of the pediatric solitary kidney. J. Pediatric Urol. 2015, 11, 145. [Google Scholar] [CrossRef]
  21. Harris, A.C.; Brownlee, E.M.; Ramaesh, R.; Jackson, M.; Munro, F.D.; MacKinlay, G.A. Feasibility of laparoscopic tumour nephrectomy in children. J. Pediatr. Surg. 2018, 53, 302–305. [Google Scholar] [CrossRef]
  22. Bilan, V.P.; Salah, E.M.; Bastacky, S.; Jones, H.B.; Mayers, R.M.; Zinker, B.; Poucher, S.M.; Tofovic, S.P. Diabetic nephropathy and long-term treatment effects of rosiglitazone and enalapril in obese ZSF1 rats. J. Endocrinol. 2011, 210, 293. [Google Scholar] [CrossRef] [PubMed]
Figure 1. Renal parenchymal area. (A) An H&E-stained coronal section (4×) superimposed on a 1 mm2 grid from the left kidney of a male obese ZSF1 rat. (B) The same renal section with labeled axes: white horizontal line represents major axis (a), yellow vertical line representing minor axis (b). The orange/brown outline around the kidney (white arrow) represents the measured renal parenchymal area, Am. (C) Again, the same renal section but with the minor axis extended (be) past the hilum (red line) to meet the imaginary dashed bar.
Applsci 09 03198 g001
Figure 2. Rat models of kidney disease. Representative photomicrograph (10×) of periodic acid Schiff-stained kidneys from a control (A) and a purumoycin aminonucleoside (PAN)-administered Sprague-Dawley (SD) rat. (B) Scarring of the glomerulus is clearly evident in the latter. Representative photomicrograph (4×) of Masson’s Trichrome-stained kidneys from an age-matched male SD rat (C) and an obese male ZSF1 rat (D). The ZSF1 rat exhibits scarring within the renal tubulointerstitium.
Applsci 09 03198 g002
Figure 3. Left kidney parenchymal area in healthy and diseased rats. Left kidneys were sourced from adult male and female obese ZSF1 rats, adult male SD rats and adult male SD rats administered PAN and sliced coronally. (A) A scatter plot of A, the renal parenchymal area calculated using the existing ellipse-based formula vs. Am, the measured renal parenchymal area. (B) A scatter plot of Ae, the renal parenchymal area calculated using the modified ellipse-based formula with the extended minor axis vs. Am, the measured renal parenchymal area. (C) In coronal renal slices, Am is greater than A (*, p < 0.01) but not different from Ae.
Applsci 09 03198 g003
Figure 4. Right kidney parenchymal area in healthy and diseased rats. Right kidneys were sourced from adult male and female obese ZSF1 rats, adult male SD rats and adult male SD rats administered PAN and sliced coronally. (A) A scatter plot of A, the renal parenchymal area calculated using the existing ellipse-based formula vs. Am, the measured renal parenchymal area. (B) A scatter plot of Ae, the renal parenchymal area calculated using the modified ellipse-based formula with the extended minor axis vs. Am, the measured renal parenchymal area. (C) In coronal renal slices, Am is greater than A (*, p < 0.01) but not different from Ae.
Applsci 09 03198 g004
Figure 5. Aristolochic acid + NaCl-induced kidney disease in mice. Representative photomicrograph (4X) of Masson’s Trichrome-stained kidneys from a control CD-1 mouse (A) and an aristolochic acid + NaCl-administered CD-1 mouse (B). Renal interstitial scarring is clearly evident in the latter.
Applsci 09 03198 g005
Figure 6. Renal parenchymal area in healthy and diseased mice (aristolochic acid + NaCl). Left and right kidneys were sourced from healthy adult male CD-1 mice or adult male CD-1 mice with aristolochic acid + NaCl nephropathy. (A) In coronal left kidney slices, Am is greater than A (*, p < 0.01) but not different from Ae. (B) In coronal right kidney slices, Am is greater than A (*, p < 0.01) but not different from Ae.
Applsci 09 03198 g006
Figure 7. Streptocozocin (STZ) + NaCl-induced kidney disease in mice. Representative photomicrograph (4×) of Masson’s Trichrome-stained kidneys from a control 129/Sv mouse (A) and an STZ + NaCl-administered 129/Sv mouse (B). Acute tubular necrosis and renal interstitial scarring is clearly evident in the latter.
Applsci 09 03198 g007
Figure 8. Renal parenchymal area in healthy and diseased mice (STZ + NaCl). Left and right kidneys were sourced from healthy adult male and female SV129 mice or adult male and female SV129 mice with diabetic nephropathy. (A) In coronal left kidney slices, Am is greater than A (*, p < 0.01) but not different from Ae. (B) In coronal right kidney slices, Am is greater than A (*, p < 0.01) but not different from Ae.
Applsci 09 03198 g008
Figure 9. Measured vs. calculated total kidney volume (TKV). (A) An H&E-stained coronal renal slice from a PCK rat. The major axis (a), minor axis (b), and extended minor axis are shown (be). (B) Kidney volume calculated using the existing formula was lower than measured TKV whereas kidney volume calculated using the modified formula was not different from the measured TKV (*, p < 0.01 vs).
Applsci 09 03198 g009
Table 1. Summary of the murine and rat models utilized in study.
Species/StrainDisease ModelNumber of Kidneys
SD RatHealthy8
SD RatPAN Glomerulosclerosis16
PCK RatPolycystic Kidney Disease (PKD)40
Obese ZSF1 RatMetabolic Syndrome20
CD-1 MiceAristolochic Acid + NaCl Nephropathy36
SV129 MiceSTZ + NaCl Nephropathy26
Table 2. Summary of calculated parenchymal areas as a percentage of the measured area using the elliptical formula and the modified elliptical formula.
ModelKidneyElliptical (% Measured)Modified Elliptical (% Measured)
Healthy and Diseased RatLeft87.5 *101.6
Right85 *99
Aristolochic MiceLeft84 *97.5
Right87 *102
Aristolochic + Blinded MiceRight87 *98
STZ MiceLeft86.5 *97
Right87 *96
*, p < 0.05 vs. measured parenchymal area.

