A Systematic Review of the Discrepancies in Life Cycle Assessments of Green Concrete


1
Department of Mechanical and Construction Engineering, University of Northumbria, Newcastle upon Tyne NE1 8ST, UK
2
CERIS, Civil Engineering, Architecture and Georesources Department, Instituto Superior Técnico, Universidade de Lisboa, Av. Rovisco Pais, 1049-001 Lisbon, Portugal
3
Department of Civil Engineering, Technical Engineering College, Erbil Polytechnic University, Erbil 44001, Kurdistan-Region, Iraq
*
Authors to whom correspondence should be addressed.
Appl. Sci. 2019, 9(22), 4803; https://0-doi-org.brum.beds.ac.uk/10.3390/app9224803
Submission received: 30 September 2019
/
Revised: 4 November 2019
/
Accepted: 7 November 2019
/
Published: 10 November 2019
(This article belongs to the Special Issue Low Binder Concrete and Mortars)
Abstract
:It is challenging to measure the environmental impact of concrete with the absence of a consensus on a standardized methodology for life cycle assessment (LCA). Consequently, the values communicated in the literature for “green” concrete alternatives vary widely between 84 and 612 kg eq CO2/m3. This does not provide enough evidence regarding the acclaimed environmental benefits compared to ordinary Portland cement concrete knowing that the average for the latter was concluded in this study to be around 370 kg eq CO2/m3. Thus, the purpose of this study was to survey the literature on concrete LCAs in an attempt to identify the potential sources of discrepancies and propose a potential solution. This was done through examining 146 papers systematically and attributing the sources of error to the four stages of an LCA: scope definition, inventory data, impact assessment and results interpretations. The main findings showed that there are 13 main sources of discrepancies in a concrete LCA that contribute to the incompatibility between the results. These sources varied between (i) user-based choices such as depending on a cradle-to-gate scope, selecting a basic volume-based functional unit and ignoring the impact allocation and (ii) intrinsic uncertainty in some of the elements, such as the means of transportation, the expected service life and fluctuations in market prices. The former affects the reliability of a study, and hence, a concrete LCA methodology should not allow for any of the uncertainties. On the other hand, the latter affects the degree of uncertainty of the final outcome, and hence, we recommended conducting scenario analyses and communicating the aggregated uncertainty through the selected indicators.
1. Introduction
For every living individual, around 4 tonnes of conventional concrete, comprised primarily of ordinary Portland cement (OPC) and naturally sourced aggregates (NA), were produced in 2015 [1]. Due to its inherent strength and durability properties, concrete is the second most used substance on Earth after water [2]. Unfortunately, the use of concrete is associated with immense negative environmental impacts. The current production rate of more than 4 billion tonnes of OPC annually is responsible for 7% of the global CO2 emissions [3]. It also risks depleting natural resources, since more than 50 billion tonnes of aggregates are being extracted annually [4]. Concrete has an environmental impact of 320 kg eq CO2/m3 on average as will be concluded in the next section of this paper, of which 90% is attributable to OPC [5]. Although this is less than that of steel and most polymers per unit mass [6], the intensive use of OPC concrete results in alarming environmental hazards. In China for example, the over-reliance on concrete alone resulted in approximately 1.5 billion tonnes of greenhouse gases (GHG) emissions in 2014 [7], which represents around 20% of the total produced in the same year [8]. Nevertheless, projections indicate that the growing global urbanization will double the demand on concrete by 2050 [9].
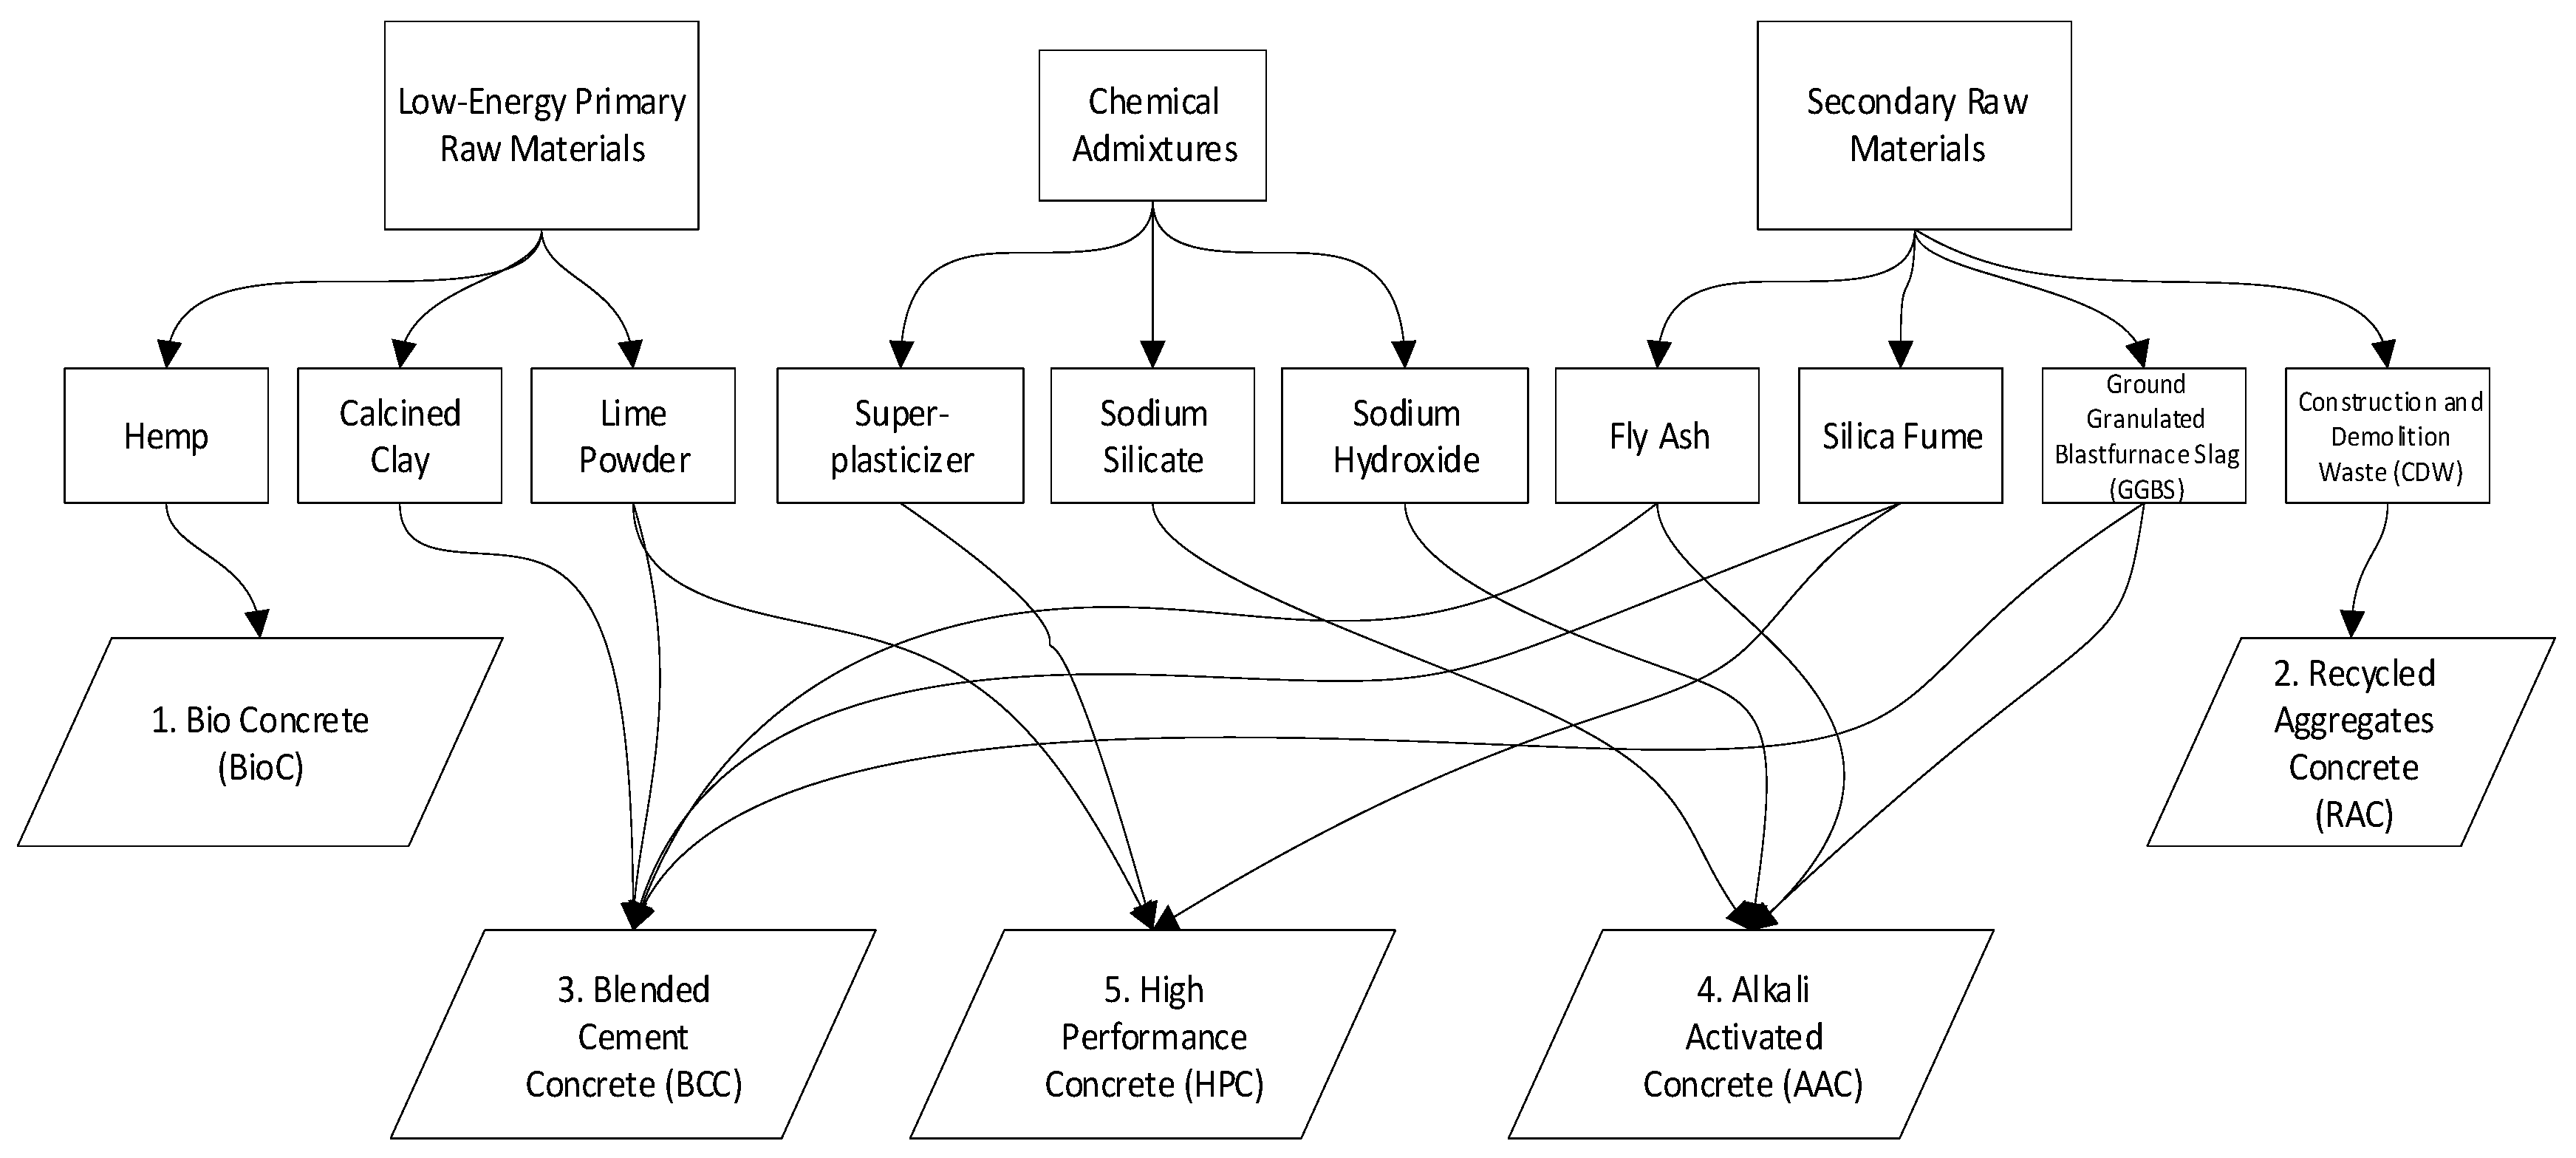
Hence, recent research has been directed to meet the “2015 Paris climate conference” guidelines of enhancing the sustainability of concrete [10]. As seen in Figure 1, there are five main families of concrete types found in the literature that are considered more eco-friendly [11,12,13,14,15,16,17,18,19,20,21,22,23,24,25,26,27,28,29,30,31,32,33,34,35,36,37,38,39,40,41,42,43,44,45,46,47,48,49]. Those are the types that were chosen to be studied in this paper as a sample for green concrete. First, there is the use of natural materials, such as bacteria, and agricultural waste, such as hemp [11], in order to create natural biological concrete (BioC) with reduced environmental impact. Second, there is recycling aggregate concrete (RAC), where construction and demolition wastes (CDWs) are used as aggregates in concrete. This reduces the landfill potential of concrete by 50–75% and its embodied carbon by 10–30% [12,13]. Blended cement concrete (BCC), where OPC in the binder, is partially replaced with various pozzolanic materials called supplementary cementitious materials (SCM), and is considered the third family. Examples of these are secondary materials such as fly ash (FA), which is a by-product of coal combustion; ground granulated blastfurnace slag (GGBS) which is a by-product of steel manufacturing; and silica fume (SF), which is generated from glass manufacturing. Additionally, some primary materials that are manufactured with lower energy demands than OPC can be used to partially replace it, such as calcined clay (CC) and lime. The mechanical and durability properties of the resulting concretes vary significantly between the different types of materials and the percentages by which OPC is being replaced, and similarly, the environmental impact varies [50]. For example, the embodied emissions of concrete could decrease by up to 30% and 60% with the incorporation of 35% and 70% of FA and GGBS, respectively [51]. In order to totally replace OPC, alkali activated concretes (AAC), are made with precursors of 100% FA, (CC) or GGBS that are activated using an alkaline solution from usually sodium hydroxide or sodium silicate. This is the forth concrete type selected in this study. AAC causes 70–75% less GHG emissions compared to OPC concrete [52]. The fifth family is high performance concrete (HPA), which is recognized as a concrete type with enhanced mechanical and durability properties compared to OPC concrete (OPCC). This allows for a reduction in the required volume of concrete in certain applications. Additionally, the concrete mixes are prepared with fillers such as lime powder to increase the particle packing of the mixing components, which minimizes the required amount of binder [15]. This potentially yields a binder with less environmental impact than OPCC.
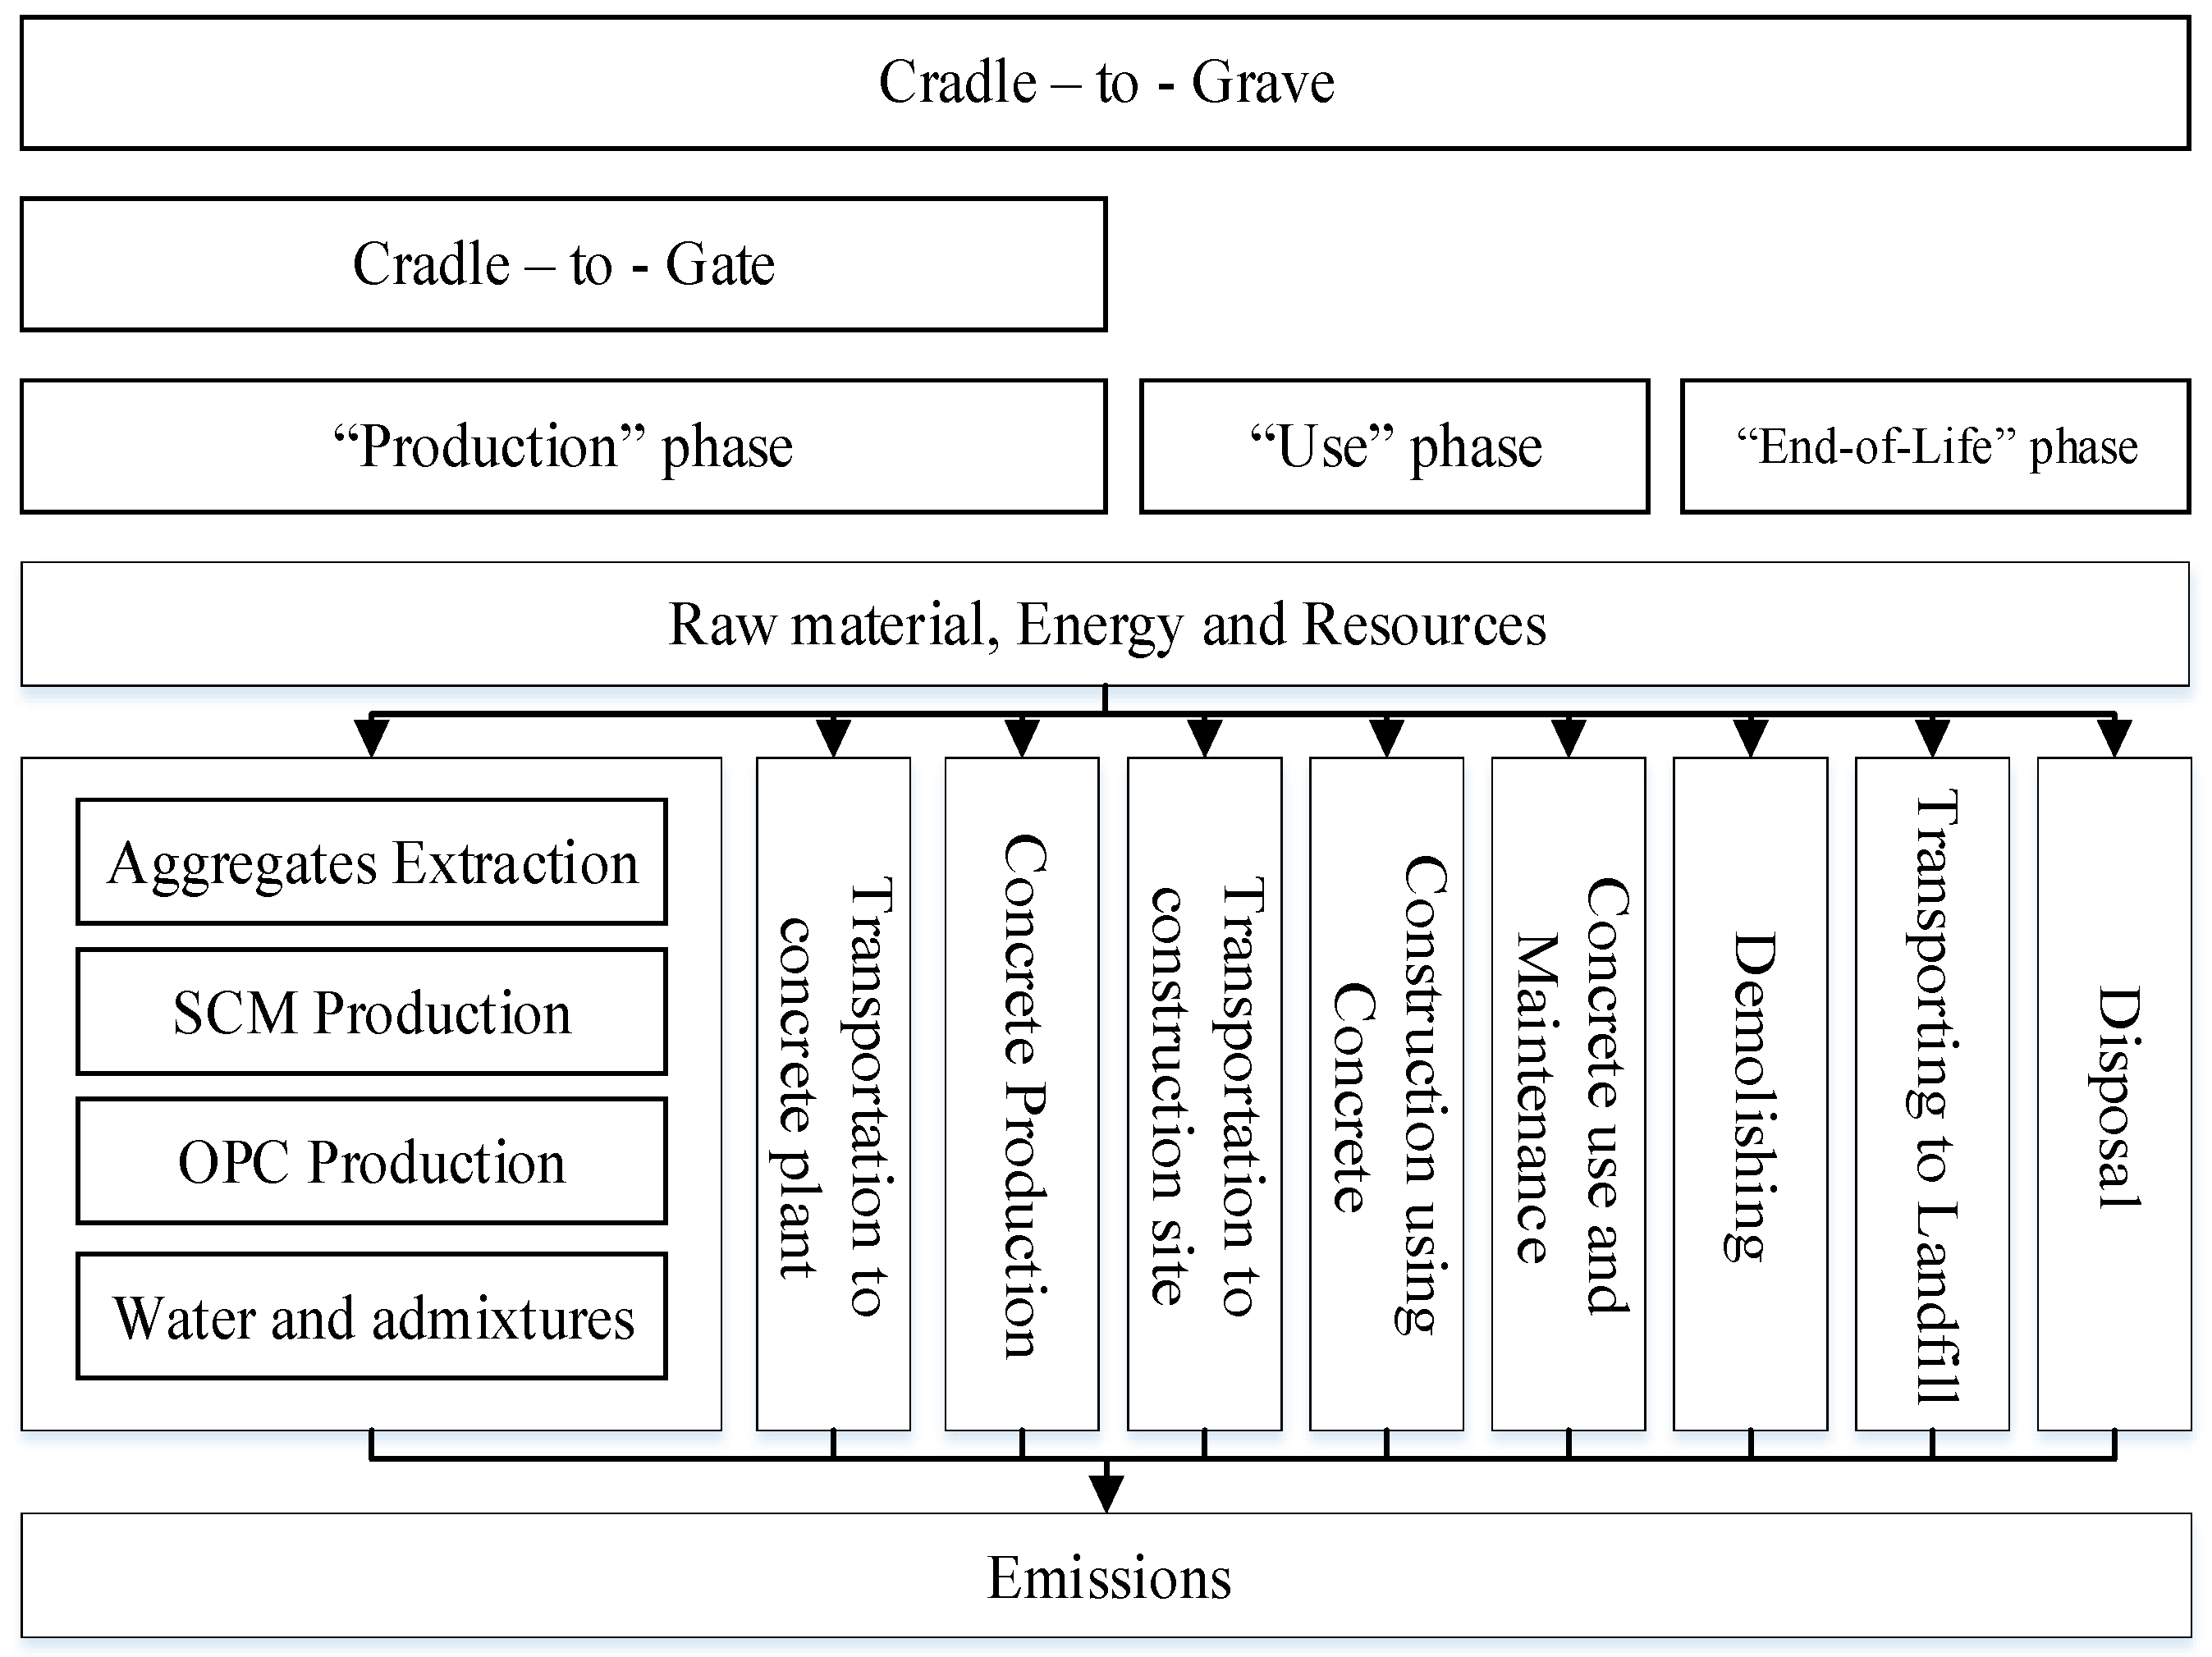
Therefore, the starting point of studying a green concrete type is to create alternative concrete types that reduce the environmental impact of OPCC [52]. Life cycle assessment (LCA) is the most widely-accepted tool to assess and compare these acclaimed environmental benefits [53]. According to ISO 14040:2006, LCA is defined as “the compilation and evaluation of the inputs, outputs and potential environmental impacts of a product system throughout its life cycle.” An LCA study is divided into four main stages: (i) Scope and goal definition. (ii) Defining the inventory for the life cycle processes. (iii) Characterizing and measuring the life cycle impact. (iv) Interpretation of the results [54]. First, goal and scope definition involves outlining the system boundary, the functional unit (FU) selection and any assumptions and/or limitations that need to be considered. A system boundary of a concrete product could be cradle-to-gate, which means including all processes and emissions until the production of its different constituents, or cradle-to-grave which includes the “Use” and “End-of-Life” phases as per Figure 2 [55]. A Cradle-to-Cradle LCA scope is that which assumes that all waste generated will be recycled in the future [23].
A FU is the basis for quantifying the inputs and outputs between alternatives. Hence, its selection needs to be reflective of the nature of the LCA subjects [56]. The second LCA stage includes collecting the data of energy and emissions associated with the aforementioned scope. The data needed for standard processes can mostly be obtained from primary sources or found in databases such as Ecoinvent and European reference Life Cycle Database (ELCD) [57]. A further source of inventory data is the environmental product declarations (EPD) of the concrete’s raw materials, which are produced by the local manufacturers according to a local binding legal framework [16]. At this stage, it is also important to decide on allocation, which is basically portioning the environmental burden of the original process to the product under study [17]. The third and final stage of an LCA is to calculate the environmental impact of the product being studied. This is performed by adding up the individual impacts of all the associated processes as per ISO 14040:2006 to calculate an environmental impact indicator, a number that makes the output of the impact assessment study more understandable to the user [58]. According to Menoufi [59], there are two main types of indicators: mid-point indicators, which correlate with the estimated impact of a specific change in the environment, such as global warming potential, and end-point indicators, which correlate that same impact to damages via cause–effect changes, such as human health.
As explained before, the LCA of green concrete cannot be easily assessed. In fact, there are a lot of uncertainties in the assessment process due to lack of a standardized methodology. To highlight this issue, an attempt was made by this study to compare the absolute values for the environmental impacts of the aforementioned green concrete types to that of OPCC, by considering around 300 different mixes from 39 journal papers [11,12,13,14,15,16,17,18,19,20,21,22,23,24,25,26,27,28,29,30,31,32,33,34,35,36,37,38,39,40,41,42,43,44,45,46,47,48,49]. Using the most predominant environmental impact indicator, global warming potential (GWP), the impact per unit volume of the concrete mixes varied between 110 and 600 kg eq CO2/m3, as shown in Figure 3. Assuming the results from these values have a normal distribution, the mean value would be around 320 kg eq CO2/m3 while the standard deviation would be around 90 kg eq CO2/m3. This is indicative of large discrepancies that could challenge the original argument that these concrete mixes cause less environmental impact compared to OPCC. Nonetheless, the absolute values communicated for the OPCC using the same indicator (GWP) were found to also vary widely. Upon reviewing 80 mixes from 20 papers, the mean value was found to be around 370 kg eq CO2/m3 with a standard deviation of around 110 kg eq CO2/m3, as shown in Figure 3. Therefore, this systematic review paper was presented in order to critically examine each stage of the LCA studies carried out by researchers in the domain of green concrete in order to identify the sources of the discrepancies. Huijbregts [60] attributes these large discrepancies to the uncertainties involved in the current use of LCA methodology. Hafliger [61] claim that the source of these uncertainties are modelling choices by the user of the system boundary, FU and source of data. On the other hand, Menoufi [27] differentiates between the uncertainties due to the nature of the inventory data used and those from choices such as the impact allocation and FU. The first affects the precision of the results due to the fact that the elements included in the study include a percentage of uncertainty, while the latter affects the reliability of the study. Hence, in this paper, which is the first of its kind to systematically tackle the sources of discrepancies in concrete LCA studies, the same categorization will be followed. Hence, the objective of this review was to provide the concrete LCA user with a coherent, state-of-the-art guide to avoid the sources of reliability error and to solve the issues caused by the sources of uncertainty.
2. Methodology of the Systematic Review
The scope of the systematic review was to examine the methodology of LCA studies performed on green concrete, along with OPCC, in order to track down the sources of discrepancies. A total of 11,000 references were found after searching online databases such as Science Direct, Taylor and Francis and Scopus using a combination of the following keywords:
- -
- LCA;
- -
- Concrete;
- -
- Cement;
- -
- SCM;
- -
- Sustainable;
- -
- Methodology.
First, the references were filtered based on their titles, then on their abstracts, and finally, on full paper analysis. The point of preference was that the study included either an LCA study on an OPCC or any of the green concrete types in the scope (exploratory) or a review of the environmental impact of any of these types; or it could be a paper that studies the methodology of a concrete LCA. The 146 references [14,15,16,17,18,19,20,21,22,23,24,25,26,27,28,29,30,31,32,33,34,35,36,37,38,39,40,41,42,43,44,45,46,47,48,49,50,51,52,53,54,55,56,57,58,59,60,61,62,63,64,65,66,67,68,69,70,71,72,73,74,75,76,77,78,79,80,81,82,83,84,85,86,87,88,89,90,91,92,93,94,95,96,97,98,99,100,101,102,103,104,105,106,107,108,109,110,111,112,113,114,115,116,117,118,119,120,121,122,123,124,125,126,127,128,129,130,131,132,133,134,135,136,137,138,139,140,141,142,143,144,145,146,147,148,149,150,151,152,153,154,155,156,157,158,159] selected were divided into categories: 107 “exploratory” articles, 23 “methodology” articles, and 16 reviews. The distribution of the exploratory LCA references between the six concrete types studied was found to be almost 50% BCC, as shown in Figure 4a. In addition, most of the references were published during the last 10 years (2009–2019) as seen in Figure 4b. The countries of origin of the publications are shown in Figure 4c. The method followed in order to come up with the sources of discrepancies was examining the methodology of each of the 107 “exploratory” studies and pointing out anomalies across the four LCA stages. Hence, the review is divided into four subsections, for each of the sources found in the corresponding LCA stages as follows.
3. Sources of Discrepancies in LCA Stages
3.1. Stage 1: LCA Scope
3.1.1. System Boundary
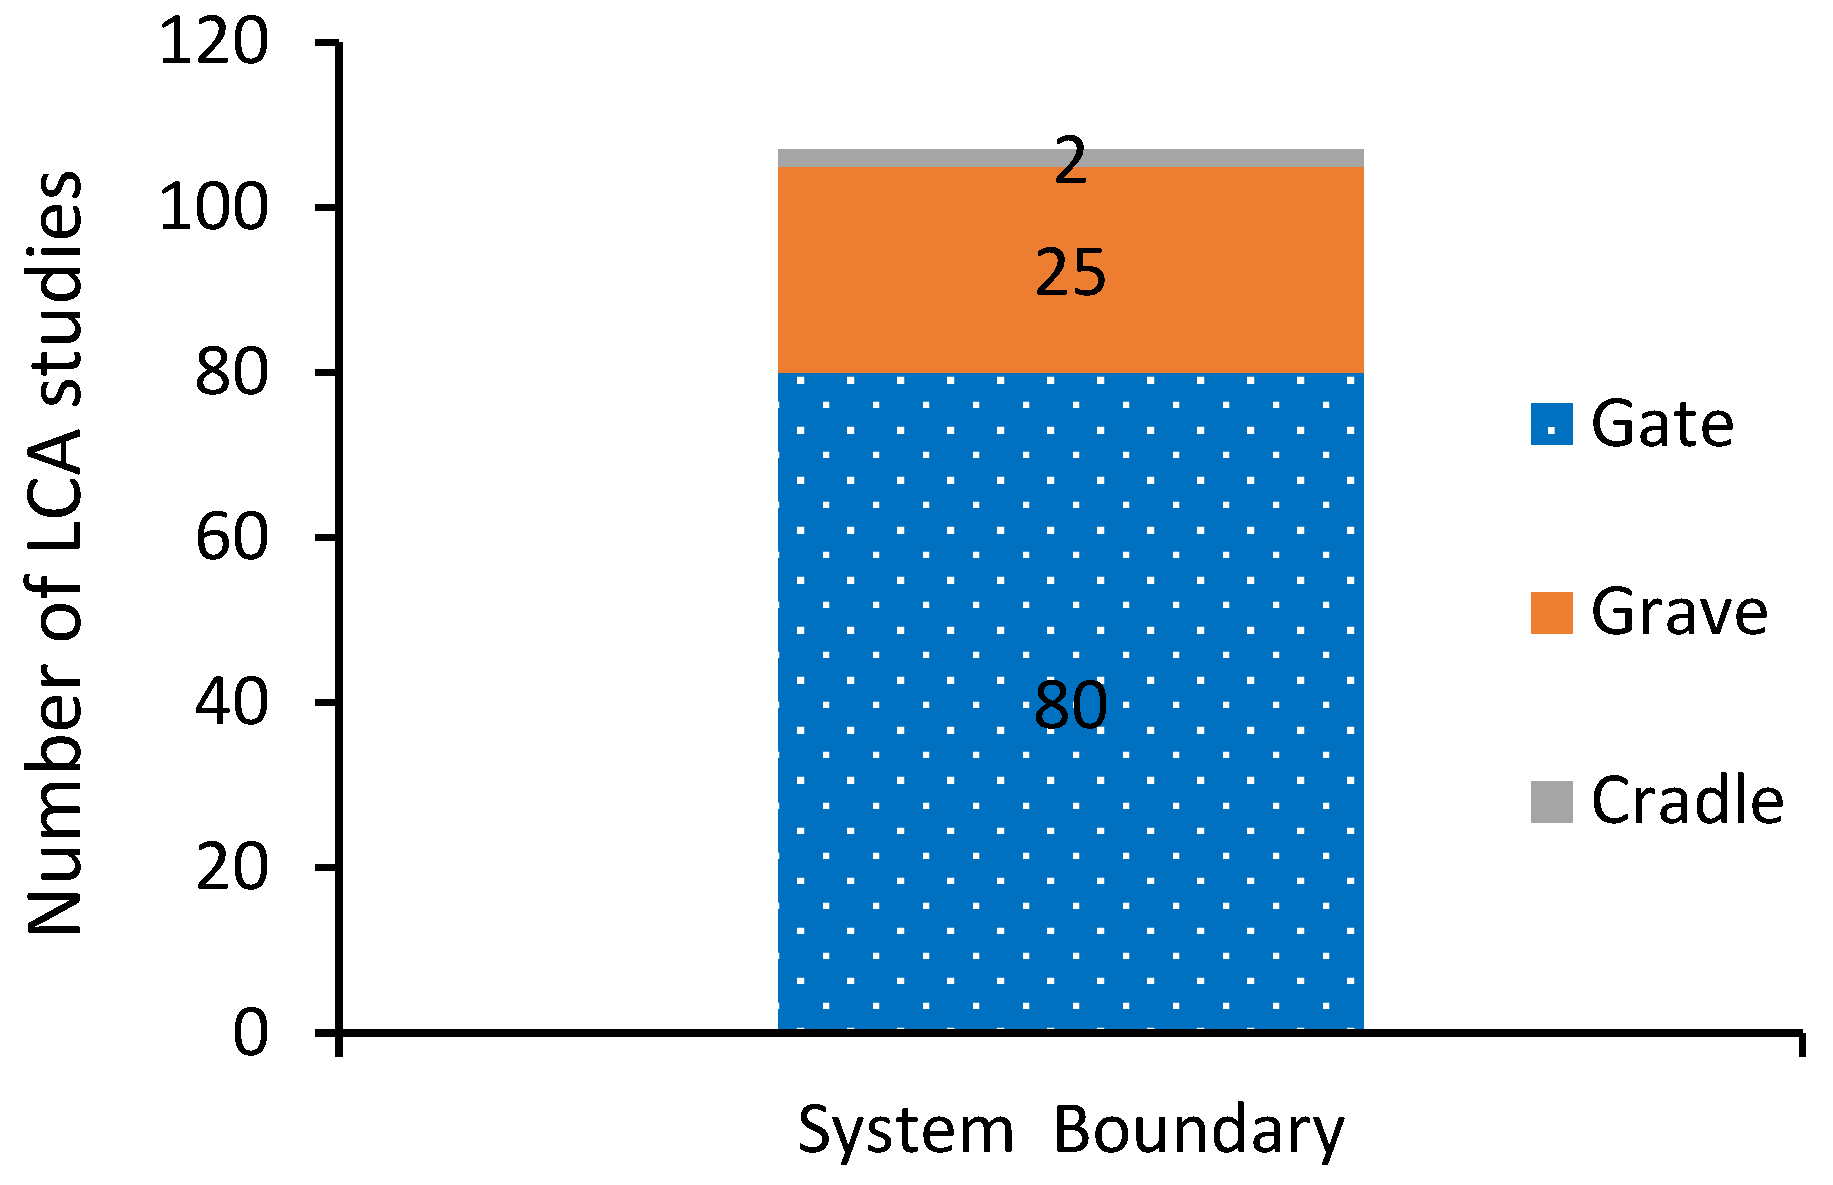
More than 75% of the studies (107) we reviewed, in which an LCA study was actually conducted, used a cradle-to-gate system boundary, as shown in Figure 5. A cradle-to-gate system boundary would limit the scope of the processes and resulting emissions and energy studied in the LCA up until the production stage, excluding the use and end-of-life stages. As stated by Wu et al. [24] the ISO 24067, released in 2013 to provide a benchmark for the LCA methodology, specifies that for a user to exclude the use and end-of-life stages while conducting an LCA, there needs to be enough evidence that the results will not be affected by this. Hence, it would not be acceptable to cut-off the use and end-of-life phases from the scope due to the following reasons (i–iii):
(i) Throughout its “use” phase, concrete exhibits carbonation, a process by which carbon dioxide is absorbed by the concrete from the exposed environment reacting with the calcium compounds in its matrix, forming carbonates [62]. A justifiable cut-off percentage is when the processes affects less than 1% of the total environmental impact according to Wu et al. [16] and 5% according to Gursel et al. [63]. However, through the carbonation process, concrete can absorb, throughout its whole service life, 13–48% of the carbon dioxide it emitted during the production phase [62]. This value of the captured carbon dioxide, denoted as carbon sequestered, varies depending on the concrete type, exposure conditions and geometry [44]. Out of the 107 references, only seven included the sequestered carbon in the LCA study, with varying values, as seen in Table 1. OPCC can capture up to 47% of its embodied carbon during use and end-of-life phases, while BCC can capture only up to 22% [39]. In all cases, it is apparent that the sequestered carbon ought to be included in an LCA study to allow for its value to be deducted from the carbon emissions in the remaining processes.
(ii) By omitting the use phase, the user is also assuming that all concrete mixes being compared will sustain the required service life. However, the findings in Table 2 show proof from the literature that this assumption is not true. Depending on the exposure conditions, concrete cover and the concrete mix, there is a high probability that a reinforced green concrete mix is unable to fulfil its required service life, especially one above 60 years [61]. Hence, according to Panesar et al. [56], there should be at least a 20% increase in the environmental impact of concrete to account for the potential maintenance that allows it to fulfil its service life requirements. Nevertheless, Tae el al. [15] set the expected CO2 emissions for concrete at 0.60 eq kg CO2/m3/year in service. Additionally, it was also proposed that a replacement factor N, which is a ratio between the reference service life of the concrete member studied and its predicted service life, needs to be included as a multiplying factor to the environmental impact of the concrete under study to make the calculation more relative, and therefore, reliable [61]. That, then, shows that there is a major underestimation of the environmental impact—the relative and absolute environmental impacts—of concrete if the maintenance/replacement impact is not considered as a part of the “use” phase of the LCA.
(iii) Having an end-of-life phase (which could be achieved by considering a cradle-to-grave boundary or a cradle-to-cradle one) included in the LCA system boundary is a prerequisite to studying RAC. De Schepper et al. [23] assumed that the aggregates used in a concrete mix were fully recyclable. By selecting a cradle-to-cradle system boundary, it was calculated that avoiding the landfilling of concrete reduces the environmental impact compared to OPCC by 4%–15%. Ding et al. [34], they included the avoided-landfilling potential for recycled CDW in the LCA and the result was that the environmental indicator CMR, consumption of natural resources, decreased by 46%. Apart from that, when the service life of a concrete product ends, the demolition process requires energy. Whether the waste will be re-used or not is an unknown at the LCA study stage. However, as seen in Table 3, the energy and impact required for the demolition of concrete constitutes 2%–10% of an average 320 kg eq CO2/m3 of concrete, which means that it should not be ignored.
3.1.2. Functional Unit Selection
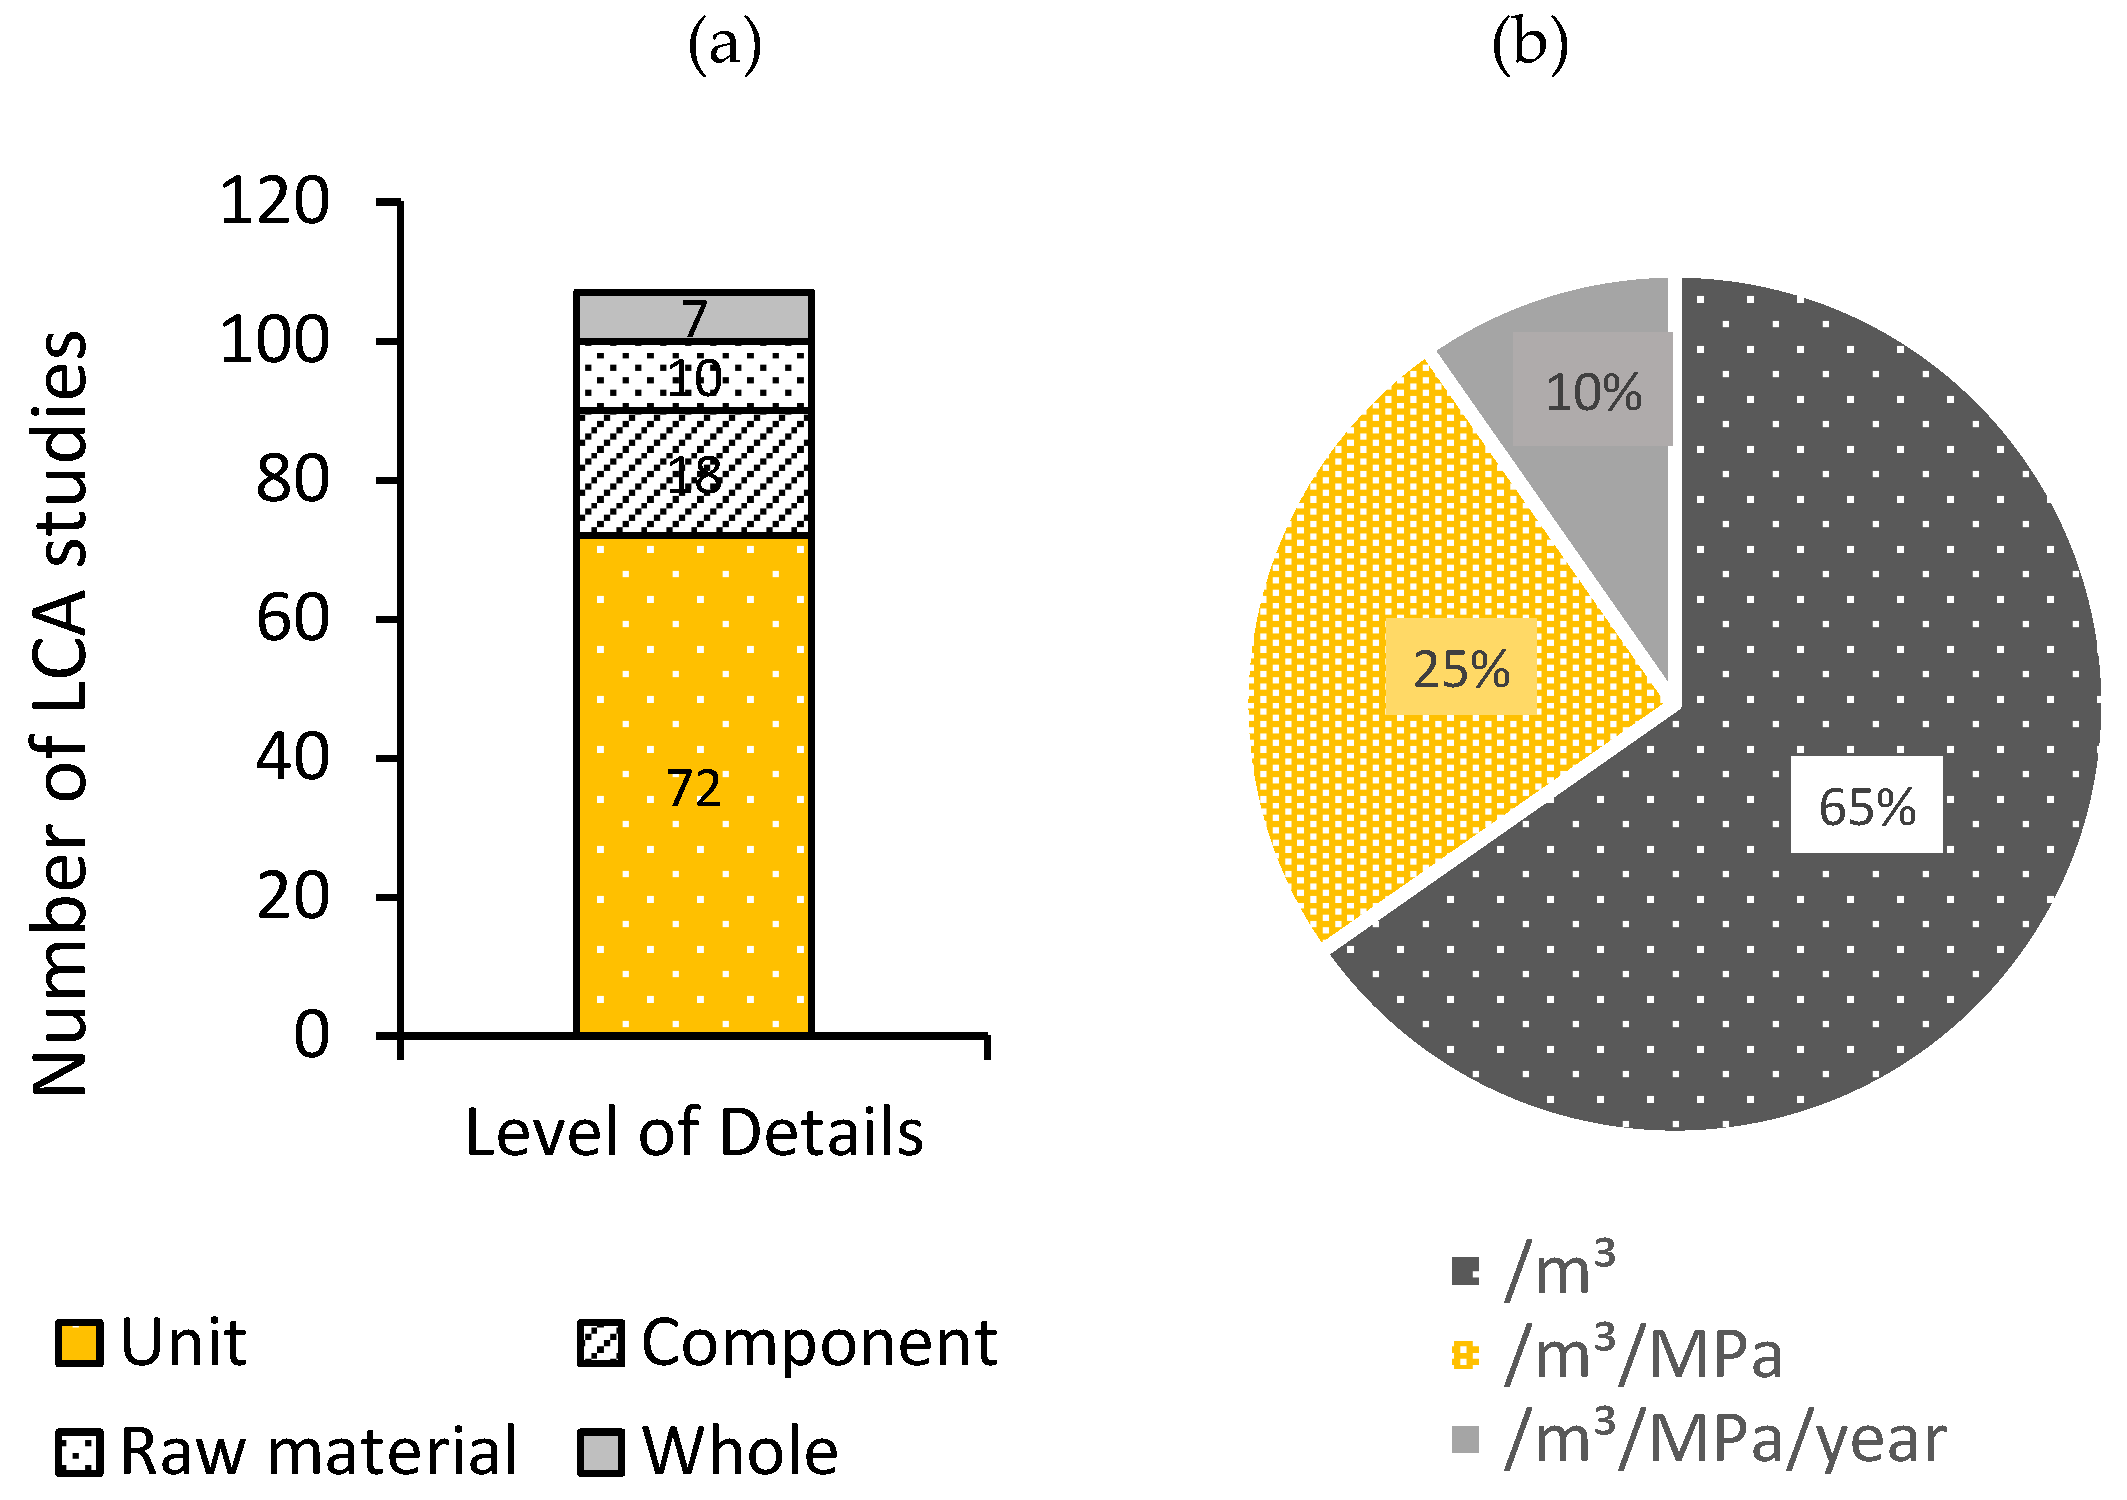
The second part of the LCA scope that the user selects is the FU. According Panesar et al. [56], a functional unit is the element that dictates how the inputs and outputs of the LCA are quantified. There are four main levels for functional units of concrete: a whole structure or a building, which was selected by around 6% of the 107 studies reviewed, as seen in Figure 6; or a component of a structure such as a beam, column or a bridge girder, and only 16% of the studies opted for that. The most famous level of detail (LOD) studied in concrete LCA is the material unit for concrete, which was selected by around 70% of the references. A unit-based FU for concrete is divided into: volume-based, volume-based while considering the strength of concrete and volume-based while considering both the strength and service life of concrete. Panesar et al. [56] claims that it is not accurate to call a unit volume a FU since it is not indicative of enough comparable functional properties. It should be called a declared unit instead. However, as seen in Figure 6, 65% of the references reviewed in this paper where a unit-based FU was selected did not consider strength nor durability; 25% considered strength and only 10% considered both. According to Zhang et al. [68], depending on the type of unit-based FU selected, the results for the LCA study might vary up to 30%. In order to further investigate this through our systematic review, the following examples were prepared.
In terms of the difference in strength between the concrete alternatives in question, for RAC, maintaining the same binder, replacing fresh aggregates with coarse and/or fine recycled aggregates from CDW, will decrease the strength of the resulting mix (coarse aggregate (RC) and fine aggregate (RF) respectively) [58]. This decrease in strength of the concrete incorporating the recycled aggregates can sometimes be larger than the associated decrease in environmental impact. Hence, as shown in Figure 7, it is clear that when a FU of kg eq CO2/MPa was used instead of just kg eq CO2, the environmental impact of the mixes with the recycled aggregates turned out to be larger than that of OPCC, not less [69].
For BCC types, the results from Celik et al. [21] suggested that the optimum replacement of OPC with FA in terms of minimizing environmental impact in a BCC mix is 70%. However, adding FA beyond a certain threshold would significantly decrease the compressive strength of concrete [35]. As seen in Figure 8, when the same GWP results were modelled using a FU of kg eq CO2/m3/MPa instead of a volume-based kg eq CO2/m3, the optimum replacement percentage dropped to only 40%. Smaller gaps between both FU results were found when examining the results for GGBS from Bilim et al. [19], as seen in Figure 8. This could be due to the fact that the results for the compressive strength were tested after 90 days of curing instead of the common 28, at which the pozzolanic reaction would mature and most BCC mixes would achieve comparable strength to that of OPCC [70].
According to Mahima et al. [71], premature concrete deterioration, due to carbonation and chloride penetration, is responsible for a loss of 2.2 trillion USD, which is equivalent to 3% of the world’s gross domestic product (GDP). This means that durability is a more detrimental factor to the performance of concrete than that of the compressive strength. Thus, the durability of concrete is an essential factor that needs to be included when the LCA of reinforced BC concrete is compared to reinforced OPC concrete. Panesar et al. [56] defined a FU where the volume of the BC concrete is multiplied by its compressive strength and the chloride ion penetration resistance, and is compared to the FU of an equivalent OPC concrete. Similarly, Celik et al. [21] and Kurda et al. [69] used experimental data of the different BCC mixes in terms of compressive strength and chloride penetration to compare the performance of BCC with OPCC. However, for the absolute environmental impact values to be credible, these durability properties need to be translated into the service life to describe a performance parameter of concrete [59]. Heede and De Belie [47] accounted for a 100 year timeframe as the service life of concrete, but only carbonation was used to determine the service life. Sagastume-Gutierrez et al. [57] devised a FU that divides the volume of cement by the number of years of durability from both chloride penetration and carbonation. Furthermore, an accurate methodology was proposed by Gettu et al. [30], where the test results of thirty different BC concrete mixes were incorporated into a FU (A-indices) that converts carbonation and chloride penetration parameters into expected service-life predictions. However, in all of the aforementioned, concretes with more than 100 years of durability will have a better environmental impact using both indices, while the specified service life for the mix is only 100 years. The same applies to compressive strength. Not capping the performance nor the durability of the concrete being studied, though it maximizes the sustainability potential according to Muller et al. [72], impinges upon the performance base specifications of the concrete. Instead, performance-based specifications similar to those in the framework proposed by Hafez et al. [55] should be adopted. Finally, according to Sagastume-Gutiérrez et al. [57], the comparison between the environmental impacts of two construction materials can be reliable, only after considering the combined effects of mechanical and durability characteristics.
The user’s choice for a unit-based LOD could be based on a personal preference or absence of the necessary details about the project, such as the quantity of concrete per member or per a whole structure. However, the benefit of studying the member or a whole structure in which the concrete mix would be a part adds is that it another important factor to the equation, which is the optimization of the total volume. For example, increasing the prescribed strength requirement for concrete from 25 MPa to 50 MPa in a solid slab building would decrease the volume of concrete needed by around 15%, especially with columns [28]. It is recommended, therefore, to run a parametric analysis on the concrete under study based on compressive strength, strength, service life and the resulting volume, and hence, the combined environmental impact.
3.2. Stage 2: Inventory Data
The second source of uncertainties and unreliability in LCA results after the scope definition is LCA inventory (LCI). This is the data collection stage, in which the input and output factors, including energy, raw materials, products and waste, are analysed for the LCA of concrete. The LCI for a concrete mix mainly include: (a) upstream processes: those involved in the production of each of the constituents and its transportation to the concrete production plant; (b) core processes which involve the energy and emissions required for mixing concrete and transportation to site; and (c) downstream processes needed for the demolition or any other end-of-life scenario [24]. Out of all the inputs/outputs data from these processes, it is primarily important to quantify the emissions and energy-use rather than the oil use, waste generated and the rest [63]. Upon reviewing the necessary literature, it shows that LCI data is a major contributor to the uncertainty in a concrete LCA study due to the following reasons (i–iv):
(i) The LCI source has no standards as to where and how to get LCI data for a LCA of concrete. Anand and Amor [73] stated that concrete inventory data should come from primary sources for reliability purposes or secondary sources if the former is not available. Primary data could be lab results, governmental reports or EPDs from the building industry to which the user has access. EPDs are standardized documents to communicate the environmental performance of a product that are accredited by local authorities [74]. On the other hand, secondary data could be from accredited environmental databases, such as EcoInvent, GaBi and ELCD database or just using previously published data from the literature. By examining the 107 papers that actually included an LCA study, it was found that more than half, as seen in Figure 9, opted for the use of secondary sources for inventory data, which could not be reliable enough to describe the special scenarios being modelled in the concrete LCA. Although EcoInvent (which was developed by the Ecoinvent Centre, a competence centre of the Swiss Federal Institutes) and GaBi (which was created by Thinkstep Inc.) are updated annually to reflect any changes in the inventory data included, the environmental impact of concrete when modelled using the Ecoinvent database and EPDs has a variability of up to 20% [61]. Hence, it is suggested that the priority in the source of upstream processes of a concrete mix is for EPDs and in the case of several EPDs, an average should be taken. The reason is that EPDs are done in accordance with the same process, an LCA, under the guidance and supervision of local authorities such as the Green Building Council of Australia’s concrete [75]. This would contribute to standardized processes and more efficient error tracking of concrete LCAs.
(ii) Apart from the reliability issue of the choice of the suitable LCI for the data, the existing data in each of the LCI sources contain large uncertainties. Looking into 25 papers, the inventory impact for OPC was found to vary between 691 kg eq CO2/tonne and 1452 eq kg CO2/tonne as shown in Figure 10. The reason could be that the OPC production process is different in efficiency between one producer and the other [76]. Additionally, the upstream process for OPC production depends on the electricity mix of the country of origin. For example, in the U.S. about 8% of the OPC used is imported and the upstream inventories of the imported clinker specific to the country of origin, as well as the energy consumed in transporting the OPC to the US, would increase the resulting impact of the OPC over the local alternatives [63]. The electricity mix in China almost has twice the environmental impact as that of Malaysia, Indonesia and Thailand due to, for example, the higher dependency on fossil fuel in electricity generation [31]. In all cases, the discrepancy in the impact of cement attributed has a great impact on the final environmental impact calculated through an LCA for a concrete alternative.
(iii) The variability in inventory data is not only in the OPC, but as seen in Table 4, it is the same with the rest of the concrete mix components. The most variable components found were the supplementary cementitious materials, such as FA, GGBS and SF whether in BCC or AAC mixes. The reason behind this could be attributed to the case of environmental impact allocation. Impact allocation is the process of portioning the environmental burden of the original process to the waste material being recycled in the product under study [17]. According to the EU directive 2008, waste can be considered to be a by-product when its further use is certain, it is produced as an integral part of a production process, it can be used without any further processing other than normal industrial practice and its further use is lawful [77]. All four points apply to FA, GGBS and SF; hence, they ought to be considered by-products, not waste. This means that they ought to be allocated a percentage of the environmental burden of their original production processes, which are coal combustion, steel production and glass manufacturing, respectively [19]. The first impact allocation scenario is “mass allocation” where the percentage allocation is based on the relative mass between the waste material as a by-product and the total mass (the effective mass of electricity + the mass of FA) as shown in Equation (1). The second scenario is “economic allocation” in which the percentage allocated is based on the relative market value between the final product, which is FA, and electricity, as per Equation (2) [77].
Hence, it is seen as a reliability requirement for LCA studies, including SCMs, to include an impact allocation scenario. However, upon reviewing the literature, it was found that out of 59 exploratory LCA studies of green concrete involving SCMs, only 14 (25%) of the LCA studies included an allocation scenario. Eight papers included economic allocation scenarios while six included both of them. According to Marinkovic et al., in case the difference between the price of main and secondary process generating the SCM product is more than 25%, economic allocation should be applied. However, the fact that the fluctuation in market prices of the raw materials should now be a part of the environmental impact assessment of concrete through the economic allocation, creates room for further discrepancies in the results, as seen in Table 5. It is recommended to keep the LCA results of concrete limited to the time frame for which the prices of the raw materials still stand unchanged.
(iv) Another source of discrepancy in LCAs of concrete with regard to inventory data is the impact attributed to the transportation of raw materials to the concrete manufacturing plant. It could vary between 5% and 20% depending on the location of the raw materials relative to the concrete batch plant [94]. While examining a sample of the papers being reviewed, it was apparent, as seen in Table 6, that the transportation distances vary widely between the different studies. A study by Panesar et al. [95] concluded that the critical distance for importing FA that would still yield a BCC mix with a positive overall environmental impact profile compared to OPCC is around 900 km as opposed to the 3000 km proposed by Hafez et al. [160] and 5700 km by O’brien et al. [96]. Additionally, Turk et al. [13] argue that if the recycled aggregates are sourced from a landfill that is more than 230 km from the concrete batch plant, the RAC produced would have a higher environmental impact compared to OPCC, which is a larger figure than the 145 km concluded by Anastasiou et al. [53]. In all cases, it is recommended to perform a scenario analysis in each LCA study for concrete in case the sources for the raw materials are not exact, to determine the sensitivity of the output relative to the change in distances.
3.3. Stage 3: Impact Assessment
The third stage of an LCA is the assessment of the impact of the concrete mix by simply multiplying the functional unit by the aggregates impact of the concrete from the three life phases. As seen in Equations (3) and (4), the emissions and energy use are calculated by adding up all the emissions and energy uses of the products and processes involved in the production, use and end-of life stages.
In order to contextualize the information about the concrete mix being studied, an environmental impact indicator is needed. An impact assessment method is vital to producing judgements on the severity of the impact of concrete on the three main areas of protection: (i) ecosystem quality, (ii) human health and (iii) natural resources [59]. This is done through three steps: characterization of the impact, which is a must-do; then, normalization and weighing, which are both optional [49]. According to Sayagh et al. [99], there are two main types of indicators: mid-point indicators, which correlate the calculated impact to a specific change in the environment, such as global warming potential, and end-point indicators which correlate the same increase to damage occurring later-on in the cause–effect chain, such as human health. The significance of this differentiation is that the same comparison between products or processes could result in different scores if looked upon by a mid-point or an end-point indicator, due to the exaggeration of damage that happens to reach the latter [100]. By examining the references reviewed, it was noticed that out of 107 papers, as seen in Figure 11 only six chose to rely on end-point indicators to present the concrete LCA findings.
In terms of relying on mid-point indicators to represent the environmental profile of concrete, the majority of the papers only selected global warming potential. The first reliability issue is that 10% of the papers opted to use the carbon dioxide emissions value as equivalent to the global warming potential [37,64,78,79,101,102]. In fact, according to the two most established midpoint environmental methodologies: CML and the Tool for the Reduction and Assessment of Chemical and other environmental Impacts (TRACI), GWP is based on the aggregation of carbon dioxide emissions, methane and nitrogen dioxide. CML was developed in 1992 by the Institute of Environmental Sciences of the University of Leiden, and TRACI was prepared by the US Environmental Protection Agency’s (US EPA’s) National Risk Management Research Laboratory in 2003.
The second reliability issue with this choice is that GWP is not the only significant environmental impact indicator. As seen in Figure 11, more than 10% of the authors opted to use, along with GWP, the cumulative energy demand (CED). More than half of the authors opted to present several midpoints, according to the following methodologies: CML (32%), Integrated Material Profile And Costing Tool (IMPACT) (10%) and TRACI (7%). These midpoint indicators include, besides GWP, ozone depletion potential (ODP), acidification potential (AP), eutrophication potential (EP), and abiotic depletion potential (ADPE), among others. Considering these indicators would include emissions such as carbon monoxide, sulphates and ammonia [67]. This concludes that in order to provide a reliable assessment of the environmental impact of a concrete alternative, it is advisable to calculate it using several midpoint indicators. However, it remains up to the user to remove any that are deemed irrelevant. For example, Passuelo et al. [103] argue that since the ODP potential of 1 tonne of geopolymer concrete is almost equal to 1.34 × 10⁻⁵, equivalent to operating a household lamp for 2.5 years, this is not a significant indicator to consider.
3.4. Stage 4: Interpretation of Results
The fourth and final stage of an LCA is that when the user analyses the assessed outcome from stage 3 to judge the environmental impact of the concrete alternative studied. In this stage, two main problems were observed. It was noticed that almost 90% of the papers reviewed opted to produce deterministic results for the environmental impact of concrete. Regardless of the indicator chosen, even if the user avoids all the systematic errors explained earlier to make the study reliable, it has been established that some of the most significant elements of a concrete LCA are intrinsically uncertain, such as (i) predicting the expected service life of a mix based on the exposure conditions and mixing proportions; (ii) uncertainty in upstream data regarding some raw materials, depending on the source or database used; (iii) the forecasted energy use in futuristic activities, such as demolition and/or maintenance of the concrete alternative; (iv) predicting the amount of carbon the concrete mix is able to sequester depending on the surface area and atmospheric conditions; and (v) the characterization factors for the mid-point indicators selected. Hence, the results of a concrete LCA should be communicated in a probabilistic fashion. In order to quantify these uncertainties, scenario analysis should be performed on each of the individual elements. Upon quantifying the aforementioned uncertainties, the user could then model the impact assessment indicators using Monte Carlo simulation, and through running the model repeatedly, that would generate a probabilistic aggregated indicator. The model would also allow the user to choose the uncertainty distribution and define the confidence level over the model output accordingly.
4. Conclusions
This review paper aimed at analysing the process of preparing a LCA for concrete and identifying potential sources of discrepancies. The purpose was to standardize the concrete LCA methodology in order to be able to judge the environmental impact in absolute terms across industries, which is a prerequisite for the rising demands to cut down the environmental impact of concrete to combat the rising global warming issues. As seen in Table 7 upon reviewing 146 references, it is apparent that there are 13 most-common sources of discrepancies that spread across the four stages of an LCA study. More than half of these sources are user-based choices, such as depending on a cradle-to-gate scope, selecting a basic volume-based functional unit, ignoring the impact allocation and relying on a single indicator. Throughout the paper, it was shown that based on these choices, the results of the concrete LCA study are not deemed reliable and are not comparable either to other concrete studies, nor in absolute terms to other products and services. Hence, it was concluded that the errors need to be addressed by following an inclusive methodology. In order to cater for the intrinsic uncertainty in some of the elements of the methodology proposed, such as the means of transportation, the expected service life and fluctuations in market prices, it is advised to perform scenario analyses on each of these elements and run a Monte Carlo simulation to aggregate the uncertainty in the final presented LCA outcome.
Author Contributions
Conceptualization, H.H.; methodology, H.H.; software, H.H.; validation, H.H.; formal analysis, H.H.; investigation, H.H.; resources, H.H.; data curation, H.H.; writing—original draft preparation, H.H.; writing—review and editing, H.H., W.M.C., B.N. and R.K.; visualization, H.H.; supervision, W.M.C., B.N. and R.K.; project administration, W.M.C., B.N. and R.K.; funding acquisition, W.M.C., B.N. and R.K.
Funding
This work is funded by the faculty of Engineering and Environment at Northumbria University, UK.
Acknowledgments
None.
Conflicts of Interest
The authors declare no conflict of interests.
References
- Miller, S.A. Supplementary cementitious materials to mitigate greenhouse gas emissions from concrete: Can there be too much of a good thing? J. Clean. Prod. 2018, 178, 587–598. [Google Scholar] [CrossRef]
- Serres, N.; Braymand, S.; Feugeas, F. Environmental evaluation of concrete made from recycled concrete aggregate implementing life cycle assessment. J. Build. Eng. 2016, 5, 24–33. [Google Scholar] [CrossRef]
- Colangelo, F.; Forcina, A.; Farina, I.; Petrillo, A. Life Cycle Assessment (LCA) of different kinds of concrete containing waste for sustainable construction. Buildings 2018, 8, 70. [Google Scholar] [CrossRef]
- Kurda, R.; Silvestre, J.D.; de Brito, J. Lifecycle assessment of concrete made with high volume of recycled concrete aggregates and fly ash. Resour. Conserv. Recycl. 2018, 139, 407–417. [Google Scholar] [CrossRef]
- Habert, G.; de Lacaillerie, J.B.D.; Roussel, N. An environmental evaluation of geopolymer based concrete production: Reviewing current research trends. J. Clean. Prod. 2011, 19, 1229–1238. [Google Scholar] [CrossRef]
- Ashby, M.F. Materials and the Environment: Eco-informed Material Choice; Elsevier Science: Amsterdam, The Netherlands, 2012; Chapter 10. [Google Scholar]
- Miller, S.A.; Horvath, A.; Monteiro, P.J.M. Readily implemenTable techniques can cut annual CO2 emissions from the production of concrete by over 20%. Envion. Res. Lett. 2016, 11, 074029. [Google Scholar] [CrossRef]
- Yuli, S.; Dabo, G.; Heran, Z.; Jiamin, O.; Yuan, L.; Jing, M.; Zhifu, M.; Zhu, L.; Qiang, Z. China CO2 emission accounts 1997–2015. Sci. Data 2018, 5. [Google Scholar] [CrossRef]
- Miller, S.A.; John, V.M.; Pacca, S.A.; Horvath, A. Carbon dioxide reduction potential in the global cement industry by 2050. Cem. Concr. Res. 2017, 114. [Google Scholar] [CrossRef]
- Viñuales, J.E.; Depledge, J.; Reiner, D.M.; Lees, E. Climate policy after the Paris 2015 climate conference. Clim. Policy 2017, 17, 1–8. [Google Scholar] [CrossRef]
- Pretot, S.; Collet, F.; Garnier, C. Life cycle assessment of a hemp concrete wall: Impact of thickness and coating. Build. Environ. 2014, 72, 223–231. [Google Scholar] [CrossRef] [Green Version]
- Shan, X.; Zhou, J.; Chang, V.W.C.; Yang, E.-H. Life cycle assessment of adoption of local recycled aggregates and green concrete in Singapore perspective. J. Clean. Prod. 2017, 164, 918–926. [Google Scholar] [CrossRef]
- Turk, J.; Cotič, Z.; Mladenovič, A.; Šajna, A. Environmental evaluation of green concretes versus conventional concrete by means of LCA. Waste Manag. 2015, 45, 194–205. [Google Scholar] [CrossRef] [PubMed]
- Tait, M.W.; Cheung, W.M. A comparative cradle-to-gate life cycle assessment of three concrete mix designs. Int. J. Life Cycle Assess. 2016, 21, 847–860. [Google Scholar] [CrossRef] [Green Version]
- Tae, S.; Baek, C.; Shin, S. Life cycle CO2 evaluation on reinforced concrete structures with high-strength concrete. Environ. Impact Assess. Rev. 2011, 31. [Google Scholar] [CrossRef]
- Wu, P.; Xia, B.; Zhao, X. The importance of use and end-of-life phases to the life cycle greenhouse gas (GHG) emissions of concrete—A review. Renew. Suatain. Energy Rev. 2014, 37, 360–369. [Google Scholar] [CrossRef]
- Marinković, S.; Dragaš, J.; Ignjatović, I.; Tošić, N. Environmental assessment of green concretes for structural use. J. Clean. Prod. 2017, 154, 633–649. [Google Scholar] [CrossRef]
- Al-Ayish, N.; During, O.; Malaga, K.; Silva, N.; Gudmundsson, K. The influence of supplementary cementitious materials on climate impact of concrete bridges exposed to chlorides. Constr. Build. Mater. 2018, 188, 391–398. [Google Scholar] [CrossRef]
- Bilim, C.; Atiş, C.D.; Tanyildizi, H.; Karahan, O. Predicting the compressive strength of ground granulated blast furnace slag concrete using artificial neural network. Adv. Eng. Softw. 2009, 40, 334–340. [Google Scholar] [CrossRef]
- Biswas, W.K.; Alhorr, Y.; Lawania, K.K.; Sarker, P.K.; Elsarrag, E. Life cycle assessment for environmental product declaration of concrete in the Gulf States. Sustain. Cities Soc. 2017, 35, 36–46. [Google Scholar] [CrossRef]
- Celik, K.; Meral, C.; Gursel, A.P.; Mehta, P.K.; Horvath, A.; Monteiro, P.J.M. Mechanical properties, durability, and life-cycle assessment of self-consolidating concrete mixtures made with blended portland cements containing fly ash and limestone powder. Cem. Concr. Compos. 2015, 56, 59–72. [Google Scholar] [CrossRef] [Green Version]
- Cheng, S.; Shui, Z.; Yu, R.; Zhang, X.; Zhu, S. Durability and environment evaluation of an eco-friendly cement-based material incorporating recycled chromium containing slag. J. Clean. Prod. 2018, 185, 23–31. [Google Scholar] [CrossRef]
- De Schepper, M.; van den Heede, P.; van Driessche, I.; de Belie, N. Life cycle assessment of completely recyclable concrete. Materials 2014, 7, 6010–6027. [Google Scholar] [CrossRef] [PubMed]
- Ding, T.; Xiao, J.; Tam, V.W.Y. A closed-loop life cycle assessment of recycled aggregate concrete utilization in China. Waste Manag. 2016, 56, 367–375. [Google Scholar] [CrossRef] [PubMed]
- Einsfeld, R.A.; Velasco, M.S.L. Fracture parameters for high-performance concrete. Cem. Concr. Res. 2006, 36, 576–583. [Google Scholar] [CrossRef]
- Felekoğlu, B.; Türkel, S.; Baradan, B. Effect of water/cement ratio on the fresh and hardened properties of self-compacting concrete. Build. Environ. 2007, 42, 1795–1802. [Google Scholar] [CrossRef]
- Fan, C.; Miller, S.A. Reducing greenhouse gas emissions for prescribed concrete compressive strength. Constr. Build. Mater. 2018, 167, 918–928. [Google Scholar] [CrossRef]
- Garcez, M.R.; Rohden, A.B.; de Godoy, L.G.G. The role of concrete compressive strength on the service life and life cycle of a RC structure: Case study. J. Clean. Prod. 2018, 172, 27–38. [Google Scholar] [CrossRef]
- García-Segura, T.; Yepes, V.; Alcalá, J. Life cycle greenhouse gas emissions of blended cement concrete including carbonation and durability. Int. J. Life Cycle Assess. 2014, 19, 3–12. [Google Scholar] [CrossRef]
- Gettu, R.; Pillai, R.; Santhanam, M.; Basavaraj, A.; Rathnarajan, S.; Dhanya, B. Sustainability-based decision support framework for choosing concrete mixture proportions. Mater. Struct. 2018, 51, 1–16. [Google Scholar] [CrossRef]
- Gursel, A.P.; Maryman, H.; Ostertag, C. A life-cycle approach to environmental, mechanical, and durability properties of “green” concrete mixes with rice husk ash. J. Clean. Prod. 2016, 112, 823–836. [Google Scholar] [CrossRef]
- Kleijer, A.L.; Lasvaux, S.; Citherlet, S.; Viviani, M. Product-specific Life Cycle Assessment of ready mix concrete: Comparison between a recycled and an ordinary concrete. Resour. Conserv. Recycl. 2017, 122, 210–218. [Google Scholar] [CrossRef]
- Miller, S.A.; Monteiro, P.J.M.; Ostertag, C.P.; Horvath, A. Comparison indices for design and proportioning of concrete mixtures taking environmental impacts into account. Cem. Concr. Compos. 2016, 68, 131–143. [Google Scholar] [CrossRef]
- Ignacio, J.N.; Víctor, Y.; José, V.M. Life Cycle Cost Assessment of Preventive Strategies Applied to Prestressed Concrete Bridges Exposed to Chlorides. Sustainability 2018, 10, 845. [Google Scholar] [CrossRef]
- Oner, A.; Akyuz, S.; Yildiz, R. An experimental study on strength development of concrete containing fly ash and optimum usage of fly ash in concrete. Cem. Concr. Res. 2005, 35, 1165–1171. [Google Scholar] [CrossRef]
- Panesar, D.K.; Churchill, C.J. The influence of design variables and environmental factors on life-cycle cost assessment of concrete culverts. Struct. Infrastruct. Eng. 2010, 9, 1–13. [Google Scholar] [CrossRef]
- Park, J.; Tae, S.; Kim, T. Life cycle CO2 assessment of concrete by compressive strength on construction site in Korea. Renew. Sustain. Energy Rev. 2012, 16, 2940–2946. [Google Scholar] [CrossRef]
- Poon, C.S.; Lam, L.; Wong, Y.L. A study on high strength concrete prepared with large volumes of low calcium fly ash. Cem. Concr. Res. 2000, 30. [Google Scholar] [CrossRef]
- Robayo-Salazar, R.; Mejía-Arcila, J.; de Gutiérrez, R.M.; Martínez, E. Life cycle assessment (LCA) of an alkali-activated binary concrete based on natural volcanic pozzolan: A comparative analysis to OPC concrete. Constr. Build. Mater. 2018, 176, 103–111. [Google Scholar] [CrossRef]
- Rohden, A.B.; Garcez, M.R. Increasing the sustainability potential of a reinforced concrete building through design strategies: Case study. Case Stud. Constr. Mater. 2018, 9, e00174. [Google Scholar] [CrossRef]
- Salas, D.A.; Ramirez, A.D.; Ulloa, N.; Baykara, H.; Boero, A.J. Life cycle assessment of geopolymer concrete. Constr. Build. Mater. 2018, 190, 170–177. [Google Scholar] [CrossRef]
- Sandanayake, M.; Gunasekara, C.; Law, D.; Zhang, G.; Setunge, S. Greenhouse gas emissions of different fly ash based geopolymer concretes in building construction. J. Clean. Prod. 2018, 204, 399–408. [Google Scholar] [CrossRef]
- Siddique, R. Performance characteristics of high-volume Class F fly ash concrete. Cem. Concr. Res. 2004, 34, 487–493. [Google Scholar] [CrossRef]
- Souto-Martinez, A.; Delesky, E.A.; Foster, K.E.O.; Srubar, W.V., III. A mathematical model for predicting the carbon sequestration potential of ordinary portland cement (OPC) concrete. Constr. Build. Mater. 2017, 147, 417. [Google Scholar] [CrossRef]
- Teixeira, E.R.; Mateus, R.; Camões, A.F.; Bragança, L.; Branco, F.G. Comparative environmental life-cycle analysis of concretes using biomass and coal fly ashes as partial cement replacement material. J. Clean. Prod. 2016, 112, 2221–2230. [Google Scholar] [CrossRef] [Green Version]
- Van Den Heede, P.; de Belie, N. Durability Related Functional Units for Life Cycle Assessment of High-Volume Fly Ash Concrete; UWM Center for By-Products Utilization: Milwaukee, WI, USA, 2010; pp. 583–594. [Google Scholar]
- Van Den Heede, P.; de Belie, N. Accelerated and natural carbonation of concrete with high volumes of fly ash: Chemical, mineralogical and microstructural effects. R. Soc. Open Sci. 2018, 6, 181665. [Google Scholar] [CrossRef] [PubMed]
- Yazdanbakhsh, A.; Bank, L.; Baez, T.; Wernick, I. Comparative LCA of concrete with natural and recycled coarse aggregate in the New York City area. Int. J. Life Cycle Assess. 2018, 23, 1163–1173. [Google Scholar] [CrossRef]
- Zhang, Y.-R.; Wu, W.-J.; Wang, Y.-F. Bridge life cycle assessment with data uncertainty. Int. J. Life Cycle Assess. 2016, 21, 569–576. [Google Scholar] [CrossRef]
- Dhanya, B.S.; Santhanam, M.; Gettu, R.; Pillai, R.G. Performance evaluation of concretes having different supplementary cementitious material dosages belonging to different strength ranges. Constr. Build. Mater. 2018, 187, 984–995. [Google Scholar] [CrossRef]
- Jiang, M.; Chen, X.; Rajabipour, F.; Hendrickson, C.T. Comparative Life Cycle Assessment of Conventional, Glass Powder, and Alkali-Activated Slag Concrete and Mortar. J. Infrastruct. Syst. 2014, 20. [Google Scholar] [CrossRef]
- Guo, Z.; Tu, A.; Chen, C.; Lehman, D.E. Mechanical properties, durability, and life-cycle assessment of concrete building blocks incorporating recycled concrete aggregates. J. Clean. Prod. 2018, 199, 136–149. [Google Scholar] [CrossRef]
- Anastasiou, E.K.; Liapis, A.; Papayianni, I. Comparative life cycle assessment of concrete road pavements using industrial by-products as alternative materials. Resour. Conserv. Recycl. 2015, 101, 1–8. [Google Scholar] [CrossRef]
- Teh, S.H.; Wiedmann, T.; Castel, A.; de Burgh, J. Hybrid life cycle assessment of greenhouse gas emissions from cement, concrete and geopolymer concrete in Australia. J. Clean. Prod. 2017, 152, 312–320. [Google Scholar] [CrossRef] [Green Version]
- Hafez, H.; Cheung, W.M.; Nagaratnam, B.; Kurda, R. A Proposed Performance Based Approach for Life Cycle Assessment of Reinforced Blended Cement Concrete. In Proceedings of the 5th SCMT Conference, Kingston University, Kingston, UK, 14–17 July 2019; pp. 50–61. [Google Scholar]
- Panesar, D.; Seto, K.; Churchill, C. Impact of the selection of functional unit on the life cycle assessment of green concrete. Int. J. Life Cycle Assess. 2017, 22, 1969–1986. [Google Scholar] [CrossRef]
- Sagastume Gutiérrez, A.; Eras, J.J.C.; Gaviria, C.A.; van Caneghem, J.; Vandecasteele, C. Improved selection of the functional unit in environmental impact assessment of cement. J. Clean. Prod. 2017, 168, 463–473. [Google Scholar] [CrossRef]
- Bjørn, A.; Hauschild, M. Introducing carrying capacity-based normalisation in LCA: Framework and development of references at midpoint level. Int. J. Life Cycle Assess. 2015, 20, 1005–1018. [Google Scholar] [CrossRef]
- Menoufi, K.A.I. Life Cycle Analysis and Life Cyle Impact Assessment Methodologies: A State of the Art; Castell, A., Cabeza, L.F., Eds.; Universitat De Lleida, Escola Politècnica: Liberia, Spain, 2011. [Google Scholar]
- Huijbregts, M. Application of uncertainty and variability in LCA. Int. J. Life Cycle Assess. 1998, 3, 273–280. [Google Scholar] [CrossRef]
- Häfliger, I.-F.; John, V.; Passer, A.; Lasvaux, S.; Hoxha, E.; Saade, M.R.M.; Habert, G. Buildings environmental impacts’ sensitivity related to LCA modelling choices of construction materials. J. Clean. Prod. 2017, 156, 805–816. [Google Scholar] [CrossRef]
- Collins, F. Inclusion of carbonation during the life cycle of built and recycled concrete: Influence on their carbon footprint. Int. J. Life Cycle Assess. 2010, 15, 549–556. [Google Scholar] [CrossRef]
- Gursel, A.P. Life-Cycle Assessment of Concrete: Decision-Support Tool and Case Study Application. Int. J. Life Cycle Assess. 2014, 19. [Google Scholar] [CrossRef]
- Kim, T.; Chae, C.U. Evaluation analysis of the CO2 emission and absorption life cycle for precast concrete in Korea. Sustainability (Switzerland) 2016, 8, 663. [Google Scholar] [CrossRef]
- Lee, S.; Park, W.; Lee, H. Life cycle CO2 assessment method for concrete using CO2 balance and suggestion to decrease LCCO2 of concrete in South-Korean apartment. Energy Build. 2012, 58. [Google Scholar] [CrossRef]
- Zhang, Y.; Zhang, J.; Lu, M.; Wang, J.D.; Gao, Y. Considering uncertainty in life-cycle carbon dioxide emissions of fly ash concrete. Proc. Inst. Civ. Eng. Eng. Sustain. 2019, 172, 198–206. [Google Scholar] [CrossRef]
- Gayarre, F.L.; Pérez, J.G.; Pérez, C.L.; López, M.S.; Martínez, A.L. Life cycle assessment for concrete kerbs manufactured with recycled aggregates. J. Clean. Prod. 2016, 113, 41–53. [Google Scholar] [CrossRef]
- Zhang, Y.; Luo, W.; Wang, J.; Wang, Y.; Xu, Y.; Xiao, J. A review of life cycle assessment of recycled aggregate concrete. Constr. Build. Mater. 2019, 209, 115–125. [Google Scholar] [CrossRef]
- Kurda, R.; de Brito, J.; Silvestre, J. CONCRETop—A multi-criteria decision method for concrete optimization. Environ. Impact Assess. Rev. 2019, 74, 73. [Google Scholar] [CrossRef]
- Hedayatinia, F.; Delnavaz, M.; Emamzadeh, S.S. Rheological properties, compressive strength and life cycle assessment of self-compacting concrete containing natural pumice pozzolan (Book review). Constr. Build. Mater. 2019, 206, 122–129. [Google Scholar] [CrossRef]
- Mahima, S.; Moorthi, P.; Bahurudeen, A.; Gopinath, A. Influence of chloride threshold value in service life prediction of reinforced concrete structures. Sādhanā 2018, 43, 1–19. [Google Scholar] [CrossRef]
- Müller, H.S.; Haist, M.; Vogel, M. Assessment of the sustainability potential of concrete and concrete structures considering their environmental impact, performance and lifetime. Constr. Build. Mater. 2014, 67, 321–337. [Google Scholar] [CrossRef]
- Anand, C.K.; Amor, B. Recent developments, future challenges and new research directions in LCA of buildings: A critical review. Renew. Suatain. Energy Rev. 2017, 67, 408–416. [Google Scholar] [CrossRef]
- Del Borghi, A. LCA and communication: Environmental Product Declaration (Editorial). Int. J. Life Cycle Assess. 2013, 18, 293. [Google Scholar] [CrossRef]
- Crossin, E. Comparative Life Cycle Assessment of Concrete Blends; RMIT University: Melbourne, Australia, 2012. [Google Scholar]
- Huntzinger, D.N.; Eatmon, T.D. A life-cycle assessment of Portland cement manufacturing: Comparing the traditional process with alternative technologies. J. Clean. Prod. 2009, 17, 668–675. [Google Scholar] [CrossRef]
- Chen, C.; Habert, G.; Bouzidi, Y.; Jullien, A. Ventura, A. LCA allocation procedure used as an incitative method for waste recycling: An application to mineral additions in concrete. Resour. Conserv. Recycl. 2010, 54, 1231–1240. [Google Scholar] [CrossRef]
- Yang, K.-H.; Seo, E.-A.; Jung, Y.-B.; Tae, S.-H. Effect of Ground Granulated Blast-Furnace Slag on Life-Cycle Environmental Impact of Concrete. J. Korea Concr. Inst. 2014, 26, 13–21. [Google Scholar] [CrossRef] [Green Version]
- Zhang, Y.R.; Liu, M.H.; Xie, H.B.; Wang, Y.F. Assessment of CO2 emissions and cost in fly ash concrete. In Environment, Energy and Applied Technology, Proceedings of the 2014 International Conference on Frontier of Energy and Environment Engineering (ICFEEE 2014), Beijing, China, 6–7 December 2014; CRC Press: Boca Raton, FL, USA, 2014; p. 327. [Google Scholar]
- Wałach, D.; Dybeł, P.; Sagan, J.; Gicala, M. Environmental performance of ordinary and new generation concrete structures—A comparative analysis. Environ. Sci. Pollut. Res. 2019, 26, 3980–3990. [Google Scholar] [CrossRef] [PubMed]
- Rahla, K.M.; Mateus, R.; Bragança, L. Comparative sustainability assessment of binary blended concretes using Supplementary Cementitious Materials (SCMs) and Ordinary Portland Cement (OPC). J. Clean. Prod. 2019, 220, 445–459. [Google Scholar] [CrossRef]
- Chiaia, B.; Fantilli, A.P.; Guerini, A.; Volpatti, G.; Zampini, D. Eco-mechanical index for structural concrete. Constr. Build. Mater. 2014, 67, 386–392. [Google Scholar] [CrossRef]
- Long, G.; Gao, Y.; Xie, Y. Designing more sustainable and greener self-compacting concrete. Constr. Build. Mater. 2015, 84, 301–306. [Google Scholar] [CrossRef]
- Flower, D.; Sanjayan, J. Green house gas emissions due to concrete manufacture. Int. J. Life Cycle Assess. 2007, 12, 282–288. [Google Scholar] [CrossRef]
- Proske, T.; Hainer, S.; Rezvani, M.; Graubner, C.-A. Eco-friendly concretes with reduced water and cement content—Mix design principles and application in practice. Constr. Build. Mater. 2014, 67, 413–421. [Google Scholar] [CrossRef]
- Chen, X.; Wang, H.; Najm, H.; Venkiteela, G.; Hencken, J. Evaluating engineering properties and environmental impact of pervious concrete with fly ash and slag. J. Clean. Prod. 2019, 237, 117714. [Google Scholar] [CrossRef]
- Gursel, A.P.; Ostertag, C.P. Impact of Singapore’s importers on life-cycle assessment of concrete. J. Clean. Prod. 2016, 118, 140–150. [Google Scholar] [CrossRef]
- Khodabakhshian, A.; de Brito, J.; Ghalehnovi, M.; Shamsabadi, E.A. Mechanical environmental and economic performance of structural concrete containing silica fume and marble industry waste powder. Constr. Build. Mater. 2018, 169, 237–251. [Google Scholar] [CrossRef]
- Li, C.; Nie, Z.; Cui, S.; Gong, X.; Wang, Z.; Meng, X. The life cycle inventory study of cement manufacture in China. J. Clean. Prod. 2014, 72, 204–211. [Google Scholar] [CrossRef]
- Seto, K.; Panesar, D.; Churchill, C. Criteria for the evaluation of life cycle assessment software packages and life cycle inventory data with application to concrete. Int. J. Life Cycle Assess. 2017, 22, 694–706. [Google Scholar] [CrossRef]
- Tucker, E.L.; Ferraro, C.C.; Laux, S.J.; Townsend, T.G. Economic and life cycle assessment of recycling municipal glass as a pozzolan in portland cement concrete production. Resour. Conserv. Recycl. 2018, 129, 240–247. [Google Scholar] [CrossRef]
- Wang, J.; Wang, Y.; Sun, Y.; Tingley, D.D.; Zhang, Y. Life cycle sustainability assessment of fly ash concrete structures. Renew. Sustain. Energy Rev. 2017, 80, 1162–1174. [Google Scholar] [CrossRef]
- Yuan, X.; Tang, Y.; Li, Y.; Wang, Q.; Zuo, J.; Song, Z. Environmental and economic impacts assessment of concrete pavement brick and permeable brick production process—A case study in China. J. Clean. Prod. 2018, 171, 198–208. [Google Scholar] [CrossRef]
- Kim, T.; Lee, S.; Chae, C.U.; Jang, H.; Lee, K. Development of the CO2 emission evaluation tool for the life cycle assessment of concrete. Sustainability (Switzerland) 2017, 9, 2116. [Google Scholar] [CrossRef]
- Panesar, D.K.; Kanraj, D.; Abualrous, Y. Effect of transportation of fly ash: Life cycle assessment and life cycle cost analysis of concrete. Cem. Concr. Compos. 2019, 99, 214–224. [Google Scholar] [CrossRef]
- O’Brien, K.; Ménaché, J.; O’Moore, L. Impact of fly ash content and fly ash transportation distance on embodied greenhouse gas emissions and water consumption in concrete. Int. J. Life Cycle Assess. 2009, 14, 621–629. [Google Scholar] [CrossRef] [Green Version]
- Chrysostomou, C.; Kylili, A.; Nicolaides, D.; Fokaides, P.A. Life Cycle Assessment of concrete manufacturing in small isolated states: The case of Cyprus. Int. J. Sustain. Energy 2017, 36, 825–839. [Google Scholar] [CrossRef]
- Maria, A.; Salman, M.; Dubois, M.; Acker, K. Life cycle assessment to evaluate the environmental performance of new construction material from stainless steel slag. Int. J. Life Cycle Assess. 2018, 23, 2091–2109. [Google Scholar] [CrossRef]
- Sayagh, S.; Ventura, A.; Hoang, T.; François, D.; Jullien, A. Sensitivity of the LCA allocation procedure for BFS recycled into pavement structures. Resour. Conserv. Recycl. 2010, 54, 348–358. [Google Scholar] [CrossRef] [Green Version]
- Maia de Souza, D.; Lafontaine, M.; Charron-Doucet, F.; Chappert, B.; Kicak, K.; Duarte, F.; Lima, L. Comparative life cycle assessment of ceramic brick, concrete brick and cast-in-place reinforced concrete exterior walls. J. Clean. Prod. 2016, 137, 70–82. [Google Scholar] [CrossRef]
- De Matos, P.R.; Sakata, R.D.; Prudêncio, L.R. Eco-efficient low binder high-performance self-compacting concretes. Constr. Build. Mater. 2019, 225, 941–955. [Google Scholar] [CrossRef]
- Pillai, R.G.; Gettu, R.; Santhanam, M.; Rengaraju, S.; Dhandapani, Y.; Rathnarajan, S.; Basavaraj, A.S. Service life and life cycle assessment of reinforced concrete systems with limestone calcined clay cement (LC3). Cem. Concr. Res. 2019, 118, 111. [Google Scholar] [CrossRef]
- Passuello, A.; Rodríguez, E.D.; Hirt, E.; Longhi, M.; Bernal, S.A.; Provis, J.L.; Kirchheim, A.P. Evaluation of the potential improvement in the environmental footprint of geopolymers using waste-derived activators. J. Clean. Prod. 2017, 166, 680–689. [Google Scholar] [CrossRef]
- Boesch, M.E.; Hellweg, S. Identifying improvement potentials in cement production with life cycle assessment. Environ. Sci. Technol. 2010, 44, 9143–9149. [Google Scholar] [CrossRef] [PubMed]
- Broun, R.; Menzies, G.F. Life Cycle Energy and Environmental Analysis of Partition Wall Systems in the UK. Proced. Eng. 2011, 21, 864–873. [Google Scholar] [CrossRef] [Green Version]
- Budelmann, H.; Holst, A.; Wachsmann, A. Durability Related Life-Cycle Assessment of Concrete Structures: Mechanisms, Models, Implementation; IALCCE: Vienna, Austria, 2012; pp. 75–86. [Google Scholar]
- Chau, C.K.; Leung, T.M.; Ng, W.Y. A review on Life Cycle Assessment, Life Cycle Energy Assessment and Life Cycle Carbon Emissions Assessment on buildings. Appl. Energy 2015, 143, 395–413. [Google Scholar] [CrossRef]
- Cheung, J.; Roberts, L.; Liu, J. Admixtures and sustainability. Cem. Concr. Res. 2018, 114, 79–89. [Google Scholar] [CrossRef]
- Colangelo, F.; Petrillo, A.; Cioffi, R.; Borrelli, C.; Forcina, A. Life cycle assessment of recycled concretes: A case study in southern Italy. Sci. Total Environ. 2018, 615, 1506–1517. [Google Scholar] [CrossRef] [PubMed]
- D’Alessandro, A.; Fabiani, C.; Pisello, A.L.; Ubertini, F.; Materazzi, A.L.; Cotana, F. Innovative concretes for low-carbon constructions: A review. Int. J. Low Carbon Technol. 2017, 12, 289–309. [Google Scholar] [CrossRef]
- Damineli, B.L.; Kemeid, F.M.; Aguiar, P.S.; John, V.M. Measuring the eco-efficiency of cement use. Cem. Concr. Compos. 2010, 32, 555–562. [Google Scholar] [CrossRef]
- Densley Tingley, D.; Davison, B. Developing an LCA methodology to account for the environmental benefits of design for deconstruction. Build. Environ. 2012, 57, 387–395. [Google Scholar] [CrossRef]
- Dobbelaere, G.; de Brito, J.; Evangelista, L. Definition of an equivalent functional unit for structural concrete incorporating recycled aggregates. Eng. Struct. 2016, 122, 196–208. [Google Scholar] [CrossRef]
- Dong, Y.H.; Ng, S.T.; Kwan, A.H.K.; Wu, S.K. Substituting local data for overseas life cycle inventories e a case study of concrete products in Hong Kong. J. Clean. Prod. 2015, 108, 414–422. [Google Scholar] [CrossRef]
- Estanqueiro, B.; Silvestre, J.D.; de Brito, J.; Pinheiro, M.D. Environmental life cycle assessment of coarse natural and recycled aggregates for concrete. Eur. J. Environ. Civ. Eng. 2018, 22, 429–449. [Google Scholar] [CrossRef]
- Evangelista, B.L.; Rosado, L.P.; Penteado, C.S.G. Life cycle assessment of concrete paving blocks using electric arc furnace slag as natural coarse aggregate substitute. J. Clean. Prod. 2018, 178, 176–185. [Google Scholar] [CrossRef]
- Evangelista, P.P.A.; Kiperstok, A.; Torres, E.A.; Gonçalves, J.P. Environmental performance analysis of residential buildings in Brazil using life cycle assessment (LCA). Constr. Build. Mater. 2018, 169, 748–761. [Google Scholar] [CrossRef]
- Fantilli, A.P.; Tondolo, F.; Chiaia, B.; Habert, G. Designing reinforced concrete beams containing supplementary cementitious materials. Materials 2019, 12, 1248. [Google Scholar] [CrossRef] [PubMed]
- Ferreiro-Cabello, J.; Fraile-Garcia, E.; Martinez-Camara, E.; Perez-de-La-Parte, M. Sensitivity analysis of Life Cycle Assessment to select reinforced concrete structures with one-way slabs. Eng. Struct. 2017, 132, 586–596. [Google Scholar] [CrossRef]
- Font, A.; Borrachero, M.V.; Soriano, L.; Monz, J.; Mellado, A.; Pay, J. New eco-cellular concretes: Sustainable and energy-efficient materials. Green Chem. 2018, 20, 4684–4694. [Google Scholar] [CrossRef]
- Fraile-Garcia, E.; Ferreiro-Cabello, J.; Martinez-Camara, E.; Jimenez-Macias, E. Repercussion the use phase in the life cycle assessment of structures in residential buildings using one-way slabs. J. Clean. Prod. 2017, 143, 191–199. [Google Scholar] [CrossRef]
- Franco de Carvalho, J.M.; Melo, T.V.d.; Fontes, W.C.; Batista, J.O.D.S.; Brigolini, G.J.; Peixoto, R.A.F. More eco-efficient concrete: An approach on optimization in the production and use of waste-based supplementary cementing materials (Book review). Constr. Build. Mater. 2019, 206, 397–409. [Google Scholar] [CrossRef]
- Gómez de Cózar, J.C.; Martínez, A.G.; López, Í.A.; Alfonsea, M.R. Life cycle assessment as a decision-making tool for selecting building systems in heritage intervention: Case study of Roman Theatre in Itálica, Spain. J. Clean. Prod. 2019, 206, 27–39. [Google Scholar] [CrossRef]
- Göswein, V.; Rodrigues, C.; Silvestre, J.D.; Freire, F.; Habert, G.; König, J. Using anticipatory life cycle assessment to enable future sustainable construction. J. Ind. Ecol. 2019. [Google Scholar] [CrossRef]
- Gursel, A.; Masanet, E.; Horvath, A.; Stadel, A. Life-cycle inventory analysis of concrete production: A critical review. Cem. Concr. Compos. 2014, 51. [Google Scholar] [CrossRef]
- Hong, T.; Ji, C.; Park, H. Integrated model for assessing the cost and CO2 emission (IMACC) for sustainable structural design in ready-mix concrete. J. Environ. Manag. 2012, 103, 1–8. [Google Scholar] [CrossRef] [PubMed]
- Hong, T.-H.; Ji, C.-Y.; Jang, M.-H.; Park, H.-S. Predicting the CO2 Emission of Concrete Using Statistical Analysis. J. Constr. Eng. Proj. Manag. 2012, 2, 53–60. [Google Scholar] [CrossRef]
- Hossain, M.; Poon, C.; Lo, I.; Cheng, J. Evaluation of environmental friendliness of concrete paving eco-blocks using LCA approach. Int. J. Life Cycle Assess. 2016, 21, 70–84. [Google Scholar] [CrossRef]
- Hossain, M.U.; Poon, C.S.; Lo, I.M.C.; Cheng, J.C.P. Comparative environmental evaluation of aggregate production from recycled waste materials and virgin sources by LCA. Resour. Conserv. Recycl. 2016, 109, 67–77. [Google Scholar] [CrossRef]
- Iezzi, B.; Brady, R.; Sardag, S.; Eu, B.; Skerlos, S. Growing bricks: Assessing biocement for lower embodied carbon structures. Proced. CIRP 2019, 80, 470–475. [Google Scholar] [CrossRef]
- Josa, A. Comparative analysis of the life cycle impact assessment of available cement inventories in the EU. Cem. Concr. Res. 2007, 37. [Google Scholar] [CrossRef]
- Juhart, J.; David, G.-A.; Saade, M.R.M.; Baldermann, C.; Passer, A.; Mittermayr, F. Functional and environmental performance optimization of Portland cement-based materials by combined mineral fillers. Cem. Concr. Res. 2019, 122, 157–178. [Google Scholar] [CrossRef]
- Kurda, R.; Silvestre, J.D.; de Brito, J.; Ahmed, H. Optimizing recycled concrete containing high volume of fly ash in terms of the embodied energy and chloride ion resistance. J. Clean. Prod. 2018, 194, 735–750. [Google Scholar] [CrossRef]
- Liu, Y.; Shi, C.; Zhang, Z.; Li, N. An overview on the reuse of waste glasses in alkali-activated materials. Resour. Conserv. Recycl. 2019, 144, 297–309. [Google Scholar] [CrossRef]
- Luo, W.; Sandanayake, M.; Zhang, G. Direct and indirect carbon emissions in foundation construction—Two case studies of driven precast and cast-in-situ piles (Report). J. Clean. Prod. 2019, 211, 1517. [Google Scholar] [CrossRef]
- Miller, S.A.; Monteiro, P.J.M.; Ostertag, C.P.; Horvath, A. Concrete mixture proportioning for desired strength and reduced global warming potential. Constr. Build. Mater. 2016, 128, 410–421. [Google Scholar] [CrossRef]
- Mohammadi, J.; South, W. Life cycle assessment (LCA) of benchmark concrete products in Australia. Int. J. Life Cycle Assess. 2017, 22, 1588–1608. [Google Scholar] [CrossRef]
- Nikbin, I.M.; Aliaghazadeh, M.; Charkhtab, A.S.; Fathollahpour, A. Environmental impacts and mechanical properties of lightweight concrete containing bauxite residue (red mud). J. Clean. Prod. 2018, 172, 2683–2694. [Google Scholar] [CrossRef]
- Omar, W.M.S.W.; Doh, J.-H.; Panuwatwanich, K.; Miller, D. Assessment of the embodied carbon in precast concrete wall panels using a hybrid life cycle assessment approach in Malaysia. Sustain. Cities Soc. 2014, 10, 101–111. [Google Scholar] [CrossRef] [Green Version]
- Pradhan, S.; Tiwari, B.R.; Kumar, S.; Barai, S.V. Comparative LCA of recycled and natural aggregate concrete using Particle Packing Method and conventional method of design mix. J. Clean. Prod. 2019, 228, 679–691. [Google Scholar] [CrossRef]
- Provis, J.L. Alkali-activated materials. Cem. Concr. Res. 2017. [Google Scholar] [CrossRef]
- Röyne, F. Life Cycle Assessment of BioZEment—Concrete Production Based on Bacteria; RISE—Research Institutes of Sweden, Built Environment, Energy and Circular Economy: Stockholm, Sweden, 2017. [Google Scholar]
- Saade, M.R.M.; Passer, A.; Mittermayr, F. A Preliminary Systematic Investigation onto Sprayed Concrete’s Environmental Performance. Proced. CIRP 2018, 69, 212–217. [Google Scholar] [CrossRef]
- Säynäjoki, A.; Heinonen, J.; Junnila, S.; Horvath, A. Can life-cycle assessment produce reliable policy guidelines in the building sector? Environ. Res. Lett. 2017, 12, 013001. [Google Scholar] [CrossRef] [Green Version]
- Säynäjoki, A.; Heinonen, J.; Junnonen, J.-M.; Junnila, S. Input–output and process LCAs in the building sector: Are the results compatible with each other? Carbon Manag. 2017, 8, 155–166. [Google Scholar] [CrossRef]
- Seto, K.E.; Churchill, C.J.; Panesar, D.K. Influence of fly ash allocation approaches on the life cycle assessment of cement-based materials. J. Clean. Prod. 2017, 157, 65–75. [Google Scholar] [CrossRef]
- Shrivastava, S.; Shrivastava, R.L. A systematic literature review on green manufacturing concepts in cement industries. Int. J. Qual. Reliab. Manag. 2017, 34, 68–90. [Google Scholar] [CrossRef]
- Silva, R.V.; Neves, R.; de Brito, J.; Dhir, R.K. Carbonation behaviour of recycled aggregate concrete. Cem. Concr. Compos. 2015, 62, 22–32. [Google Scholar] [CrossRef] [Green Version]
- Sinka, M.; van den Heede, P.; de Belie, N.; Bajare, D.; Sahmenko, G.; Korjakins, A. Comparative life cycle assessment of magnesium binders as an alternative for hemp concrete. Resour. Conserv. Recycl. 2018, 133, 288–299. [Google Scholar] [CrossRef]
- Soleimani, M.; Shahandashti, M. Comparative process-based life-cycle assessment of bioconcrete and conventional concrete. J. Eng. Des. Technol. 2017, 15, 667–688. [Google Scholar] [CrossRef]
- Suárez Silgado, S.; Valdiviezo, L.C.; Domingo, S.G.; Roca, X. Multi-criteria decision analysis to assess the environmental and economic performance of using recycled gypsum cement and recycled aggregate to produce concrete: The case of Catalonia (Spain). Resour. Conserv. Recycl. 2018, 133, 120–131. [Google Scholar] [CrossRef] [Green Version]
- Tam, V.W.Y.; Soomro, M.; Evangelista, A.C.J. A review of recycled aggregate in concrete applications (2000–2017). Constr. Build. Mater. 2018, 172, 272–292. [Google Scholar] [CrossRef]
- Tempest, B.; Sanusi, O.; Gergely, J.; Ogunro, V.; Weggel, D. Compressive Strength and Embodied Energy Optimization of Fly Ash Based Geopolymer Concrete. In Proceedings of the 2009 World of Coal Ash (WOCA) Conference, Lexington, KY, USA, 4–7 May 2009. [Google Scholar]
- Tošić, N.; Marinković, S.; Dašić, T.; Stanić, M. Multicriteria optimization of natural and recycled aggregate concrete for structural use. J. Clean. Prod. 2015, 87, 766–776. [Google Scholar] [CrossRef]
- Turner, L.K.; Collins, F.G. Carbon dioxide equivalent (CO2-e) emissions: A comparison between geopolymer and OPC cement concrete. Constr. Build. Mater. 2013, 43, 125–130. [Google Scholar] [CrossRef]
- Vieira, D.R.; Calmon, J.L.; Coelho, F.Z. Life cycle assessment (LCA) applied to the manufacturing of common and ecological concrete: A review. Constr. Build. Mater. 2016, 124, 656–666. [Google Scholar] [CrossRef]
- Wijayasundara, M.; Mendis, P.; Crawford, R.H. Methodology for the integrated assessment on the use of recycled concrete aggregate replacing natural aggregate in structural concrete. J. Clean. Prod. 2017, 166, 321–334. [Google Scholar] [CrossRef]
- Zhong, Y.; Wu, P. Economic sustainability, environmental sustainability and constructability indicators related to concrete- and steel-projects. J. Clean. Prod. 2015, 108, 748–756. [Google Scholar] [CrossRef]
- Zingg, S.; Habert, G.; Lämmlein, T.; Lura, P.; Denarié, E.; Hajiesmaeili, A. Environmental Assessment of Radical Innovation in Concrete Structures. In Proceedings of the 2016 Sustainable Built Environment (SBE) Regional Conference, Zürich, Switzerland, 15–17 June 2016. [Google Scholar]
- Hafez, H.; Kurda, R.; Cheung, W.M.; Nagaratnam, B. Comparative life cycle assessment between imported and recovered fly ash for blended cement concrete in the UK. J. Clean. Prod. 2019, 244, 118722. [Google Scholar] [CrossRef]
Figure 1.
Green concrete strategies and types.

Figure 2.
Different system boundaries of green concrete life cycle assessment (LCA) [21].
Figure 2.
Different system boundaries of green concrete life cycle assessment (LCA) [21].

Figure 3.
A review of the values for the equivalent kg CO2/m3 of: (a) 80 Ordinary Portland Cement Concrete (OPCC) mixes and (b) 300 mixes of all 5 concrete types studied from the literature.
Figure 3.
A review of the values for the equivalent kg CO2/m3 of: (a) 80 Ordinary Portland Cement Concrete (OPCC) mixes and (b) 300 mixes of all 5 concrete types studied from the literature.

Figure 4.
Number of LCA studies per (a) type of concrete, (b) published year and (c) country.

Figure 5.
Meta-analysis of the selected system boundary for each of the LCA studies reviewed in this paper.
Figure 5.
Meta-analysis of the selected system boundary for each of the LCA studies reviewed in this paper.

Figure 6.
The division of the FU in the LCA studies reviewed based on (a) Level of Detail and (b) type of unit volume.
Figure 6.
The division of the FU in the LCA studies reviewed based on (a) Level of Detail and (b) type of unit volume.

Figure 7.
A comparison between the impact of a recycling aggregate concrete (RAC) using volume-based FU and a FU normalized to strength [69].
Figure 7.
A comparison between the impact of a recycling aggregate concrete (RAC) using volume-based FU and a FU normalized to strength [69].

Figure 8.
A comparison between the impact of blended cement concrete (BCC) using a volume-based FU and a FU normalized to strength.
Figure 8.
A comparison between the impact of blended cement concrete (BCC) using a volume-based FU and a FU normalized to strength.

Figure 9.
The meta data for the primary versus secondary sources for LCA studies reviewed and the databases used.
Figure 9.
The meta data for the primary versus secondary sources for LCA studies reviewed and the databases used.

Figure 10.
A review of the global warming potential (GWP) of a tonne of ordinary Portland cement (OPC) reported in 25 papers.
Figure 10.
A review of the global warming potential (GWP) of a tonne of ordinary Portland cement (OPC) reported in 25 papers.

Figure 11.
Meta-data for the indicators used in the concrete LCA studies reviewed.


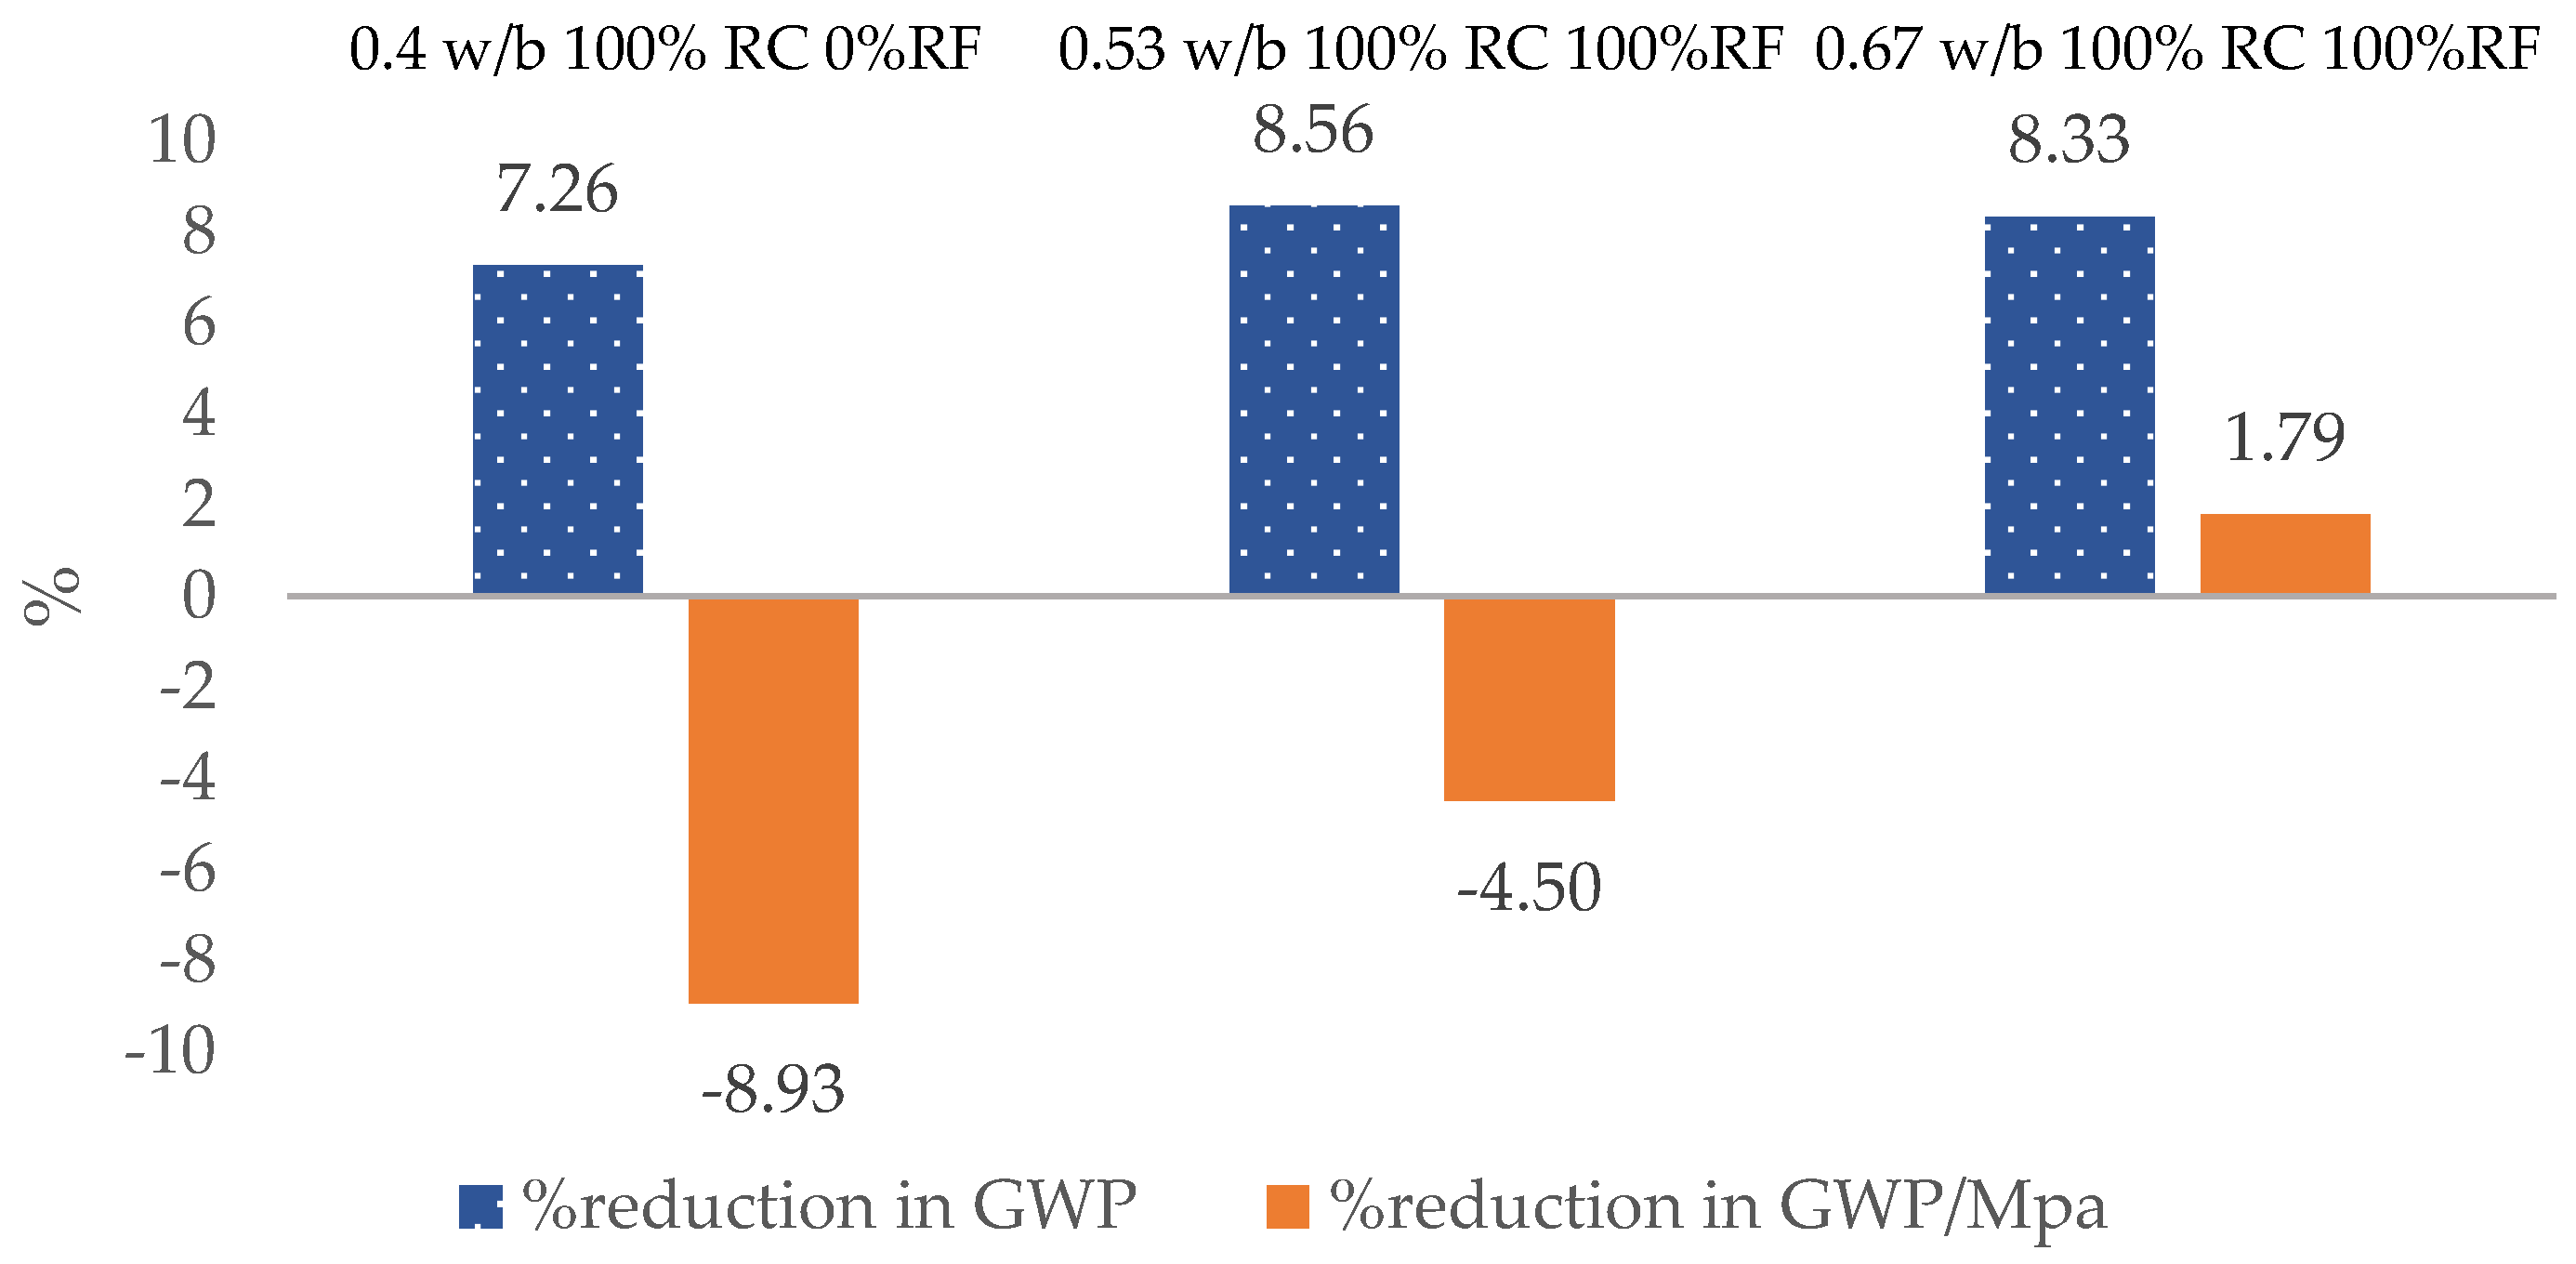
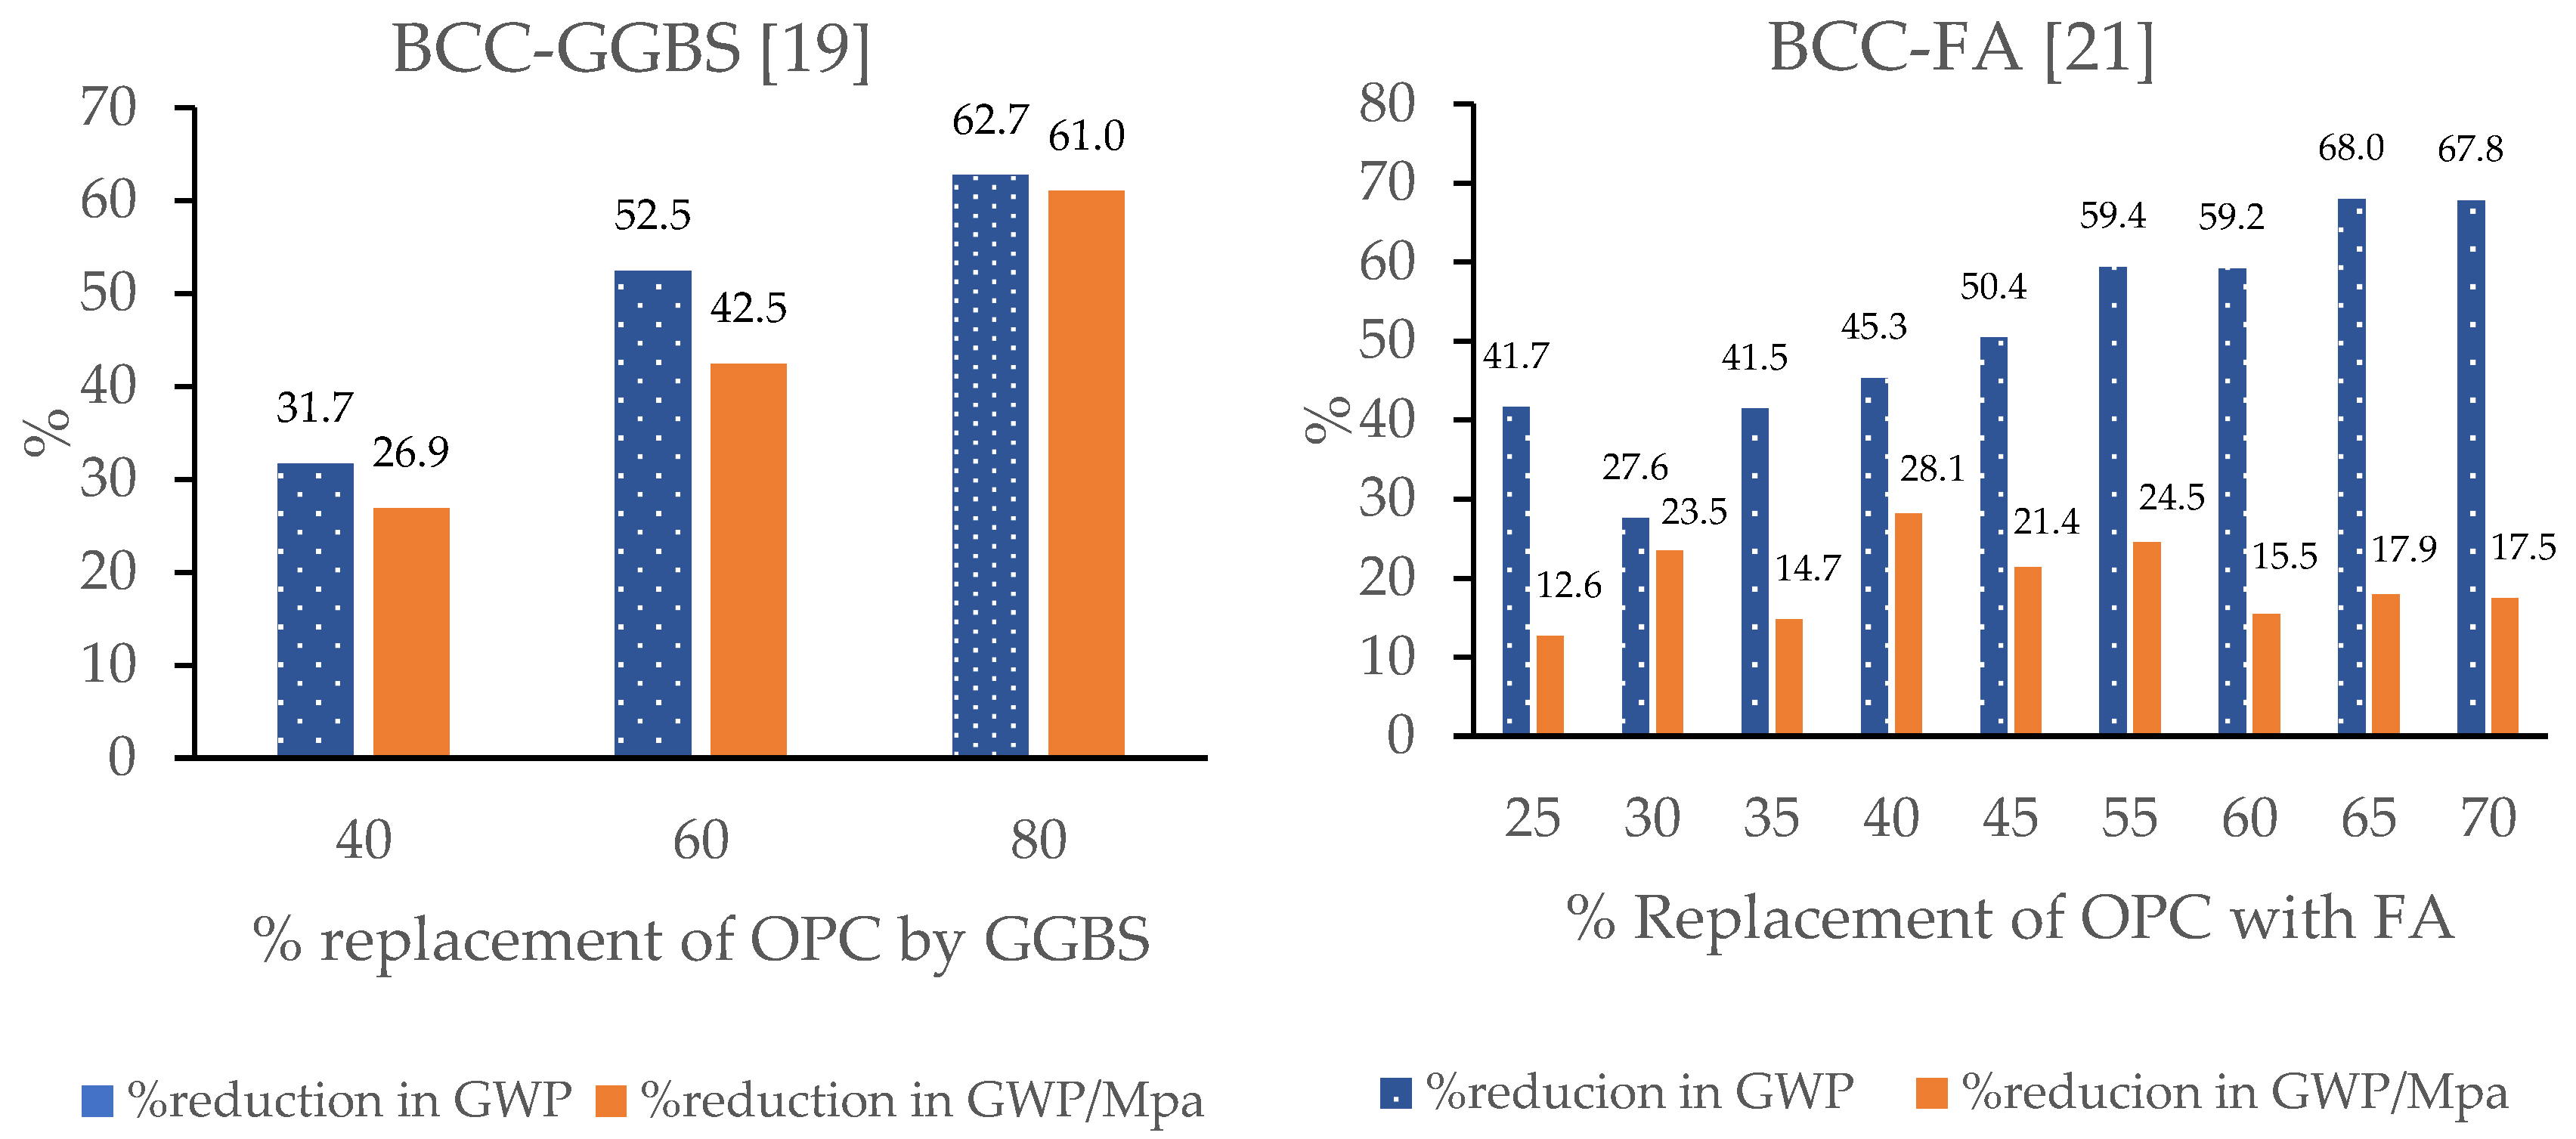
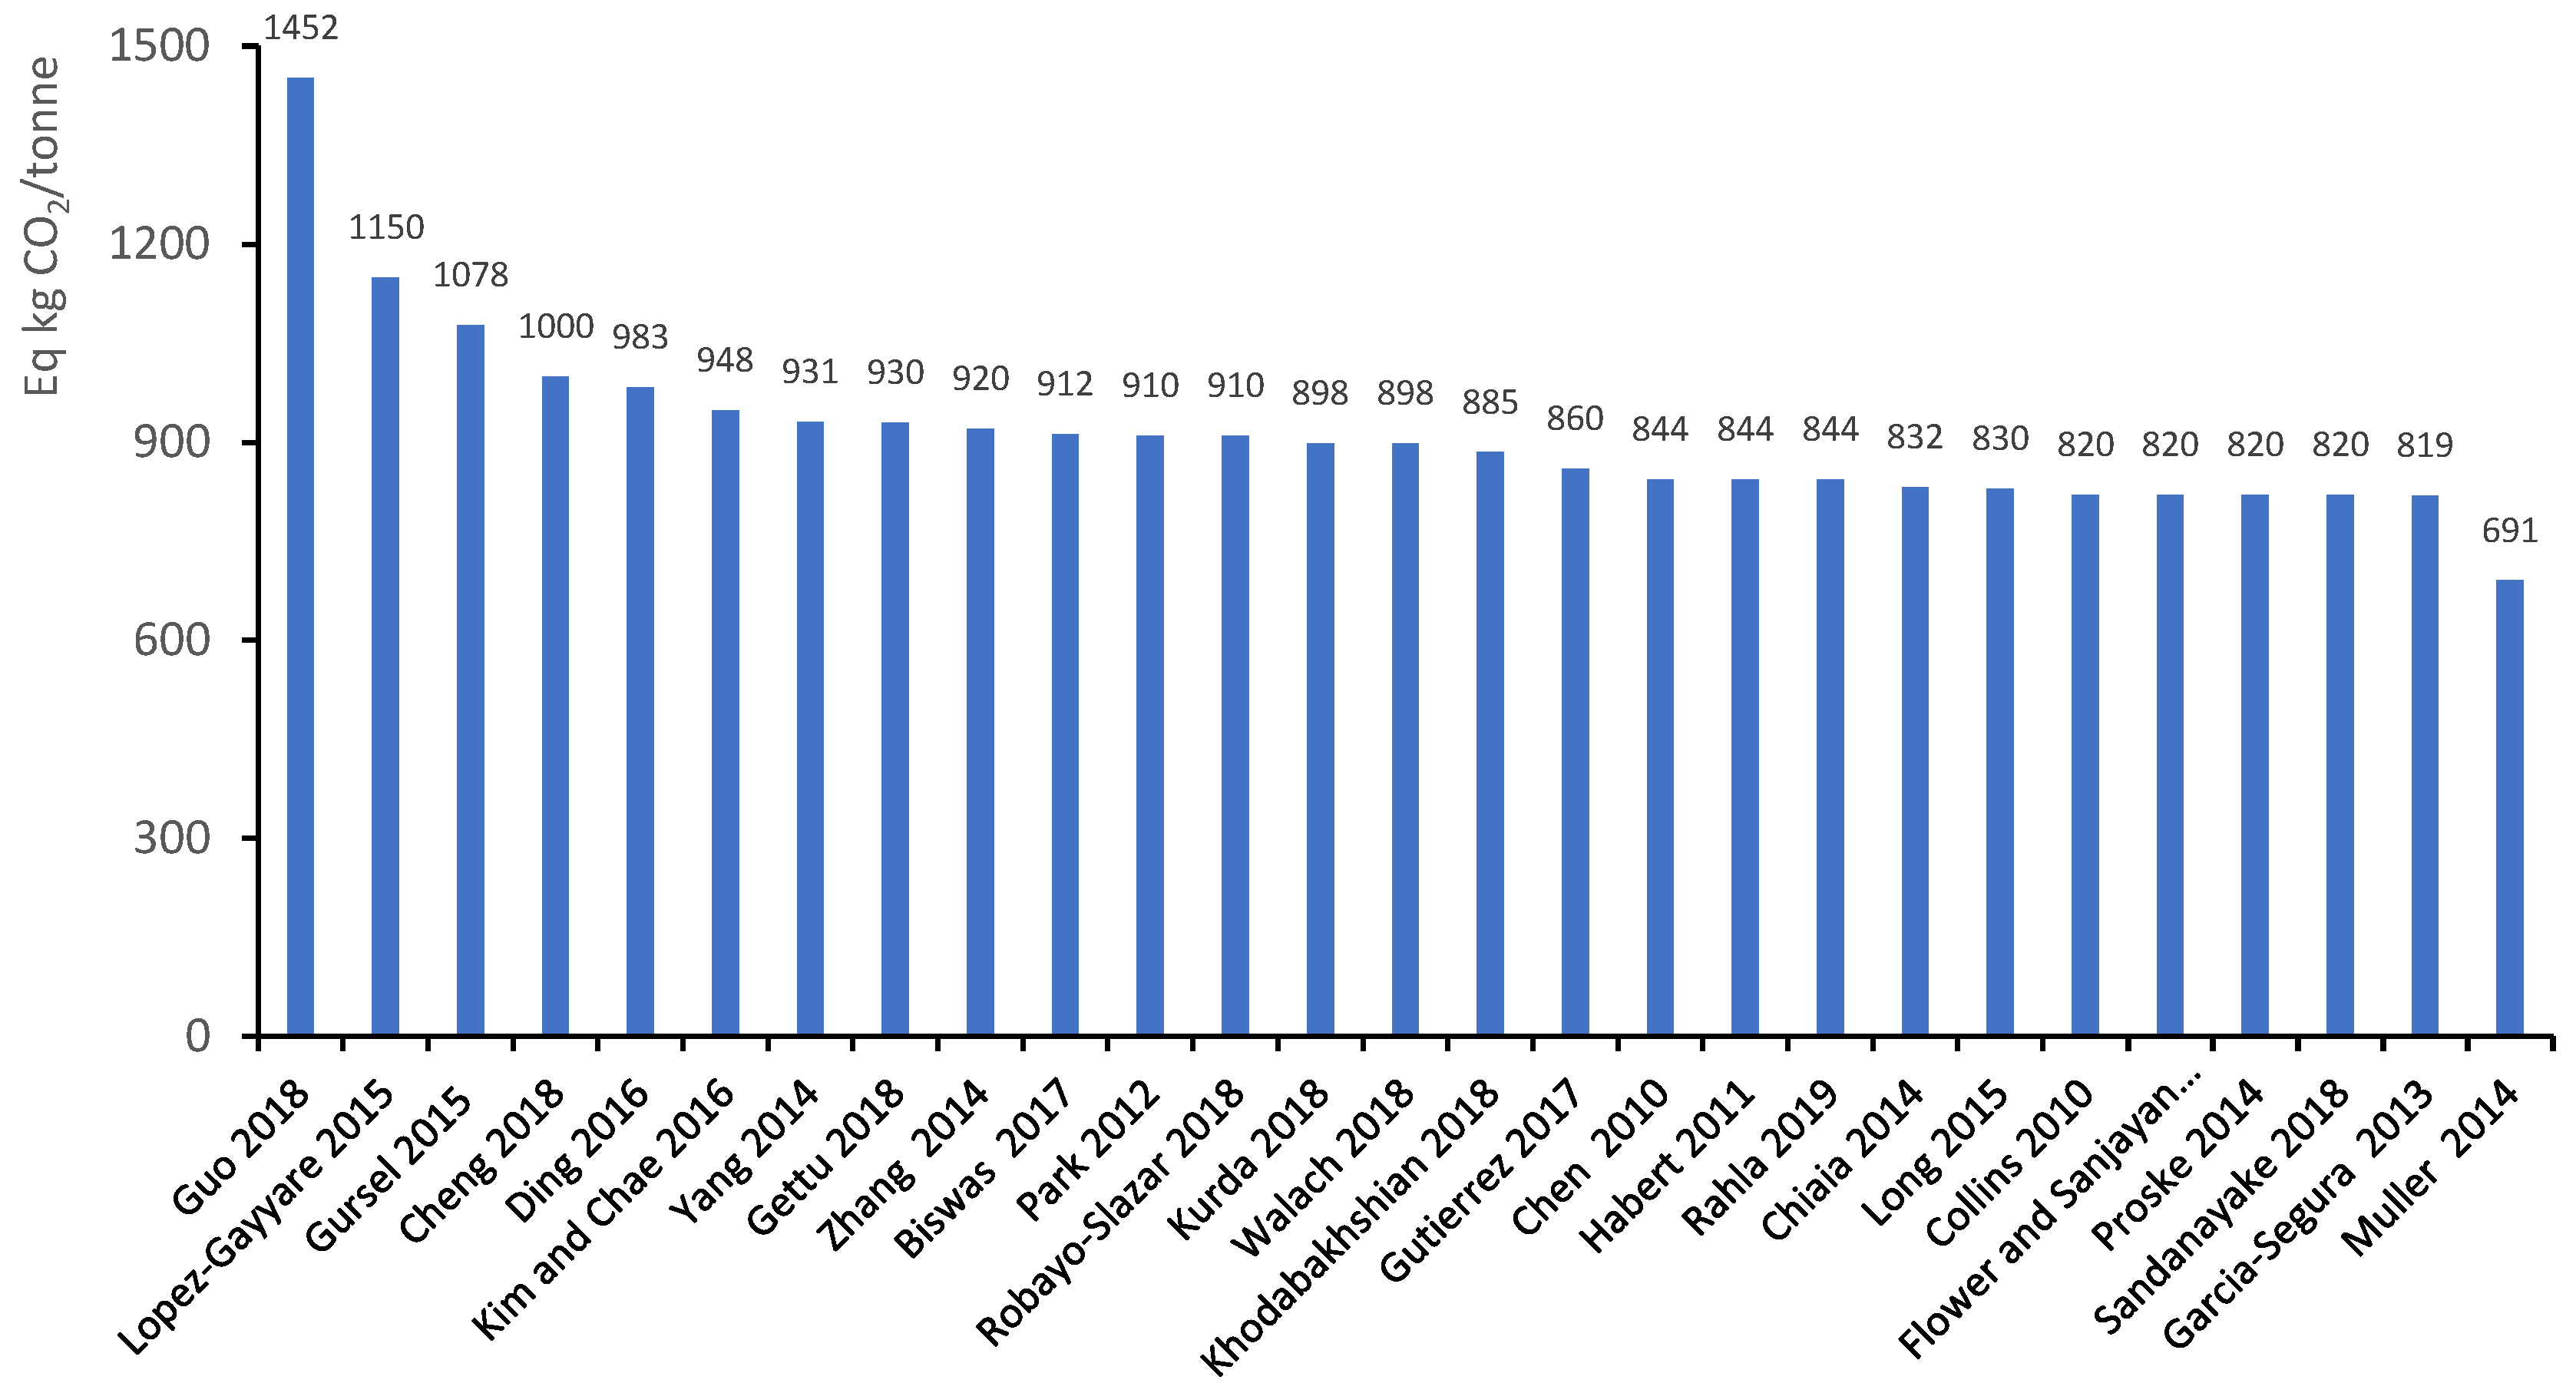
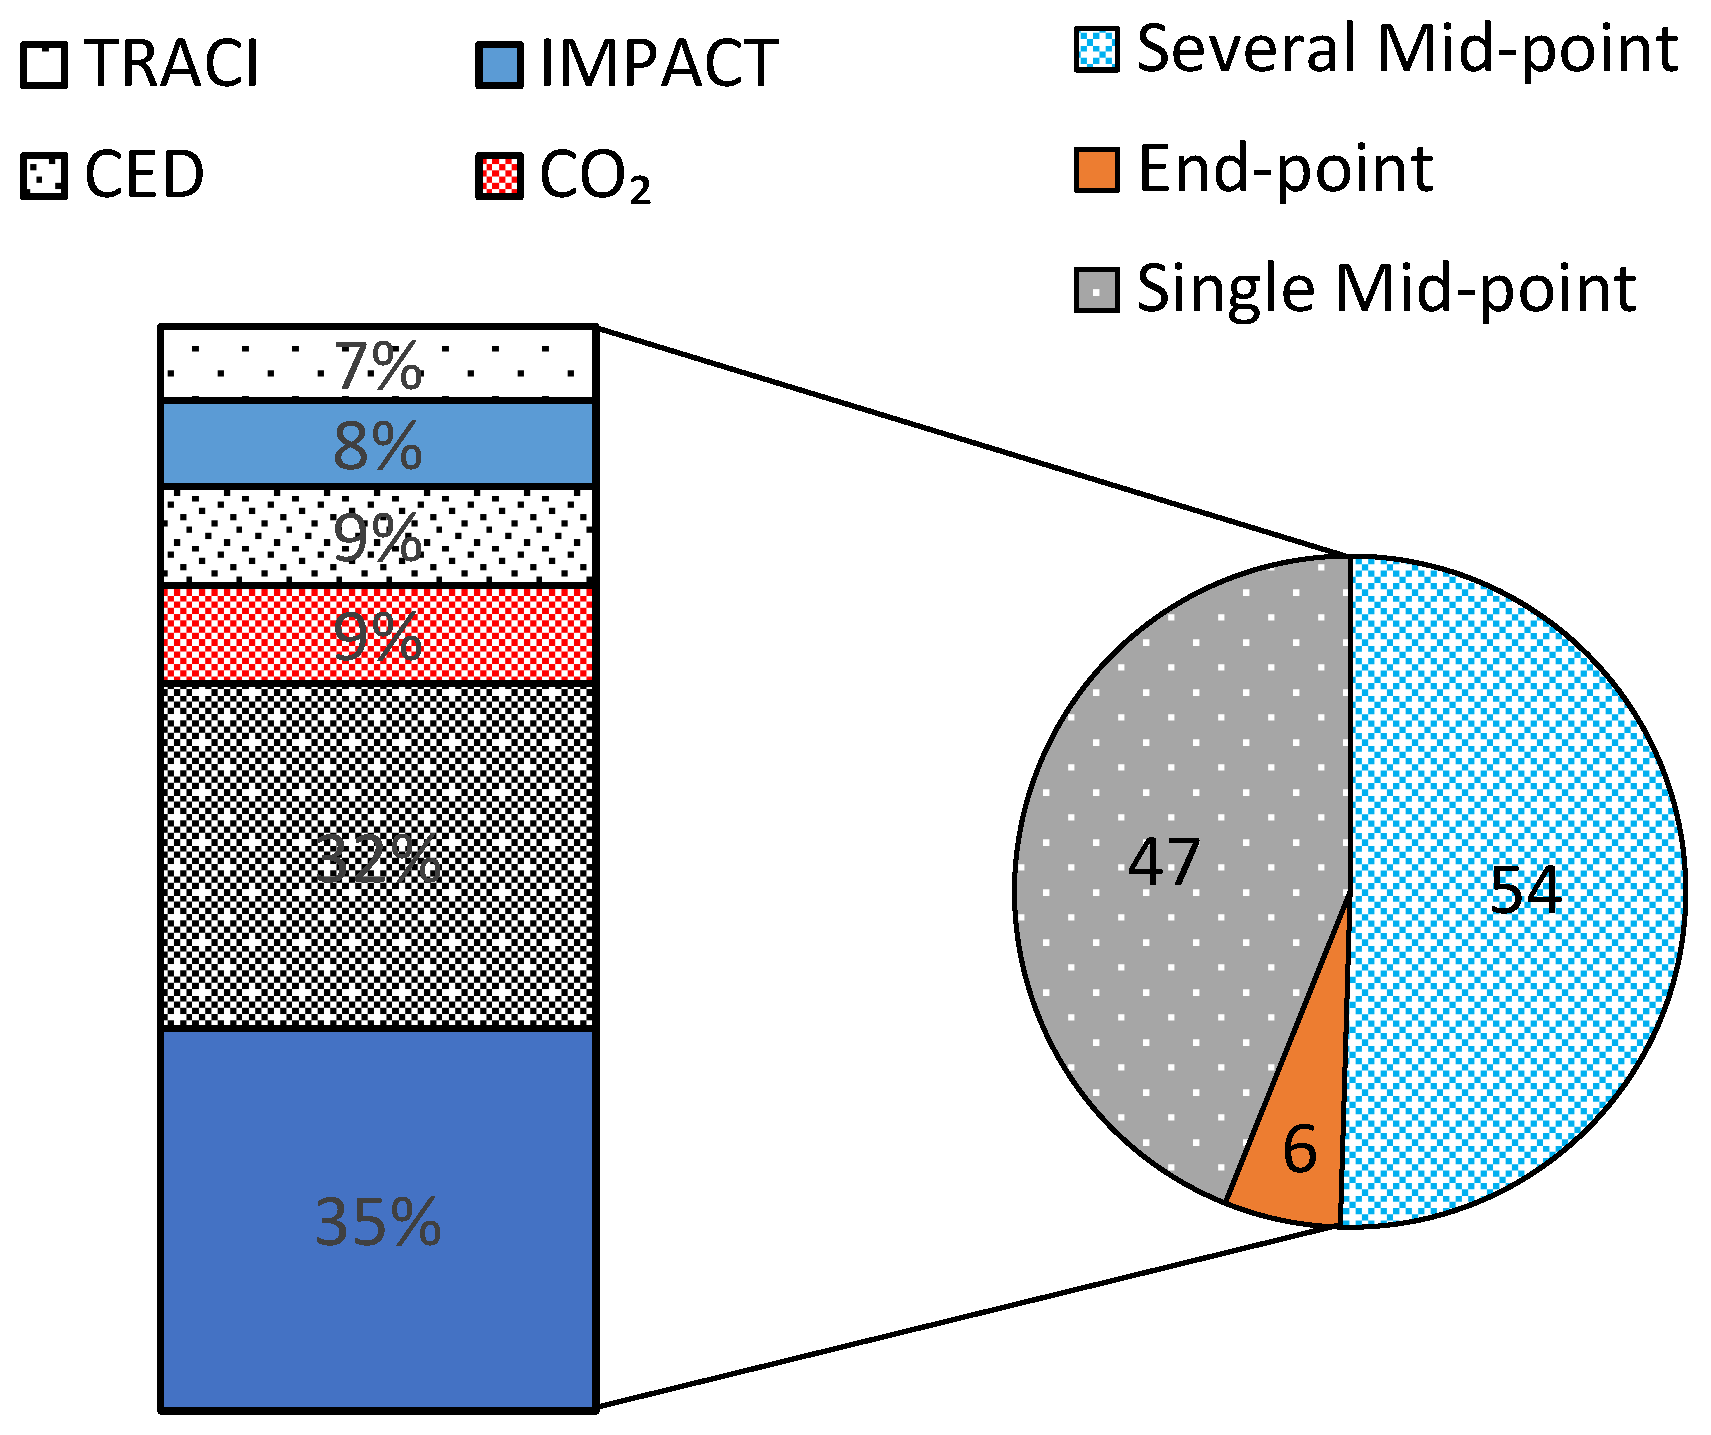
Table 1.
The different values for carbon sequestration from the papers reviewed.
| References | First Author’s Last Name | Year | Kg CO2/m3 |
|---|---|---|---|
| [62] | Collins | 2010 | 5 |
| [29] | Garcia-Segura | 2013 | 61 |
| [64] | Kim and Chae | 2016 | 172 |
| [65] | Lee | 2013 | 10 |
| [46] | Panesar and Churchill | 2010 | 30 * |
| [66] | Zhang | 2019 | 39 * |
| [44] | Souto-Matrinez | 2017 | 60 |
* Calculated based on a percentage of the 320 eq CO2/m3 average value.
Table 2.
Service life predictions for different concrete types from the literature.
| Reference | [36] | [46] | |||||
|---|---|---|---|---|---|---|---|
| Concrete Type | OPCC | 25%GGBS | 50%GGBS | 15% FA | 35%FA | 50%FA | |
| Cover (mm) | Service Life (Years) | ||||||
| Carbonation | 65 | 62 | 124 | 200 | - | - | - |
| 50 | 124 | 200 | 200 | - | - | - | |
| 35 | 200 | 200 | 200 | - | 100 | 100 | |
| Chloride Penetration | 65 | 33 | 68 | 114 | - | - | - |
| 50 | 67 | 138 | 200 | 51 | - | 60 | |
| 35 | 91 | 186 | 200 | - | - | - | |
Table 3.
Some values for the environmental impact of demolishing concrete from the literature reviewed.
Table 3.
Some values for the environmental impact of demolishing concrete from the literature reviewed.
| References | First Author’s Last Name | Year | kg CO2/m3 |
|---|---|---|---|
| [28] | Garcez | 2017 | 25 |
| [29] | Garcia-Segura | 2013 | 5 |
| [67] | Lopez-Gayyare | 2015 | 13 |
| [62] | Collins | 2010 | 5 |
Table 4.
Inventory data for different concrete components from the literature we reviewed.
| Ref. | 1st Author’s Name | Year | eq kg CO2/Tonne | |||||||||
|---|---|---|---|---|---|---|---|---|---|---|---|---|
| Steel | Coarse NA | Fine NA | FA | SF | GGBS | Lime | SH | SS | SP | |||
| [78] | Yang | 2014 | 3.2 | 2.3 | 27 | |||||||
| [30] | Gettu | 2018 | 265 | 144 | 516 | |||||||
| [79] | Zhang | 2014 | 14 | 41 | 27 | 720 | ||||||
| [20] | Biswas | 2017 | 1470 | 5 | 2.4 | 72 | 156 | 1130 | ||||
| [37] | Park | 2012 | 4 | 1 | 20 | 27 | 250 | |||||
| [39] | Robayo-Slazar | 2018 | 1.1 | 0.5 | 9 | 277 | 1359 | 793 | ||||
| [69] | Kurda | 2018 | 29 | 2 | 4 | |||||||
| [80] | Walach | 2018 | 3 | 13 | 4 | 1840 | ||||||
| [77] | Chen | 2010 | 350 | 19 | ||||||||
| [5] | Habert | 2011 | 4.3 | 2.4 | 5 | 17 | 35 | 1140 | 749 | |||
| [81] | Rahla | 2019 | 210 | 1580 | 134 | |||||||
| [82] | Chiaia | 2014 | 150 | 2.5 | 2.5 | 19 | 720 | |||||
| [83] | Long | 2015 | 6 | 1 | 9 | 19 | 17 | 720 | ||||
| [62] | Collins | 2010 | 46 | 14 | 27 | 143 | ||||||
| [84] | Flower and Sanjayan | 2007 | 36 | 14 | 27 | 143 | ||||||
| [85] | Proske | 2014 | 874 | 7 | 2.3 | 11 | 29 | 772 | ||||
| [52] | Sandanayake | 2018 | 40 | 14 | 1425 | 780 | ||||||
| [29] | Garcia-Segura | 2013 | 920 | 4 | 4 | 4 | 52 | 220 | ||||
| [18] | Al-Ayish | 2018 | 370 | 2.4 | 1.7 | 88 | ||||||
| Mean | 694.8 | 11.547368 | 6.44737 | 74.46 | 552 | 95.85 | 105.5 | 1392 | 904.3 | 833.2 | ||
| St dev | 486.2 | 14.489436 | 9.75525 | 118.2 | 890.9 | 78.61 | 201.2 | 46.7 | 204.2 | 441.7 | ||
| St. dev (% of mean) | 69.98 | 125.47825 | 151.306 | 158.7 | 161.4 | 82.01 | 190.7 | 3.35 | 22.58 | 53.01 | ||
Table 5.
Market prices of different concrete components from the literature.
| Ref. | 1st Author’s Name | Year | Country | FA (£/Tonne) | GGBS (£/Tonne) | SF (£/Tonne) | Electricity (£/kWh) |
|---|---|---|---|---|---|---|---|
| [53] | Anastasiou | 2015 | Greece | 3.50 | |||
| [86] | Chen | 2019 | France | 35 | 23 | 0.12 | |
| [77] | Chen | 2010 | France | 20 | 40 | 0.1 | |
| [75] | Crossin | 2012 | Australia | 100 | |||
| [87] | Gursel | 2015 | USA | 890 | |||
| [5] | Habert | 2011 | Switzerland | 25 | 45 | 0.12 | |
| [51] | Jiang | 2014 | USA | 74 | |||
| [88] | Khodabakhshian | 2018 | Iran | 500 | |||
| [89] | Li | 2015 | China | 20 | |||
| [17] | Marinkovic | 2017 | Serbia | 3.5 | 0.05 | ||
| [34] | Igancio | 2018 | Spain | 38 | 1140 | ||
| [56] | Panesar | 2019 | Canada | 135 | |||
| [37] | Park | 2012 | South Korea | 33 | 41 | ||
| [81] | Rahla | 2019 | Portugal | 28 | 37 | 430 | |
| [90] | Seto | 2017 | Canada | 107 | 0.07 | ||
| [45] | Teixeira | 2015 | Portugal | 21 | 0.22 | ||
| [91] | Tucker | 2017 | USA | 0.09 | |||
| [92] | Wang | 2017 | China | 10 | 0.11 | ||
| [93] | Yuan | 2017 | China | 0.11 | |||
| [59] | Zhang | 2014 | China | 9 | |||
| Mean | 38.7 | 42.6 | 740.0 | 0.11 | |||
| St dev | 40.3 | 29.0 | 334.8 | 0.05 | |||
| St. dev (% of mean) | 104.2 | 68.2 | 45.2 | 43.1 | |||
Table 6.
A sample of the inventory data for the transportation distances of concrete raw materials in km.
Table 6.
A sample of the inventory data for the transportation distances of concrete raw materials in km.
| Ref. | Author | Year | Kilometres | ||||||
|---|---|---|---|---|---|---|---|---|---|
| OPC | Aggregates | FA | GGBS | SP | SH | SS | |||
| [53] | Anastasiou | 2015 | 50 | 50 | 50 | ||||
| [20] | Biwas | 2017 | 25 | 1 | 0.01 | ||||
| [93] | Chrysostomou | 2017 | 45 | 36 | 39 | ||||
| [75] | Crossin | 2012 | 90 | 30 | 945 | 9317 | |||
| [98] | Maria | 2018 | 50 | 50 | 10 | ||||
| [24] | Ding | 2016 | 100 | ||||||
| [29] | Garcia-Segura | 2013 | 32 | 12 | 180 | 1640 | 724 | ||
| [64] | Kim and Chae | 2016 | 106 | 32 | 77 | ||||
| [69] | Kurda | 2018 | 60 | 65 | 160 | 15 | |||
| [89] | Li | 2015 | 177 | ||||||
| [17] | Marinkovic | 2017 | 100 | 100 | 50 | 50 | 20 | ||
| [39] | Robayo-Slazar | 2018 | 6 | 10 | 10 | 493 | 53 | 192 | |
| [41] | Salas | 2018 | 5 | 5 | 12 | 64 | |||
| [13] | Turk | 2015 | 50 | 1 | |||||
| [46] | Van den Heede and De Belie | 2010 | 113 | 193 | 38 | 118 | |||
| [78] | Yang | 2014 | 277 | 43 | 322 | 339 | 70 | ||
| mean | 72.1 | 48.5 | 195.9 | 1498.0 | 173.8 | 38.3 | 92.0 | ||
| St dev | 68.5 | 51.0 | 299.2 | 3205.7 | 271.8 | 22.9 | 89.4 | ||
| St. dev (% of mean) | 95.0 | 105.2 | 152.7 | 214.0 | 156.4 | 59.6 | 97.1 | ||
Table 7.
Summary of the sources of error from the review.
| # | LCA Stage | Source of Discrepancy | Description | Outcome | Frequency | Category | Impact on LCA Outcome | Potential Solution |
|---|---|---|---|---|---|---|---|---|
| 1 | Stage 1: LCA Scope | System Boundaries | Disregarding the “use” phase | Ignoring potential carbon sequestration by concrete | 90% | Reliability | 2–20% overestimation | Deduct the sequestered carbon by predicting the carbonation potential of concrete throughout its expected service life |
| 2 | Assuming same service life for concrete alternatives | 75% | Reliability | Underestimation (variable) | Include maintenance and/or replacement impact depending on the difference between the required and expected service life of concrete | |||
| 3 | Ignoring the operational energy consumed by concrete | 75% | Precision | 1–10% underestimation | Add an estimate of the operational energy consumed by concrete throughout its service life | |||
| 4 | Disregarding the “end-of-life” phase | Ignoring the impact of demolishing concrete | 75% | Precision | 1–10% underestimation | Add an estimate of the emissions and energy required to demolish the concrete alternative at the end of its service life | ||
| 5 | Ignores the avoided landfill impact for CDW waste | 95% | Precision | 1–10% overestimation | Deduct the impact from avoiding landfilling the waste that is being recycled as aggregates in the concrete mix | |||
| 6 | Functional Unit | Selecting a volume based FU | Ignores the functional properties of concrete | 65% | Reliability | Variable | Select a functional unit that reflects performance based specifications such as strength and predicted service life | |
| 7 | Selecting a unit level of details | Missing out on the potential of optimizing the total volume required | 70% | Precision | Variable | If possible, select a “whole structure” LoD to run different scenarios optimizing the impact based on strength and volume of concrete | ||
| 8 | Stage 2: Inventory Data | Data source | Relying on secondary sources | Not reliable and sometimes irrelevant data | 45% | Reliability | Variable | Whenever possible, rely on primary sources such as EPDs and certified lab results |
| 9 | Data variability | Variability in upstream data | Higher uncertainty in the values for impact and cost of transportation and raw materials | NA | Precision | Variable | Whenever needed, perform scenario analyses to measure the sensitivity of the outcome to the potential variability in upstream data | |
| 10 | Impact allocation | Impact allocation for SCM | Ignoring the impact allocation for SCMs recycled in concrete | 75% | Reliability | Variable | If the difference between the price of main and secondary process generating the SCM product is > 25%; economic allocation should be applied | |
| 11 | Stage 3: Impact Assessment | Indicators | Using end-point indicators | Carries large uncertainties in correlating cause-effect environmental impact relationships | 5% | Reliability | Variable | Use a combination of mid-point indicators to calculate the impact for concrete such as GWP, EP, ODP, AP, CED |
| 12 | Using CO2 as GWP | It ignores the impact associated with methane and nitrogen dioxide as GHG emissions | 10% | Reliability | 10–30% underestimation | Use a standard methodology such as CML or TRACI that characterizes the different GHG emissions contributing to the GWP indicator | ||
| 13 | Stage4: Interpretation of results | Absolute judgements | Deterministic LCA outcome | Ignores the uncertainties aforementioned in the nature of the upstream data | 90% | Reliability | NA | Perform scenario analyses, quantify the uncertainties in each of the elements then do a Monti Carlo simulation to aggregate the uncertainties of the indicators |
© 2019 by the authors. Licensee MDPI, Basel, Switzerland. This article is an open access article distributed under the terms and conditions of the Creative Commons Attribution (CC BY) license (http://creativecommons.org/licenses/by/4.0/).
Share and Cite
MDPI and ACS Style
Hafez, H.; Kurda, R.; Cheung, W.M.; Nagaratnam, B. A Systematic Review of the Discrepancies in Life Cycle Assessments of Green Concrete. Appl. Sci. 2019, 9, 4803. https://0-doi-org.brum.beds.ac.uk/10.3390/app9224803
AMA Style
Hafez H, Kurda R, Cheung WM, Nagaratnam B. A Systematic Review of the Discrepancies in Life Cycle Assessments of Green Concrete. Applied Sciences. 2019; 9(22):4803. https://0-doi-org.brum.beds.ac.uk/10.3390/app9224803
Chicago/Turabian StyleHafez, Hisham, Rawaz Kurda, Wai Ming Cheung, and Brabha Nagaratnam. 2019. "A Systematic Review of the Discrepancies in Life Cycle Assessments of Green Concrete" Applied Sciences 9, no. 22: 4803. https://0-doi-org.brum.beds.ac.uk/10.3390/app9224803
Note that from the first issue of 2016, this journal uses article numbers instead of page numbers. See further details here.