Analytical Model for Predicting the UCS from P-Wave Velocity, Density, and Porosity on Saturated Limestone


Department of Metallurgical and Mining Engineering, Universidad Católica del Norte, 1270709 Antofagasta, Chile
*
Author to whom correspondence should be addressed.
Appl. Sci. 2019, 9(23), 5265; https://0-doi-org.brum.beds.ac.uk/10.3390/app9235265
Submission received: 5 November 2019
/
Revised: 24 November 2019
/
Accepted: 28 November 2019
/
Published: 3 December 2019
(This article belongs to the Section Civil Engineering)
Abstract
:Rock mechanics and rock engineering projects require determining, among other parameters, the uniaxial compressive strength (UCS) of rock. For such a purpose, it is not uncommon to perform ultrasonic pulse laboratory tests. Many researchers have found experimental relationships between strength and P-wave velocity, but these relationships are based mainly on dry conditions and without considering any other physical or chemical characteristics of the studied rock. Specifically, for limestone, there are 11 correlations reported in the literature, eight of which are simple and the remaining three are multiple, and, among the latter, only two of them consider the saturation. In order to evaluate the combined effect of P-wave velocity, density, and porosity on the UCS of saturated limestone, simple and multiple regression analyses were carried out on the test results of 13 saturated limestone specimens to determine the parameters of both previously mentioned predictive models. The results showed that density is not correlated with strength.

1. Introduction
Rock mechanics and rock engineering projects require obtaining the physicochemical properties of rocks. Uniaxial compressive strength (UCS) is, perhaps, the most important parameter for mechanically characterizing a rock or rock mass [1,2,3]. Other parameters, such as the elastic (static and dynamic) ones, are also required as indicators of the stress–strain behavior of rocks and rock masses.
UCS is mainly obtained in laboratories by means of destructive tests carried out on cylindrical specimens and is standardized by test methods [4,5] or suggested methods [6]. Since the preparation of the specimens needed to achieve the required specifications is time (and money)-consuming, some researchers [7,8,9,10,11,12,13,14,15,16,17,18,19,20,21,22,23,24,25,26,27,28,29,30,31,32] have been developing empirical relationships between ultrasonic wave velocity and UCS results in order to predict strength and deformability parameters.
P-wave velocity (vp) and S-wave velocity (vs) are easily obtained in a laboratory by means of a nondestructive test based on ultrasonic pulses that is currently only standardized by a suggested method of the International Society for Rock Mechanics and Rock Engineering (ISRM) [33]. Beginning from vp and vs, the dynamic elastic modulus (Edyn) and dynamic Poisson’s ratio (νdyn) can be obtained [33], but these velocities are related to more physical and mechanical properties of rocks. In this sense, a good number of authors have studied the relationship between vp and density (ρ) [7,8,9], porosity (n) [10,11,12], pore water content [13,14,15,16], content on clayey minerals inside the pores [17,18], UCS with different degrees of saturation (Sr) [19,20,21,22,23,24,25,26,27,28], and the static elastic modulus (Est) [29,30]. In addition, the relationship of the geometry of the tested specimen with vp has been studied, both on the diameter (D) [31] and height (H) [32] of the specimen.
Table 1 shows the equations obtained by other authors, all of which are simple correlations (UCS only depends on vp) and only one of them considers saturating the specimen [18], so the combined effect of vp, ρ, and n is not considered in the UCS results. Table 2 shows the equations obtained by authors who addressed correlations not only with vp, but also with other parameters. In this sense, Jamshidi et al. [28] considered the combined effect of vp, ρ, and n, and Karakul and Ulusay [18] considered vp, Sr, and the effective clay content (ECC). The aim of this study was to statistically analyze the combined effect of vp, ρ, and n on the UCS of cylindrical specimens of saturated limestone.
Up to here, all the known correlations between vp and UCS have been presented in a general view. In the following paragraphs, the studies on and correlations between vp and UCS for limestone are discussed in detail.
Kahraman [21] studied the UCS of 48 different rocks (sedimentary, igneous, and metamorphic), 10 of which were limestones coming from different sites in Turkey. vp was measured in 27 parallelepiped blocks of 13 × 20 × 12 cm3, and seven of the rocks were limestone with a vp between 4.1 and 5.5 km·s−1. The obtained Equation (1) is a potential equation with R2 = 0.69.
Yasar and Erdogan [22] studied the effect of vp, ρ, and Est on UCS but as simple regressions (one parameter at a time). They studied carbonate rocks from different places in Turkey. vp was measured in three cubes of unknown dimensions, and in five cylindrical specimens (42 mm in diameter and 105 mm in length). The results showed vp minimum and maximum values of 2.9 and 5.6 km·s−1, respectively. The linear correlation (Equation (2)) obtained by the authors was based on average values of four different limestones, obtaining R2 = 0.80.
Kiliç and Teymen [25] collected 19 rock samples from Southern Anatolia (Turkey). Ten of them were igneous (seven were volcanic), two of them were metamorphic, and the remaining seven were sedimentary. Among the latter, there was a limestone. This limestone was studied by means of three cylindrical specimens (42 mm in diameter and 85 mm in length) and the mean resulting vp was 5.840 km·s−1. The authors obtained Equation (3) with R2 = 0.94.
Yagiz [26] tested 10 specimens of nine different rocks (three of them were limestones) collected in Turkey. The author did not show the geometry of the specimens, but vp values were reported for each kind of rock. For the studied limestones, vp was between 3.8 and 5.0 km·s−1. The author obtained a potential Equation (4) with R2 = 0.85.
Altindag [34] studied nine different rocks, among which there were 54 limestone specimens with an average value of vp = 5.05 km·s−1. The authors did not provide information on the dimensions of the specimens but obtained another potential Equation (5).
Sarkar et al. [35] tested 44 specimens of 13 different rocks. From these 44 specimens, 10 were limestone, but the specimen dimensions were not reported. The average vp value for the limestone was 3.128 km·s−1. They obtained a nice linear correlation (Equation (6)) with a quite good R2 = 0.93.
Karakul and Ulusay [18] tested 14 different rocks (nine sedimentary, three volcanic, and two volcano-sedimentary). The authors studied two different diameters—NX (54.7 mm) and NQ (47.6 mm)—with a height-to-diameter ratio between 2.5 and 3. The minimum and maximum vp values reported were 6.16 (dry conditions) and 6.30 (saturated conditions), respectively. The authors obtained a simple correlation between UCS and vp (Equation (7)) and a multiple correlation where they added n and ECC (Equation (9)), since the deformability and strength of rocks are directly related to the effective clay content in the rock pores.
Jamshidi et al. [28] are the only authors, to our knowledge, who obtained a correlation between UCS and vp only for limestone. The authors reported cylindrical specimens 54 mm in diameter and 135 mm in height, with an average vp value of 4.828 km·s−1. They obtained a logarithmic relation (Equation (8)) with R2 = 0.82, beginning from 18 cylindrical specimens. Additionally, the authors proposed two different multiple correlations. The first one related UCS with vp and ρ (Equation (10)), and the second one related UCS with vp and n (Equation (11)). All tests were performed in dry conditions (Sr = 0).
2. Experimental Works
2.1. Specimen Preparation
The studied rock was obtained from a mine located near Antofagasta, which is the capital and largest city of the region of Antofagasta in northern Chile. The marine calcareous rock is dated in the lower cretaceous era (between the Hauterivian and Barremian ages) and is a fine limestone with a variable content of CaCO3 between 78% and 90%.
Beginning from some rock samples obtained in the mine, 13 cylindrical specimens (30.9 mm in diameter and a length-to-diameter ratio of 2.1 [4]) were obtained in order to perform UCS tests. Geometry requirements of the specimens [5] were achieved by means of careful drilling and a grinding machine. All the specimens showed no visible discontinuities and were tested in order to obtain density, porosity, ultrasonic velocity, and uniaxial compressive strength, following the current standards [5,6]. The results of these tests are shown in Table 3.
2.2. Density and Porosity Tests
The 13 specimens were tested following the suggested method of the ISRM [6] in order to determine dry mass (maintained at 105 °C for 24 h) and saturated mass (submerged for 48 h). The hydrostatic scale method was used in order to calculate the total volume of the samples. Dry density (ρdry), saturated density (ρsat), and n were obtained separately by the following Equations (12)–(14):
where mdry is the dry mass (g), msat is the saturated mass (g), msub is the submerged mass (g), Vv is the pore (void) volume (cm3), VT is the bulk volume (cm3), and ρw is the water density (g·cm−3).
The mean values of ρdry, ρsat, and n were 2.63 g·cm−3, 2.65 g·cm−3, and 2.5% respectively.
2.3. Ultrasonic Pulse Transmission Tests
The tests were carried out with a PROCEQ Pundit Lab+ apparatus. ISRM indications were followed and a direct configuration of the transducers with 54 kHz of bandwidth was used. In order to achieve correct coupling between the transducers and the specimen, a thin layer of stiffer grease was spread on the ground faces of the specimens. Specimens were saturated (Sr = 1) in order to obtain maximum values of vp and vs [14,18], as well as the lowest UCS when effective stress was considered due to Terzaghi’s law [36], as Torok and Vásárhelyi [16] indicated for limestone.
The average primary velocity is larger for saturated conditions than for dry conditions. ∆vp was 197 m·s−1, so it can be derived that its ECC was almost null [19]. The average vp-to-vs ratio was 1.87, which is in the 1.8–1.9 experimental range obtained by Pickett [37] for limestone. This ratio is also over 1.4, which is the minimum value (corresponding to a null Poisson’s ratio) indicated by Schön [38].
2.4. Uniaxial Compressive Strength Tests
The American Society for Testing and Materials (ASTM) standard [4] was followed to perform the tests. A fully servo-controlled 300 t press (CONTROLS 50-C52Z00 + MCC8 50-C8422/M) was used. The load velocity was fixed to 0.2 MPa·s−1 in order to achieve failure between 5 and 10 min after the test began. On average, the uniaxial compressive strength was 68.99 MPa.
2.5. Statistical Model
The effect of the independent variables on modeling UCS was studied using the optimization of the response surface methodology [39,40]. Additionally, a quadratic model was developed and fitted to the experimental results in order to study the UCS of the limestone when varying vp, n, and ρsat.
From the uniaxial compressive strength tests, Minitab 18 software was used to investigate the linear effects, interactions, and quadratic effects of the independent variables on UCS. Experimental results were fitted firstly to a simple regression model (vp dependent). They were then fitted to a multiple regression analysis [41] (adding n and ρsat) using a quadratic model, considering only those variables that can explain the variability of the model and, therefore, those variables with a large statistical significance. The general expression of the experimental model is shown in Equations (15) and (16):
where xi are the independent variables vp, ρsat, and n; bi and bij are the coefficients; and the result Y is the UCS. The experimental data used to design the model are shown in Table 3.
R2, p-values, and Mallows’ Cp statistics, as well as the indicators of goodness of fit, indicate if a model is adequate in order to describe the dependent variable on the pertinent domain. The coefficient of determination (R2) measures the total variability proportion of the dependent variable related to its average value obtained by the regression model. p-values represent statistical significance and they indicate if there is a significant relation between the response of the model and the experimental results. Mallows’ Cp is a measure of the precision of the model as well as the bias on the actual parameters of the regression analysis [42,43].
3. Results and Discussion
3.1. Bibliographical Correlations between UCS and vp for Limestone
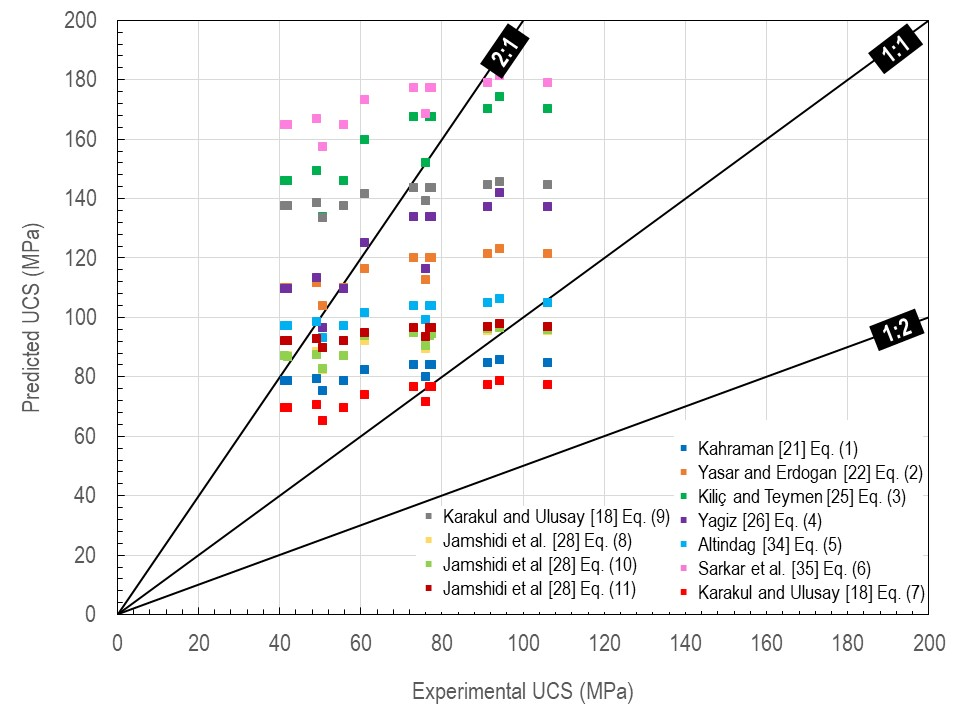
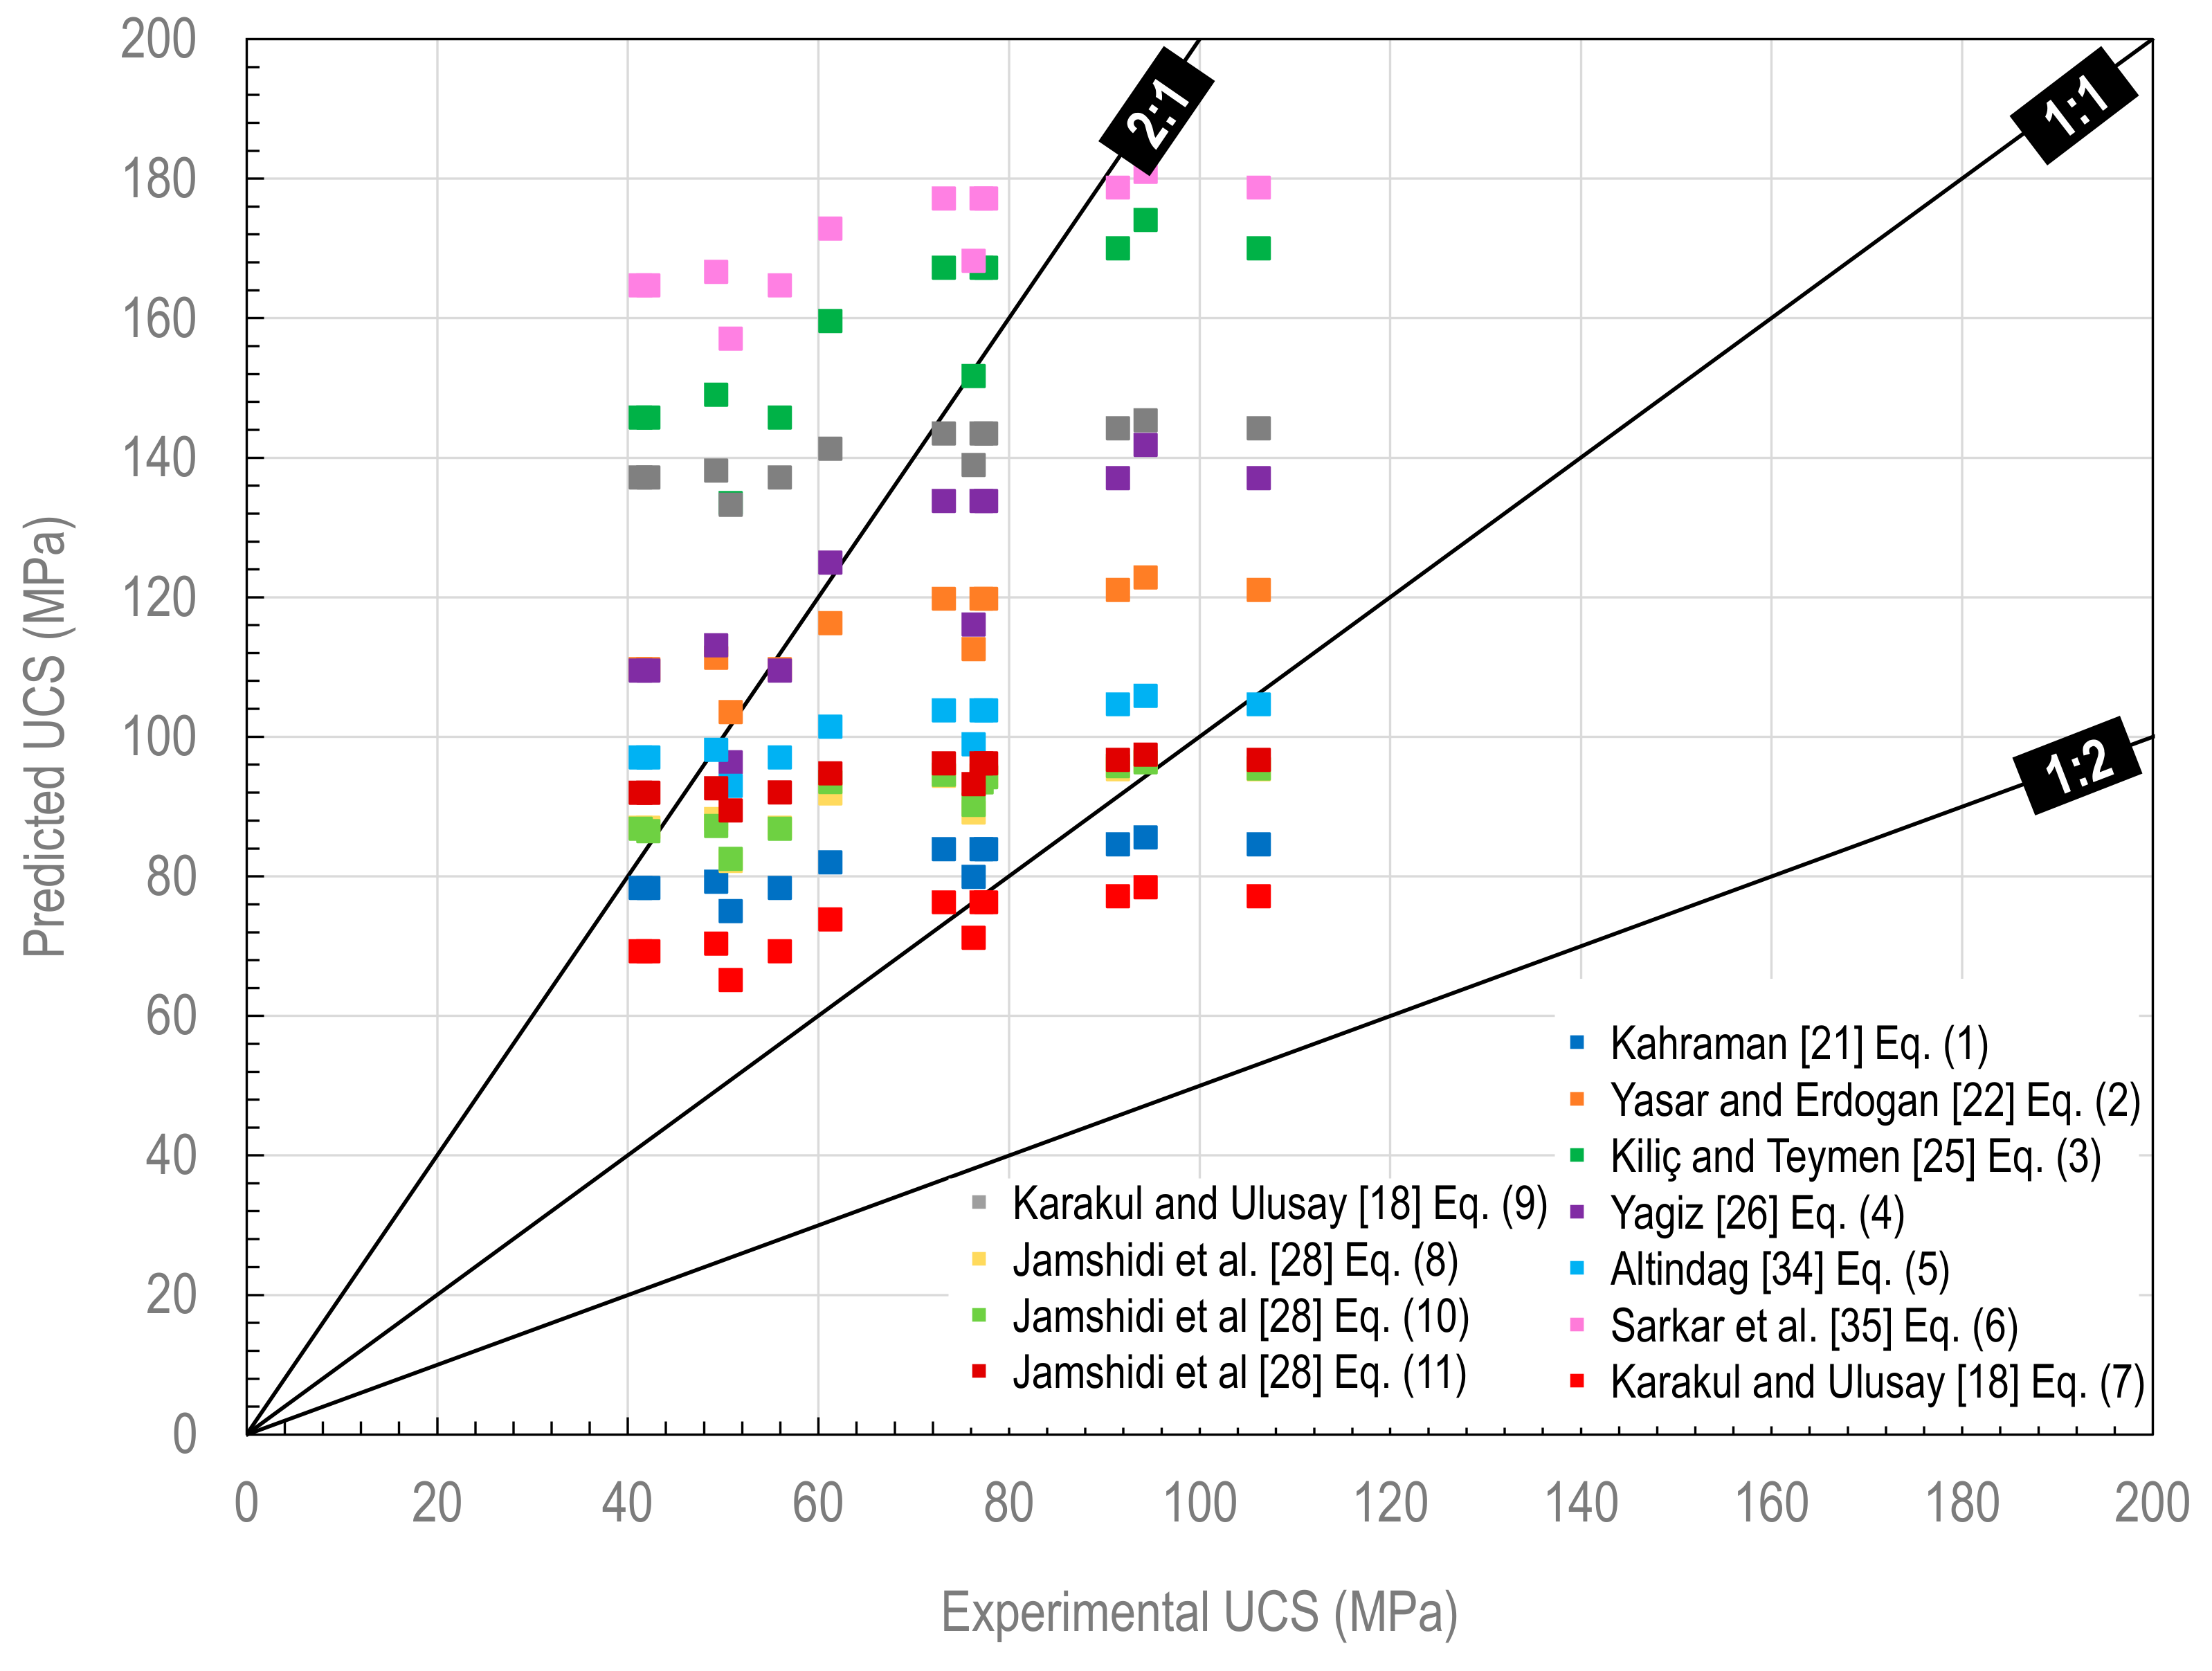
Figure 1 shows the predicted UCS as obtained by using the previously mentioned equations compared to the obtained UCS in the actual uniaxial compressive strength tests. It can be readily observed that none of the equations correctly captured all the performed tests, although there were a few coincidences with Equations (1), (7), (8), (10), and (11). Table 4 shows the average predicted values of UCS as well as the relative error for each of these equations. The value obtained with Equation (7) [19] showed the minimal relative error; Equation (7) is the only equation that considers saturated conditions.
3.2. Experimental Correlation between UCS and vp in This Study
Obtained vp values were correlated with obtained UCS using simple and multiple regression analyses. All test results were used to generate empirical equations able to predict limestone UCS beginning from the independent variables (vp, ρsat, and n). Four types of function models were tested: linear, potential, exponential, and logarithmic. The equation of the best fit, R2, F-values, and p-values (significance) were obtained for each regression analysis.
3.2.1. Simple Regression Analyses
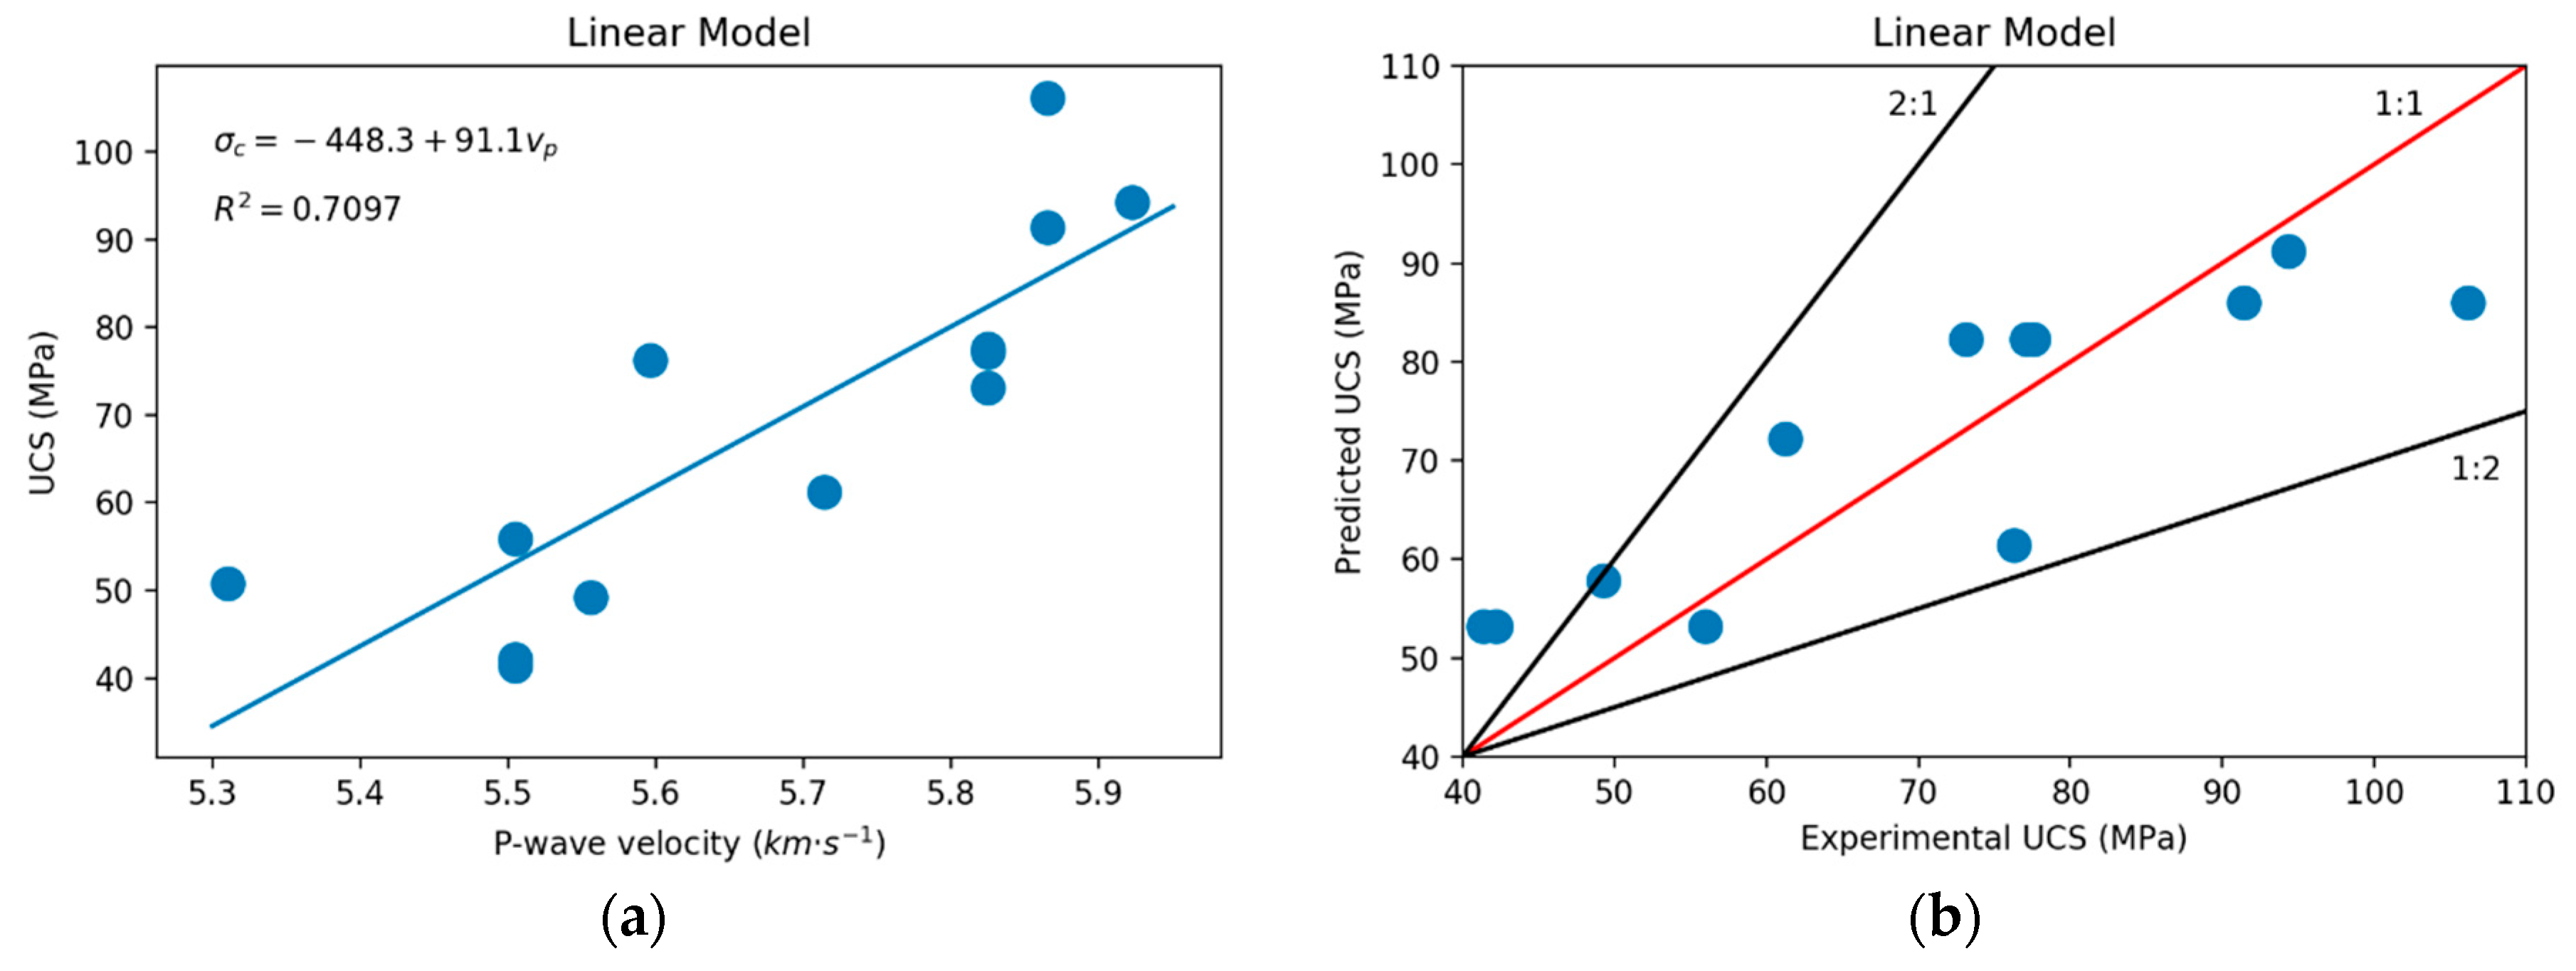
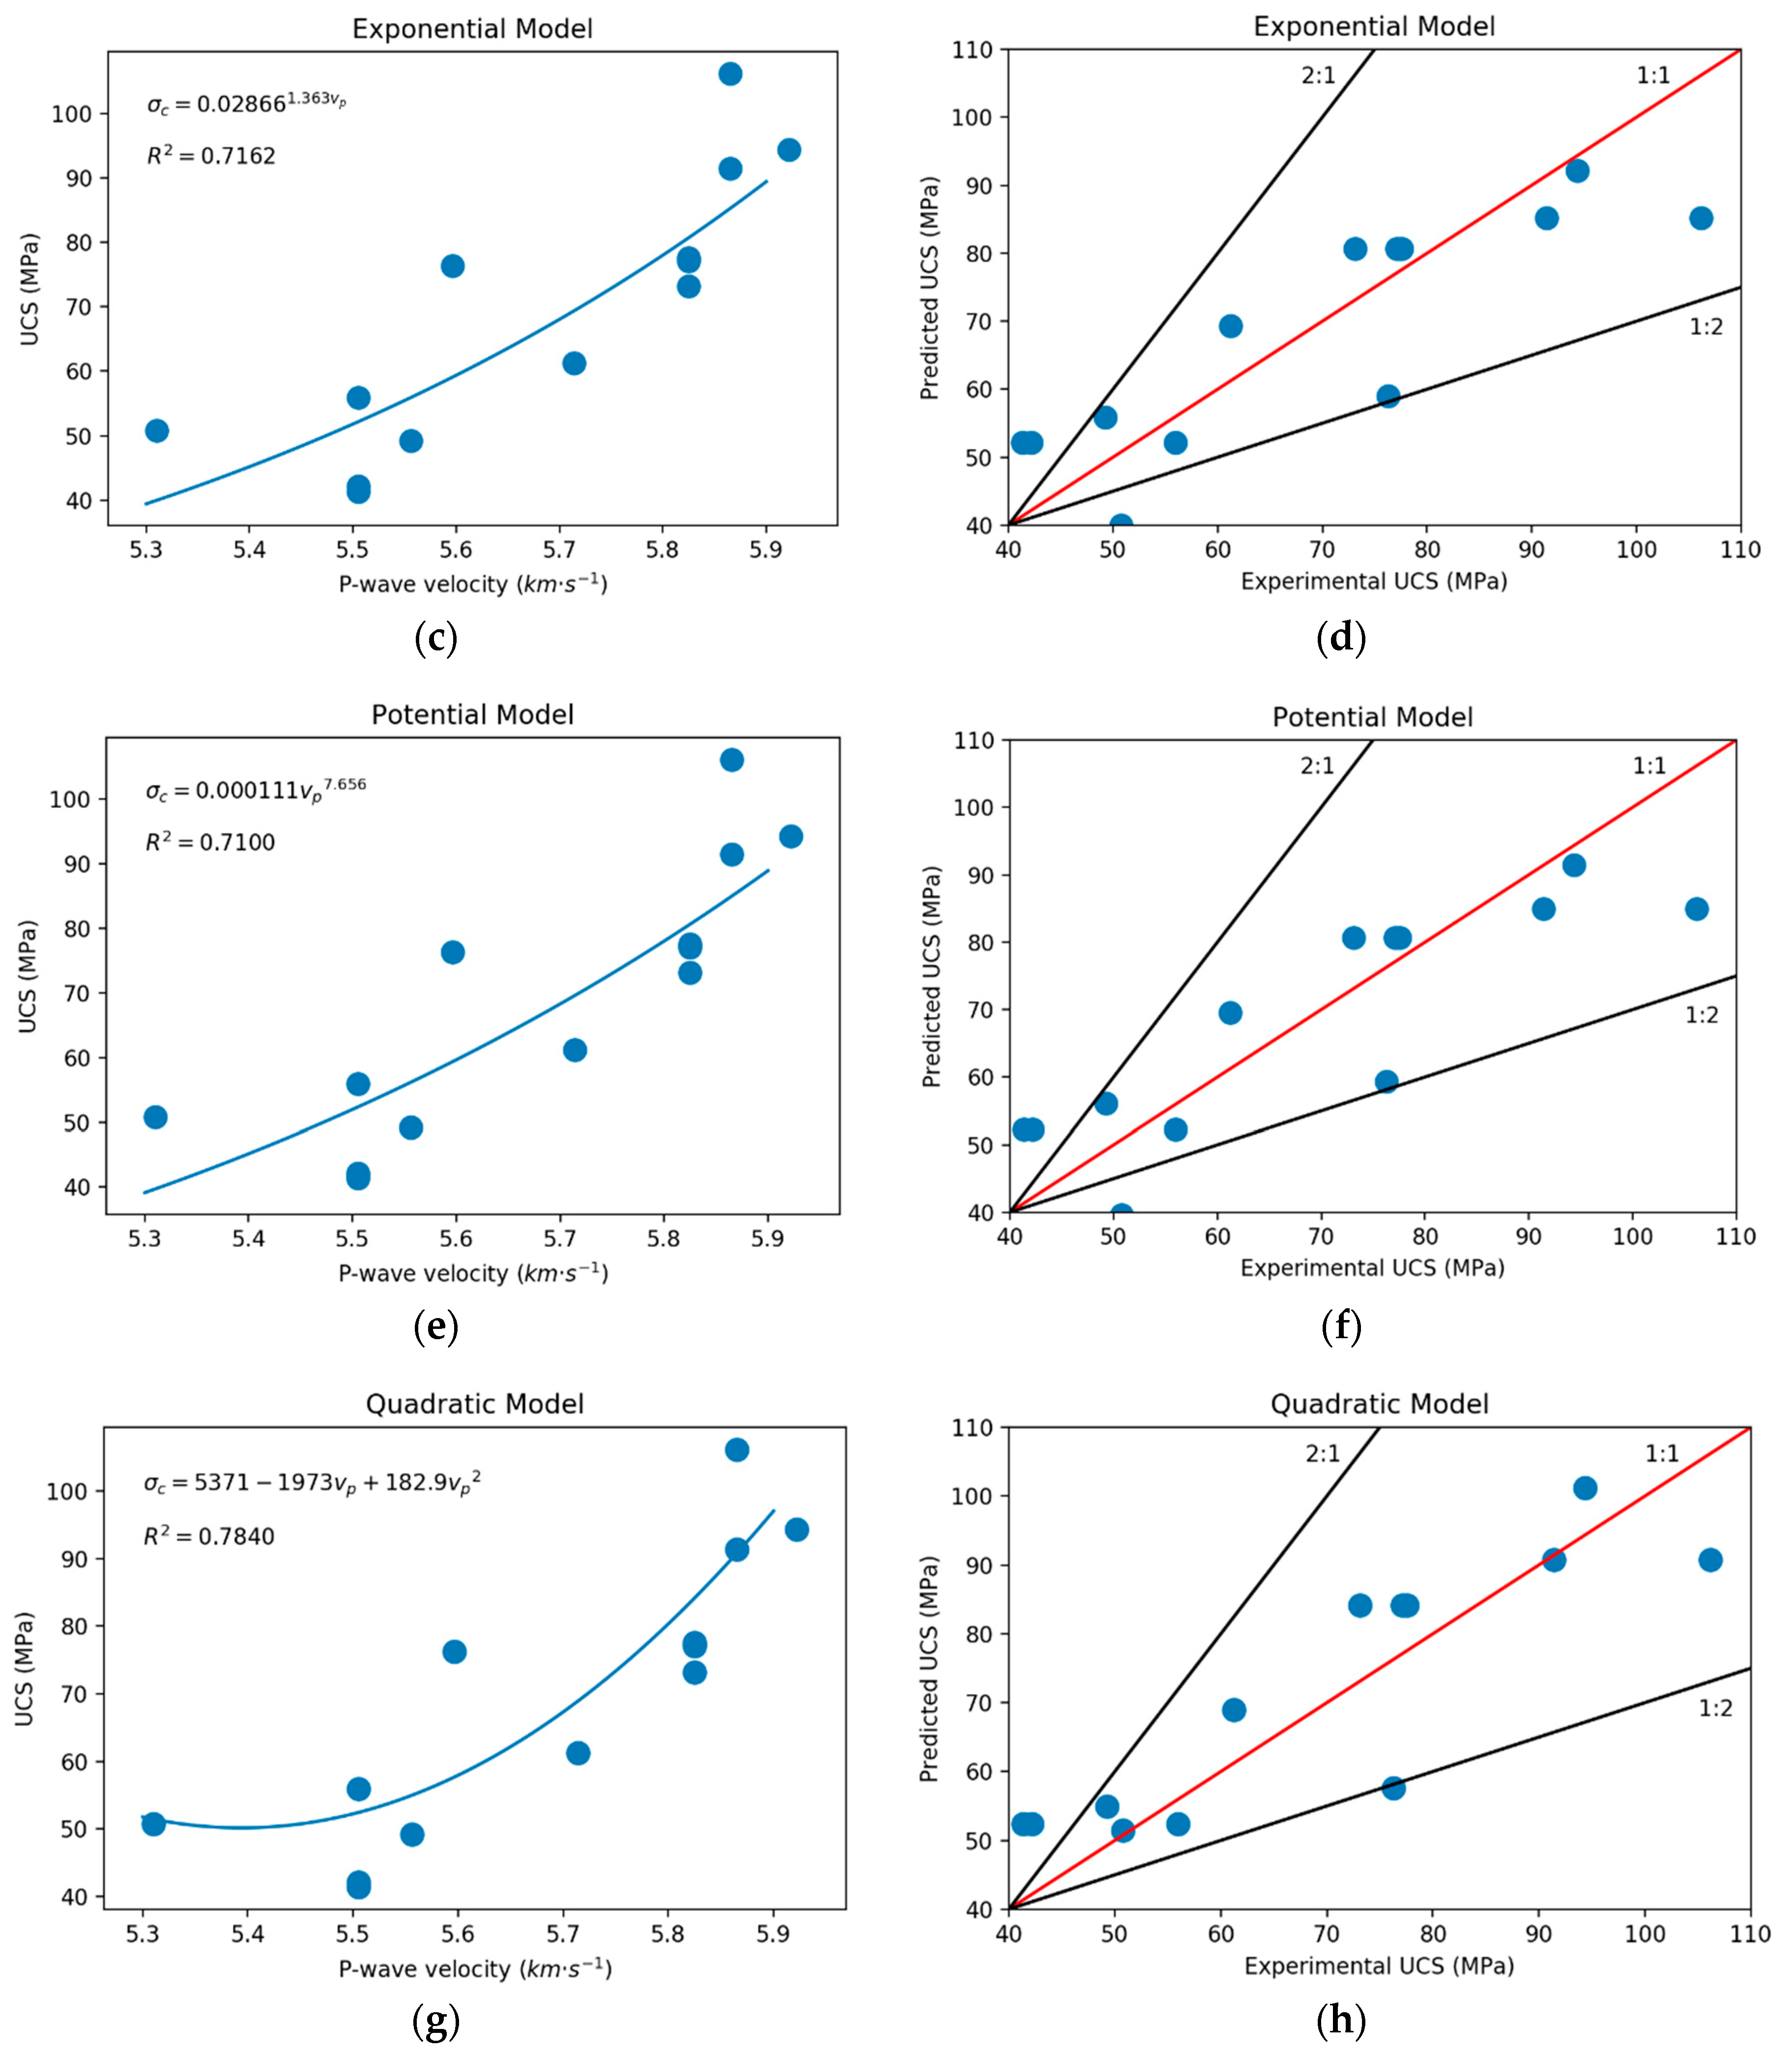
The obtained simple regression model that could predict UCS beginning from the independent variable (vp) and fitted to the values of Table 3 is shown in Equation (17):
Based on variance analysis, the simple regression shown in Figure 2a was suitable to predict UCS. In addition, the p-value (<0.05), F-value (26.89), R2 (70.97%), and the plot of predicted UCS versus experimental UCS (Figure 2b) validated the model, which demonstrates the great normality of the residuals.
On the other hand, exponential Equation (18), potential Equation (19), and quadratic Equation (20) models were fitted to the results, and a better fit was obtained compared with the linear simple regression model. The statistics p-value (<0.05), F-value, R2, and errors also validated them (Table 5):
Predicted UCS values of the tested specimens were plotted against measured values. The error of each predicted value was represented as the distance to the 1:1 line. A point located in the line 1:1 indicates an exact prediction, while the points located far away from the 1:1 line represent an error. As can be observed (Figure 2b,d,f,h), the obtained points were located surrounding the 1:1 line.
The checked simple regression models are shown in Figure 2. The quadratic solution (Figure 2g,h) is the analytical model that provided the best fit (goodness-of-fit statistics of all the models are shown in Table 5). On the other hand, the worst fit was obtained by the simple linear regression model (Figure 2a,b), followed by the potential (Figure 2c,d) and the exponential (Figure 2e,f) models.
Although the simple regression analyses (including exponential and potential models by means of logarithmic transformation) obtained high coefficients of determination, these analytical models only considered one independent variable. The inclusion of other independent variables (through multiple regression analysis) has the potential of obtaining a better fit and reducing the variability of the results.
3.2.2. Multiple Regression Analyses
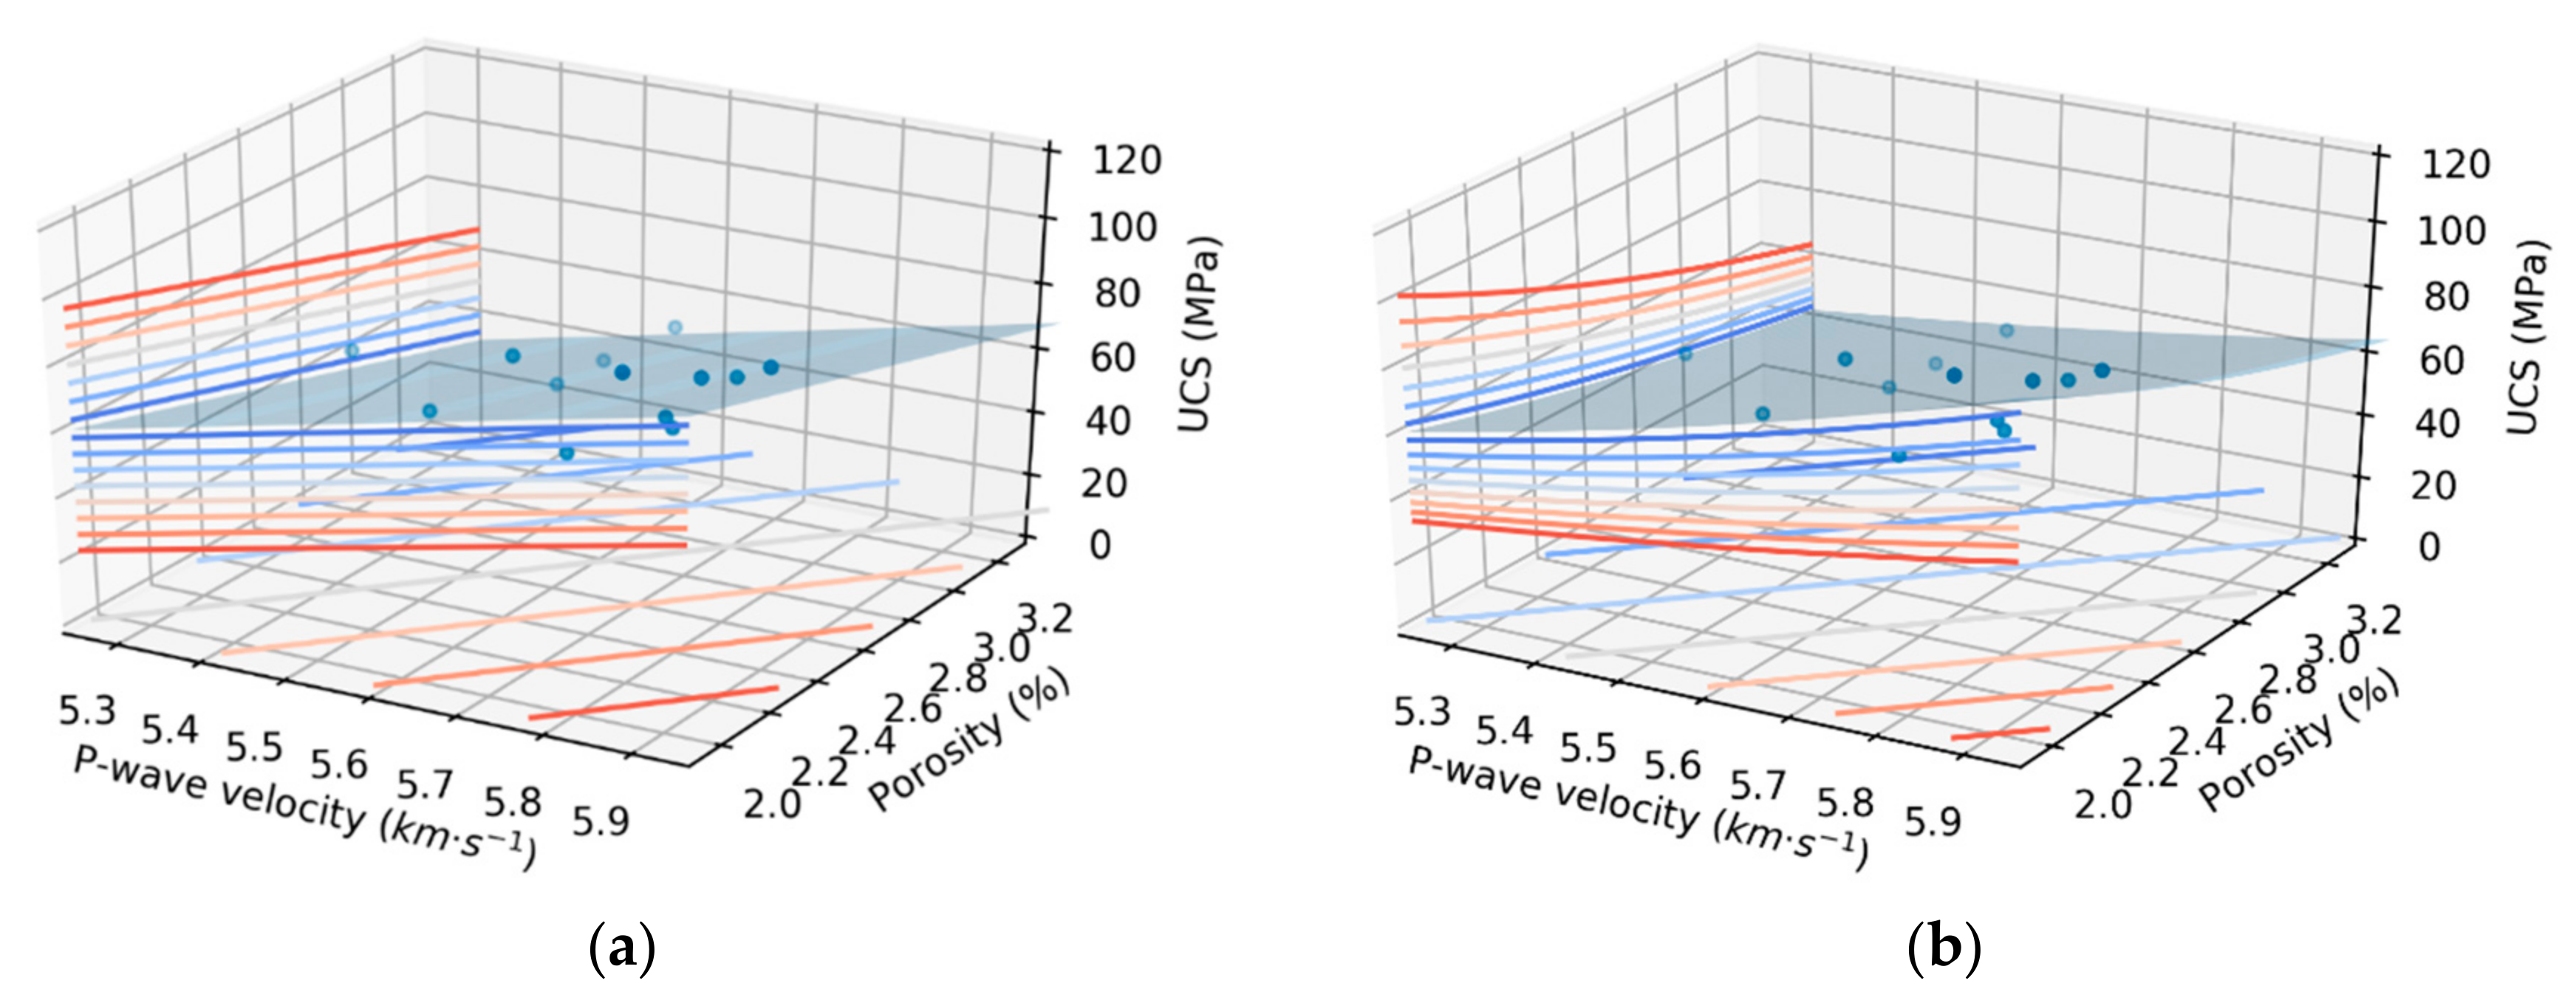
Results of the multiple regression analyses through ANOVA showed that there was no significant effect of the saturated density ρsat in the UCS results (p > 0.05), considering both linear and quadratic models or derived from the interactions with the remaining independent variables. On the other hand, the linear effects and interaction of vp and n contributed greatly to explaining the experimental model. Then, after eliminating nonsignificant coefficients, two models were generated to predict the UCS over the range of sampled experimental conditions presented in Equations (21) and (22):
The ANOVA test of the models adjusted in Equations (21) and (22) was suitable for representing UCS under the range of sampled parameters. There was no lack of fit of the models, and the values of R2 (0.8228) for the multiple regression and R2 (0.8490) for the exponential model validated it. The ANOVA showed that the indicated factors influenced the UCS because of Fregression (23.21) and Fexponential (28.12) > FTheoretical (F2,9 = 3.8625) at a 95% confidence level. Additionally, the p-values of both models (Table 5) indicated that they were statistically significant, while the Mallows’ Cp statistic indicated that the adjusted models were relatively accurate and did not show bias in the estimation of the true regression coefficients.
Figure 3a shows that the UCS increased linearly for larger values of vp and lower values of n. In addition, a lower UCS was attained for large levels of n and low values of vp. Figure 3b shows that there was an exponential decrease of the UCS when increasing porosity and an exponential increase of UCS when increasing vp. Therefore, considering the goodness parameters of both fits, the potential model Equation (22) best represented the uniaxial compressive strength under the studied conditions.
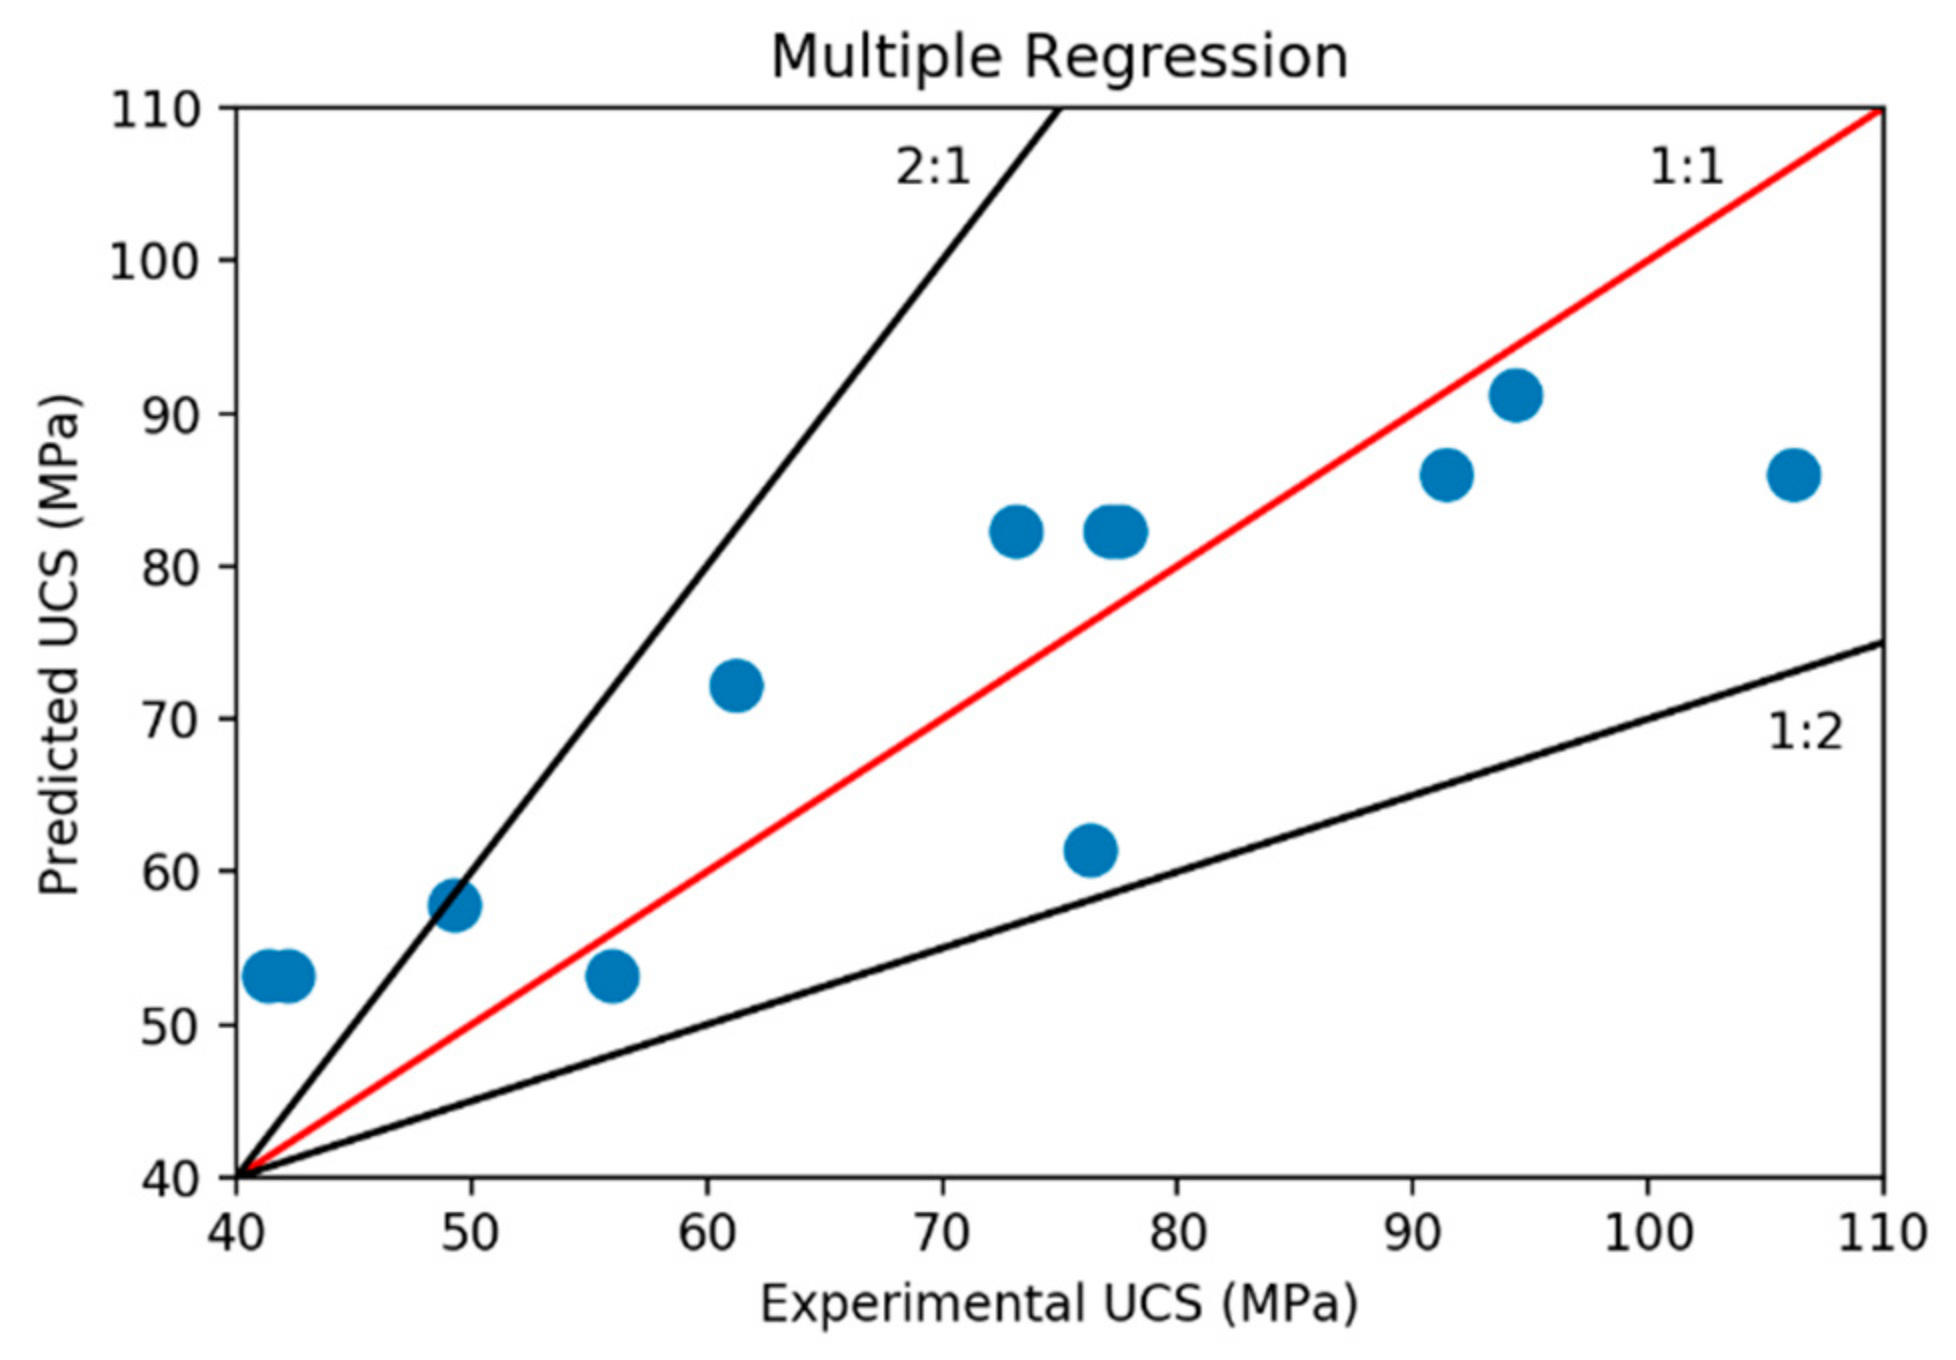
The predicted Equation (22) and experimental values of UCS are compared in Figure 4. This figure shows that the observed versus predicted data usually followed the diagonal line (1:1). The normality test determination coefficients were very high (p = 0.77), which indicates a good correlation.
The levels of significance of the regression coefficients (after a transformation of the exponential with the multiple exponent model) were investigated by means of an F-test. The F-value (28.12) of the Equation (22) model and the corresponding significance level equal to zero (Table 5) suggest that at least one of the independent variables influenced the dependent variable. On the other hand, all significance levels of the model parameters were lower than α = 0.05, so there were significant individual correlations between dependent and independent variables. Finally, the ANOVA test results suggest that the developed empirical correlation Equation (22) between UCS (dependent variable) and vp and n (independent variables) was significant.
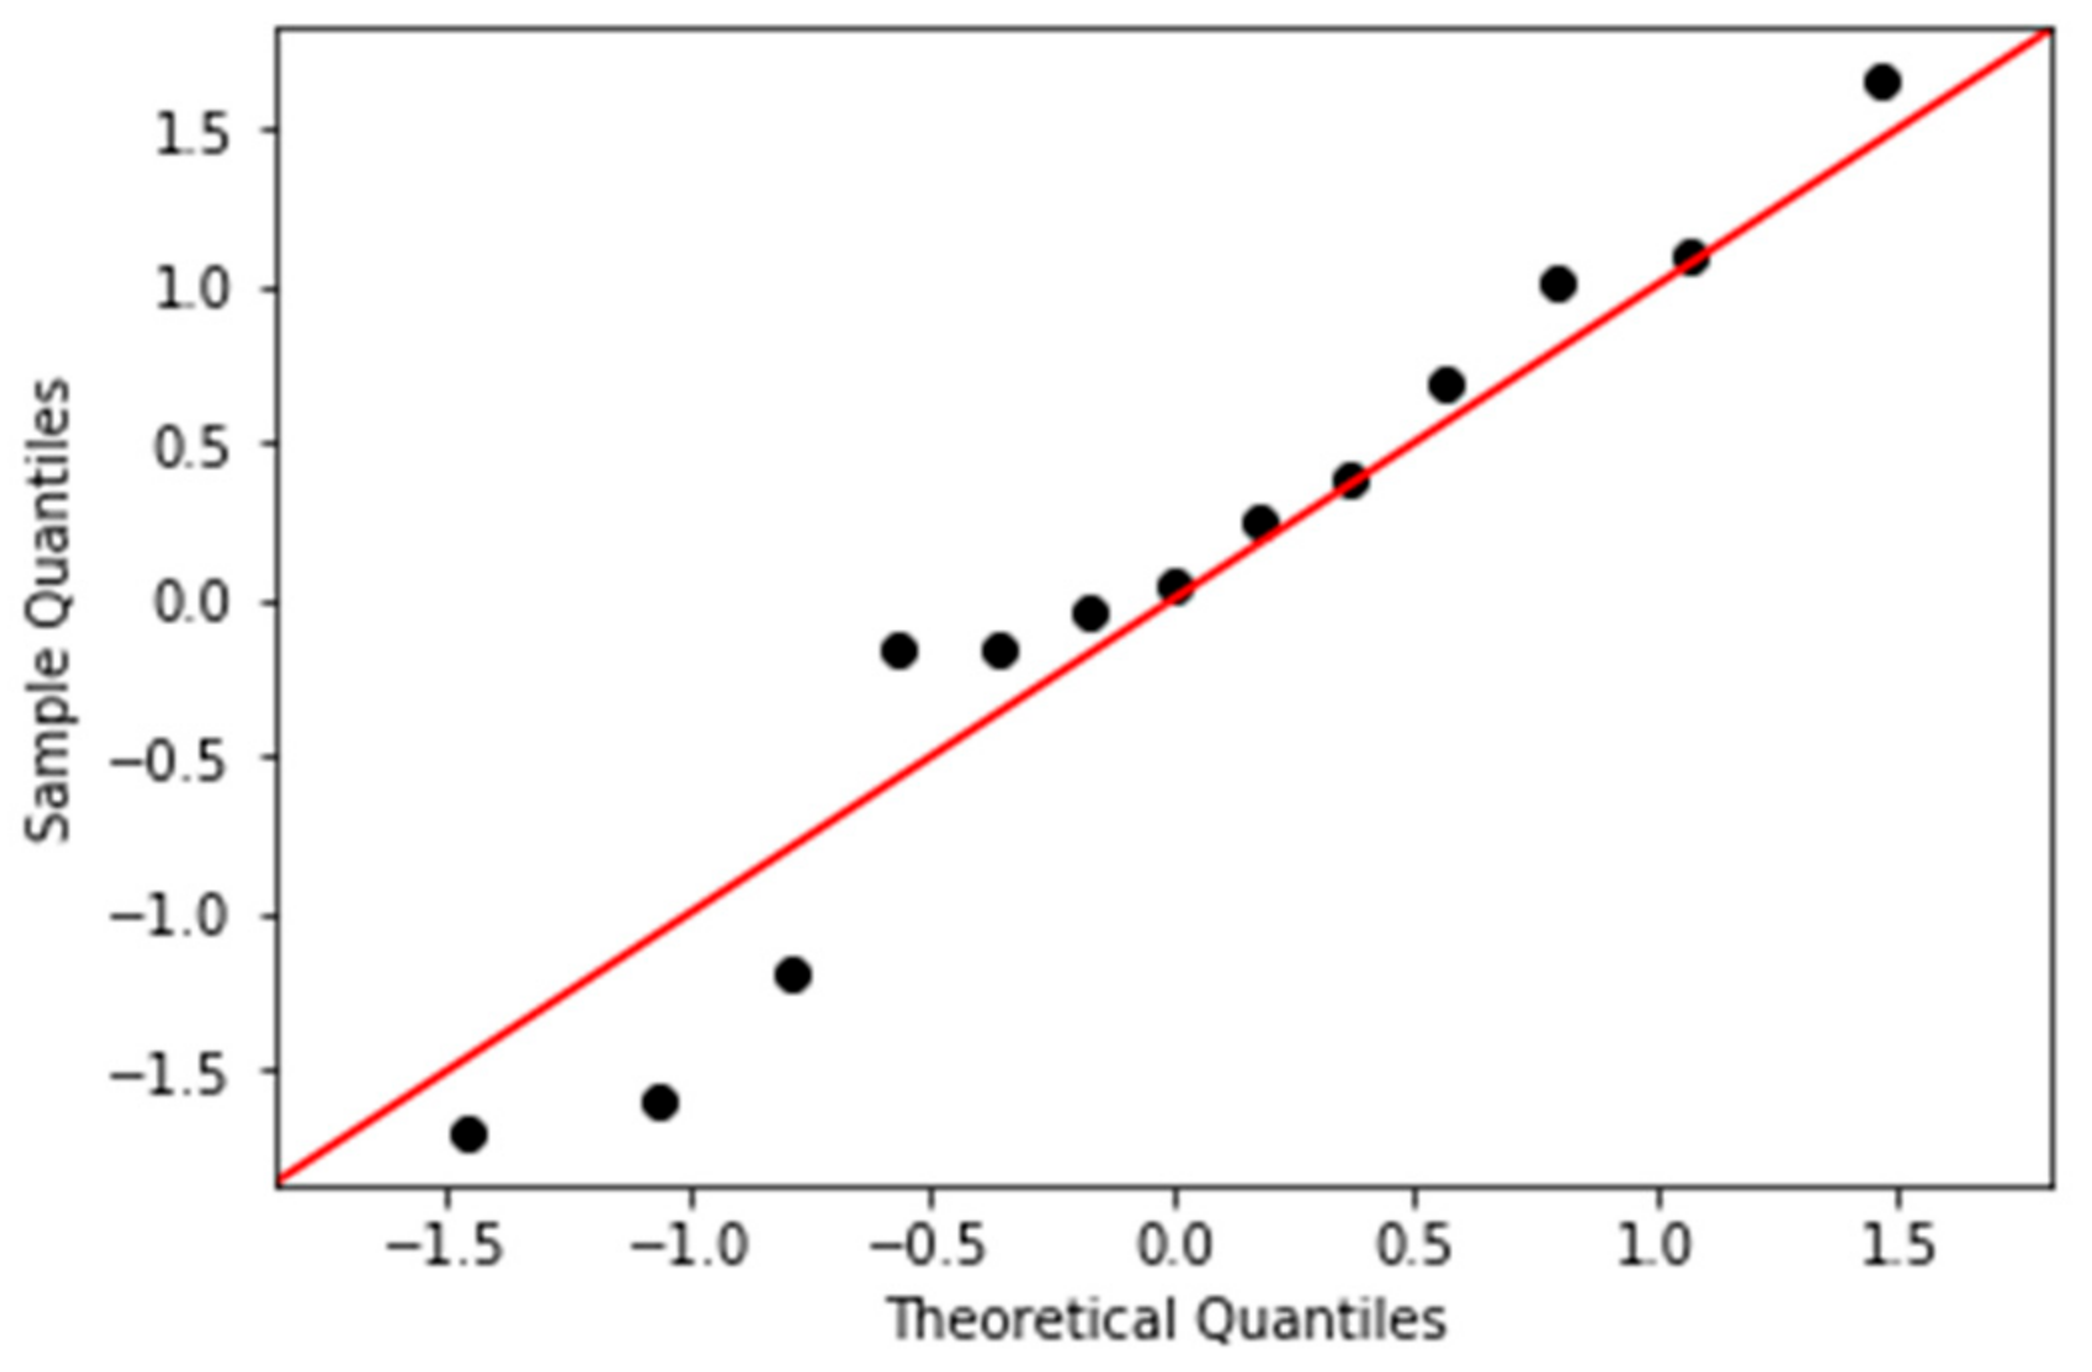
The significance of the multiple regression model Equation (22) can be determined by examining the dispersion of the residuals of the predicted values. For such a purpose, the normal distribution (p > 0.05) was checked. As can be seen in Figure 5, the cumulative probability of a normal distribution was compatible with the cumulative probability of the experimental distribution. Therefore, the hypothesis about the normal distribution of the results is correct.
3.3. Discussion
Table 5 shows the results of all the performed regression analyses and their goodness-of-fit statistics, when relating UCS (dependent variable) first with vp and then with vp and other rock parameters for the studied limestone.
Simple regression analyses found that UCS is related to vp, and the best fit was obtained with a quadratic model (R2 = 78.40%).
Nevertheless, it is well known that vp depends, among other physical properties, on the n, ρ, and Sr of a rock, as explained in the introduction. Thus, it seemed worthwhile to attempt to obtain a better fit by incorporating some of these independent variables into the analyses. For such a task, we performed multiple regression analyses considering a full saturation level and obtained two relevant results.
First, although it has been stated that vp depends on ρ, the results showed that ρ does not have statistical significance for the predicted UCS. This may be explained by the fact that there does not seem to be a clear relationship between UCS and ρ based on the results of this study (Table 3). The maximum UCS was obtained on a mean ρ specimen, whereas both maximum and minimum ρ attained UCS values between the lower ones (UCS < 60 MPa).
Second, n does have statistical significance for the predicted UCS. It is known that n affects strength, and the experimental results obtained in this study (Table 3) confirmed this: the largest UCS was obtained for the specimens with lowest n and the minimum UCS values were obtained for the specimens with largest n.
Furthermore, two different multiple regression models were tested, and we found that both multiple regression analyses featured better goodness-of-fit statistics than all of the simple regression analyses (Table 5). This means that it is worth considering more independent variables when trying to predict UCS starting from ultrasonic pulse transmission tests.
Finally, it has to be pointed out that, despite there being many authors who have attempted to predict UCS from vp, there is still no universal equation that can explain such a relationship at the laboratory scale for intact rock. Thus, this relationship for intact rocks at the laboratory scale still needs to be investigated before trying to extrapolate results at a real scale, where discontinuities will obviously play a fundamental role in the relationship between rock mass strength and ultrasonic wave velocity.
4. Conclusions and Future Research
4.1. Conclusions
The combined effect of P-wave velocity (vp), saturated density (ρsat), and porosity (n) on UCS was studied for saturated cylindrical specimens of limestone. Under the testing conditions, it was demonstrated that vp and n have a synergetic effect on UCS, whereas ρsat does not have a statistically significant influence on the dependent variable.
Experimental results were analyzed through simple regression analyses in order to develop the best-fit analytical model that can represent UCS depending on vp (as developed by most authors). Subsequently, multiple regression analyses were performed in order to obtain a better model to predict UCS from vp, n, and ρsat.
Simple regression analyses (using only vp as the independent variable) showed a best R2 value of 78.40%. On the other hand, a multiple regression analysis resulted in a better R2 (84.90%), thus indicating a better fit when more independent variables are considered.
Multiple regression analyses also were able to identify ρsat as a statistically nonsignificant independent variable for predicting UCS from ultrasonic pulse transmission tests. That is, there was insufficient evidence for ρsat contributing to variations of UCS under the tested conditions.
Finally, the exponential with multiple exponent model featured the best fit when predicting UCS, showing that UCS depends directly on vp and inversely on n.
4.2. Future Research
In order to continue this line of research with limestone, we plan to incorporate a larger number of independent variables into the analysis. Such research aims to identify those variables explaining experimental UCS variability. The possible variables that will be considered are the static Young’s modulus, the geometrical parameters of the cylindrical specimens (diameter and length), and the degree of saturation. New tests will be performed to try to strengthen the analytical models.
Author Contributions
All the authors contributed in a similar way to the final writing of this manuscript. J.G. put his efforts on laboratory testing and bibliographical review. M.S. collaborated with the statistical analyses. J.A. was in charge of the final compilation, arrangement and presentation of data.
Funding
This research received no external funding.
Acknowledgments
The authors want to acknowledge Izabott Erazo and Raúl Perez for their invaluable contribution in helping to perform the laboratory tests.
Conflicts of Interest
The authors declare no conflict of interest
References
- Barton, N.; Lien, R.; Lunde, J. Engineering classification of rock masses for the design of tunnel support. Rock Mech. 1974, 6, 189–236. [Google Scholar] [CrossRef]
- Bieniawski, Z.T. Engineering Rock Mass Classifications; Wiley: Rotterdam, The Netherlands, 1989. [Google Scholar]
- Romana, M. A geomechanical classification for slopes: Slope Mass Rating. In Comprehensive Rock Engineering; Hudson, J.A., Ed.; Pergamon: London, UK, 1993; Volume 3, pp. 575–600. [Google Scholar]
- ASTM D7012–14. Standard Test Methods for Compressive Strength and Elastic Moduli of Intact Rock Core Specimens under Varying States of Stress and Temperatures; American Society for Testing and Materials: Conshohocken, PA, USA, 2017. [Google Scholar]
- ASTM D4543–19. Standard Test Methods for Preparing Rock Core as Cylindrical Test Specimens and Verifying Conformance to Dimensional and Shape Tolerances; American Society for Testing and Materials: Conshohocken, PA, USA, 2019. [Google Scholar]
- ISRM. The Complete ISRM Suggested Methods for Rock Characterization, Testing and Monitoring: 1974–2006. In Commission on Testing Methods, International Society for Rock Mechanics; Ulusay, R., Hudson, J.A., Eds.; ISRM Turkish National Group: Ankara, Turkey, 2007. [Google Scholar]
- Del Potro, R.; Hürlimann, M. A comparison of different indirect techniques to evaluate volcanic intact rock strength. Rock Mech. Rock Eng. 2009, 42, 931–938. [Google Scholar] [CrossRef]
- Tugrul, A.; Zarif, H. Correlation of mineralogical and textural characteristics with engineering properties of selected granitic rocks from Turkey. Eng. Geol. 1999, 51, 303–317. [Google Scholar] [CrossRef]
- Yilmaz, I.; Yuksek, G. Prediction of the strength and elasticity modulus of gypsum using multiple regression, ANN, and ANFIS models. Int. J. Rock Mech. Min. Sci. 2009, 46, 803–810. [Google Scholar] [CrossRef]
- Lashkaripour, G.R. Predicting mechanical properties of mudrock from index parameters. Bull. Eng. Geol. Environ. 2002, 61, 73–77. [Google Scholar] [CrossRef]
- Rabbani, E.; Sharif, F.; Koolivand Salooki, M.; Moradzadeh, A. Application of neural network technique for prediction of uniaxial compressive strength using reservoir formation properties. Int. J. Rock Mech. Min. Sci. 2012, 56, 100–111. [Google Scholar] [CrossRef]
- Pappalardo, G. Correlation between P-wave velocity and physical–mechanical properties of intensely jointed dolostones, Peloritani Mounts, NE Sicily. Rock Mech. Rock Eng. 2015, 48, 1711–1721. [Google Scholar] [CrossRef]
- Saito, T. Variation of Physical Properties of Igneous Rocks in Weathering. In Proceedings of the ISRM International Symposium, Tokyo, Japan, 21–24 September 1981; Volume 1, pp. 191–196. [Google Scholar]
- Kahraman, S. The correlations between the saturated and dry P-wave velocity of rocks. Ultrasonics 2007, 46, 341–348. [Google Scholar] [CrossRef]
- King, M.S. Recent developments in seismic rock physics. Int. J. Rock Mech. Min. Sci. 2009, 46, 1341–1348. [Google Scholar] [CrossRef]
- Török, Á.; Vásárhelyi, B. The influence of fabric and water content on selected rock mechanical parameters of travertine, examples from Hungary. Eng. Geol. 2010, 115, 237–245. [Google Scholar] [CrossRef]
- Klimentos, T. The effects of porosity-permeability-clay content on the velocity of compressional waves. Geophysics 1991, 56, 1930–1939. [Google Scholar] [CrossRef]
- Karakul, H.; Ulusay, R. Empirical Correlations for Predicting Strength Properties of Rocks from P-Wave Velocity Under Different Degrees of Saturation. Rock Mech. Rock Eng. 2013, 46, 981–999. [Google Scholar] [CrossRef]
- McNally, G.H. Estimation of Coal Measures Rock Strength using Sonic and Neutron Logs. Geoexploration 1987, 24, 381–395. [Google Scholar] [CrossRef]
- Göktan, R.M. Theoretical and Practical Analysis of Rock Rippability. Ph.D. Thesis, Istanbul Technical University, Istanbul, Turkey, 1988. [Google Scholar]
- Kahraman, S. Evaluation of simple methods for assessing the uniaxial compressive strength of rock. Int. J. Rock Mech. Min. Sci. 2001, 38, 981–994. [Google Scholar] [CrossRef]
- Yasar, E.; Erdogan, Y. Correlating sound velocity with the density, compressive strength and Young’s modulus of carbonate rocks. Int. J. Rock Mech. Min. Sci. 2004, 41, 871–875. [Google Scholar] [CrossRef]
- Sousa, L.M.O.; Suárez del Río, L.M.; Calleja, L.; Ruiz de Argandoña, V.G.; Rodríguez Rey, A. Influence of microfractures and porosity on the physico-mechanics properties and weathering of ornamental granite. Eng. Geol. 2005, 77, 153–168. [Google Scholar] [CrossRef] [Green Version]
- Sharma, P.K.; Singh, T.N. A correlation between P-wave velocity, impact strength index, slake durability index and uniaxial compressive strength. Bull. Eng. Geol. Environ. 2007, 67, 17–22. [Google Scholar] [CrossRef]
- Kiliç, A.; Teymen, A. Determination of mechanical properties of rocks using simple methods. Bull. Eng. Geol. Environ. 2008, 67, 237–244. [Google Scholar] [CrossRef]
- Yagiz, S. P-wave velocity test for assessment of geotechnical properties of some rock materials. Bull. Mater. Sci. 2011, 34, 947–953. [Google Scholar] [CrossRef]
- Chawre, B. Correlations between ultrasonic pulse wave velocities and rock properties of quartz-mica schist. J. Rock Mech. Geotech. Eng. 2018, 10, 594–602. [Google Scholar] [CrossRef]
- Jamshidi, A.; Zamanian, H.; Zarei Sahamieh, R. The Effect of Density and Porosity on the Correlation Between Uniaxial Compressive Strength and P-wave Velocity. Rock Mech. Rock Eng. 2018, 51, 1279–1286. [Google Scholar] [CrossRef]
- Chang, C.; Zoback, M.D.; Khaksar, A. Empirical relations between rock strength and physical properties in sedimentary rocks. J. Pet. Sci. Eng. 2006, 51, 223–237. [Google Scholar] [CrossRef]
- Martínez-Martínez, J.; Benavente, D.; García-del-Cura, M.A. Comparison of the static and dynamic elastic modulus in carbonate rocks. Bull. Eng. Geol. Environ. 2012, 71, 263–268. [Google Scholar] [CrossRef]
- Fener, M. The Effect of Rock Sample Dimension on the P-Wave Velocity. J. Nondestruct. Eval. 2011, 30, 99–105. [Google Scholar] [CrossRef]
- Ercikdi, B.; Karaman, K.; Cihangir, F.; Yilmaz, T.; Aliyazıcıoğlu, S.; Ayhan, K. Core size effect on the dry and saturated ultrasonic pulse velocity of limestone samples. Ultrasonics 2016, 72, 143–149. [Google Scholar] [CrossRef] [PubMed]
- ISRM. The ISRM Suggested Methods for Rock Characterization, Testing and Monitoring: 2007–2014. In Commission on Testing Methods, International Society for Rock Mechanics; Ulusay, R., Ed.; Springer: Dordrecht, The Netherlands, 2015. [Google Scholar]
- Altindag, R. Correlation between P-wave velocity and some mechanical properties for sedimentary rocks. J. S. Afr. Inst. Min. Metall. 2012, 12, 229–237. [Google Scholar]
- Sarkar, K.; Vishal, V.; Singh, N.T. An Empirical Correlation of Index Geomechanical Parameters with the Compressional Wave Velocity. Geotech. Geol. Eng. 2012, 30, 469–479. [Google Scholar] [CrossRef]
- Terzaghi, K. Theoretical Soil Mechanics; John Wiley & Sons: New York, NY, USA, 1943. [Google Scholar]
- Pickett, G.R. Acoustic character logs and their applications in formation evaluation. J. Pet. Technol. 1963, 15, 659–667. [Google Scholar] [CrossRef]
- Schön, J.H. Physical properties of Rocks. In Handbook of Petroleum Exploration and Production; Cubitt, J., Ed.; Elsevier: Amsterdam, The Netherlands, 2011; Volume 8. [Google Scholar]
- Dean, A.; Voss, D.; Draguljic, D. Design and Analysis of Experiments, 2nd ed.; Springer: Cham, Switzerland, 2017; pp. 565–614. [Google Scholar]
- Bezerra, M.A.; Santelli, R.E.; Oliveira, E.P.; Villar, L.S.; Escaleira, L.A. Response surface methodology (RSM) as a tool for optimization in analytical chemistry. Talanta 2008, 76, 965–977. [Google Scholar] [CrossRef]
- Berger, P.D.; Maurer, R.E.; Celli, G.B. Experimental Design, With Application in Management, Engineering, and the Sciences, 2nd ed.; Springer: Cham, Switzerland, 2018; pp. 505–532. [Google Scholar]
- Montgomery, D.C. Design and Analysis of Experiments, 8th ed.; Wiley: Hoboken, NJ, USA, 2012. [Google Scholar]
- Walpole, R.; Myers, R.; Myers, S.; Keying, Y. Probabilidad y Estadística Para Ingeniería y Ciencias, 9th ed.; Pearson: Naucalpan de Juárez, Mexico, 2012. [Google Scholar]
Figure 1.
Predicted UCS Equations (1)–(11) vs. experimental UCS.

Figure 2.
Left: correlation between experimental UCS and P-wave velocity. Right: predicted against experimental UCS values. (a,b) Linear fit, (c,d) exponential fit, (e,f) potential fit, and (g,h) quadratic fit.
Figure 2.
Left: correlation between experimental UCS and P-wave velocity. Right: predicted against experimental UCS values. (a,b) Linear fit, (c,d) exponential fit, (e,f) potential fit, and (g,h) quadratic fit.


Figure 3.
Multiple regression analysis response surface of UCS: (a) Equation (21) and (b) Equation (22).
Figure 3.
Multiple regression analysis response surface of UCS: (a) Equation (21) and (b) Equation (22).

Figure 4.
Predicted against experimental UCS results of the multiple regression analysis.

Figure 5.
Comparison of theoretical and observed probabilities for standardized residuals of uniaxial compressive strength.
Figure 5.
Comparison of theoretical and observed probabilities for standardized residuals of uniaxial compressive strength.


Table 1.
Existing simple correlations between UCS (MPa) and vp (km·s−1) for limestone.
| Correlation | R2 | Rock Type | Phase | Reference | Equation |
|---|---|---|---|---|---|
| 0.69 | Diabase, dolomite, hematite, limestone, marl, sandstone, and serpentine | Dry * | [21] | (1) | |
| 0.80 | Dolomite, limestone, and marble | Dry * | [22] | (2) | |
| 0.94 | Andesite, basalt, diorite, granodiorite, limestone, marble, quartzite, sandstone, traquite, travertine, and tuff | Dry * | [25] | (3) | |
| 0.85 | Limestone, schist, and travertine | Dry * | [26] | (4) | |
| 0.76 | Clayey marl, claystone, dolomite, limestone, marl, mudrock–shale, sandstone, siltstone, slate, and travertine | Dry * | [34] | (5) | |
| 0.93 | Coal, dolomite, dolomitic limestone, limestone, gneiss, granite, massive basalt, quartz–mica schist, quartzite, sandstone, shale, tuffaceous basalt, and weathered basalt | Dry * | [35] | (6) | |
| 0.72 | Andesite, argillaceous limestone, claystone, marl, ignimbrite, sandstone, and tuff | Sat | [18] | (7) | |
| 0.82 | Limestone | Dry * | [28] | (8) |
* The authors do not explicitly indicate saturated or dry conditions, so it is assumed as dry (Sr = 0).
Table 2.
Existing multiple correlations between UCS (MPa), vp (m·s−1), n (%), Sr, and ECC (%) [18] for limestone.
Table 2.
Existing multiple correlations between UCS (MPa), vp (m·s−1), n (%), Sr, and ECC (%) [18] for limestone.
| Correlation | R2 | Rock Type | Phase | Reference | Equation |
|---|---|---|---|---|---|
| 0.91 | Andesite, argillaceous limestone, claystone, marl, ignimbrite, sandstone, and tuff | Dry/Sat | [18] | (9) | |
| 0.86 | Limestone | Dry * | [28] | (10) | |
| 0.92 | Limestone | Dry * | [28] | (11) |
* The authors do not explicitly indicate saturated or dry conditions, so it is assumed as dry (Sr = 0).
Table 3.
Geometry of specimens, vp, vs, ρ, and n results.
| Specimen | Diameter D (mm) | Height H (mm) | Porosity n (%) | Density ρ (g·cm−3) | P-Wave Velocity vp (km·s−1) | S-Wave Velocity vs (km·s−1) | Uniaxial Compressive Strength UCS (MPa) | |||
|---|---|---|---|---|---|---|---|---|---|---|
| Dry | Sat. | Dry | Sat. | Dry | Sat. | |||||
| 1 | 30.830 | 60.548 | 2.46 | 2.64 | 2.66 | 5.351 | 5.596 | 2.992 | 2.976 | 76.30 |
| 2 | 30.853 | 60.335 | 3.15 | 2.59 | 2.62 | 5.263 | 5.505 | 2.844 | 2.871 | 41.37 |
| 3 | 30.968 | 60.135 | 2.26 | 2.63 | 2.63 | 5.505 | 5.825 | 3.176 | 3.061 | 77.59 |
| 4 | 30.860 | 60.588 | 1.95 | 2.64 | 2.64 | 5.596 | 5.865 | 3.211 | 3.211 | 106.19 |
| 5 | 30.923 | 60.345 | 2.55 | 2.61 | 2.61 | 5.962 | 5.825 | 3.282 | 3.077 | 77.10 |
| 6 | 30.858 | 60.718 | 2.46 | 2.63 | 2.65 | 5.596 | 5.865 | 3.297 | 3.128 | 91.43 |
| 7 | 30.933 | 60.395 | 2.43 | 2.62 | 2.62 | 5.505 | 5.505 | 3.226 | 3.000 | 55.93 |
| 8 | 30.193 | 60.650 | 2.29 | 2.64 | 2.64 | 5.263 | 5.825 | 2.970 | 3.000 | 73.14 |
| 9 | 30.843 | 59.855 | 3.27 | 2.60 | 2.60 | 5.310 | 5.556 | 2.804 | 3.158 | 49.24 |
| 10 | 30.853 | 60.518 | 2.95 | 2.61 | 2.61 | 5.446 | 5.505 | 3.177 | 3.177 | 42.15 |
| 11 | 30.975 | 60.155 | 2.26 | 2.66 | 2.68 | 5.556 | 5.714 | 2.956 | 2.927 | 61.24 |
| 12 | 30.808 | 60.223 | 2.32 | 2.63 | 2.63 | 5.596 | 5.922 | 3.081 | 3.050 | 94.32 |
| 13 | 30.915 | 60.458 | 2.77 | 2.62 | 2.62 | 5.310 | 5.310 | 2.800 | 2.804 | 50.80 |
| Mean | 30.832 | 60.379 | 2.55 | 2.62 | 2.63 | 5.481 | 5.678 | 3.063 | 3.029 | 68.99 |
| SD | 0.199 | 0.241 | 0.38 | 0.02 | 0.02 | 0.194 | 0.192 | 0.179 | 0.116 | 20.77 |
Table 4.
Average obtained UCS values in strength tests and average predicted UCS values, as well as their relative errors according to different authors.
Table 4.
Average obtained UCS values in strength tests and average predicted UCS values, as well as their relative errors according to different authors.
| Experimental UCS (MPa) | Predicted UCS (MPa) | Relative Error (%) | |||||||||
|---|---|---|---|---|---|---|---|---|---|---|---|
| Equation (1) | Equation (7) | Equation (8) | Equation (10) | Equation (11) | Equation (1) | Equation (7) | Equation (8) | Equation (10) | Equation (11) | ||
| Mean | 68.99 | 81.37 | 73.08 | 91.78 | 91.04 | 94.27 | −27.50 | −14.03 | −42.30 | −42.28 | −48.22 |
| SD | 20.77 | 3.32 | 4.49 | 5.19 | 4.56 | 2.50 | 35.63 | 30.40 | 38.87 | 38.51 | 43.08 |
Table 5.
Parameters of the studied correlations.
| Model | Source | Degrees of Freedom | SS Adj | MS Adj | F-Value | p-Value (Significance) | R2 (%) |
|---|---|---|---|---|---|---|---|
| Linear | Regression | 1 | 3671.99 | 3671.99 | 26.89 | 0.000 | 70.97 |
| Equation (17) | Error | 11 | 1502.22 | 136.57 | |||
| Total | 12 | 5174.21 | |||||
| Exponential | Regression | 1 | 0.82251 | 0.822506 | 27.76 | 0.000 | 71.62 |
| Equation (18) | Error | 11 | 0.32588 | 0.029626 | |||
| Total | 12 | 1.14839 | |||||
| Potential | Regression | 1 | 0.81531 | 0.815308 | 26.93 | 0.000 | 71.00 |
| Equation (19) | Error | 11 | 0.33308 | 0.030280 | |||
| Total | 12 | 1.14839 | |||||
| Quadratic | Regression | 1 | 4056.82 | 2028.41 | 18.15 | 0.000 | 78.40 |
| Equation (20) | Error | 11 | 1117.39 | 111.74 | |||
| Total | 12 | 5174.21 | |||||
| Multiple | Regression | 2 | 4257.1 | 2128.55 | 23.21 | 0.000 | 82.28 |
| Equation (21) | vp | 1 | 710.6 | 710.62 | 7.75 | 0.019 | |
| 1 | 585.1 | 585.12 | 6.38 | 0.030 | |||
| Error | 10 | 917.1 | 91.71 | ||||
| Total | 12 | 5174.2 | |||||
| Exponential and Multiple Exponent Equation (22) | Regression | 2 | 0.9750 | 0.48750 | 28.12 | 0.000 | 84.90 |
| vp | 1 | 0.1440 | 0.14398 | 8.3 | 0.016 | ||
| 1 | 0.1525 | 0.15249 | 8.79 | 0.014 | |||
| Error | 10 | 0.1734 | 0.01734 | ||||
| Total | 12 | 1.1484 |
© 2019 by the authors. Licensee MDPI, Basel, Switzerland. This article is an open access article distributed under the terms and conditions of the Creative Commons Attribution (CC BY) license (http://creativecommons.org/licenses/by/4.0/).
Share and Cite
MDPI and ACS Style
González, J.; Saldaña, M.; Arzúa, J. Analytical Model for Predicting the UCS from P-Wave Velocity, Density, and Porosity on Saturated Limestone. Appl. Sci. 2019, 9, 5265. https://0-doi-org.brum.beds.ac.uk/10.3390/app9235265
AMA Style
González J, Saldaña M, Arzúa J. Analytical Model for Predicting the UCS from P-Wave Velocity, Density, and Porosity on Saturated Limestone. Applied Sciences. 2019; 9(23):5265. https://0-doi-org.brum.beds.ac.uk/10.3390/app9235265
Chicago/Turabian StyleGonzález, Javier, Manuel Saldaña, and Javier Arzúa. 2019. "Analytical Model for Predicting the UCS from P-Wave Velocity, Density, and Porosity on Saturated Limestone" Applied Sciences 9, no. 23: 5265. https://0-doi-org.brum.beds.ac.uk/10.3390/app9235265
Note that from the first issue of 2016, this journal uses article numbers instead of page numbers. See further details here.