The Evaluation Method of Particle Clustering Phenomena in RAP


School of Transportation, Southeast University, 2 Sipailou, Nanjing 210096, Jiangsu, China
*
Author to whom correspondence should be addressed.
Appl. Sci. 2019, 9(3), 424; https://0-doi-org.brum.beds.ac.uk/10.3390/app9030424
Submission received: 31 December 2018
/
Revised: 23 January 2019
/
Accepted: 24 January 2019
/
Published: 27 January 2019
(This article belongs to the Special Issue Achievements and Prospects of Advanced Pavement Materials Technologies)
Abstract
:The particle clustering phenomena in reclaimed asphalt pavement (RAP) particles is one of the most important factors to affect the efficient recycling of asphalt concrete. In this study, the particle composition, clustering degree, crushing properties and clustering stability of RAP were studied by extraction test and cantabro-crushing test. It was found that the particles above 4.75 mm were composed mainly of small particles with a large degree of cluster and poor stability. The coarse particles (>4.75 mm) had a great influence on the variation of 4.75 mm sieve. Quantitative indexes of Percentage Loss rate (PL) and Stability Index (w) were proposed to evaluate the clustering degree and the stability of RAP. It provided a meaningful reference for the comparison of different RAP and the different crushing processes. In addition, the RAP could be divided into three kinds of structures, including weak cluster structure, strong cluster structure and old aggregate. The process of crushing the RAP was divided into three stages, which are weak structure-dominated, strong structure-dominated and the broken old aggregate. The weak structure had the largest degree of cluster and worst stability, resulting in a large variability of RAP, and it should be avoided in the crushing process.
1. Introduction
The asphalt RAP mixture has an enhanced ductility and a higher strain capacity when compared to the control asphalt mixture. These improved properties are useful in the construction of the road bases and sub-bases [1,2]. The average RAP content added in the new asphalt mixture has steadily increased in recent years [3]. From an environmental perspective, higher percentages of RAP (e.g., >50%) are being utilized to reduce costs and save natural resources. The demolished old asphalt pavement and waste asphalt mixture will not only occupy a large amount of land resources, but also cause environmental pollution and ecological damage [4]. Currently, the asphalt pavement recycling technology provides an effective way for the disposal of waste asphalt mixture [5,6,7]. According to the construction site and temperature, asphalt pavement regeneration technology generally could be divided into four categories: in-plant hot recycling technology, hot in-place recycling technology, in-plant cold recycling technology and cold in-place recycling technology [8,9,10]. However, these recycling methods are faced with a common problem. The utilization rate of RAP is low, the performance variability of recycled materials is large, and the road performance thus cannot be fully guaranteed. So as to improve the utilization rate of old materials, a large number of studies have been carried out. Tang et al. used two methods to evaluate asphalt mixtures with high RAP contents based on the performance of fatigue-cracking resistance. It was found that faster fatigue degradation was observed for the 40% RAP binder and RAP mixture when subjected to repeated loading [11]. Fakhri studied the glass fiber modified warm mix asphalt mixtures with high RAP content, and improved performance of the WMA mixture was shown due to the glass fiber and higher RAP percent [12]. Stimilli et al., proposed that an accurate mix design and the selection of adequate binder could overcome the potential drawbacks related to the use of high RAP percentage, given the possibility to produce suitable recycled mixtures [13]. The performance variability of recycled materials cannot be solved fully, and the reason is because there is a great variability of RAP [14,15,16,17]. The particle cluster phenomenon in RAP is one of the most important factors to affect the gradation variability and road performance of regenerated mixtures. Many studies had been carried out to investigate the clustering phenomena in regenerated asphalt mixtures. Bressi (2015) contended that the rheology, and in particular the complex modulus, could be used to study the cluster phenomenon in mixtures containing RAP [18]. In Bressi’s more recent research, he concluded that the quantity and the quality of virgin aggregates play a significant role in the clusters’ formation [19].
According to related studies, the cluster level of different sources of RAP materials was quite different [20,21,22]. It could be affected by the pavement aging degree, material composition, gradation characteristics, milling equipment, milling temperature, pavement humidity, pavement layer and many other factors [23,24,25]. If the old asphalt mixtures were not broken fully, it would seriously affect the performance of the regenerated mixture and reduce the utilization rate of the RAP [26,27,28]. Therefore, to fully reduce the clustering degree of old asphalt mixtures and improve the utilization rate of old materials, it is necessary to study the clustering status, the fragmentation behavior and the disposal measures of RAP mixtures.
The objectives of this study are to study the cluster phenomenon in RAP mixtures, including the clustering degree, particle composition in RAP, law of particle breakage, and the stability of the cluster. These quantitative evaluation indexes are suggested with a purpose to put forward some efforts to reduce the cluster phenomenon in RAP materials.
2. Materials
In this study the following two RAP materials were used:
- (1)
- The RAP 1 was obtained during the process of pavement milling, in which the asphalt binder content was 5.16%. The RAP 1 material was first dried to constant weight at 60 °C and collected for the following experiment.
- (2)
- The RAP 2 was collected from crushing material of plant, and it contained 5.0% of asphalt binder. Similar with RAP 1, RAP 2 samples were also dried to constant weight at 60 °C, and then were sampled for the following experiments.
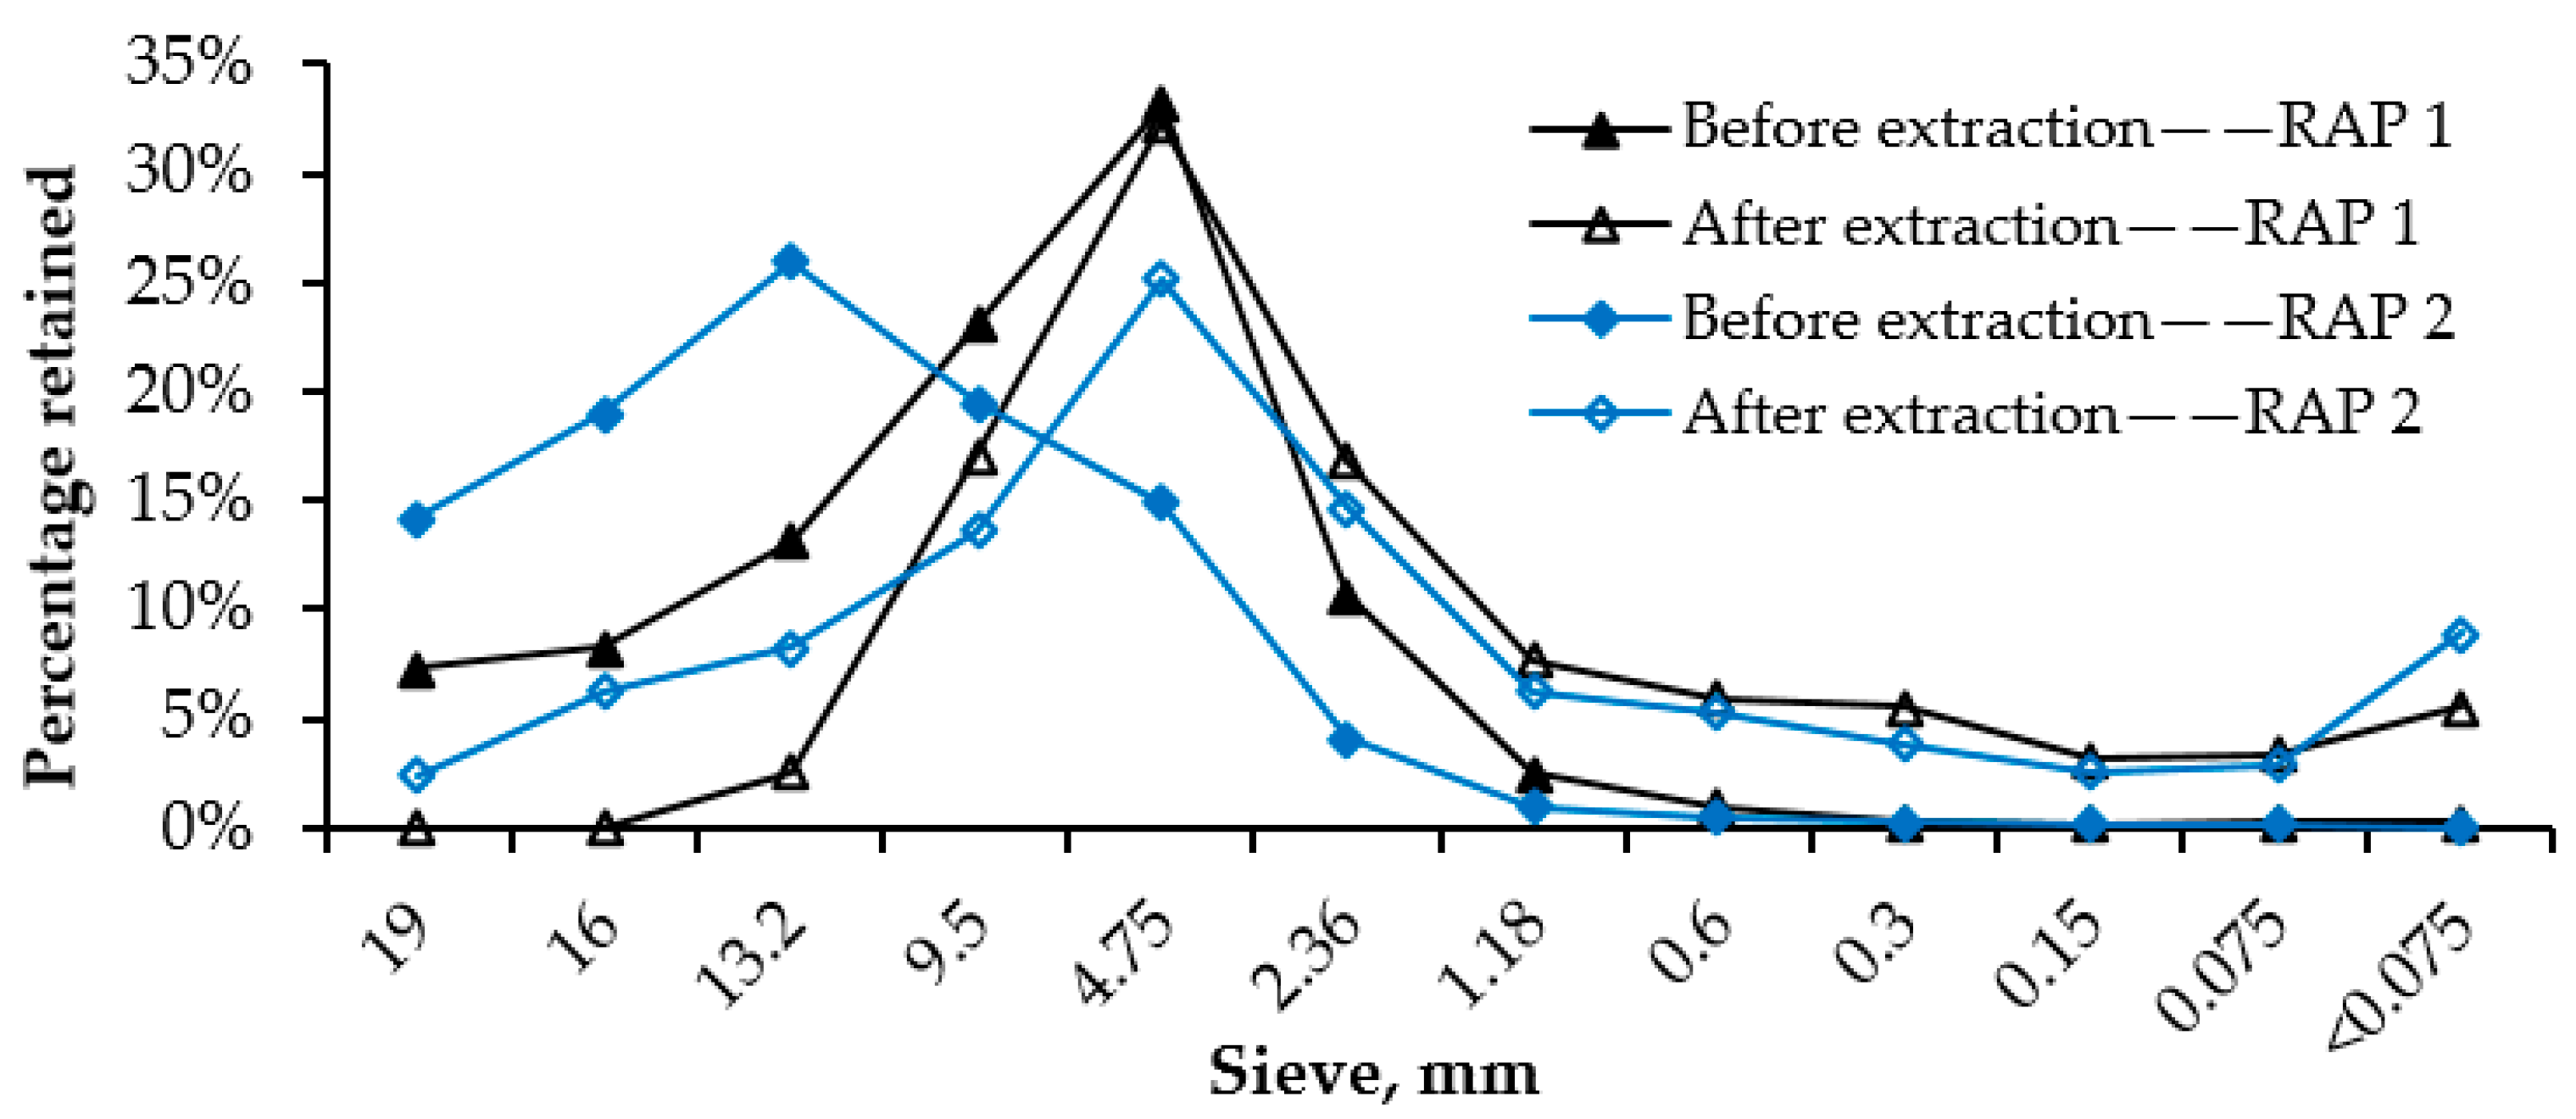
The gradation and particles distribution of RAP 1 and RAP 2 materials are important material properties, and it can be obtained from the sieving experiment. Therefore, both RAP mixtures were first subjected to sieving analysis, before and after extraction. The gradation results of RAP 1 and RAP 2 materials are shown in Figure 1.
3. Methodology
This study aims to investigate the cluster phenomena in RAP materials. The extraction test and Cantabro-crushing test were used to analyze the clustering phenomena in RAP materials of AC-13 asphalt mixture. Validation tests were also performed on the RAP materials of Stone Mastic Asphalt (SMA) and Open Graded Friction Course (OGFC) asphalt mixtures. Besides, aggregate image measurement system (AIMS) was used to calculate the angularity and sphericity of RAP materials. A detailed description is given below.
3.1. Extraction Test
According to the Chinese specification JTG E20-2011 T0722, which is “Standard Test Methods of Asphalt and Asphalt Mixtures for Highway Engineering”, the centrifugal separation method is used to extract the RAP. This extraction test is often used to determine the aggregate gradation or binder content of asphalt mixtures. But different from the traditional method of extraction test, in this study, the extraction test was aimed at the size of each of the RAP particles, including 2.36 mm, 4.75 mm, 9.5 mm, 13.2 mm, 16 mm and 19 mm. Then the extraction test was carried out separately. The main process of the experiment included the following steps:
- Sieving the RAP mixtures and weighing 1 kg to 1.5 kg of RAP materials of each size which is above 2.36 mm;
- Carrying out the extraction test for each particle size.
- Drying and weighing the materials after extraction test, sieving, and calculating the percentage retained of each size.
- Calculating the Percentage-Loss index by Equation (1):
3.2. Cantabro-Crushing Test
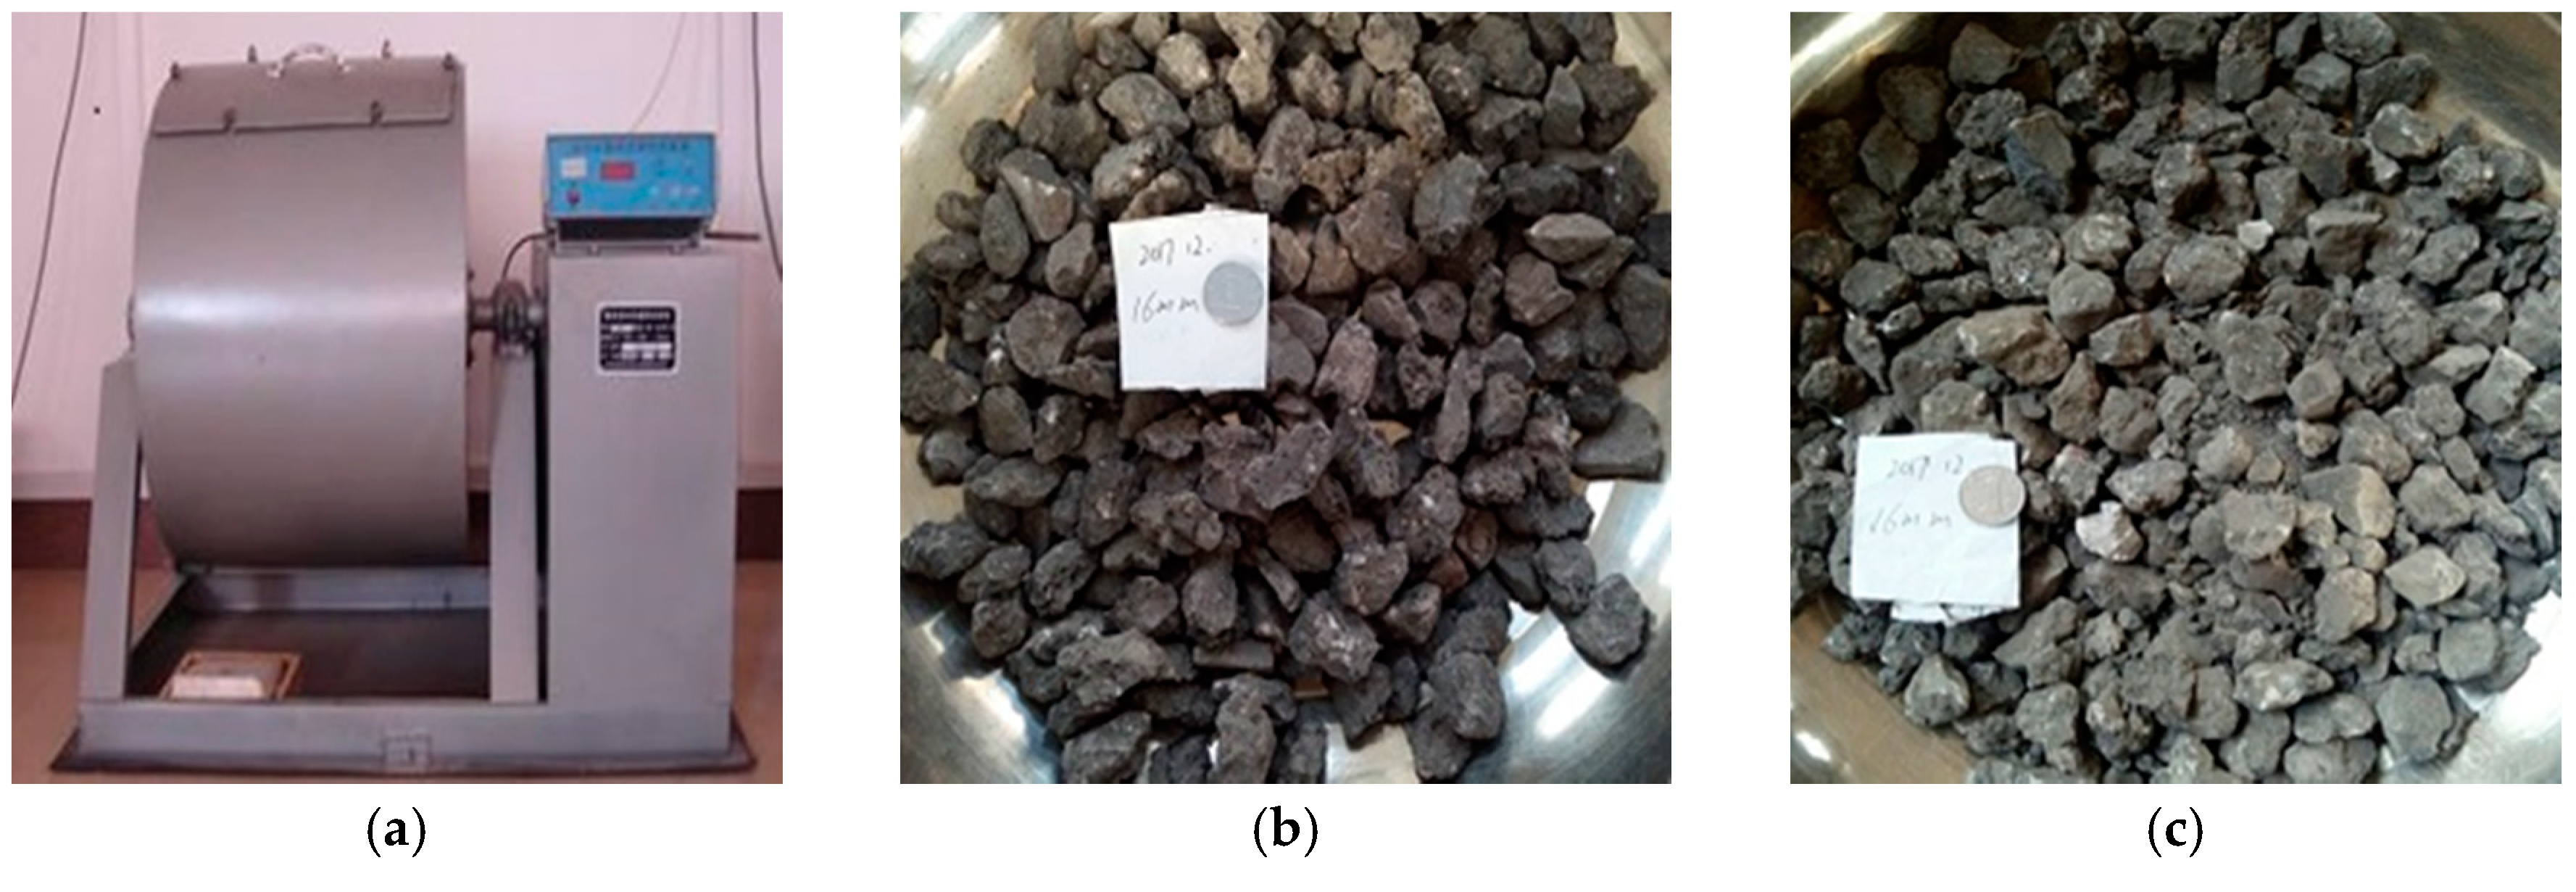
To simulate the break-up process of each size of RAP materials, the Cantabro-Crushing test is used here. The Cantabro-Crushing test was designed to study the breaking law and the stability of the cluster comprising of each RAP particle size. In this test the Los Angeles abrasion tester was used, as is shown in Figure 2. The experiment process was described as follows:
- Sieving the RAP materials and weighing 2 kg of RAP material of each size which is above 4.75 mm;
- Carrying out the crushing test at room temperature, and the rotation number of Los Angeles abrasion tester is set to 50 r, 100 r, 200 r, 300 r.
- After the test, taking out the samples and sieving, weighing the mass of the remaining RAP materials on the sieve;
- Calculating the index of Crushing-Loss rate following Equation (2):
3.3. Aggregate Image Measurement System
The aggregate image measurement system (AIMS) is an integrated system, consisting of image acquisition hardware and computers for system operation and data analysis. The image acquisition hardware uses cameras, microscopes, aggregate trays, backlight and overhead lighting systems. The computer software, including the hardware and the user interface, were designed for the purpose of data analysis. It can also combine the software, such as Excel or Matlab, to output data in the form of chart or figure. In this paper, the AIMS was used to capture the shapes of RAP materials and to analyze clustering degree with respect to angularity and sphericity [29,30]. RAP material particles with sizes of 13.2 mm to 16 mm were subjected to the test, and a total of five kinds of mixtures were used. They include new materials, secondary crushing old materials, pavement milling materials, flat secondary crushing old materials, and flat pavement milling materials, respectively. The angularity (GA) and sphericity index (SP) were calculated.
Angularity (GA) is defined to character the shape of the particle boundary variation, which is an efficient way to measure the change in high gradient value along the boundary of polygonal particles. The calculation of GA is shown in Equation (3).
where: -Azimuth at an edge point; -The total number of points; -The ith point on the edge.
Sphericity (SP) is applicable for coarse aggregate size and describes the overall three-dimensional shape of particles, as is defined in Equation (4).
where ds: Minimum particle size;: Intermediate particle size; : Intermediate particle size.
3.4. Evaluation Methods of Particle Clustering Phenomena
To quantitatively analyze the overall stability of RAP material, this study combines the results of crushing test and extraction test to define the index of stability, which is w, as is shown in Equation (5). The larger the index of stability (w), the higher the clustering stability of the coarse particle:
where = Index of stability; = The number of the particle size; = The loss rate of the ith particle size after extraction test; = The loss rate of the ith particle size after crushing test.
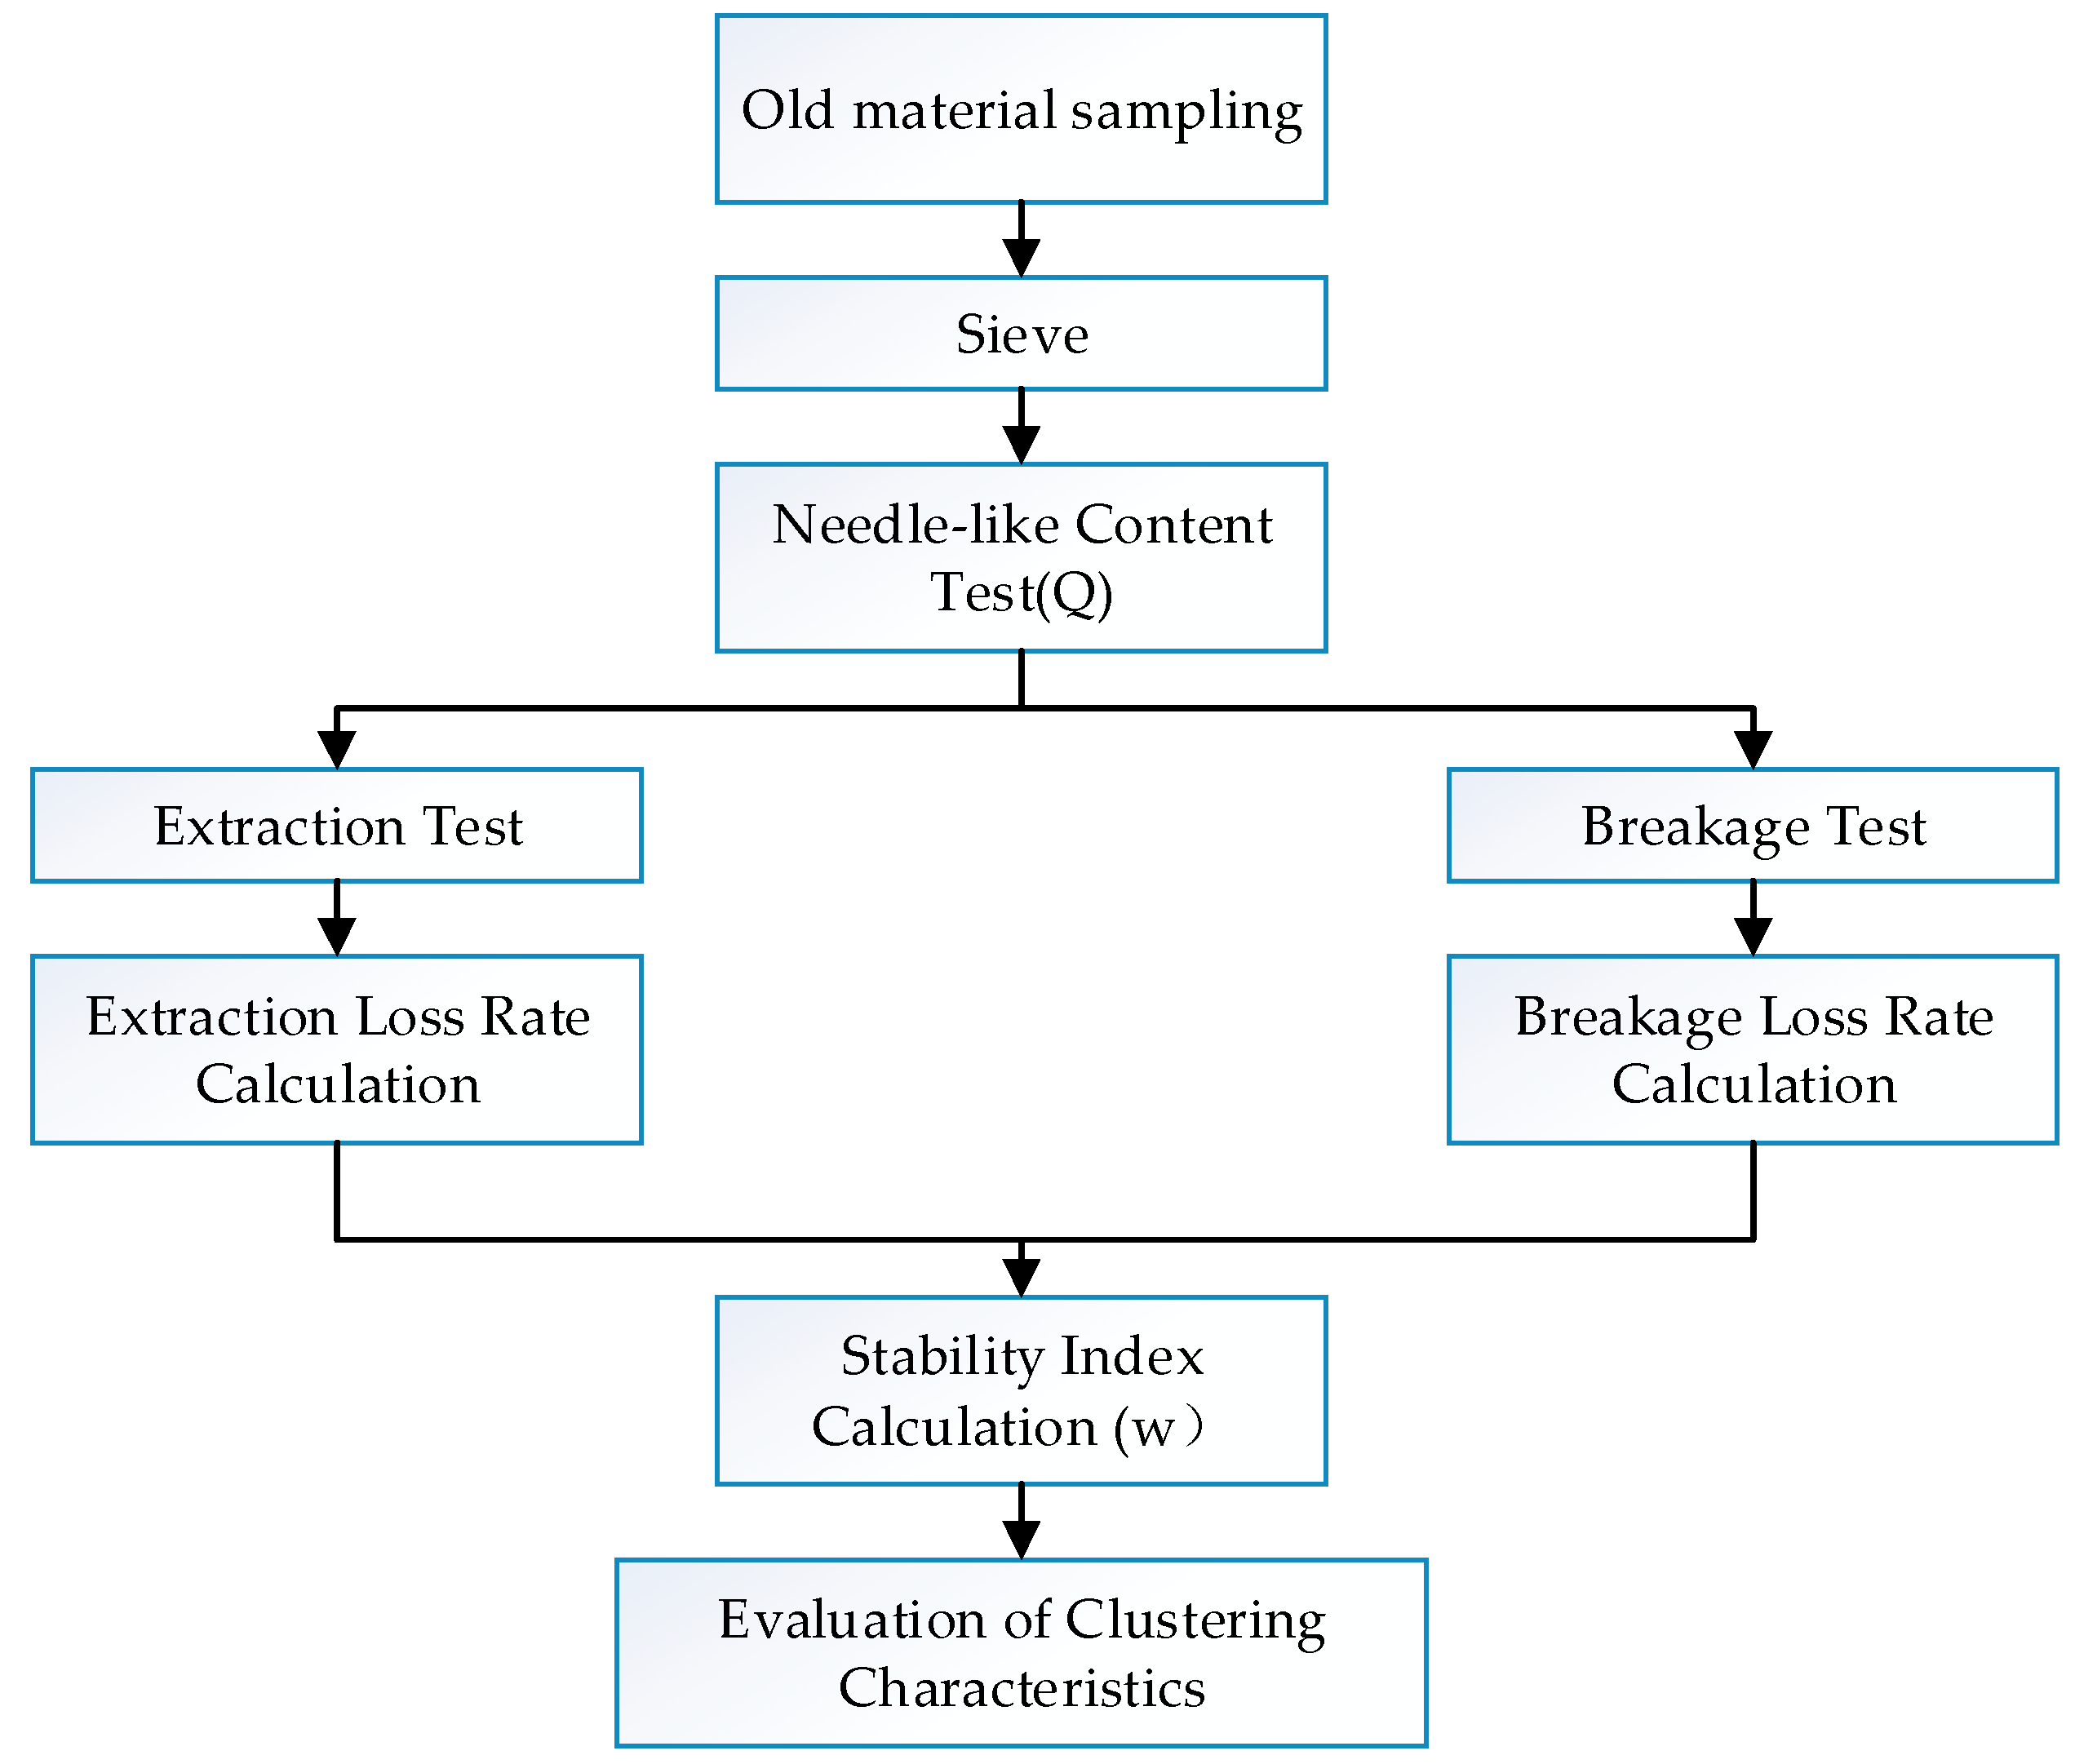
According to the results analysis, a flow chat is illustrated here to evaluate RAP materials clustering degree. As is shown in Figure 3, old materials can be divided into three structural types which are respectively strong clustering structure, weak clustering structure and aggregates after needle-like particles tests. Then the extraction test and the breakage test can be conducted to calculate extraction loss rate and breakage loss rate, which are used to calculate the stability index. On the basis of the stability index, the clustering degree of old materials could be determined, and the clustering characteristics of recycled asphalt pavement can be comprehensively evaluated.
4. Results and Discussion
4.1. Particle Composition Analysis of Each Particle Size
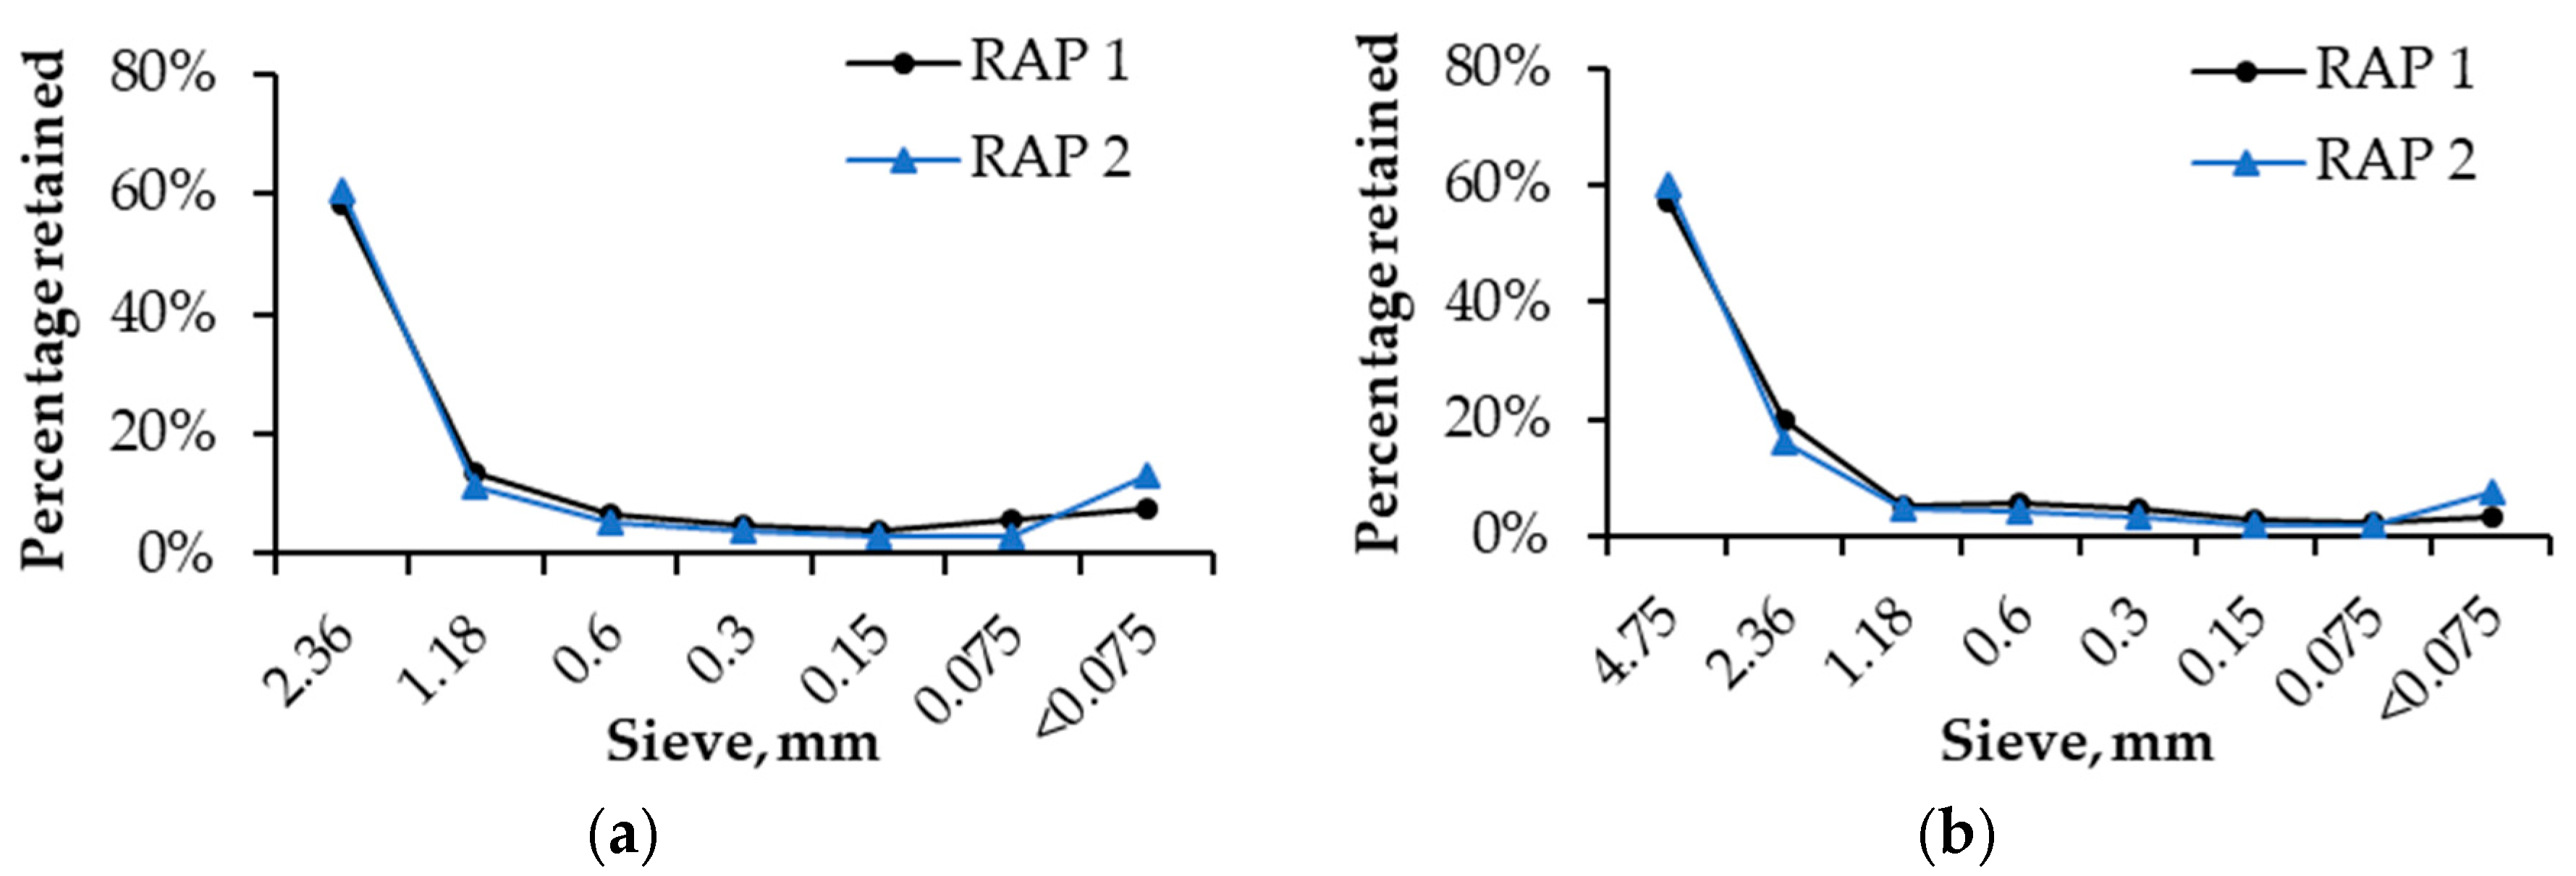
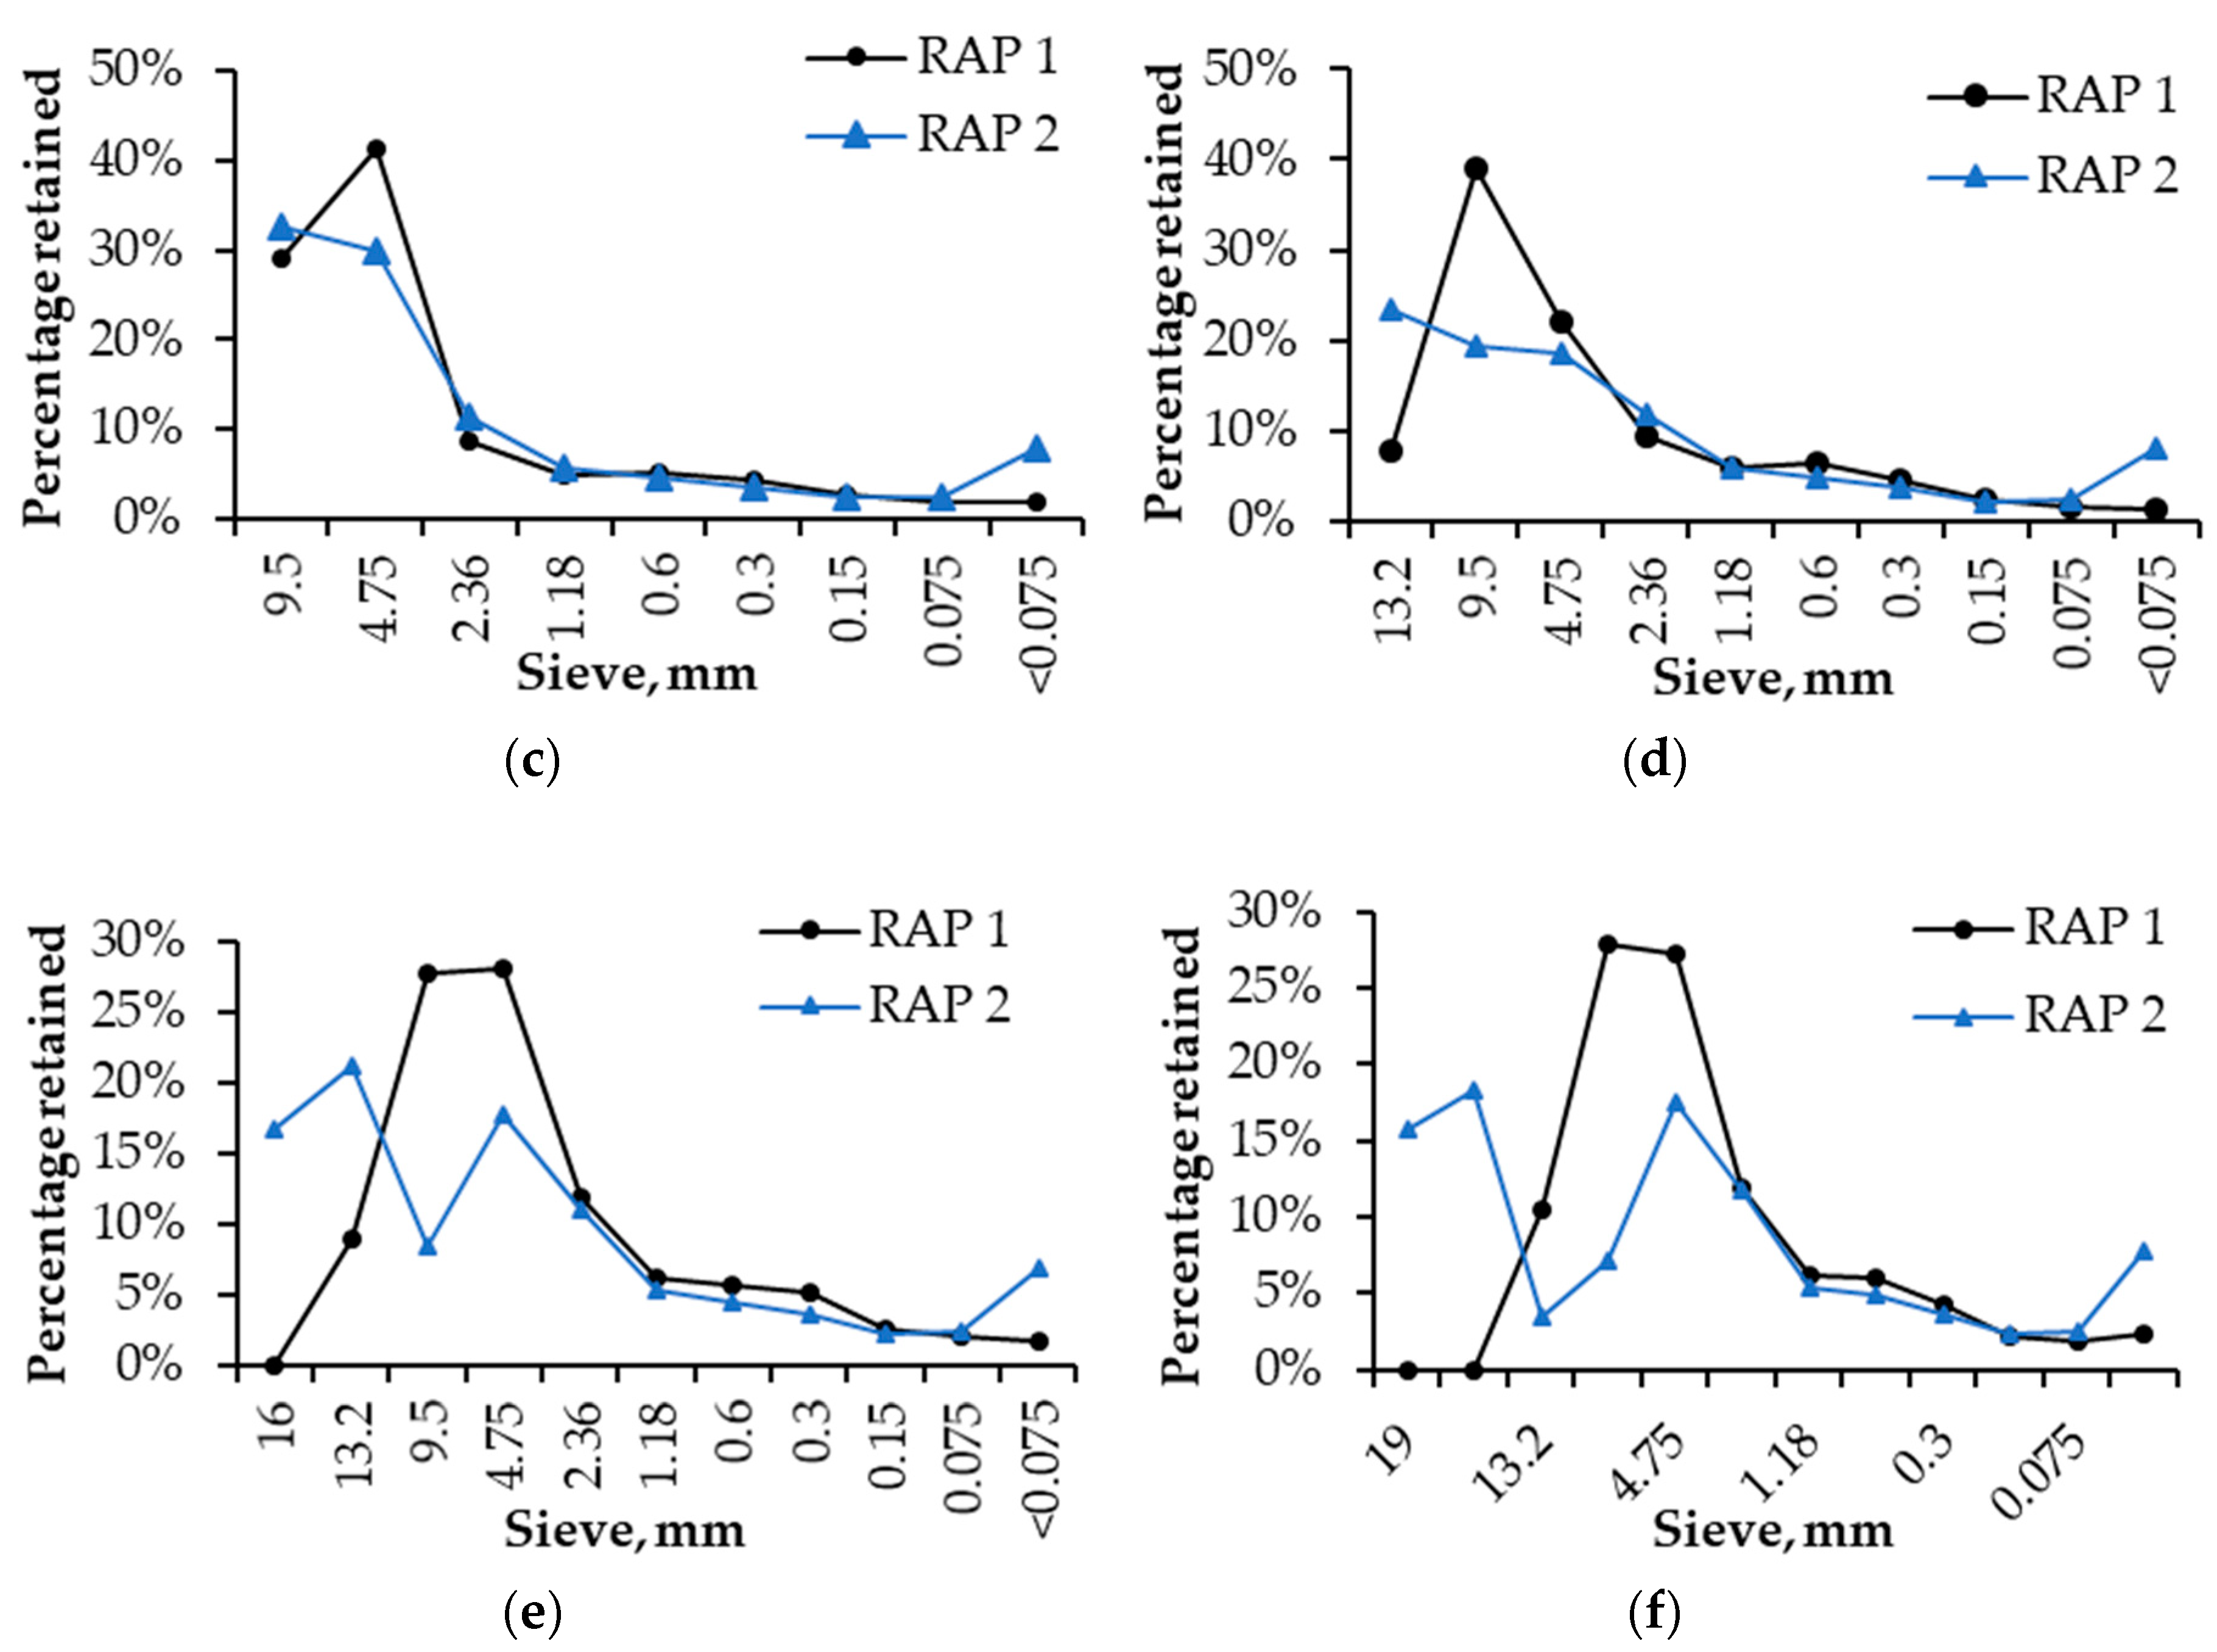
Figure 4 shows the result of the percentage retained on each size of RAP materials after the extraction test. It can be found that one particle size of the RAP was mainly composed of the next particle size. Further, the cluster of coarse aggregate (>4.75 mm) was mainly composed of aggregates with its next particle size and 4.75 mm size. It indicates that the cluster phenomenon of coarse aggregates in RAP materials would have a great impact on the variability of its next particle size and the particle size of 4.75 mm. In addition, for RAP 1 materials, which is milled from the old asphalt pavement directly, it can be found that the particle size of 16mm and 19 mm were mainly composed of aggregates of 9.5 mm and 4.75 mm, and this is different from other sizes. This is probably because the raw materials were from AC13 type asphalt mixture, thus the content of particles of 13.2 mm size was less, and the RAP did not break sufficiently during the milling procedure.
Therefore, from the analysis of the composition of each particle size, it can be found that the content of its next particle size was higher, and the cluster of coarse aggregate (>4.75 mm) was mainly composed of its next particle size and 4.75 mm particle size aggregate. In terms of fines (< 4.75 mm), the 2.36mm particle was mainly composed of its next size aggregate and mineral powder. It also has to be noted that the particle composition of fines needs further study.
4.2. Clustering Degree Analysis of Each Particle Size
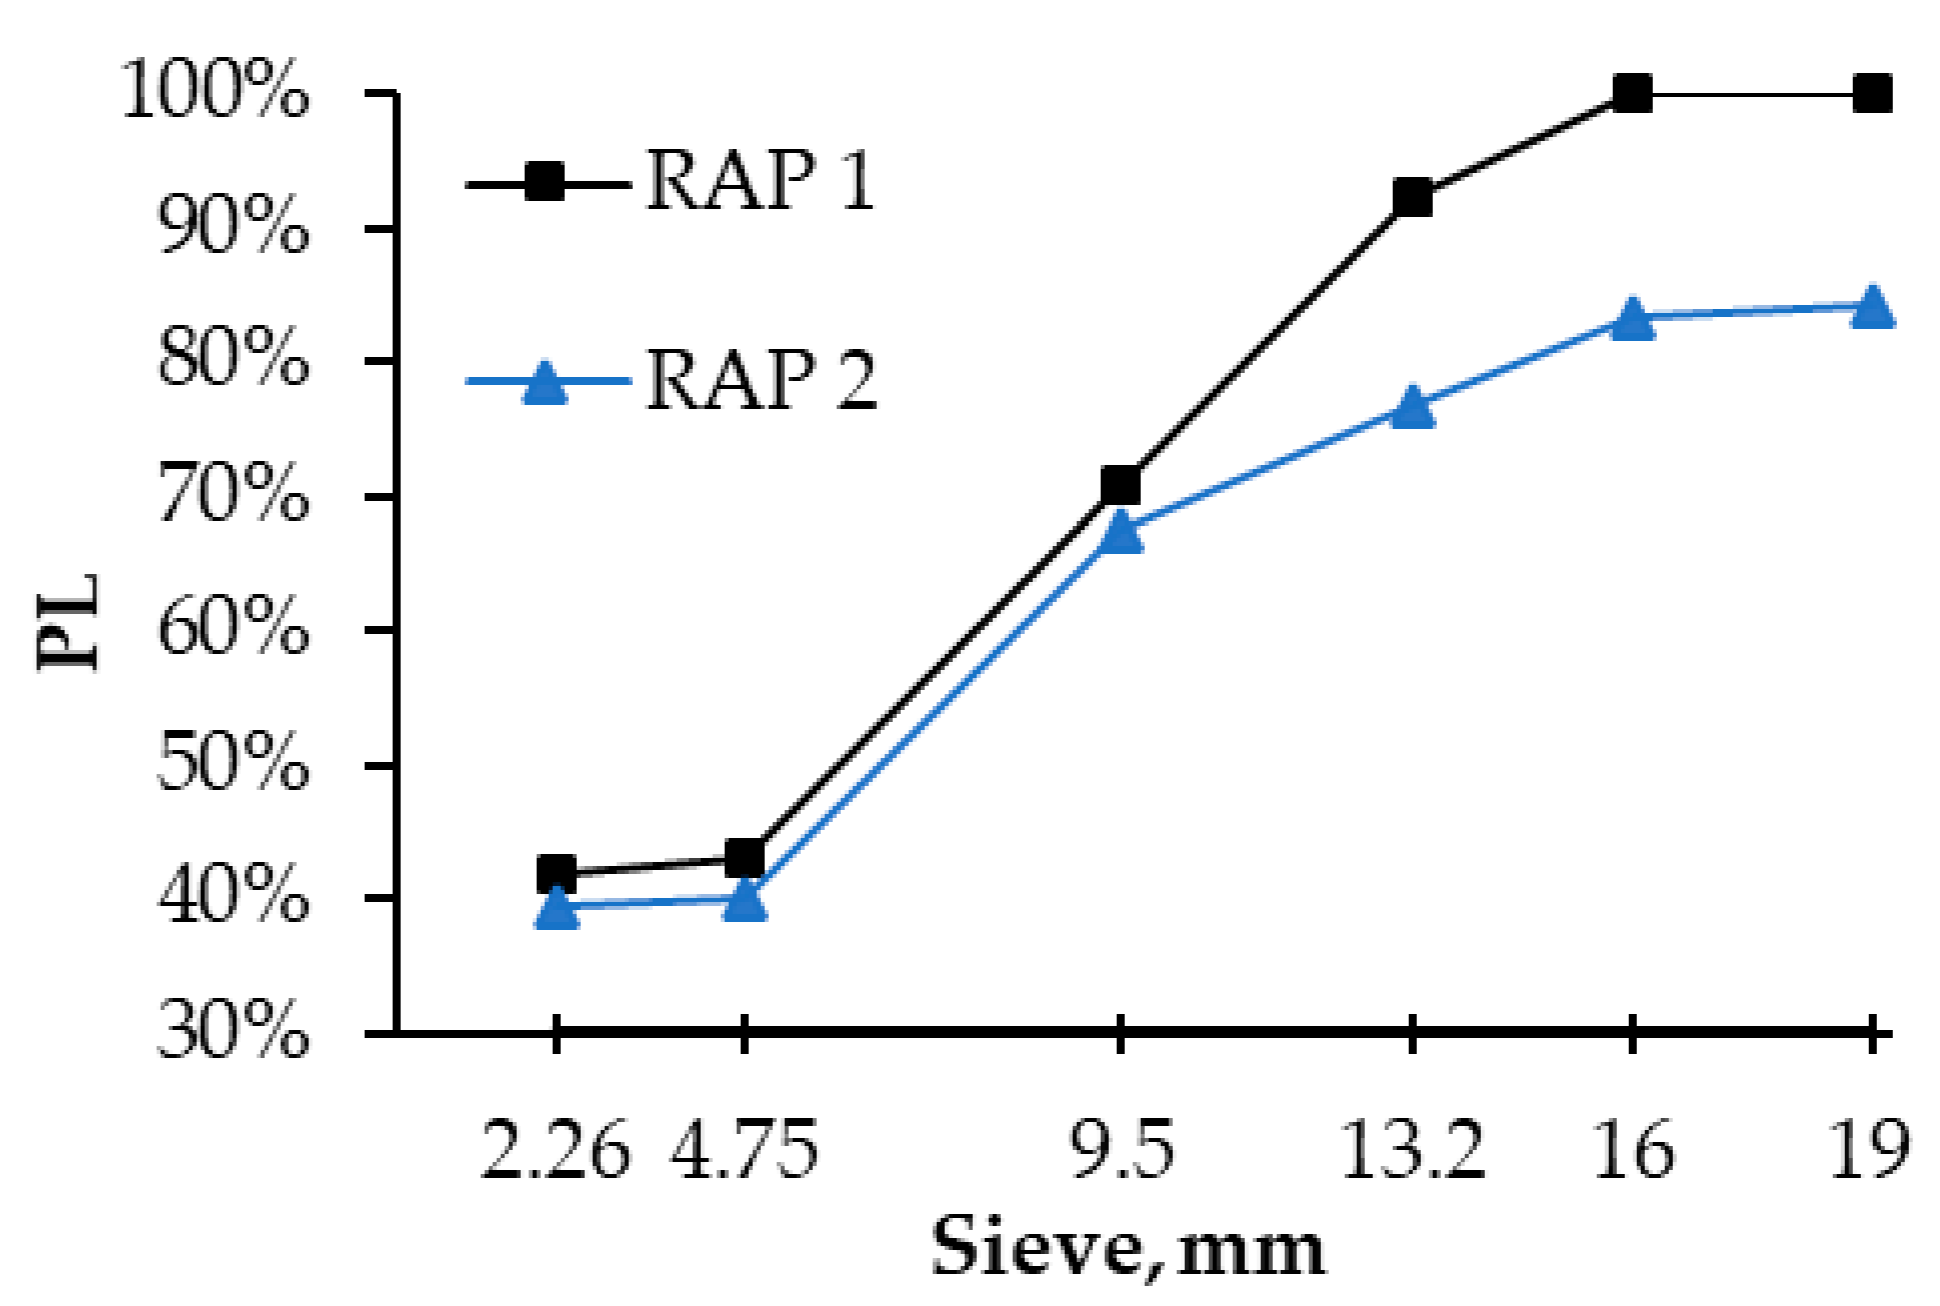
To further analyze the clustering degree of RAP materials with different particle sizes, the Percentage-Loss (PL) rate after extraction was used as the evaluation index. The greater the PL, the more serious the clustering degree. Results are shown in Figure 5.
As is shown in Figure 5, with the increase of particle size, the loss rate of the two kinds of RAP materials showed a general increasing trend. It indicates that the larger the size of the RAP particle, the more severe the clustering degree. Besides, there were two change phases, and 4.75 mm sieving holes can be seen as the cut-off point. The loss rate of the particle size less than 4.75 mm changes smoothly and the clustering degree was smaller; while the particle size which are above 4.75 mm, the loss rate increased rapidly, and the clustering degree was more serious.
Therefore, the particle size larger than 4.75 mm would seriously affect the variability of RAP and as a result, required further crushing treatment. Furthermore, when compared the RAP1 with RAP2, the clustering degree of RAP1 was greater. To finely crush the RAP materials, it is necessary to reduce the clustering degree of the coarse aggregate (above 4.75 mm), which is of great significance in reducing the variability of the RAP mixtures and to improve the performance of the recycled mixtures.
4.3. Analysis of the Breakage Behavior of RAP
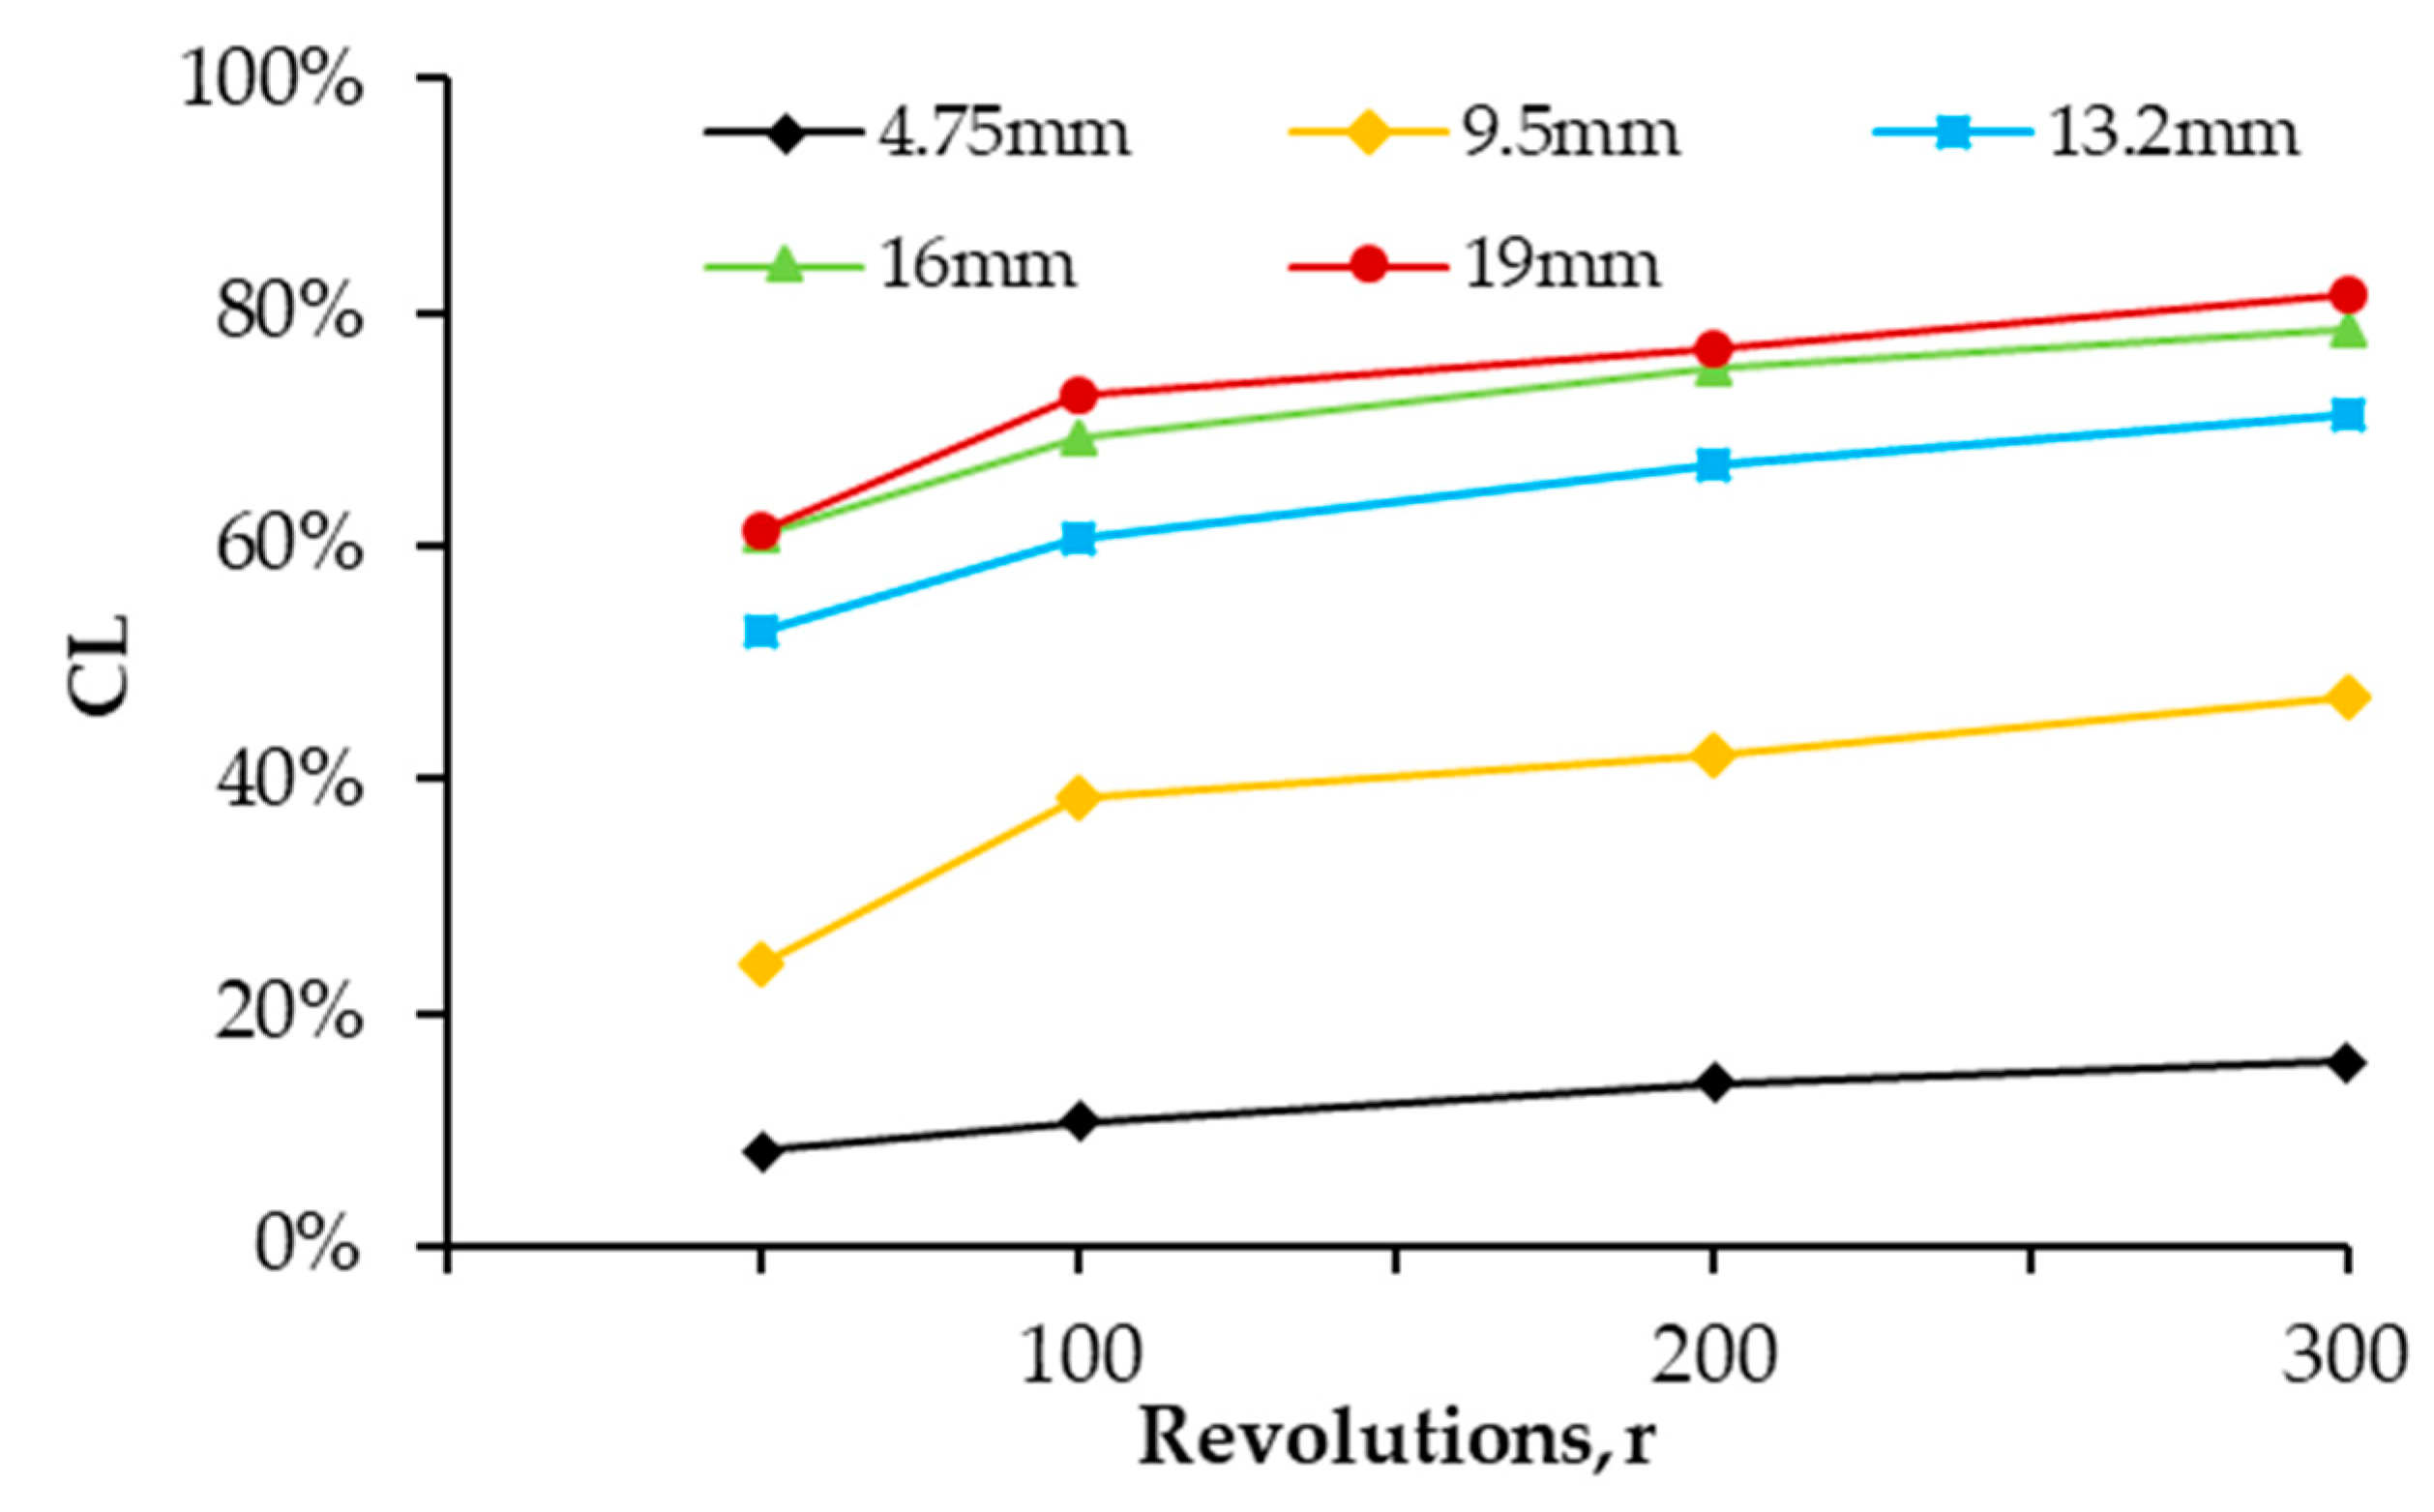
The extraction test found that the particle clustering phenomena occurred mainly in the coarse aggregate (>4.75 mm). To further analyze the crushing law and clustering stability of RAP, in this paper, the Cantabro-Crushing test was used to crush the particle (>4.75 mm) respectively. The cluster stability of each particle size was evaluated by the index of the Crushing loss rate (CL) for RAP 1 and RAP 2, and results are shown in Figure 6 and Figure 7, respectively.
Figure 6 and Figure 7 illustrate that the loss rates of the two kinds of RAP materials gradually increase with the increase of the revolutions. As for the same RAP material, with the increase of the particle size, the loss rate of the particles gradually increased at the same revolutions. It indicated that the clustering stability of the RAP materials decreases with the increase of the particle size or revolutions. Compared with these two kinds of RAP, it can be found that the crushing loss rate of RAP 1 was obviously greater than that of RAP 2, indicating that the clustering stability of RAP 1 was lower than that of RAP 2.
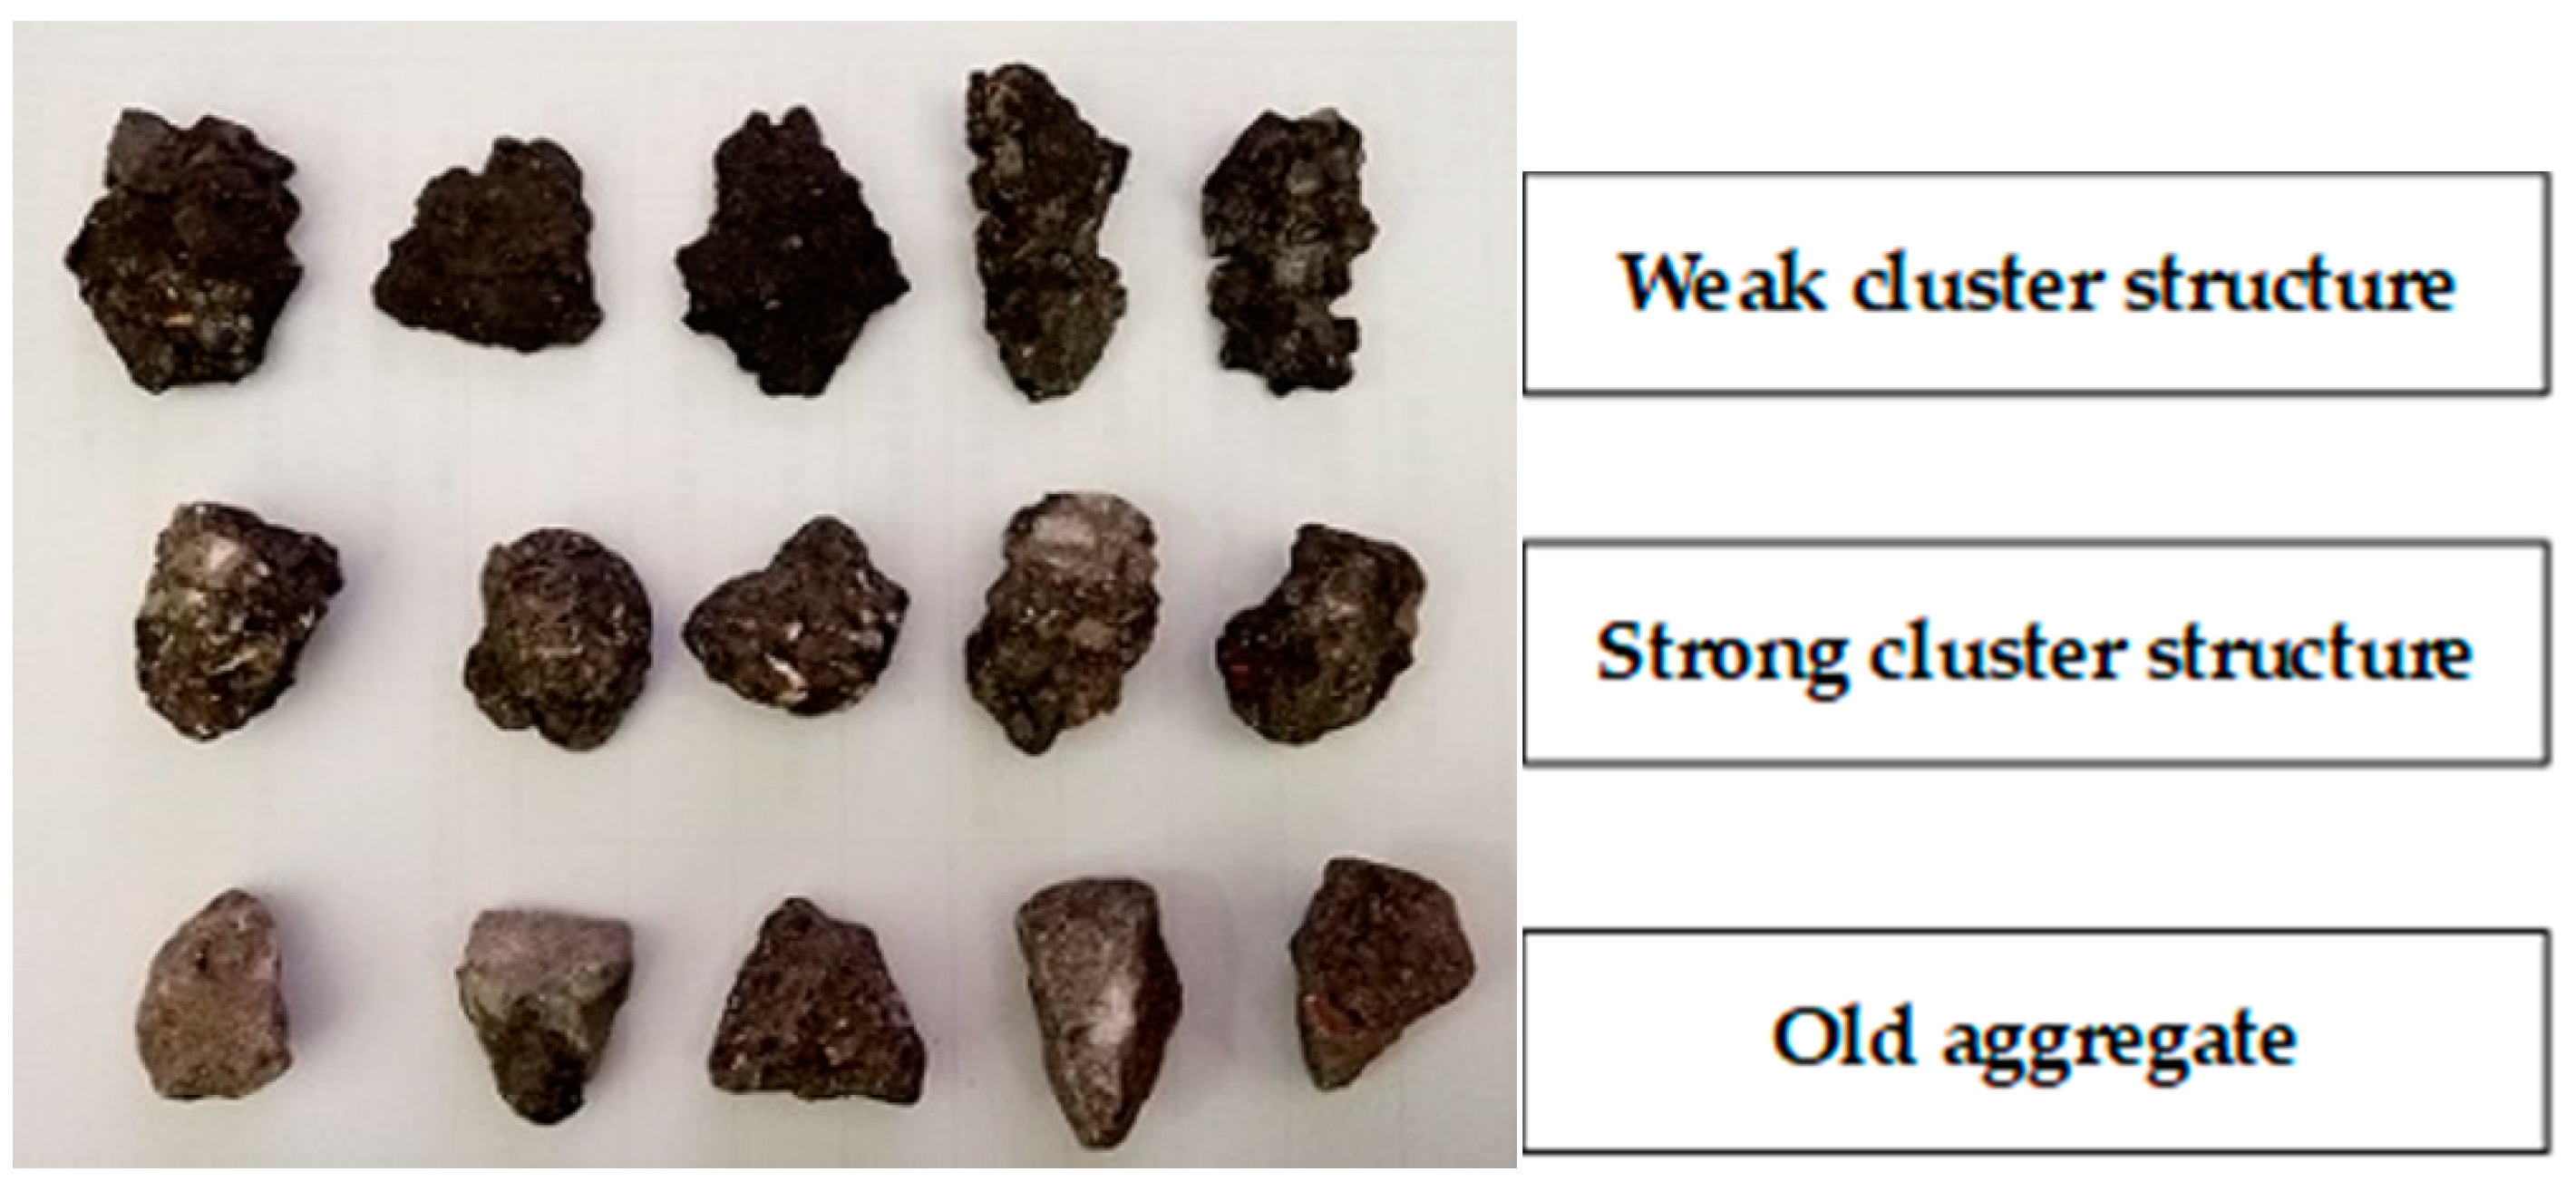
To describe the broken law, the RAP materials can be divided into three types of structures firstly, as is shown in Figure 8. The first one is weak cluster structure. It mainly refers to some flat, needle-shaped particles, and it mainly is composed of small particles aggregates wrapped with asphalt binder. The second one is strong cluster structure. This structure mainly refers to some particles with tight clusters and better grain shape, and it is generally formed by small particles wrapping around the large particle aggregates. The last one is old aggregate, and which is composed of independent stone particles.
Therefore, according to the results of Figure 6 and Figure 7, the process of RAP crushing can be further divided into three stages, qualitatively. The first breaking stage is dominated by weak cluster structure, which is the crushing of the flat, needle-shaped particles. Followed by the second breaking stage, it is dominated by strong cluster structure which was the crushing of blocky-shaped particles. The last stage is the crushing of aggregates. This was consistent with a process in which the trend of RAP loss rate is from rapid to steady.
4.4. Quantitative Analysis of Clustering Stability of RAP
Table 1 summarizes the stability index results of two types of RAP materials. As seen in Table 1, as the number of revolutions increases, the stability index of coarse particles gradually decreased. The larger the number of revolutions, the greater the impact on the cluster stability of the coarse particle. Compared the RAP 1 with the RAP 2, it can be found that the stability index of RAP 2 was higher than RAP 1, indicating that RAP 2 material has a higher stability. Therefore, the stability index (w) can be used to quantitatively describe and compare the clustering stability of different RAP mixtures, as wells the crushing effect of different processes. It could provide a valuable reference for the comparison of the advantages and disadvantages of different RAP mixtures and different crushing processes.
4.5. Comparison and Analysis of Weak Cluster Structure, Strong Cluster Structure and Old Aggregate
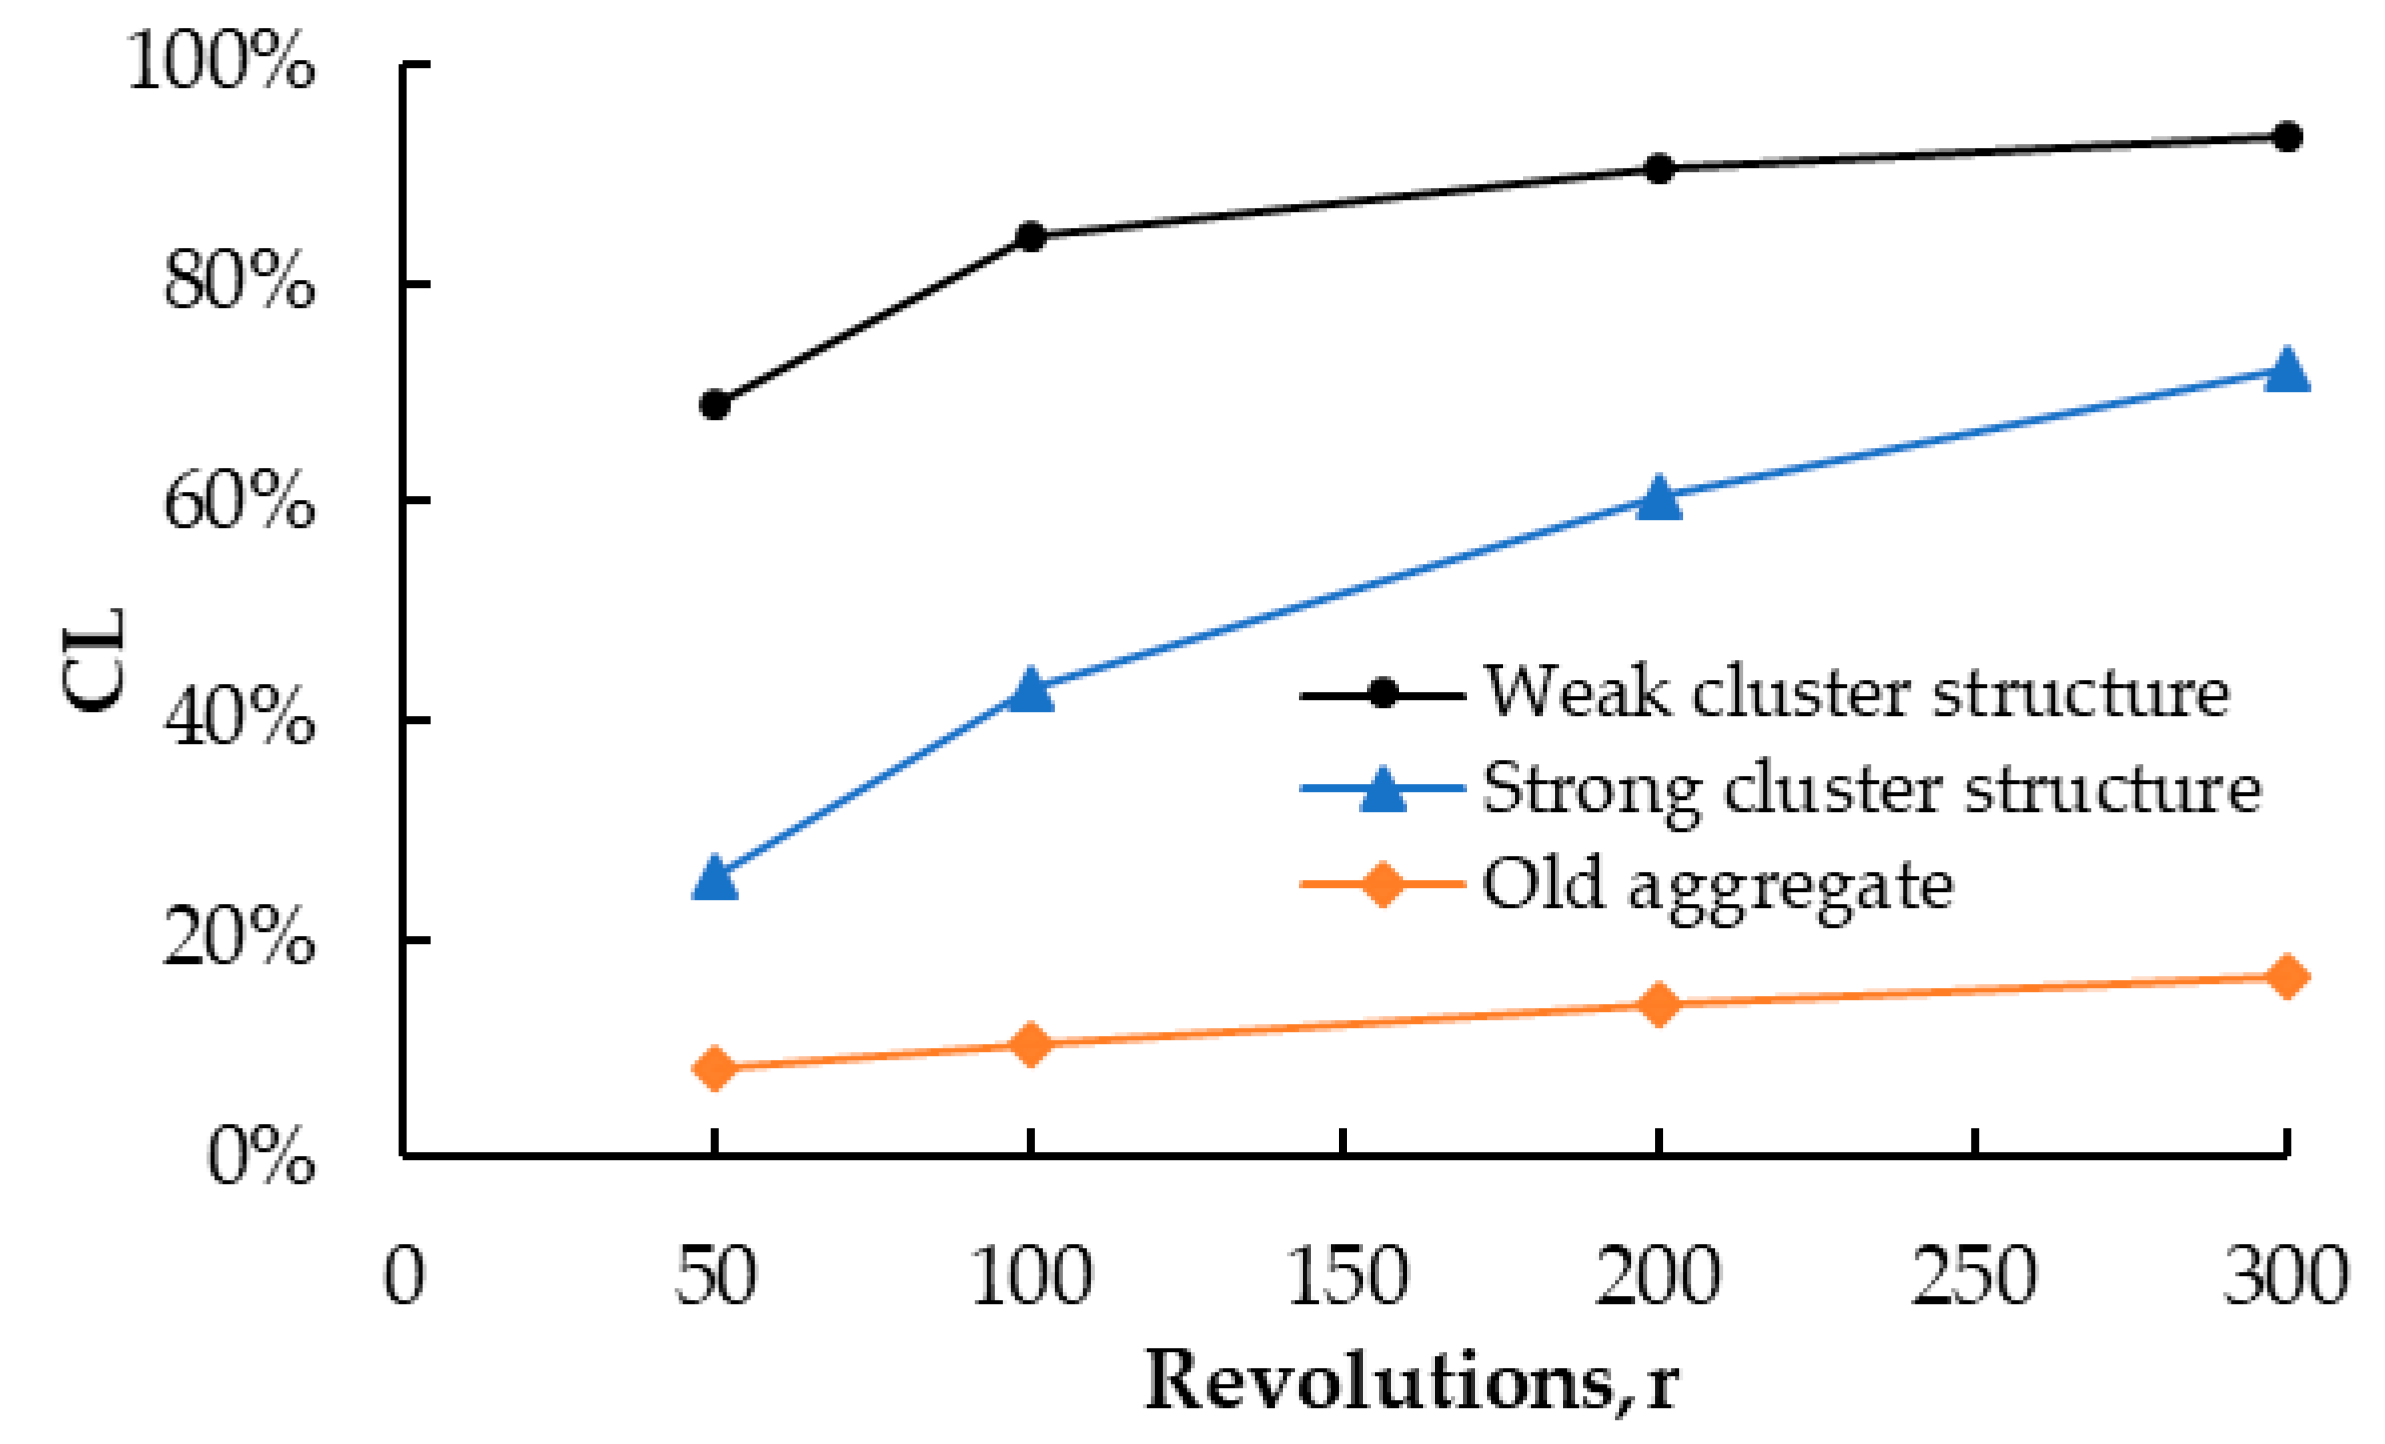
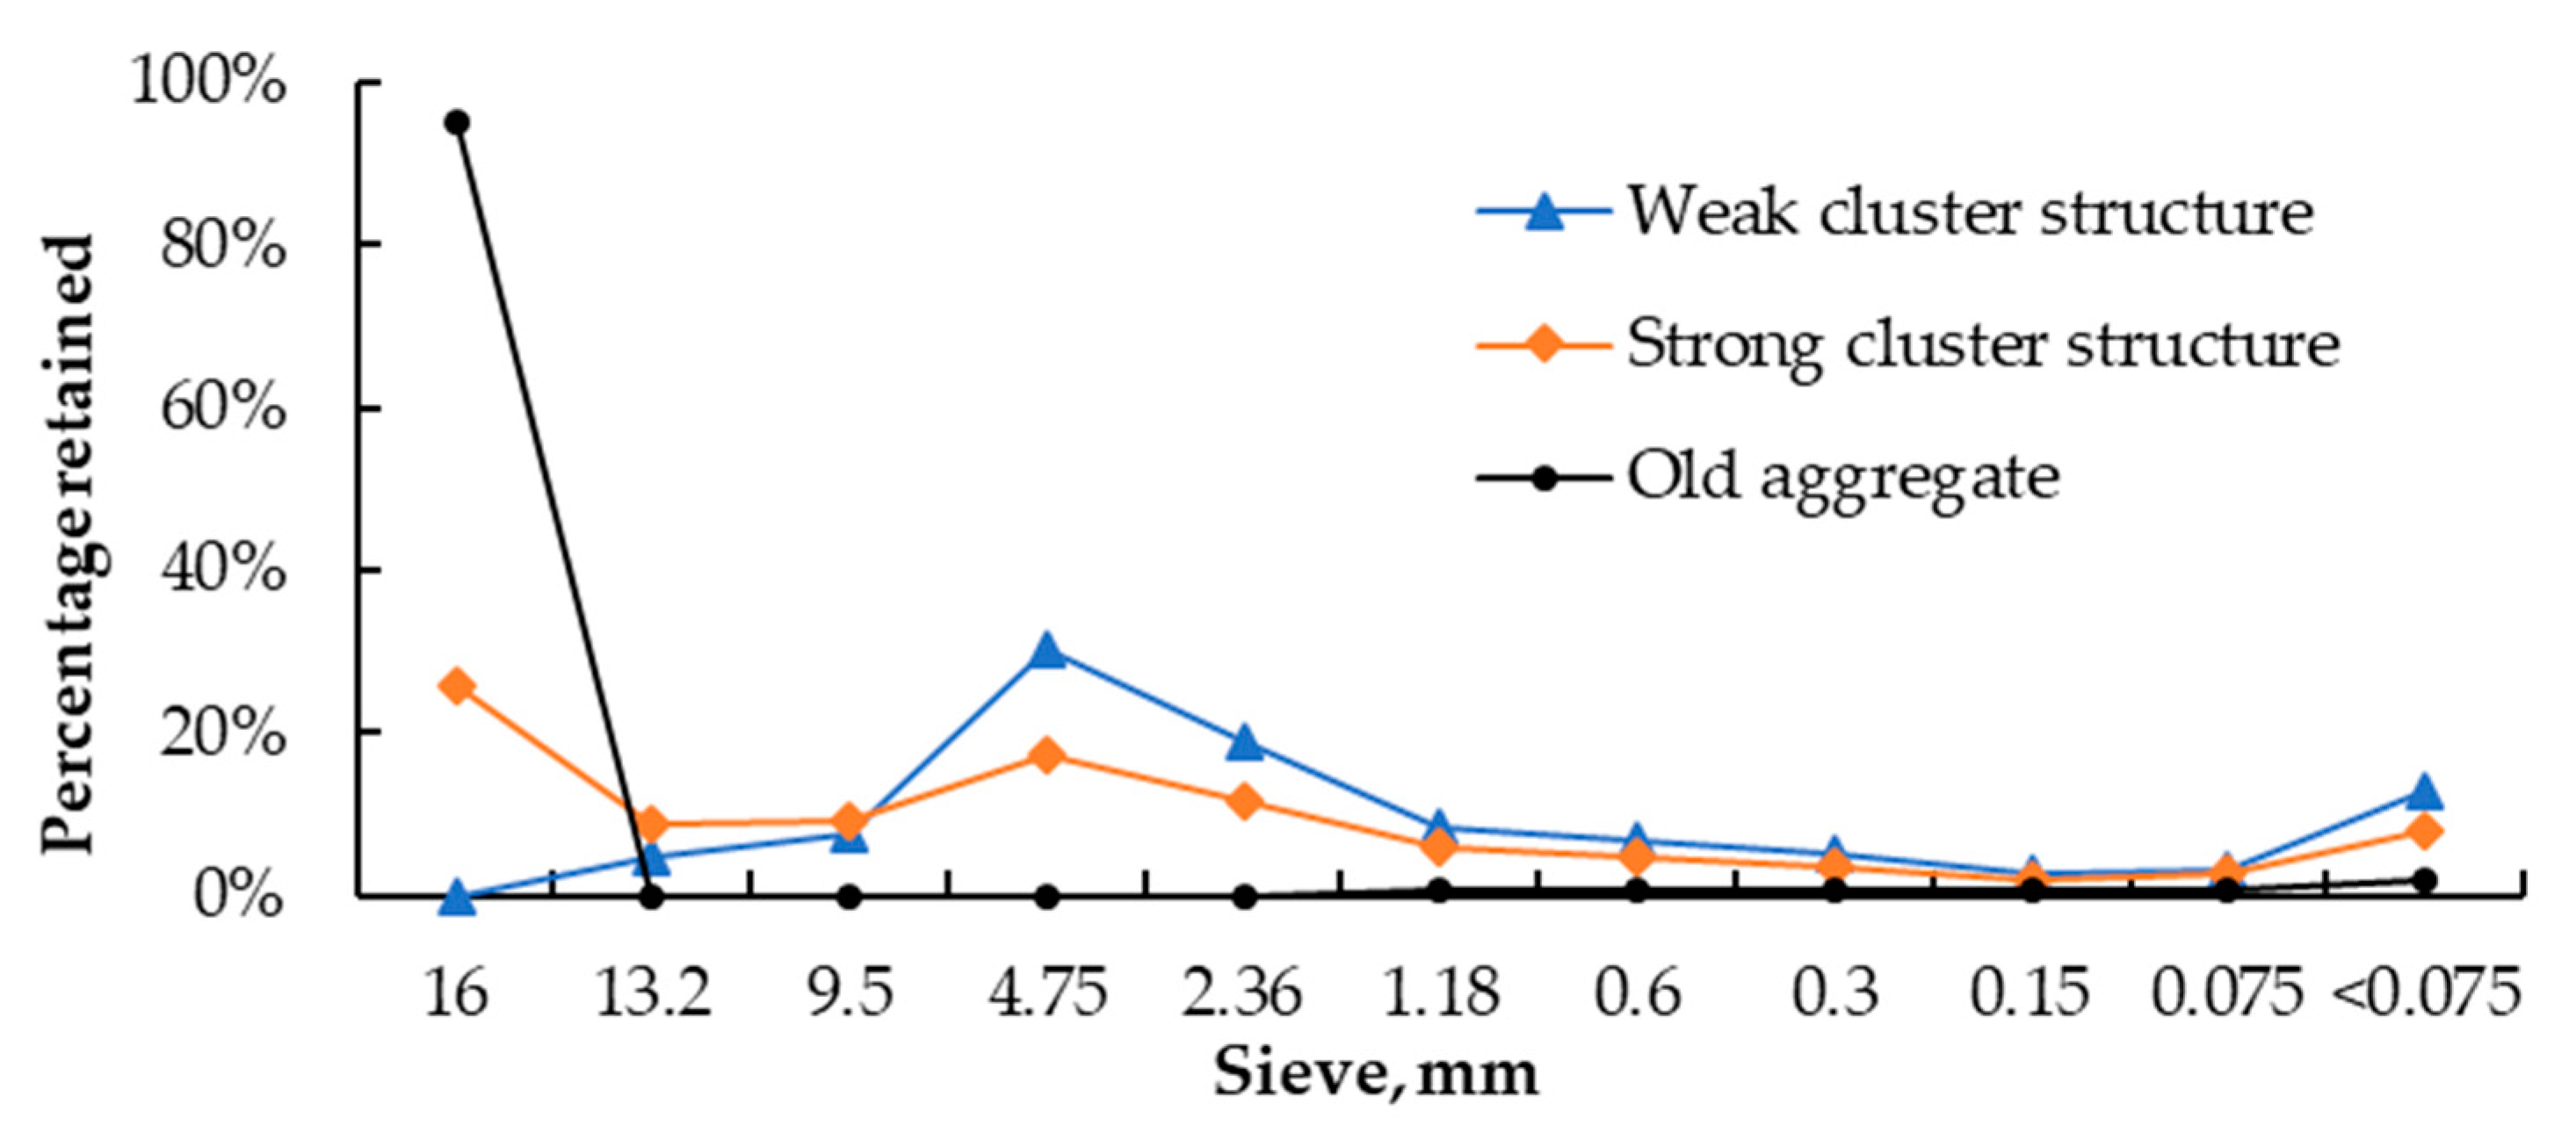
In this paper, the particle size of 16–19 mm in RAP 2 was used to further analyze the three kinds of structures in RAP, including the proportion, the clustering stability and the clustering degree. The proportion of three kinds of structures is shown in Table 2. The results of the crushing test and extraction test are shown in Figure 9 and Figure 10 respectively.
As shown in Table 2, it can be found that the content of strong cluster structure was the highest, followed by the weak cluster, and the content of old stones was the least. Figure 9 shows that the loss rate of the weak cluster structure increases fastest, and the loss rate was the largest; followed by the strong cluster structure; the loss rate of the old aggregate particles was least. This indicates that the stability of the weak cluster structure was worst, easily broken. In contrast, the strong cluster structure was relatively stable, but would experience a greater loss under a full effect of external forces. The old aggregate particles were most stable, mainly corner damage could be expected.
Figure 10 shows that when the sieve size was above 16mm, the percentage retained of weak cluster structures was 0. The weak cluster structure was mainly composed of 4.75 mm and below fines, and the content of mineral powder was high. This indicated that the clustering degree of the weak cluster structure was the largest, and this is likely to have an adverse effect on gradation variation. According to the result of extraction test, the loss rate of the strong cluster structure was larger, and it mainly affected the content of coarse particles. For the old aggregate, there is no loss and it thus had little effect on gradation variation.
Therefore, from the comparative analysis of these three kinds of structures, it can be found that the order of influence on the gradation variability of the RAP was: weak cluster structure > strong cluster structure > old aggregate. Therefore, to reduce the cluster phenomenon and reduce the variability of RAP, the formation of the weak cluster structure should be avoided as much as possible during crushing process at first. It is important to reduce the content of strong cluster structures, and to increase the content of old aggregates. It is suggested that the nonlinear viscoelastic response of RAP mixtures at high temperatures should be considered in the future investigations [31]. The particle packing ability before and after crushing for different types of RAP should be considered to provide a better understanding of the effect of particle clustering on the overall performance of the mixture in the future study [32,33,34].
4.6. Validation of Clustering Characteristics
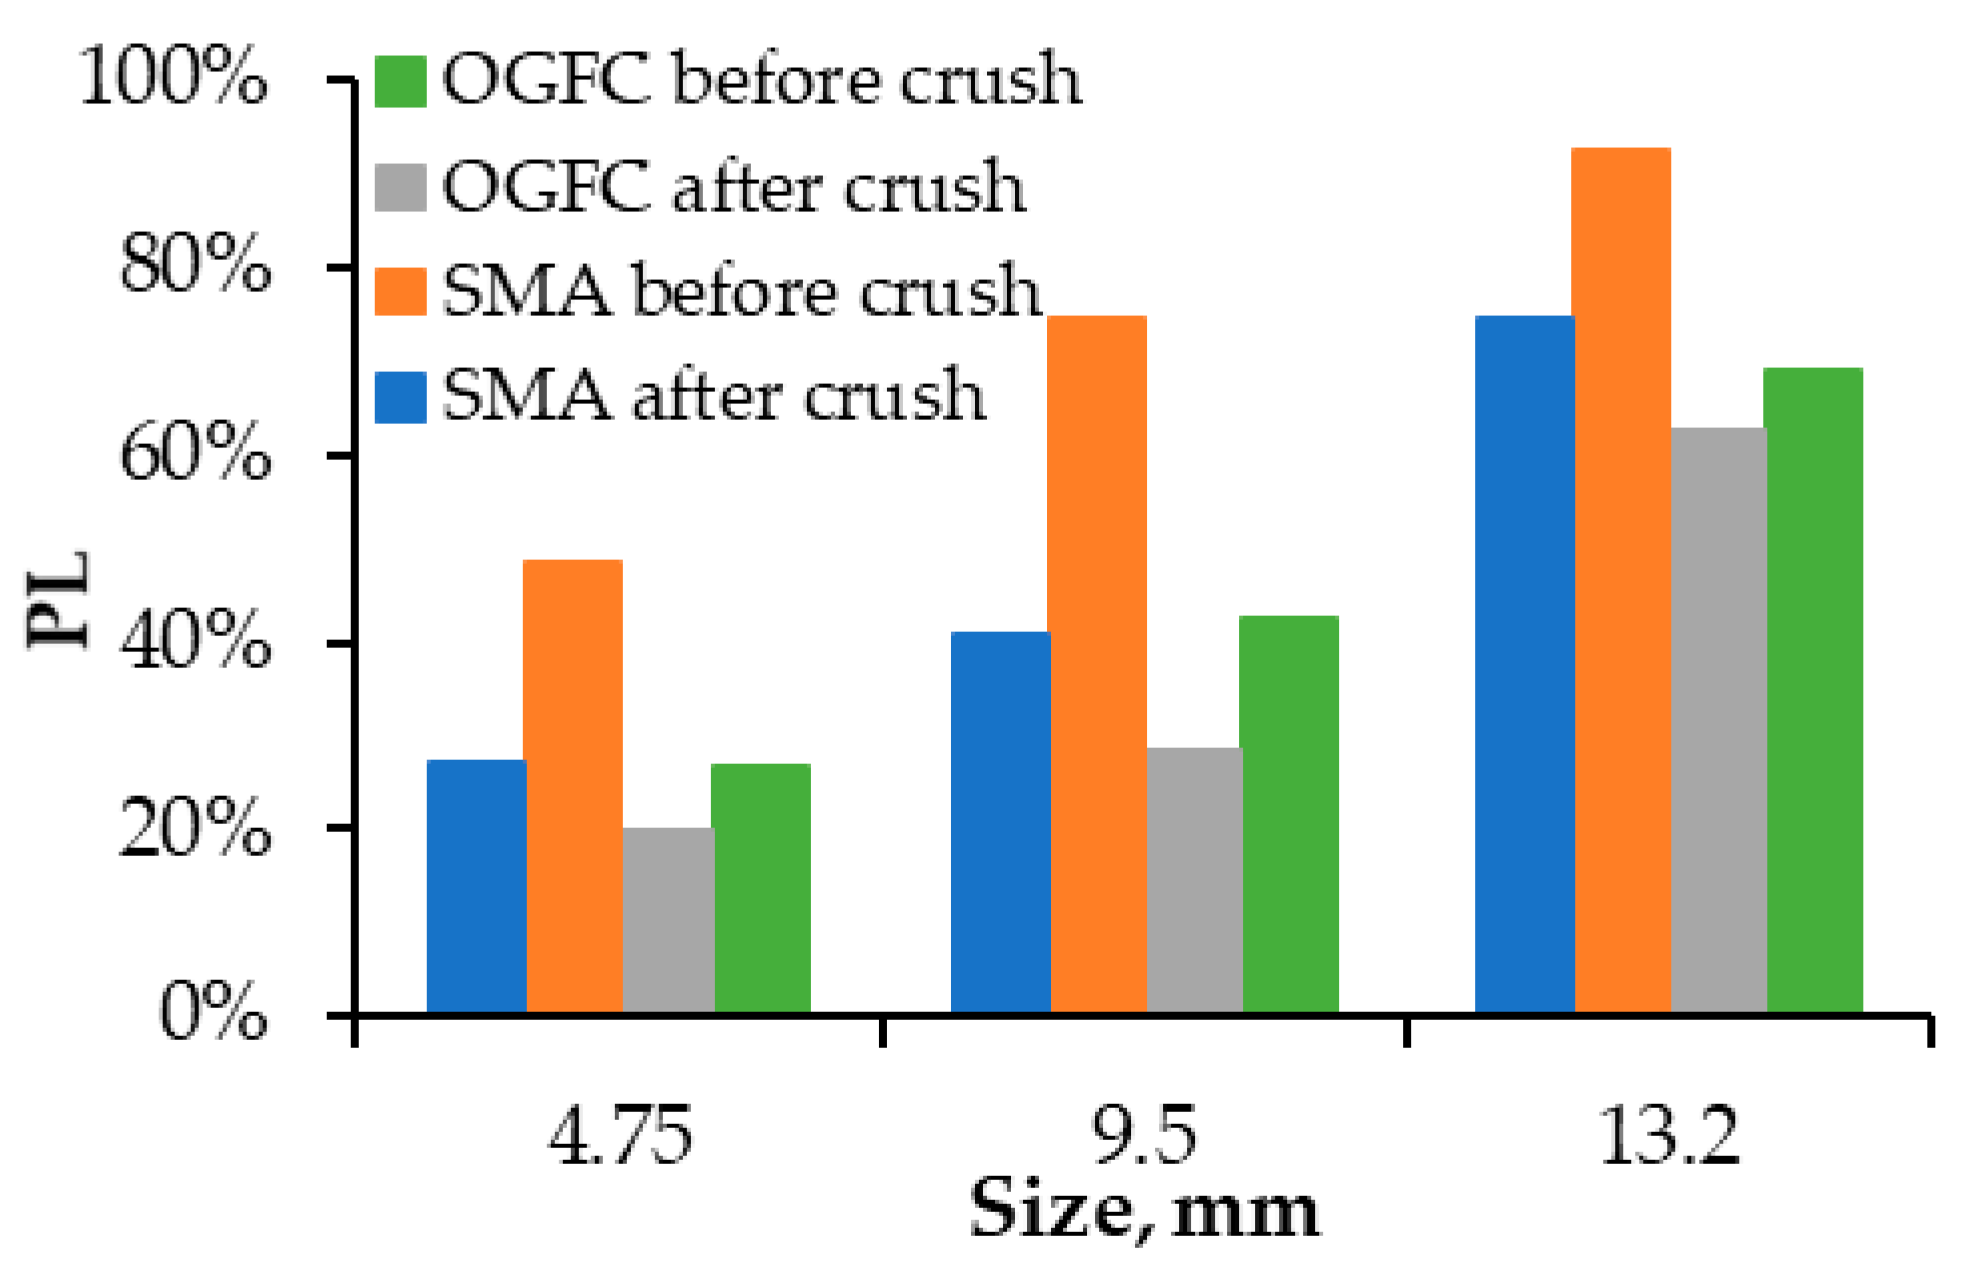
To verify the applicability of other mixture types, RAP materials were collected from OGFC and SMA asphalt pavement. Figure 11 shows the extraction loss rate before and after crushing with respect to OGFC and SMA RAP material. Three particles sizes were compared, which are 4.75 mm, 9.5 mm and 13.2 mm. As shown in Figure 11, the extraction loss rate increases with the increase in particle size no matter of OGFC or SMA mixture type, and each loss rate of size beyond 4.75 mm exceeds 30% for all sizes, indicating a large clustering degree and relatively poor stability. This is consistent with the cases in dense grade mixtures of AC type asphalt mixture. Additionally, materials of each particle size decrease in extraction loss rate after a second time crushing, it is understandable because the clustering materials went through crushing process tended to cluster fewer aggregates.
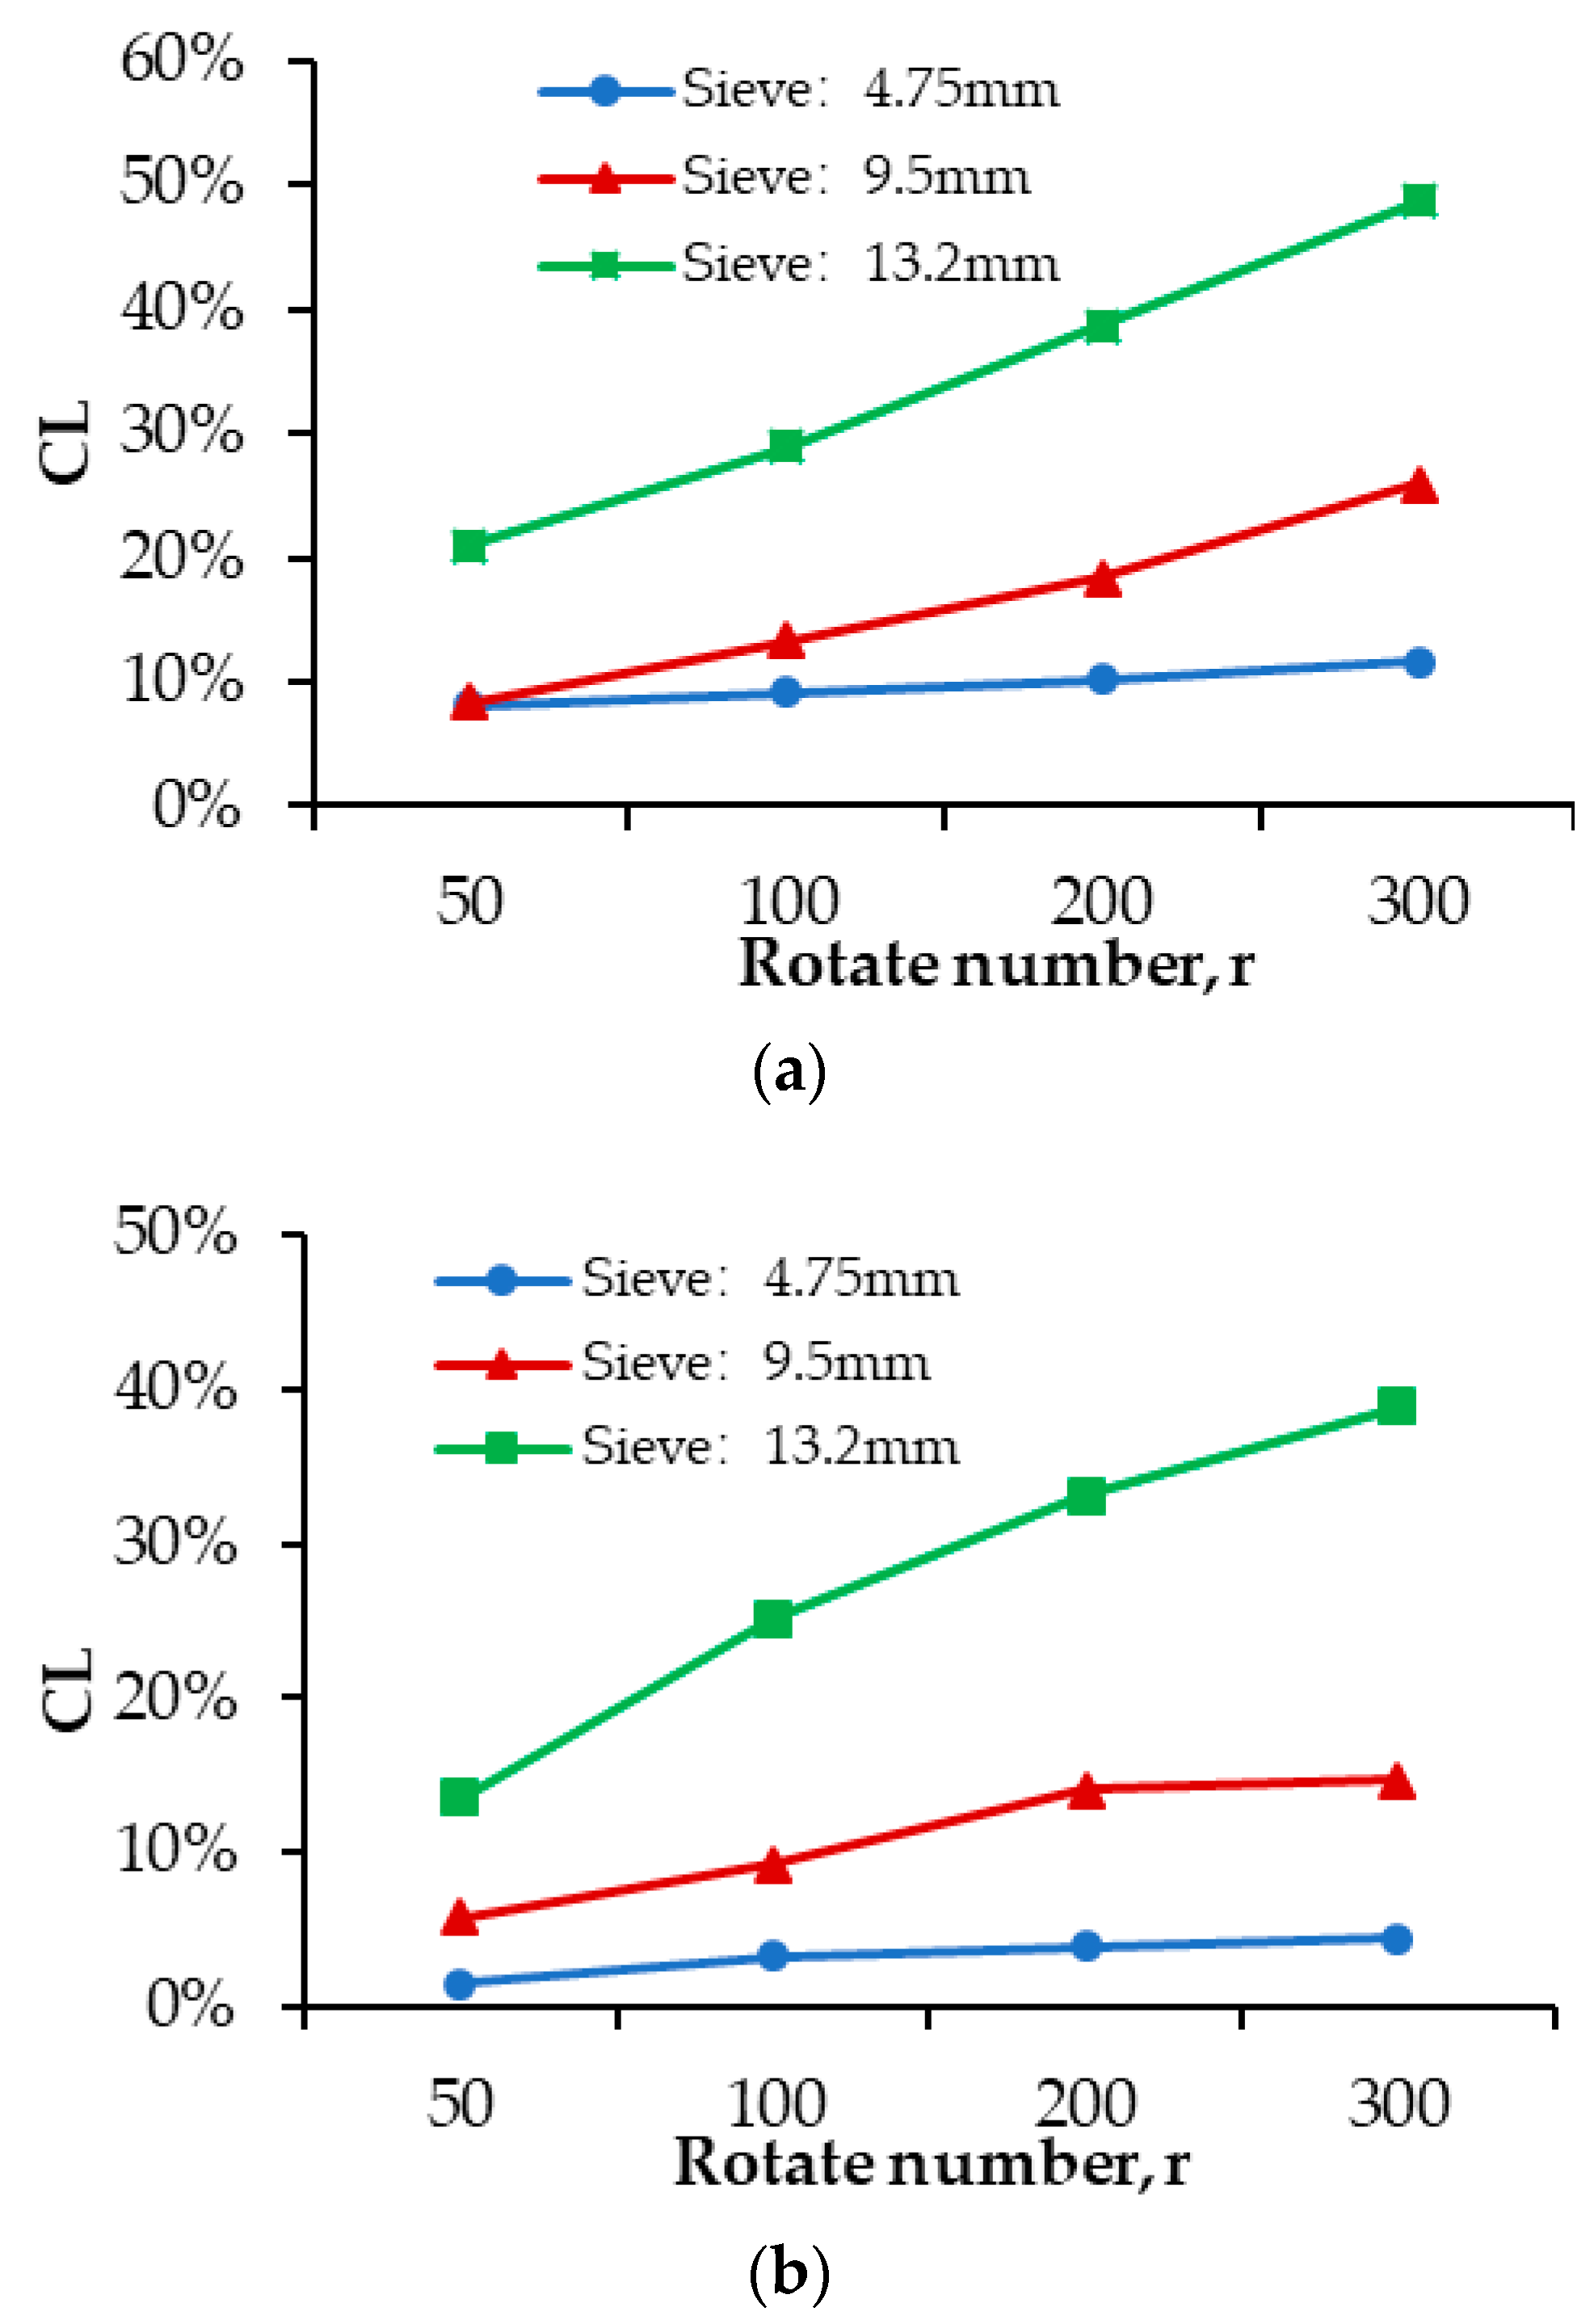
Figure 12 shows the comparison of breakage loss rate between OGFC and SMA. On one hand, for both types, the loss rate increases as the particle size increases, especially for 13.2 mm aggregates which has a distinct increase in breakage loss compared with others. On the other hand, the increase rate of 4.75 mm size aggregates in both OGFC and SMA materials is very small. The breakage loss changed little as rotate number increases, indicating a stable status of 4.75 mm old clustering materials. For the other two size materials, the breakage rate increases as rotate number increases, and the rate of OGFC materials is higher than that of SMA materials. This is probably because OGFC is open grade mixture and SMA is semi-open grade mixture, and the air voids in OGFC materials is larger and thus OGFC materials are easier to be separated.
From the breakage rate results, it was found that OGFC suffered from a greater loss in RAP materials. In Figure 13, the stability index between OGFC and SMA was compared. As shown in Figure 12, with the increase of rotate number, the stability index of both materials decreases. Although the decrease trends are similar, the OGFC materials presented a lower stability index than SMA materials at all rotate number. It could be concluded that old OGFC materials are more difficult to reuse due to their low stability and high clustering degree.
4.7. Other Attempts to Evaluate the Old material Clustering Degree
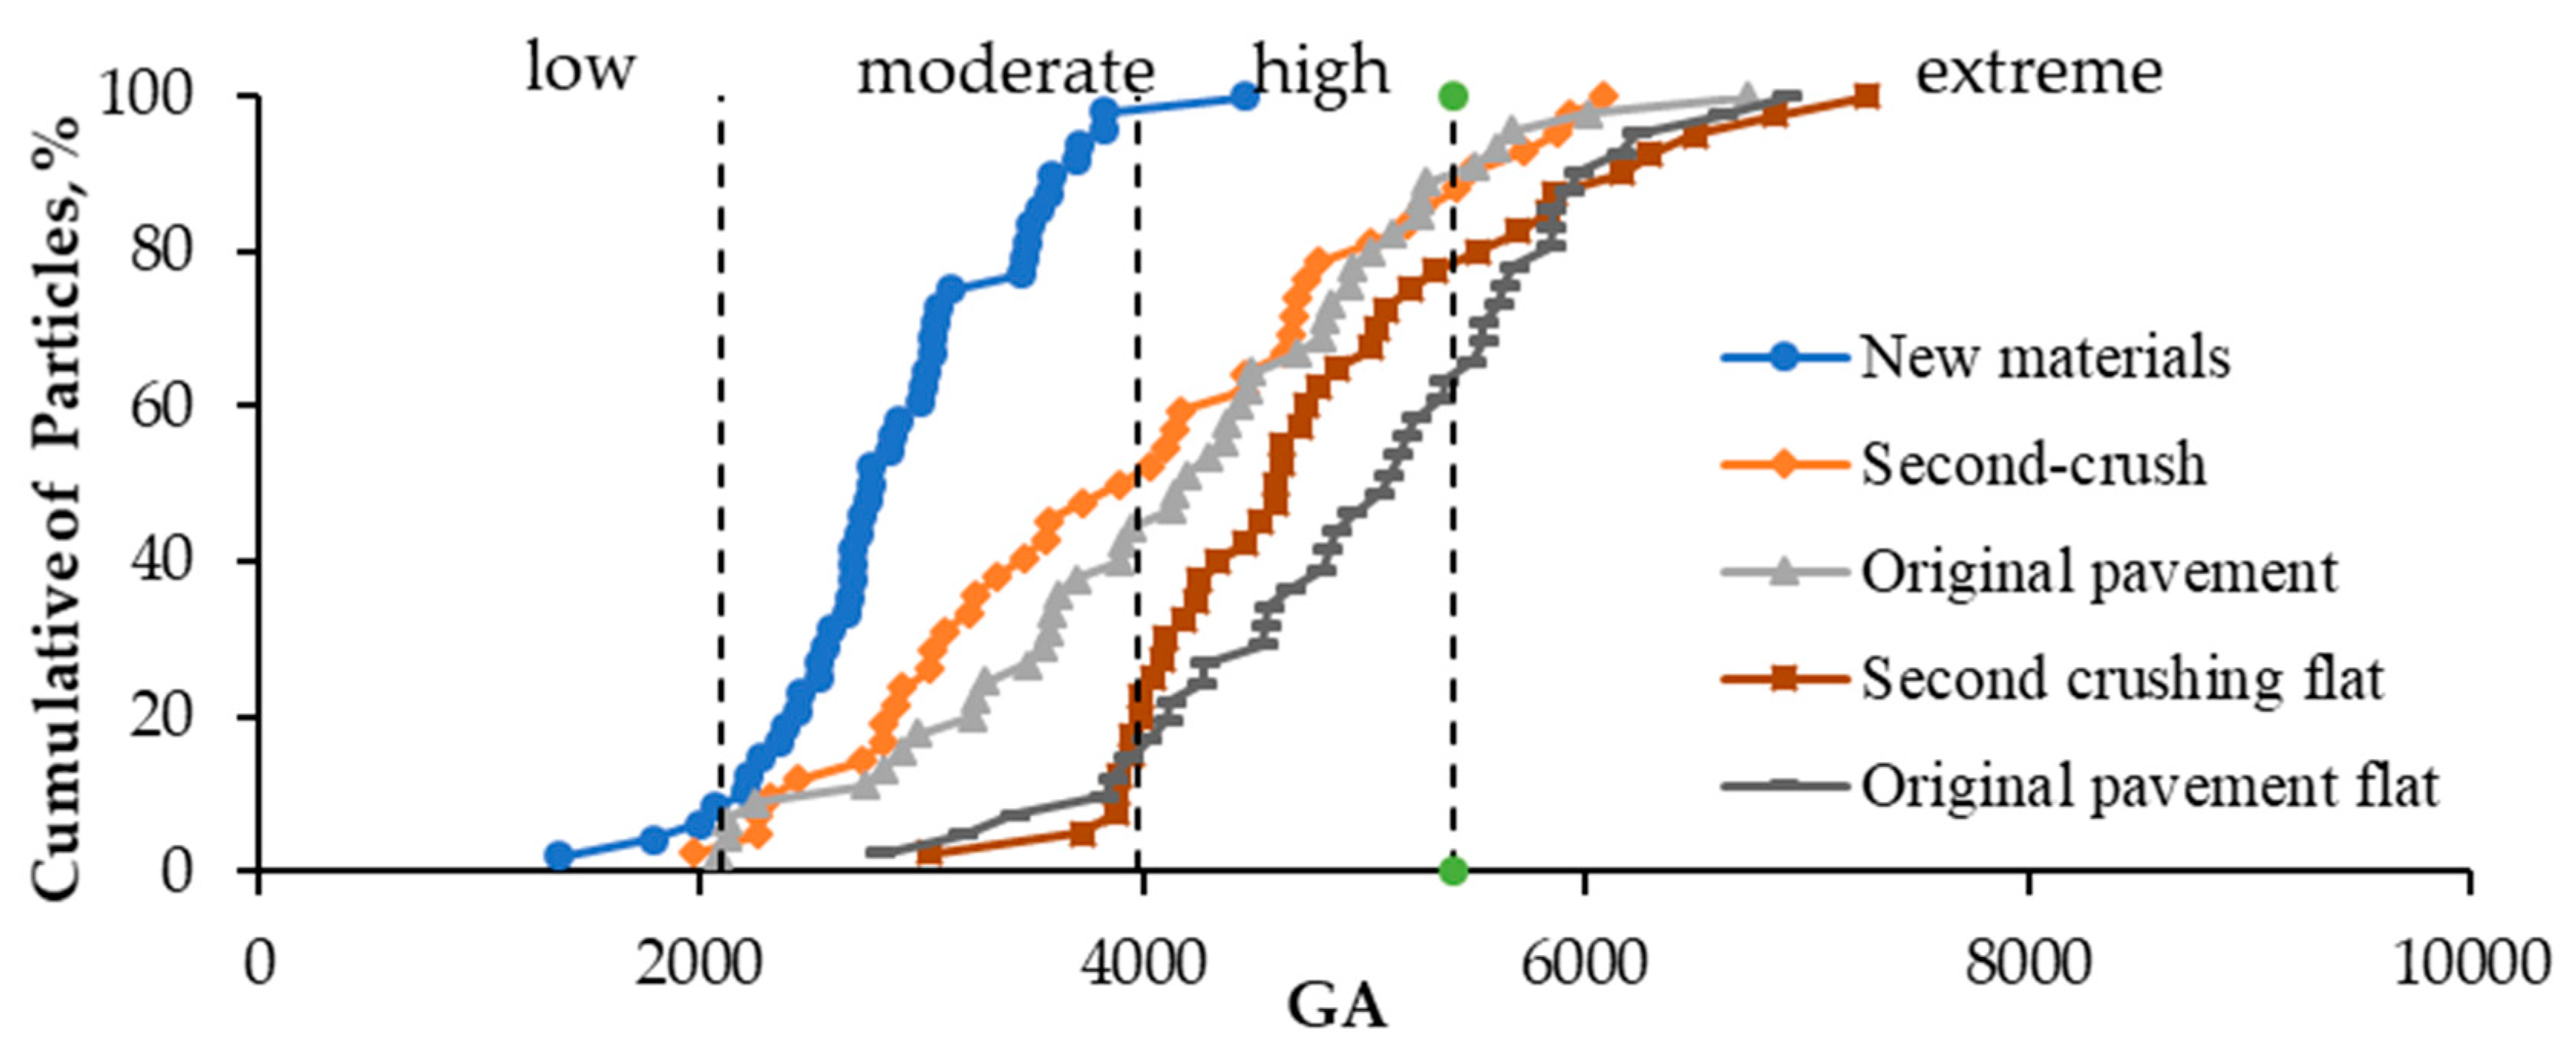
The angularity results of all aggregates are shown in Figure 14. Compared with the new aggregates, the clustering of the old aggregates results in an increase of the edge angle, which makes the RAP aggregates more fragile. RAP aggregates subjected to a secondary crushing can reduce the edge angle to a certain extent, which also accounts for the relatively high clustering stability of the old aggregates. From the results of the angularity test, RAP material particles in a flat shape tend to have a higher edge angle and poorer cluster stability, and thus the edge angle could to some extent represent the clustering degree of RAP materials. The greater the edge angle, the larger the RAP material clustering degree. The worse stability of the cluster could cause gradation variation of rejuvenated RAP material.
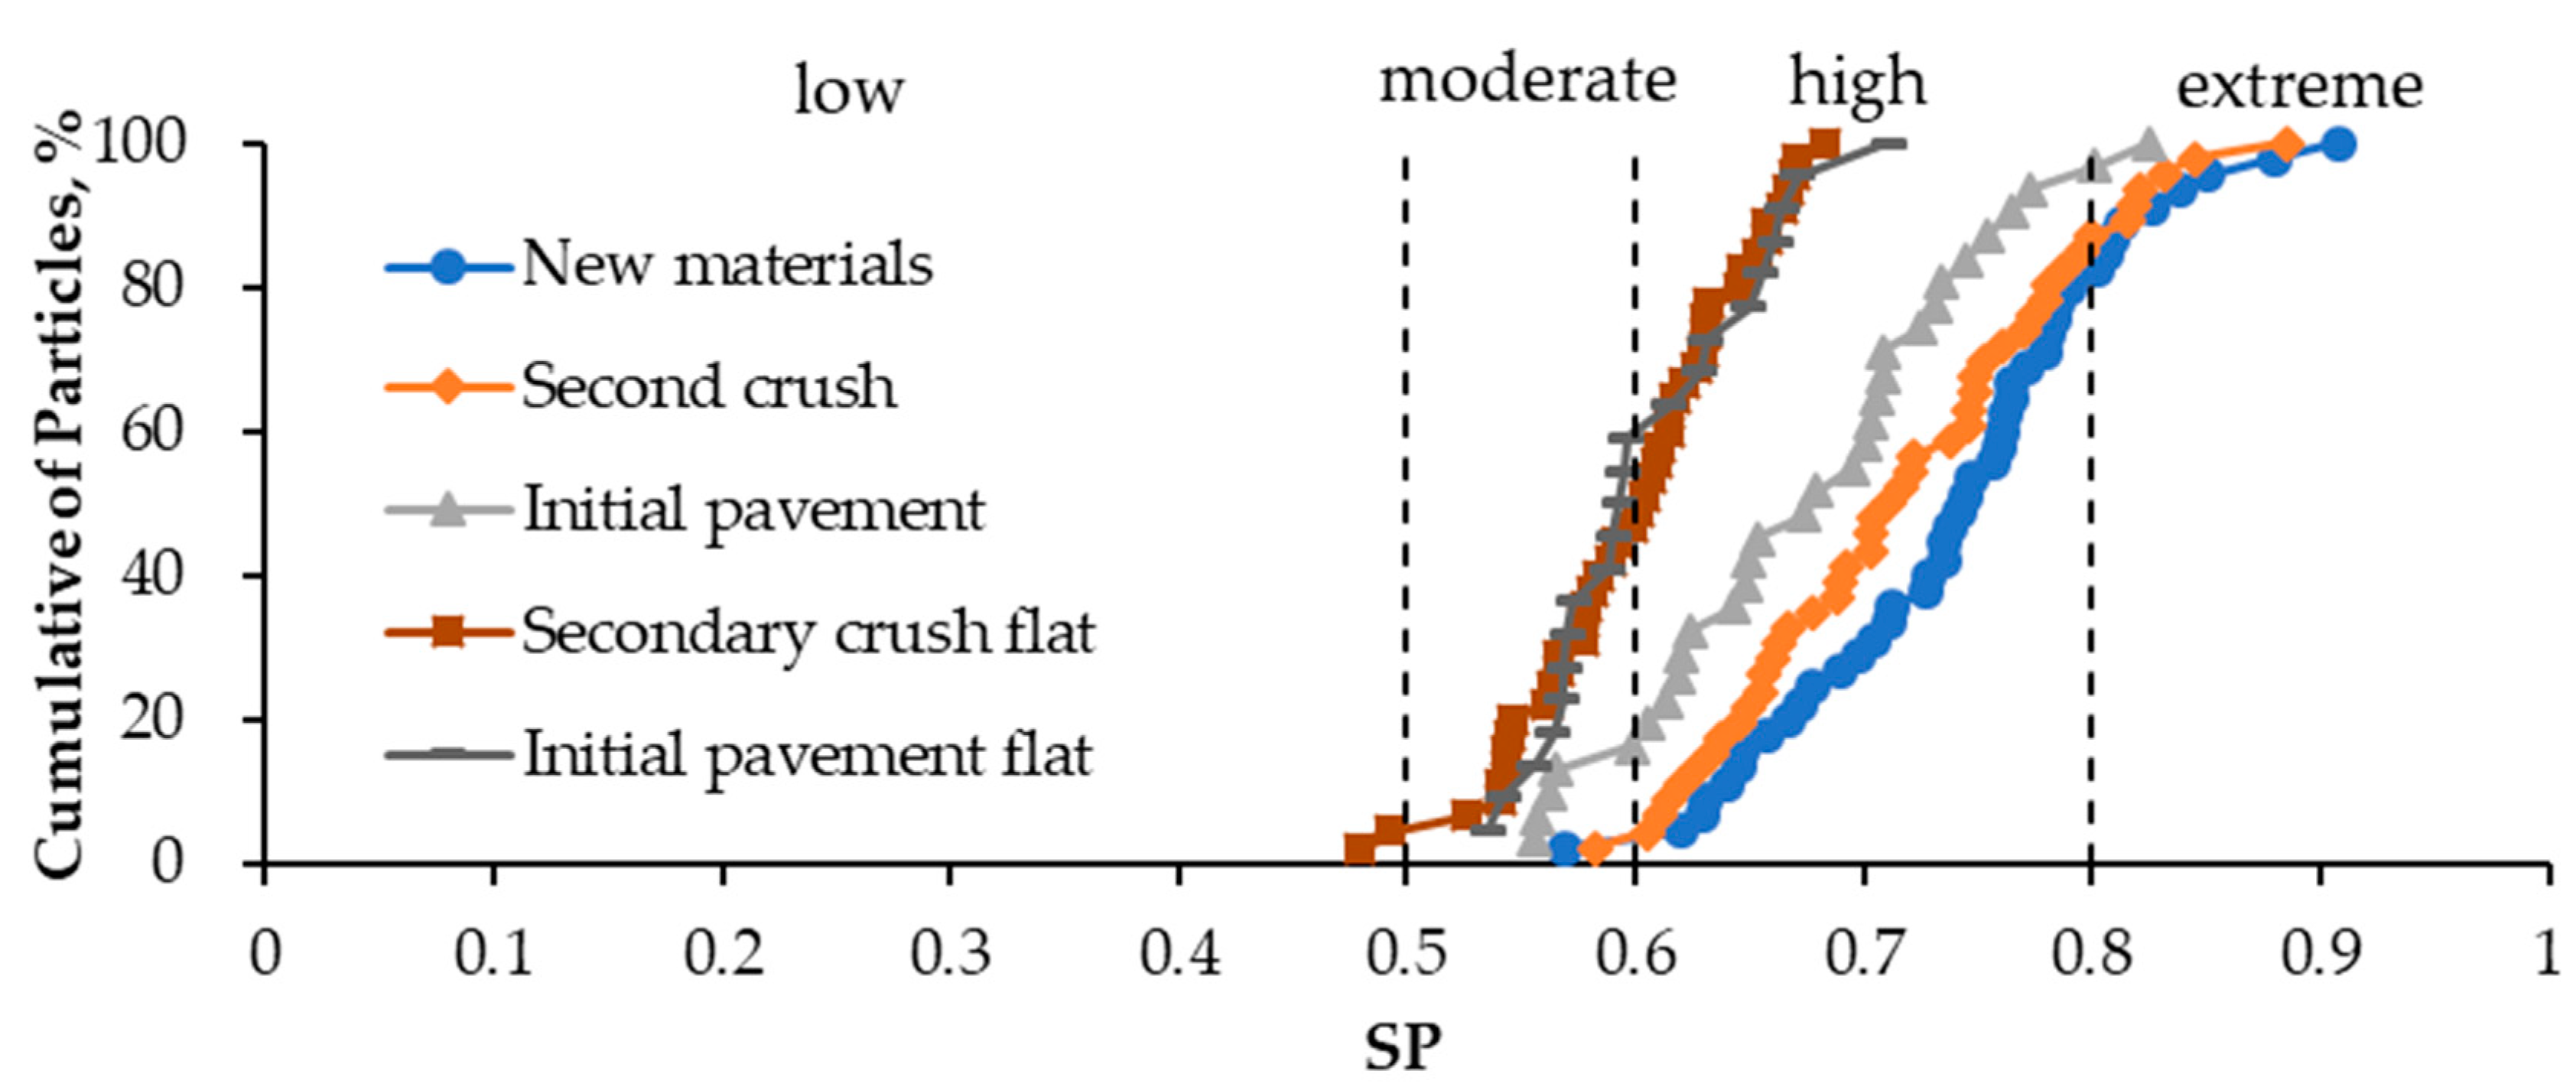
The sphericity results of RAP materials are shown in Figure 15. As is shown in Figure 15, compared with the new materials and the flat shape of the old materials, the sphericity of flat old material is obviously smaller. Given that the old flat particles clustering degree is higher and the clustering stability is poorer, the sphericity index might be used to represent the old materials clustering degree. The smaller the sphericity value is, the higher the RAP material clustering degree and the worse the stability of the cluster will be.
5. Conclusions
The particle clustering phenomena in RAP was one of the most important factors to limit its utilization rate in pavement engineering. In this paper, the clustering characteristics of RAP, such as the particle composition of each particle size, the clustering degree and the clustering stability, were investigated by the extraction test and crushing test. The following conclusions can be drawn:
- (1)
- The cluster phenomenon in RAP occurred mainly in the coarse part (>4.75 mm), and the clustering degree was more serious as the particle size increased. In terms of the RAP particle composition, the cluster of coarse aggregate (>4.75 mm) was mainly composed of its next particle size and 4.75 mm particle size aggregate.
- (2)
- The RAP materials can be divided into three types of structures, namely weak cluster structure, strong cluster structure and old aggregate. The crushing process of RAP can be divided into three stages. The first stage was dominated by weak cluster structure, which was the crushing of the flat, needle-shaped particles; the second stage was dominated by strong cluster structure, which was the crushing of blocky-shaped particles; and the last stage was the crushing of aggregates. It is important to reduce the content of the weak cluster structure, because the clustering degree of the weak cluster structure accounts for the largest part and is more likely to have an adverse effect on gradation variation.
- (3)
- The quantitative indexes, loss rate (PL and CL) and stability index (w), were proved to evaluate the clustering degree, the crushing characteristics and the clustering stability of RAP materials. They provided meaningful references for the comparison of different RAP materials and different crushing processes.
Recommendations for reducing the particle clustering phenomena in RAP:
- (1)
- Due to the high content of 4.75 mm particles, as well as the large clustering degree of particles above 4.75 mm, it is suggested that the coarse aggregate, especially particles of 4.75 mm key sieve size, be fully crushed and broken.
- (2)
- The weak cluster structure in RAP is very fragile, and had a serious impact on the RAP variability. It is suggested that the formation of weak cluster structure should be avoided and the content of the old aggregate particles should be increased in the process of milling and planning. Separating the weak cluster structure, or subject to secondary breaking, could also reduce the variability of RAP.
- (3)
- The method of measuring the proportion of weak cluster, strong cluster and old aggregate in RAP could be used to analyze the advantages and disadvantages of crushing processes. The stability index (w) can be used for quantitative comparison.
Author Contributions
Conceptualization, T.M.; methodology, G.X. and T.M.; validation, G.X. and Z.F.; formal analysis and investigation, T.M and G.X.; resources and data curation, G.X. and W.Z.; writing—original draft preparation, Z.F.; writing—review and editing, G.X.; supervision, T.M and X.H.; project administration, T.M.
Funding
This research was funded by the National Natural Science Foundation of China (grant number 51808116 and 51878164), Natural Science Foundation of Jiangsu Province with grant number BK20180404, and Fundamental Research Funds for the Central Universities, grant number 2242018K40003.
Conflicts of Interest
The authors declare no conflict of interest.
References
- Hassan, K.E.; Brooks, J.J.; Erdman, M. The Use of Reclaimed Asphalt Pavement (RAP) Aggregates in Concrete; Waste Management Series; Elsevier: Harrogate, UK, 2000; Volume 1, pp. 121–128. [Google Scholar]
- Gu, F.; Ma, W.; West, R.C.; Taylor, A.J.; Zhang, Y. Structural performance and sustainability assessment of cold central-plant and in-place recycled asphalt pavements: A case study. J. Clean. Prod. 2019, 208, 1513–1523. [Google Scholar] [CrossRef]
- Zaumanis, M.; Mallick, R.B.; Frank, R. 100% Hot Mix Asphalt Recycling: Challenges and Benefits. Transp. Res. Procedia 2016, 14, 3493–3502. [Google Scholar] [CrossRef] [Green Version]
- Singh, D.; Chitragar, S.F.; Ashish, P.K. Comparison of moisture and fracture damage resistance of hot and warm asphalt mixes containing reclaimed pavement materials. Constr. Build. Mater. 2017, 157, 1145–1153. [Google Scholar] [CrossRef]
- Xu, G.J.; Wang, H. Diffusion and interaction mechanism of rejuvenating agent with virgin and recycled asphalt binder: A molecular dynamics study. Mol. Simul. 2018, 44, 1433–1443. [Google Scholar] [CrossRef]
- Xu, G.J.; Wang, H. Molecular dynamics study of oxidative aging effect on asphalt binder properties. Fuel 2017, 188, 1–10. [Google Scholar] [CrossRef]
- Hou, S.; Chen, C.; Zhang, J.; Shen, H.; Gu, F. Thermal and mechanical evaluations of asphalt emulsions and mixtures for microsurfacing. Constr. Build. Mater. 2018, 191, 1221–1229. [Google Scholar] [CrossRef]
- Sheng, X.H.; Wang, M.; Xu, T.; Chen, J. Preparation, properties and modification mechanism of polyurethane modified emulsified asphalt. Constr. Build. Mater. 2018, 189, 375–383. [Google Scholar] [CrossRef]
- Niazi, Y.; Jalili, M. Effect of Portland cement and lime additives on properties of cold in-place recycled mixtures with asphalt emulsion. Constr. Build. Mater. 2009, 23, 1338–1343. [Google Scholar] [CrossRef]
- Farooq, M.A.; Mir, M.S. Use of reclaimed asphalt pavement (RAP) in warm mix asphalt (WMA) pavements—A review. Innov. Infrastruct. Solut. 2017, 2, 10. [Google Scholar] [CrossRef]
- Tang, S.; Williams, R.C.; Cascione, A. Reconsideration of the fatigue tests for asphalt mixtures and binders containing high percentage RAP. Int. J. Pavement Eng. 2017, 18, 443–449. [Google Scholar] [CrossRef]
- Fakhri, M.; Hosseini, S.A. Laboratory evaluation of rutting and moisture damage resistance of glass fiber modified warm mix asphalt incorporating high RAP proportion. Constr. Build. Mater. 2017, 134, 626–640. [Google Scholar] [CrossRef]
- Stimilli, A.; Virgili, A.; Giuliani, F.; Canestrari, F. Mix design validation through performance-related analysis of in plant asphalt mixtures containing high RAP content. Int. J. Pavement Res. Technol. 2017, 10, 23–37. [Google Scholar] [CrossRef] [Green Version]
- Mučinis, D.; Sivilevičius, H.; Oginskas, R. Factors determining the inhomogeneity of reclaimed asphalt pavement and estimation of its components content variation parameters. Baltic J. Road Bridge Eng. 2009, 4, 69–79. [Google Scholar]
- Sivilevičius, H.; Bražiūnas, J.; Prentkovskis, O. Technologies and principles of hot recycling and investigation of preheated reclaimed asphalt pavement batching process in an asphalt mixing plant. Appl. Sci. 2017, 7, 1104. [Google Scholar] [CrossRef]
- Lu, D.X.; Saleh, M.; Nguyen, N.H.T. Effect of rejuvenator and mixing methods on behaviour of warm mix asphalt containing high RAP content. Constr. Build. Mater. 2019, 197, 792–802. [Google Scholar] [CrossRef]
- Ding, X.H.; Ma, T.; Huang, X.M. Discrete-Element Contour-Filling Modeling Method for Micro-and Macro- Mechanical Analysis of Aggregate Skeleton of Asphalt Mixture. J. Transp. Eng. Part B Pavements 2019, 145, 04018056. [Google Scholar] [CrossRef]
- Bressi, S.; Dumont, A.G.; Pittet, M. Cluster phenomenon and partial differential aging in RAP mixtures. Constr. Build. Mater. 2015, 99, 288–297. [Google Scholar] [CrossRef]
- Bressi, S.; Pittet, M.; Dumont, A.G.; Partl, M.N. A framework for characterizing RAP clustering in asphalt concrete mixtures. Constr. Build. Mater. 2016, 106, 564–574. [Google Scholar] [CrossRef]
- Zaumanis, M.; Oga, J.; Haritonovs, V. How to reduce reclaimed asphalt variability: A full-scale study. Constr. Build. Mater. 2018, 188, 546–554. [Google Scholar] [CrossRef]
- Bressi, S.; Cavalli, M.C.; Partl, M.N.; Tebaldi, G.; Dumont, A.G.; Poulikakos, L.D. Particle clustering phenomena in hot asphalt mixtures with high content of reclaimed asphalt pavements. Constr. Build. Mater. 2015, 100, 207–217. [Google Scholar] [CrossRef]
- Nazzal, M.D.; Mogawer, W.; Austerman, A.; Qtaish, L.A.; Kaya, S. Multi-scale evaluation of the effect of rejuvenators on the performance of high RAP content mixtures. Constr. Build. Mater. 2015, 101, 50–56. [Google Scholar] [CrossRef]
- Kou, C.; Xiao, P.; Kang, A.; Mikhailenko, P.; Baaj, H.; Wu, Z. Methods to evaluate the aging grades of reclaimed asphalt binder. Appl. Sci. 2017, 7, 1209. [Google Scholar] [CrossRef]
- Xu, T.; Wang, Y.; Xia, W.; Hu, Z. Effects of flame retardants on thermal decomposition of SARA fractions separated from asphalt binder. Constr. Build. Mater. 2018, 173, 209–219. [Google Scholar] [CrossRef]
- Shen, W.; Shan, L.; Zhang, T.; Ma, H.; Cai, Z.; Shi, H. Preparation and Effectiveness of Composite Phase Change Material for Performance Improvement of Open Graded Friction Course. J. Clean. Prod. 2019, 214, 259–269. [Google Scholar]
- Moghaddam, T.B.; Baaj, H. The use of rejuvenating agents in production of recycled hot mix asphalt: A systematic review. Constr. Build. Mater. 2016, 114, 805–816. [Google Scholar] [CrossRef]
- Shannon, C.; Mokhtari, A.; Lee, H.D.; Tang, S.; Williams, C.; Schram, S. Effects of high reclaimed asphalt-pavement content on the binder grade, fatigue performance, fractionation process, and mix design. J. Mater. Civ. Eng. 2016, 29, 04016218. [Google Scholar] [CrossRef]
- Pan, P.; Kuang, Y.; Hu, X.; Zhang, X. A comprehensive evaluation of rejuvenator on mechanical properties, durability, and dynamic characteristics of artificially aged asphalt mixture. Materials 2018, 11, 1554. [Google Scholar] [CrossRef]
- Ding, X.H.; Ma, T.; Gao, W. Morphological characterization and mechanical analysis for coarse aggregate skeleton of asphalt mixture based on discrete-element modeling. Constr. Build. Mater. 2017, 154, 1048–1061. [Google Scholar] [CrossRef]
- Bessa, I.S.; Castelo Branco, V.T.F.; Soares, J.B. Evaluation of polishing and degradation resistance of natural aggregates and steel slag using the aggregate image measurement system. Road Mater. Pavement Des. 2014, 15, 385–405. [Google Scholar] [CrossRef]
- Bazzaz, M.; Darabi, M.K.; Little, D.N.; Garg, N. A straightforward procedure to characterize nonlinear viscoelastic response of asphalt concrete at high temperatures. Transp. Res. Rec. 2018, 2672, 481–492. [Google Scholar] [CrossRef]
- Li, J.; Zhang, J.; Qian, G.; Zheng, J.; Zhang, Y. Three-Dimensional Simulation of Aggregate and Asphalt Mixture Using Parameterized Shape and Size Gradation. J. Mater. Civ. Eng. 2019, 31, 04019004. [Google Scholar] [CrossRef]
- Pouranian, M.R.; Haddock, J.E. Determination of voids in the mineral aggregate and aggregate skeleton characteristics of asphalt mixtures using a linear-mixture packing model. Constr. Build. Mater. 2018, 188, 292–304. [Google Scholar] [CrossRef]
- Salemi, M.; Wang, H. Image-aided random aggregate packing for computational modeling of asphalt concrete microstructure. Constr. Build. Mater. 2018, 177, 467–476. [Google Scholar] [CrossRef]
Figure 1.
Percentage retained of reclaimed asphalt pavement (RAP) 1 and RAP 2 before and after extraction.
Figure 1.
Percentage retained of reclaimed asphalt pavement (RAP) 1 and RAP 2 before and after extraction.

Figure 2.
Samples before and after the Cantabro-crushing test, (a) Cantabro-crushing test apparatus; (b) Samples before the test; (c) Samples after the test.
Figure 2.
Samples before and after the Cantabro-crushing test, (a) Cantabro-crushing test apparatus; (b) Samples before the test; (c) Samples after the test.

Figure 3.
A flow chart of the evaluation method.

Figure 4.
The Percentage Retained of Each Sieve after the Extraction Test, (a) 2.36 mm sieve; (b) 4.75 mm sieve; (c) 9.5 mm sieve; (d) 13.2mm sieve; (e) 16 mm sieve; (f) 19 mm sieve.
Figure 4.
The Percentage Retained of Each Sieve after the Extraction Test, (a) 2.36 mm sieve; (b) 4.75 mm sieve; (c) 9.5 mm sieve; (d) 13.2mm sieve; (e) 16 mm sieve; (f) 19 mm sieve.


Figure 5.
Percentage Loss (PL) Rate of Each Particle Size after Extraction Test.

Figure 6.
Effect of Revolutions on the Crushing Loss Rate of RAP 1.

Figure 7.
Effect of Revolutions on the Crushing Loss Rate of RAP 2.

Figure 8.
Three Different Cluster Structures of RAP.

Figure 9.
The Crushing Loss Rate of the Three Kinds of Structures.

Figure 10.
The Percentage Retained of Three Kinds of Structures after the Extraction Test.

Figure 11.
Percentage Loss (PL) Rate of RAP material.

Figure 12.
Crushing Loss rate of old (a) Open Graded Friction Course (OGFC) materials; (b) Stone Mastic Asphalt (SMA) materials.
Figure 12.
Crushing Loss rate of old (a) Open Graded Friction Course (OGFC) materials; (b) Stone Mastic Asphalt (SMA) materials.

Figure 13.
Stability Index of old OGFC and SMA materials.

Figure 14.
Comparison of edge angle between new and RAP materials.

Figure 15.
Comparison of Sphericity between new and RAP materials.


Table 1.
The Stability Index (w) of Two Kinds of RAP Materials.
| Revolutions | w | |
|---|---|---|
| RAP 1 | 50 r | 53.59% |
| 100 r | 42.54% | |
| 200 r | 36.64% | |
| 300 r | 31.85% | |
| RAP 2 | 50 r | 65.09% |
| 100 r | 57.01% | |
| 200 r | 47.98% | |
| 300 r | 41.23% |
Table 2.
The Proportion of Three Kinds of Structures (16–19 mm).
| Number | 1 | 2 | 3 | 4 | 5 | Average |
|---|---|---|---|---|---|---|
| Weak cluster structure | 36.06% | 36.61% | 33.10% | 38.13% | 34.03% | 35.58% |
| Strong cluster structure | 45.29% | 42.41% | 48.53% | 41.43% | 43.66% | 44.27% |
| Old aggregate | 18.65% | 20.98% | 18.37% | 20.44% | 22.32% | 20.15% |
© 2019 by the authors. Licensee MDPI, Basel, Switzerland. This article is an open access article distributed under the terms and conditions of the Creative Commons Attribution (CC BY) license (http://creativecommons.org/licenses/by/4.0/).
Share and Cite
MDPI and ACS Style
Xu, G.; Ma, T.; Fang, Z.; Huang, X.; Zhang, W. The Evaluation Method of Particle Clustering Phenomena in RAP. Appl. Sci. 2019, 9, 424. https://0-doi-org.brum.beds.ac.uk/10.3390/app9030424
AMA Style
Xu G, Ma T, Fang Z, Huang X, Zhang W. The Evaluation Method of Particle Clustering Phenomena in RAP. Applied Sciences. 2019; 9(3):424. https://0-doi-org.brum.beds.ac.uk/10.3390/app9030424
Chicago/Turabian StyleXu, Guangji, Tao Ma, Zhanyong Fang, Xiaoming Huang, and Weiguang Zhang. 2019. "The Evaluation Method of Particle Clustering Phenomena in RAP" Applied Sciences 9, no. 3: 424. https://0-doi-org.brum.beds.ac.uk/10.3390/app9030424
Note that from the first issue of 2016, this journal uses article numbers instead of page numbers. See further details here.