Process Simulation and Economic Evaluation of Bio-Oil Two-Stage Hydrogenation Production

1
College of Chemistry and Molecular Engineering, Zhengzhou University, Zhengzhou 450001, China
2
Environmental Chemistry & Low Carbon Technologies Key Lab of Henan Province, Zhengzhou 450001, China
3
Department of Chemical and Process Engineering, University of Canterbury, Christchurch 8083, New Zealand
*
Author to whom correspondence should be addressed.
Appl. Sci. 2019, 9(4), 693; https://0-doi-org.brum.beds.ac.uk/10.3390/app9040693
Submission received: 19 January 2019
/
Revised: 6 February 2019
/
Accepted: 13 February 2019
/
Published: 18 February 2019
(This article belongs to the Special Issue New Carbon Materials from Biomass and Their Applications)
Abstract
:Featured Application
The developed process simulation model is used for economical analysis of a two-stage hydrogenation of the bio-oil process, it is also adaptable for simulation and performance evaluation of process with various types of feedstocks. As the catalytic reaction mechanisms and catalysts coking deactivation kinetics are embedded, its specialty is to simulate and evaluate the process with large catalyst usage or significant catalyst decay.
Abstract
Bio-oil hydrogenation upgrading process is a method that can convert crude bio-oil into high-quality bio-fuel oil, which includes two stages of mild and deep hydrogenation. However, coking in the hydrogenation process is the key issue which negatively affects the catalyst activity and consequently the degree of hydrogenation in both stages. In this paper, an Aspen Plus process simulation model was developed for the two-stage bio-oil hydrogenation demonstration plant which was used to evaluate the effect of catalyst coking on the bio-oil upgrading process and the economic performance of the process. The model was also used to investigate the effect of catalyst deactivation caused by coke deposition in the mild stage. Three reaction temperatures in the mild stage (250 °C, 280 °C, and 300 °C) were considered. The simulation results show that 45% yield of final product is obtained at the optimal reaction condition which is 280 °C for the mild stage and 400 °C for the deep stage. Economic analysis shows that the capital cost of industrial production is $15.2 million for a bio-oil upgrading plant at a scale of 107 thousand tons per year. The operating costs are predicted to be $1024.27 per ton of final product.

1. Introduction
As a renewable energy source, biomass contributes about 15% to the total global energy consumption. In China, a traditional agricultural country, the use of straw, sugar cane, and rice husk has great potential for future energy and fuels [1]. It is reported that total agricultural and forestry waste in China reaches 1.5 billion tons per year, of which straw has attracted increasing interests due to environmental concerns as most of it is burned on farmland. If straw were used, the bioenergy from available sources would be equivalent to 180 million tons of standard coal [2]. If one takes into account the CO2 uptake by plants during growth and supposes that the biomass is processed efficiently for energy and fuels, CO2 emissions can be reduced by about 90% compared with fossil energy [3]. There are various processes for converting biomass to energy and fuels including thermochemical processes and bioprocesses. It is believed that the thermochemical processes, including combustion, gasification pyrolysis, and liquefaction, are most promising in the short and medium terms of 5 to 10 years [4]. In recent years, extensive studies have been reported on the commercialization of these technologies [5]. However, most of these studies were conducted at pilot or demonstration scales due to the difficulties and challenges in constructing full commercial-scale plants.
Aspen Plus, a large-scale chemical process simulation software, has been widely used in the design and optimization of unit operation devices such as distillation, absorption, and gas fractionation in chemical processes. Optimizing and improving the production itself using the software’s own analysis tools (sensitivity analysis, design regulations, etc.) can reduce costs for capital and operation, in addition to saving energy and avoiding negative impacts on the environment. Based on the experimental studies carried out on the fast pyrolysis process of biomass, Susanne et al. [6,7] carried out a simulation design for the process of hydrogenation of bio-oil to biodiesel. In these studies, the simulation of the whole process from raw biomass materials through pyrolysis, bio-oil hydrogenation to transportation fuel was established. Atsonios et al. [8] also conducted research on the hydrotreating of pyrolysis oil produced by the co-pyrolysis of coal and biomass. They used specific components of the oil including anisole, guaiacol, acetic acid, ethylene, and furan as model compounds to represent the pyrolysis oils. The effect of the co-pyrolysis, hydrogenation, catalytic reforming hydrogen production, and coke combustion on the overall process was investigated. In a separate study, Wright et al. [9] simulated the hydrogenation process of bio-oil produced by the rapid pyrolysis of cornstalk, and conducted economic and technical assessments of the entire process. It is found that hydrogen sources have significant impacts which include hydrogen production from reforming part of the pyrolysis bio-oil and hydrogen purchased from the commercial process of natural gas reforming. The results show that if the hydrogen is obtained from reforming pyrolysis bio-oil, the final liquid product yield has the greatest impact on the whole process economy. However, if the hydrogen is purchased from the commercial process, the biomass raw material price has the greatest impact on the entire process economy.
In this study, an Aspen Plus-based process model was established to simulate the two stages of bio-oil hydrogenation. The unique feature of the model was that it considered intrinsic reaction kinetics of catalyst coking deactivation in the first mild stage and the influences of the whole production process. The model also included material mass balance and energy balance in the bio-oil hydrogenation process under different reaction conditions. The process was finally optimized based on economic analysis to achieve the lowest operating costs and the lowest capital costs.
2. Development of a Process Model for Two-Stage Bio-Oil Hydrogenation (HDO)
2.1. Specification of Compounds from Bio-Oil
A process model was developed by using Aspen Plus to simulate the process of two-stage bio-oil hydrogenation. According to the properties of raw bio-oil and products shown in Table 1, and for simulation purposes, the hundreds of substances presenting bio-oil and products were therefore divided into 9 model components according to the reported study [10]: (1) BIO-OIL (organic compounds of raw bio-oil, CH1.47O0.56); (2) H2; (3) ODF (oil-phase organic compounds of mild stage, CH1.47O0.11); (4) AQO (aqueous phase organic compounds of mild stage, CH3.02O1.09); (5) CO2; (6) H2O; (7) COKES (soluble coke deposit, Cs); (8) COKEIS (insoluble coke deposit, Cis); and (9) PRODUCT (model compound that represents the final product of bio-fuel, with same properties of gasoline, CH1.71). Model compounds were selected from the Aspen Plus database to represent the above-mentioned substances in the bio-oil and the upgraded products [11]. The developed HDO process model is adaptable for different types of bio-oil feedstock with given properties and reaction kinetic parameters.
2.2. Process Setup
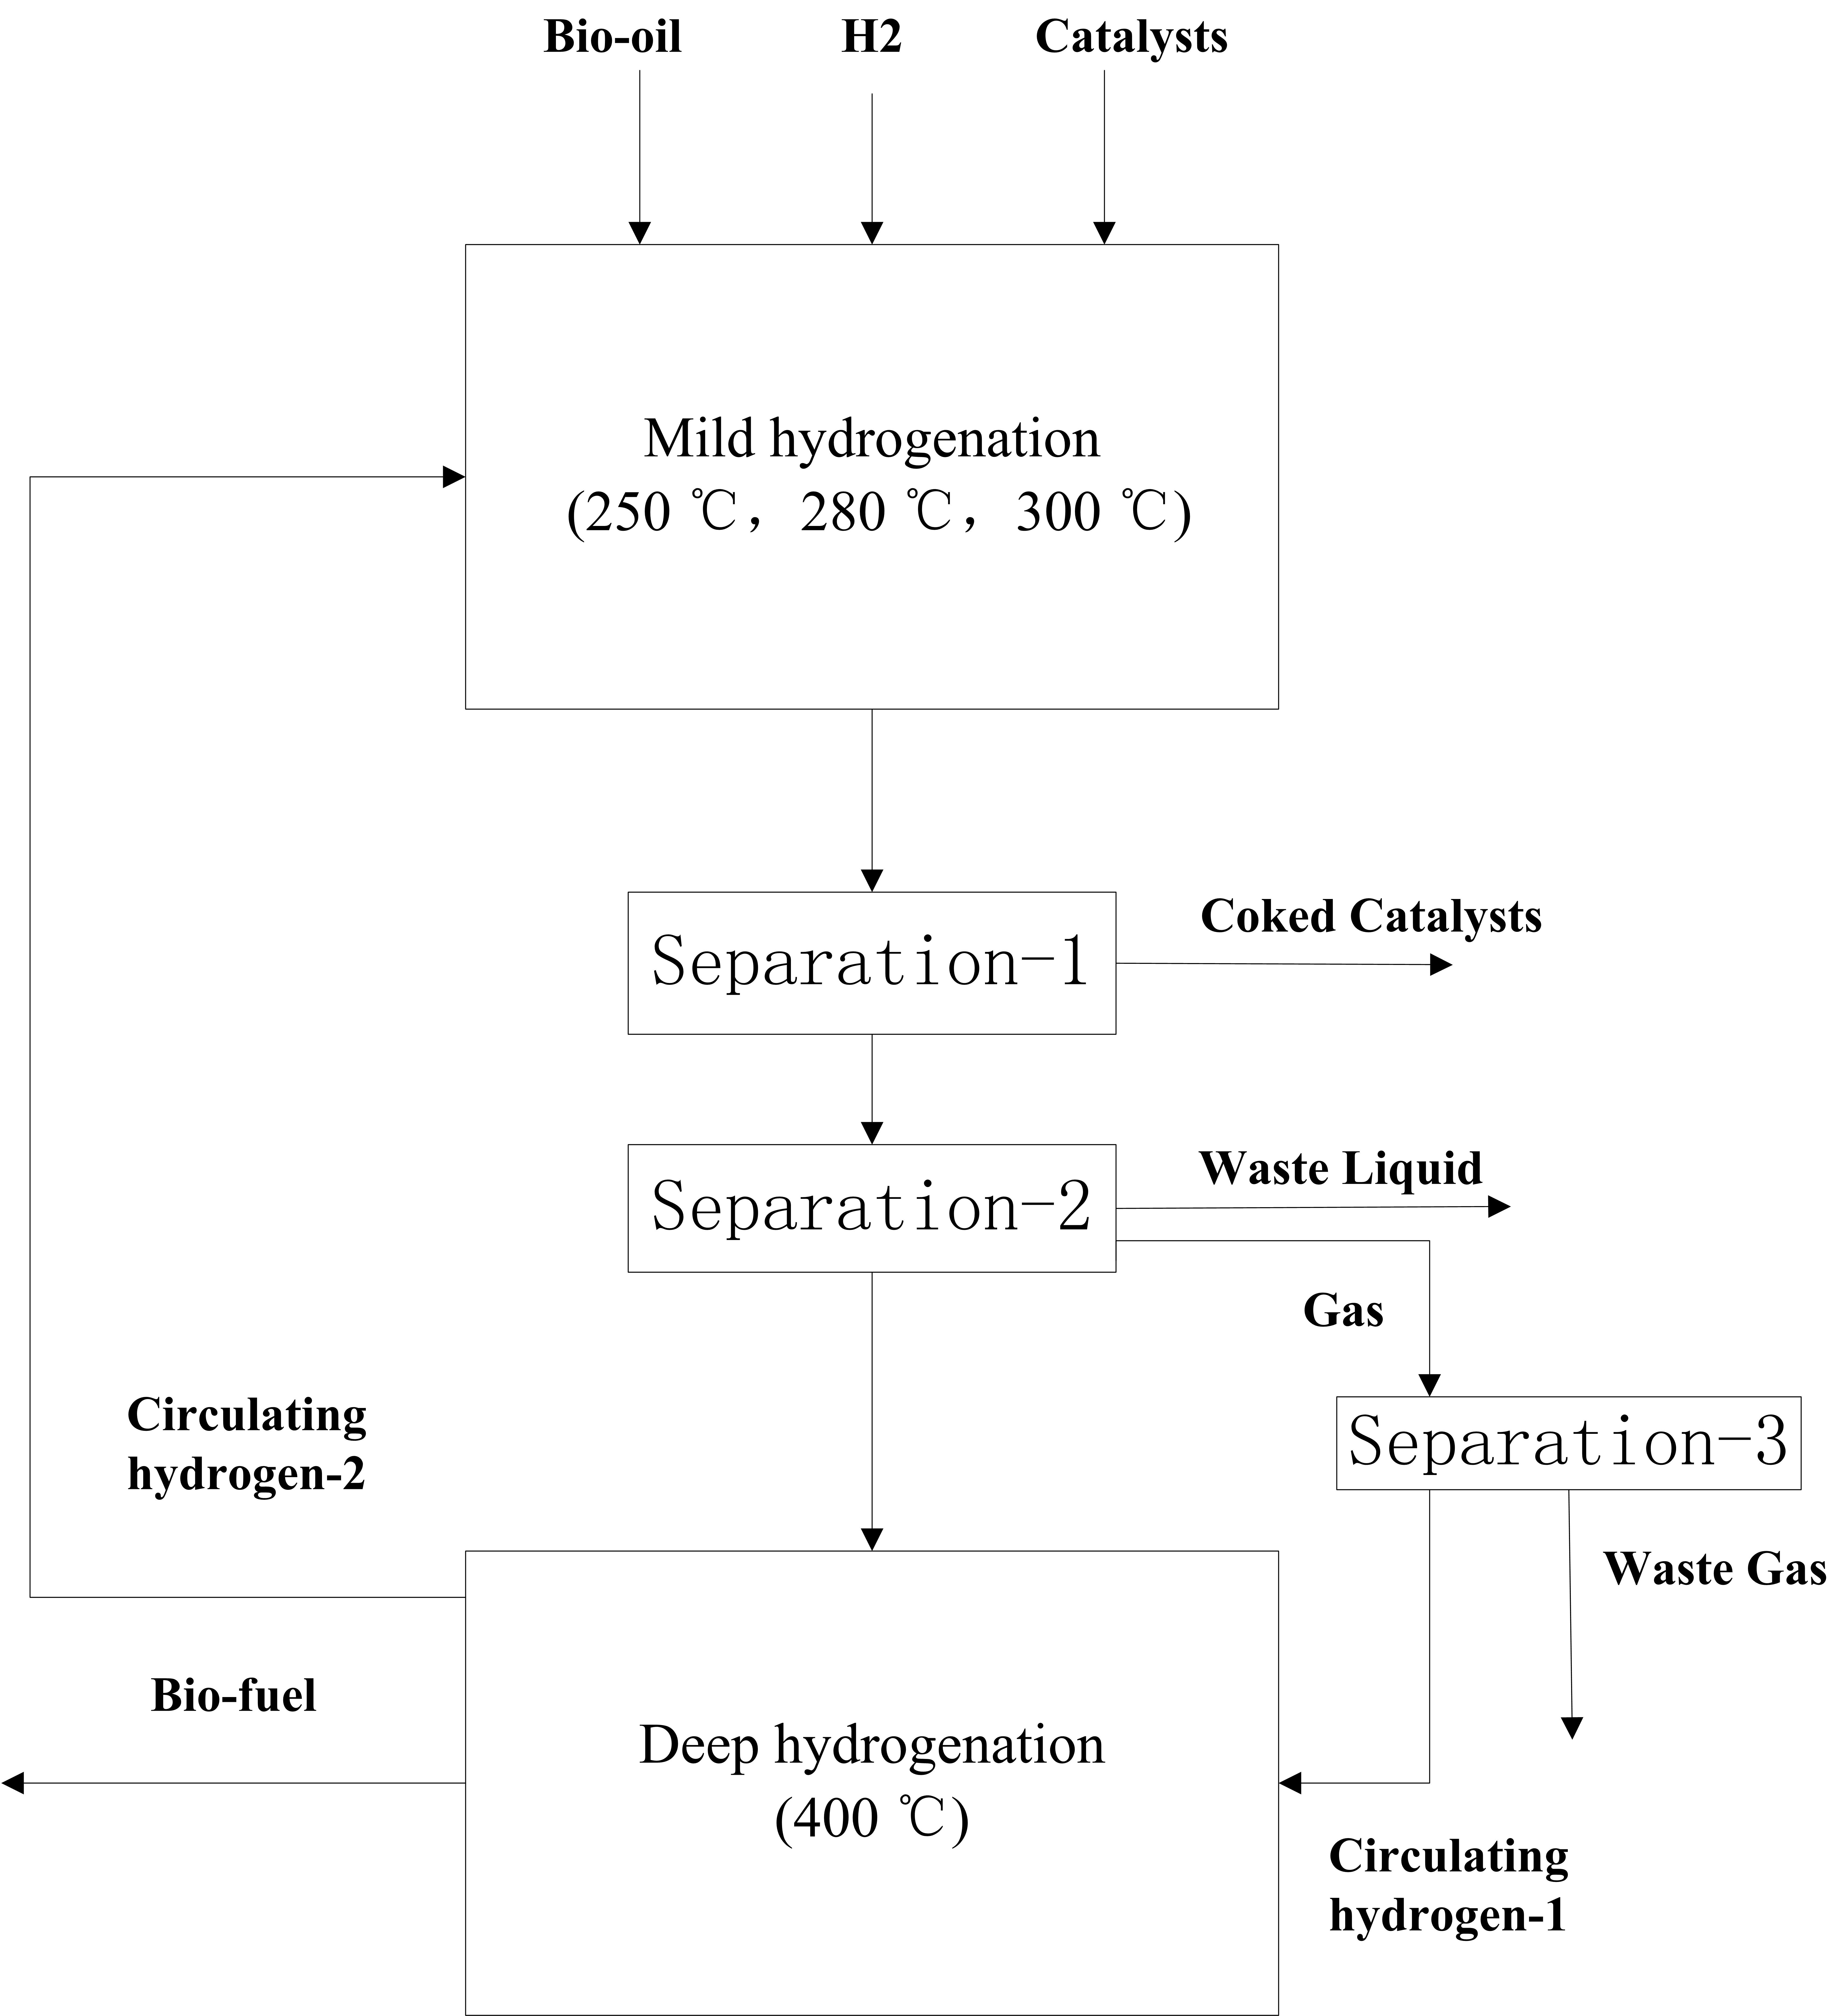
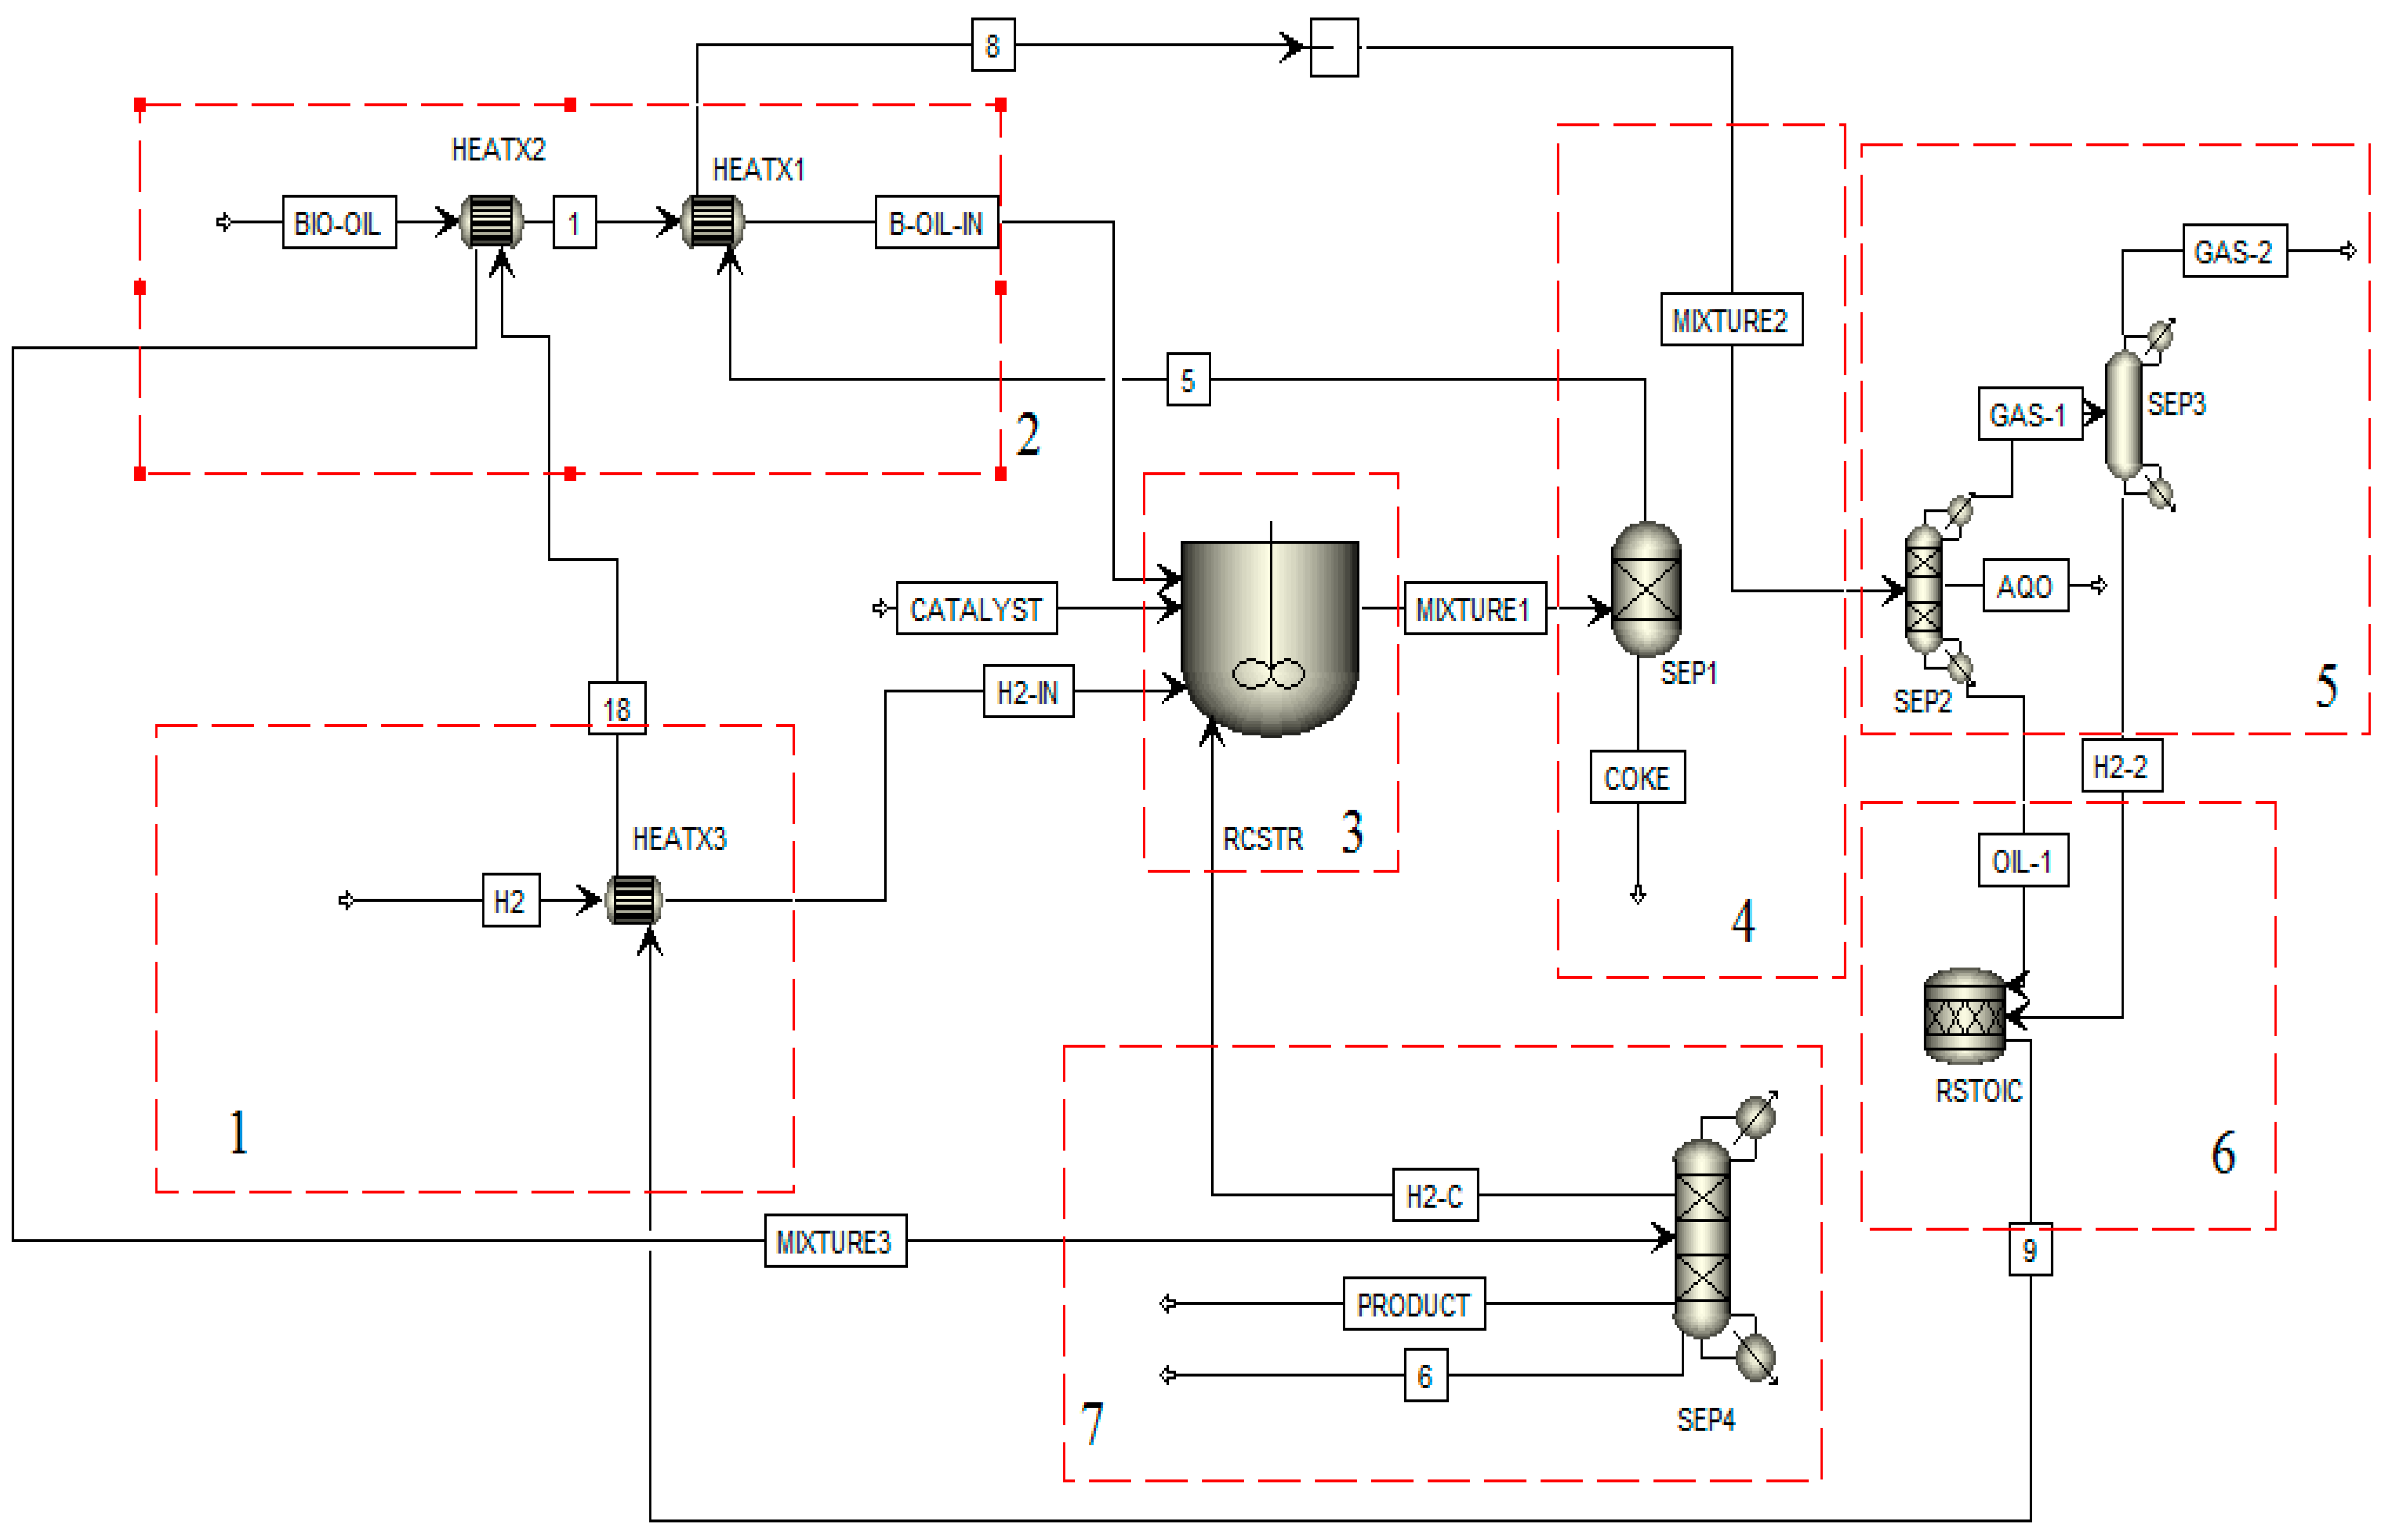
As discussed above, the whole HDO process was divided into two main stages which included a mild hydrogenation stage and a subsequent deep hydrogenation stage. The system flow diagram for the bio-oil hydrogenation process is shown in Figure 1 and Figure 2. The whole HDO process consists of seven unit operations: (1) hydrogen preheating; (2) bio-oil preheating; (3) mild hydrogenation reactor; (4) mild hydrogenation product solid–liquid separation; (5) mild hydrogenation product liquid–gas separation; (6) deep hydrogenation reaction; and (7) product cooling and pressure separation.
The organic compounds of raw bio-oil (BIO-OIL), hydrogen (H2-1), and the catalyst (CATALYST) are treated as input parameters under normal conditions that are first preheated by the stream (MIXTURE3) and then continuously fed into the first stage HDO, or the mild hydrogenation reactor (RCSTR). According to the reported research and experimental data, operating temperature for the mild hydrogenation reactor of raw bio-oil is set at 250 °C, 280 °C, and 300 °C, respectively. The kinetic reactions added to this RCSTR reactor include the main bio-oil hydrogenation reaction plus side reactions of the catalyst coking [12].
The product stream (MIXTURE1) from mild hydrogenation reactor first enters a solid-fluidized bed separator (SEP-1) to remove the used catalysts (with soluble and insoluble coke deposits), and the liquid product then flows into a three-phase separator (SEP-2) to be separated into: (1) water and aqueous phase organic compounds (AQO) formed during the hydrogenation reaction; (2) the unreacted bio-oil with an oil-phase organic compound (ODF); and (3) a mixture of gaseous products and unreacted hydrogen (GAS-1). The organic compound (ODF) and unreacted hydrogen (H2-2) are separated from stream (GAS-1) and then fed into the secondary hydrogenation reactor (RSTOIC) for the deep hydrogenation. The product stream (MIXTURE3) is separated after the heat exchanger. Excessive hydrogen (H2-C) from the deep hydrogenation is continuously recycled and fed to the mild reactor. The heat recovery of the process is achieved by a series of heat exchangers between process streams and feedstock, and the only unit operation that requires external heat supply within the entire process is the secondary hydrogenation reactor.
2.3. Determination of Properties of Bio-Oil and Upgraded Products
The bio-oil and its upgraded product components in this study are complicated, mostly non-polar mixtures of acids, substances, aldehydes, ethers, and alcohols. Therefore, the PR-BM method was chosen in Aspen Plus to determine the chemical and physical properties for both bio-oil and its upgraded products.
2.4. Input Parameters for Plant Operation and Simulation of Hydrogenation Upgrading of Bio-Oil
The annual throughput of the demonstration plant in this case study was set at 107 thousand tons per year of raw bio-oil. Therefore, the input flow rates of feedstock materials were set as follows: 10,000 kg/h for the organic compounds of raw bio-oil (BIO-OIL), 345 kg/h for the hydrogen (H2), and 10 kg/h for the fresh catalyst feed (CATALYST). Catalyst loading in the reactor (RCSTR) was 200 kg. The ratios among the feed streams were selected from reported values [13]. The Ni-based commercial catalysts were used in the mild stage of hydrogenation (HDO). Three sets of operating conditions for mild HDO step were assessed which were, respectively, (1) 250 °C, 5.6 MPa; (2) 280 °C, 8 MPa; and (3) 300 °C, 10 MPa. The optimum reaction conditions were eventually selected according to the desired product yield.
According to the theory of mild hydrogenation kinetics, the chemical conversion reactions among the components was established [10]. The model for the conversion of the catalytic bio-oil hydrogenation process was obtained by fitting the experimental data of product distribution and catalyst deactivation in the small industrial reaction [14]. The pre-exponential factor A and the activation energy E in the chemical reactions were obtained from the previous study on kinetic modeling of the bio-oil hydrogenation from which the parameters of the mild-stage reactions were fitted. Their values are given in Table 2, with the parameter setting of reaction conditions as described above.
The deactivation rate of the catalyst is defined as follows:
where mcat is the total mass of the catalyst at a given time and mcat,f is the mass of fresh catalyst. The relationship between the deactivation rate of the catalyst and catalyst coking has been derived from coking theory [14] and experimental results of the batch hydrogenation reactor [15] and is expressed as follows:
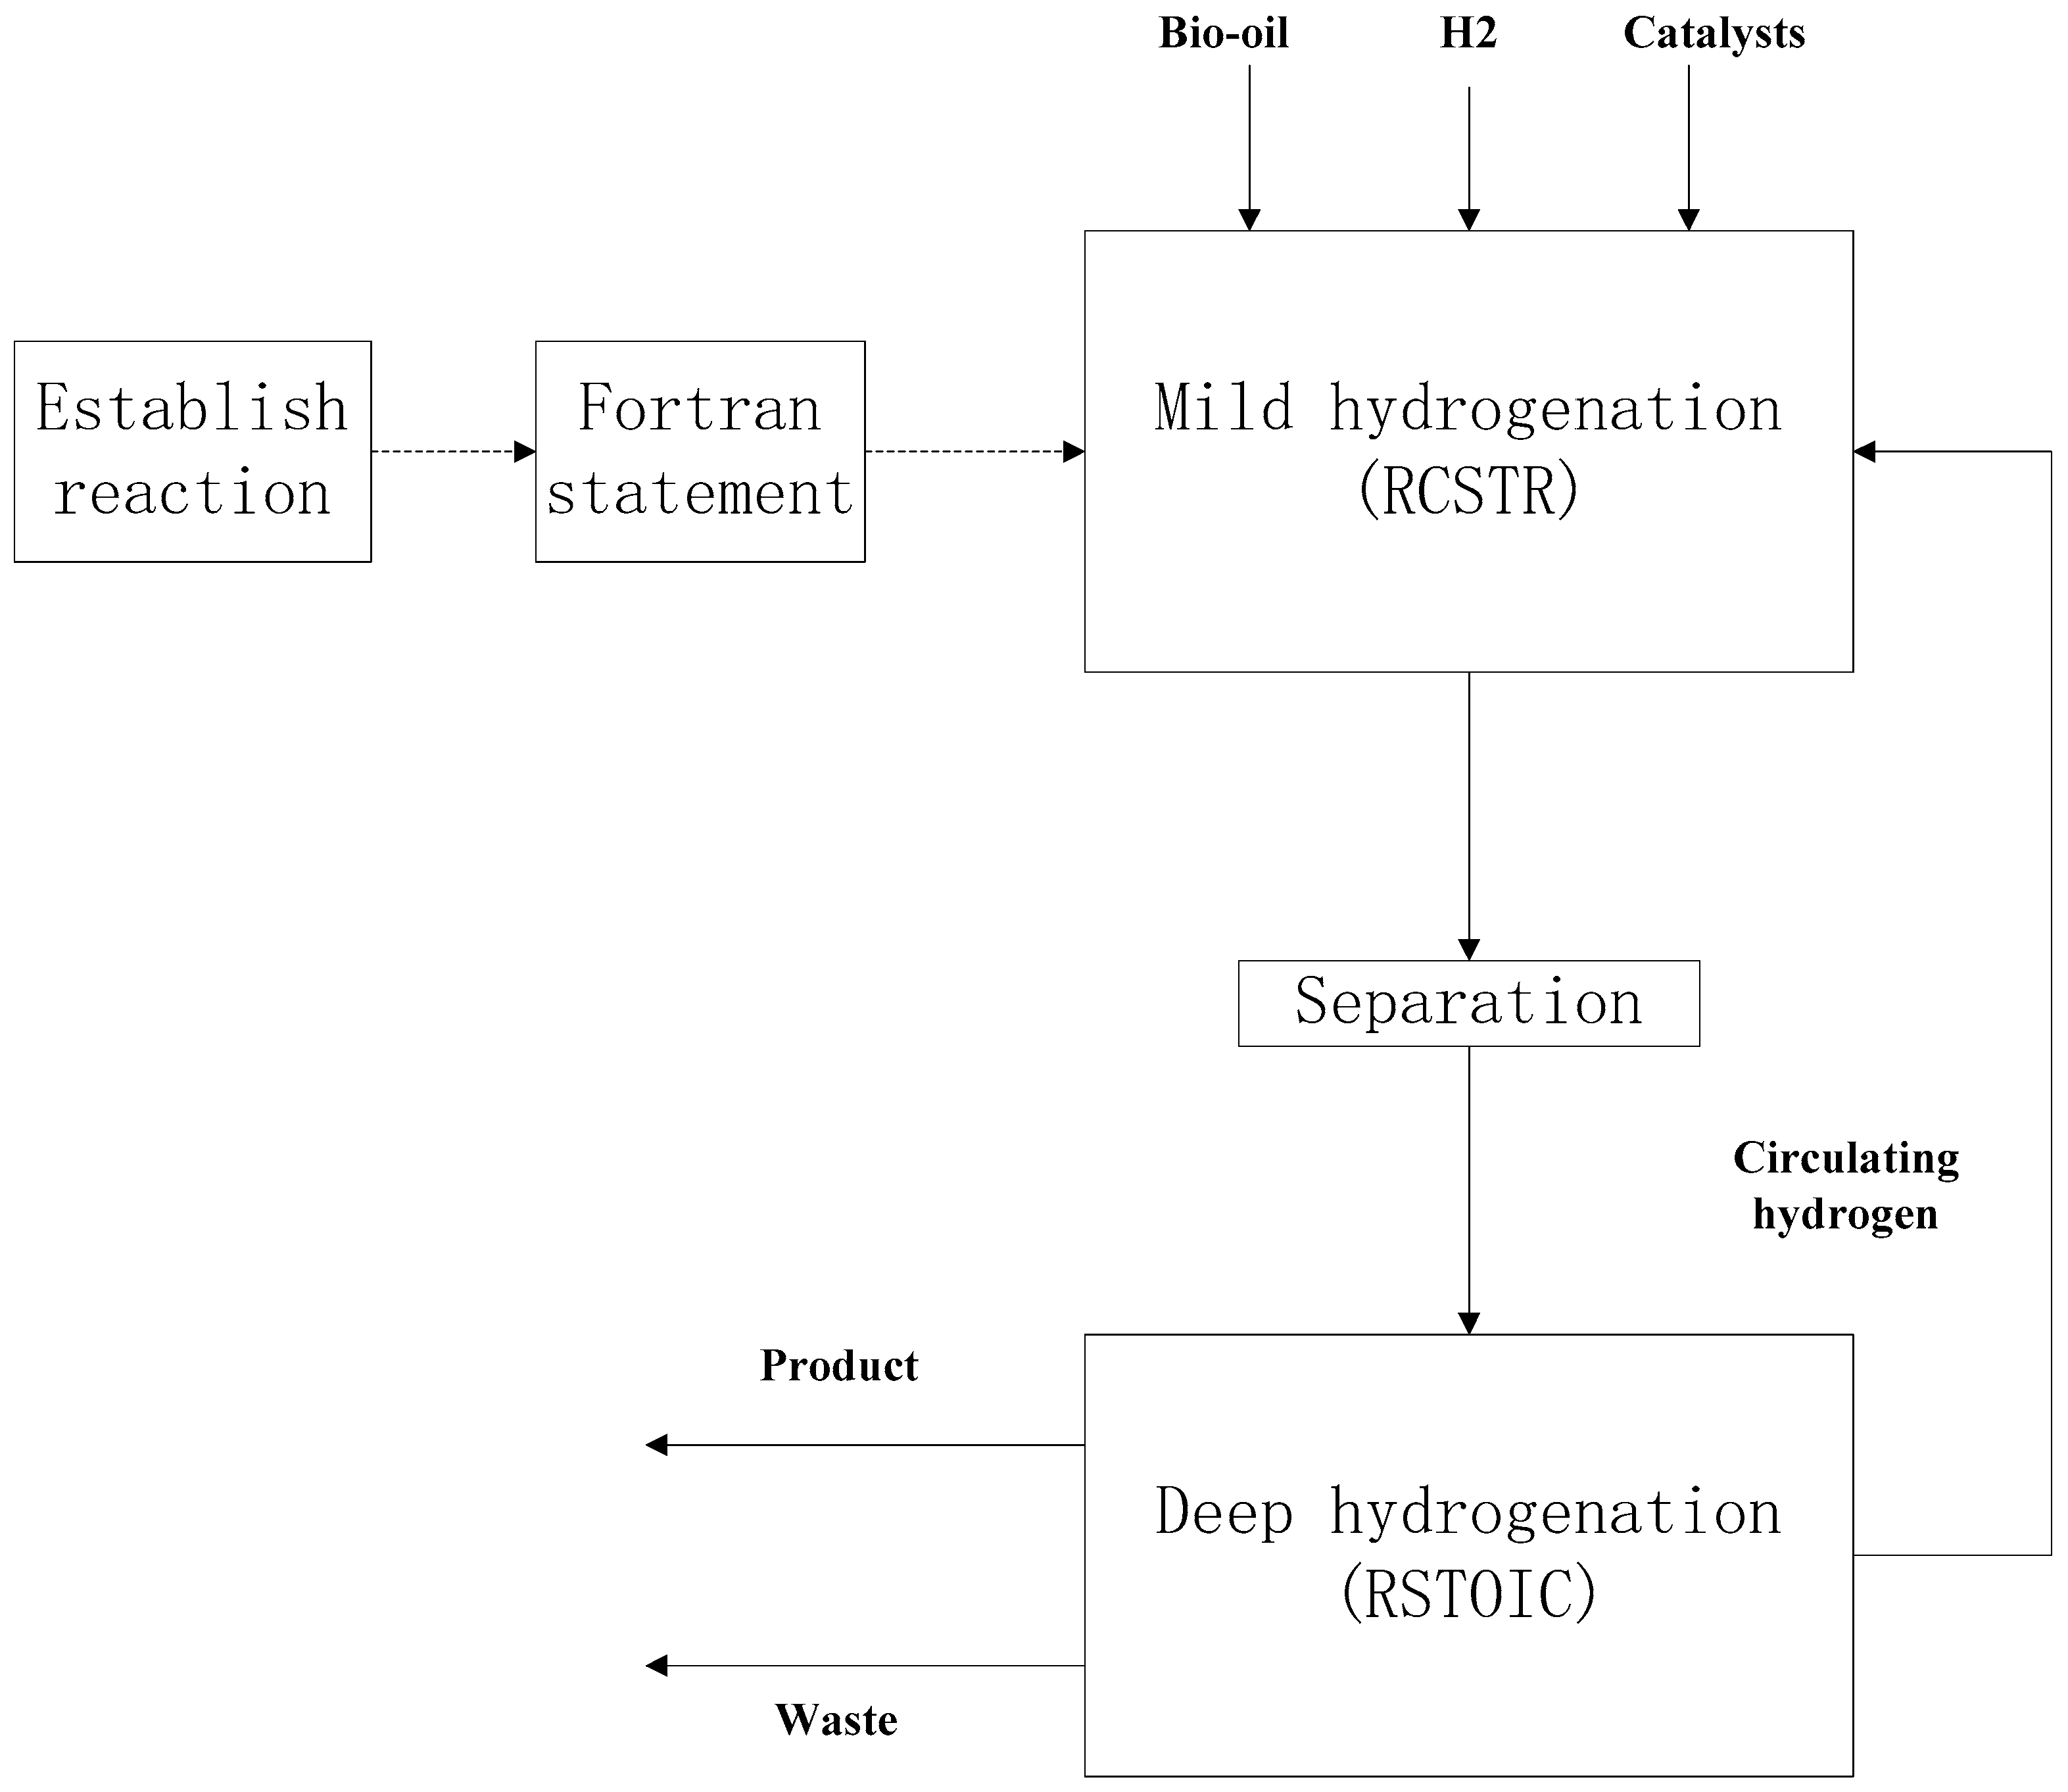
where Kd is the deactivation constant of coke deposition, α is the weighing factor of coke type, and β is the deactivation exponent. The mathematical expression of impacts of catalyst coking deactivation (Equation (2)) on the reaction system in the mild HDO stage is embedded into the Aspen model using a FORTRAN subroutine.
The deep hydrogenation step used a Ni/Al2O3 catalyst, under the operating conditions of 400 °C and 15 MPa.
The stoichiometry for deep hydrogenation reaction which produces the final upgraded bio-fuel (PRODUCT) is obtained from reported experimental results [16] and shown in Equation (3).
ODF + 0.23H2 → PRODUCT + 0.11H2O
3. Results and Discussion
3.1. Analysis on Bio-Oil Conversion under Different Reaction Conditions
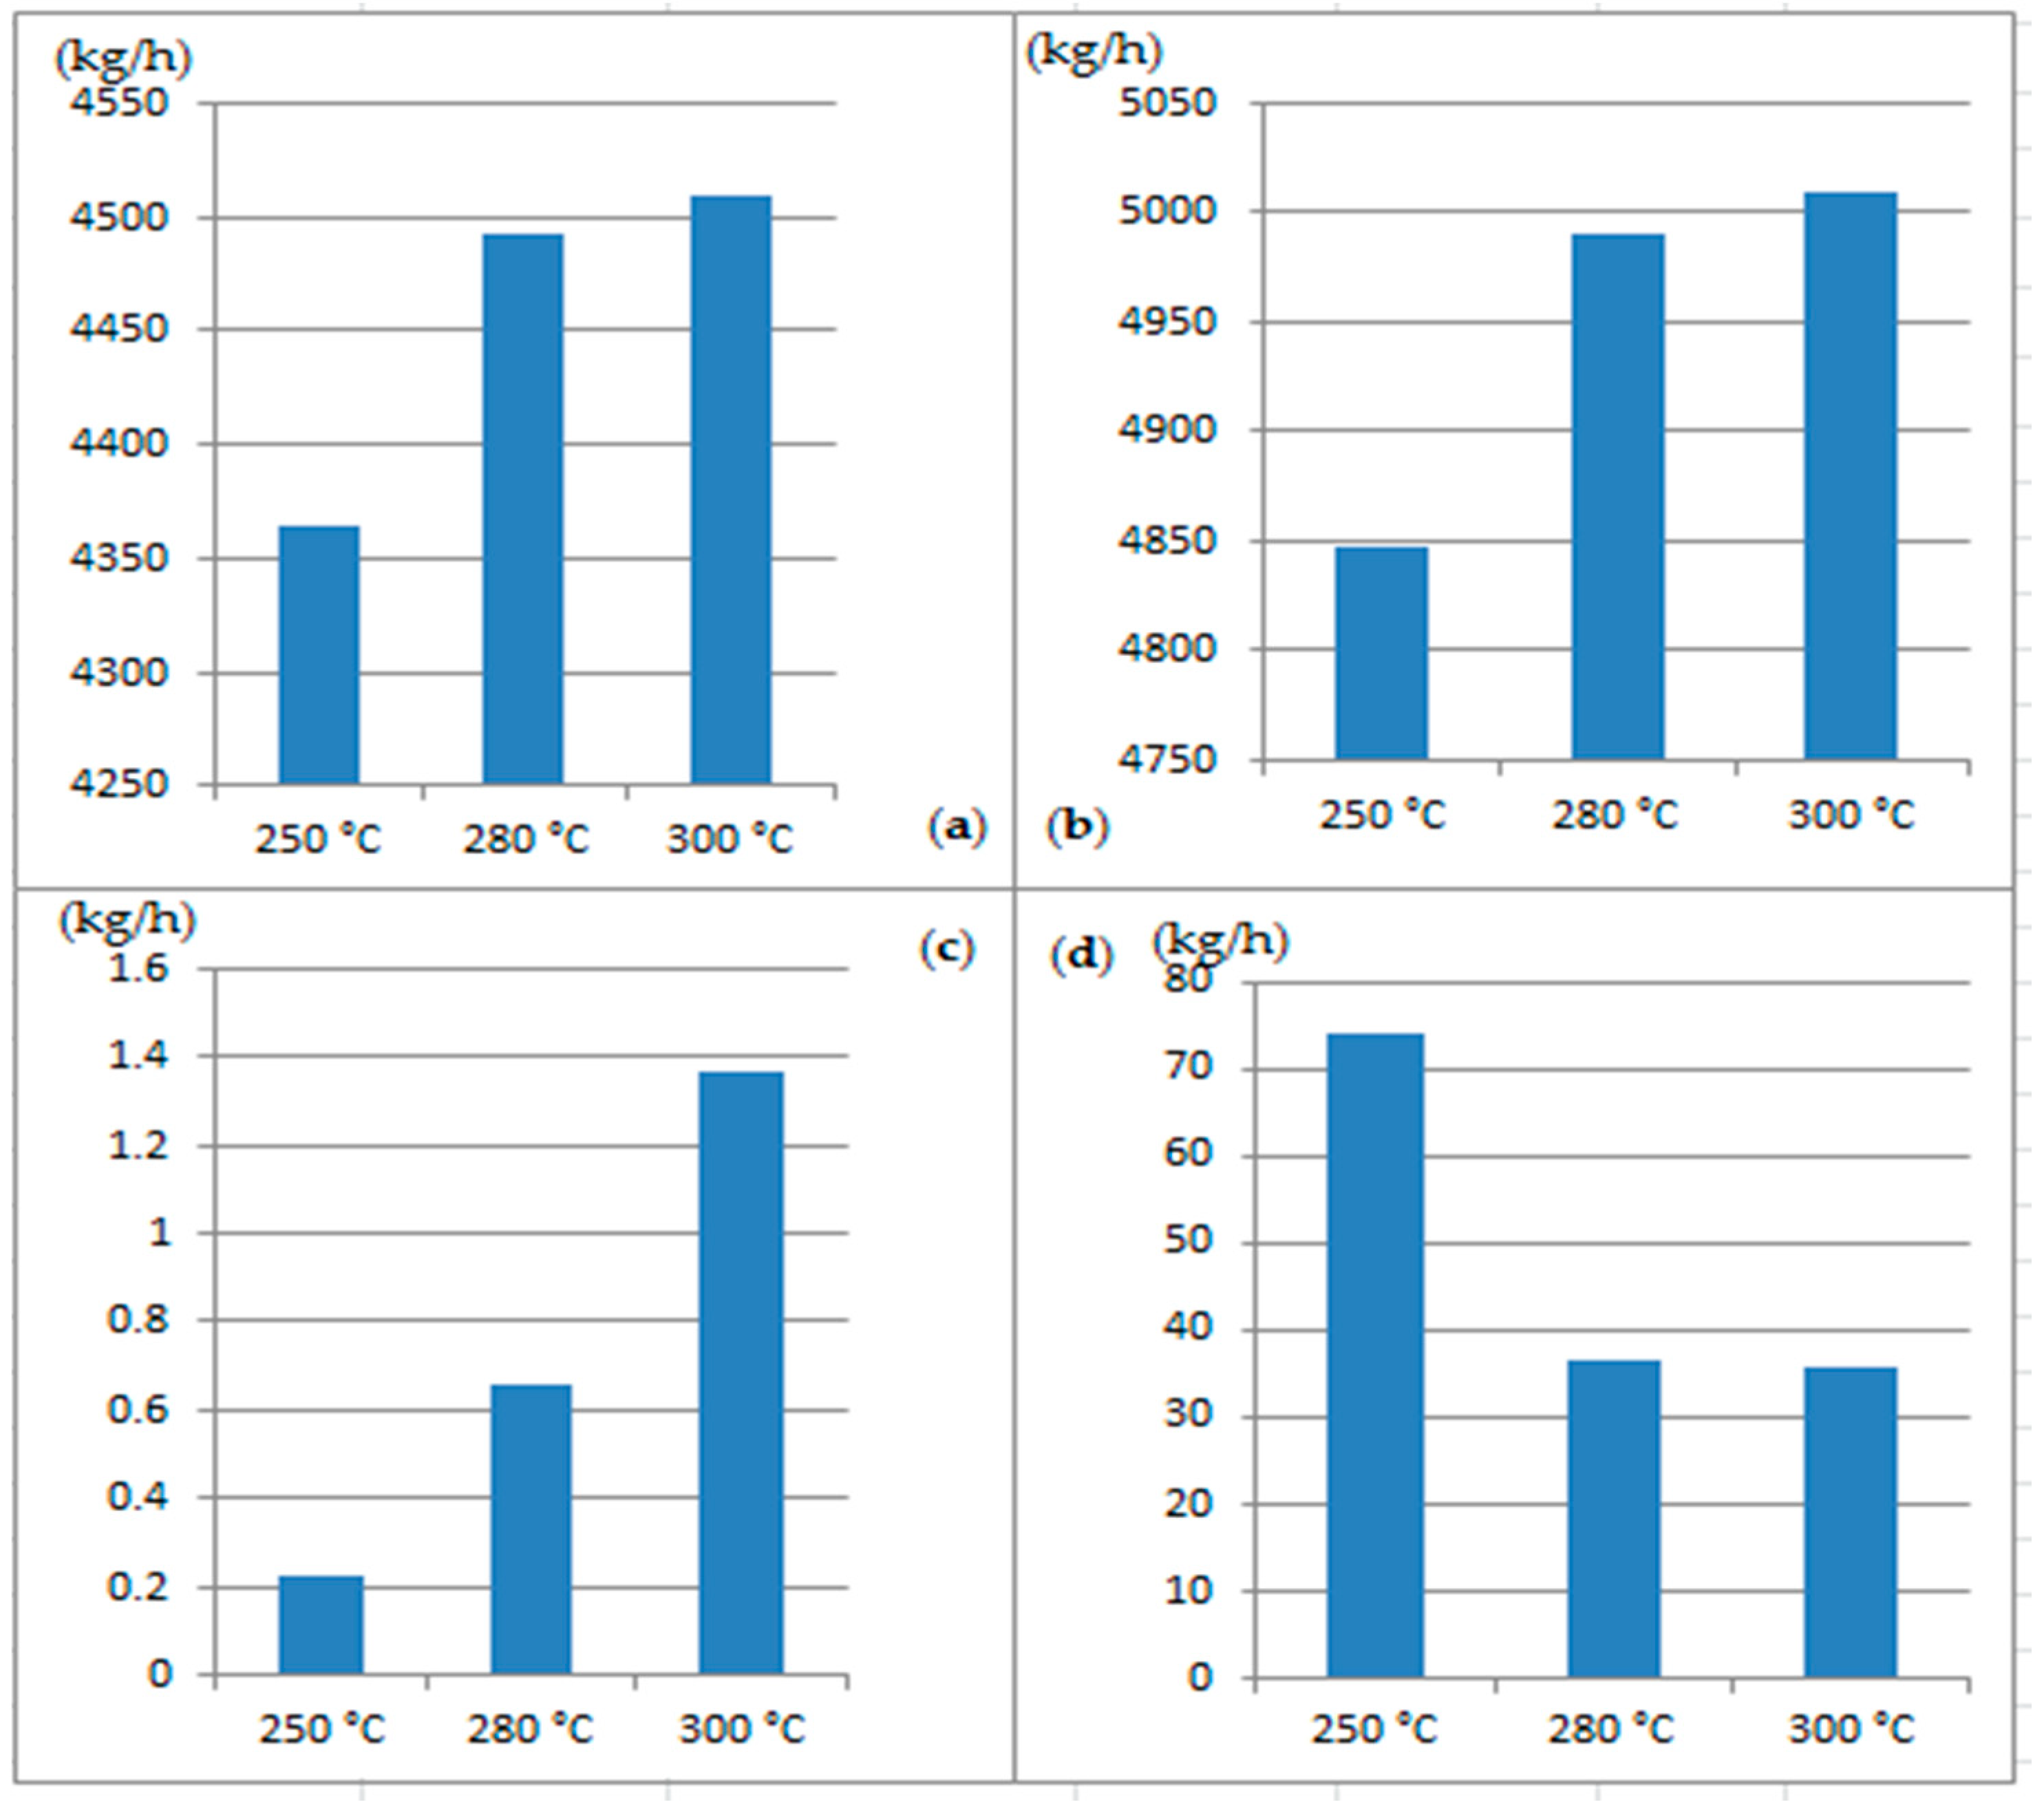
In running the process model, the operating temperatures for the mild hydrogenation reactor was set at 250 °C, 280 °C, and 300 °C, respectively, and the corresponding pressures were 5.6 MPa, 8 MPa, and 10 MPa. The deep hydrogenation stage used a Ni/Al2O3 catalyst under the operating conditions of 400 °C and 15 MPa. As per the simulation results shown in Figure 3, among the various products from the bio-oil upgrading, the yield of the bio-fuel is the highest (45%) and the total amount of coke is the lowest with the mild hydrogenation reactor temperature of 300 °C. However, the yields of bio-fuel and the total coke deposits at 280 °C and 300 °C are very similar. Moreover, the lower operating temperature is beneficial for the sake of process safety as the corresponding pressure is lower. The selection of optimal reaction temperature for the mild stage will be further discussed in the energy analysis section. The amount of insoluble coke deposit increases with the elevated reaction temperature, which is consistent with the reported trend of insoluble coke deposit with reaction temperature in the literature [17]. According to the Arrhenius reaction formula, the higher temperature promotes endothermic reactions. However, the production of insoluble coke deposits is the main reason for catalyst deactivation. The yield of the oil phase (ODF) in the first stage does not increase linearly with increasing temperature.
A more detailed material balance of the whole industrial process under different reaction conditions is shown in Table A1, Table A2 and Table A3. Since the amount of catalyst is unchanged during the reaction, the flow of catalyst is not shown in the stream summary tables. The slight mass imbalances (0.1–0.6%) in the stream tables were caused by the inherent convergence issues of the Aspen Plus v7.2 software (AspenTech, Boston, Massachusetts, US).
3.2. Analysis on Energy Consumption and Energy Flows
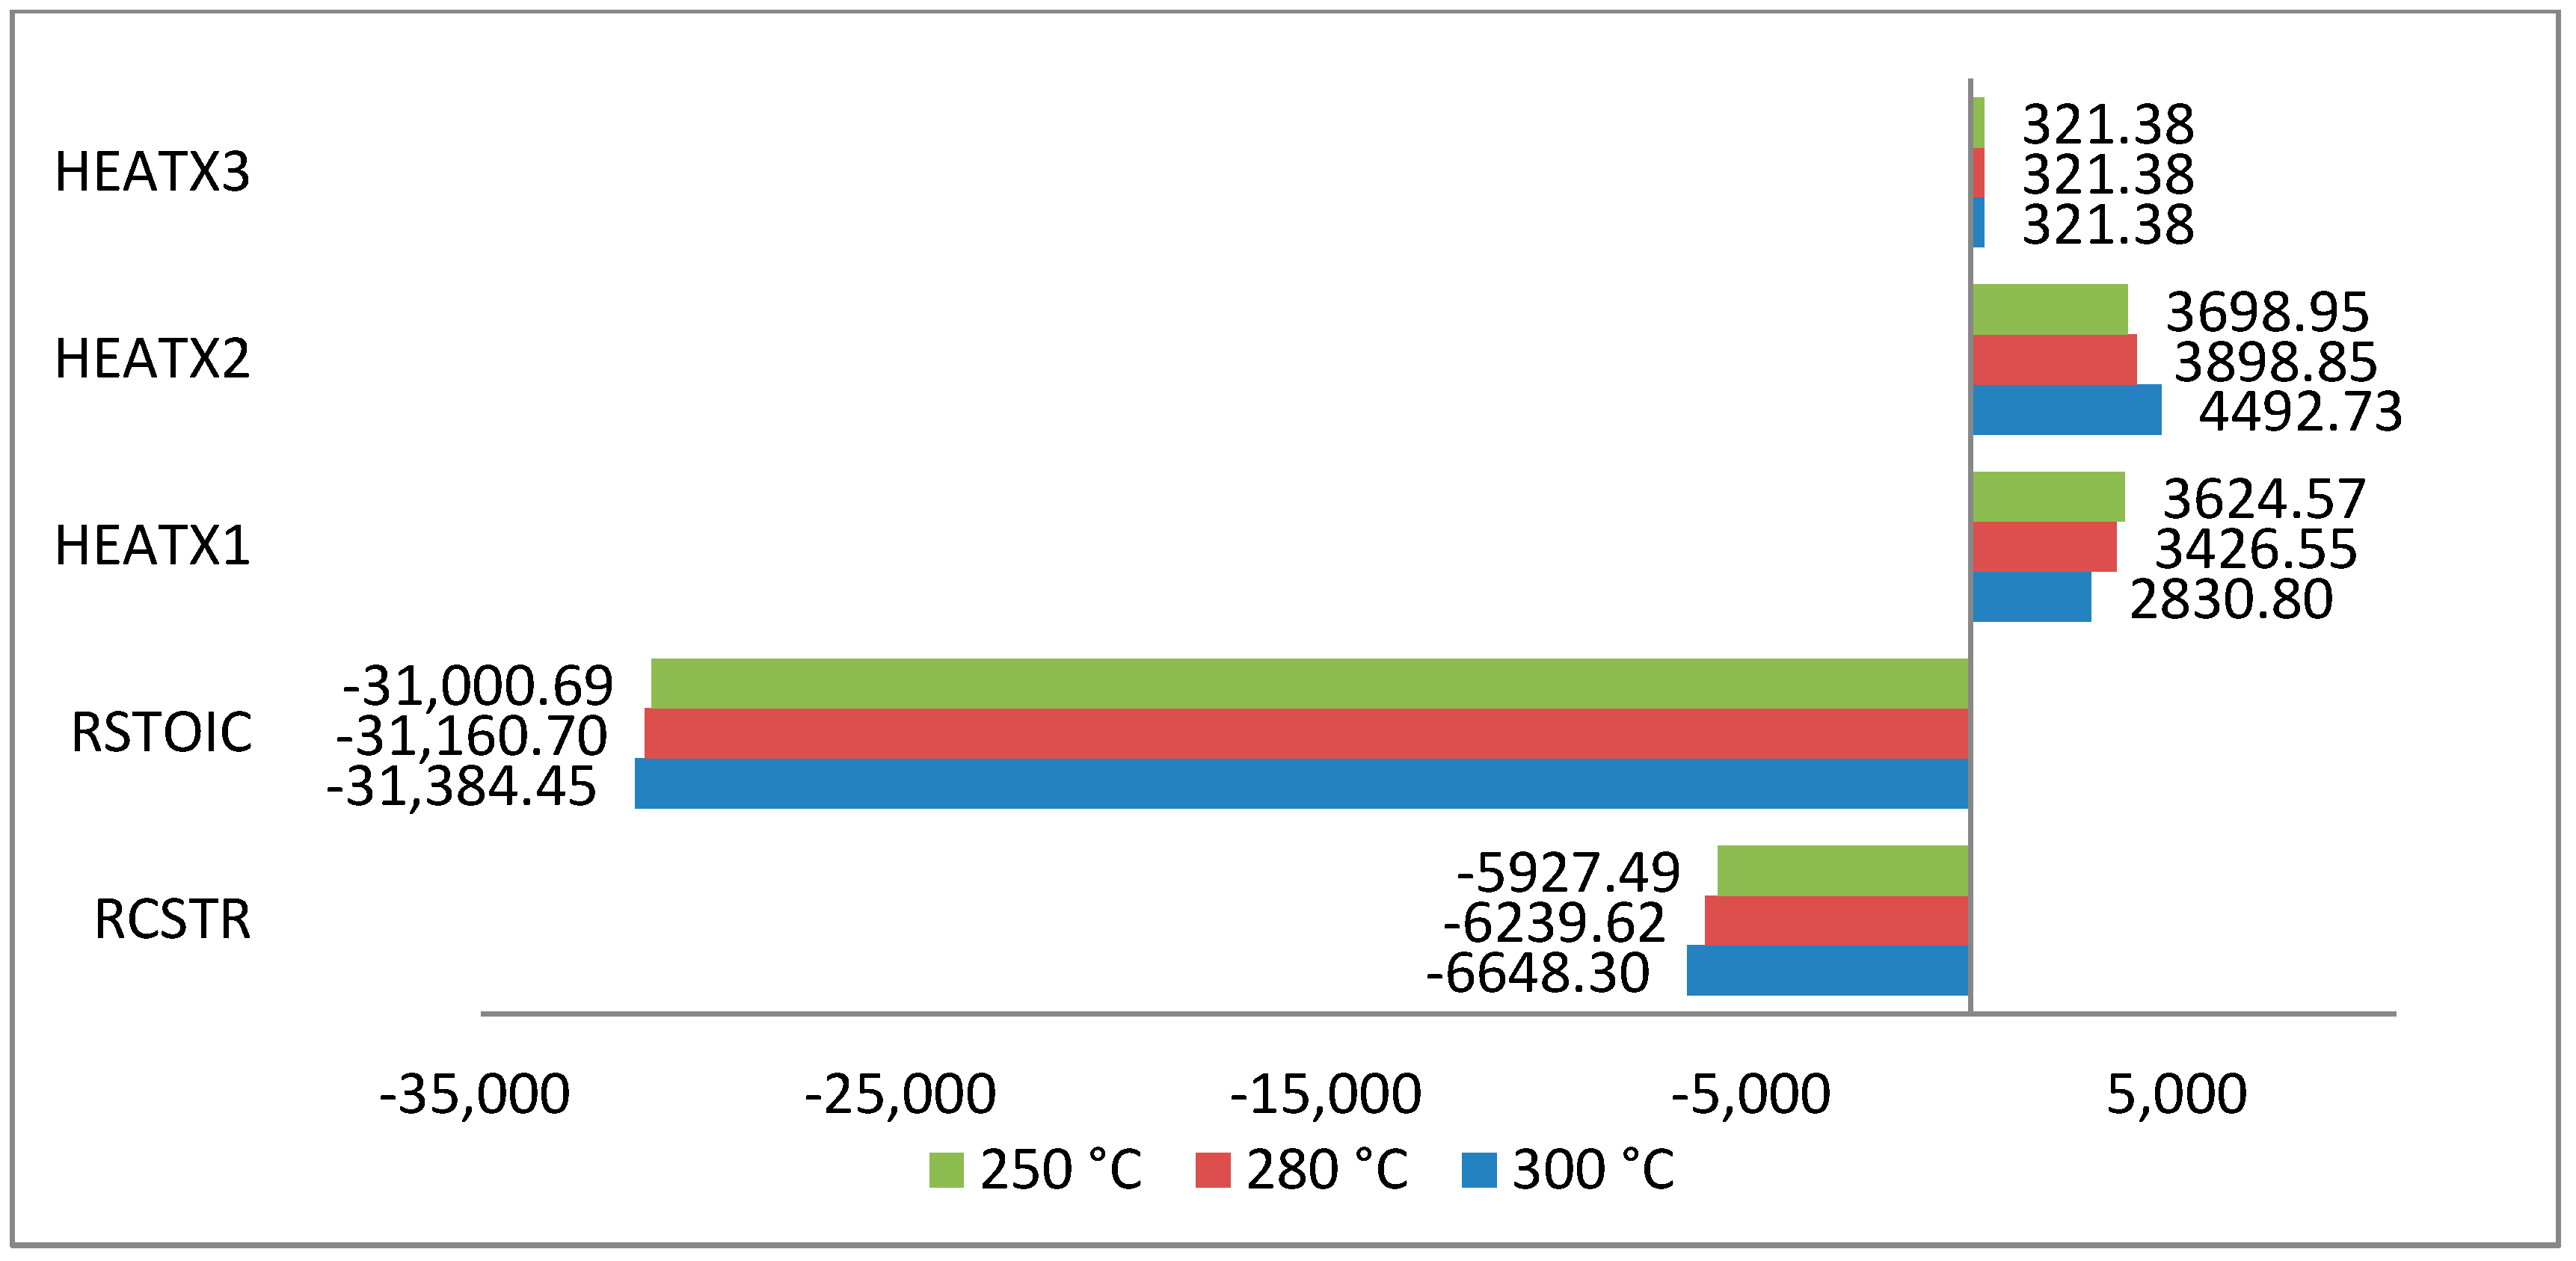
The summary of energy flows in each major unit is shown in Figure 4, in which the negative heat duties of the two reactors indicate that an external heat supply is required for maintaining the required operating temperature. However, the required heat duty of the mild HDO reactor is less than that of the deep stage because the feedstock streams have been partially preheated by the product streams through the heat exchangers.
In total, three heat exchangers are employed for heat recovery. The heat exchange rate in HEATX2 is the highest, because the amount of heat required for bio-oil preheating is large due to high mass flow rate. The optimal reaction temperature for the mild stage was selected as 280 °C, because the product yields at the two operating temperatures are similar but the energy required for 280 °C is less than that for 300 °C.
4. Economic Evaluations
4.1. Fixed Capital Cost
According to the throughput of the process plant defined in this case study, the minimum possible capital investment for the unit product was estimated. The fixed capital cost of the demonstration plant was approximated as the sum of fixed costs (equipment costs and installation costs), because the ancillary costs for a demonstration plant are unpredictable.
The cost for purchasing major equipment (reactors, separators, heat exchangers, etc.) was estimated from the power-law relationship between purchase price, equipment size, and inflation index [18]. The installed costs were estimated using the installation factor method [19]:
New Equipment Cost = Original Equipment Cost (New size/Original size) exp
Installed Equipment Cost = Equipment Cost × Installation Factor
4.2. Operating Costs
The operating costs mainly consist of costs for materials and energy consumption, whereas the taxes are not included in this study. The total annual operating time is assumed to be 8000 h. Operating costs include the costs for bio-oil, hydrogen, and catalyst (the average cost of catalyst for the deep and mild stages). The cost of bio-oil is assumed to be the production cost of the pyrolysis process of biomass under ideal conditions [13]. The purchase price of hydrogen considered here is $1.50/gallon of gasoline equivalent (GGE) or nearly $1.50/kg [13]. Prices for the external steam supply to heat the HDO reactors and for cooling water are based on the Chinese industrial standard. The labor costs are estimated as 120 employees in total with an annual salary of $9000. The other costs include the general overheads and the plant maintenance which account for up to 2% of the fixed capital cost.
The overall unit production costs of two scenarios are shown in Table 5 [7,9], which include the practical unit production and the ideal unit production costs. The ideal production assumes that the catalyst activity is not affected by catalyst coking, whereas the practical production takes in account the coking deactivation of the catalyst. By comparing the two cases, one can see that the costs for bio-oil, hydrogen, cooling water, and steam supply are virtually unchanged, because the increases in feed rates for those material and energy streams to maintain the same yield of desired product are not significant. However, the unit cost of the product increases by approximately 10%, because a higher feeding rate of fresh catalyst is required to balance the effect of catalyst coking deactivation.
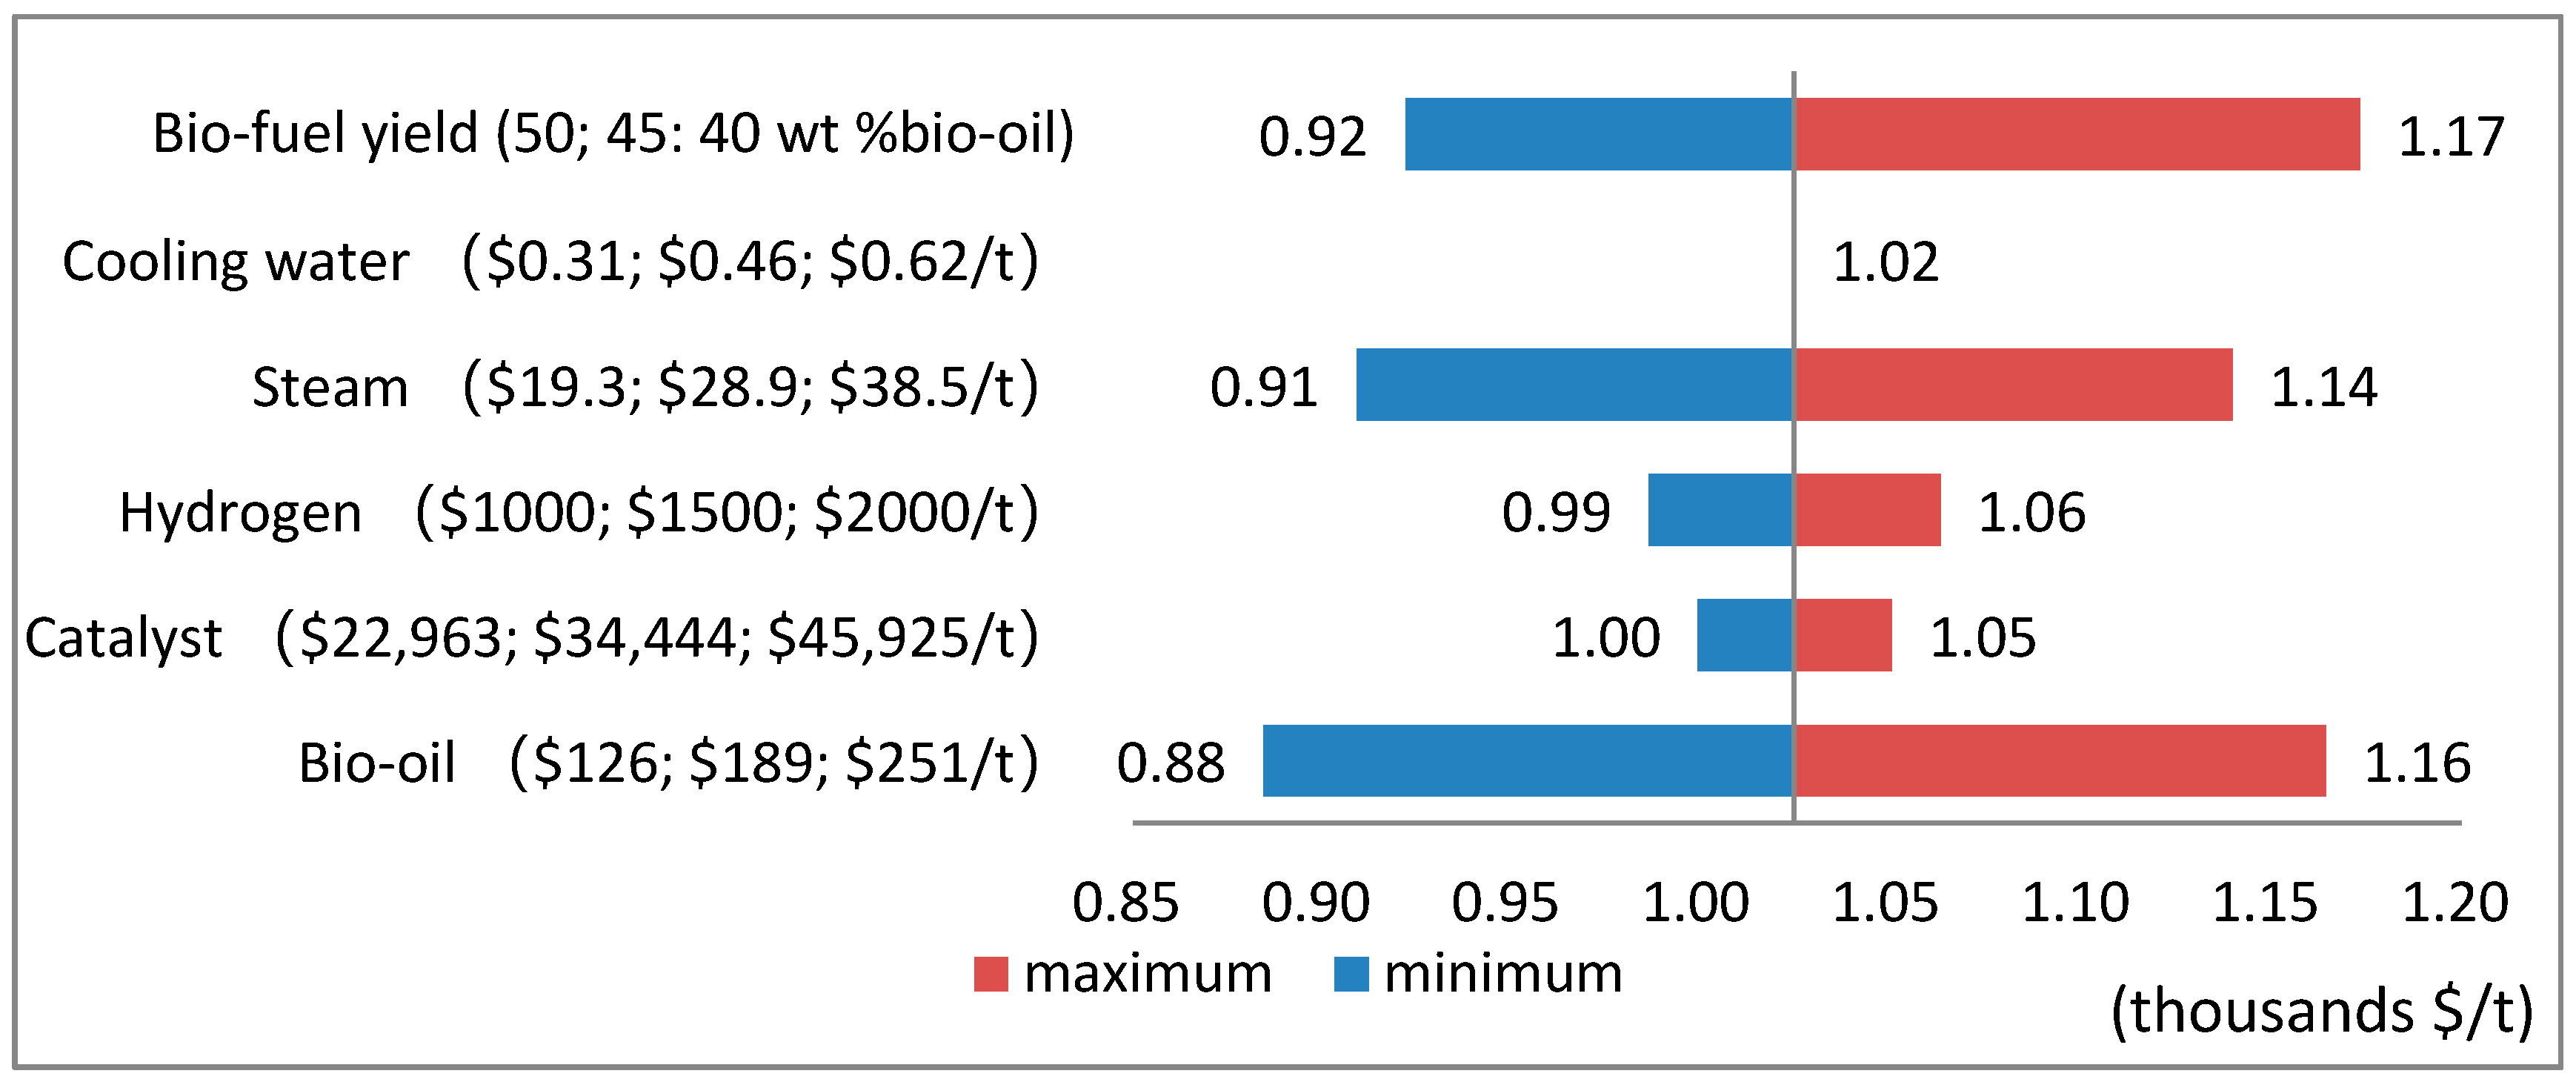
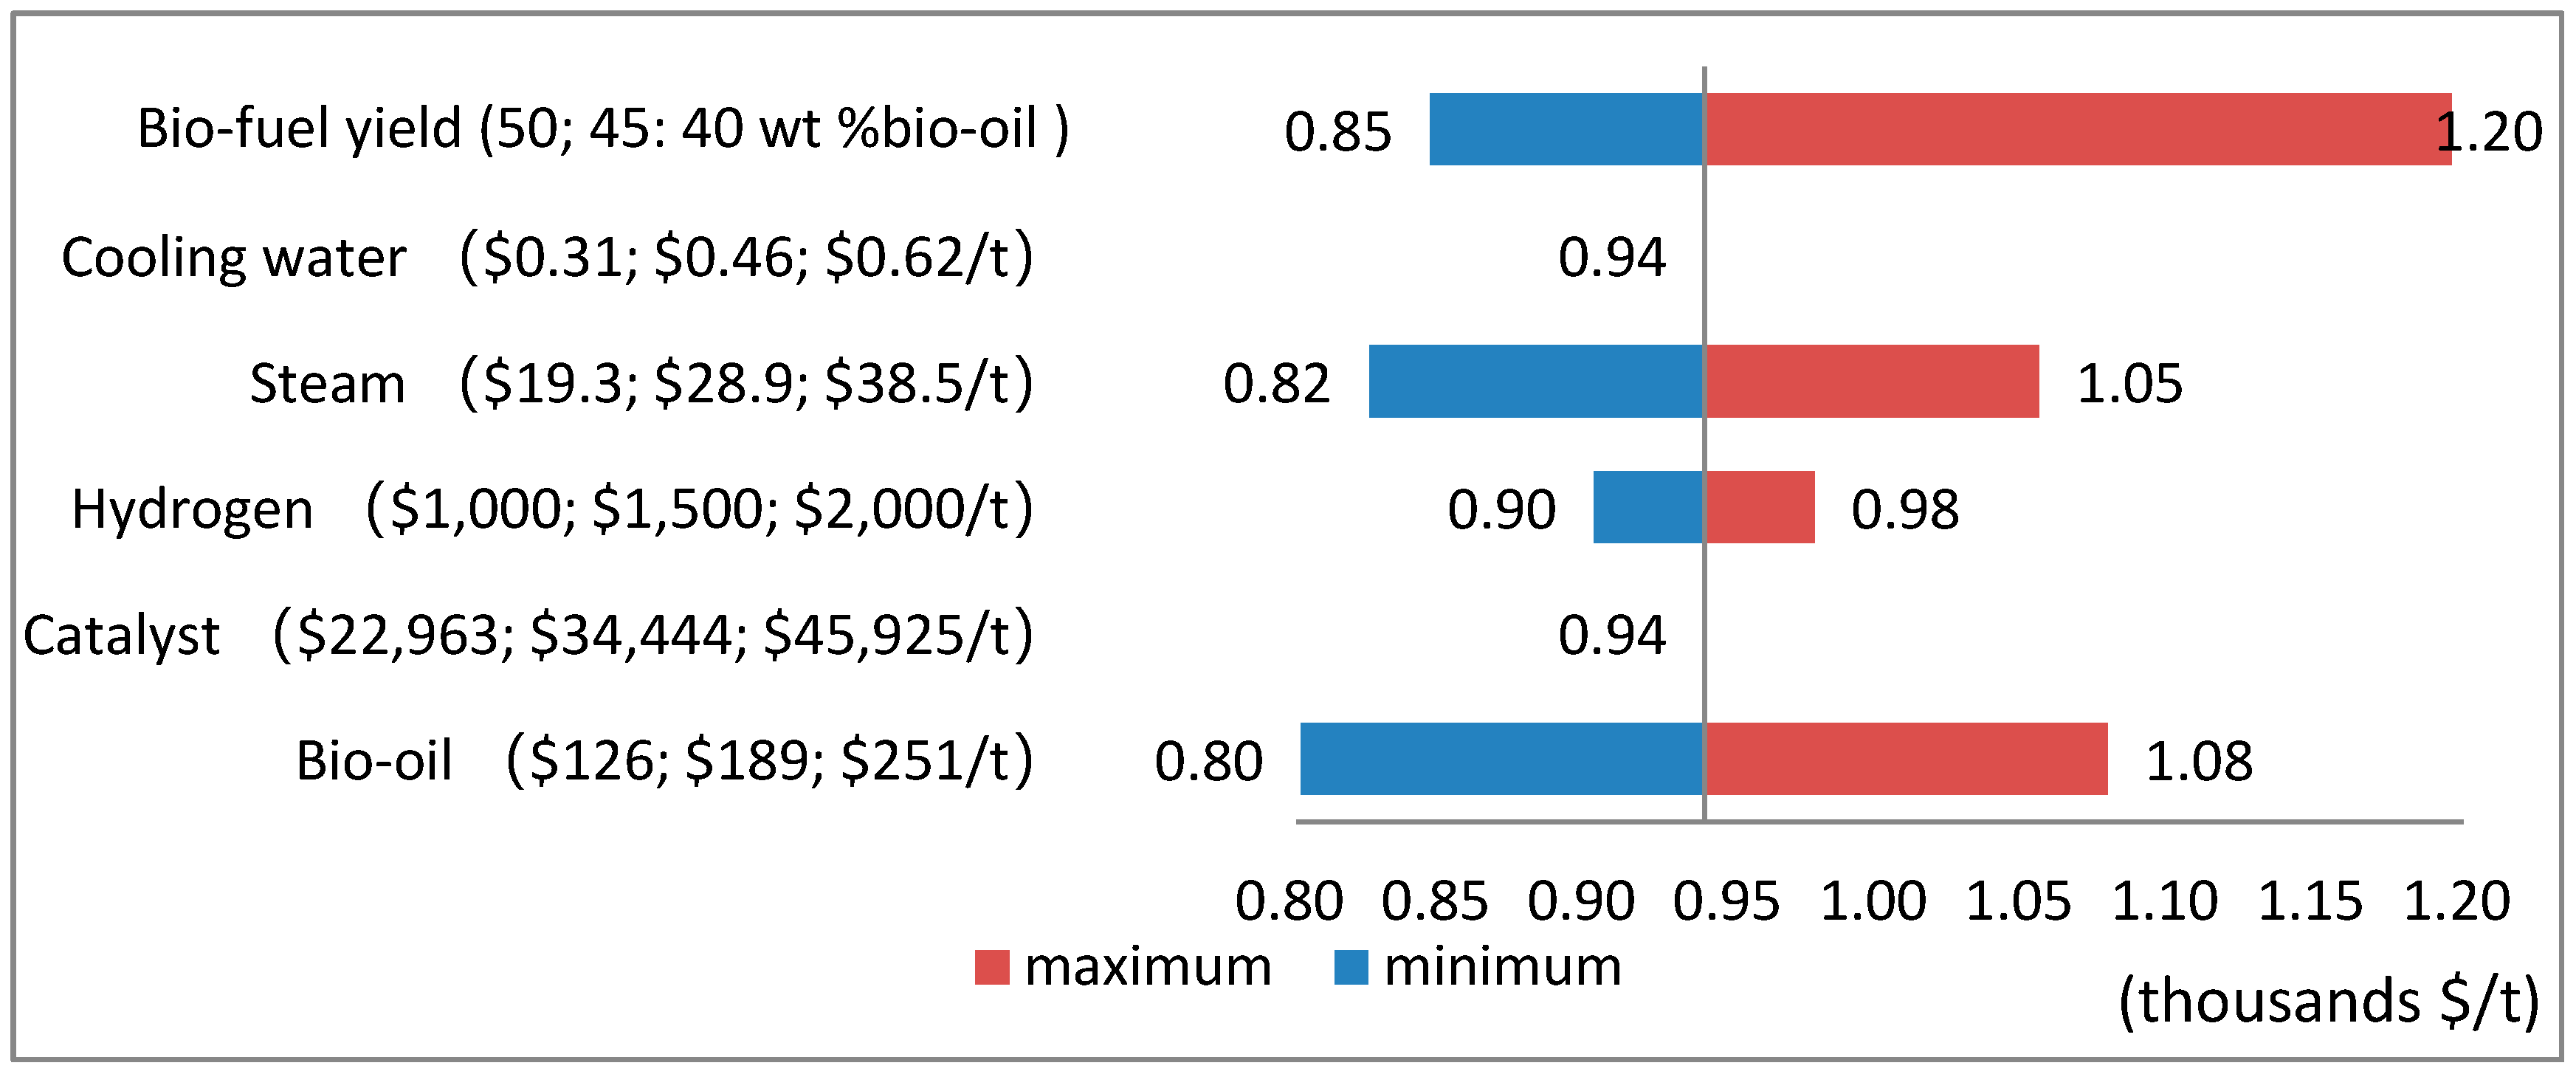
A sensitivity analysis of the influences on the production costs was performed for both the practical and ideal scenarios, and the resulting minimum and maximum production costs [13,20] that reflect the impact of common variations of the key input parameters from the base case are shown in Figure 5 and Figure 6 The costs of materials and utilities as well as the yield of final products are included. Bio-fuel yield has the strongest positive influence on the production cost; this implies that slight improvements in the overall performance of bio-oil upgrading process could reduce the cost of fuel significantly. In addition, the production costs are sensitive to the purchase price of raw bio-oil, as the cost for acquiring feedstock can vary widely between locations and throughout the year. Moreover, the influence of the catalyst is significant in the practical scenario but is negligible in the ideal case, which is due to the fact that the feeding rate of fresh catalyst in the latter is negligible in comparison with the former because no coking deactivation of the catalyst occurs.
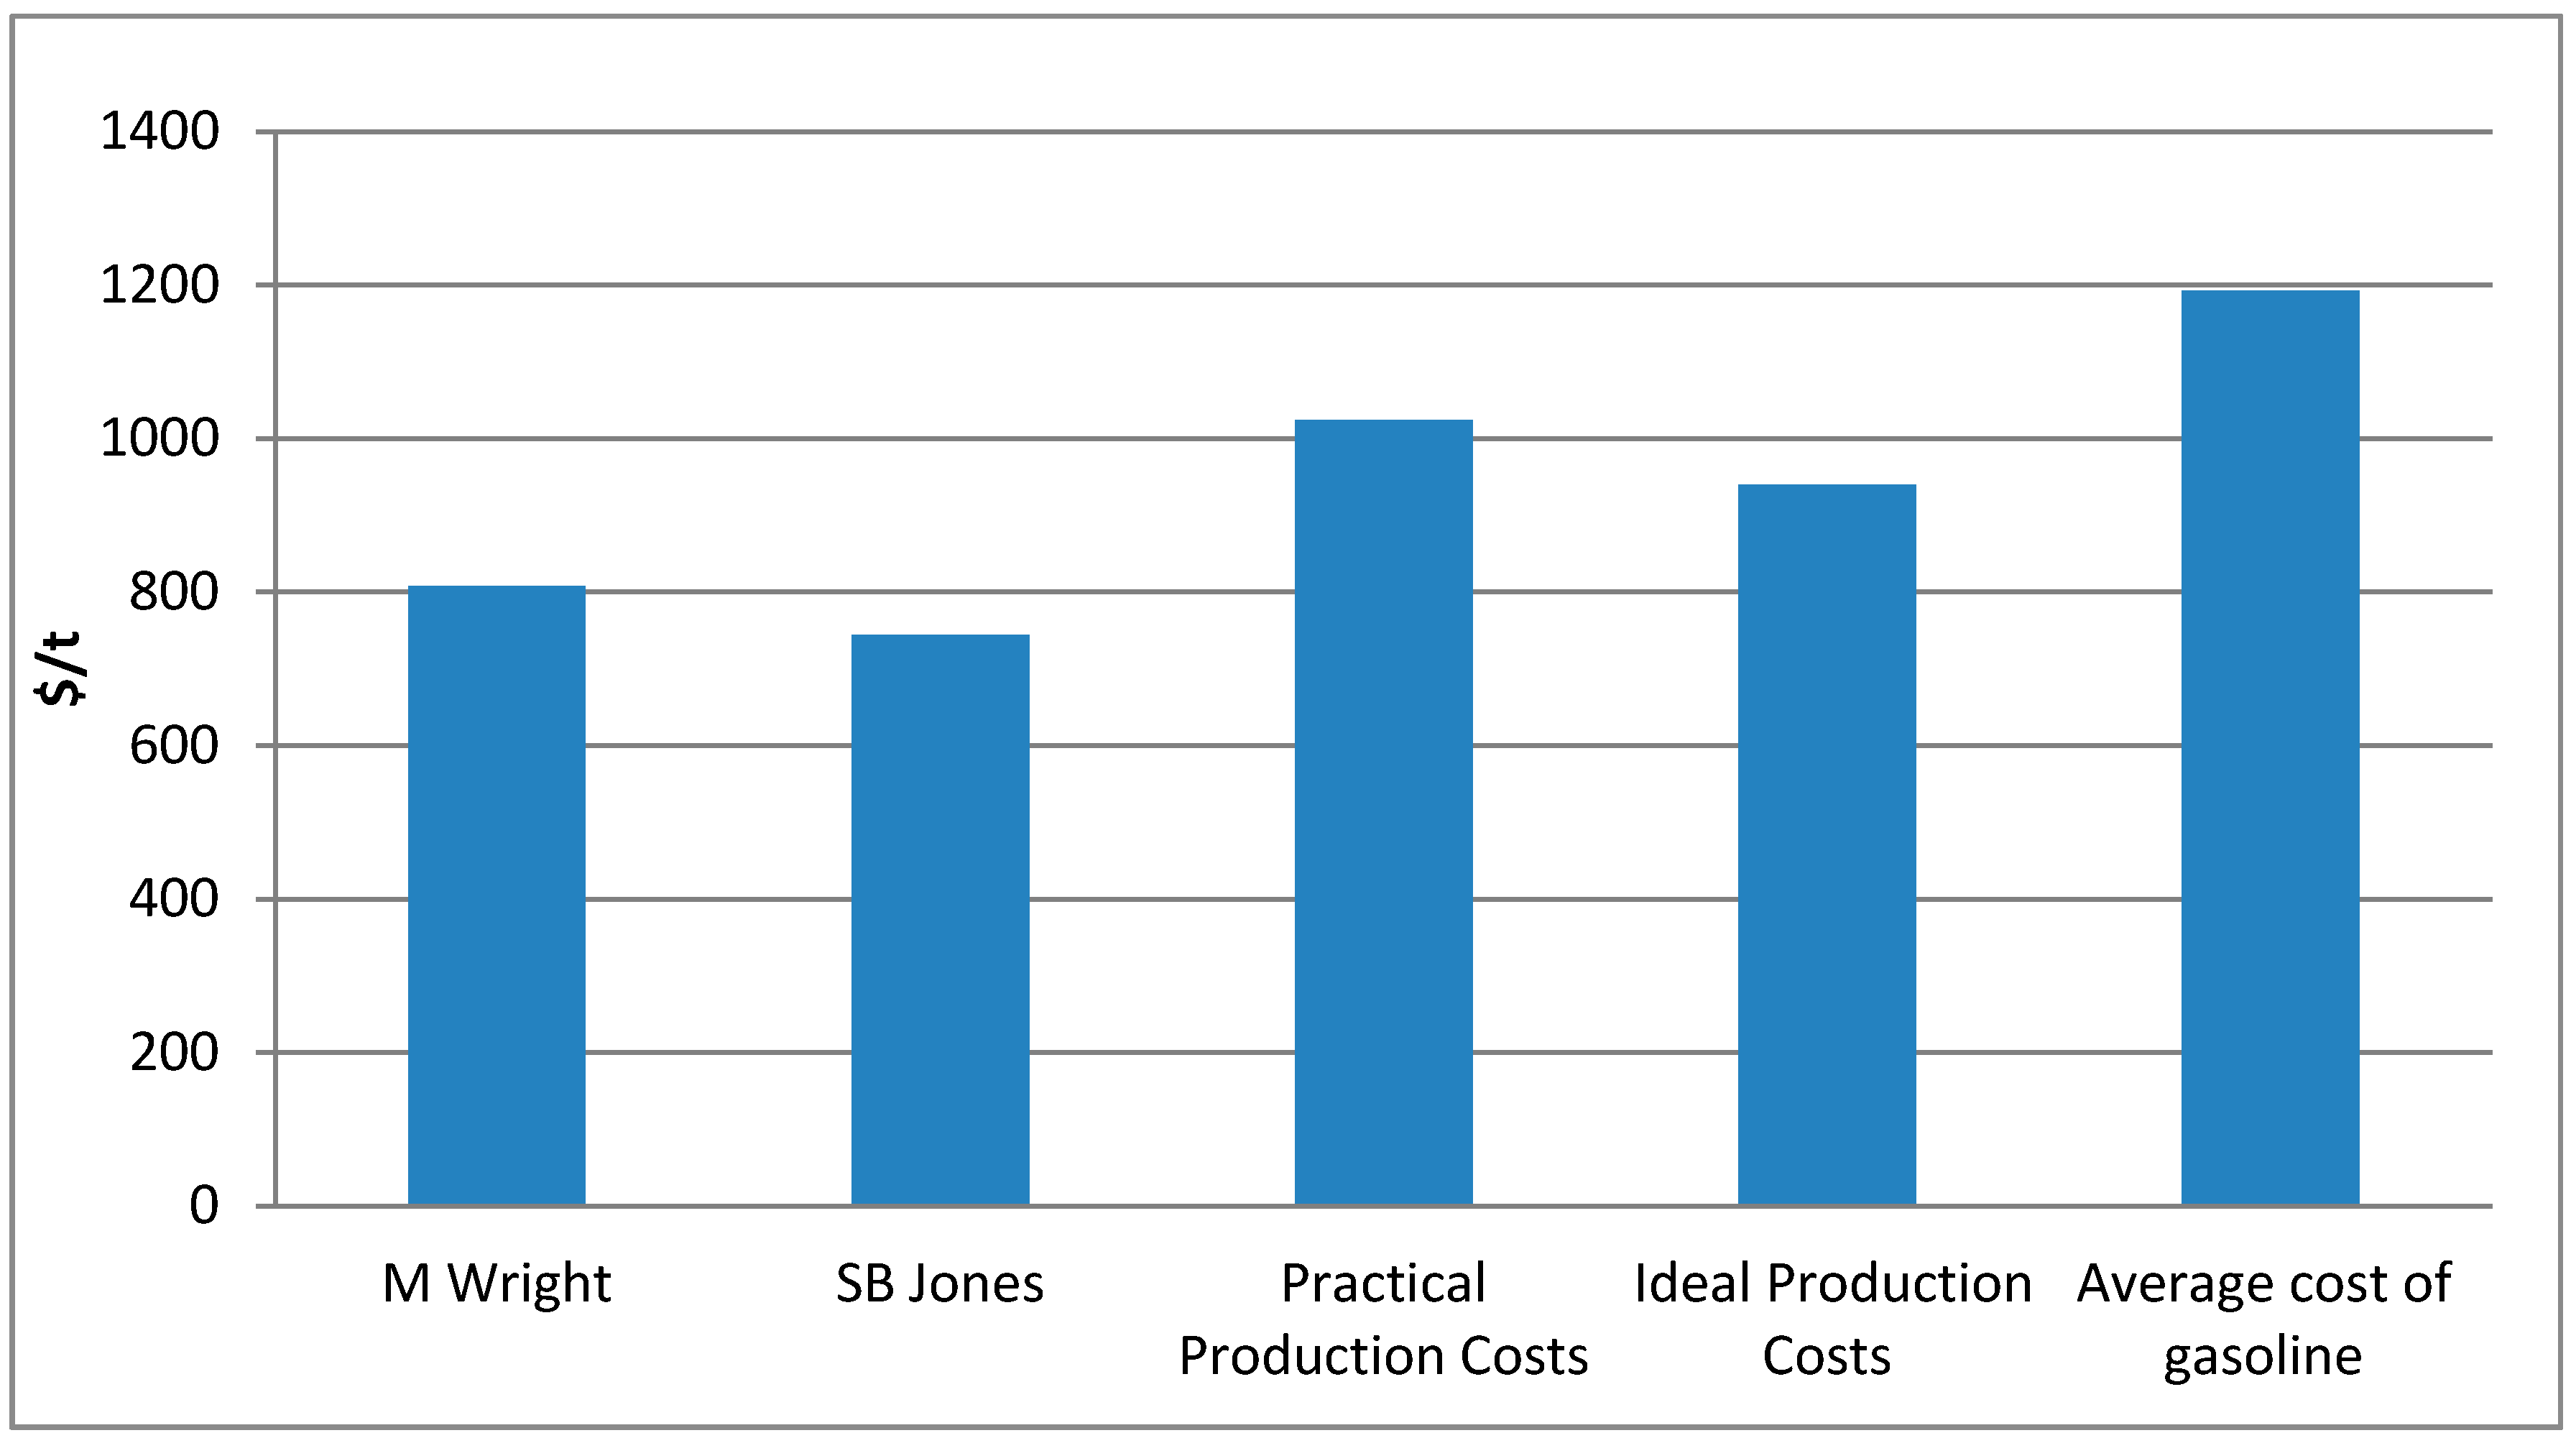
The comparison of production costs estimated in this study with different research studies [7,13] and of average gasoline prices throughout 2018 is shown in Figure 7. Both practical and ideal (where no catalyst coking occurs) production costs estimated in this study are higher than the results from other research studies. The reason for this is that only the hydrogenation process of bio-oil has been considered in this study, whereas both processes of pyrolysis and hydrogenation were included in Wright et al. [13] and Jones et al. [7]. The overall heat efficiency of the integrated process of pyrolysis and hydrogenation is higher, as the heat surplus of the pyrolysis plant could be utilized for hydrogenation; the cost for external steam could thus be reduced in comparison with the sole hydrogenation process. However, the cost for purchasing bio-oil from biomass pyrolysis can be subsidized according to the renewable energy policy in China. Therefore, the industrial production of upgraded bio-fuel from two-stage hydrogenation of bio-oil is economically feasible as the production cost is $168/ton lower than the average gasoline price in 2018.
5. Conclusions
In this study, a process simulation and a cost analysis were carried out for a bio-oil hydrogenation demonstrating plant with an annual throughput of 107 thousand tons of raw bio-oil. The following conclusions were drawn from this study.
- (1)
- A process model was developed using Aspen Plus to simulate the bio-oil HDO production process, material and energy balances throughout the plant were carried out, and deactivation of the catalysts due to coking in the mild HDO stage was embedded into the process model using a FORTRAN subroutine. The developed process model was capable of simulating the HDO process with extended ranges of feedstock properties and different reaction kinetics. From the simulation results, the yield of simulated bio-fuel varied between 44.1% and 45% across the selected temperature range of mild HDO reaction (250 °C–300 °C), whereas the optimal reaction temperature for the mild hydrogenation stage was found to be 280 °C, making this trend optimal for industrial design.
- (2)
- The simulation results showed that the catalyst deactivation due to coking could decrease the yield of the desired product, and that a larger feedstock flow for maintaining the productivity was required to compensate for the effect of coking deactivation. All these results showed that the catalyst deactivation affected the performance in the practical production process. Thus, the main reason for the catalyst deactivation was the presence of insoluble coke deposits, which affected the hydrogenation reaction in the mild stage, making it one of the decisive factors of the whole process.
- (3)
- A cost analysis of the bio-oil HDO production was performed and the minimum required costs were estimated. The total fixed capital cost for the demonstration plant with an annual throughput of 107 thousand tons of raw bio-oil was estimated at $15.2 million. The required variable costs for the unit product in the ideal case was found to be $939.76; where the unit production cost for the practical case, which included the catalyst deactivation, was found to be $1024.27/ton. The additional $76.68/ton came mainly from the expenditures related to the extra catalyst. A sensitivity analysis of the key process variables showed that the bio-fuel yield has the most impact on the unit production cost. Variations of ±5% in the bio-fuel yield resulted in production costs rising from 0.92 to 1.2 thousand/ton for the practical scenario. The industrial production of upgraded bio-fuel from the two-stage hydrogenation of bio-oil is economically feasible as the operating costs are $168/ton which is lower than the average gasoline price in 2018.
Author Contributions
Conceptualization, Q.X.; Data curation, X.M.; Formal analysis, X.M.; Investigation, X.M.; Methodology, X.M.; Software, X.M. and Q.X.; Supervision, R.Z.; Validation, Q.X.; Writing—original draft, X.M.; Writing—review and editing, S.P. and Q.X.
Funding
This research was partially funded by National Key Research and Development Program of China, grant number 2017YFC0212400.
Acknowledgments
The authors wish to thank the three anonymous reviewers and the editor for their constructive suggestions for improving the manuscript.
Conflicts of Interest
The authors declare no conflict of interest.
Appendix A. Stream Information and Energy Analysis of the Whole Process

Table A1.
Simulated results for main streams of products from mild hydrogenation of bio-oil at 250 °C and 5.6 MPa and deep hydrogenation at 400 °C and 15 MPa.
Table A1.
Simulated results for main streams of products from mild hydrogenation of bio-oil at 250 °C and 5.6 MPa and deep hydrogenation at 400 °C and 15 MPa.
| Streams | B-OIL-IN | H2-IN | MIXTURE1 | MIXTURE2 | MIXTURE3 | PRODUCT | H2-C |
|---|---|---|---|---|---|---|---|
| Total Flow, kg/h | 10,000 | 345 | 11,264.79 | 11,190.29 | 6147.53 | 4364.09 | 849.13 |
| Temperature, °C | 192.79 | 250 | 250 | 20 | 30 | 30 | 30 |
| Mass Flow for all components, kg/h | |||||||
| H2 | 0 | 345 | 995.55 | 995.55 | 849.13 | 0 | 849.13 |
| WATER | 0 | 0 | 934.51 | 934.51 | 630.26 | 0 | 0 |
| CO2 | 0 | 0 | 1435.13 | 1435.13 | 0 | 0 | 0 |
| BIO-OIL | 10,000 | 0 | 304.05 | 304.05 | 304.05 | 0 | 0 |
| ODF | 0 | 0 | 4847.93 | 4847.93 | 0 | 0 | 0 |
| AQO | 0 | 0 | 2673.13 | 2673.13 | 0 | 0 | 0 |
| COKES | 0 | 0 | 74.28 | 0 | 0 | 0 | 0 |
| COKEIS | 0 | 0 | 0.23 | 0 | 0 | 0 | 0 |
| PRODUCT | 0 | 0 | 0 | 0 | 4364.09 | 4364.09 | 0 |
Table A2.
Simulated results for main streams of products from mild hydrogenation of bio-oil at 280 °C and 8 MPa and deep hydrogenation at 400 °C and 15 MPa.
Table A2.
Simulated results for main streams of products from mild hydrogenation of bio-oil at 280 °C and 8 MPa and deep hydrogenation at 400 °C and 15 MPa.
| Streams | B-OIL-IN | H2-IN | MIXTURE1 | MIXTURE2 | MIXTURE3 | PRODUCT | H2-C |
|---|---|---|---|---|---|---|---|
| Total Flow, kg/h | 10,000 | 345 | 10,862.11 | 10,824.59 | 5633.78 | 4491.99 | 434.76 |
| Temperature, °C | 192.79 | 250 | 280 | 20 | 3 | 30 | 30 |
| Mass Flow for all components, kg/h | |||||||
| H2 | 0 | 345 | 585.48 | 585.48 | 434.76 | 0 | 434.76 |
| WATER | 0 | 0 | 962.54 | 962.54 | 648.73 | 0 | 0 |
| CO2 | 0 | 0 | 1478.17 | 1478.17 | 0 | 0 | 0 |
| BIO-OIL | 10,000 | 0 | 58.3 | 58.3 | 58.3 | 0 | 0 |
| ODF | 0 | 0 | 4990.01 | 4990.01 | 0 | 0 | 0 |
| AQO | 0 | 0 | 2750.11 | 2750.11 | 0 | 0 | 0 |
| COKES | 0 | 0 | 36.86 | 0 | 0 | 0 | 0 |
| COKEIS | 0 | 0 | 0.66 | 0 | 0 | 0 | 0 |
| PRODUCT | 0 | 0 | 0 | 0 | 4491.99 | 4491.99 | 0 |
Table A3.
Simulated results for main streams of products from mild hydrogenation of bio-oil at 300 °C and 0 MPa and deep hydrogenation at 400 °C and 15 MPa.
Table A3.
Simulated results for main streams of products from mild hydrogenation of bio-oil at 300 °C and 0 MPa and deep hydrogenation at 400 °C and 15 MPa.
| Streams | B-OIL-IN | H2-IN | MIXTURE1 | MIXTURE2 | MIXTURE3 | PRODUCT | H2-C |
|---|---|---|---|---|---|---|---|
| Total Flow, kg/h | 10,000 | 345 | 10,624.99 | 10,587.65 | 5377.13 | 4508.92 | 195.85 |
| Temperature, °C | 192.79 | 250.00 | 300 | 20 | 30 | 30 | 30 |
| Mass Flow for all components, kg/h | |||||||
| H2 | 0 | 345 | 347.13 | 347.13 | 195.85 | 0 | 195.85 |
| WATER | 0 | 0 | 967.13 | 967.13 | 651.18 | 0 | 0 |
| CO2 | 0 | 0 | 1485.22 | 1485.22 | 0 | 0 | 0 |
| BIO-OIL | 10,000 | 0 | 21.19 | 21.19 | 21.19 | 0 | 0 |
| ODF | 0 | 0 | 5008.81 | 5008.81 | 0 | 0 | 0 |
| AQO | 0 | 0 | 2758.16 | 2758.16 | 0 | 0 | 0 |
| COKES | 0 | 0 | 35.97 | 0 | 0 | 0 | 0 |
| COKEIS | 0 | 0 | 1.36 | 0 | 0 | 0 | 0 |
| PRODUCT | 0 | 0 | 0 | 0 | 4508.92 | 4508.92 | 0 |
Table A4.
Energy analysis of the overall process at 250 °C and 5.6 MPa and deep hydrogenation at 400 °C and 15 MPa.
Table A4.
Energy analysis of the overall process at 250 °C and 5.6 MPa and deep hydrogenation at 400 °C and 15 MPa.
| Inlets | Outlets | Operation Temperature (°C) | Heat Medium | Heat Duty(kw) | |||||
|---|---|---|---|---|---|---|---|---|---|
| Stream | Flow (kg/h) | Temp. (°C) | Stream | Flow (kg/h) | Temp. (°C) | ||||
| RCSTR | B-OIL-IN | 10,000 | 192.79 | MIXTURE1 | 11,264.79 | 250 | 250 | steam (400 °C) | −5927.49 |
| H2-IN | 345 | 250 | |||||||
| H2-C | 849.13 | 30 | |||||||
| RSTOIC | OIL-1 | 5151.98 | 20 | 9 | 6147.53 | 400 | 400 | steam (600 °C) | −31,000.69 |
| H2-2 | 995.55 | ||||||||
| HEATX1 | 5(Hot) | 11,190.29 | 254.07 | 8(Hot) | 11,190.29 | 192.39 | 3624.57 | ||
| 1(Cold) | 10,000 | 118.85 | B-OIL-IN(Cold) | 10,000 | 192.79 | ||||
| HEATX2 | 18(Hot) | 6147.53 | 375.51 | MIXTURE3(Hot) | 6147.53 | 30 | 3698.95 | ||
| BIO-OIL(Cold) | 10,000 | 20 | 1(Cold) | 10,000 | 118.85 | ||||
| HEATX3 | 9(Hot) | 6147.53 | 400 | 18(Hot) | 6147.53 | 375.51 | 321.38 | ||
| H2(Cold) | 345 | 20 | H2-IN(Cold) | 345 | 250 | ||||
Table A5.
Energy analysis of the overall process at 280 °C and 8 MPa and deep hydrogenation at 400 °C and 15 MPa.
Table A5.
Energy analysis of the overall process at 280 °C and 8 MPa and deep hydrogenation at 400 °C and 15 MPa.
| Inlets | Outlets | Operation Temperature (°C) | Heat Medium | Heat Duty (kw) | |||||
|---|---|---|---|---|---|---|---|---|---|
| Stream | Flow (kg/h) | Temp. (°C) | Stream | Flow (kg/h) | Temp. (°C) | ||||
| RCSTR | B-OIL-IN | 10,000 | 192.79 | MIXTURE1 | 10,862.11 | 280 | 280 | steam (400 °C) | −6239.62 |
| H2-IN | 345 | 250 | |||||||
| H2-C | 434.76 | 30 | |||||||
| RSTOIC | OIL-1 | 5048.30 | 20 | 9 | 5633.78 | 400 | 400 | steam (600 °C) | −31,160.70 |
| H2-2 | 585.48 | ||||||||
| HEATX1 | 5(Hot) | 10,824.59 | 279.77 | 8(Hot) | 10,824.59 | 196.85 | 3426.55 | ||
| 1(Cold) | 10,000 | 118.85 | B-OIL-IN(Cold) | 10,000 | 192.79 | ||||
| HEATX2 | 18(Hot) | 5633.78 | 371.78 | MIXTURE3(Hot) | 5633.78 | 30 | 3898.85 | ||
| BIO-OIL(Cold) | 10,000 | 20 | 1(Cold) | 10,000 | 118.85 | ||||
| HEATX3 | 9(Hot) | 5633.78 | 400 | 18(Hot) | 5633.78 | 371.78 | 321.38 | ||
| H2(Cold) | 345 | 20 | H2-IN(Cold) | 345 | 250 | ||||
Table A6.
Energy analysis of the overall process at 300 °C and 10 MPa and deep hydrogenation at 400 °C and 15 MPa.
Table A6.
Energy analysis of the overall process at 300 °C and 10 MPa and deep hydrogenation at 400 °C and 15 MPa.
| Inlets | Outlets | Operation Temperature (°C) | Heat Medium | Heat Duty (kw) | |||||
|---|---|---|---|---|---|---|---|---|---|
| Stream | Flow (kg/h) | Temp. (°C) | Stream | Flow (kg/h) | Temp. (°C) | ||||
| RCSTR | B-OIL-IN | 10,000 | 192.79 | MIXTURE1 | 10,624.99 | 300 | 300 | steam (400 °C) | −6648.30 |
| H2-IN | 345 | 250 | |||||||
| H2-C | 195.84 | 30 | |||||||
| RSTOIC | OIL-1 | 5030.01 | 20 | 9 | 5377.13 | 400 | 400 | steam (600 °C) | −31,384.45 |
| H2-2 | 347.14 | ||||||||
| HEATX1 | 5(Hot) | 10,587.66 | 284.44 | 8(Hot) | 10,587.66 | 183.57 | 2830.80 | ||
| 1(Cold) | 10,000 | 118.85 | B-OIL-IN(Cold) | 10,000 | 192.79 | ||||
| HEATX2 | 18(Hot) | 5377.15 | 369.32 | MIXTURE3(Hot) | 5377.15 | 30 | 4492.73 | ||
| BIO-OIL(Cold) | 10,000 | 20 | 1(Cold) | 10,000 | 118.85 | ||||
| HEATX3 | 9(Hot) | 5377.15 | 400 | 18(Hot) | 5377.15 | 369.32 | 321.38 | ||
| H2(Cold) | 345 | 20 | H2-IN(Cold) | 345 | 250 | ||||
References
- Werther, J.; Saenger, M.; Hartge, E.U.; Ogada, T.; Siagi, Z. Combustion of agricultural residues. Prog. Energy Combust. Sci. 2000, 26, 1–27. [Google Scholar] [CrossRef]
- He, J.; Liu, Y.; Lin, B. Should China support the development of biomass power generation? Energy 2018, 163, 416–425. [Google Scholar] [CrossRef]
- Demirbas, A. Biofuels sources, biofuel policy, biofuel economy and global biofuel projections. Energy Convers. Manag. 2008, 49, 2106–2116. [Google Scholar] [CrossRef]
- Pang, S. Advances in thermochemical conversion of woody biomass to energy, fuels and chemicals. Biotechnol. Adv. 2018. [Google Scholar] [CrossRef] [PubMed]
- Mortensen, P.M.; Grunwaldt, J.D.; Jensen, P.A.; Knudsen, K.G.; Jensen, A.D. A review of catalytic upgrading of bio-oil to engine fuels. Appl. Catal. A Gen. 2011, 407, 1–19. [Google Scholar] [CrossRef]
- Jones, S.B.; Meyer, P.A.; Snowden-Swan, L.J.; Padmaperuma, A.B.; Tan, E.; Dutta, A.; Jacobson, J.; Cafferty, K. Process Design and Economics for the Conversion of Lignocellulosic Biomass to Hydrocarbon Fuels: Fast Pyrolysis and Hydrotreating Bio-Oil Pathway; U.S. Department of EnergyOffice of Scientific and Technical Information: Oak Ridge, TN, USA, 1 November 2013.
- Jones, S.B.; Valkenburt, C.; Walton, C.W.; Elliott, D.C.; Holladay, J.E.; Stevens, D.J.; Kinchin, C.; Czernik, S. Production of Gasoline and Diesel from Biomass via Fast Pyrolysis, Hydrotreating and Hydrocracking: A Design Case; Pacific Northwest National Laboratory: Richland, WA, USA, 25 February 2009. [Google Scholar]
- Atsonios, K.; Kougioumtzis, M.A.; Grammelis, P.; Kakaras, E. Process Integration of a Polygeneration Plant with Biomass/Coal Co-pyrolysis. Energy Fuels 2017, 31, 14408–14422. [Google Scholar] [CrossRef]
- Wright, M.M.; Daugaard, D.E.; Satrio, J.A.; Brown, R.C. Techno-economic analysis of biomass fast pyrolysis to transportation fuels. Fuel 2010, 89, S2–S10. [Google Scholar] [CrossRef] [Green Version]
- Venderbosch, R.H.; Ardiyanti, A.R.; Wildschut, J.; Oasmaa, A.; Heeres, H.J. Stabilization of biomass-derived pyrolysis oils. J. Chem. Technol. Biotechnol. 2010, 85, 674–686. [Google Scholar] [CrossRef]
- Lv, Q.; Yue, H.; Xu, Q.; Zhang, C.; Zhang, R. Quantifying the exergetic performance of bio-fuel production process including fast pyrolysis and bio-oil hydrodeoxygenation. J. Renew. Sustain. Energy 2018, 10, 043107. [Google Scholar] [CrossRef]
- Xu, X.; Zhang, C.; Zhai, Y.; Liu, Y.; Zhang, R.; Tang, X. Upgrading of Bio-Oil Using Supercritical 1-Butanol over a Ru/C Heterogeneous Catalyst: Role of the Solvent. Energy Fuels 2014, 28, 4611–4621. [Google Scholar] [CrossRef]
- Wright, M.; Satrio, J.A.; Brown, R.C. Techno-Economic Analysis of Biomass Fast Pyrolysis to Transportation Fuels; NREL: Golden, CO, USA, 2010. [Google Scholar]
- Li, Y.; Zhang, C.; Liu, Y.; Hou, X.; Zhang, R.; Tang, X. Coke Deposition on Ni/HZSM-5 in Bio-oil Hydrodeoxygenation Processing. Energy Fuels 2015, 29, 1722–1728. [Google Scholar] [CrossRef]
- Yamamoto, Y.; Kumata, F.; Massoth, F.E. Hydrotreating catalyst deactivation by coke from SRC-II oil. Fuel Process. Technol. 1988, 19, 253–263. [Google Scholar] [CrossRef]
- Xu, X.; Zhang, C.; Liu, Y.; Zhai, Y.; Zhang, R. Two-step catalytic hydrodeoxygenation of fast pyrolysis oil to hydrocarbon liquid fuels. Chemosphere 2013, 93, 652–660. [Google Scholar] [CrossRef] [PubMed]
- Li, Y.; Zhang, C.; Liu, Y.; Tang, S.; Chen, G.; Zhang, R.; Tang, X. Coke formation on the surface of Ni/HZSM-5 and Ni-Cu/HZSM-5 catalysts during bio-oil hydrodeoxygenation. Fuel 2017, 189, 23–31. [Google Scholar] [CrossRef]
- Yang, Z.; Qian, K.; Zhang, X.; Lei, H.; Xin, C.; Zhang, Y.; Qian, M.; Villota, E. Process design and economics for the conversion of lignocellulosic biomass into jet fuel range cycloalkanes. Energy 2018, 154, 289–297. [Google Scholar] [CrossRef]
- En, W.; Guoyan, Z.; Shandong, T. Technical economic analysis of heat exchangers. Chem. Ind. Eng. Prog. 2006, 25, 458–461. [Google Scholar]
- Wu, W.; Long, M.R.; Zhang, X.; Reed, J.L.; Maravelias, C.T. A framework for the identification of promising bio-based chemicals. Biotechnol. Bioeng. 2018, 115, 2328–2340. [Google Scholar] [CrossRef] [PubMed]
Figure 1.
Simulation procedure of the bio-oil hydrogenation (HDO) process.

Figure 2.
Bio-oil hydrogenation reaction process.

Figure 3.
The mass flow at different temperatures of the mild HDO stage. (a) PRODUCT (model compound that represents the final product of bio-fuel, with same properties of gasoline, CH1.71); (b) ODF (oil-phase organic compounds of mild stage, CH1.47O0.11); (c) COKES (soluble coke deposit, Cs); and (d) COKEIS (insoluble coke deposit, Cis).

Figure 4.
Heat duty of the key blocks in the process.

Figure 5.
Sensitivity analysis for the practical production costs.

Figure 6.
Sensitivity analysis for the ideal production costs.

Figure 7.
Comparison of simulated production cost and the average cost of Chinese gasoline in 2018 [7,13].

| Properties | Bio-Oil | Mild-Stage Production | Deep-Stage Production |
|---|---|---|---|
| Density (kg L−1) | 1.1–1.2 | 1.2 | 0.84 |
| Viscosity (c St at 25 °C) | 19–25 | 7.4 | 2.8 |
| Water content (wt %) | 20–30 | 11.4 | 0.02 |
| Higher heating value (MJ kg−1) | 16–18 | 29.5 | 45.6 |
| pH | 2.7 | 4.2 | – |
| Elemental analysis (wt %, a. f) | |||
| C | 44–46 | 78.3 | 88 |
| H | 6–7 | 9.6 | 11.5 |
| O | 46–48 | 11.4 | 0.5 |
Table 2.
Kinetic parameters of bio-oil hydrogenation in the mild hydrogenation stage.
| Kinetic Reactions | A | E (kJ/mol) |
|---|---|---|
| BIO-OIL + 0.22H2→0.742ODF + 0.192AQO + 0.121H2O + 0.076CO2 | 4.31 × 10⁶ (m3 MPa−1 kg−1 h−1) | 80 |
| BIO-OIL→1.869Cs | 1.67 × 10⁴ (m3 h−1 kg−1) | 9.4 |
| BIO-OIL→1.869Cis | 5.09 × 10⁸ (m3 h−1 kg−1) | 169.5 |
| Cs→0.535BIO-OIL | 0.5003 (h−1) | 44.3 |
| ODF→1.269Cs | 6.58 × 10⁴ (m3 h−1 kg−1) | 16 |
| Cs→0.787ODF | 2 (h−1) | 45.3 |
| AQO→2.705Cs | 1.2 × 10³ (m3 h−1 kg−1) | 14.6 |
| Cs→0.396AQO | 5 (h−1) | 46.7 |
| Cs →Cis | 1.54 × 10³ (h−1) | 52.6 |
Table 3.
Installation factor and exponential factor.
| Equipment | Installation Factor | Exp |
|---|---|---|
| reactor (stainless steel) | 1.6 | 0.5 |
| heat exchanger (stainless steel) | 2.2 | 0.7 |
| separator | 3.02 | 0.7 |
Table 4.
Equipment costs and installation costs.
| Equipment | Equipment Cost (millions $) | Installation Cost (millions $) |
|---|---|---|
| RCSTR | 3.1 | 5.0 |
| RSTOIC | 1.7 | 2.8 |
| HEATX1 | 0.2 | 0.44 |
| HEATX2 | 0.23 | 0.5 |
| HEATX3 | 0.02 | 0.04 |
| SEP1 | 0.02 | 0.06 |
| SEP2 | 0.18 | 0.54 |
| SEP3 | 0.008 | 0.02 |
| SEP4 | 0.09 | 0.28 |
| Total | 15.2 |
| Unit Costs ($/t) | Practical Production Costs ($/t) | Ideal Production Costs ($/t) | |
|---|---|---|---|
| Bio-oil | 188.55 [13] | 419.75 | 415.05 |
| Catalyst (Ni-based) | 34,444 [7] | 76.68 | 0.0032 |
| Hydrogen | 1500 [13] | 115.21 | 113.7 |
| Steam | 28.88 | 346.21 | 344.58 |
| Cooling water | 0.46 | 0.063 | 0.062 |
| Labor costs | 28.88 | 28.88 | |
| Fixed costs | 21.13 | 21.13 | |
| Other costs | 16.36 | 16.36 | |
| Total | 1024.27 | 939.76 |
© 2019 by the authors. Licensee MDPI, Basel, Switzerland. This article is an open access article distributed under the terms and conditions of the Creative Commons Attribution (CC BY) license (http://creativecommons.org/licenses/by/4.0/).
Share and Cite
MDPI and ACS Style
Ma, X.; Pang, S.; Zhang, R.; Xu, Q. Process Simulation and Economic Evaluation of Bio-Oil Two-Stage Hydrogenation Production. Appl. Sci. 2019, 9, 693. https://0-doi-org.brum.beds.ac.uk/10.3390/app9040693
AMA Style
Ma X, Pang S, Zhang R, Xu Q. Process Simulation and Economic Evaluation of Bio-Oil Two-Stage Hydrogenation Production. Applied Sciences. 2019; 9(4):693. https://0-doi-org.brum.beds.ac.uk/10.3390/app9040693
Chicago/Turabian StyleMa, Xiaoyuechuan, Shusheng Pang, Ruiqin Zhang, and Qixiang Xu. 2019. "Process Simulation and Economic Evaluation of Bio-Oil Two-Stage Hydrogenation Production" Applied Sciences 9, no. 4: 693. https://0-doi-org.brum.beds.ac.uk/10.3390/app9040693
Note that from the first issue of 2016, this journal uses article numbers instead of page numbers. See further details here.