Article

Research on the Structure and Control Strategy of a Novel Power Electronic Transformer for AC/DC Hybrid Distribution Network

1
State Key Laboratory of Alternate Electrical Power System with Renewable Energy Sources, North China Electric Power University, Beijing 102206, China
2
China Electricity Council, Beijing 100761, China
*
Author to whom correspondence should be addressed.
Submission received: 23 January 2019 / Revised: 14 February 2019 / Accepted: 16 February 2019 / Published: 19 February 2019
(This article belongs to the Special Issue Emerging Power Electronics Technologies)

Abstract

:
Power electronic transformers (PETs), as the core devices of the energy internet, are the key to achieve both effective consumption for renewable energy and the safe and coordinated operation for AC/DC hybrid system. In order to overcome the shortcomings of the existing PETs, a novel PET with an improved structure that applicable for multi-voltage level AC/DC hybrid distribution network is proposed. The topology of the proposed PET is analyzed, and the corresponding control methods are suggested for different parts. The input stage utilizes the modular multilevel converter structure and applies the virtual synchronous machine control strategy to enhance the inertia and damping of the system. The power of the output stage is adjusted flexibly and that enables the PET to provide certain power support to the upper grid and participate in its primary frequency regulation. A combined connection of input-series output-series and input-series output-parallel is applied for the dual-active-bridge modules of the isolation stage to enable network interconnection and electrical isolation of AC/DC grids with significantly different voltage levels. A power coordinated control method is then proposed to meet the power demand of the distribution networks connected to the output stage and ensure stable operations of PET simultaneously. The reliability and efficiency of the proposed PET topology and control strategy for AC/DC hybrid distribution network are finally verified via PSCAD/EMTDC simulation.

1. Introduction

With the gradual depletion of fossil fuel, the increasing environmental pollution, and the large-scale development of distributed energy, the existing grid infrastructure becomes inadequate to meet the future needs of development, which makes the energy internet come into being. American scholar Jeremy Rifkin has proposed in the “Third Industrial Revolution” that the energy internet is a next-generation smart grid that deeply integrates energy with the Internet. The energy internet is supported by advanced power electronic devices, high-speed digital communication technology, and efficient distributed control technology. It aims to provide a reliable energy support system [1]. In 2011, the University of North Carolina proposed an energy internet architecture based on future renewable electric energy delivery and management (FREEDM) system. Intelligent energy management (IEM) device, as the core of FREEDM, consists of a power electronic transformer (PET) that is based on high-frequency isolation, in order to achieve system interconnection of AC/DC grids as well as flexible control and intelligent management of power flow [2]. Moreover, Europe’s universal and flexible power management (UNIFLEX-PM) project utilizes the power converter based on the PET structure, and possesses many advantages. For example, bidirectional flow of active and reactive power can be achieved; power quality and robustness of power grid can meet the international standards of grid connections for distributed energy systems; electrical isolation between different ports can be also achieved; and the operation of modular structure is reliable which also improves the convenience of maintenance [3]. As the core device of energy internet, PETs can provide flexible and standard power electronic interfaces for various distributed energy sources and loads [4,5]. Meanwhile, real-time acquisition and control of the electrical quantities of each port can be performed through PETs to meet the requirements for grid dispatching and provide data support for the effective and stable operation of energy internet [6].
With the increasing voltage level, the traditional two-level or three-level voltage source converter PET struggles to meet the needs of medium- and high-voltage applications. Hence, different topologies of multilevel converters have been proposed for PET applications. For instance, the cascaded H-bridge multilevel inverter (CHB-MLI) PETs is widely used for medium- and high-voltage applications for its simple control, modularity, and small voltage stress of switching tube [7,8,9]. However, the CHB-MLI PET requires plenty of high-frequency transformers and controlled switching devices in three-phase applications, which is uneconomical [10,11]. Recently, as modular multilevel converters (MMCs) becomes widely applied, the PETs that based on MMC structure has attracted more attention [12,13,14] since it applicable to higher voltage levels and able to provide higher power quality and conversion efficiency [15]. The isolated DC/DC converters of existing PETs mainly adopt the ISOP connection, and the converter of every output port connects to the ISOP output side in parallel. In this case, additional DC/DC converters need to be installed to obtain the access to AC/DC grids with different voltage levels, which will complicate the system and reduce economic benefits [16].
On the other hand, the pros and cons of PET control methods can have an immediate impact on the performance of an entire system. Most of the existing research focuses on direct power control or droop control, etc. [17,18]. However, with an increasing proportion of distributed energy resources in the distribution network, it becomes difficult, or impossible, for traditional control methods to control the grid voltage and frequency, which further reduces the inertia of the grid. Moreover, traditional control methods can cause frequency fluctuation and power imbalance of the power grid when the power output is unstable or the load changes, which is against the operation safety and the stability of the power grid. Therefore, the capability to maintain the stability of the lower grid connected to the output stage, as well as provide friendly support to the upper grid, is of great significance for improving the stability of entire AC/DC hybrid distribution network.
Based on the mentioned considerations, this paper proposes a novel PET that is applicable for an AC/DC hybrid distribution network. The input stage utilizes MMC and applies the virtual synchronous machine (VSM) control strategy to improve the inertia and damping of the system, which is more friendly to the upper power grid. The isolation stage applies a combined connection of input-series output-series (ISOS) and input-series output-parallel (ISOP), which effectively reduces the amount of DC/DC modules used, increases the flexibility of access to AC/DC distribution networks of multi-voltage levels, and improves economic benefits. The output stage enables the PET to respond to the frequency fluctuation of the upper power grid and participate in primary frequency regulation (PFR) through controlling the power of the DC output port, which improves the stability of the power grid. In addition, a power coordination control method is proposed that can coordinate power flows among every port when the power demand of the output stage changes, by means of adjusting the high-voltage DC voltage of the input and isolation stages.

2. System Topology

2.1. Topology of Conventional PET

Subject to the withstand voltage and power rating of existing power semiconductor devices, conventional PETs mainly employ the structure of CHB-MLI for medium- and high-voltage applications, as shown in Figure 1. Due to the single-phase structure of CHB-MLI, three sets of the same single-phase CHB-MLI PET are needed to meet the application scenario of a three-phase distribution network, which results in the extensive use of high-frequency transformers and controlled switching devices. As passive components constitute a large proportion of the volume and weight in PETs, the extensive use of high-frequency transformers is unfavorable for improving the power density of PET. In addition, the output DC voltage of a cascaded structure contains the double-frequency component which requires an additional double-frequency filter to ensure the output voltage quality.
At the isolation stage of conventional PETs, the isolated DC/DC converters employ the connection of ISOP. Every port converter of the output stage connects to the low-voltage DC-BUS of the isolation stage in parallel, thereby causing the similarity of the voltage levels of the output ports. In this case, additional DC/DC converters need to be installed to obtain access to AC/DC grids with significantly different voltage levels, which will complicate the system and reduce economic benefits.

2.2. Topology of the Proposed Novel PET

The proposed novel PET consists of three parts, namely the input stage, the isolation stage, and the output stage. The topology is shown in Figure 2. The input stage connects with the medium- and high-voltage AC distribution network by MMC, and the sub-modules (SMs) of MMC are connected in series to make PET suitable for higher voltage levels. MMC uses relatively fewer filters while retaining considerably high overall operational efficiency and power quality, and lowering the requirement of withstand voltage of power semiconductor devices. Furthermore, the input stage can achieve unity power factor or constant power factor operation through effective regulating.
The isolation stage applies the dual-active-bridge (DAB) bidirectional DC/DC converters as the core component to enable up/down voltage conversion and electrical isolation among different ports. In comparison to the other DC/DC converters, DAB has high power transfer capability, and has the advantages of a modularized symmetrical structure, bidirectional power flow capability, rapid dynamic response, and easy implementation of soft switching. As shown in Figure 2, the isolation stage consists of two parts where some DAB modules connect with the AC port at the output stage via ISOS, others connect to the DC port at the output stage via ISOP. The isolation stage of existing PET only adopts the ISOP connection, while the proposed combined connection of ISOS and ISOP enables the output stage to meet the access requirements of AC/DC power grids with significantly different voltage levels more easily.
The output stage includes two output ports, namely the AC output port and the DC output port. Different structures can be applied for the port converter according to the voltage level of the connected network and the power transmission mode, etc. In the model established in this paper, the AC output port connects to the 10 kV AC distribution network and the MMC structure is utilized. In addition, a three-phase two-level inverter structure can be adopted when the AC output port connects to the low-voltage grid. The DC output port connects the low-voltage DC distribution network through a buck/boost-type DC/DC converter. The study conducted in this paper focuses on the PET with two output ports at the output stage, while it is worth mentioning that the amount of AC/DC output ports can be increased as needed.

3. Control Strategy

3.1. Input Stage Control Strategy

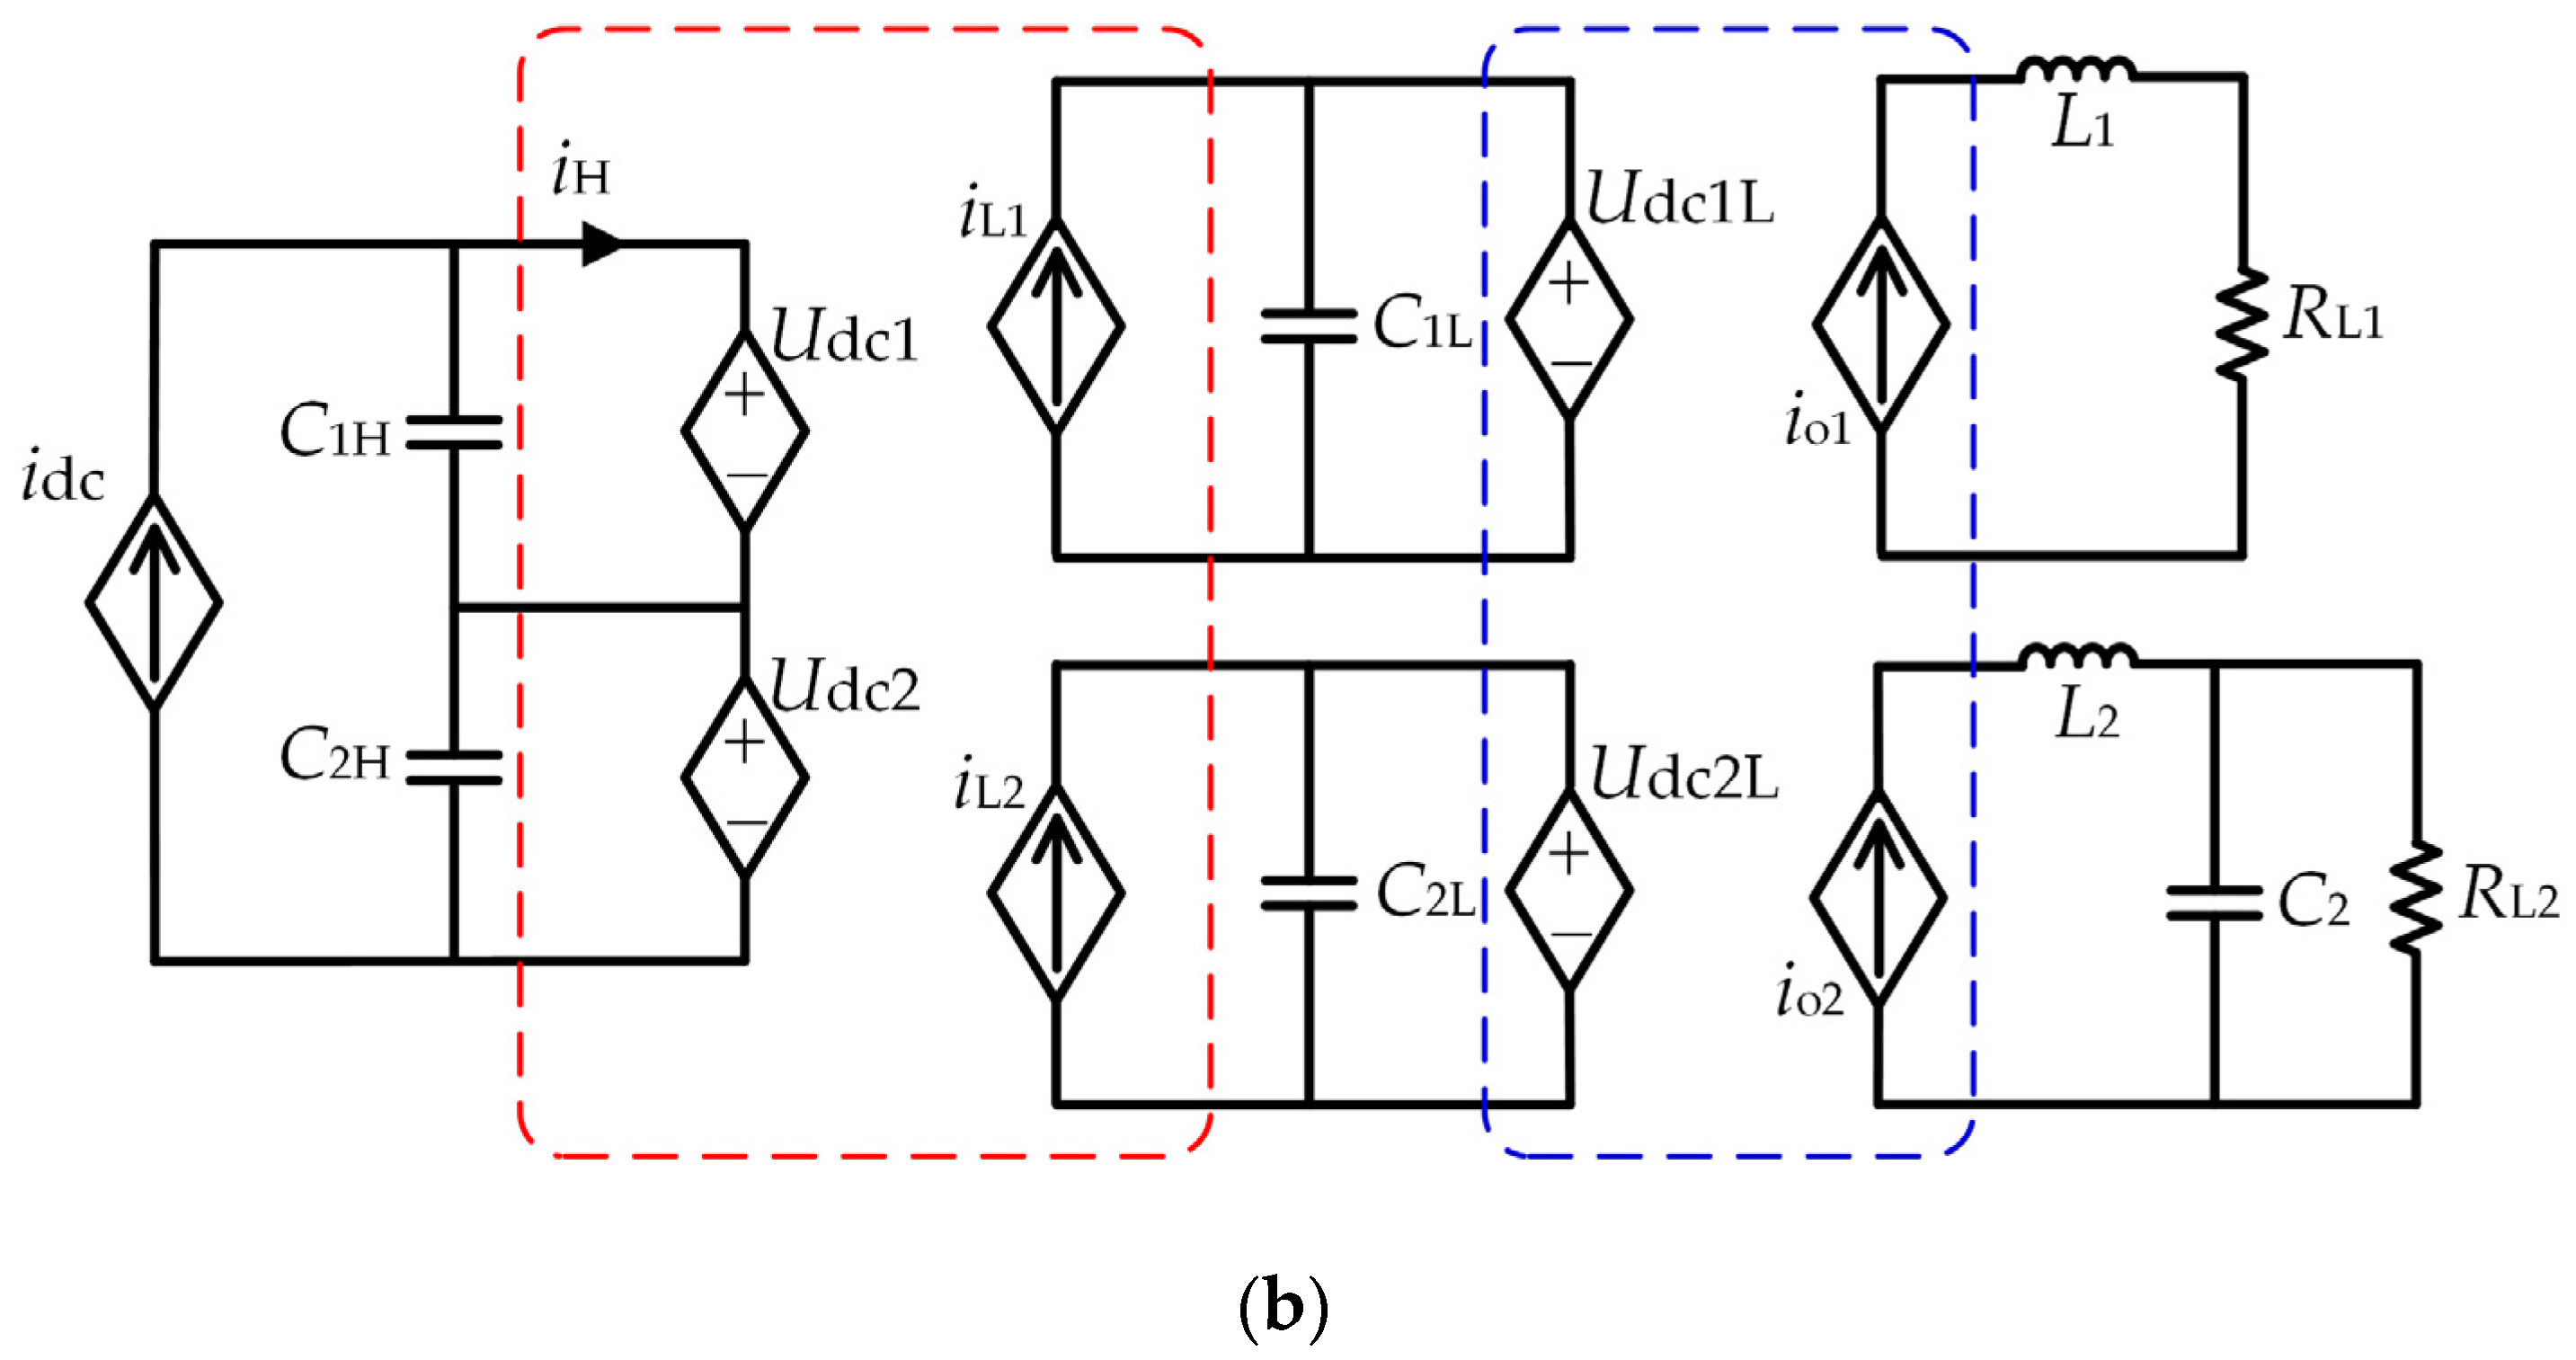
3.1.1. Mathematical Model of MMC

The input stage adopts the MMC structure as shown in the blue part of Figure 2. It can be seen that the upper and lower arms of each phase consist of the same amount (N) of sub-modules which are connected in series, and N is determined by the voltage level. usj and isj (j = a, b, c) represent the voltage and current on the AC side, respectively. Rs and Ls represent the equivalent filter resistance and equivalent filter inductance on the AC side, respectively. upj and ipj represent the voltage and current of the upper arm of phase j, and unj and inj represent the voltage and current of the lower arms of phase j, respectively. R0 and L0 represent the arm resistors and arm inductors, and Udcp, Udcn, and Udc represent the positive electrode potential, negative electrode potential, and inter-electrode voltage on the DC side of MMC, respectively.
R0 is neglected due to its considerably small value, and Equations (1)–(3) can be obtained according to Kirchhoff’s law:
u s j i s j R s L s d i s j d t = L 0 d i p j d t + U dcp u p j
u s j i s j R s L s d i s j d t = L 0 d i n j d t + U dcn + u n j
i s j = i n j i p j
Since Udcp + Udcn = 0, Equation (4) can be derived through Equations (1)–(3):
( L s + L 0 2 ) d i s j d t = i s j R s + u s j u n i u p i 2

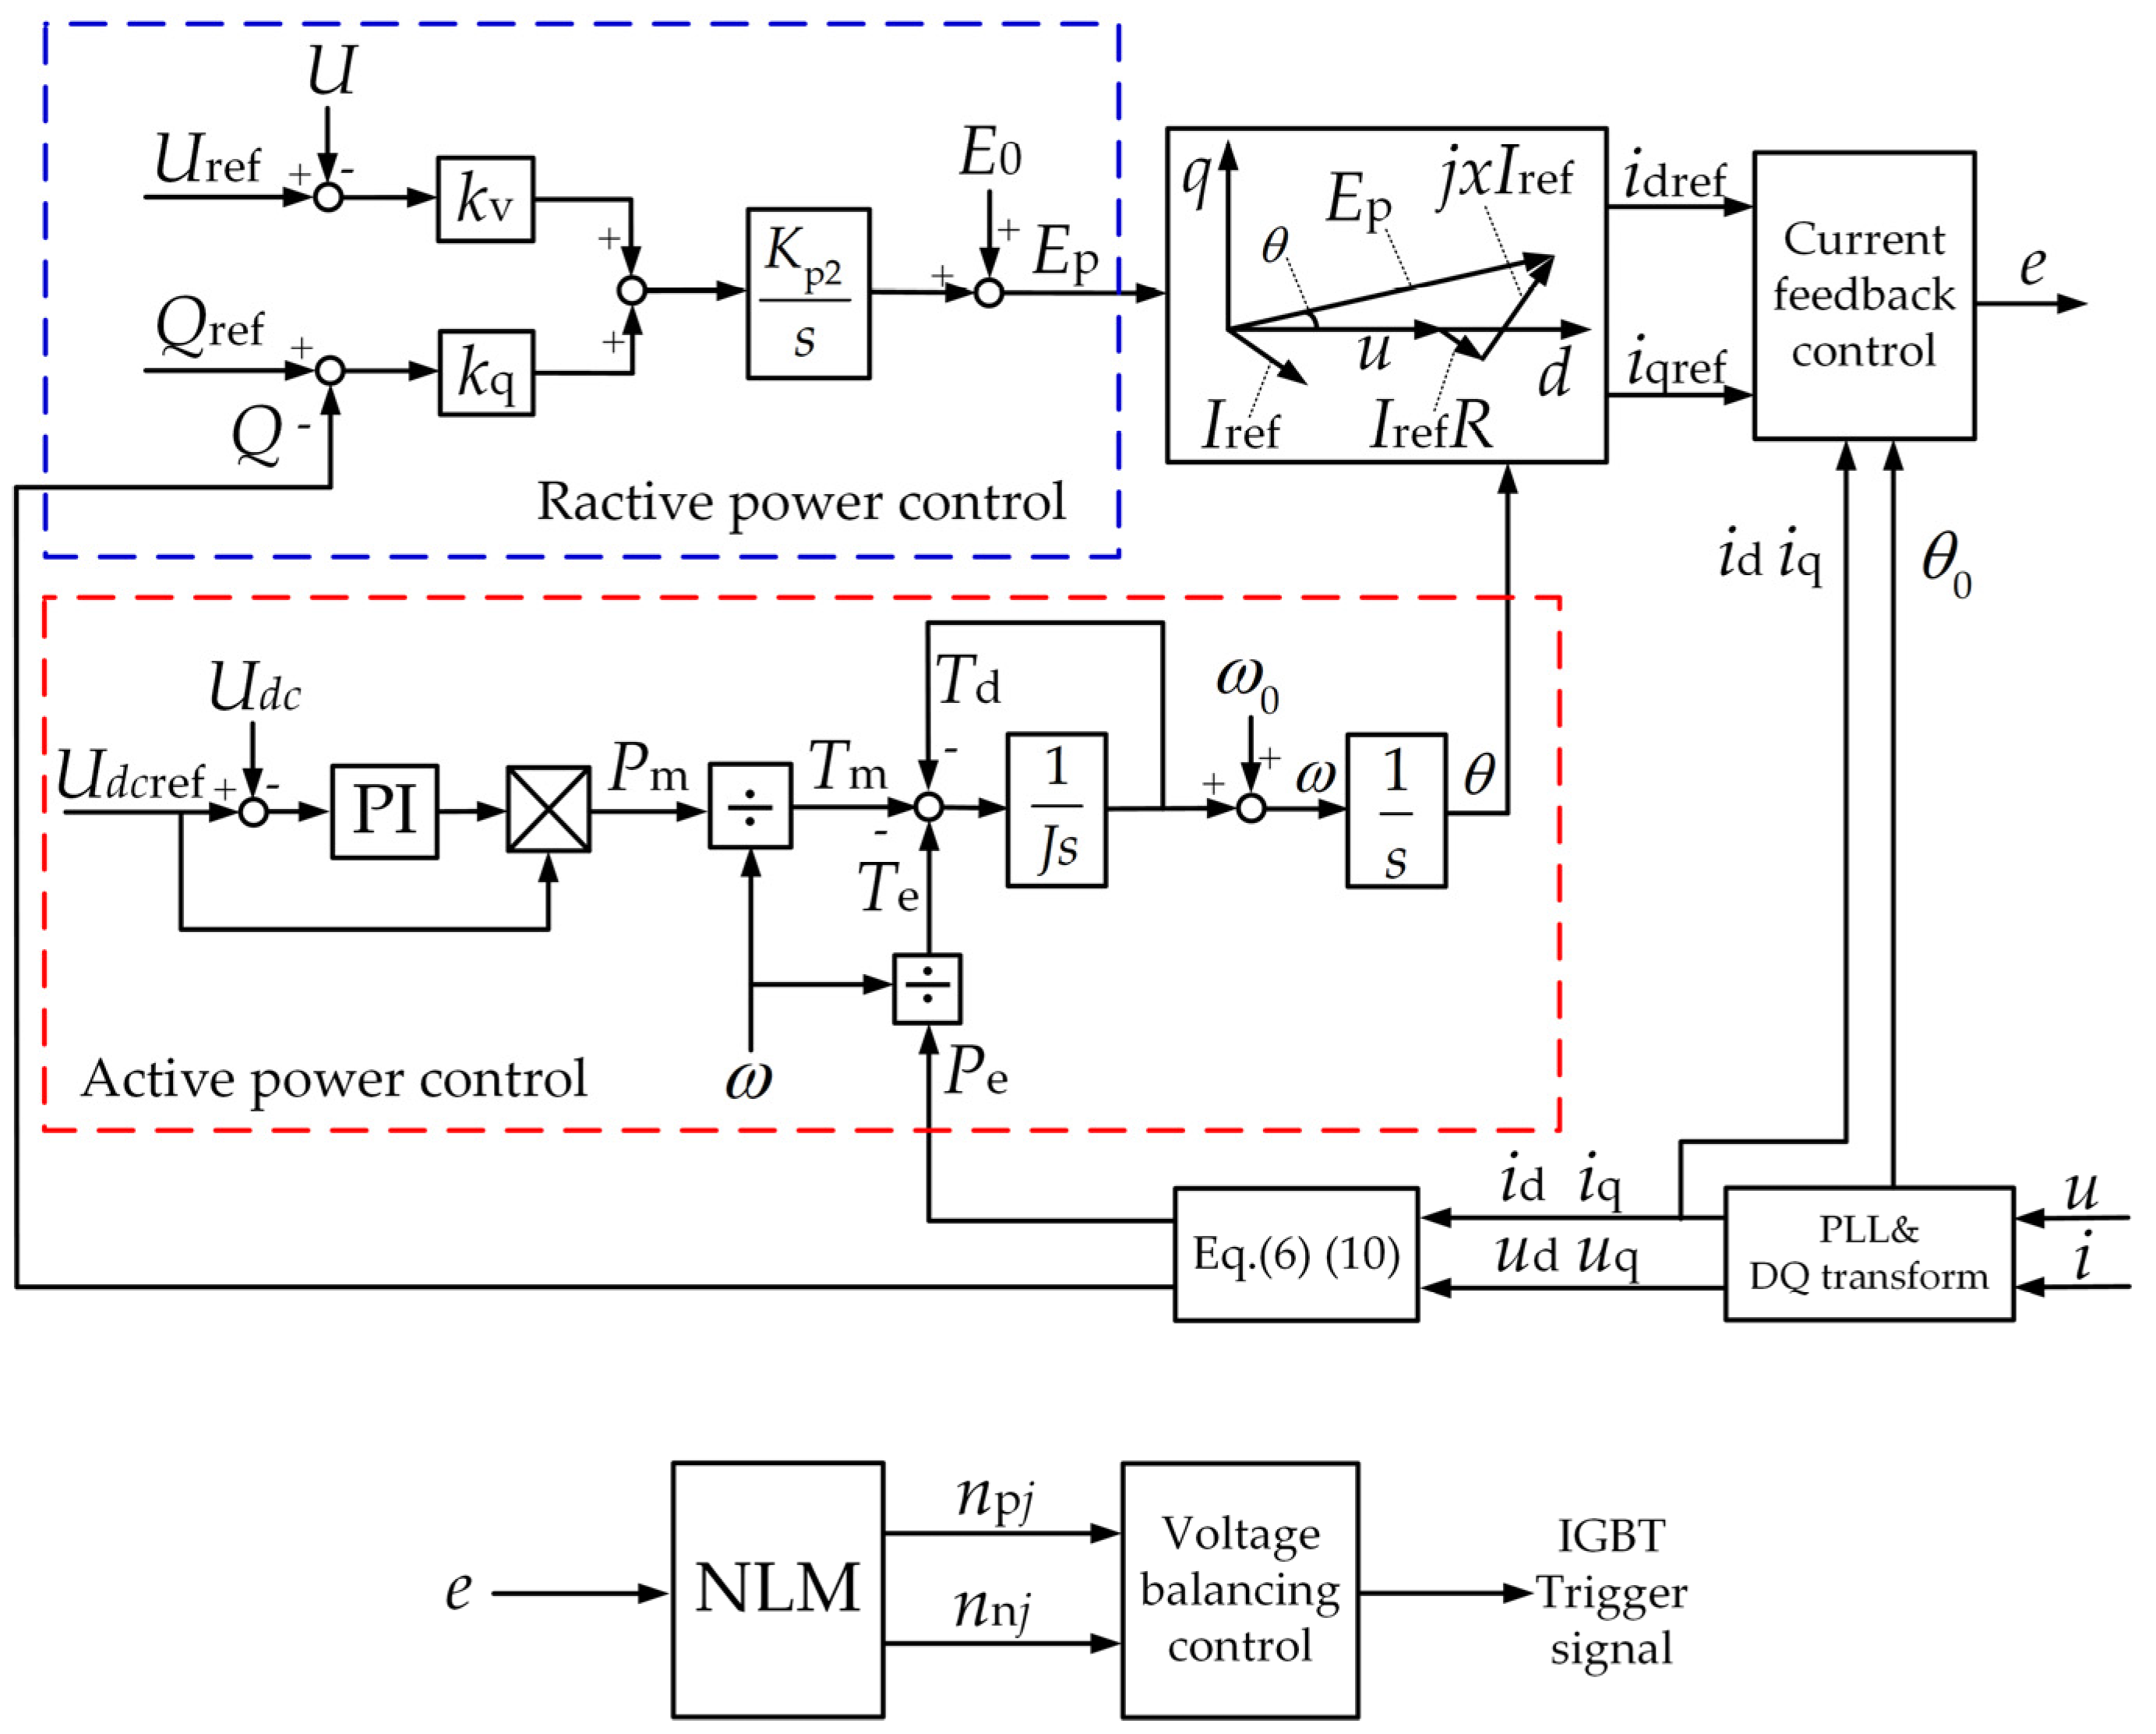
3.1.2. VSM-Based MMC Control Strategy

The MMC converter of the input stage uses the VSM-based control strategy, and can operate by simulating the performance of a synchronous motor. Here, the MMC converter can be simplified into a synchronous motor as shown in Figure 3, where the DC side of MMC is equivalent to the mechanical load of a synchronous motor, Tm represents the virtual mechanical torque, and Te represents the virtual electromagnetic torque.
The mechanical motion equation of VSM can be expressed by Equation (5) when the number of pole pairs of VSM is set to be 1:
{ J d ω d t = T e T m D ( ω ω 0 )   d θ d t = ω
where J represents the virtual rotational inertia, D represents the damping coefficient, ω represents the mechanical angular velocity, ω0 represents the synchronous angular velocity of the grid, and θ represents the power angle.
Apply the Park’s transformation to the grid voltage (u) and the input current (i) of the AC side, and the input electromagnetic power of VSM in the rotating d-q reference frame can be achieved through Equation (6). The virtual electromagnetic torque of VSM is given by Equation (7).
P e = 1.5   ( u d i d + u q i q )
T e   =   P e / ω
where Pe is the input electromagnetic power of VSM, ud and uq are the d-axis component and the q-axis component of u in the rotating d-q axis, respectively, and id and iq are the d-axis component and the q-axis component of i in the rotating d-q axis.
The rated output active power of VSM can be obtained through Equation (8) from the DC voltage loop, and the virtual mechanical torque is expressed by Equation (9).
P m = ( ( K p 1 + K i 1 1 s ) ( U dcref U dc ) U dcref )
T m = P m / ω
where PM is the rated output active power of VSM, Kp1 and Ki1 are the proportional parameter and integral gain parameter for the PI controller of the DC voltage loop, respectively, and Udcref is the DC voltage reference.
The virtual electromagnetic equation of VSM is given by Equation (10):
{ L d i d t = R i + u e i = [ i a , i b , i c ] T u = [ u a , u b , u c ] T e = [ e a , e b , e c ] T
where L and R are the synchronous reactance and the armature resistance, e is the back electromotive force (EMF) vector, u is the phase terminal voltage vector, and i is the stator current vector.
Based on the previously mentioned mathematical model of MMC and Equation (10), Equation (11) can be derived as follows:
{ L = L s + L 0 2 R = R s i = i s j u = u s j e = u n j u p j 2
According to the excitation equation of synchronous motor, the virtual potential of VSM and reactive power in the rotating d-q reference frame can be obtained through Equations (12)–(13):
E p = E 0 + ( K p 2 s ) ( k q ( Q ref Q ) + k v ( U ref U ) )
Q = 1.5 ( u d i d u q i q )
where E0 is the no-load potential of VSM, kq and kv are the reactive power control coefficient and the voltage control coefficient, respectively, Kp2 is the integral gain parameters, Qref and Q are the reference value and actual value of the reactive power, respectively, and Uref and U are the reference value and measured value of the RMS voltage of grid.
Hence, it can be learned from the Equations (12)–(13) that the terminal voltage and reactive power can be controlled by adjusting the virtual potential of VSM.
Figure 4 shows the VSM-based control diagram of MMC where npj and nnj represent the amount of inserted submodules in the upper and lower arms of phase j, respectively. The nearest level modulation (NLM) technique is employed to control multilevel power converters, and details of the modulation technique have been widely introduced from published literature [19,20].

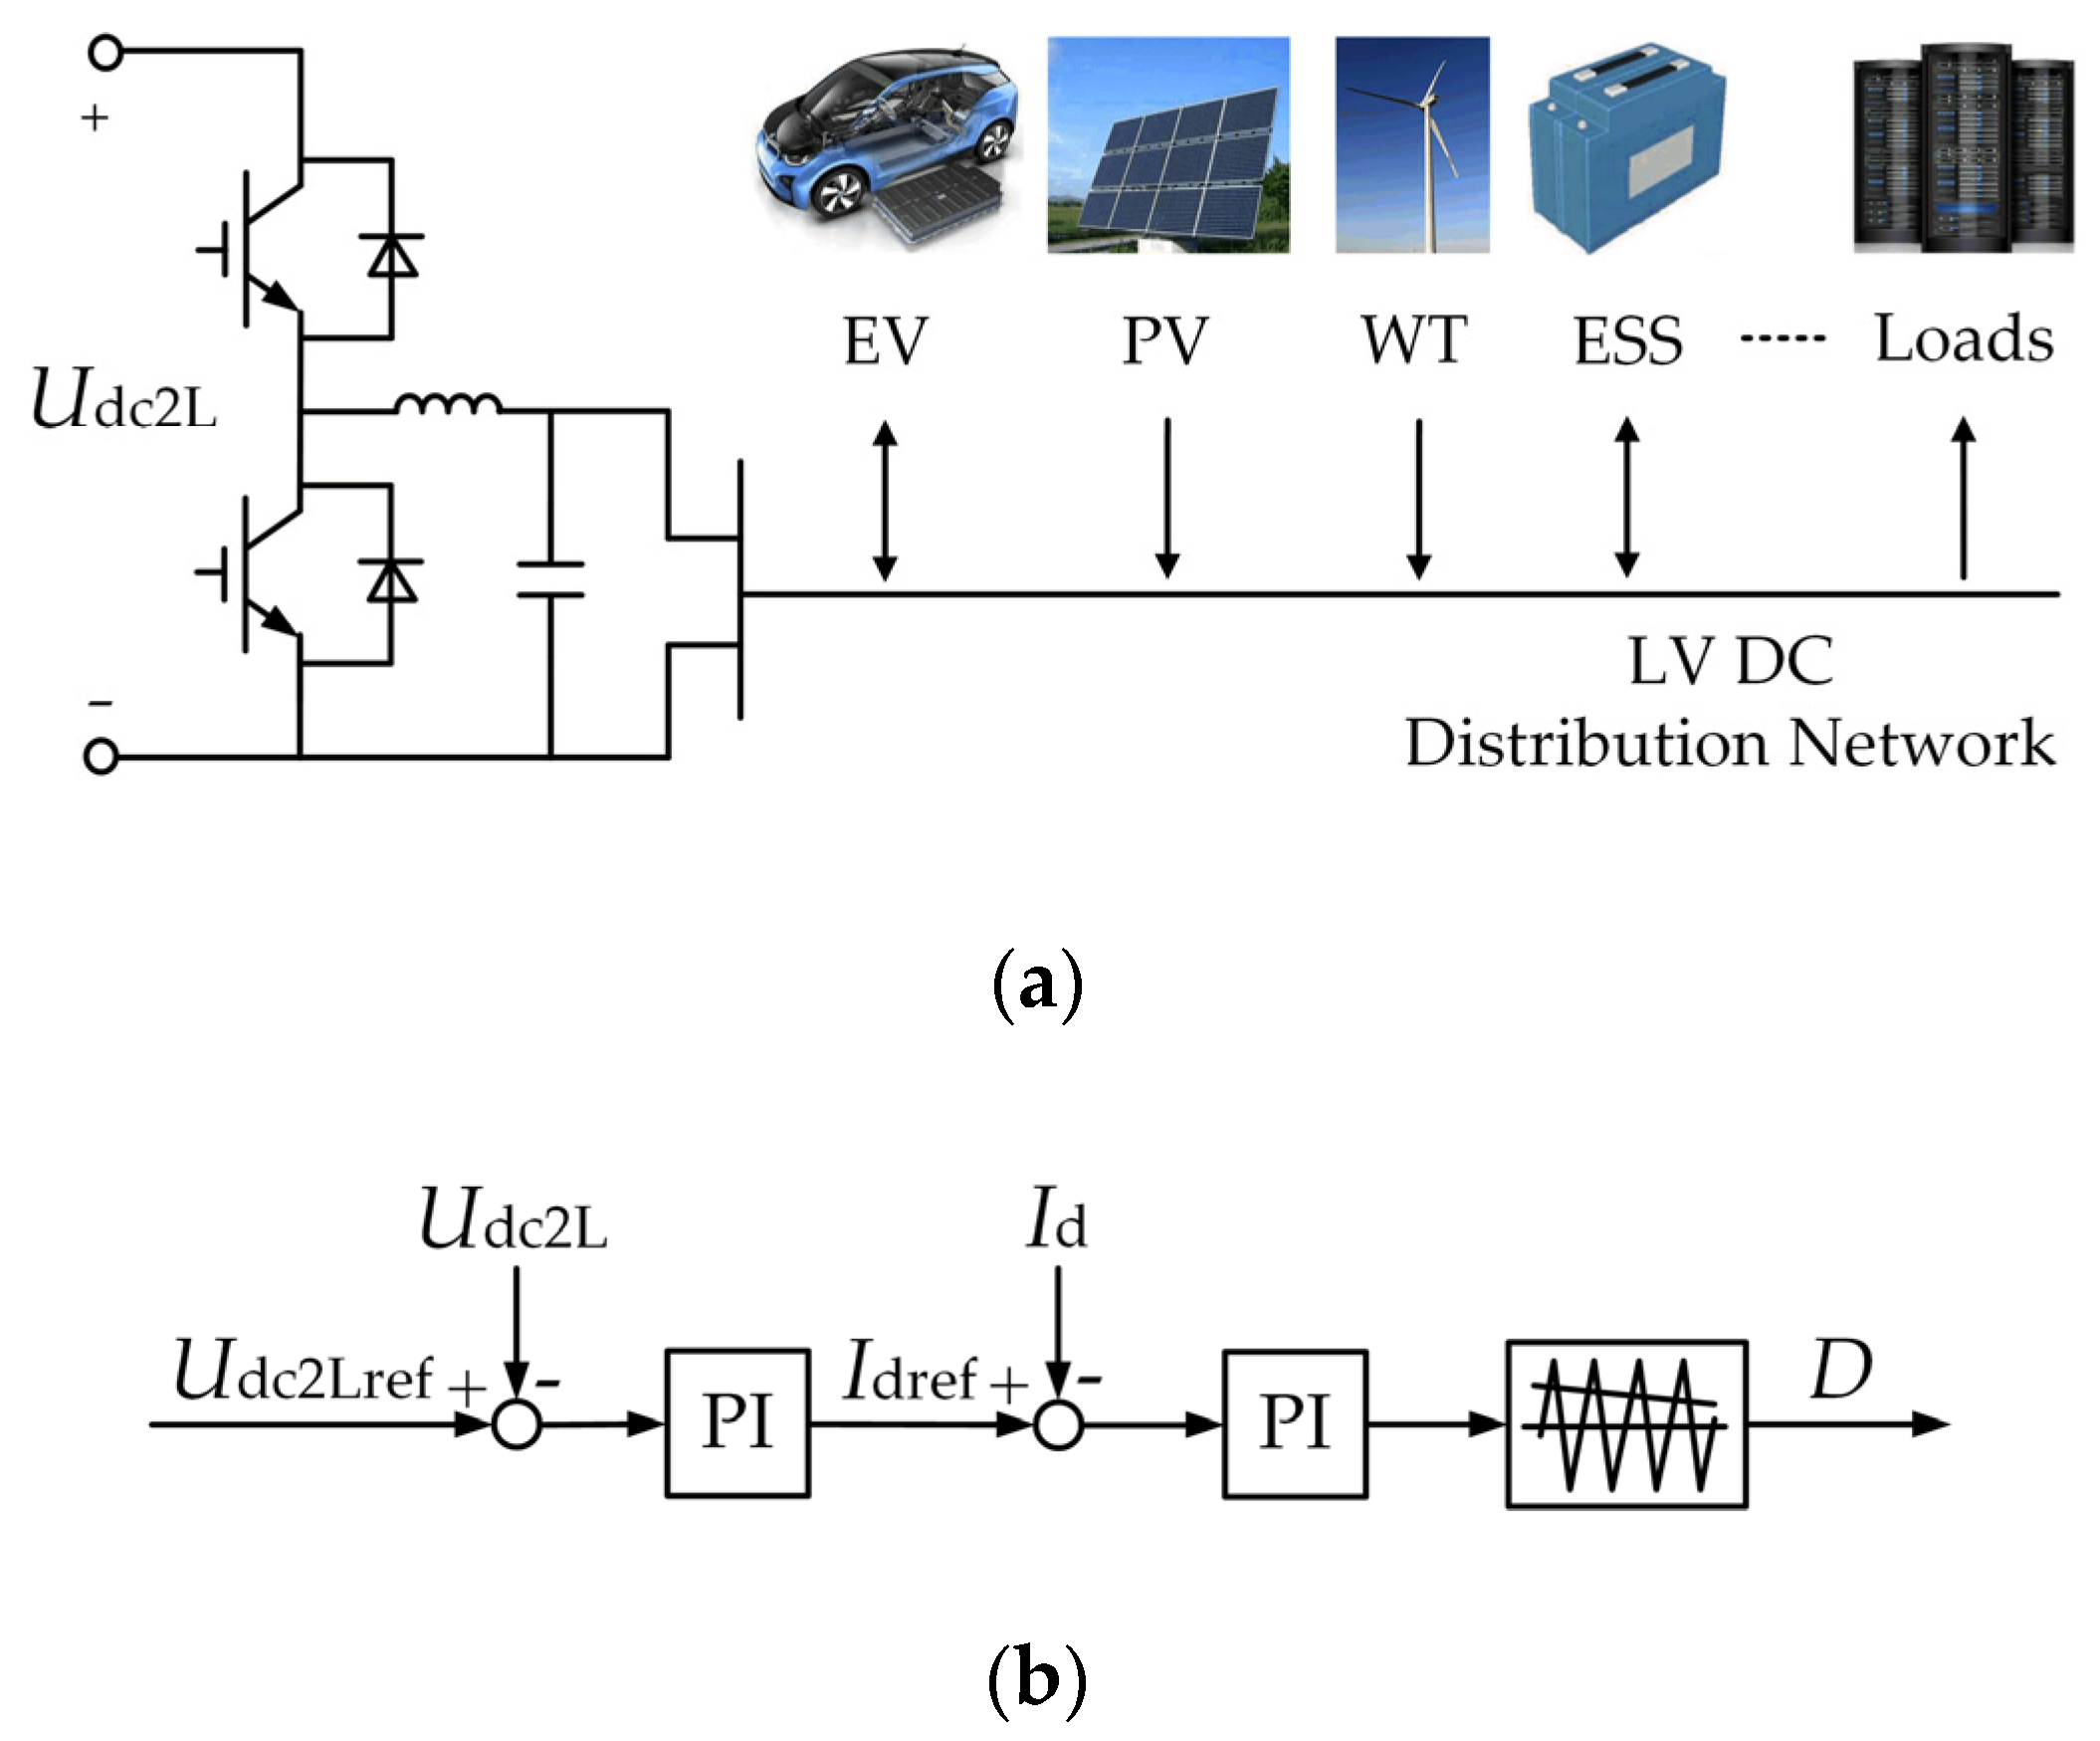
3.2. Output Stage Control

The output stage of the proposed novel PET shown in Figure 2 consists of an AC output port and a DC output port. The AC output port connects the medium- and low-voltage AC distribution networks, and the DC output port connects the low-voltage DC distribution network. Different structures can be applied for the port converter according to the voltage level of the connected network and the power transmission mode, etc.
As explained previously, the AC output port adopts the MMC structure and connects to the 10 kV AC distribution networks in the model of this paper. The circuit topology is shown in the grey part of Figure 2 and the mathematical model of MMC is explained in Section 3.1.1. The control method of the converter depends on the operation mode of the power grid it connects, and the traditional P/Q control is applied when the connected network is grid-tied. Figure 5 shows the block diagram of the inverter where the outer loop power control adjusts the active power and reactive power, and the inner current loop is designed to follow the reference of the output current in the rotating d-q axis and obtain the modulating signal. The inverter uses V/F control when the point of common coupling (PCC) is disconnected in order to provide a voltage source with constant voltage amplitude and frequency for the lower grid.
The DC output port connects the low-voltage DC distribution network by a buck/boost converter. It adopts a dual-loop control strategy that with outer voltage loop and inner current loop in order to quickly stabilize the input voltage instead of directly controlling the power. Figure 6 a,b show the topology and control block diagram of DC output port, respectively, where Udc2 is the measured value of input DC voltage, Udc2ref is the reference of Udc2, Id is the output DC current, Idref is the reference of Id, and D is the control signal of the converter.
Besides being partially supplied by the upper grid via PET, the load within the DC distribution network is mainly supplied by renewable electricity generation such as wind turbines (WTs) and photovoltaics (PVs). When the load changes or the power supply fluctuates, the real-time balance of the power and continuous power supply for the load can be guaranteed by the energy storage system (ESS) within the DC distribution network. Therefore, it is possible to enable PET to provide auxiliary services such as frequency regulation for the upper grid by adjusting the output power of DC output port.
The power (ΔPPFR) participating in the PFR of the upper power grid from DC port can be calculated by Equation (14) and the output power set value (P2set) is given by Equation (15).
Δ P PFR = k f ( f f 0 )
P 2 set = P 0 + Δ P PFR
where kf is the active power-frequency (P-f) droop coefficient, f0 is the rated grid frequency, f is the measured value of grid frequency, P2set is the output power set value of DC port, and P0 is the initial output power.
Due to the power limit of ESS, the output power of DC port has upper and lower bounds as shown in Equation (16):
P min P set P max

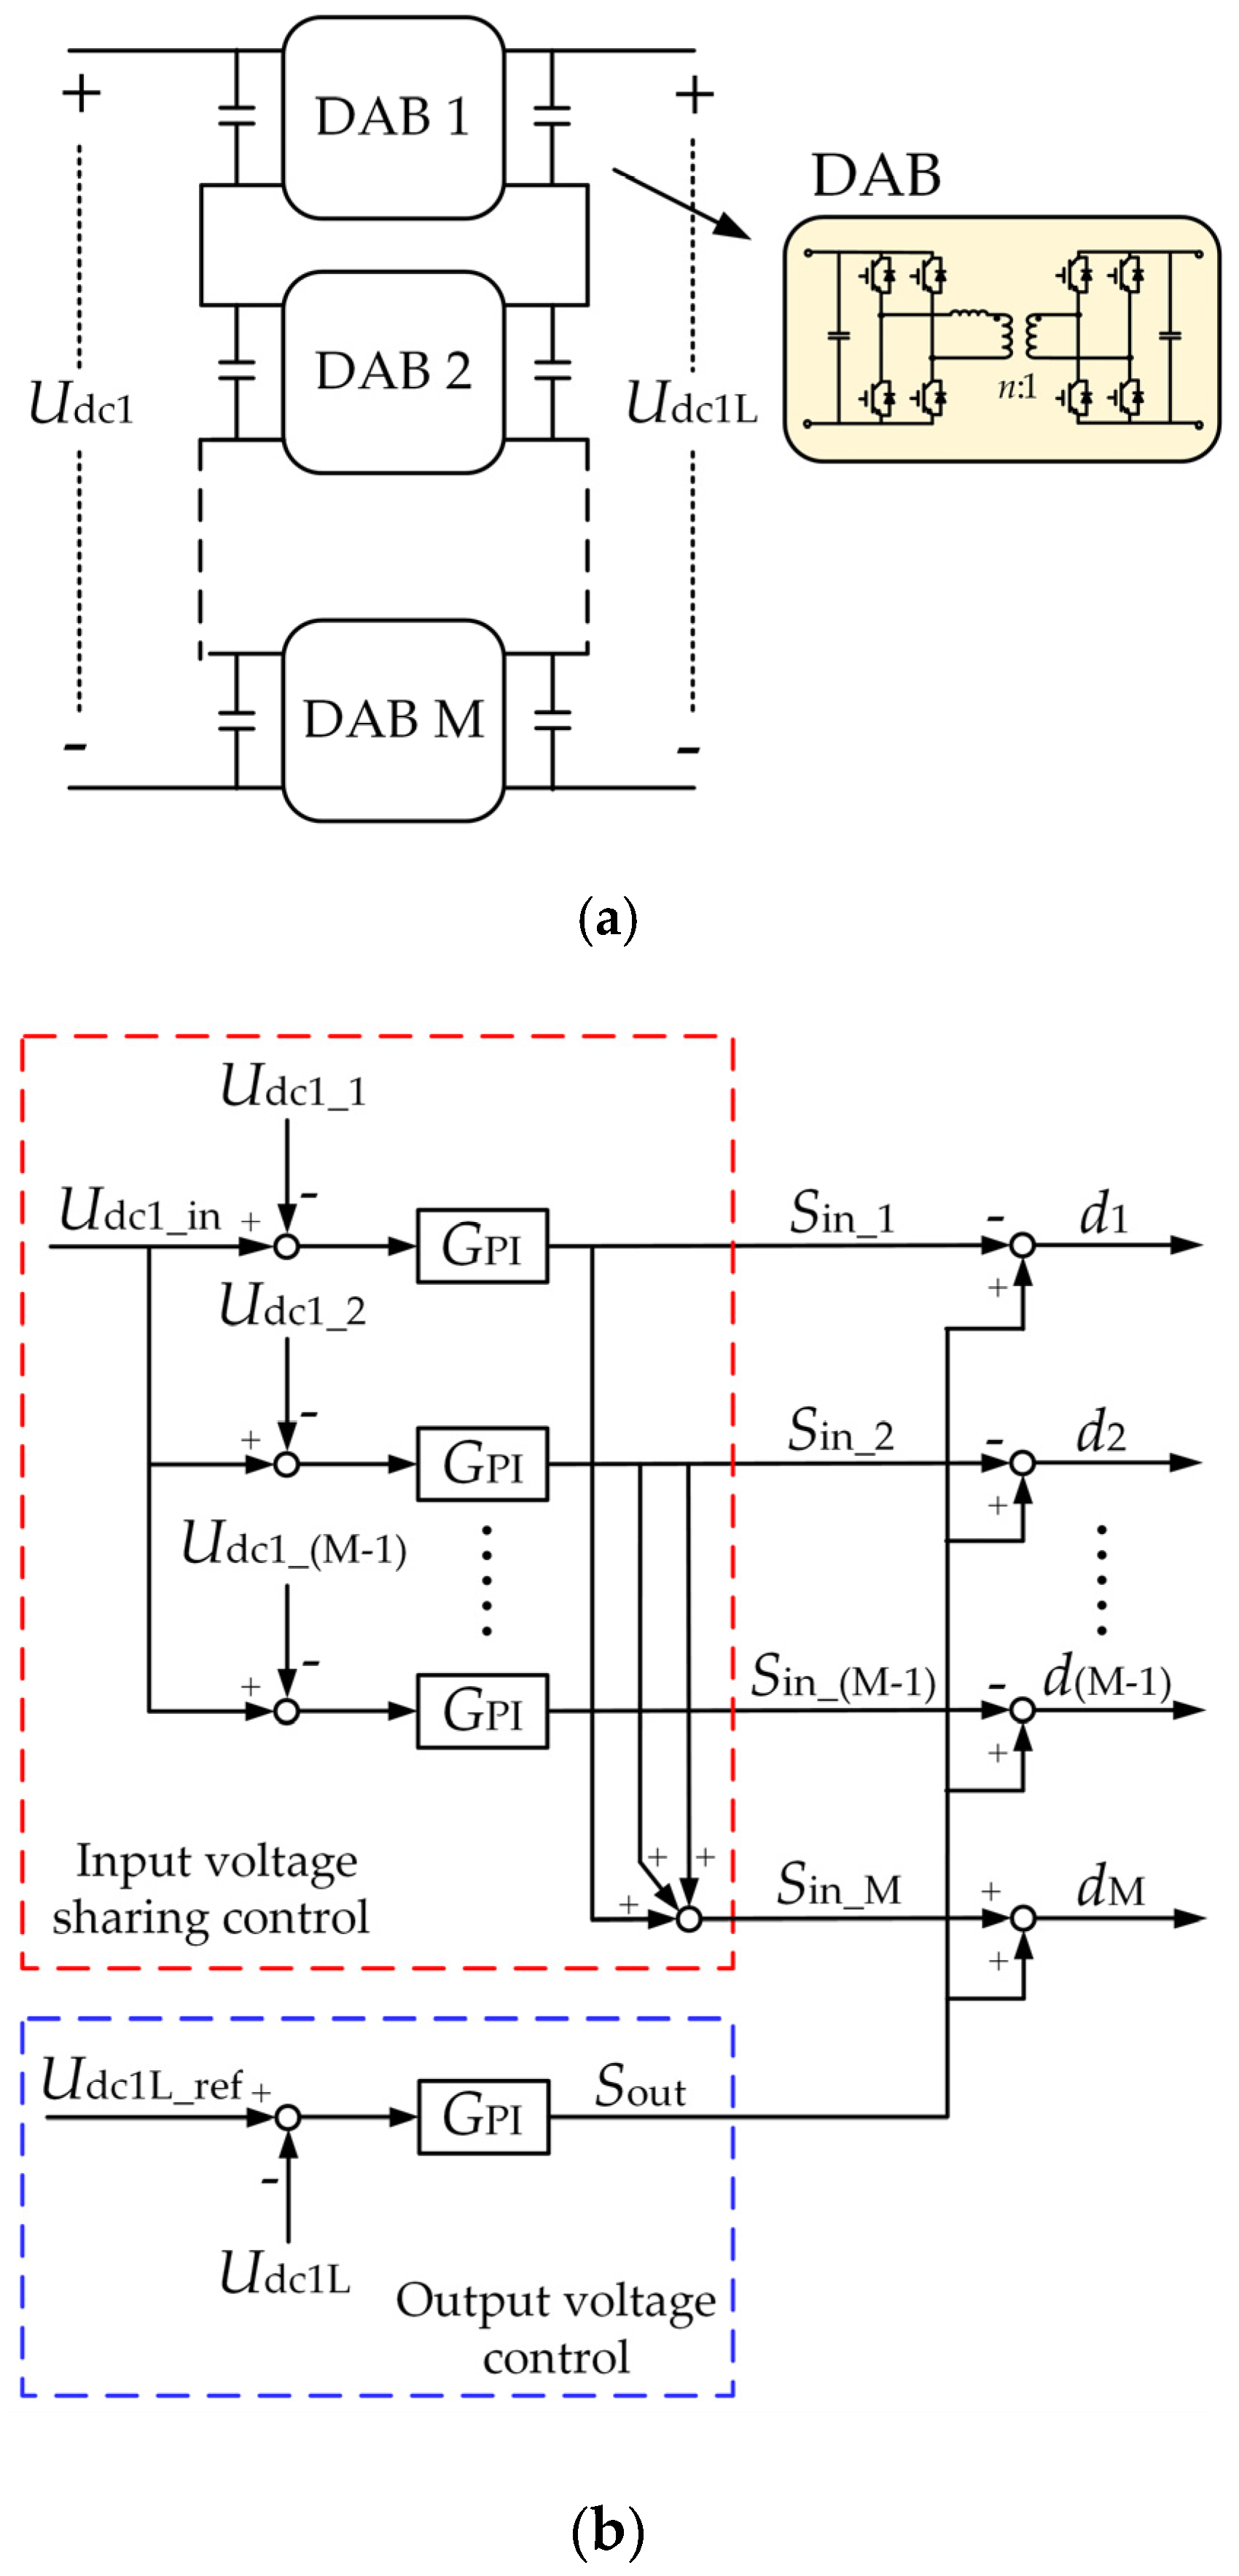
3.3. Isolation Stage Control

As shown in Figure 2, the isolation stage of the proposed novel PET enables the medium- and high-voltage AC/DC distribution network to flexibly connect with multiple medium- and low-voltage AC/DC distribution networks of significantly different voltage levels through a reasonable series or parallel connection of DAB modules. ISOS and ISOP connection are usually used for DAB modules in consideration of the difference between the voltage levels of the input and output stages. Benefitting from the output-series, ISOS is able to connect with the output port of relevantly high voltage levels and is applied for the part of the isolation stage that connects with the medium- and low-voltage AC output port, while ISOP is applied for the other part of the isolation stage that connects with the low-voltage DC output port due to the output-parallel being applicable for relevantly low voltage levels and high power levels.
Figure 7a shows the topology of ISOS where Udc1 and Udc1L are the input and output side voltages of ISOS, respectively. Udc1 is determined by the DC side voltage (Udc) of the input stage and the input side voltage (Udc2) of ISOP at the isolation stage. The proper sharing of input and output voltages of DAB modules is the key factor to ensure reliable and stable operations for ISOS and PET. Therefore, a control strategy that decouples the input voltage sharing control loop and the output voltage control loop is utilized in this paper [21], as shown in Figure 7b. Where, Udc1_in is the reference of the input voltage of each DAB module and is equal to Udc1/M, Udc1_i is the actual value of the input voltage of the ith DAB module, Udc1L_ref is the reference of the output voltage of ISOS.
It can be learned from Figure 7b that the sum of the output signals from the input voltage sharing control loop is zero, which enables the decoupling between the output voltage control loop and the input voltage sharing control loop.
Figure 8a shows the topology of ISOP where Udc2 and Udc2L are the input and output side voltages, respectively. It can be seen that the output sides of all DAB module connect in parallel to the same DC bus, and they have equal output voltages. Since the output side voltage of ISOP is controlled by the DC port converter in the output stage, it is only necessary to control the input voltage of each DAB module to enable reliable and stable operations of ISOP, and the control block diagram is shown in Figure 8b.

3.4. Power Coordinated Control

The PET should be able to offer coordinated control for power flows of all ports when the power demand of the output stage changes, in order to ensure safe and stable operations of the AC/DC hybrid distribution system. It can be seen from Figure 2 that the DC side of the input stage and the input side of the isolation stage are connected in parallel, and the input sides of ISOS and ISOP are connected in series. Since the DC side voltage of the input stage is necessarily controlled to remain consistent, it is able to adjust the input side voltages of ISOS and ISOP at the isolation stage to change the power flow and fulfill the power demand of the ports at the output stage.
In order to facilitate the analysis, the average model of each stage is developed and shown in Figure 9, where RL1 and RL2 represent the equivalent loads.
Set the input power of the input stage MMC to P, and the output power of the AC and DC output port to P1 and P2, respectively. Equations (17)–(19) can be obtained when the PET operates stably and the circuit loss is negligible:
P = P 1 + P 2
U dc = U dc 1 + U dc 2
P 1 P 2 = U dc 1 U dc 2
Since Udc is controlled by the input stage to remain at a set value, and the output powers (P1, P2) of AC and DC output ports are given, Equations (20)–(21) can be derived from Equations (17)–(19):
U dc 1 = U dc P 1 P 1 + P 2
U dc 2 = U dc P 2 P 1 + P 2
When the power demand of the output ports changes, PET will be unable to stably operate if the adjusting is not made to the input side voltage of the isolation stage. Hence, assuming variations of the power demand of AC output port and DC output port are ΔP1 and ΔP2, respectively, Udc1 and Udc2 should be adjusted to Udc1 and Udc2 as shown in Equations (22)–(23) to meet the power demand.
U dc 1 = U dc P 1 + Δ P 1 P 1 + Δ P 1 + P 2 + Δ P 2
U dc 2 = U dc P 2 + Δ P 2 P 1 + Δ P 1 + P 2 + Δ P 2
The correlations between voltage adjustments (ΔUdc1, ΔUdc2) and power variations (ΔP1, ΔP2) can be derived through Equations (20)–(23) and are given by Equations (24)–(25):
Δ U dc 1 = U dc ( P 1 + Δ P 1 P 1 + Δ P 1 + P 2 + Δ P 2 P 1 P 1 + P 2 )
Δ U dc 2 = U dc ( P 2 + Δ P 2 P 1 + Δ P 1 + P 2 + Δ P 2 P 2 P 1 + P 2 )
Based on the above discussion, a control strategy is proposed that when the power demands of the AC/DC output ports changes, stabilizing Udc and adjusting Udc2 according to Equation (24) can effectuate the power coordinated control. It is worth mentioning that the control strategy is also applicable for multiple AC/DC output ports.

4. Simulation Verification

In order to verify the feasibility and effectiveness of the novel PET topology and control methods proposed in this paper, a system simulation model based on Figure 2 is built with PSCAD/EMTDC and the model parameters are selected according to [13,14,22].
The input stage connects to a 35 kV 50 Hz high-voltage AC distribution network, and the upper and lower arms of each phase contain 16 sub-modules. The AC port at the output stage connects to a 10 kV 50 Hz medium-voltage AC distribution network, and the upper and lower arms of each phase contain 12 sub-modules. The DC port connects to a 400V low-voltage DC distribution network. The input stage, isolation stage, and output stage adopt corresponding control methods that are introduced before and the specific simulation parameters are list in Table 1, Table 2 and Table 3.

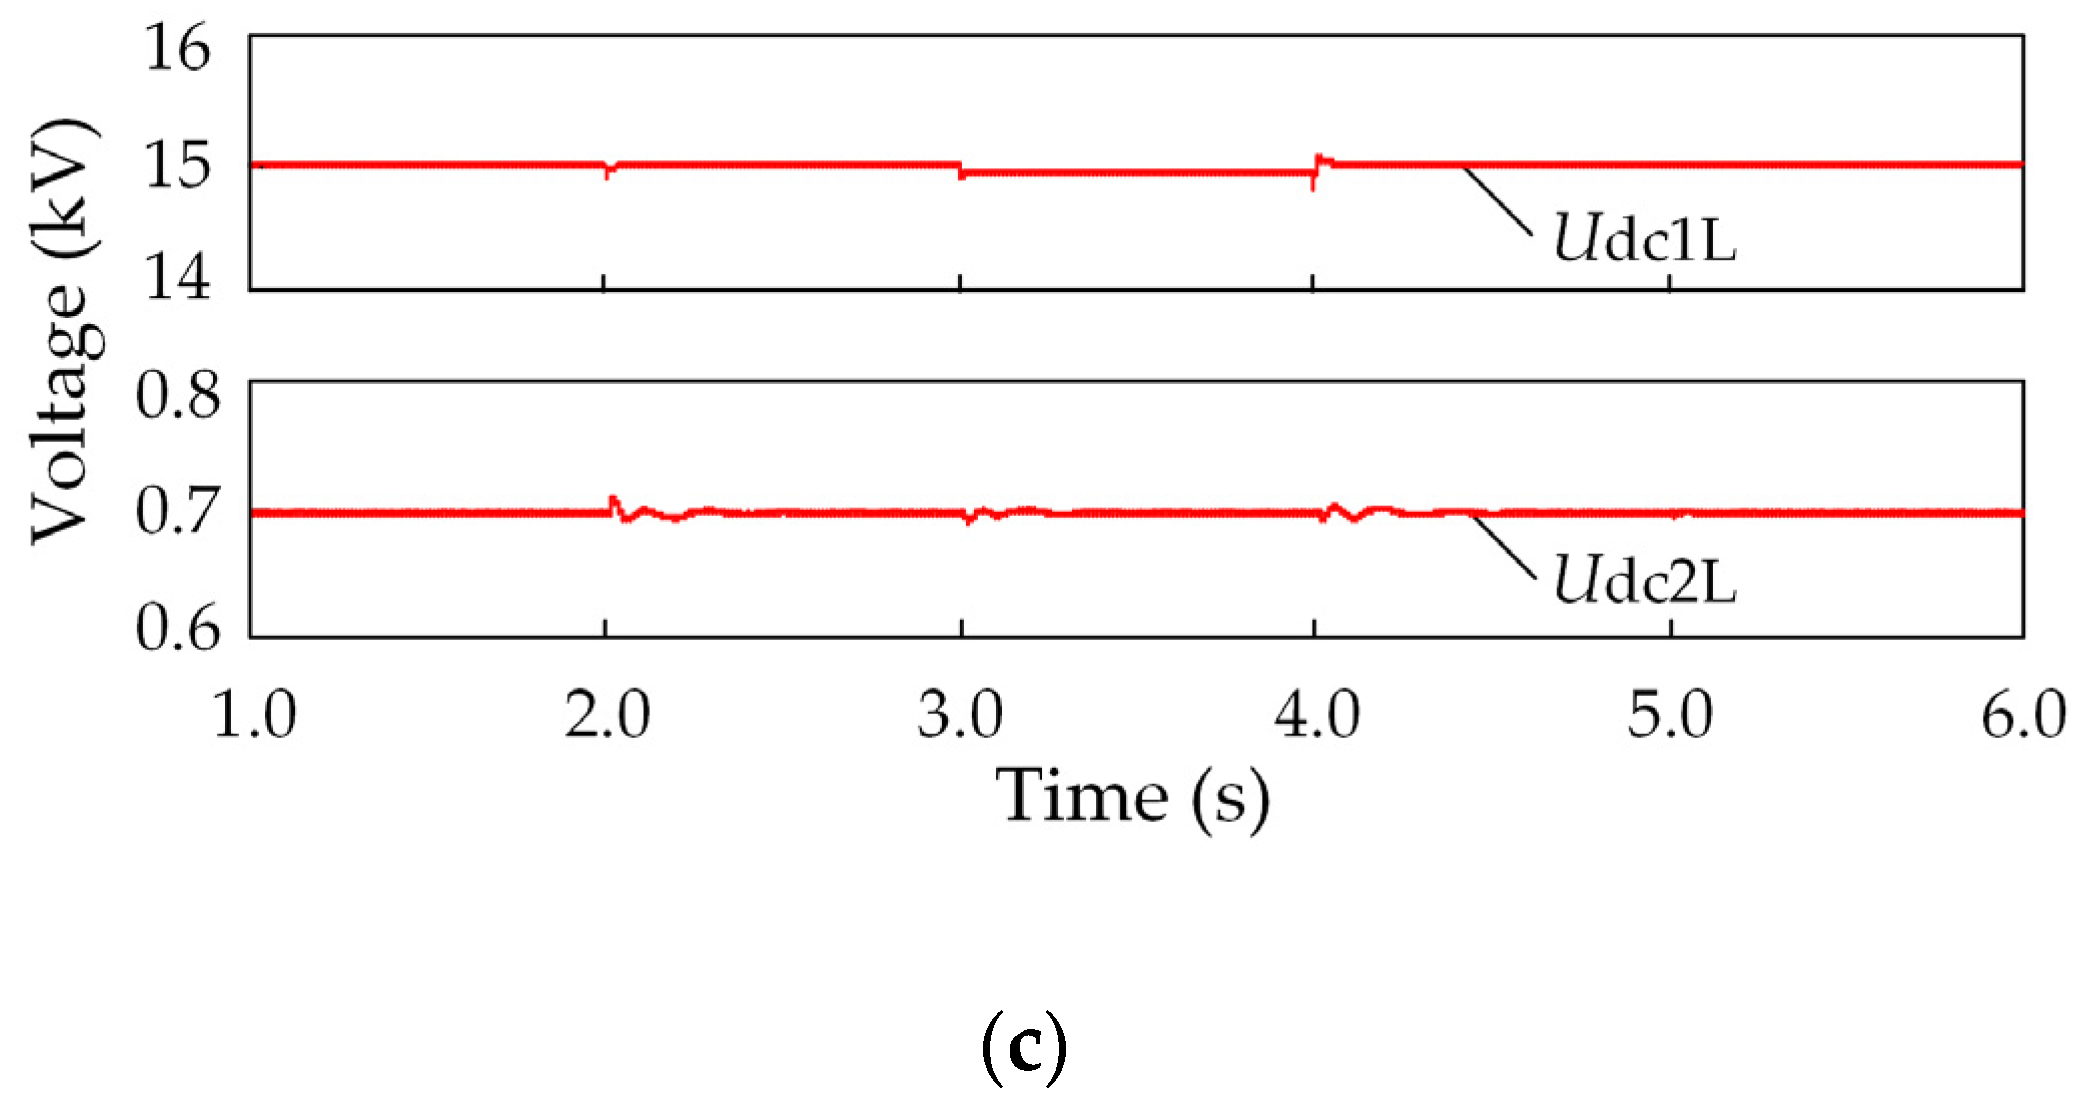
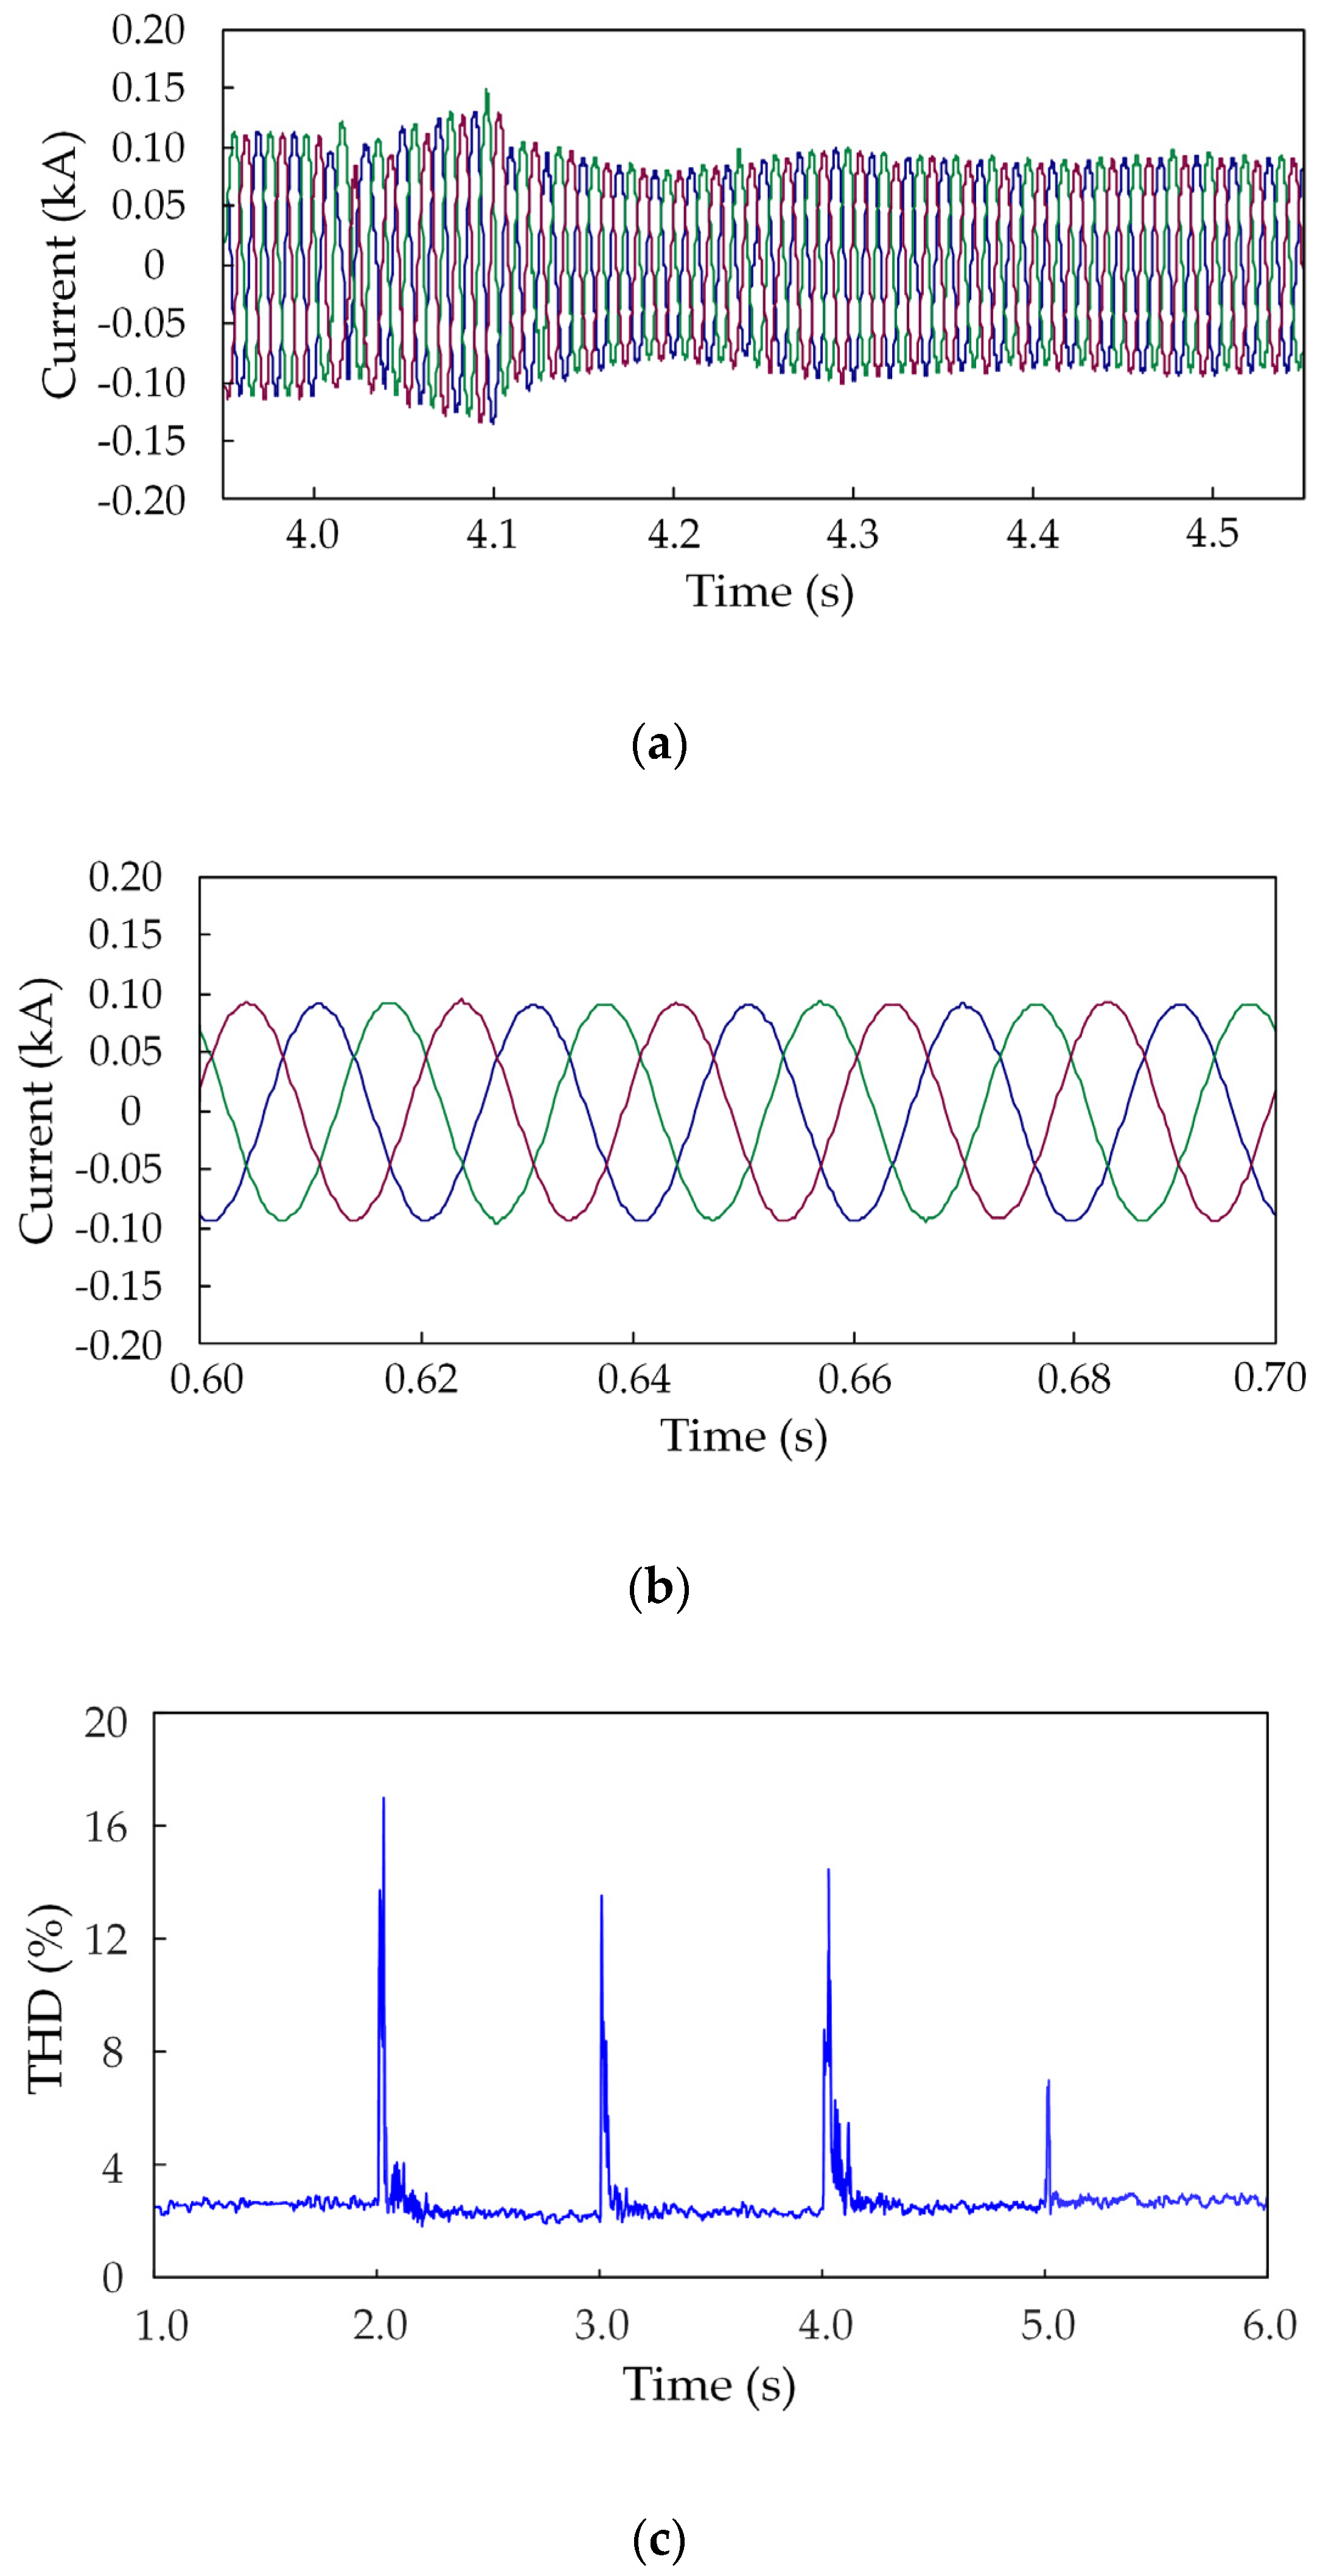
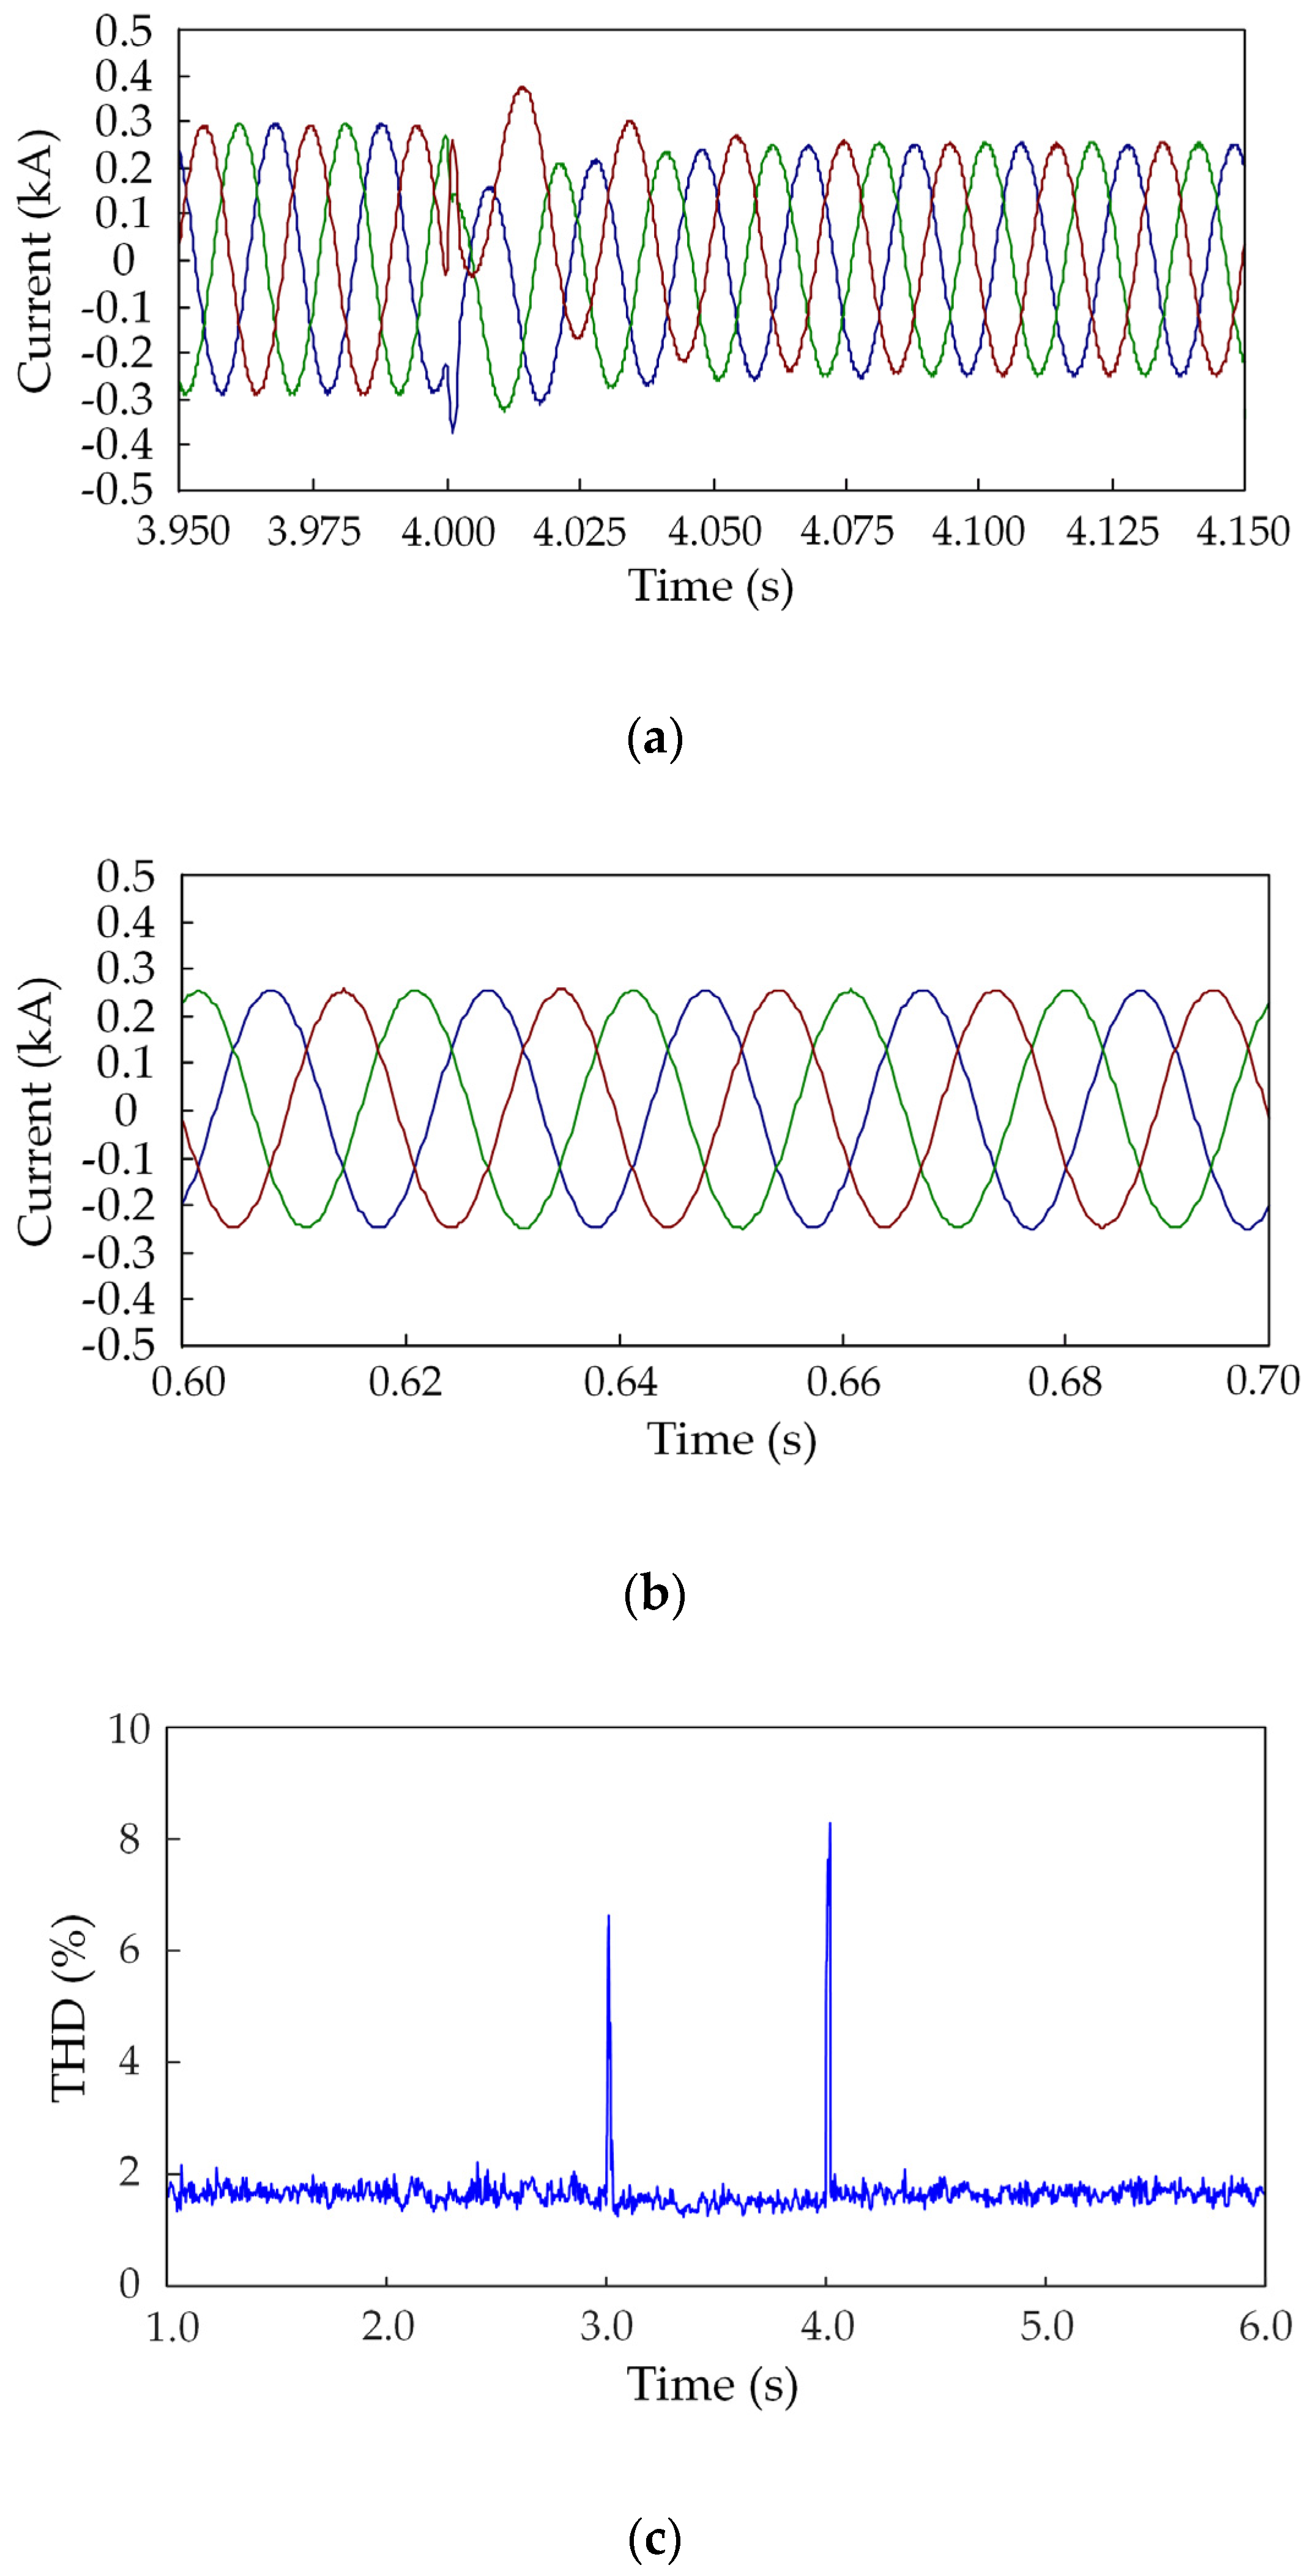
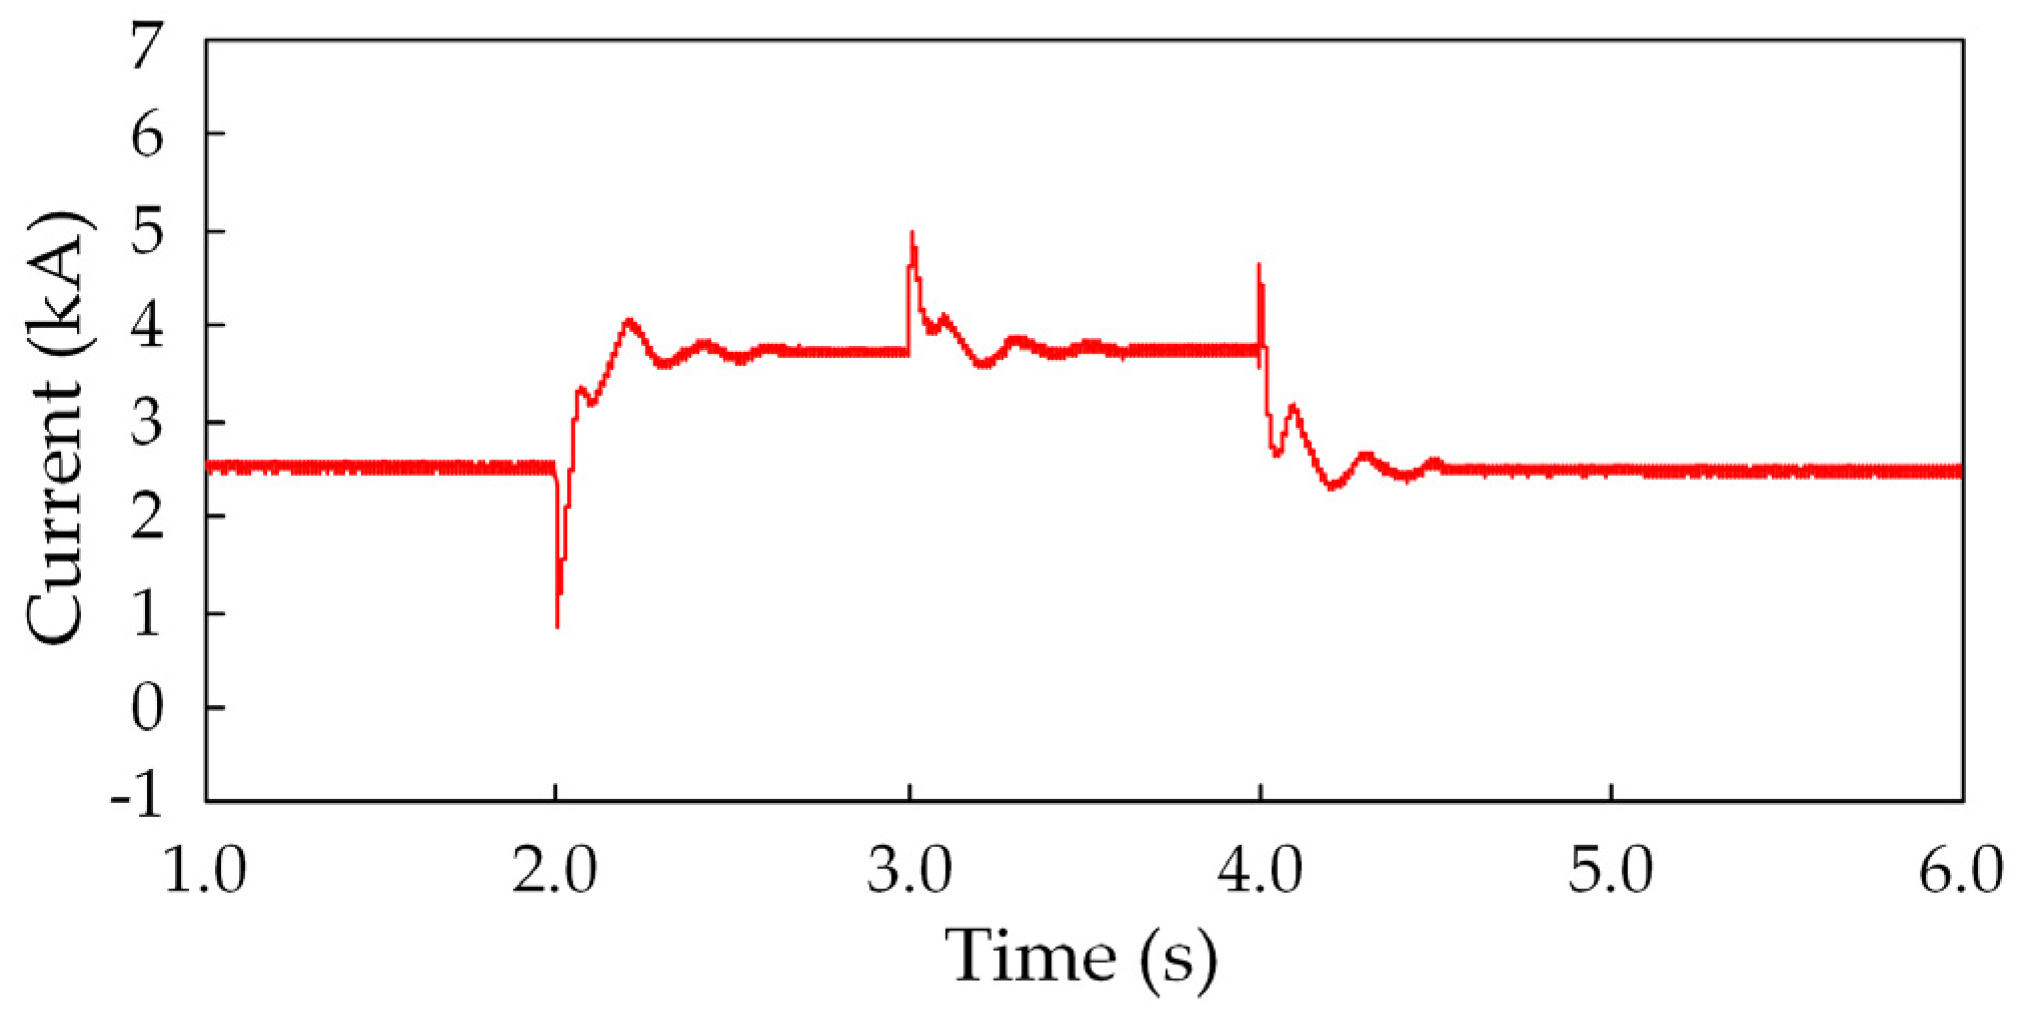
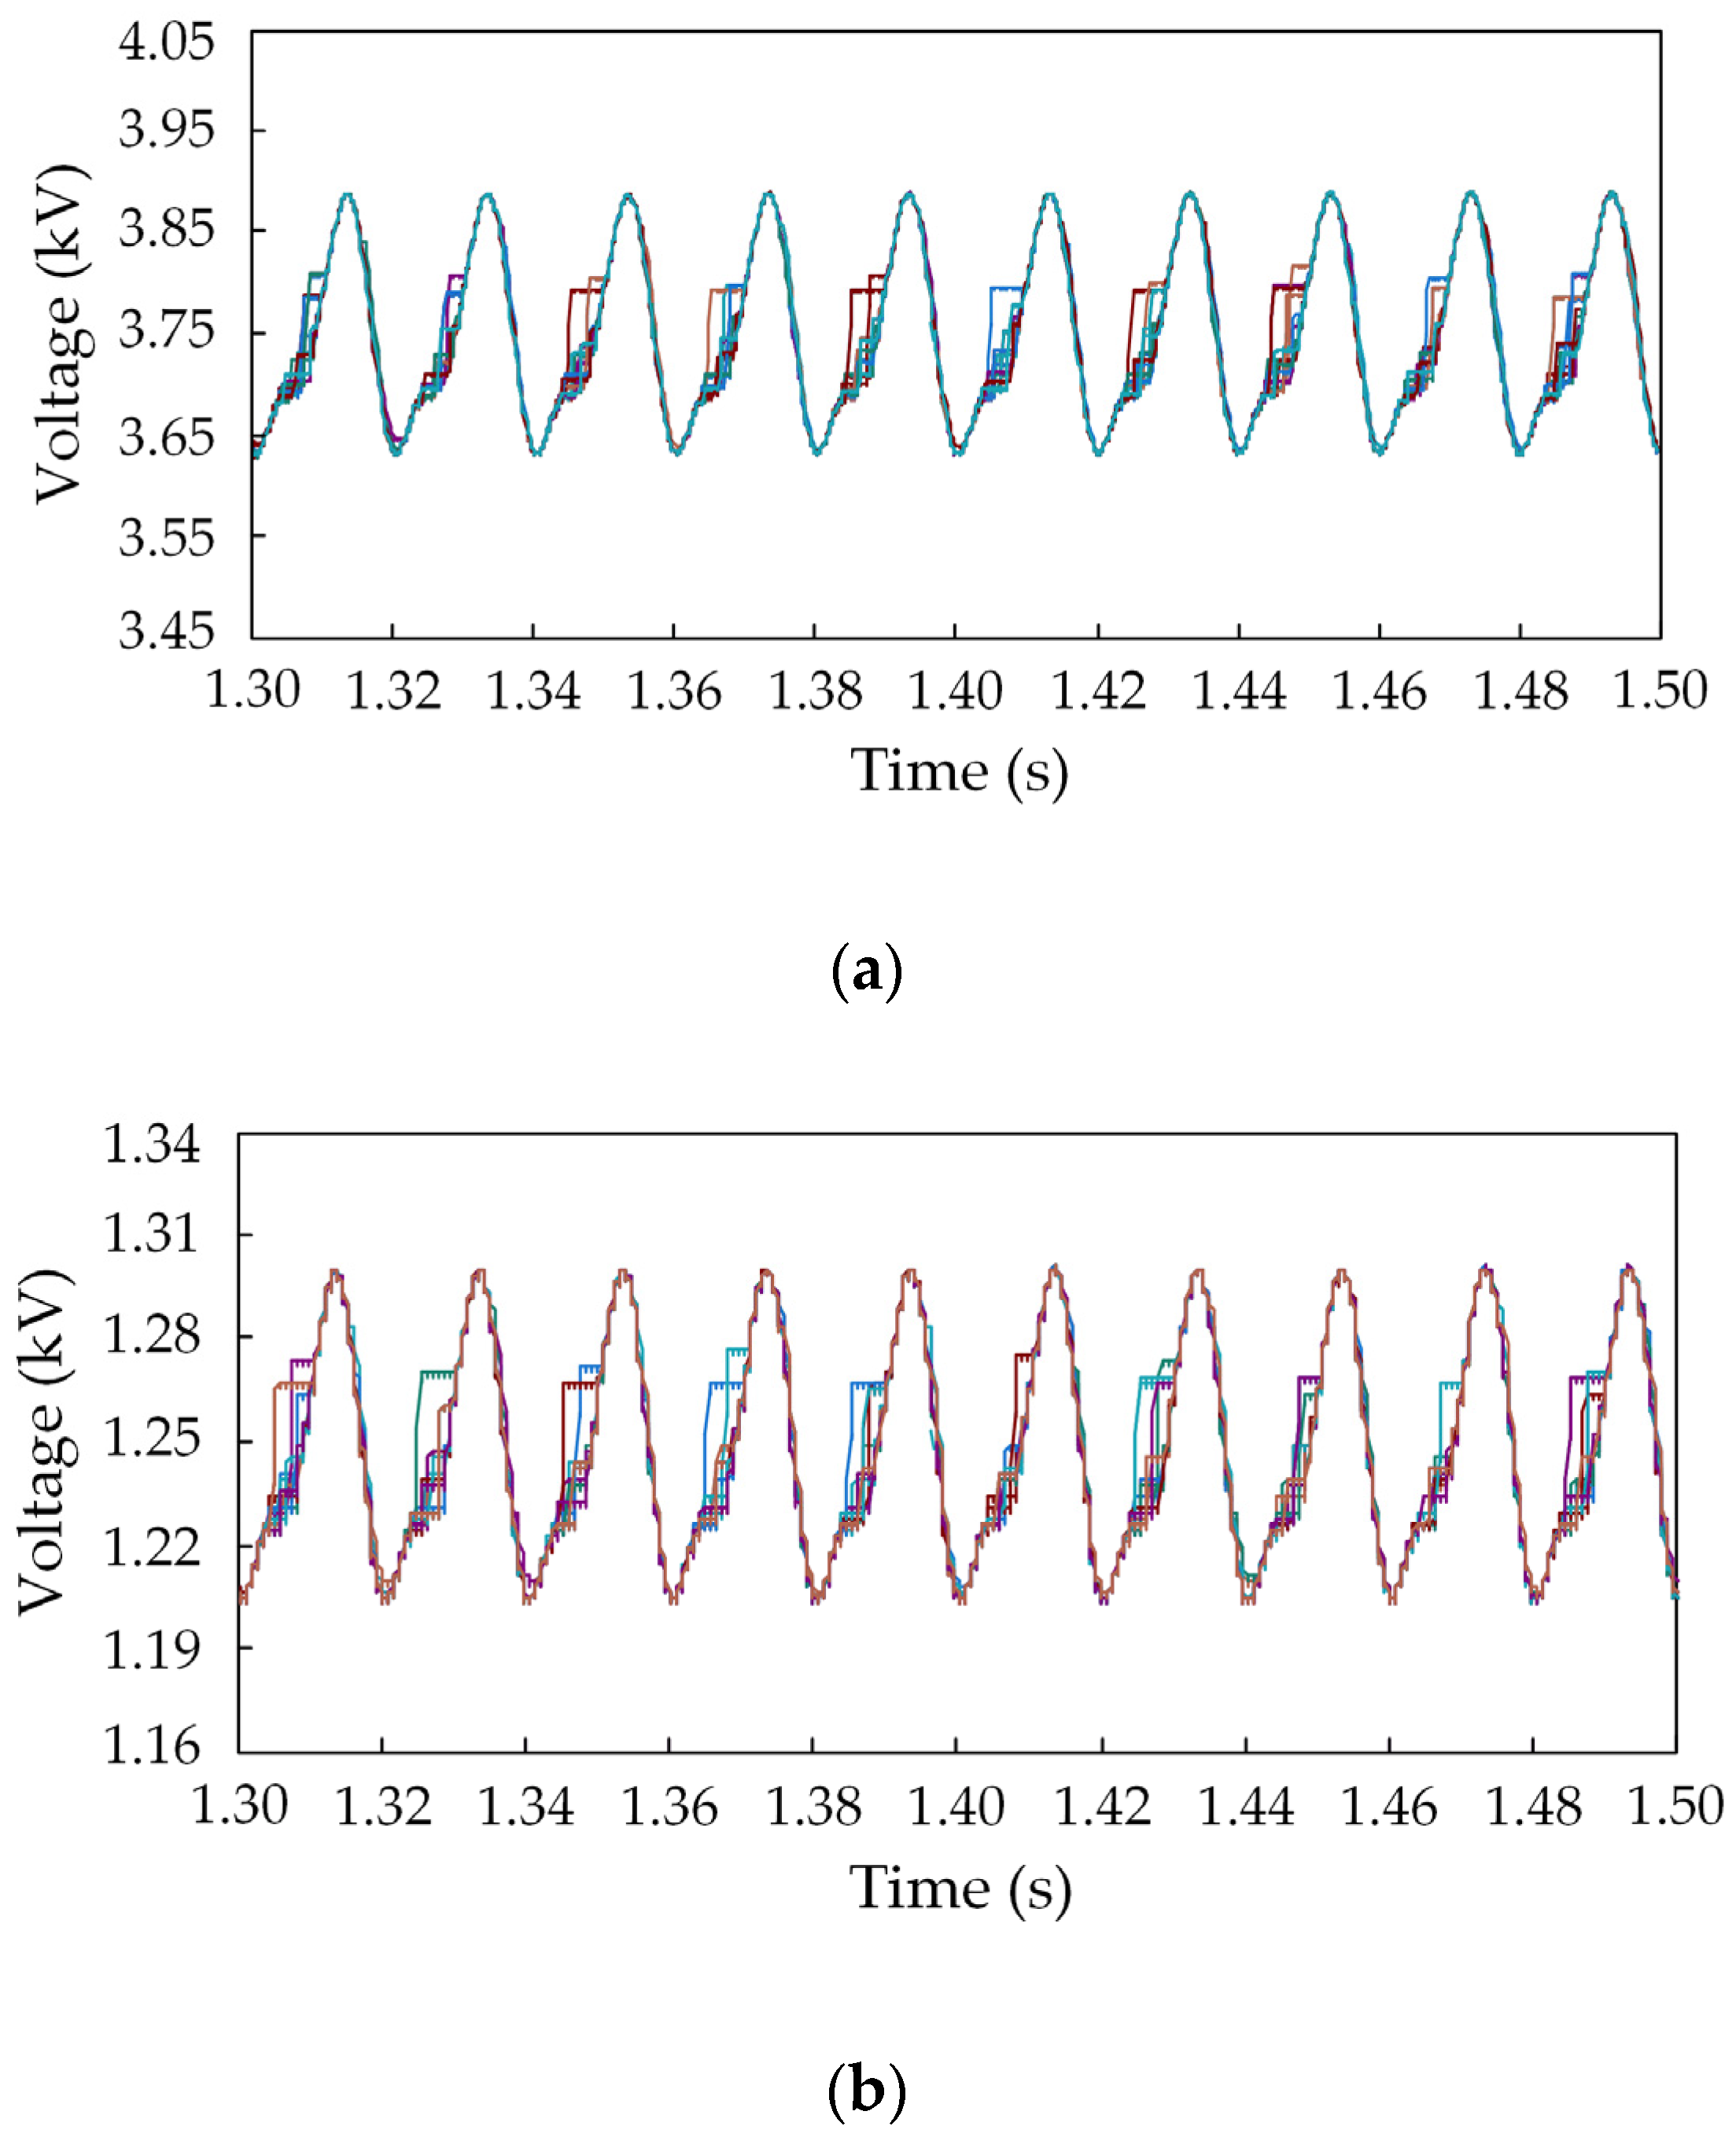
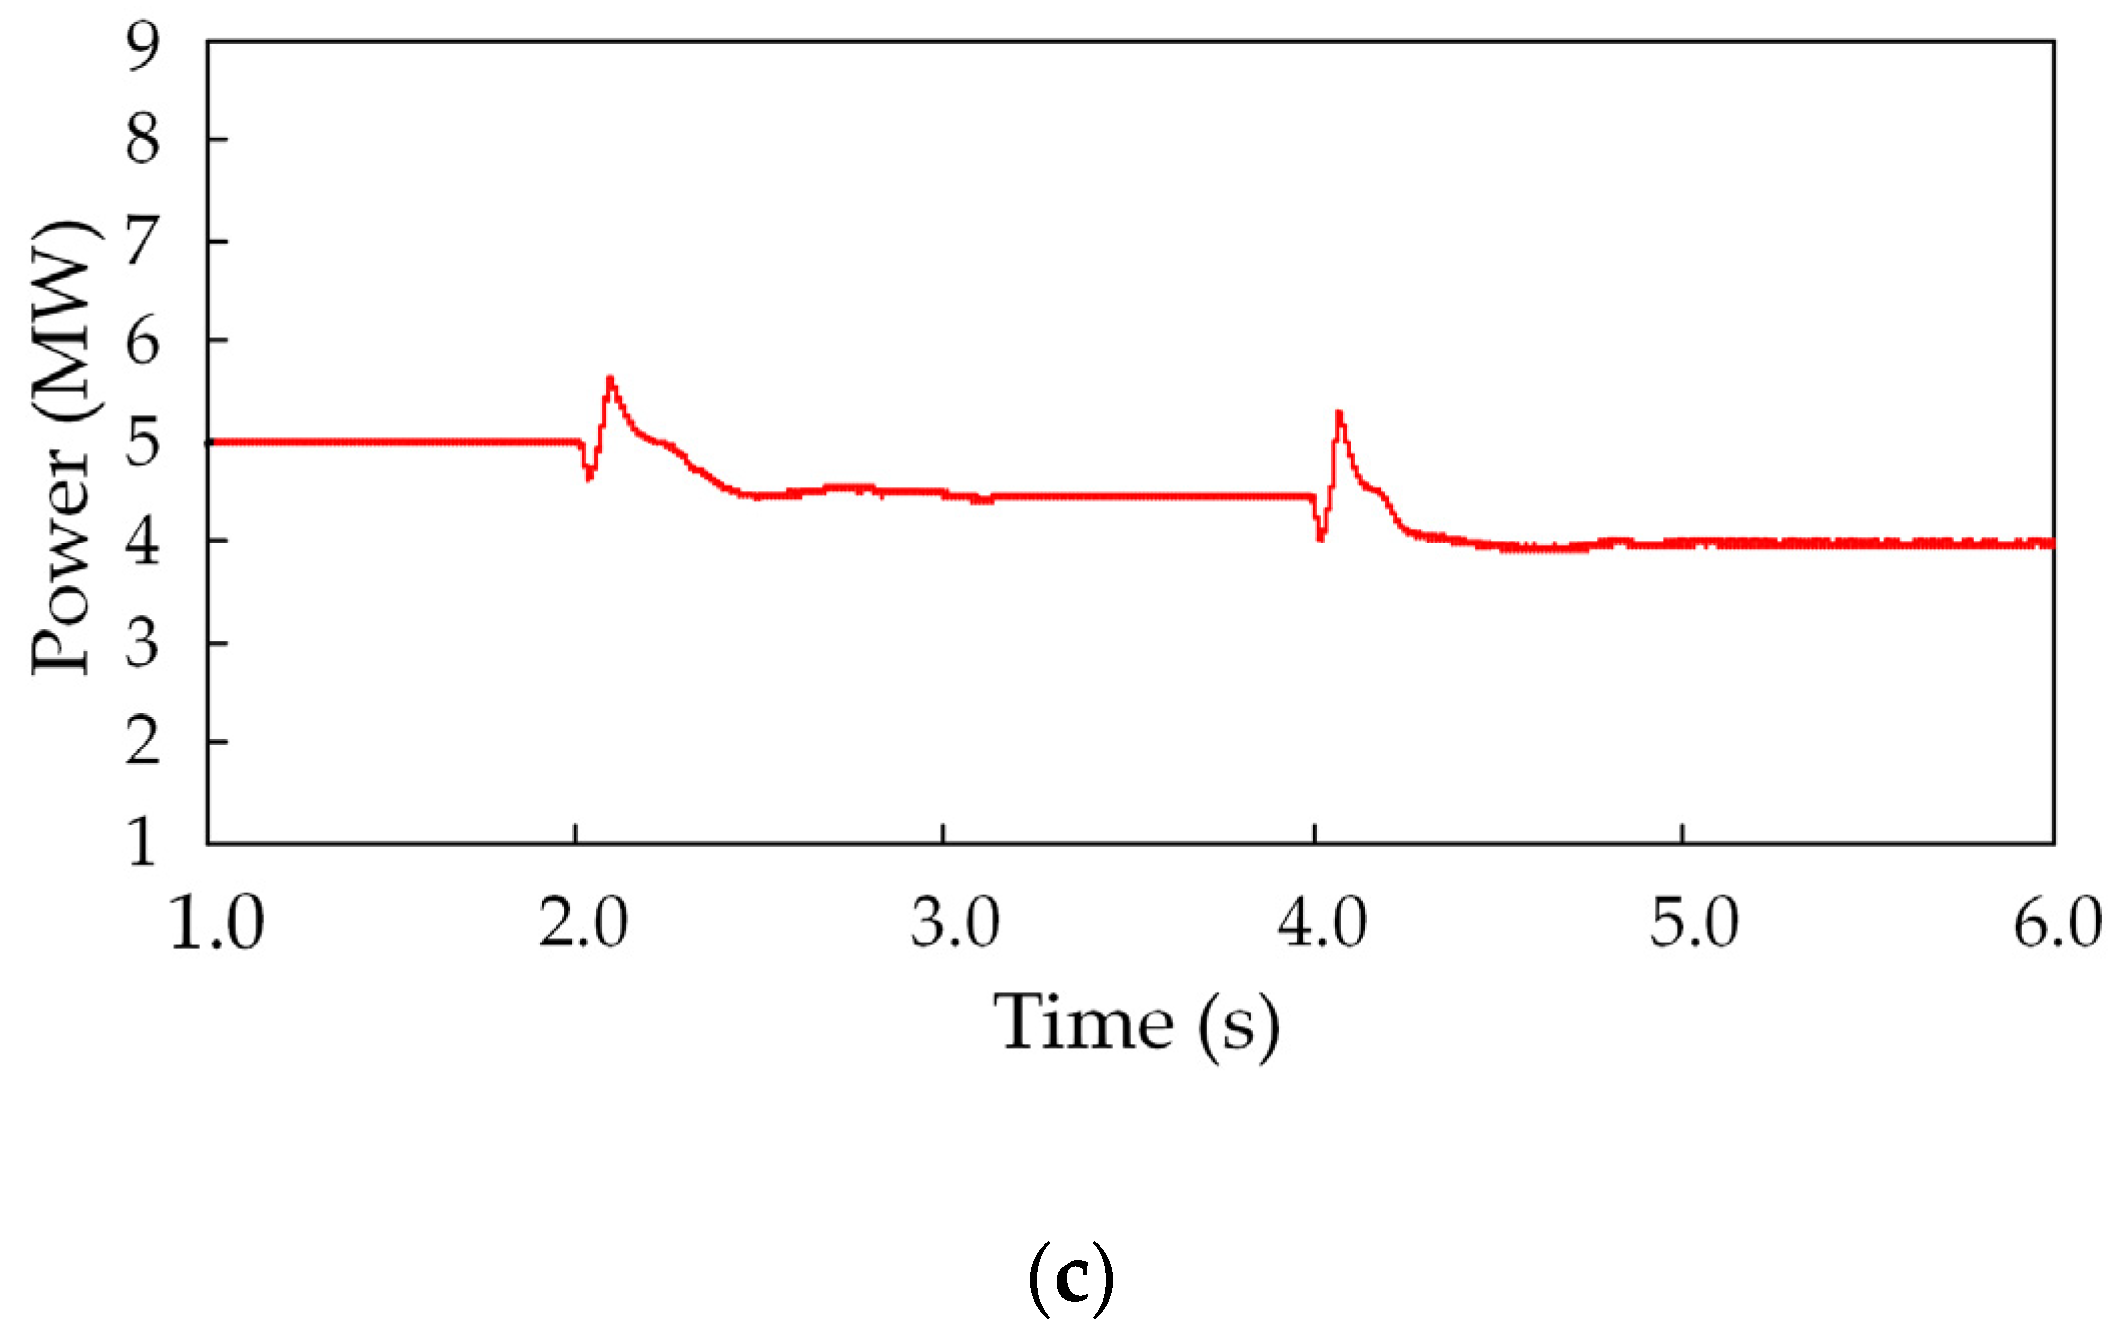
4.1. Verification of Power Coordinated Control

To verify the capability of the proposed PET to run stably and coordinate the control of the power distribution of all ports when the power demand of the output stage changes, the following settings are introduced:
  • At t < 2 s, the reactive power Q at the input stage is set to 0, and the active power of AC port (P1) and DC port (P2) at the output stage are 3 MW and 1 MW, respectively;
  • At t = 2 s, P2 increases to 1.5 MW;
  • At t = 3 s, P1 increases to 3.5 MW;
  • At t = 4 s, P1 and P2 decrease to 3 MW and 1 MW, respectively;
  • At t = 5 s, Q decreases to −1 Mvar.
The system dynamic response waveforms are shown in Figure 10. While PET runs stably to t = 2 s, the active power P1 and P2 are kept at their setpoints with negligible errors. P1: P2 and Udc1:Udc2 are both 3:1, which proves the accuracy of the average model proposed in Section 3.4. At t = 2 s, P2 increases to 1.5 MW, which is achieved by adjusting U1 and U2 to 20 kV and 40 kV, respectively, as shown in Figure 10a. It can be seen that the DC side voltage Udc of the input stage fluctuates slightly when P2 changes, which is due to the energy buffering capacity of the DC side capacitors. Additionally, Figure 10b shows that P2 and U2 change simultaneously and quickly reach the setpoint after a short overshoot. At t = 3 s and 4 s, the system response is similar to that at t = 2 s. Figure 10c presents the simulation results of the output side voltages of ISOS and ISOP. It indicates the DAB modules in both ISOS and ISOP can maintain voltage stability, and achieve stable and efficient power transmission, which verifies the effectiveness of corresponding control strategy.
Figure 11a,b present the output characteristics of the input stage MMC. Figure 11a displays the active and reactive power that transmit between PET and the upper grid. While the power changes, the input stage exhibits certain inertia and damping characteristics under the control strategy of VSM, which enhances the friendliness to the upper grid. In addition, Q becomes negative after t = 5 s, indicating that PET delivers reactive power to the upper grid and provides reactive power support. Figure 11b illustrates the virtual potential response of VSM. Before t = 5 s, the input stage absorbs active power and the reactive power setpoint is zero. At this point, the virtual potential is slightly lower than the voltage amplitude of the upper grid voltage of 28.6 kV, and slight fluctuations occur when the active power changes. After t = 5 s, the virtual potential becomes larger than the upper grid voltage because PET delivers reactive power to the upper grid.
The grid-side current transient response, steady-state response and total harmonic distortion (THD) of the input stage MMC are shown in Figure 12. In order to analyze the transient response characteristics of the current when the output power changes abruptly, we select the current variation at the third power change for analysis randomly. It can be seen from Figure 12a that the current changes are relatively smooth under the control strategy of VSM. Since the VSM control strategy causes the input stage to have certain inertia and damping characteristics, the dynamic corresponding time is about 0.55 s. Figure 12b shows the steady-state response of the current. It can be seen that the quality of the grid-side current waveform is good at steady state. Figure 12c displays the THD of the grid-side current which takes the first 31 harmonics into account. It can be seen that the current remains at a relatively low THD of about 2.3% during the steady-state operation and the THD becomes higher when the power changes because the frequency of the output current deviates from the rated frequency at that time. It can be summarized that the control strategy of VSM can make the grid-side current of the input stage have a relatively low THD and ensure the power quality, which can effectively reduce the harmonic pollution caused by PET and reduce its adverse impact on the grid.
Figure 13 presents the transient and steady-state response of the current and the THD taking the first 31 harmonics into account of the AC output port. We select the current variation around 4 s to analyze the transient response characteristics. As shown in Figure 13a, the output current responds quickly when the output power changes and reaches a steady state after a small overshoot under the P/Q control. Figure 13b indicates that the quality of the current waveform is good at steady state. Figure 13c shows that the current remains at a relatively low THD of about 1.9% during the steady-state operation except when the output power changes that causing higher THD.
Figure 14 shows the current waveform of the DC output port. It can be seen that the DC output current remains stable at steady state and the ripple coefficient is approximately 2%. When the power changes, the current responds rapidly and reaches a new steady state after a short period of fluctuation. This is because the DC output port does not control the power directly and the power is determined by the input DC voltages of the isolation stage as analyzed previously.
Figure 15a,b shows the steady-state capacitor voltage waveforms of the MMC sub-modules of the input stage and AC output port, respectively. Due to the large amount of sub-modules, we select the sub-modules in the upper arm of phase A for analysis. In the simulation, the capacitor voltage setting values of each sub-module of the input stage and the AC output port are 3.75 kV and 1.25 kV, respectively. It can be seen from Figure 15a, the capacitor voltage fluctuation of each sub-module of the input stage is about ± 120 V, and the ripple coefficient is about 3.2%. Figure 15b illustrates that the capacitor voltage fluctuation of each sub-module of the AC output port is about ± 50 V, and the ripple coefficient is about 4%. The results indicate that the MMCs operate steadily and the capacitor voltage of the sub-modules are well balanced under the control strategy used in this paper.
It can be demonstrated from the above analysis that when the power demand of the output stage changes, PET can quickly and accurately coordinate the power distribution under the proposed power coordinated control strategy, thereby ensuring stable and reliable operation of the AC/DC hybrid distribution network. The input stage adopts the VSM control strategy, which increases the friendliness to the upper grid and provides reactive power support if necessary. It can also be concluded that the PET can ensure the power quality of each port and effectively reduce the harmonic pollution to the grid.

4.2. Verification of PFR

In order to confirm that PET has the ability to participate in PFR of the upper grid and meet the power requirements of each port, the following simulation is conducted:
The power to the upper 35 kV AC grid is supplied by the synchronous generators. The power upper and lower boundaries of DC port at the output stage are P2max =3 MW and P2min = 1 MW, respectively; the initial settings for the active powers P1 and P2 are 3 MW and 2 MW, respectively. At t = 2 s, the load in the upper grid increases by 1 MW, and it increases by 4 MW at t = 4 s.
The simulation results are present in Figure 16. Figure 16a illustrates the frequency response of the upper grid when PET participates in or opts out of the PFR. It can be observed that when the frequency changes, PET is able to offer a certain power support to the upper grid, participate in the PFR, and effectively reduce the frequency deviation. Figure 16a,b also shows that the descent rate of frequency accelerates significantly around t = 4.2 s. This is because P2 reaches its lower boundary and the low-voltage DC port keeps operating at the lower boundary, which makes PET no longer participate in the PFR. Meanwhile, since the AC port at the output stage does not participate in the PFR, P1 will consistently maintain its setpoint. Figure 16c demonstrates the response curve of the active power exchanged between the input stage and the upper grid. Due to the VSM control method, PET shows certain damping and inertia, and suppresses the frequency fluctuation of the upper grid.
It can be learned from the above discussion that PET can give a certain power support to the upper grid and participate in the PFR by adjusting the power of the DC port at the output stage. Meanwhile, the output power of the AC port remains at its setpoint, which ensures the reliable and stable operation of PET.

5. Conclusions

As the core device of the energy internet, PET plays a vital role in the effective consumption for renewable energy and the flexible conversion of electrical energy. Based on the existing literature of PET research, this paper proposes a novel PET with an improved structure that is applicable for AC/DC hybrid distribution network of multi-voltage levels, and corresponding control strategies are suggested. The reliability and effectiveness of the proposed structure and control strategies are verified by PSCAD/EMTDC simulation. The conclusions are summed as follows:
(1) An improved structure of PET is proposed, in which the input stage utilizes MMC, and the isolation stage adopts a combined connection of ISOS and ISOP. The ISOS and ISOP hybrid structure facilitates the access of PET to the AC/DC distribution network with multiple voltage levels, which widens the application of PET.
(2) The control strategy based on VSM is applied for the input stage, which increases the inertia and damping of the grid, and makes PET more friendly to the upper grid. In addition, it enables PET to provide power support and participate in the PFR by adjusting the output power of the output stage DC port when the frequency of the upper power grid fluctuates.
(3) A power coordinated control strategy is proposed to coordinate the power distribution of all ports and ensure the stable operation of PET by adjusting the DC side voltage of the input stage and the input voltage of the isolation stage when the power demand of the output stage changes.
Future works will be carried out to analyze the dynamic response characteristics of the control system and the system stability problems caused by parameters selection. The corresponding control strategy for PET participating in the secondary frequency regulation will also be investigated.

Author Contributions

Conceptualization, J.R. and X.A.; funding acquisition, X.A.; Investigation, J.R.; Methodology, J.R.; Supervision, X.A.; Validation, D.R.; Writing—original draft, J.R.; Writing—review and editing, Y.L. and D.R.

Funding

This research was funded by the 2016 national key R & D program of China to support low-carbon Winter Olympics of integrated smart grid demonstration project (2016YFB0900500); Beijing Natural Science Foundation (3182037).

Conflicts of Interest

The authors declare no conflict of interest.

References

  1. Cao, J.W.; Meng, K.; Wang, J.Y.; Yang, M.B.; Chen, Z.; Li, W.Z.; Lin, C. An energy internet and energy routers. Sci. Sinica Inform. 2014, 44, 714–727. [Google Scholar]
  2. Huang, A.Q.; Crow, M.L.; Heydt, G.T.; Zheng, J.P.; Dale, S.J. The Future Renewable Electric Energy Delivery and Management (FREEDM) System: The Energy Internet. Proc. IEEE 2011, 99, 133–148. [Google Scholar] [CrossRef]
  3. Bifaretti, S.; Zanchetta, P.; Watson, A.; Tarisciotti, L.; Clare, J.C. Advanced power electronic conversion and control system for universal and flexible power management. IEEE Trans. Smart Grid 2011, 2, 231–243. [Google Scholar] [CrossRef]
  4. Brando, G.; Bova, B.; Cervone, A.; Dannier, A.; Del Pizzo, A. A Distribution Power Electronic Transformer with MMC. Appl. Sci. 2018, 8, 120. [Google Scholar] [CrossRef]
  5. Zhang, G.; Chen, J.; Zhang, B.; Zhang, Y. A critical topology review of power electronic transformers: In view of efficiency. Chin. J. Electr. Eng. 2018, 4, 90–95. [Google Scholar]
  6. Huang, A.Q. Medium-voltage solid-state transformer: Technology for a smarter and resilient grid. IEEE Ind. Electron. Mag. 2016, 10, 29–42. [Google Scholar] [CrossRef]
  7. Briz, F.; Lopez, M.; Rodriguez, A.; Arias, M. Modular power electronic transformers: Modular multilevel converter versus cascaded H-bridge solutions. IEEE Ind. Electron. Mag. 2016, 10, 6–19. [Google Scholar] [CrossRef]
  8. Wang, L.; Zhang, D.; Wang, Y.; Wu, B.; Athab, H.S. Power and voltage balance control of a novel three-phase solid-state transformer using multilevel cascaded H-bridge inverters for microgrid applications. IEEE Trans. Power Electron. 2016, 31, 3289–3301. [Google Scholar] [CrossRef]
  9. Morawiec, M.; Lewicki, A. Power electronic transformer based on cascaded H-bridge converter. Bull. Pol. Acad. Sci. Techn. Sci. 2017, 65, 675–683. [Google Scholar] [CrossRef]
  10. Huber, J.E.; Kolar, J.W. Solid-state transformers: On the origins and evolution of key concepts. IEEE Ind. Electron. Mag. 2016, 10, 19–28. [Google Scholar] [CrossRef]
  11. Zhao, T.; Wang, G.; Bhattacharya, S.; Huang, A.Q. Voltage and power balance control for a cascaded H-bridge converter-based solid-state transformer. IEEE Trans. Power Electron. 2013, 28, 1523–1532. [Google Scholar] [CrossRef]
  12. Fan, B.; Li, Y.; Wang, K.; Zheng, Z.; Xu, L. Hierarchical System Design and Control of an MMC-Based Power-Electronic Transformer. IEEE Trans. Ind. Inform. 2017, 13, 238–247. [Google Scholar] [CrossRef]
  13. Zixin, L.; Ping, W.; Zunfang, C.; Haibin, Z.; Yaohua, L. Research on medium-and high-voltage smart distribution grid oriented power electronic transformer. Power Syst. Technol. 2013, 37, 2592–2601. [Google Scholar]
  14. Li, Y.; Han, J.; Cao, Y.; Li, Y.; Xiong, J.; Sidorov, D.; Panasetsky, D. A modular multilevel converter type solid state transformer with internal model control method. Int. J. Electr. Power Energy Syst. 2017, 85, 153–163. [Google Scholar] [CrossRef]
  15. Contreras, J.P.; Ramirez, J.M. Multi-Fed Power Electronic Transformer for Use in Modern Distribution Systems. IEEE Trans. Smart Grid 2014, 5, 1532–1541. [Google Scholar] [CrossRef]
  16. Gu, C.; Zheng, Z.; Xu, L.; Wang, K.; Li, Y. Modeling and control of a multiport power electronic transformer (PET) for electric traction applications. IEEE Trans. Power Electron. 2016, 31, 915–927. [Google Scholar] [CrossRef]
  17. Rodrigues, W.; Oliveira, T.; Morais, L.; Rosa, A. Voltage and Power Balance Strategy without Communication for a Modular Solid State Transformer Based on Adaptive Droop Control. Energies 2018, 11, 1802. [Google Scholar] [CrossRef]
  18. Liu, B.; Zha, Y.; Zhang, T. DQ frame predictive current control methods for inverter stage of solid state transformer. IET Power Electron. 2017, 10, 687–696. [Google Scholar] [CrossRef]
  19. Moranchel, M.; Huerta, F.; Sanz, I.; Bueno, E.; Rodríguez, F.J. A comparison of modulation techniques for modular multilevel converters. Energies 2016, 9, 1091. [Google Scholar] [CrossRef]
  20. Wang, J.; Ma, H.; Bai, Z. A Submodule Fault Ride-Through Strategy for Modular Multilevel Converters With Nearest Level Modulation. IEEE Trans. Power Electron. 2018, 33, 1597–1608. [Google Scholar] [CrossRef]
  21. Chen, W.; Ruan, X.; Yan, H.; Tse, C.K. DC/DC conversion systems consisting of multiple converter modules: Stability, control, and experimental verifications. IEEE Trans. Power Electron. 2009, 24, 1463–1474. [Google Scholar] [CrossRef]
  22. Cao, Y.; Yuan, L.; Zhu, S.; Huang, R.; Feng, G.; Zhao, Z. Parameter design of energy router orienting energy internet. Power Syst. Technol. 2015, 39, 3094G3101. [Google Scholar]
Figure 1. System topology of the developed three-phase power electronic transformer (PET) for medium- and high-voltage distribution network.
Applsci 09 00727 g001
Figure 2. System topology of the proposed novel PET.
Applsci 09 00727 g002
Figure 3. Equivalent relationship between MMC and virtual synchronous machine (VSM).
Applsci 09 00727 g003
Figure 4. Block diagram of VSM-based MMC.
Applsci 09 00727 g004
Figure 5. Block diagram of the AC output port.
Applsci 09 00727 g005
Figure 6. DC output port: (a) Topology; (b) block diagram.
Applsci 09 00727 g006
Figure 7. Input-series output-series (ISOS) connection: (a) Topology; (b) Block diagram.
Applsci 09 00727 g007
Figure 8. Input-series output-parallel (ISOP) connection: (a) Topology; (b) Block diagram.
Applsci 09 00727 g008
Figure 9. Average model: (a) Input stage MMC; (b) isolation stage and output stage.
Applsci 09 00727 g009aApplsci 09 00727 g009b
Figure 10. System dynamic response when the power demand changes: (a) DC voltages at high-voltage side; (b) Active power of AC output port and DC output port; (c) DC voltage at output side of ISOS and ISOP.
Applsci 09 00727 g010aApplsci 09 00727 g010b
Figure 11. Output characteristics of the input stage: (a) Active and reactive power between PET and the upper grid; (b) Virtual potential of VSM.
Applsci 09 00727 g011
Figure 12. Grid-side current characteristics of the input stage MMC: (a) Transient response (b) Steady-state response (c) Total Harmonic Distortion (THD).
Applsci 09 00727 g012
Figure 13. Current characteristics of the AC output port: (a) Transient response, (b) Steady-state response, (c) THD.
Applsci 09 00727 g013
Figure 14. Current waveform of the DC output port.
Applsci 09 00727 g014
Figure 15. Capacitor voltage of the sub-modules of (a) the input stage and (b) AC output port.
Applsci 09 00727 g015
Figure 16. Waveforms when the frequency fluctuates: (a) Frequency response before primary frequency regulation (PFR) and after PFR; (b) active power of AC output port and DC output port; (c) active power exchanged between PET and the upper grid.
Applsci 09 00727 g016aApplsci 09 00727 g016b
Table 1. Input stage parameters.
ParameterValue
Grid-side filter inductance LS/mH20
Grid-side filter resistance RS0.1
Arm inductance L0/mH8
SM capacitance CSM/μF750
DC side voltage Udc/kV60
Virtual inertia of VSM J/(kg·m2)0.3
Virtual damping of VSM D/(N·m·s/rad)10
Voltage control coefficient kv0.2
Reactive power control coefficient kq0.08
Table 2. Isolation stage parameters.
ParameterValue of AC PortValue of DC Port
HV-side DC link capacitance CH/μF750750
LV-side DC link capacitance CL/μF450450
Transformer operating frequency/kHz33
LV-side capacitance voltage/kV1.250.7
P-f droop coefficient kf\20
Number of DAB124
Transformation ratio3:175:14
Table 3. Output stage parameters.
ParameterValue
Filter resistance of AC port R10.1
Filter inductance of AC port L1/mH5
Arm inductance of AC port L0/mH6
SM capacitance of AC port CSM/μF450
Filter capacitance of DC port C2/mF2
Filter inductance of DC port L2/mH10

