Crushing Performance of Ultra-Lightweight Foam Concrete with Fine Particle Inclusions


Department of Civil and Environmental Engineering, University of Illinois at Urbana-Champaign, Urbana, IL 61801, USA
*
Authors to whom correspondence should be addressed.
Appl. Sci. 2019, 9(5), 876; https://0-doi-org.brum.beds.ac.uk/10.3390/app9050876
Submission received: 21 January 2019
/
Revised: 17 February 2019
/
Accepted: 18 February 2019
/
Published: 1 March 2019
(This article belongs to the Special Issue New Trends in Recycled Aggregate Concrete)
Abstract
:Featured Application
This study investigates the influence of particle inclusion on the elastic modulus, crushing strength, and 3D foam structure of low-density foam concrete mixtures. The results provide insights into using high-volume fine aggregates or other waste fine particles in low-density foam concrete for its functional applications.
Abstract
Foam concrete is a low-density controlled strength material that can potentially be used for accommodating different types of particles—recycled fine aggregate being an example. The paste matrix of this material has a cellular microstructure, and bulk performance is readily affected by the inclusion of fines. To study the effect of inclusion of fines on mechanical performance and foam structure of foam concrete, a group of 0.55 g/cm3 foam–sand composite mixtures with high-volume fly ash replacement are investigated. The elastic modulus is measured by a vibrational frequency test. The crushing mechanics are determined by the load-displacement response from a penetration test. The effect of particle inclusion on the foam concrete microstructure is characterized using micro computed tomography. The results indicate that use of fine-graded sand particles at a small dosage simultaneously reduces cement content and enhances the crushing performance, however poor material performance is observed for a high sand content. The cellular structure of the foam–sand composite, and thus its mechanical behavior, can be substantially diminished by larger sand particles, especially when the particle size is larger than the voids in foam.
Keywords:
foam concrete; cellular concrete; ceramic foam; modulus; crushing; energy absorbing; CT; foam structure; foam stability1. Introduction
Concrete sustainability has emerged as a key theme across modern concrete studies because of the large environmental impact of cement production [1] and natural aggregate exploitation [2]. All three Rs of environmental protection—reduce, reuse, recycle—can be applied in some ways to concrete infrastructure. Recycling concrete from demolished building structures and pavements as aggregates for new constructions represents a strong potential for concrete recycling. While the use of recycled coarse aggregate is well established [3,4,5,6], the fine fractions in recycled concrete aggregates pose greater challenges for material recycling in new construction [7,8,9]. Due to the high heterogeneity of recycled fine aggregate, there are a wide variety of concrete durability concerns, such as water permeability, long-term shrinkage, and alkali–silica reaction, which makes it difficult to recycle the fines in the production of normal concrete for structural purposes.
However, good potential has been seen for using recycled fine aggregate for making controlled low strength materials (CLSM). New ideas about using fine inclusions in foam concrete, which is classified as a low-density CLSM [10,11], open new possibilities to accommodate high-volume recycled fines for its functional material applications, such as excavatable landfill, thermal and acoustic isolators, and fire resistant and impact absorbing materials [12,13,14,15].
Foam concrete is a cellularized cementitious solid made from blending aqueous foam with fresh cement paste. Depending on the volume ratio of the foam, the bulk density of foam concrete typically varies from 0.3 to 1.6 g/cm3 [16]. Mixtures with density higher than 0.8 g/cm3 may be applicable for structural applications [12,17,18]. At lower densities, the strength of the foam concrete is greatly reduced, and the material exhibits other beneficial properties, being ultra-lightweight, permeable, and crushable. In this study, attention is focused on the functional potential for the ultra-lightweight foam concrete.
Although the use of fine aggregates is seen in some foam concrete studies, most of the investigated foam mixtures are denser than 0.8 g/cm3 [12,18,19] and only a few studies focused on the influence of adding sand into low-density foamed paste [2,20,21]. Based on the existing literature, the strength of low-density foam concrete mixtures is sensitive to the inclusion of particles and can be affected by the filler type. It has been reported that foam concrete with fine aggregates shows a greater tendency of shrinkage, and ensuring good curing is critical [12,22]. It is generally understood that greater sand or particle content reduces the foam stability, which usually causes strength reduction in foam concrete [18,23,24,25]. For most cases, a small amount of inclusion of finer particles results in a higher strength of foam concrete. Fly ash is also considered as a filler in some studies [20,26,27,28] and a favorable effect has been seen with respects to workability and strength; however, the physical and chemical nature of fly ash can be quite different to typical particle fillers. Some discussions on using other recycled fine aggregates in foam concrete are also found in literature [2,29].
As a cellular solid, the performance of foam concrete is largely governed by its foam structure [17,23,30,31,32]. Before implementing recycled fine aggregates in foam concrete, it is pertinent to understand how the cellular microstructure is altered with the inclusion of particles, and how this alters mechanical performance. Given the promise of using recycled fines in ultra-lightweight foam concrete for low strength applications, low-density foam mixture design and processing deserve greater attention by researchers. More knowledge about efficiently incorporating particles into the foam structure is needed for advanced use of recycled fines in foam concrete production.
This study focuses on investigating the effect of adding fine particles to the foam concrete crushing behavior and void structure, where the mixture is considered as a foam–particle composite. Fine river sand was used as a standard filler for studying the influence of particle size and dosage on foam concrete mixtures. A high-volume fly ash replacing 40% cement was designed to further advance the engineering sustainability and to improve the mixture uniformity. All the foam–sand mixtures were designed at a 0.55 g/cm3 bulk density, with three particle sizes (300, 600, and 850 µm) and at three sand-cementitious weight ratios (0.15, 0.3, and 0.5). The elastic modulus of the samples was measured using a vibrational frequency test. For investigating the crushing behavior of the composite material, a penetration test was conducted. In order to clarify the influence of sand inclusion on the foam structure, micro computed tomography (micro-CT) was further used to characterize the 3D morphology of a subgroup of the samples.
2. Mixture Design and Sample Preparation
A controlled sample without sand as well as nine mixtures of foam–sand composite samples of different sand ratio (mass ratio between sand and cementitious materials) and sand size were prepared for this study. The detailed information of the mixture design is given in Table 1, where the mixture naming convention is “sand ratio_sand size”. The materials included cement (Essroc Italcementi Group, Type I/II), fly ash (Boral, Class C), water, superplasticizer (Sika, ViscoCrete 2100), an accelerator (Grace, Calcium Chloride 37), a foaming agent (BASF MasterCell 30), and river sand (specific gravity = 2.63). The “300 μm” sand had a size range between 300 to 600 μm, the “600 μm” sand ranged from 600 to 850 μm, and the “850 μm” sand ranged from 850 to 1180 μm.
The foam concrete mixture design generally followed ASTM C796 [33], and the entire mixture preparation was divided into four steps: paste mixing, preparation of aqueous foam, foamed paste mixing, and sand inclusion. For preparing the paste, the mixing protocol followed the standard specified in ASTM C305 [34]. As part of the water was used for foaming, the water available for paste mixing was different across the samples. As such, the superplasticizer was used to maintain the same flowability of the fresh paste for the subsequent mixing. The accelerator was dosed as 8% by weight of cement for better stabilizing of the fresh foamed mixture [16]. A standard aqueous foam was prepared separately by blending water with the foaming agent at a 15:1 ratio. After that, the paste and foam were blended together using a high-speed mixer. During this step, different amounts of aqueous foam were progressively added to the mixture for achieving the target bulk density in different samples. The sieved sand particles were then gently poured into the foamed paste, after which the mixing was extended for 30 seconds to ensure an even final mixture.
All the samples were designed to have the same bulk density of 0.55 g/cm3. The paste in all samples was designed with 0.45 water–cementitious ratio (w/cm) and 40% fly ash replacement (by weight of cement). All liquid phase from the aqueous foam and chemical agents was considered for cement hydration when calculating the w/cm ratio. Considering the mixing process involves only using a portion of water for paste mixing, the cement created in the first step has a low w/cm ratio, down to 0.35. From previous experimental tests, mixing of this lower w/cm paste with the foam could not be blended into a homogenous mixture of foam concrete, even when dosed with a high amount superplasticizer. Therefore, a major portion of the cement was replaced with fly ash to obtain a more flowable paste mixture.
Based on previous experimental work, it was observed the foam had void sizes ranging between 400 to 800 μm. Therefore, the three sand sizes used in Table 1 were selected to differentiate the three cases that particles are smaller, within range, and larger than the voids. Since the density of the river sand is higher than the paste, the effective bulk density of the pure foamed paste decreases when the sand ratio increases (see Table 1).
For each mixture, three prismatic specimens for the vibrational frequency test (50.8 × 50.8 × 203.2 mm) and three cylindrical samples for the penetration test (101.6 mm diameter by 203.2 mm height) were cast. The cylinder specimens were seal-cured in the mold until testing, while the prism specimens were demolded at 7 days and further cured under the sealed condition. The bulk density of each mixture was also measured at this age. Any sample that showed a deviation from the target bulk density larger than 0.05 g/cm3 was rejected, and the mixture was recast. The bulk density of the accepted mixtures for testing is shown in Table 1.
3. Testing methods
3.1. Measurement of Elastic Modulus Using a Vibrational Frequency Test
The influence of sand inclusion on foam concrete elastic modulus was evaluated using the vibrational frequency test as specified by ASTM C215. Feasibility of using this test for measuring the elastic modulus of foamed cement paste has been confirmed in several studies [15,35]. As the measurement is non-destructive, the three prism specimens of each mixture were repeatedly tested at the age of 7, 14, and 21 days, where the modulus measurement were repeated three times on each specimen during testing. Due to the use of an accelerating admixture, the subsequent increment of the sample modulus was found to be marginal after 21 days and thus negligible. The testing instrument of the elastic modulus measurement included a PCB-352C04 accelerometer, a PCB-482 signal conditioner, and a NI-9171 DAQ for data acquisition. This testing setup yielded a 4 Hz resolution in the frequency spectrum. As suggested by the previous test [35], the sample elastic modulus was interpreted based on the transverse vibration frequency of the prism specimens.
3.2. Measurement of Crushing Behavior Using a Penetration Test
The crushing behavior of the samples was characterized using a penetration test at 7, 14, and 21 days, where one cylindrical specimen was tested per mixture at each age. This test method has been previously used for studying the crushing behavior of foam concrete [15]. For each test, a 47 mm diameter steel rod was vertically displaced into the cylinder specimen at a 75 mm/min rate from the top center, where the loading was controlled using an Instron-4502 testing frame. Due to the 10 kN loading capacity of the load cell used, the maximum indentation stress was 5.7 MPa.
3.3. Micro-CT
The microstructure of the materials used in this study was investigated using an Xradia MicroCT (MicroXCT-200). Due to the low sample density, a low-level X-ray energy setting was used for data acquisition. The micro-CT specimens were extracted from the controlled and composite samples of a 0.5 sand ratio. Each specimen was a small pellet of 5 mm diameter, excised from the undamaged section of the parent cylindrical sample after the 21-day penetration test. For consistency, the specimens were extracted roughly at the same location from the mid-depth of the cylinder. The CT scan captured a volume of 5000-μm diameter cross-section by 5000-μm height, with a voxel size of 5 µm. After testing, the micro-CT scans were processed using image analysis software, ImageJ. After segmenting different phases in the mixtures (air void, hydrated cement paste, and sand), the 3D solid foam structure was reconstructed for each sample, where the model represented a smaller volume of 500 × 500 × 500 voxel3 (2500 ×2500 ×2500 µm3) at the center of the specimens.
4. Results and discussion
4.1. Elastic Modulus of the Samples
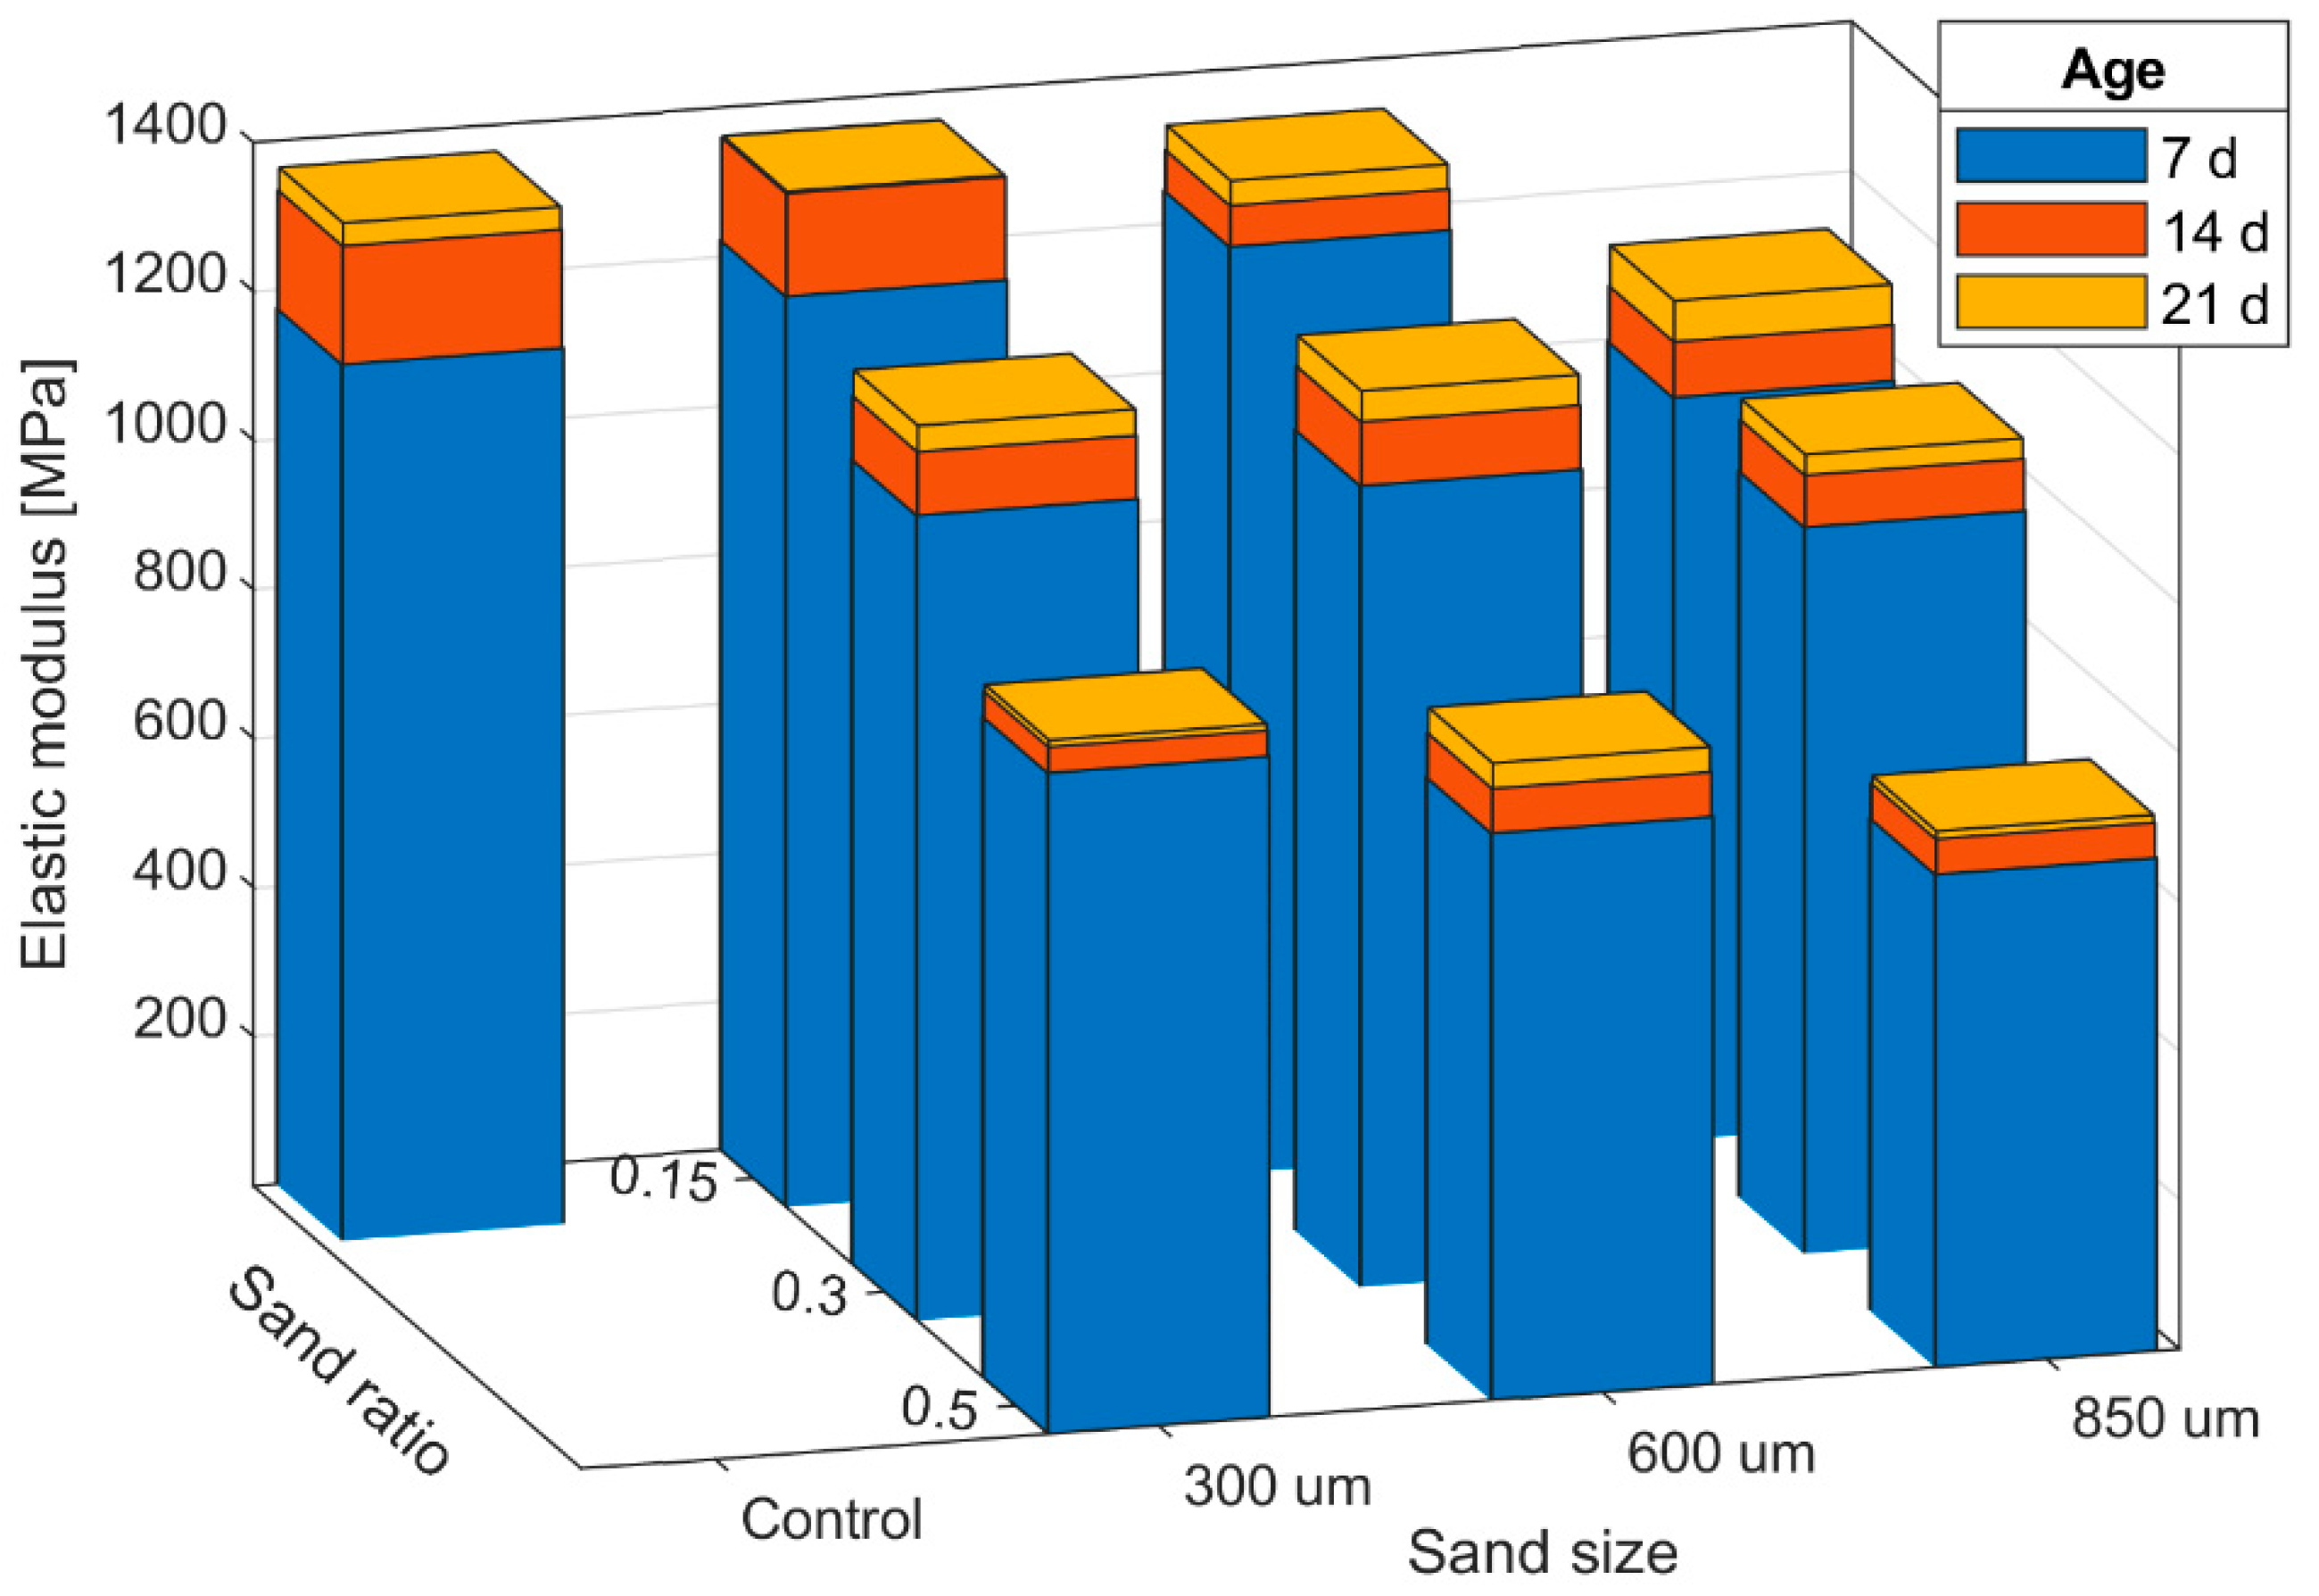
The elastic modulus data obtained from the using the vibrational frequency test are summarized in Table 2 and compared in Figure 1. Each mean value in Table 2 represents the result averaged from nine measurements (3 specimens by 3 repeats). Continuous increase of the elastic modulus was seen for all samples from 7 to 21 days, where the average increase was 7.8% at 14 days and only 2.6% at 21 days. Because of the high accelerator dosage used for mixing, the modulus change of the samples from 14 to 21 days was marginal, indicating that cement hydration in the mixtures was almost complete at 21 days. In terms of standard deviation of the measurements, the samples with a larger sand ratio were less consistent than the others at 7 days but more consistent at the later ages.
Figure 1 indicates that elastic modulus decreases for both sand size and sand ratio. The lowest modulus values at all three testing ages are observed with Sample 0.5_850 μm, which had the largest sand ratio and sand size. On the other hand, the modulus of Sample 0.15_300 μm is quite close to the control sample. The influence of sand ratio from 0.15 to 0.5 is more significant than increasing the sand size from 300 to 850 µm in this case. Although the elastic modulus of the fine aggregate is greater than cement paste, the overall trend indicates that the elastic modulus of the composite samples are much reduced at higher sand ratios. However, similar observations have been reported in the literature [12,19,27]. As all samples were designed for the same target bulk density, the effective density of foamed paste is lower in samples with higher sand ratios, as shown in Table 1, meaning that less cement is available to support the cellular structure in foam concrete. This should be the main influence from sand ratio. Interestingly, the 7-day modulus values of Samples 0.15_300 μm and 0.15_600 μm are slightly higher than Control, and continue to stay close to Control at the later ages. This relationship, however, is not observed for Sample 0.15_850 μm. Thus, a small amount of sand inclusion has a minimal influence, or even a slight improvement, on the elastic modulus of the foam–sand composite, but this rule does not hold true when the particle size becomes larger.
The influence of sand size on elastic modulus is not strong in the samples with the 300- and 600-μm sand of 0.15 and 0.3 sand ratios, but an increase in particle size to 850 µm resulted in a substantial reduction for all sand ratios. Seemingly, there is a size threshold between 600 and 850 µm beyond which leads to a marked modulus reduction. It can be noticed that by increasing the sand size, the cellular matrix of the foamed paste loses the ability to support the sand particles within its cellular matrix. Although all three 850 μm samples exhibits lightly lower densities than their counterparts, this difference plays a minor role in the modulus reduction. The lower bulk densities of the 850 μm samples imply that these foam mixtures are less stable during the fresh stage. This issue will be further discussed with the micro-CT evidence later in this paper.
4.2. Loading Behavior
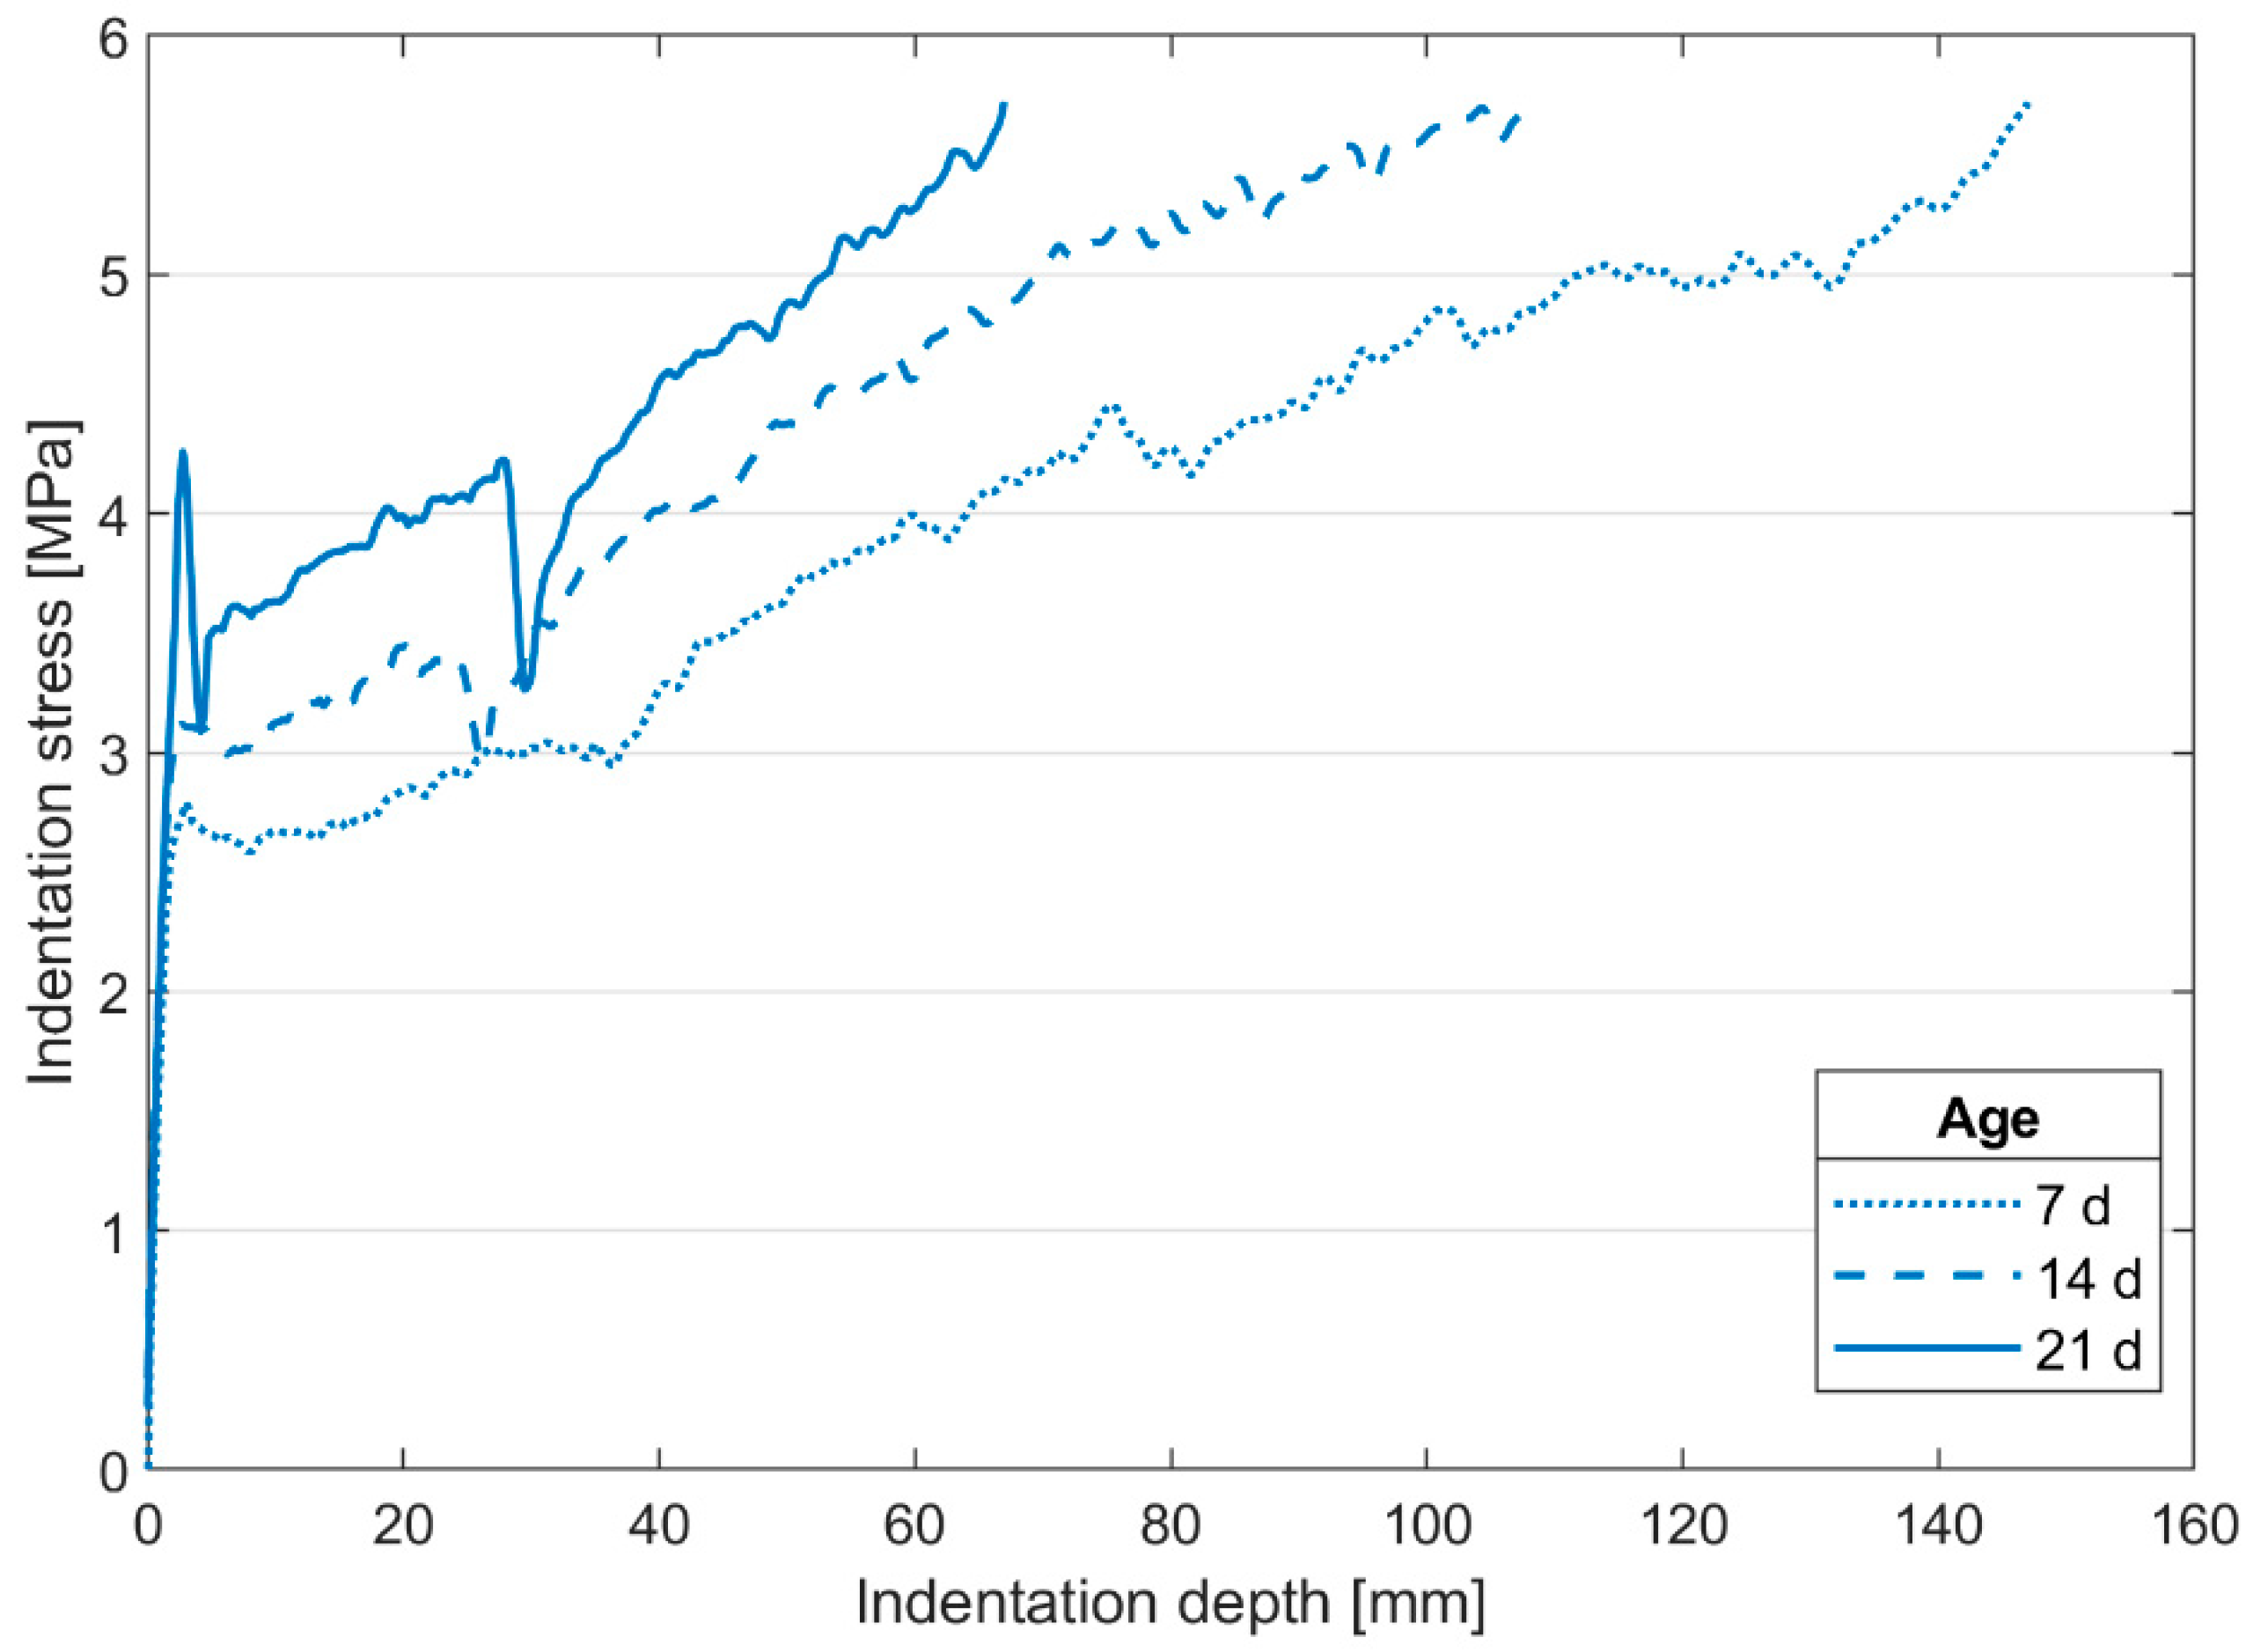
The loading behavior of all the samples was investigated using the penetration test at the same testing ages as the vibrational frequency test. A demonstration of the loading responses of the control sample at the three ages is given in Figure 2, where the indentation stress was calculated by dividing the resistant force by the cross-section area of the cylindrical indenter. A preliminary test has confirmed that the friction between the indenter and sample is so small that such effect is negligible. All the indentation curves of the samples were curtailed on (1) the x axis at 160 mm as further penetration results in boundary effects and (2) the y axis at 5.7 MPa indentation stress as the loading capacity of the testing frame is reached.
The trend of the indentation curve of the samples is consistent with the observation from several other studies on foam concrete [15,36] and other cellular solids [37,38]. As the test initiated, the material behaved in a linear-elastic manner with a steep increase of the indentation stress. After reaching a yielding point shortly at a few millimeters, the increment became substantially milder at a roughly constant rate. Due to the geometry of the indenter, the crushing plateau reported in our previous study was not captured in this test [15]; the material crushing strength, however, can still be quantitatively compared based on the indentation stress at the same indentation depth. In Figure 2, localized material cracking affected the 14- and 21-day loading curves of the controlled sample at around 30 mm, after which the curves returned to their normal trend lines. These events are considered as anomalies that can be generally neglected, and they were rarely observed in the other samples, as cracks could not propagate effectively in the weaker microstructure.
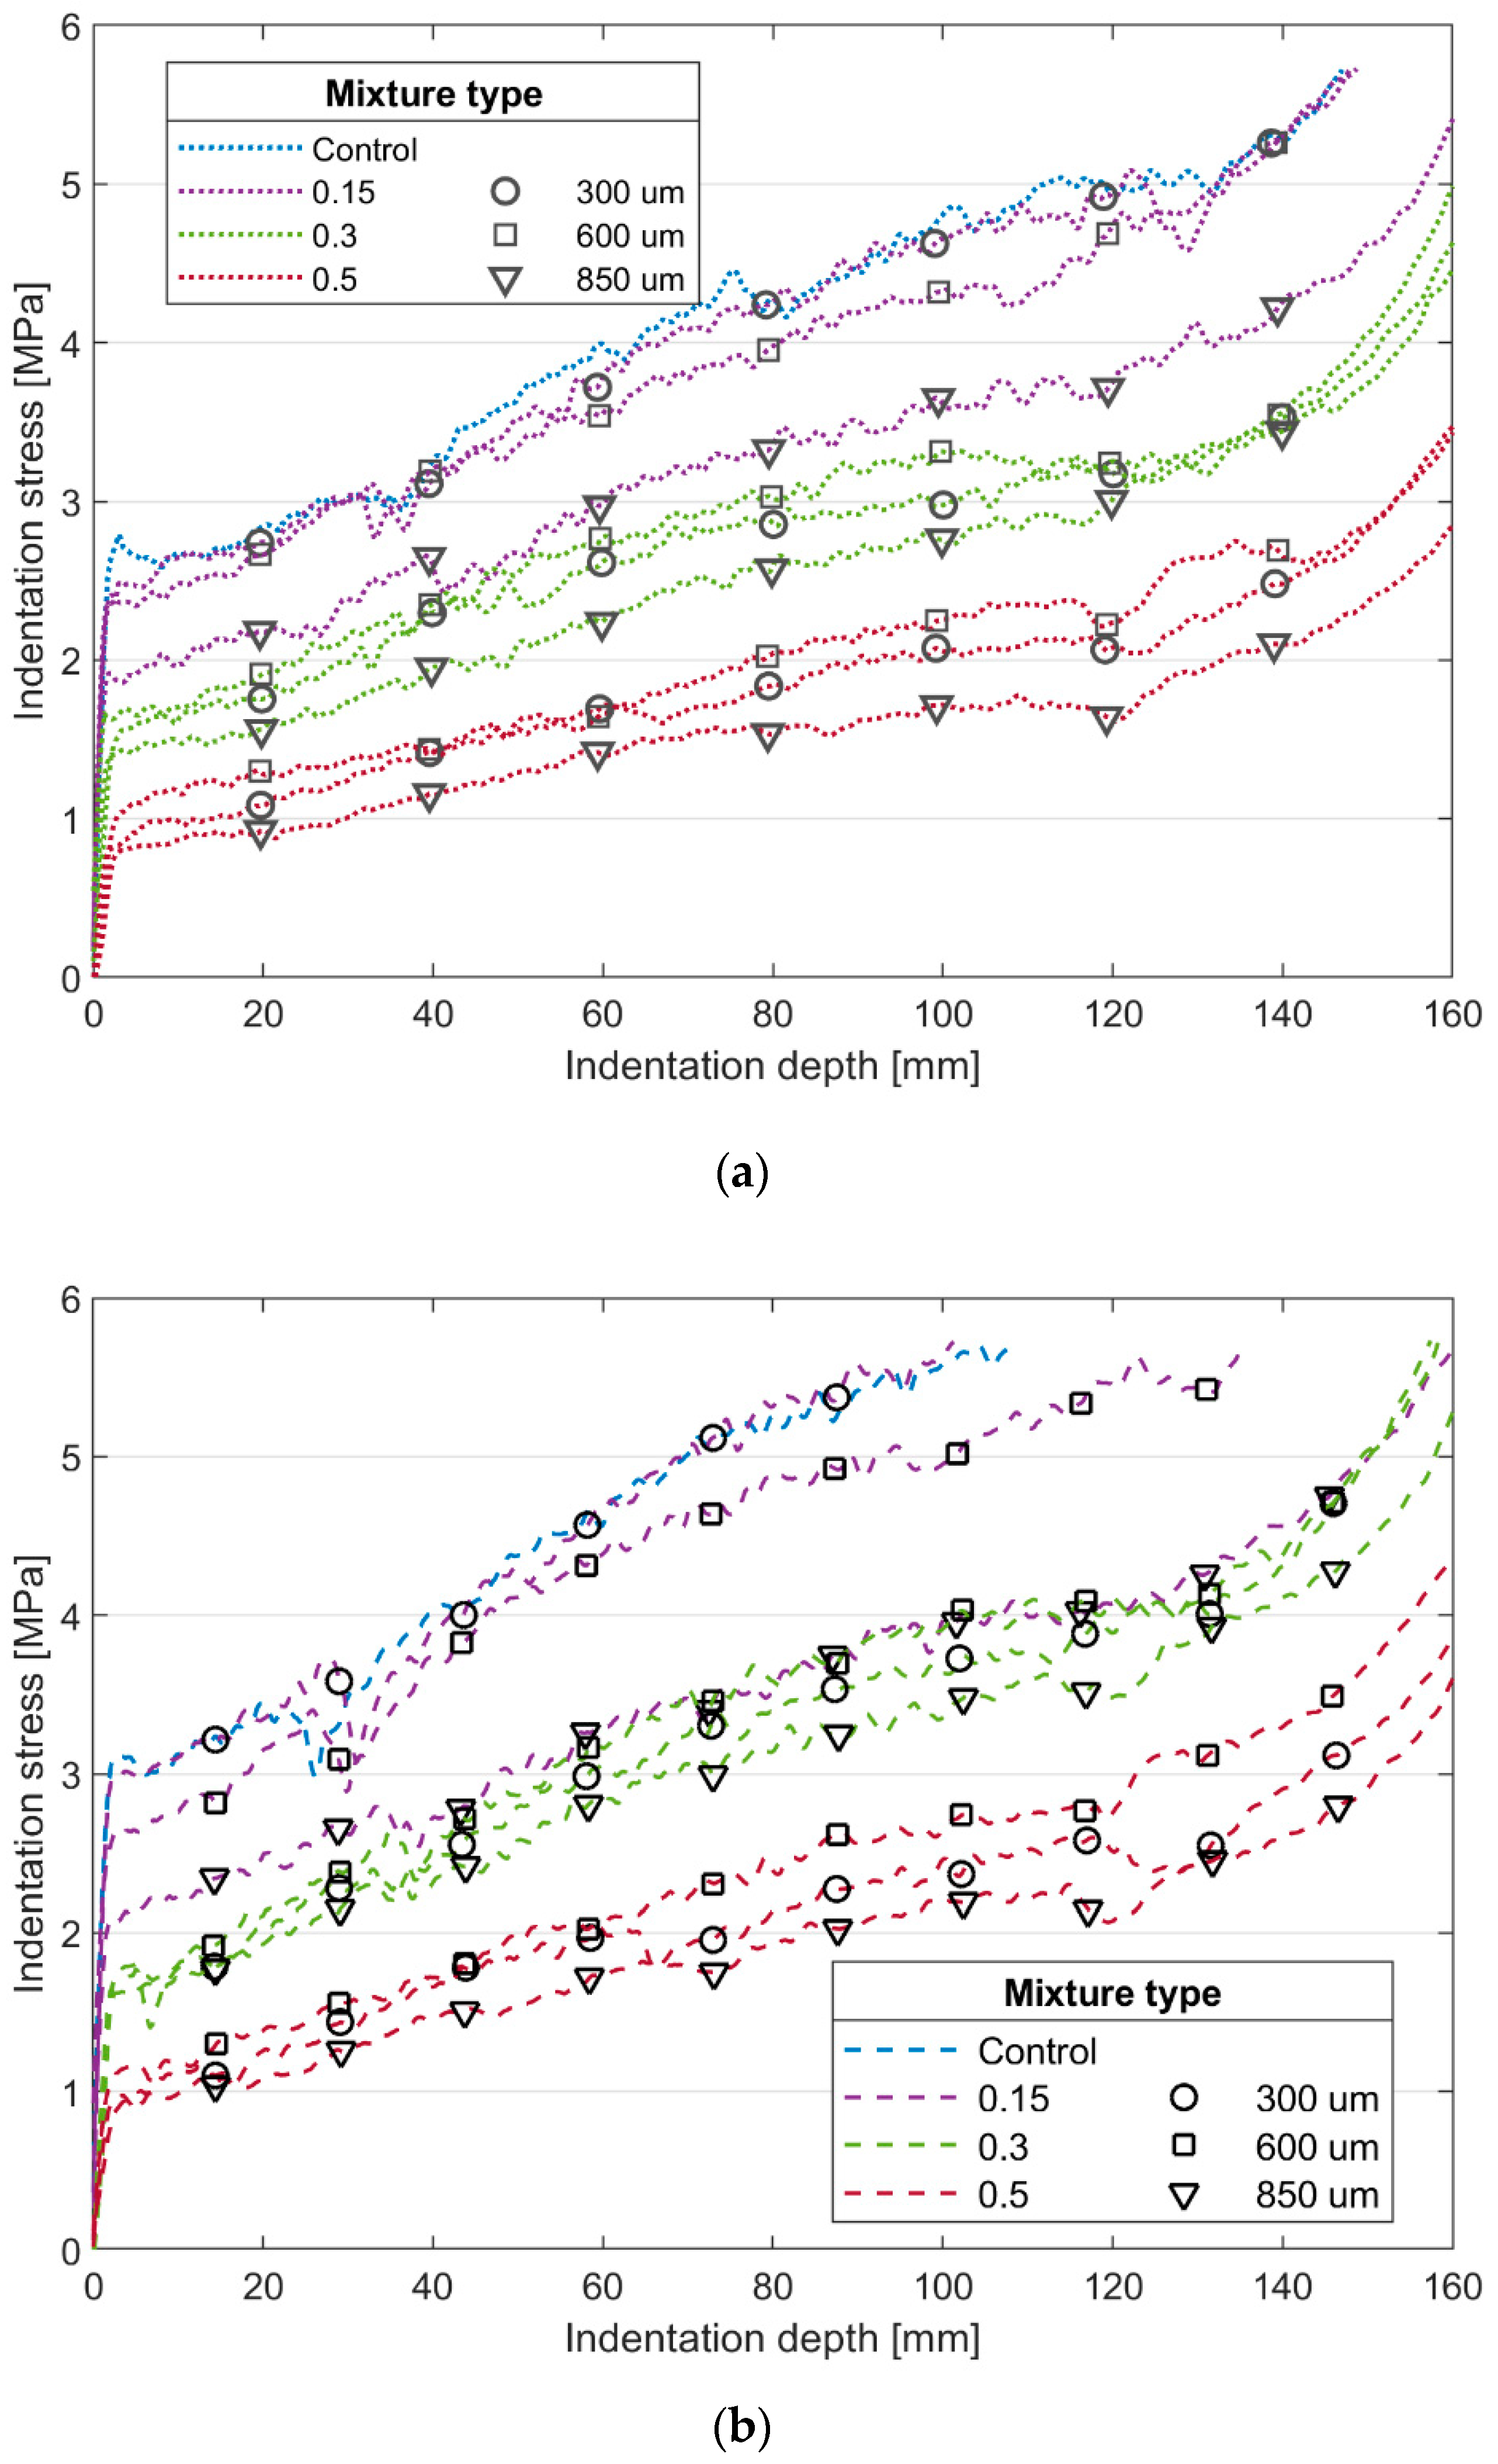
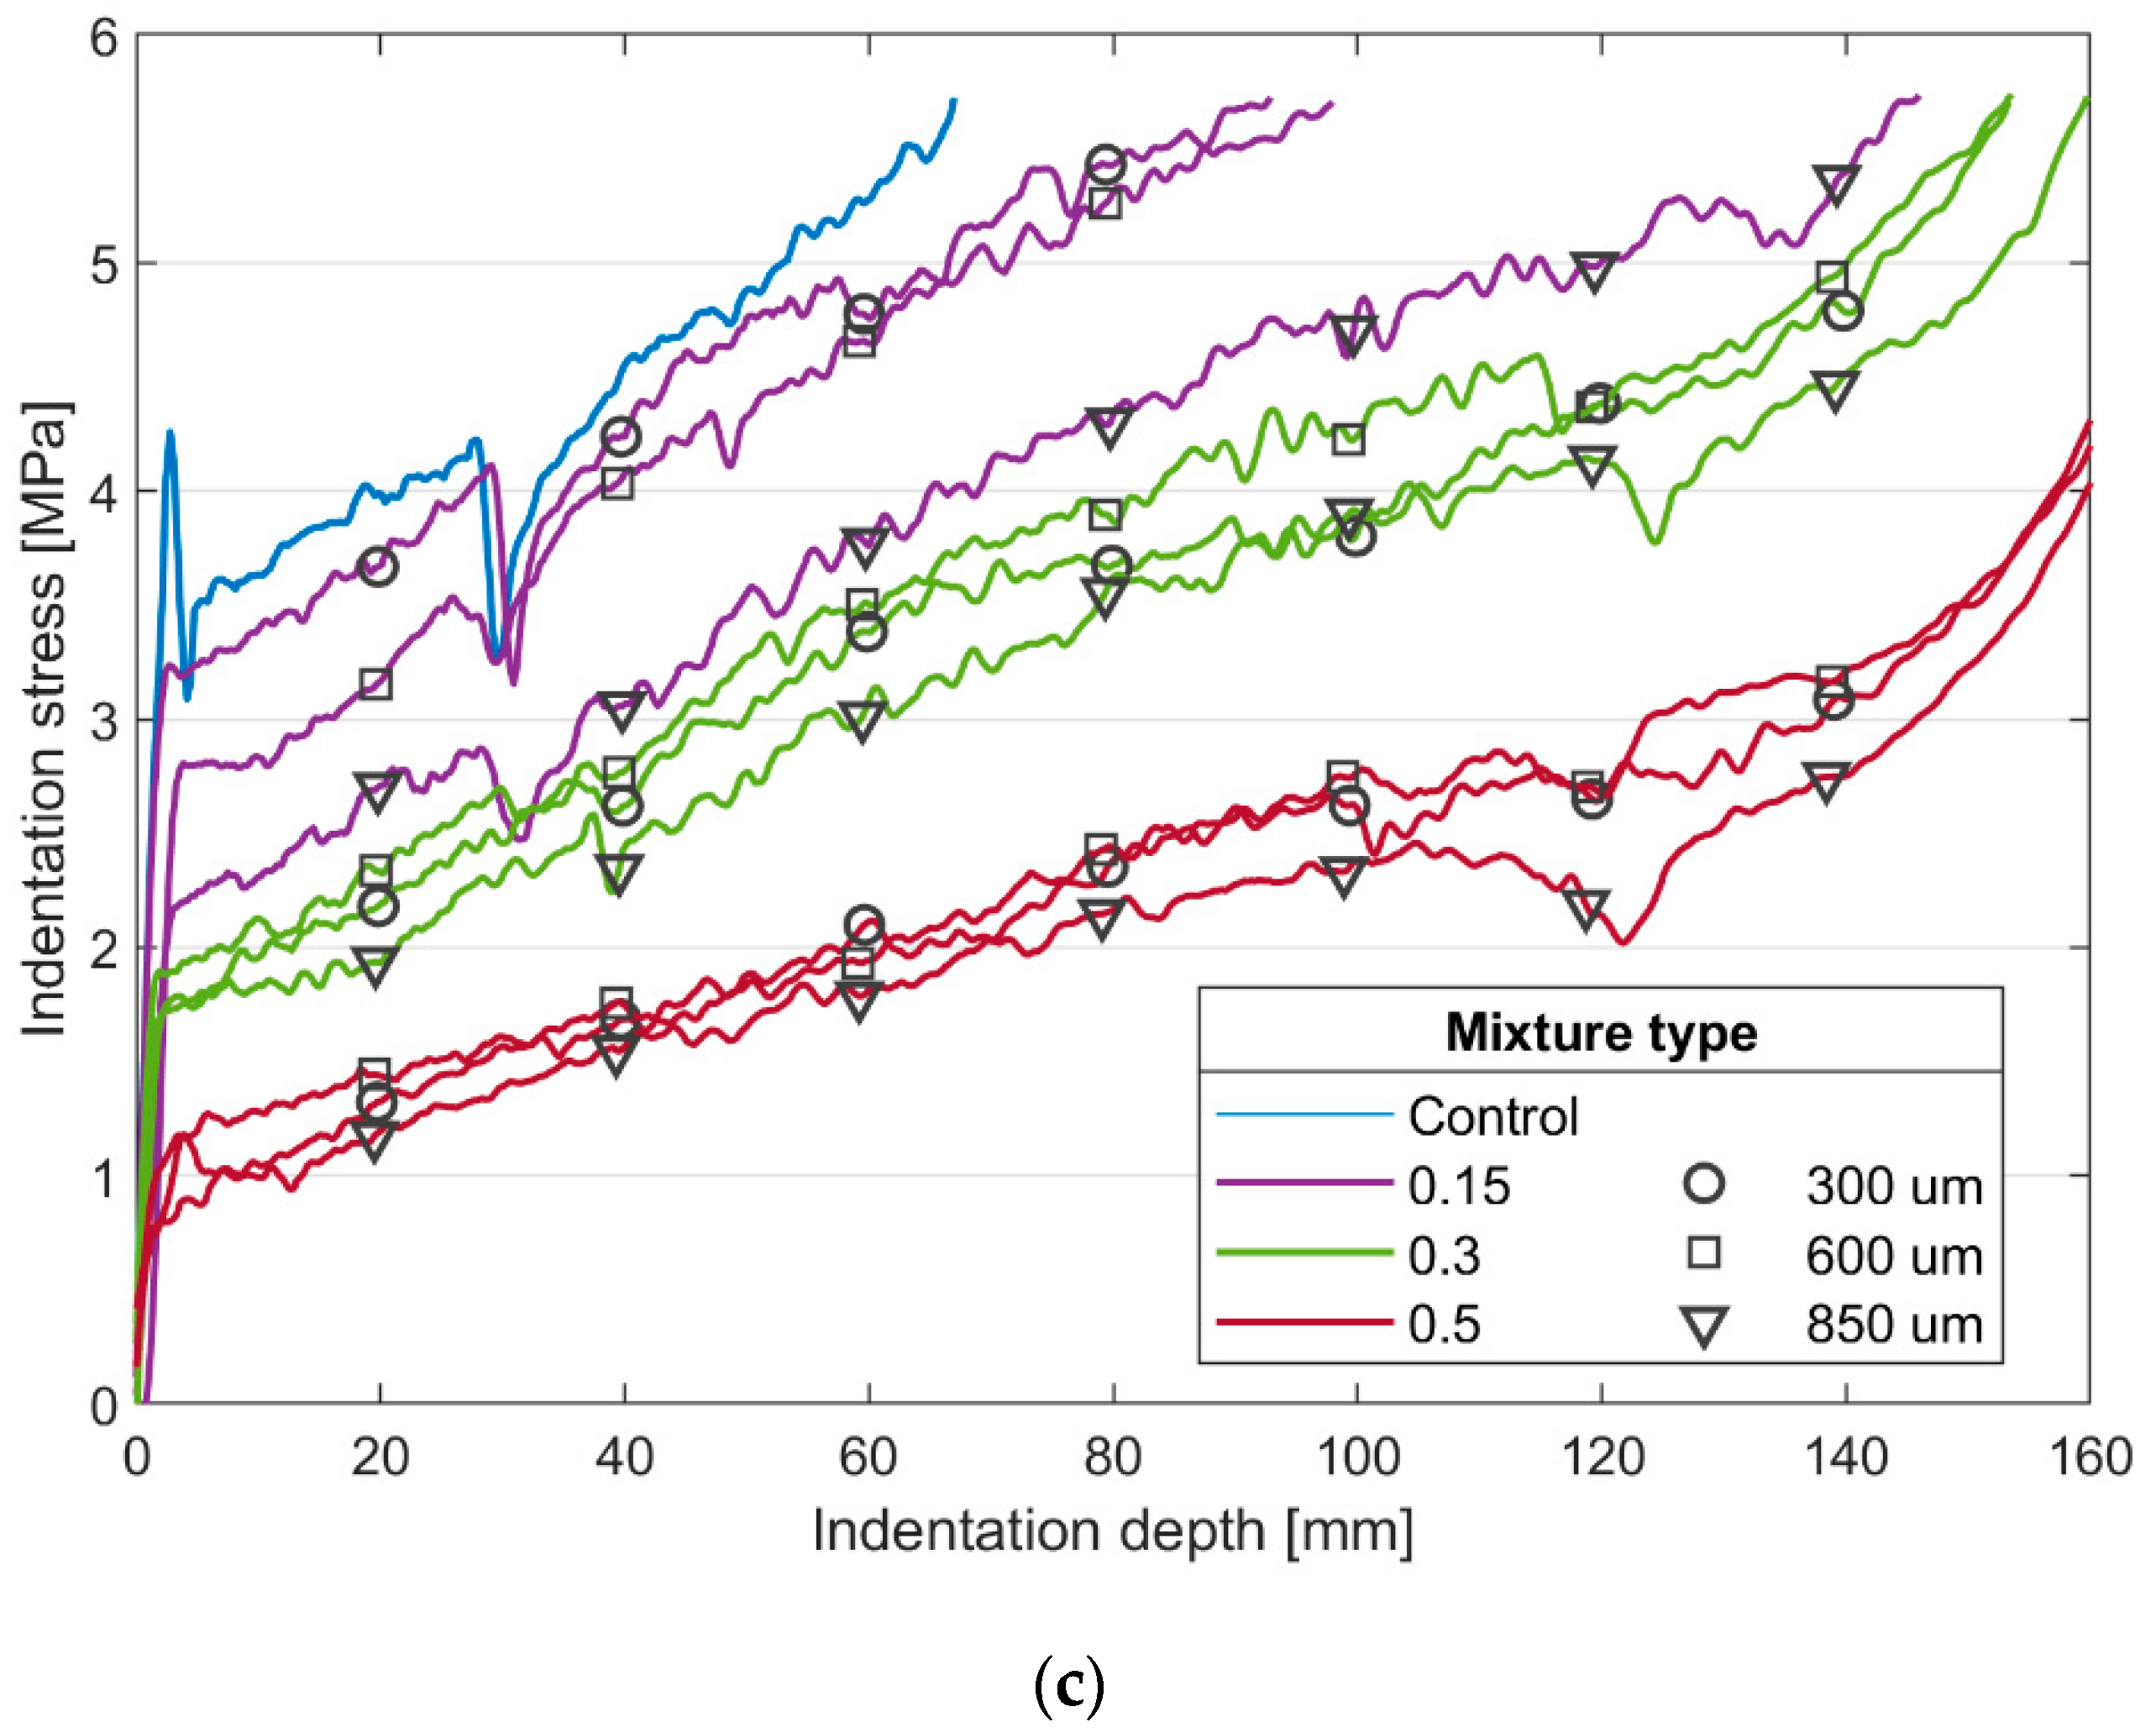
The 7-, 14-, and 21-day loading behavior across different samples are compared in Figure 3. In general, the influence from sand ratio and sand size to the crushing strength follows the same trend as observed from the elastic modulus measurement. Comparing the results among the three ages, the strength gain is smaller for the samples with a larger sand ratio. This phenomenon should be mainly caused by the reduced cement usage in the high sand ratio samples. The slope of the load curves after the initial yielding is also relevant to inclusion of sand particles. There is a noticeable rise in the curve slopes of the controlled sample and those of a 0.15 sand ratio. As more sand was added into the mixture, this slope change becomes less pronounce. This observation should be associated with the reduced bulk modulus for samples of higher sand ratio, as the stress build-up underneath the indenter develops at a slower rate in weaker samples. This point is generally supported by data from the elastic modulus measurement.
At a low sand ratio of 0.15, the 7 day loading responses of Samples 0.15_300 μm and 0.15_600 μm are similar to Control, while the indentation stress of Sample 0.15_850 μm is much lower during the entire crushing history. This evidence accords with an earlier study focusing on a higher foam concrete density and with coarser sand [22], which also shows that higher sand size reduces compressive and flexural strength of foam concrete. As a result of the reduced cement ratio, the indentation strength is consistently diminished for samples of the same sand size but higher sand ratio. At higher sand ratios of 0.3 and 0.5, however, it is still evident that the crushing strength is further reduced when larger sand particles are used. Another important observation is that no matter for which sand ratio, the relative strength reduction between the 850 μm and 600 μm samples is larger than that between the 600 μm and 300 μm samples, implying a profound influence from the 850-μm sand.
4.3. Micro-CT Investigation on the Influence of Particle size
The experimental results from both the vibrational frequency test and the penetration test indicate that sand size affects the material performance of the foam–sand composite samples, especially at the large sand ratio of 0.5. It has been known that the mechanical behavior of cellular solid material is primarily determined by the solid property (e.g., solid modulus) and the morphology of the foam structure (e.g., void size distribution) [13,18,23]. In this case, the solid modulus is related to the cement paste and sand; however, this factor remains unchanged under the same sand ratio of 0.5. Therefore, it is more likely that the size of the sand inclusion makes a difference in the foam crushing behavior by affecting the cellular paste matrix.
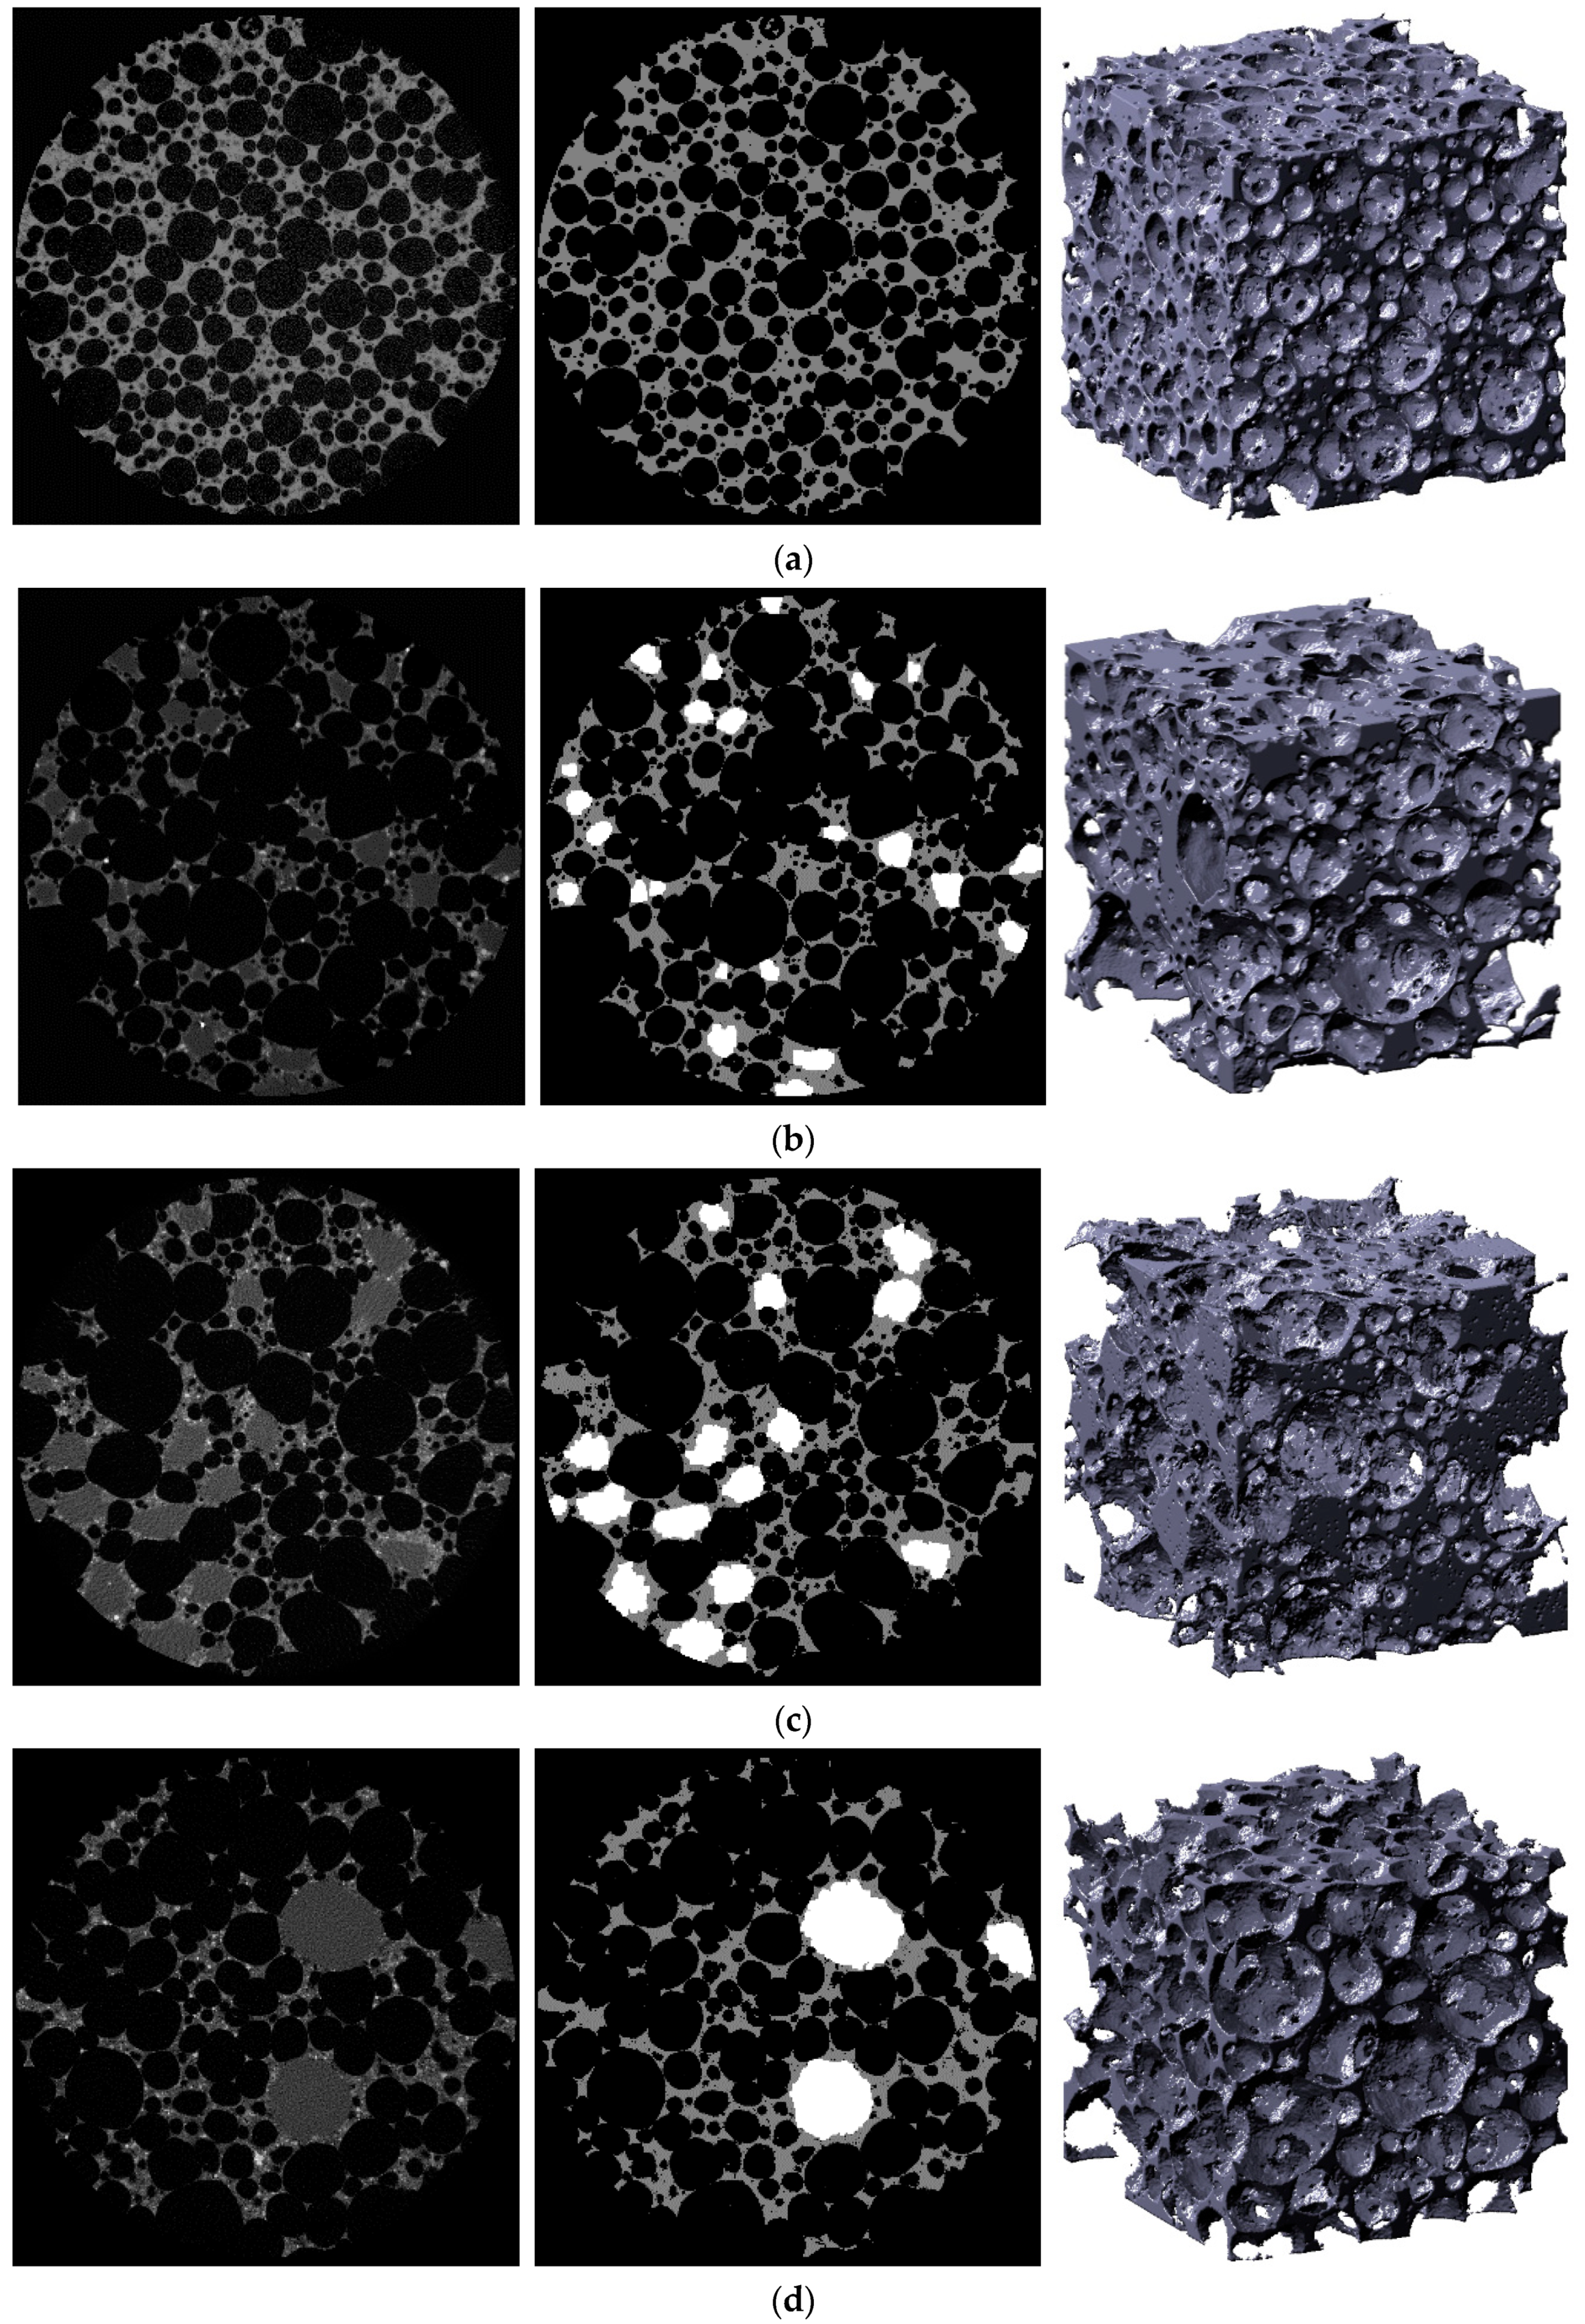
To study the influence of the inclusion size, the specimens of Samples of 0.5 sand ratio, along with the control sample were further scanned using micro-CT. These samples were selected because they reflected the greatest contrast between the control and composite samples based on the mechanical tests. A sample scan of each sample is shown in Figure 4, along with the corresponding processed image highlighting the different material phases and a 3D reconstruction showing the foam structure. The 3D reconstruction represents a smaller 2500 × 2500 × 2500 μm3 volume being extracted from the center of each CT scan. Due to the density difference, the sharp contrast made it easy for segmenting between air void and solid phases, while it was more challenging to separate out the sand particles from the cement paste, as the density of C-S-H solid is close to that of the sand [39].
To further validate the CT test, the volume fractions of the three phases measured from the 3D reconstruction of each sample were compared with the theoretical values calculated based on the mixture design, as shown in Table 3. In general, the measurement achieves a decent agreement with the theoretical volume for all four samples, especially the void content. Due to the difficulty of separating the paste and sand, the variation on these two phases is greater. With respect to the composite samples, a greater deviation is observed in Sample 0.5_600 μm, but still within a reasonable range.
In terms of the spatial distribution of sand, the 3D reconstruction shows that no particle agglomeration in the inspected volumes and these mixtures are generally homogeneous. The segmentation images in Figure 4 confirm the increment on sand size from Sample 0.5_300 µm to 0.5_850 µm. Since the amount of sand inclusion was identical across the three samples, the sand population declines with the particle size. Seemingly, the sand particles in Samples 0.5_300 µm and 0.5_600 µm are more included in the cement paste, but those in Sample 0.5_850 µm are less confined by the cellular matrix.
Regarding the air void size, Sample Control in Figure 4a has the smallest voids among the four samples. This difference is mainly caused by the lower effective density of the foamed paste in the composite samples (see Table 1), and thus less confinement to the air bubbles in fresh cement paste before setting. These larger voids can be partly attributed to the presence of sand as well, as the interaction between the solid sand particles to the soft air bubbles reduces the stability of the foamed paste during mixing [17,23,32]. Another observation is that the sand particles in Samples 0.5_300 µm (Figure 4b) and 0.5_600 µm (Figure 4c) are smaller than the large air voids in the cellular matrix; however, the particle size is evidently larger in Sample 0.5_850 µm (Figure 4d). This difference may be relevant to the greater drop on elastic modulus and crushing strength of samples with the 850 μm sand.
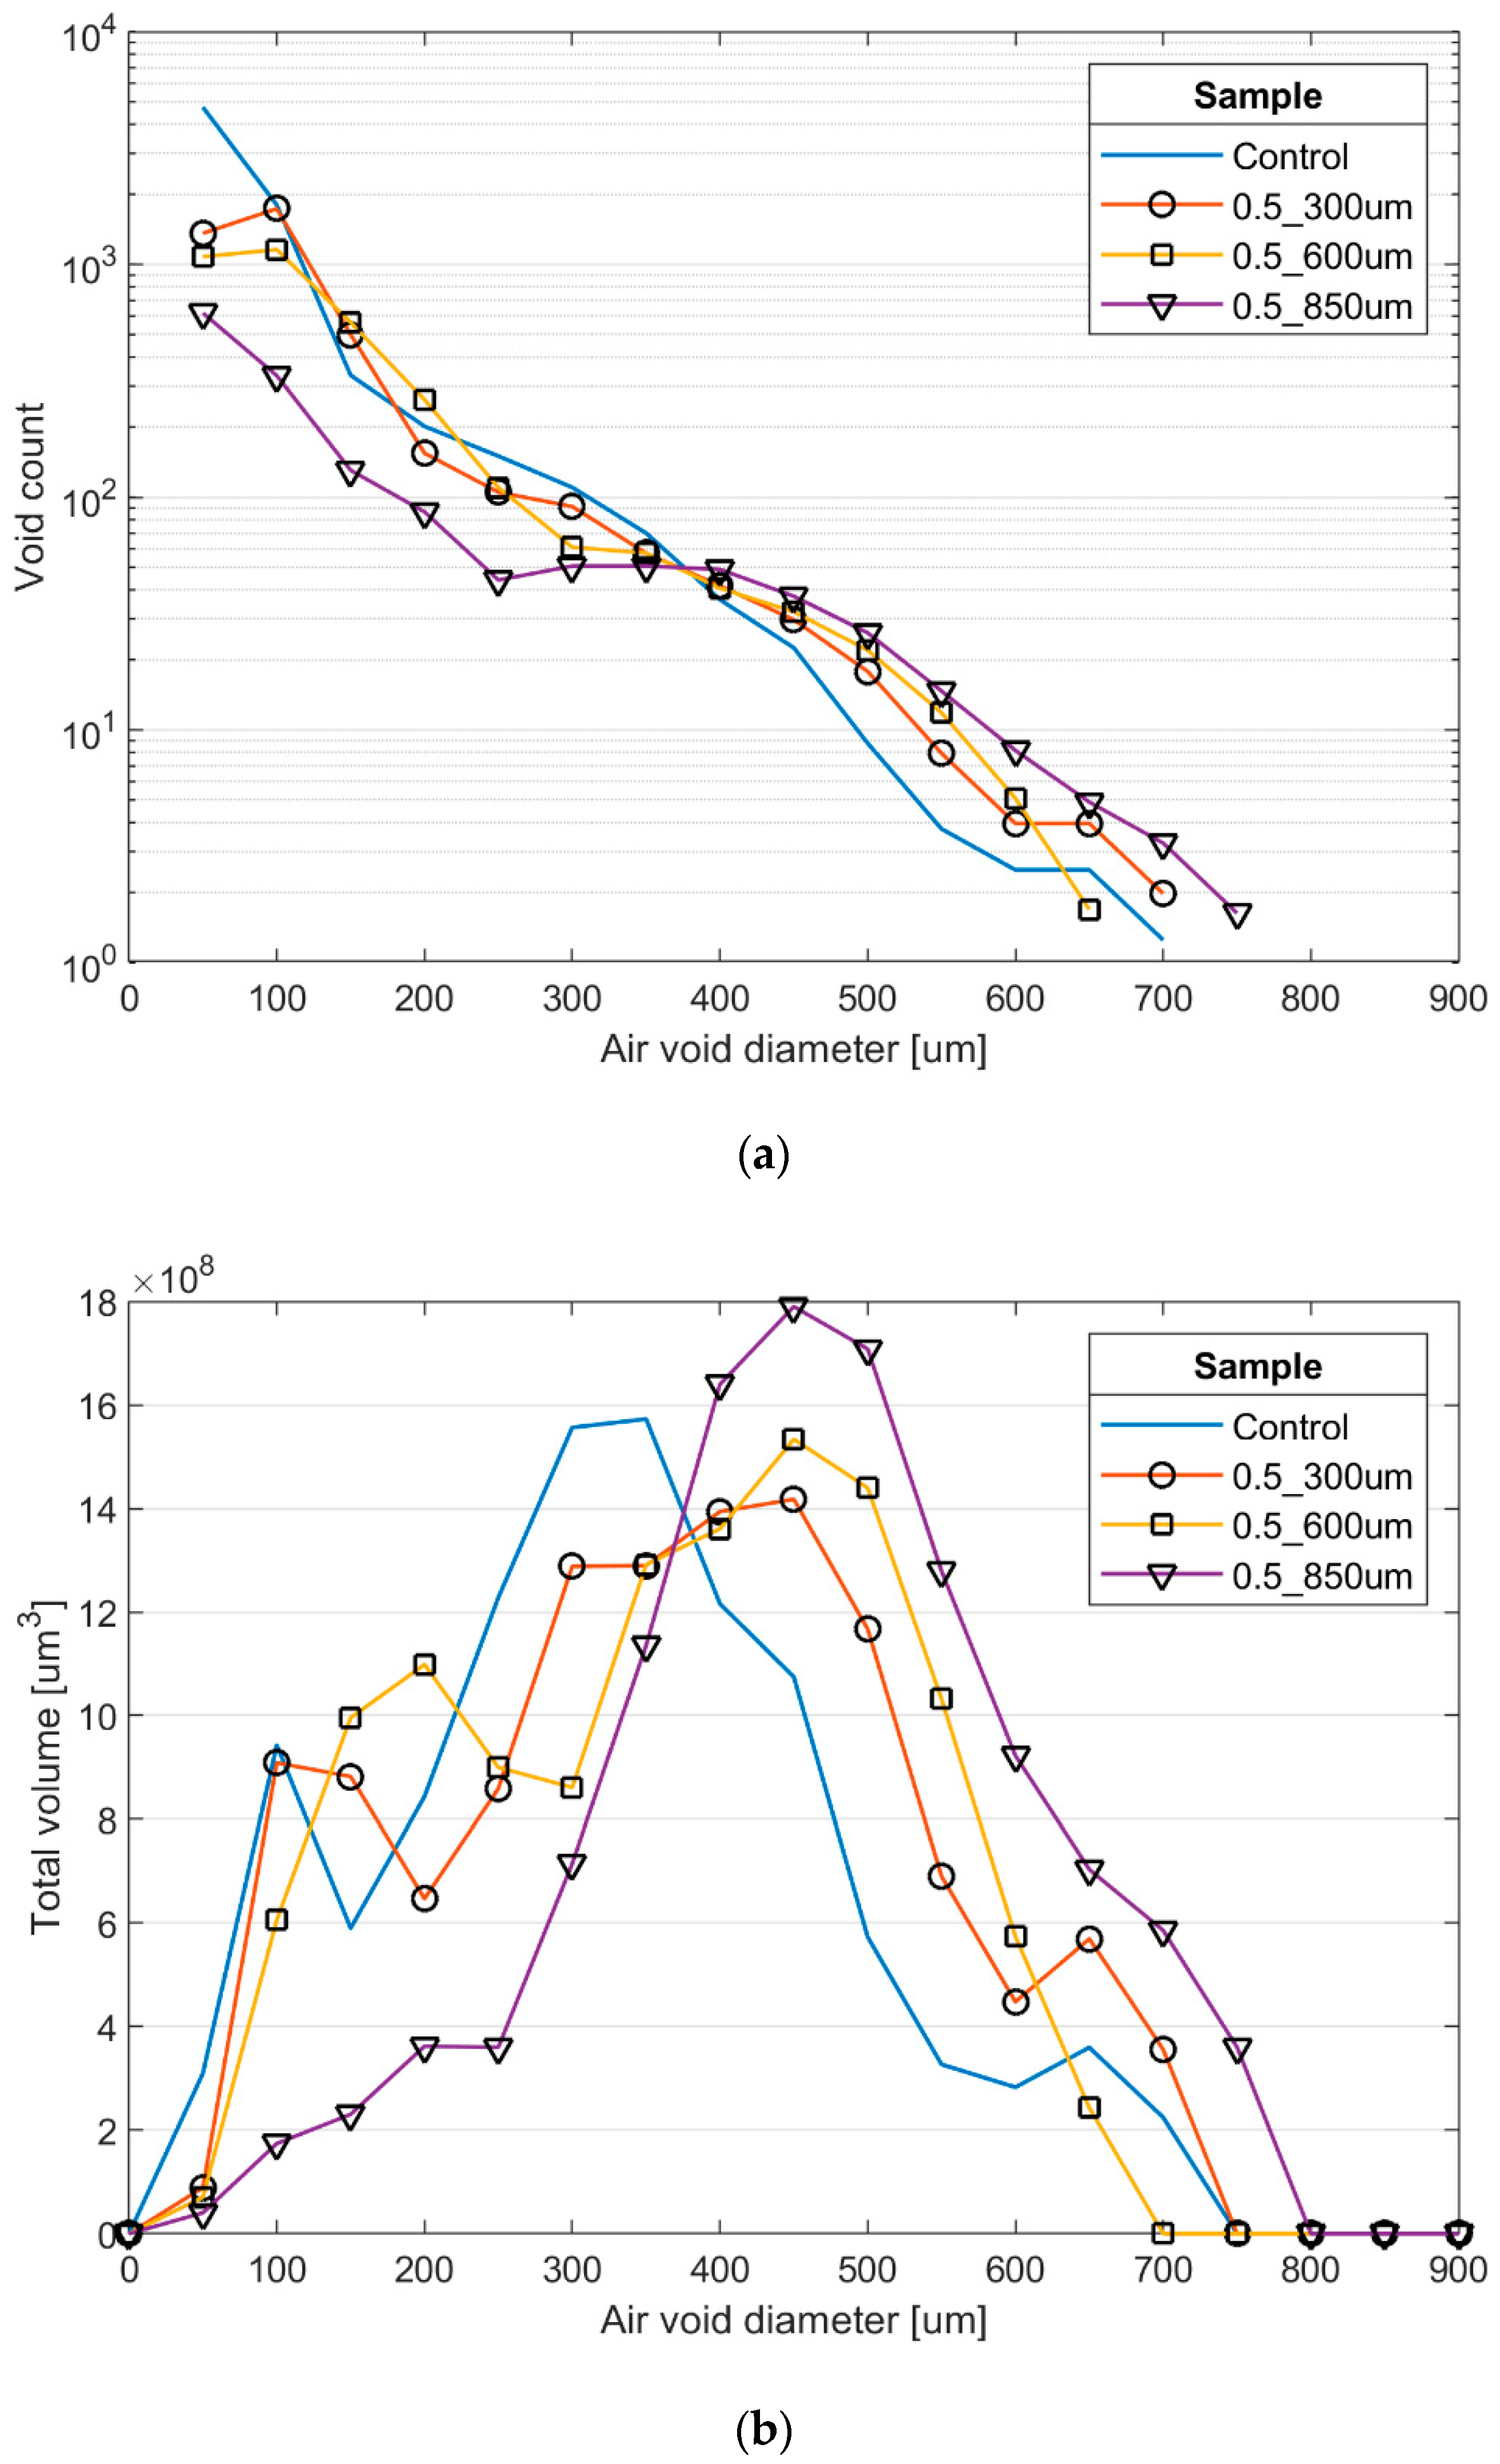
To compare the void systems of the four samples quantitively, their void size distributions were extracted from the 3D reconstructions, as shown in Figure 5. As the air voids that are intersected by the model boundary does not reflect the actual void size, those intersected voids were not counted for the statistical analysis. As a result, the effective model volume was different for each sample. This artifact was compensated by renormalizing the effective model volume back to 2500 × 2500 × 2500 μm3. A back calculation using the normalized distributions confirmed that the deviation to the actual bulk density of each sample was less than 5%. In the four specimens, voids larger than 800 µm were not observed, which is generally in agreement with the visual inspection. Possibly, air bubbles larger than this size cannot be sufficiently confined by the fresh mixture during mixing.
According to Figure 5a, the log-scaled void population of Sample Control reduces rather linearly as a function of void size. As suggested by the other three samples, the sand inclusion results in fewer small voids and an increase of large voids. This point is better reflected in Figure 5b, as the volume distribution progressively moves to bigger voids with larger sand added. Since a standard aqueous foam was used for casting all mixtures and the only difference was the volume of foam added, ideally, the normalized void size distribution should not shift across different samples. Therefore, the influence on void size distribution must be induced by either the foamed paste or/and the particle inclusion before setting. Figure 5a shows that the overall distributions of Samples 0.5_300 µm and 0.5_600 µm are close to the controlled sample from 100 to 450 µm but consistently higher at larger sizes. The remarkable reduction at 50 µm can be mainly attributed to the diminished stability of small air voids, which have a higher tendency of merging under the reduced paste confinement. Based on the gradual rightward shift of the three distributions in Figure 5b, the larger sand seems to further induces formation of larger voids at the expense of smaller ones.
In comparison, the 850-μm sand has a more profound impact on the void distribution. According to Figure 5a, the void population is dramatically reduced before 300 μm and consistently increased beyond 400 µm. In correspondence, its void volume is concentrated at a larger size in Figure 5b. This significant change on the void system can be only reasonably associated with the fact that the 850 μm sand is much larger than the air voids in the sample. Prior studies have reported that the aqueous foam system tends to be more influenced when the inclusion size becomes larger [22,32]. Thus, the void stability in Sample 0.5_850 µm is more diminished than those with smaller sand, leading to the most degenerated foam structure among all four samples. This explanation is also well supported by the experimental results of Sample 0.5_850 µm on elastic modulus as shown in Figure 1, and crushing strength as shown in Figure 3, as well as the other 850-μm sand samples. Therefore, during material design, special attention should be given to control the maximum particle size when any inclusion is used in foam concrete mixtures.
5. Conclusions
This study investigated the influence of sand size and sand content on the mechanical properties of a group of 0.55 g/cm3 foam concrete mixtures, for which higher sand ratio corresponds to less cement usage and lower density of the foamed paste. The test results of elastic modulus from the vibration frequency test and loading response from the penetration test suggest a strong influence from the material modulus to the crushing behavior of the foam-sand composite. At a small sand ratio of 0.15, the modulus and crushing strength between the controlled and composite samples are very close and even slightly higher when the 300- and 600-μm fine sand were used; the inclusion of the large 850-μm sand, however, caused significantly diminished results for both tests. Under higher sand ratios, the lower effective foamed paste density results in progressively inferior material performance, and the influence from the inclusion size becomes secondary.
In addition to the mechanical tests, the micro-CT scan indicates that the air voids in the composite mixtures are generally enlarged, which is mainly attributed to the reduced paste confinement. Furthermore, increasing the sand size diminishes the stability of small air voids and induces formation of larger voids. This size impact is most profound when the sand particles are larger than the voids.
As a general rule, it is recommended that low-density foam concrete should be designed with a relatively low volume of particles to avoid compromising mechanical performance. Preferably, fine-graded particles should be used to maintain a good foam stability. Due to this direct influence from the sand size to the foam stability, special attention should be paid to the particle dimension and void size of the foam during the mixture design when using particle inclusions in foam concrete.
Author Contributions
Conceptualization, Y.S. and D.L.; Methodology and Data Analysis, Y.S.; Supervision, Project Administration, and Funding Acquisition, D.L.
Funding
The authors would like to acknowledge funding from the University Transportation Center for Research on Concrete Applications for Sustainable Transportation (RE-CAST), O’Hare Modernization Program, and the Chicago Department of Aviation (CDA).
Acknowledgments
We also thank fellow student Jamie Clark for the CT image acquisition and Robbie Damiani for valuable discussion on the test results.
Conflicts of Interest
The authors declare no conflict of interest.
References
- Chen, C.; Habert, G.; Bouzidi, Y.; Jullien, A. Environmental impact of cement production: Detail of the different processes and cement plant variability evaluation. J. Clean. Prod. 2010, 18, 478–485. [Google Scholar] [CrossRef]
- Lim, S.K.; Tan, C.S.; Li, B.; Ling, T.C.; Hossain, M.U.; Poon, C.S. Utilizing high volumes quarry wastes in the production of lightweight foamed concrete. Constr. Build. Mater. 2017, 151, 441–448. [Google Scholar] [CrossRef]
- Manzi, S.; Mazzotti, C.; Bignozzi, M.C. Short and long-term behavior of structural concrete with recycled concrete aggregate. Cem. Concr. Compos. 2013, 37, 312–318. [Google Scholar] [CrossRef]
- Sagoe-Crentsil, K.K.; Brown, T.; Taylor, A.H. Performance of concrete made with commercially produced coarse recycled concrete aggregate. Cem. Concr. Res. 2001, 31, 707–712. [Google Scholar] [CrossRef]
- Malešev, M.; Radonjanin, V.; Marinković, S. Recycled concrete as aggregate for structural concrete production. Sustainability 2010, 2, 1204–1225. [Google Scholar] [CrossRef]
- Cabral, A.E.B.; Schalch, V.; Molin, D.C.C.D.; Ribeiro, J.L.D. Mechanical properties modeling of recycled aggregate concrete. Constr. Build. Mater. 2010, 24, 421–430. [Google Scholar] [CrossRef]
- Khatib, J.M. Properties of concrete incorporating fine recycled aggregate. Cem. Concr. Res. 2005, 35, 763–769. [Google Scholar] [CrossRef]
- Zega, C.J.; Di Maio, Á.A. Use of recycled fine aggregate in concretes with durable requirements. Waste Manag. 2011, 31, 2336–2340. [Google Scholar] [CrossRef] [PubMed] [Green Version]
- Evangelista, L.; de Brito, J. Durability performance of concrete made with fine recycled concrete aggregates. Cem. Concr. Compos. 2010, 32, 9–14. [Google Scholar] [CrossRef] [Green Version]
- ACI Committee. 229 Report on Controlled Low-Strength Materials; ACI Committee: Farmington Hills, MI, USA, 2013. [Google Scholar]
- ACI Committee. 523 Guide for Cellular Concretes above 50 lb/ft3 (800 kg/m3) (ACI 523.3R-93). In ACI Manual of Concrete Practice; ACI Committee: Farmington Hills, MI, USA, 2013; ISBN 9780870318856. [Google Scholar]
- Ramamurthy, K.; Kunhanandan Nambiar, E.K.; Indu Siva Ranjani, G. A classification of studies on properties of foam concrete. Cem. Concr. Compos. 2009, 31, 388–396. [Google Scholar] [CrossRef]
- Jones, M.R.; McCarthy, A. Behaviour and assessment of foamed concrete for construction applications. In Proceedings of the 2005 International Congress—Global Construction: Ultimate Concrete Opportunities, Dundee, UK, 5–7 July 2005. [Google Scholar]
- Wang, J.; Guo, W.; Zhao, R.; Shi, Y.; Zeng, L. Energy-absorbing properties and crushing flow stress equation of lightweight foamed concrete. J. Civ. Archit. Environ. Eng. 2013, 35, 96–102. [Google Scholar]
- Song, Y.; Lange, D. Crushing Behavior and Crushing Strengths of Low-Density Foam Concrete. Preprints 2019, 2019020208. [Google Scholar] [CrossRef]
- Wei, S.; Yunsheng, Z.; Jones, M.R. Using the ultrasonic wave transmission method to study the setting behavior of foamed concrete. Constr. Build. Mater. 2014, 51, 62–74. [Google Scholar] [CrossRef]
- Amran, Y.H.M.; Farzadnia, N.; Ali, A.A.A. Properties and applications of foamed concrete; A review. Constr. Build. Mater. 2015, 101, 990–1005. [Google Scholar] [CrossRef]
- Narayanan, N.; Ramamurthy, K. Structure and properties of aerated concrete: A review. Cem. Concr. Compos. 2000, 22, 321–329. [Google Scholar] [CrossRef]
- Jones, M.R.; McCarthy, A. Preliminary views on the potential of foamed concrete as a structural material. Mag. Concr. Res. 2005, 57, 21–31. [Google Scholar] [CrossRef]
- Nambiar, E.K.K.; Ramamurthy, K. Influence of filler type on the properties of foam concrete. Cem. Concr. Compos. 2006, 28, 475–480. [Google Scholar] [CrossRef]
- Nambiar, E.K.K.; Ramamurthy, K. Models relating mixture composition to the density and strength of foam concrete using response surface methodology. Cem. Concr. Compos. 2006, 28, 752–760. [Google Scholar] [CrossRef]
- Lim, S.K.; Tan, C.S.; Zhao, X.; Ling, T.C. Strength and toughness of lightweight foamed concrete with different sand grading. KSCE J. Civ. Eng. 2014, 19, 2191–2197. [Google Scholar] [CrossRef] [Green Version]
- Jones, M.R.; Ozlutas, K.; Zheng, L. Stability and instability of foamed concrete. Mag. Concr. Res. 2016, 68, 542–549. [Google Scholar] [CrossRef] [Green Version]
- Ghorbani, S.; Ghorbani, S.; Tao, Z.; Brito, J.; Tavakkolizadeh, M. Effect of magnetized water on foam stability and compressive strength of foam concrete. Constr. Build. Mater. 2019, 197, 280–290. [Google Scholar] [CrossRef]
- Onprom, P.; Chaimoon, K.; Cheerarot, R. Influence of Bottom Ash Replacements as Fine Aggregate on the Property of Cellular Concrete with Various Foam Contents. Adv. Mater. Sci. Eng. 2015, 2015, 381704. [Google Scholar] [CrossRef]
- Kearsley, E.P.; Wainwright, P.J. The effect of high fly ash content on the compressive strength of foamed concrete. Cem. Concr. Res. 2001, 31, 105–112. [Google Scholar] [CrossRef]
- Jones, M.R.; McCarthy, A. Utilising unprocessed low-lime coal fly ash in foamed concrete. Fuel 2005, 84, 1398–1409. [Google Scholar] [CrossRef]
- She, W.; Du, Y.; Zhao, G.; Feng, P.; Zhang, Y.; Cao, X. Influence of coarse fly ash on the performance of foam concrete and its application in high-speed railway roadbeds. Constr. Build. Mater. 2018, 170, 153–166. [Google Scholar] [CrossRef]
- Jones, R.; Zheng, L.; Yerramala, A.; Rao, K.S. Use of recycled and secondary aggregates in foamed concretes. Mag. Concr. Res. 2012, 64, 513–525. [Google Scholar] [CrossRef]
- Gibson, L.J.; Ashby, M.F. Cellular Solids; Cambridge University Press: Cambridge, UK, 1999; ISBN 9781139878326. [Google Scholar]
- Ashby, M.F.; Medalist, R.F.M. The mechanical properties of cellular solids. Metall. Trans. A 1983, 14, 1755–1769. [Google Scholar] [CrossRef]
- Nambiar, E.K.K.; Ramamurthy, K. Air-void characterisation of foam concrete. Cem. Concr. Res. 2007, 37, 221–230. [Google Scholar] [CrossRef]
- American Society for Testing and Materials. ASTM C796—Standard Test Method for Foaming Agents for Use in Producing Cellular Concrete Using Preformed Foam; ASTM International: West Conshohocken, PA, USA, 2012. [Google Scholar]
- ASTM. ASTM 305. Standard Practice for Mechanical Mixing of Hydraulic Cement Pastes and Mortars of Plastic Consistency; Annu. B. ASTM Stand Standard; ASTM International: West Conshohocken, PA, USA, 2011. [Google Scholar]
- Song, Y.; Lange, D.A. Measuring Young’s Modulus of Low-Density Foam Concrete Using Resonant Frequency. Preprints 2019, 2019020207. [Google Scholar] [CrossRef]
- Santagata, E.; Bassani, M.; Sacchi, E. Performance of new materials for aircraft arrestor beds. Transp. Res. Rec. 2010, 2177, 124–131. [Google Scholar] [CrossRef]
- Zhou, Q.; Mayer, R.R. Characterization of Aluminum Honeycomb Material Failure in Large Deformation Compression, Shear, and Tearing. J. Eng. Mater. Technol. 2002, 124, 412–420. [Google Scholar] [CrossRef]
- Ramamurty, U.; Kumaran, M.C. Mechanical property extraction through conical indentation of a closed-cell aluminum foam. Acta Mater. 2004, 52, 181–189. [Google Scholar] [CrossRef]
- Allen, A.J.; Thomas, J.J.; Jennings, H.M. Composition and density of nanoscale calcium-silicate-hydrate in cement. Nat. Mater. 2007, 6, 311. [Google Scholar] [CrossRef] [PubMed]
Figure 1.
Comparison of the elastic modulus results for all samples.

Figure 2.
General loading response from the penetration test at 7, 14, and 21 days for the control sample.
Figure 2.
General loading response from the penetration test at 7, 14, and 21 days for the control sample.

Figure 3.
Loading responses of all the samples at (a) 7, (b) 14, and (c) 21 days.


Figure 4.
A representative micro-CT scan, corresponding phase segmentation, and 3D reconstruction of samples (a) Control, (b) 0.5_300 μm, (c) 0.5_600 μm, and (d) 0.5_850 μm, where the micro-CT scan has a side length of 5000 μm and the 3D reconstruction has a side length of 2500 μm.
Figure 4.
A representative micro-CT scan, corresponding phase segmentation, and 3D reconstruction of samples (a) Control, (b) 0.5_300 μm, (c) 0.5_600 μm, and (d) 0.5_850 μm, where the micro-CT scan has a side length of 5000 μm and the 3D reconstruction has a side length of 2500 μm.

Figure 5.
Statistics of the void (a) population and (b) volume distribution of the micro-CT specimens. These results have been normalized by a unit volume of 2500 × 2500 × 2500 μm3.
Figure 5.
Statistics of the void (a) population and (b) volume distribution of the micro-CT specimens. These results have been normalized by a unit volume of 2500 × 2500 × 2500 μm3.


Table 1.
Mixture design and density of the samples.
| Mixture | Sand Ratio | Sand Size [µm] | ρtarget [g/cm3] | ρfoamed paste [g/cm3] | ρmeasured [g/cm3] |
|---|---|---|---|---|---|
| Control | 0 | NA | 0.55 | 0.550 | 0.552 |
| 0.15_300 μm | 0.15 | 300 | 0.55 | 0.509 | 0.575 |
| 0.15_600 μm | 0.15 | 600 | 0.55 | 0.509 | 0.573 |
| 0.15_850 μm | 0.15 | 850 | 0.55 | 0.509 | 0.547 |
| 0.3_300 μm | 0.3 | 300 | 0.55 | 0.474 | 0.583 |
| 0.3_600 μm | 0.3 | 600 | 0.55 | 0.474 | 0.58 |
| 0.3_850 μm | 0.3 | 850 | 0.55 | 0.474 | 0.562 |
| 0.5_300 μm | 0.5 | 300 | 0.55 | 0.433 | 0.549 |
| 0.5_600 μm | 0.5 | 600 | 0.55 | 0.433 | 0.562 |
| 0.5_850 μm | 0.5 | 850 | 0.55 | 0.433 | 0.538 |
Table 2.
Mean elastic modulus and standard deviation of the samples.
| Sample | Mean of Elastic Modulus (and Standard Deviation) [MPa] | |||||
|---|---|---|---|---|---|---|
| 7 Days | 14 Days | 21 Days | ||||
| Control | 1176 | (31.1) | 1335 | (5.5) | 1365 | (18.5) |
| 0.15_300 μm | 1223 | (1.8) | 1361 | (26.0) | 1363 | (17.3) |
| 0.15_600 μm | 1245 | (35.8) | 1299 | (14.7) | 1332 | (23.4) |
| 0.15_850 μm | 997 | (30.2) | 1071 | (4.4) | 1126 | (7.2) |
| 0.3_300 μm | 1081 | (24.8) | 1166 | (23.1) | 1201 | (23.5) |
| 0.3_600 μm | 1076 | (20.6) | 1161 | (25.8) | 1202 | (34.6) |
| 0.3_850 μm | 975 | (29.4) | 1045 | (27.1) | 1072 | (28.8) |
| 0.5_300 μm | 888 | (20.1) | 922 | (24.3) | 931 | (15.8) |
| 0.5_600 μm | 762 | (42.9) | 821 | (43.4) | 855 | (33.8) |
| 0.5_850 μm | 662 | (49.1) | 709 | (8.9) | 719 | (16.1) |
Table 3.
Theoretical volume fractions and measurements from the 3D reconstructions.
| Void Content [%] | Paste Content [%] | Sand Content [%] | ||||
|---|---|---|---|---|---|---|
| Sample | Calculated | Measured | Calculated | Measured | Calculated | Measured |
| Control | 71.1 | 70.9 | 28.9 | - | 0.0 | - |
| 0.5_300 μm | 76.8 | 75.6 | 18.0 | 18.9 | 5.2 | 5.5 |
| 0.5_600 μm | 76.8 | 77.4 | 18.0 | 16.8 | 5.2 | 5.8 |
| 0.5_850 μm | 76.8 | 75.8 | 18.0 | 19.3 | 5.2 | 4.9 |
© 2019 by the authors. Licensee MDPI, Basel, Switzerland. This article is an open access article distributed under the terms and conditions of the Creative Commons Attribution (CC BY) license (http://creativecommons.org/licenses/by/4.0/).
Share and Cite
MDPI and ACS Style
Song, Y.; Lange, D. Crushing Performance of Ultra-Lightweight Foam Concrete with Fine Particle Inclusions. Appl. Sci. 2019, 9, 876. https://0-doi-org.brum.beds.ac.uk/10.3390/app9050876
AMA Style
Song Y, Lange D. Crushing Performance of Ultra-Lightweight Foam Concrete with Fine Particle Inclusions. Applied Sciences. 2019; 9(5):876. https://0-doi-org.brum.beds.ac.uk/10.3390/app9050876
Chicago/Turabian StyleSong, Yu, and David Lange. 2019. "Crushing Performance of Ultra-Lightweight Foam Concrete with Fine Particle Inclusions" Applied Sciences 9, no. 5: 876. https://0-doi-org.brum.beds.ac.uk/10.3390/app9050876
Note that from the first issue of 2016, this journal uses article numbers instead of page numbers. See further details here.