1. Introduction
Titanium alloys have been widely used in aerospace, energy and military fields due to their excellent specific strength, specific stiffness, heat resistance, corrosion resistance, etc. In order to meet the advanced requirements for processing efficiency and workpiece surface quality in the aforementioned fields, it is particularly important to adopt high-speed precision milling. However, severe tool wear may occur in high-speed milling, which reduces the processing efficiency and affects machining surface integrity [
1]. During milling, the temperature of the milling cutter [
2,
3], lubrication mode [
4,
5,
6] and the anti-friction performance of the tool [
7] are the important factors that affect tool wear. In order to meet the specific requirements of green cutting, increasing research attentions have been directed toward the peripheral milling of titanium alloy workpiece with integral carbide end mills, especially on tool temperatures. The main influential factors of temperature field distribution in the cutting process are heat source intensity, geometric characteristics of heat source, processing parameters, constitutive model of workpiece material, tool holder, undeformed chip thickness, the number of cutting edges involved in the cutting process, etc.
Many studies have focused on the aforementioned factors. The time-varying load between tool and chip may directly affect the heat intensity in the RCZ. Hence, Islam et al. [
8] used a finite difference method with implicit time discretization to solve the partial differential equations for the heat-mass transfer models of tool, and then established a temperature field of milling that has time-varying chip loads. The complex geometric characteristics and asymmetric heat source may directly influence the distribution of cutting temperature field. For this reason, Klocke et al. [
9] investigated the effect of cutting-edge geometries and cutting-edge radius on cutting heat source and constructed an analytical model of cutting temperature based on the panel method in the field of fluid mechanics. In order to carry out a more specific research on milling temperature, Wu et al. [
10] divided the temperature change period of end mills into temperature increase and decrease phases. Considering the real friction state between chip and tool in the temperature increase phase, the heat flux and tool-chip contact length are obtained via finite element simulation, whereas for the temperature decrease phase, a one-dimensional disc heat convection model is applied. Processing parameters are one of the most important factors that affect cutting temperature. Therefore, Sivasakthivel et al. [
11] developed an end-milling temperature rise model based on the response surface method and assessed the influence of milling parameters on this model. They used a genetic algorithm to optimize the processing parameters to obtain a low temperature rise and found that helix angle is the most crucial milling parameter affecting the peak temperature rise. The constitutive model of workpiece material may affect the flow deformation in the first deformation zone. For this reason, Yang et al. [
12] established a new constitutive model of workpiece material under the milling conditions of large strain, high strain rate and high temperature, which can improve the accuracy of cutting temperature resulted by finite element simulation when using the double-helix edge end mills to process Ti6Al4V. The heat conduction during cutting process may be affected by the tool holder, thus Carvalho et al. [
13] calculated the tool–chip interface temperature using an inverse heat conduction method based on tool and tool holder factors. At the end milling process, the time variations of tool chip contact length may directly affect the undeformed chip thickness and tool temperature distribution. To overcome these challenges, Sato et al. [
14] considered the time-varying of tool chip contact length in the end milling process and constructed a temperature distribution model of the rake face of indexable milling cutter through Green's function. When an integral carbide end mill is milling a plane, both its circumferential edge and bottom edge may be involved in the process of milling, thus generating milling heat. Consequently, Lazoglu et al. [
15] established a new end milling heat model using a semi-analytical method, by considering the effects of the circumferential edge and bottom edge on cutting temperature.
Heat intensity and heat distribution ratio are the two important physical parameters for establishing a cutting temperature field model. Therefore, heat intensity in the machining process may directly affect the amount of heat generated from cutting and affect the process precision owing to the thermo-elastic deformations. Processing technology, heat transfer mode and processing conditions are the main factors that affect heat intensity. Many studies have been carried out concerning these factors. First, through orthogonal continuous cutting, Yvonnet et al. [
16] derived the heat intensity of the rake face based on numerical simulation and an inverse method algorithm. Furthermore, in the interrupted cutting of indexable milling cutters, Jiang et al. [
17] calculated the heat intensity with time-varying characteristics by using an inverse heat conduction method. Similarly, based on the reverse heat conduction method, Han et al. [
18] obtained heat intensity by thermocouple method embedded. Because of the unsteady milling process, Putz et al. [
19] calculated the unsteady heat intensity of indexable milling insert through the finite element simulation of the interrupted chip formation process. Considering the influence of processing conditions on heat intensity, Pabst et al. [
20] established mathematical expressions on the heat intensity of end milling based on a polynomial method for feed per tooth, cutting speed, axial cutting depth, cutting width, edge radius, and rake angle. Taken together, during the process of studying the milling temperature of an integral flat end milling cutter, there is a lack of prior research on the time-varying and non-uniform characteristics of heat intensity in the RCZ as well as the non-uniform characteristics of heat intensity in the FWZ.
Heat distribution ratio in the process of machining may directly affect tool temperature distribution. The main influential factors of the heat distribution ratio are processing technology; thermal number, which is a parameter defining how much accumulated heat in the primary shear zone is distributed by heat convection in comparison with thermal conduction; tool coating; and workpiece material. Numerous studies have been carried out on these factors. The thermal number of workpiece materials determines the amount of heat accumulated through heat convection in the shear zone. Therefore, some studies have investigated the relationship between thermal number and heat distribution ratio. Heat value parameters were applied to establish a calculation method for heat distribution ratio under continuous cutting conditions by Putz et al. [
21]. Moreover, Putz et al. [
22] extended the same parameters to the calculation of the heat distribution ratio in an interrupted cutting process. Tool coatings of different materials can have a significant impact on the generation and distribution of cutting heat within coated tools. Therefore, by using the characteristics and tool chip contact as well as the types of workpiece materials and tool matrix/coating materials, the heat distribution ratio of multi-coated tools can be accurately predicted, see Grzesik et al. [
23]. Zhang et al. [
24] examined the heat distribution ratio of coated cutting tools based on the convective heat transfer principle. Akbar et al. [
25] developed a two-dimensional finite element model under thermo-mechanical coupling to estimate the heat distribution ratio of tool chip. This model was modified based on deformed chip thickness and cutting force, and its sensitivity on measuring heat distribution ratio was evaluated. Considering the lubrication condition, Rech et al. [
26] established a fast heat distribution ratio model based on a special tribometer. In the field of processing carbon fiber composites, by considering the direction of fibers and predicting the heat distribution ratio based on classical Hertzian contact theory, Wang et al. [
27] found that the direction of fibers exhibited a greater impact on the heat distribution ratio instead of cutting parameters. Overall, the time-varying characteristics of the heat distribution ratio from the RCZ to the rake face and from the FWZ to the wear land on the flank of end mills have yet to be comprehensively investigated, especially the milling temperature of end mill.
As aforementioned, there is a lack of research focused on the temperature modeling of wear land on the flank of an integral end milling cutter. Especially according to the process of temperature rise and temperature drop during milling. With regards to the time-varying characteristics of heat intensity and heat distribution ratio in the RCZ, FWZ as well as the rake angle factors. Considering the roles of time-varying heat intensity, time-varying heat distribution ratio and rake angle factors in the RCZ and FWZ, as well as the impacts of heat sources in the PSZ, RCZ, FWZ and dissipating heat source, we aimed to establish a transient temperature field model of wear land on the flank of end mill based on “moving heat source method”.
2. Transient Temperature Field Model of Wear Band on the Flank of End Mills
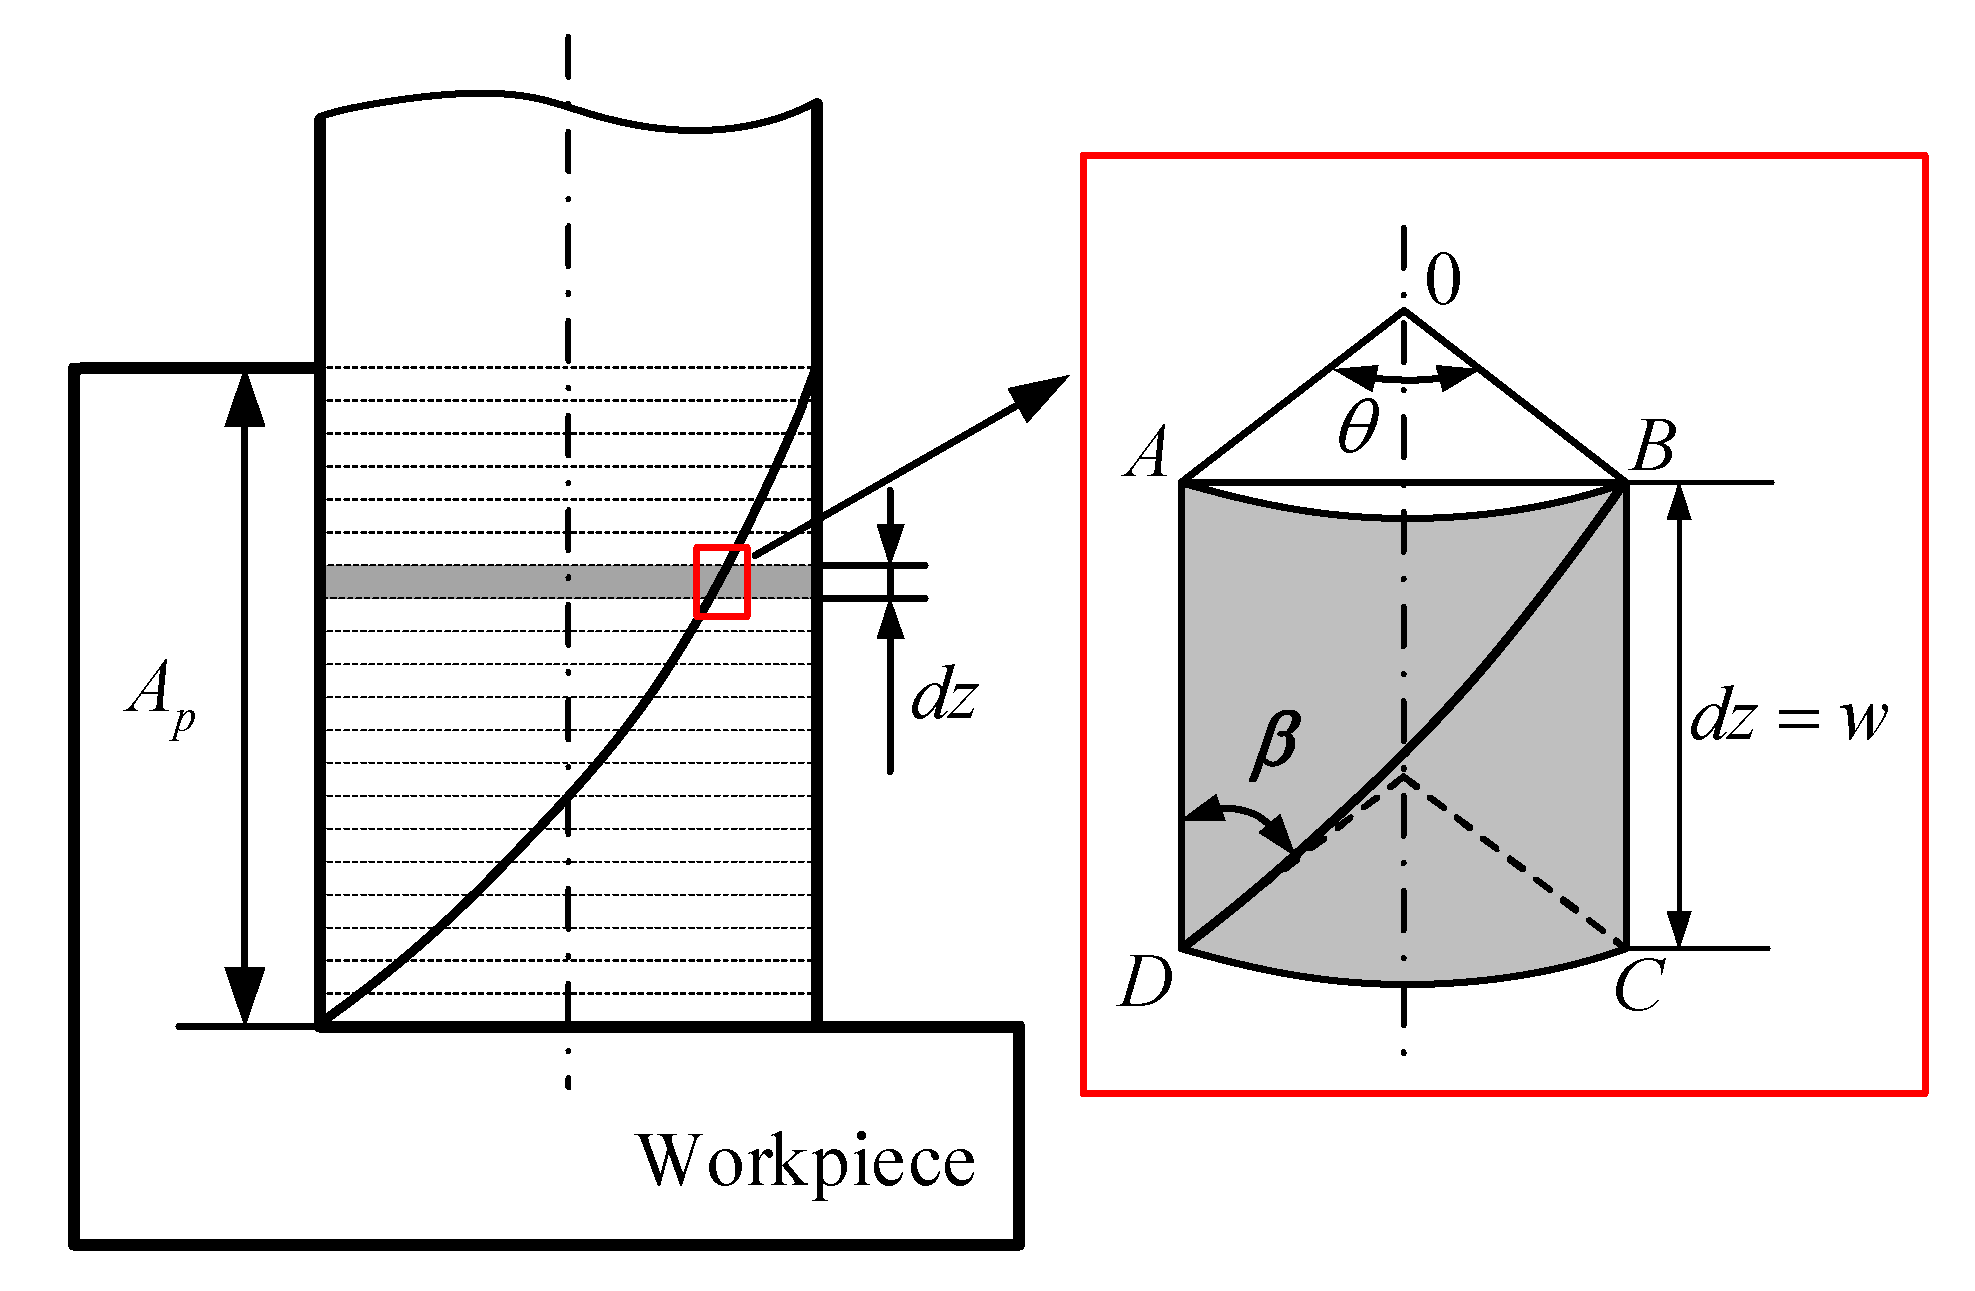
During the peripheral milling process, each tooth of the helical end mills is discretized into many slices along the axis (
Z direction). Helical angle changes the end mill into an independent oblique cutting edge, and thus the peripheral milling process is transformed into an oblique cutting process (
Figure 1).
Because milling involves intermittent tool-workpiece contact, when the edge is in contact with the workpiece, heat source that results in temperature rise is primarily generated in three different deformation zones at the time of metal cutting. The PSZ generates a high temperature due to its plastic deformation on the shear surface, thus softening the workpiece material and leading to greater workpiece deformation. This is a process of mutual coupling between heat and deformation. The heat generated in the RCZ is attributed to chip deformation, bonding and sliding friction between the tool and chip. The third deformation zone contains the heat generated by sliding friction and extrusion between the machined workpiece surface and wear band on the flank face. When the edge is out of contact with the workpiece, a dissipating heat source that results in temperature drop primarily is generated in wear land on the flank of end mills. Among these three zones, the PSZ and RCZ are mainly affected by cutting conditions, whereas the FWZ is largely affected by the wear of the flank face, dissipating heat source mainly affected by the cooling medium wear land on the flank of end mills. In this study, the flank of end mills was worn out, and thus the influences of the PSZ, RCZ, FWZ, and dissipating heat source on the transient temperature field of flank wear band on the end mills were comprehensively considered.
The following five assumptions were made for the transient temperature field model of the wear band on the flank of end mills.
The heat flow generation and temperature distribution are stable.
Deformation energy refers to the deformation energy within the shear zone, deformation energy at the rake–chip interface due to friction and extrusion, and deformation energy at the flank–workpiece interface due to friction and extrusion. All deformation energy is involved in mechanical processes and is converted into cutting heat. This negligible part is stored in the deformed metal in the form of potential. The heat loss along the contact surface as well as the tool, chip and workpiece surface are neglected.
The heat sources in the RCZ are not affected by crater wear on the rake face.
The cutting-edge radius is zero.
The temperature of end mills is not related to the milling depth.
The yield strength of Ti6Al4V is affected by its temperature, strain rate and stress state. In order to simplify the calculation, only the effect of temperature on the yield strength of Ti6Al4V is considered.
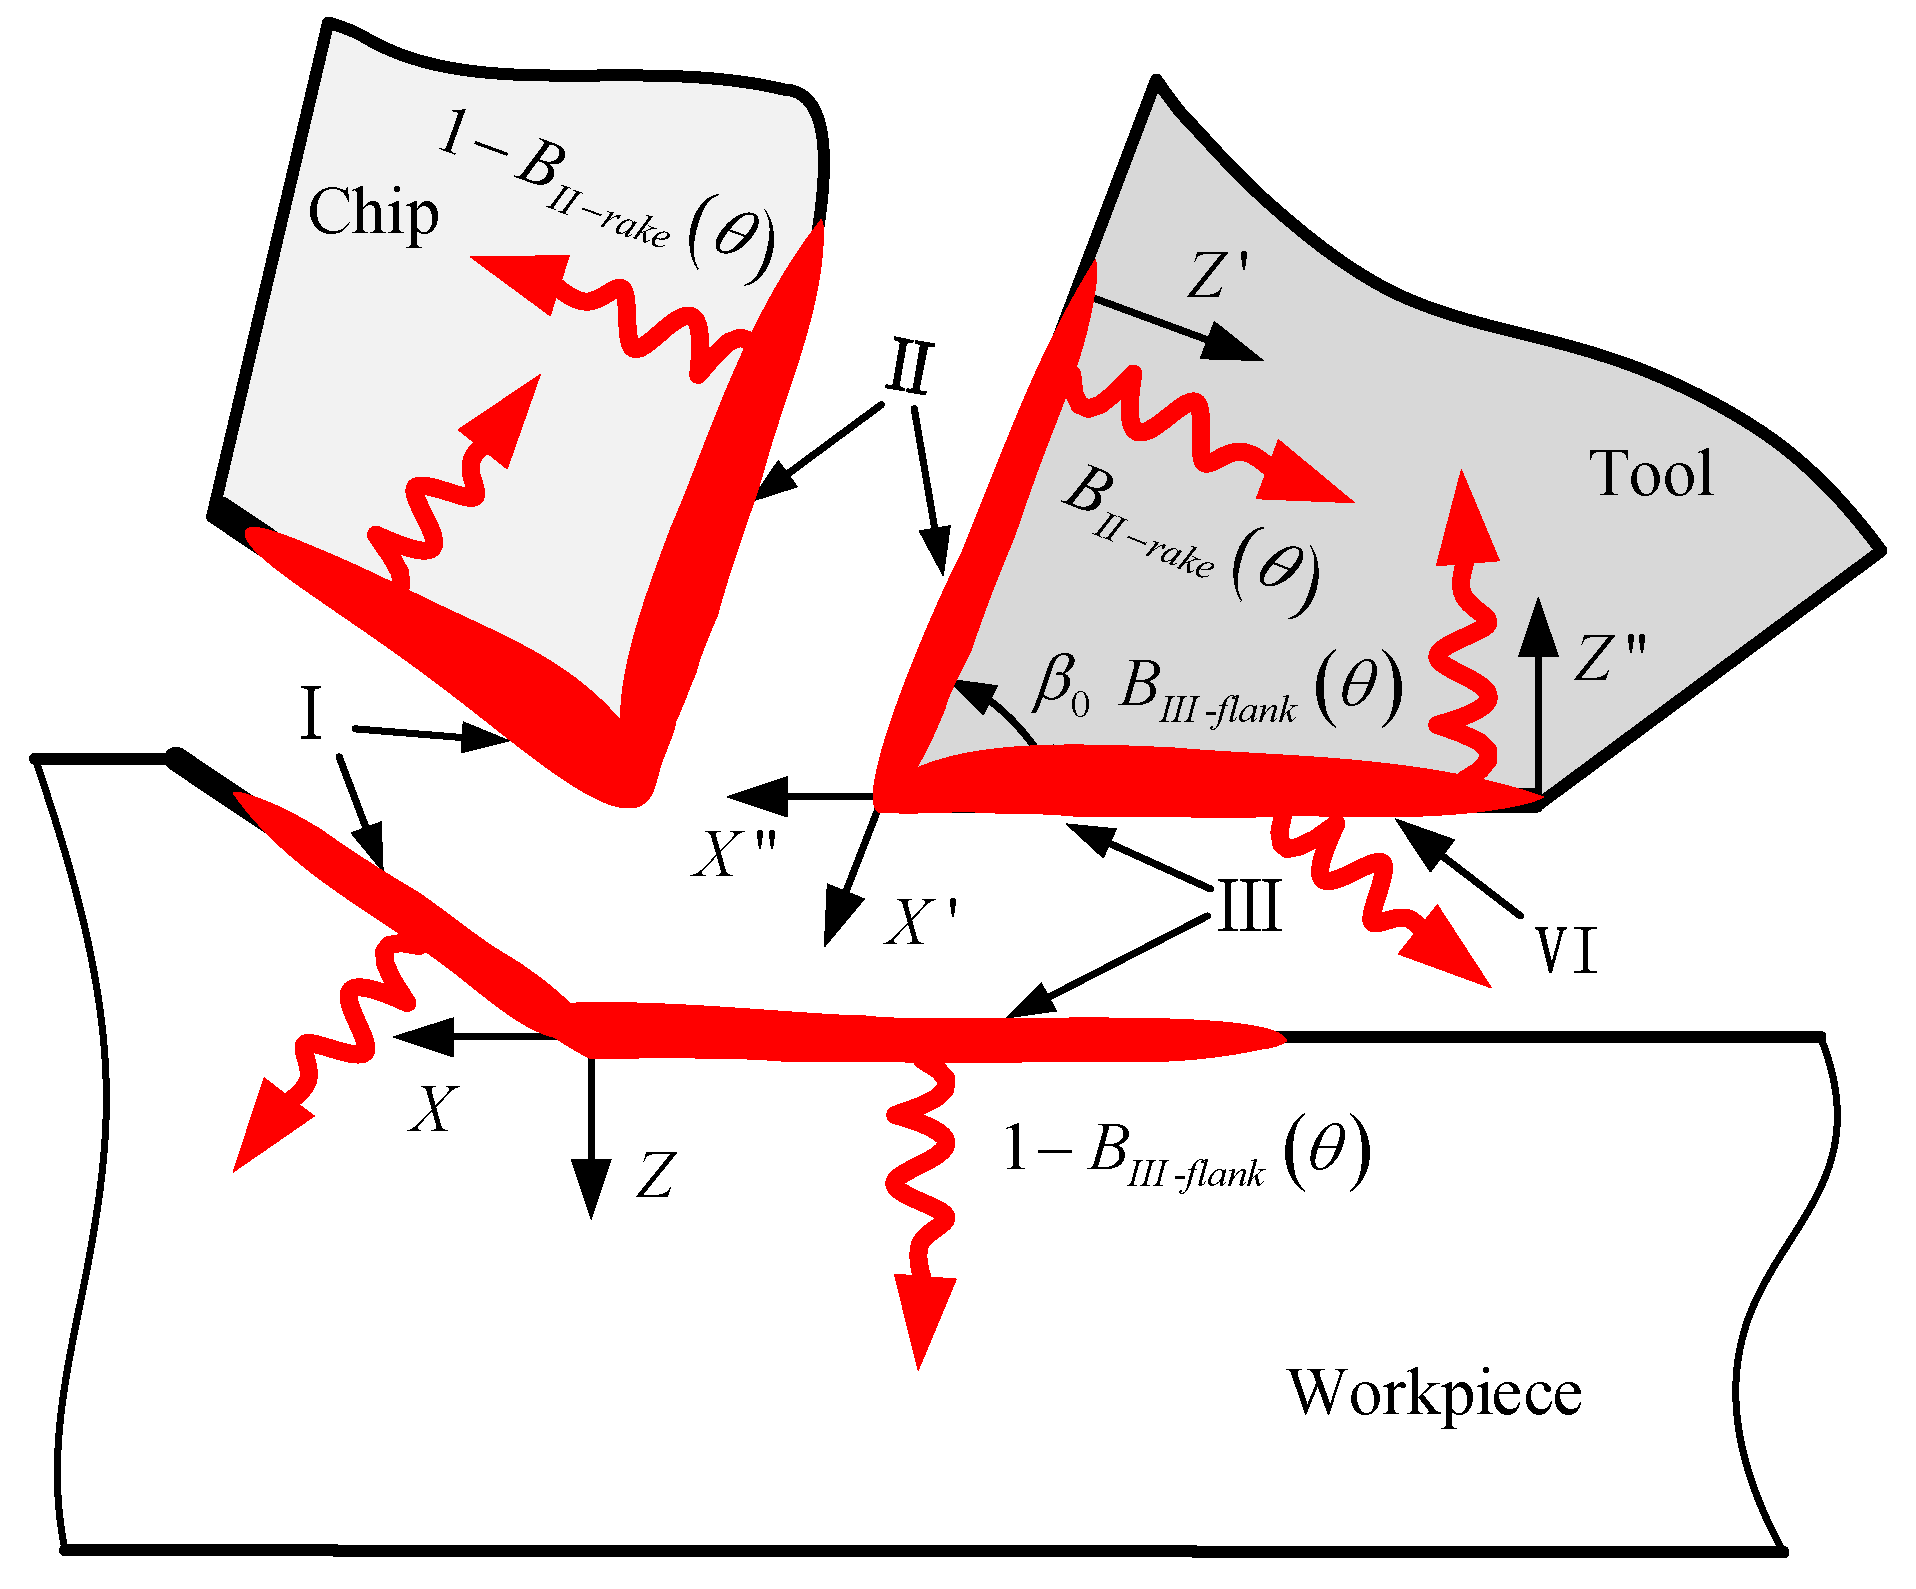
As shown in
Figure 2, three different coordinate systems were established, by considering the influence of four heat sources on the temperature field of the wear band on the flank of end mills.
To calculate the increased temperatures caused by heat sources in the PSZ, RCZ, FWZ and dissipating heat source, the coordinate systems of heat sources in the PSZ and RCZ were converted into the coordinate system of heat source in the FWZ (or dissipating heat source), , as shown in Equation (1).
2.1. Temperature Rise Model of the Wear Band Affected by Heat Source in the PSZ
During the peripheral milling process, the heat source in the PSZ contacts with the tool indirectly through the workpiece, so the transient temperature field of the wear land on the flank of end mills will inevitably be affected by the heat source in the PSZ. According to Komanduri et al. [
28], it is considered that the temperature rise at an arbitrary point on the workpiece can be calculated by the heat source model in the PSZ. This paper applies the heat source model in the PSZ to evaluate the temperature rise at any point on wear land on the flank of end mills, this model is based on the native heat source in the PSZ and its mirror heat source, and both of them exhibit the same heat source intensity (
Figure 3).
According to a previous study [
29], it has been suggested that the temperature rise
ΔTP of any point
P in space is caused by a heat source point
dl on an obliquely moving banded heat source, as demonstrated in Equation (2).
In Equation (2), RV is the length of the projection from heat source to an arbitrary point towards the motion of the banded heat source; and Vh is the velocity of the belt heat source.
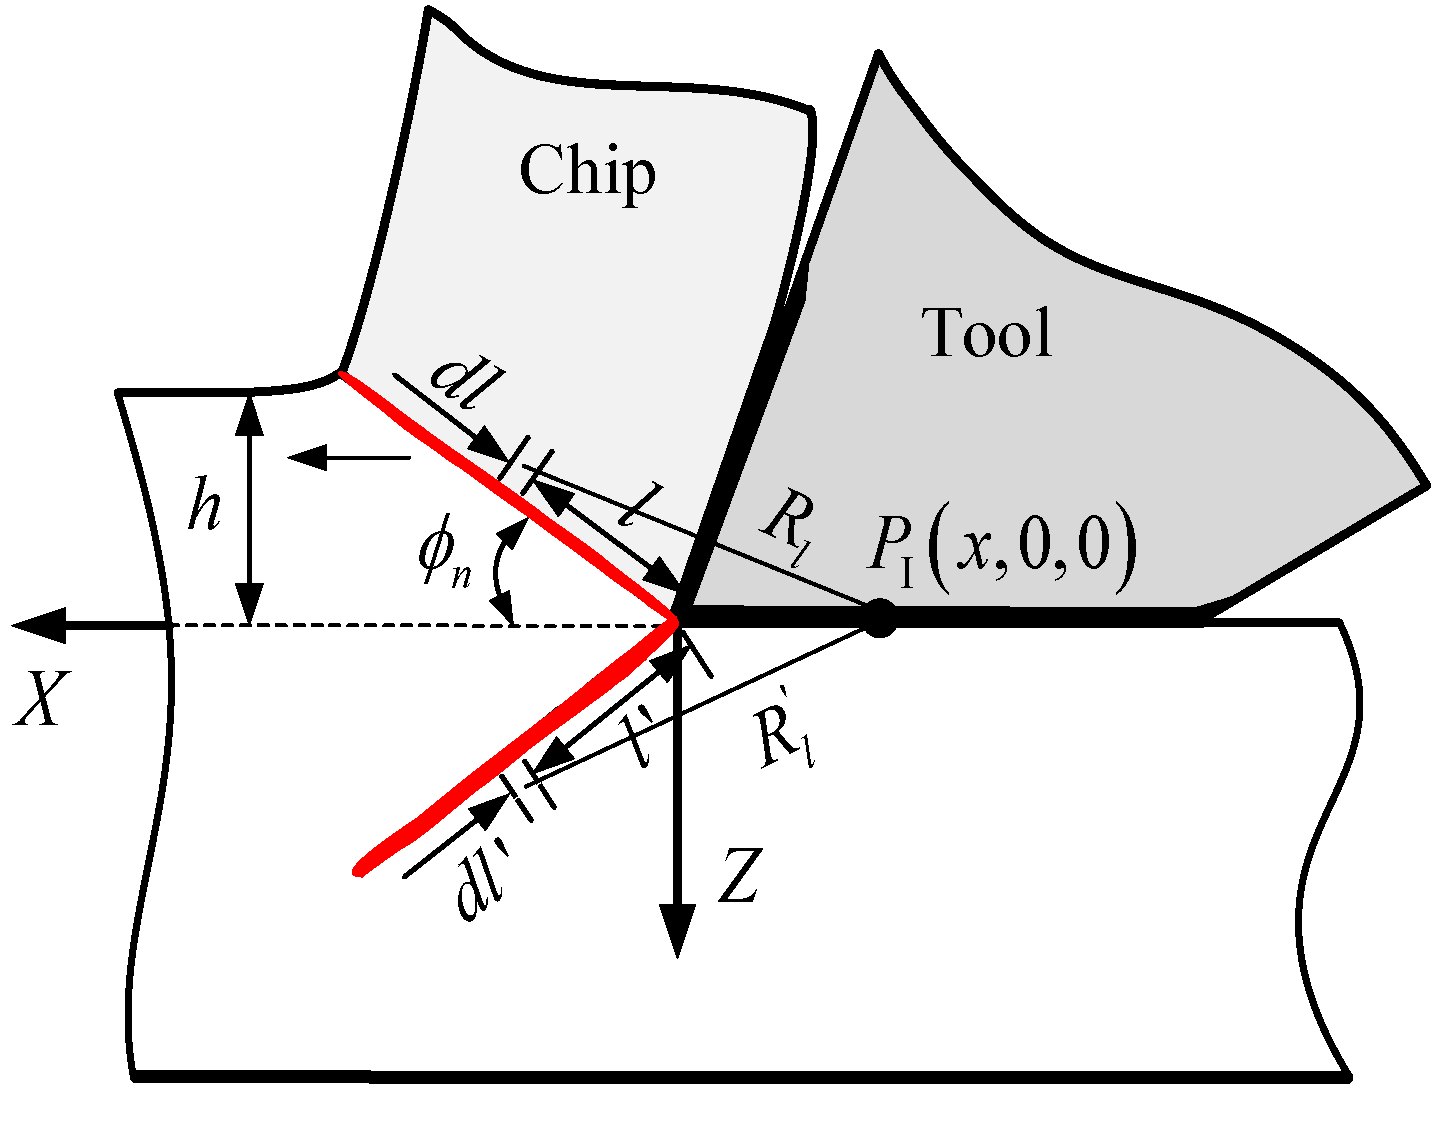
Figure 3 shows the relationship between the maximum length of the banded heat source in the first deformation zone and the undeformed chip thickness, as shown in Equation (3).
Further, the length of the projection from heat source to any point towards the motion of the banded heat source is calculated by Equation (4).
According to Equations (3) and (4), the maximum length of the banded heat source in the PSZ and the projection length of the distance from the heat source point to any point in the direction of the movement of the banded heat source are time-varying because of the time-varying characteristics of the undeformed chip thickness, which ultimately leads to the time-varying characteristics of the temperature rise of the transient temperature field in the flank wear zone on end mills affected by the heat source in the PSZ.
Because the heat source in the PSZ is a banded heat source, the temperature rise of the transient temperature field in wear land on the flank of end mills affected by the heat source in the PSZ is regarded as the effect of the integral superposition of a finite number of heat source points. Further, according to the coordinate system established in
Figure 3, the temperature rise at any point along the
X direction can be calculated by Equations (5)–(7).
From Equation (5) to (7),
ΔTI (
x, 0, z) and
ΔTI' (
x, 0, z) are the temperature rises caused by native heat source and mirror heat source in the PSZ, respectively. The distance from any point
PI (
x, 0, z) along the
X direction to the points of the native heat source
dl and mirror heat source
dl′ in the PSZ can be measured by Equation (8).
From Equation (5) to (7), λt is the thermal conductivity of the tool (cemented carbide material); h(θ) is the thickness of the undeformed chips; φn is the normal shear angle; ηc is the chip outflow angle; αw is the thermal diffusivity of the Ti6Al4V material; and K0 is the zero order of the second modified Bessel function.
The calculation of heat source intensity in the PSZ is presented in Equation (9).
The milling process is accompanied by a large plastic deformation at high temperatures, pressures and strain rates. In the present study, a flow stress model (
Johnson-Cook) was used to characterize the yield stress (σ
ABCD) on the shear surface (
ABCD) of workpiece during milling. The shear slip phenomenon of the shear surface requires the ultimate shear stress (
τABCD-max). The relationship between them is revealed by Equation (10).
The calculation for the ultimate shear stress of the shear plane (
ABCD) is shown in Equation (11).
Johnson-Cook constitutive model has been reported on Ti6Al4V material by Wu et al. [
30]. In Equation (11),
A is the initial yield stress at the reference strain rate and temperature,
B is the strain hardening modulus of Ti6Al4V,
is the effective plastic strain at the shear plane,
n is the strain-hardening exponent of Ti6Al4V,
C is the strain rate-hardening parameter of Ti6Al4V,
is the effective plastic strain rate at the shear plane,
is the reference strain rate;
T is the current temperature;
Tr is the reference temperature;
Tm is the melting temperature of Ti6Al4V; and
m is the thermal softening index of Ti6Al4V.
2.2. Temperature Rise Model of the Wear Band Affected by Heat Source in the RCZ
During the peripheral milling process, the heat source in the RCZ contacts with the rake face of end mills, then the heat generated by the heat source in the RCZ is transmitted to wear land on the flank of end mills through the inside of the end mills, so the transient temperature field of wear land on the flank of end mills will inevitably be affected by the heat source in the RCZ. According to Jaeger's dynamic heat source theory [
31], the temperature field model of the heat source in the RCZ is established. The contact surface between the chip and the rake face formed by the peripheral milling process is a parallelogram; a rectangular heat source in the RCZ is considered to simplify the problem. Huang et al. [
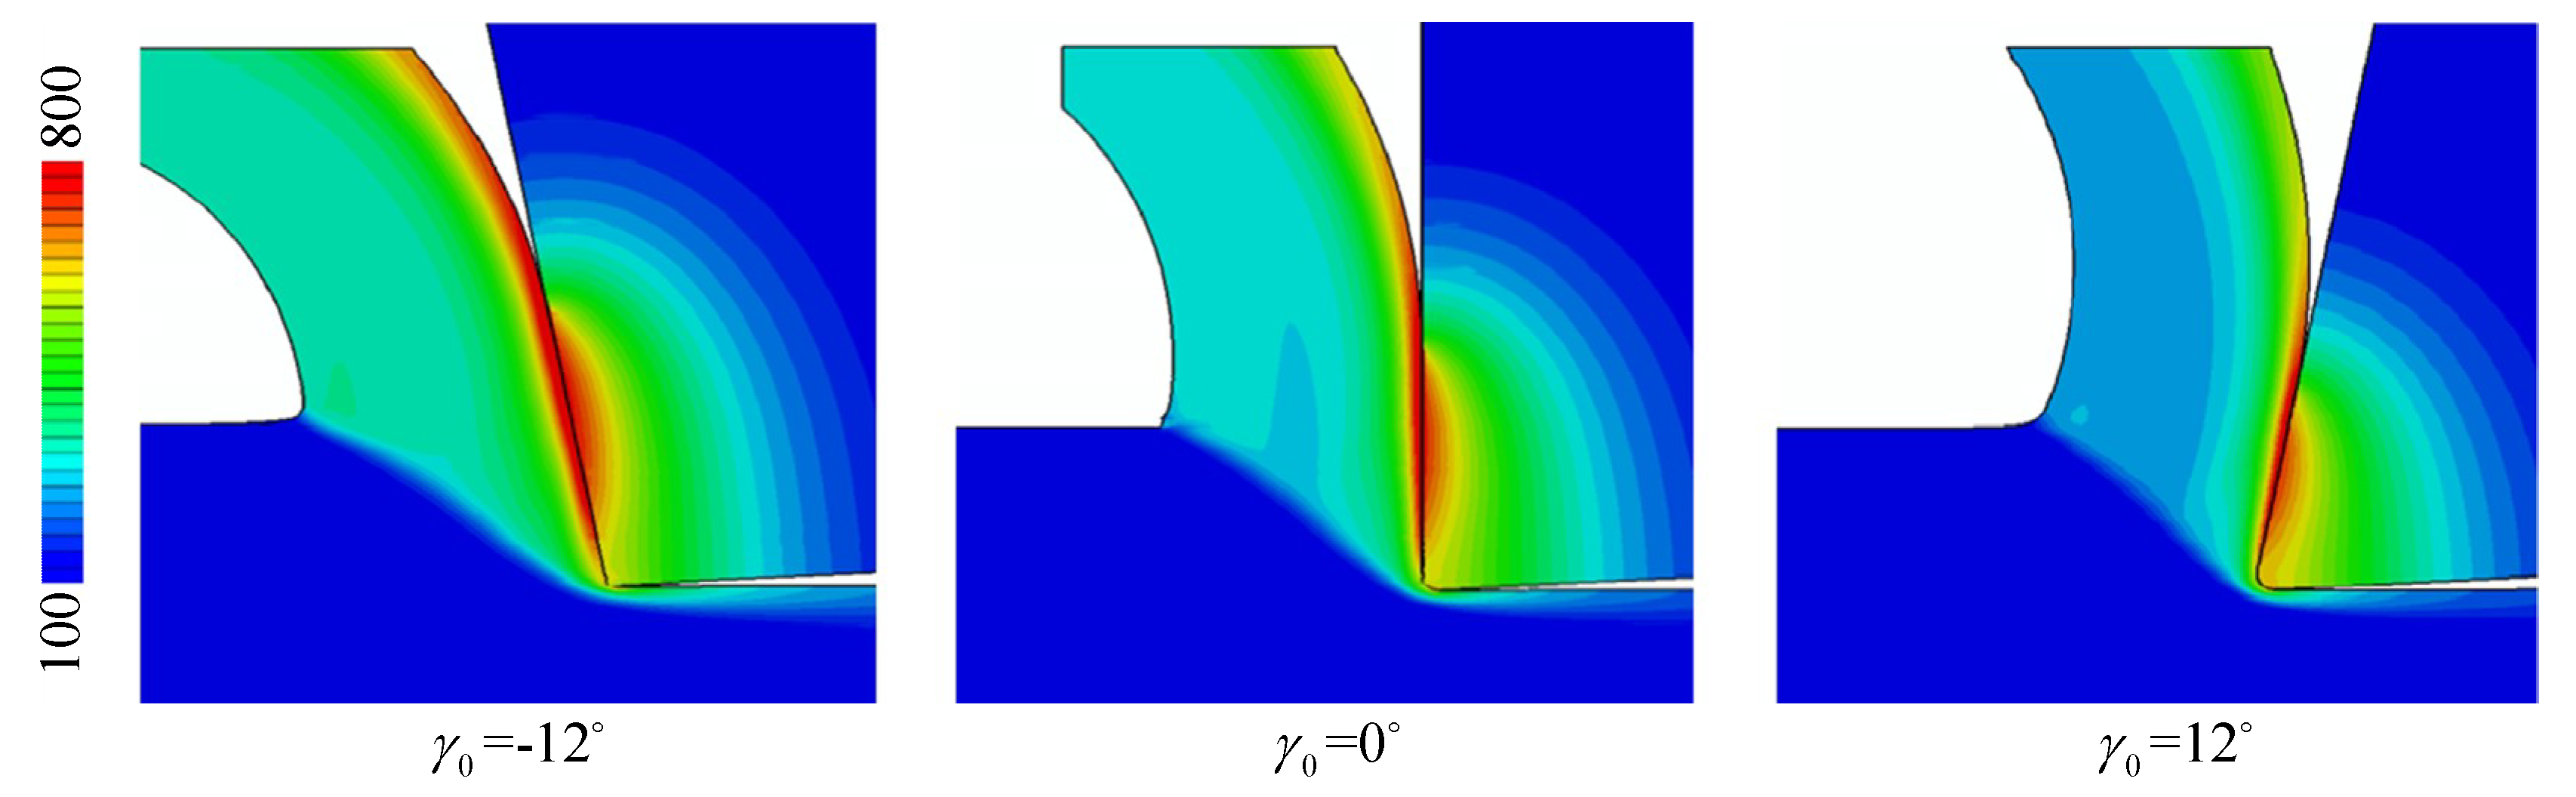
32] considered that the rake angle effect on rake face temperature could be ignored. However, Puls et al. [
33] found out by finite element simulation that the chip plastic deformation decreased with the increase of rake angle, which ultimately reduced the temperature rise of rake face (
Figure 4).
Therefore, the rake angle should be considered for establishing the heat source model in the RCZ. The heat source in the RCZ is composed of both native and mirror heat sources, and the heat intensity of the two heat sources are relatively similar (
Figure 5).
The temperature rise
ΔT flank-II (
x′, 0,
z′) at any point
PII (
x′, 0,
z′) in the plane
X′, 0,
Z′ can be calculated by Equations (12), (13) and (14).
From Equation (12) to (14),
ΔTII (
x′, 0,
z′) and
ΔTII' (
x′, 0,
z′) are the temperature rise caused by native heat source and mirror heat source in the RCZ, respectively. The distance from any point
PII (
x′, 0,
z′) along
X′ direction to the points of both native and mirror heat sources in the RCZ can be measured by Equation (15).
Under dry cutting conditions and with a new tool for machining, the flank is generally considered as adiabatic. Therefore, nr = 1, when wear land on the flank of end mills contacts with the machined surface, it is calculated as 0 <nr < 1. The value obtained in this study was 0.5, for which the simulation result of the transient temperature field model of wear land on the flank of end mills is closest to the experimental results.
In the process of peripheral milling, the tool chip contact area of cuttings may exhibit time-varying characteristics, leading to the time-varying characteristics of heat source strength in the second deformation zone. In addition, the non-uniform friction distribution between tool and chip may contribute to the non-uniformity of heat intensity in the RCZ. Based on the above assumptions, the heat intensity of the RCZ
qII' (
θ,
x') is calculated using Equation (16).
Huang et al. [
32] believes that shear stress results in heat source intensity. However, in the actual high-speed milling process, the heat production of the tool chip is largely dependent on contact friction. Therefore, due to the non-uniform friction distribution between the chip and rake face, it is presumed that the lengths of bonding zone and slip zone accounted for half of the tool chip contact length. The friction force in the bonding zone represents the ultimate shear stress of workpiece material, and the ultimate shear stress
,
σs-w is derived from the yield stress of Ti6Al4V.
The yield strength of Ti6Al4V is affected by its temperature, strain rate and stress state. In order to simplify the calculation, only the effect of temperature on the yield strength of Ti6Al4V is considered. According to Sun et al. [
34], it is known that the relationship between workpiece temperature and milling parameters is shown in Equation (17), when the peripheral milling of cemented carbide is used to process Ti6Al4V.
In this paper,
V = 80 m/min;
fz = 0.1 mm/z;
Ae = 0.7 mm; and
Ap = 16 mm is milling parameters, so
Tworkpiece = 318.73°C according to Boyer et al. [
35], the relationship between yield strength and temperature of Ti6Al4V can be obtained, and the yield strength of Ti6Al4V is 600 MPa.
The slip friction zone obeys Coulomb friction law. Hence, the frictional force interface between tool and chip is shown in Equation (18).
According to previous studies [
36,
37,
38,
39], the normal stress distribution on the rake face of end mills is measured based on the time-varying characteristics of tool chip contact length, as described in Equation (19).
The calculation of the normal stress near the tip of the rake face is referred to in Moufki et al. [
39], as shown in Equation (20).
According to Moufki et al. [
39], the relationship between unknown chip speed and given cutting speed can be calculated using Equation (21).
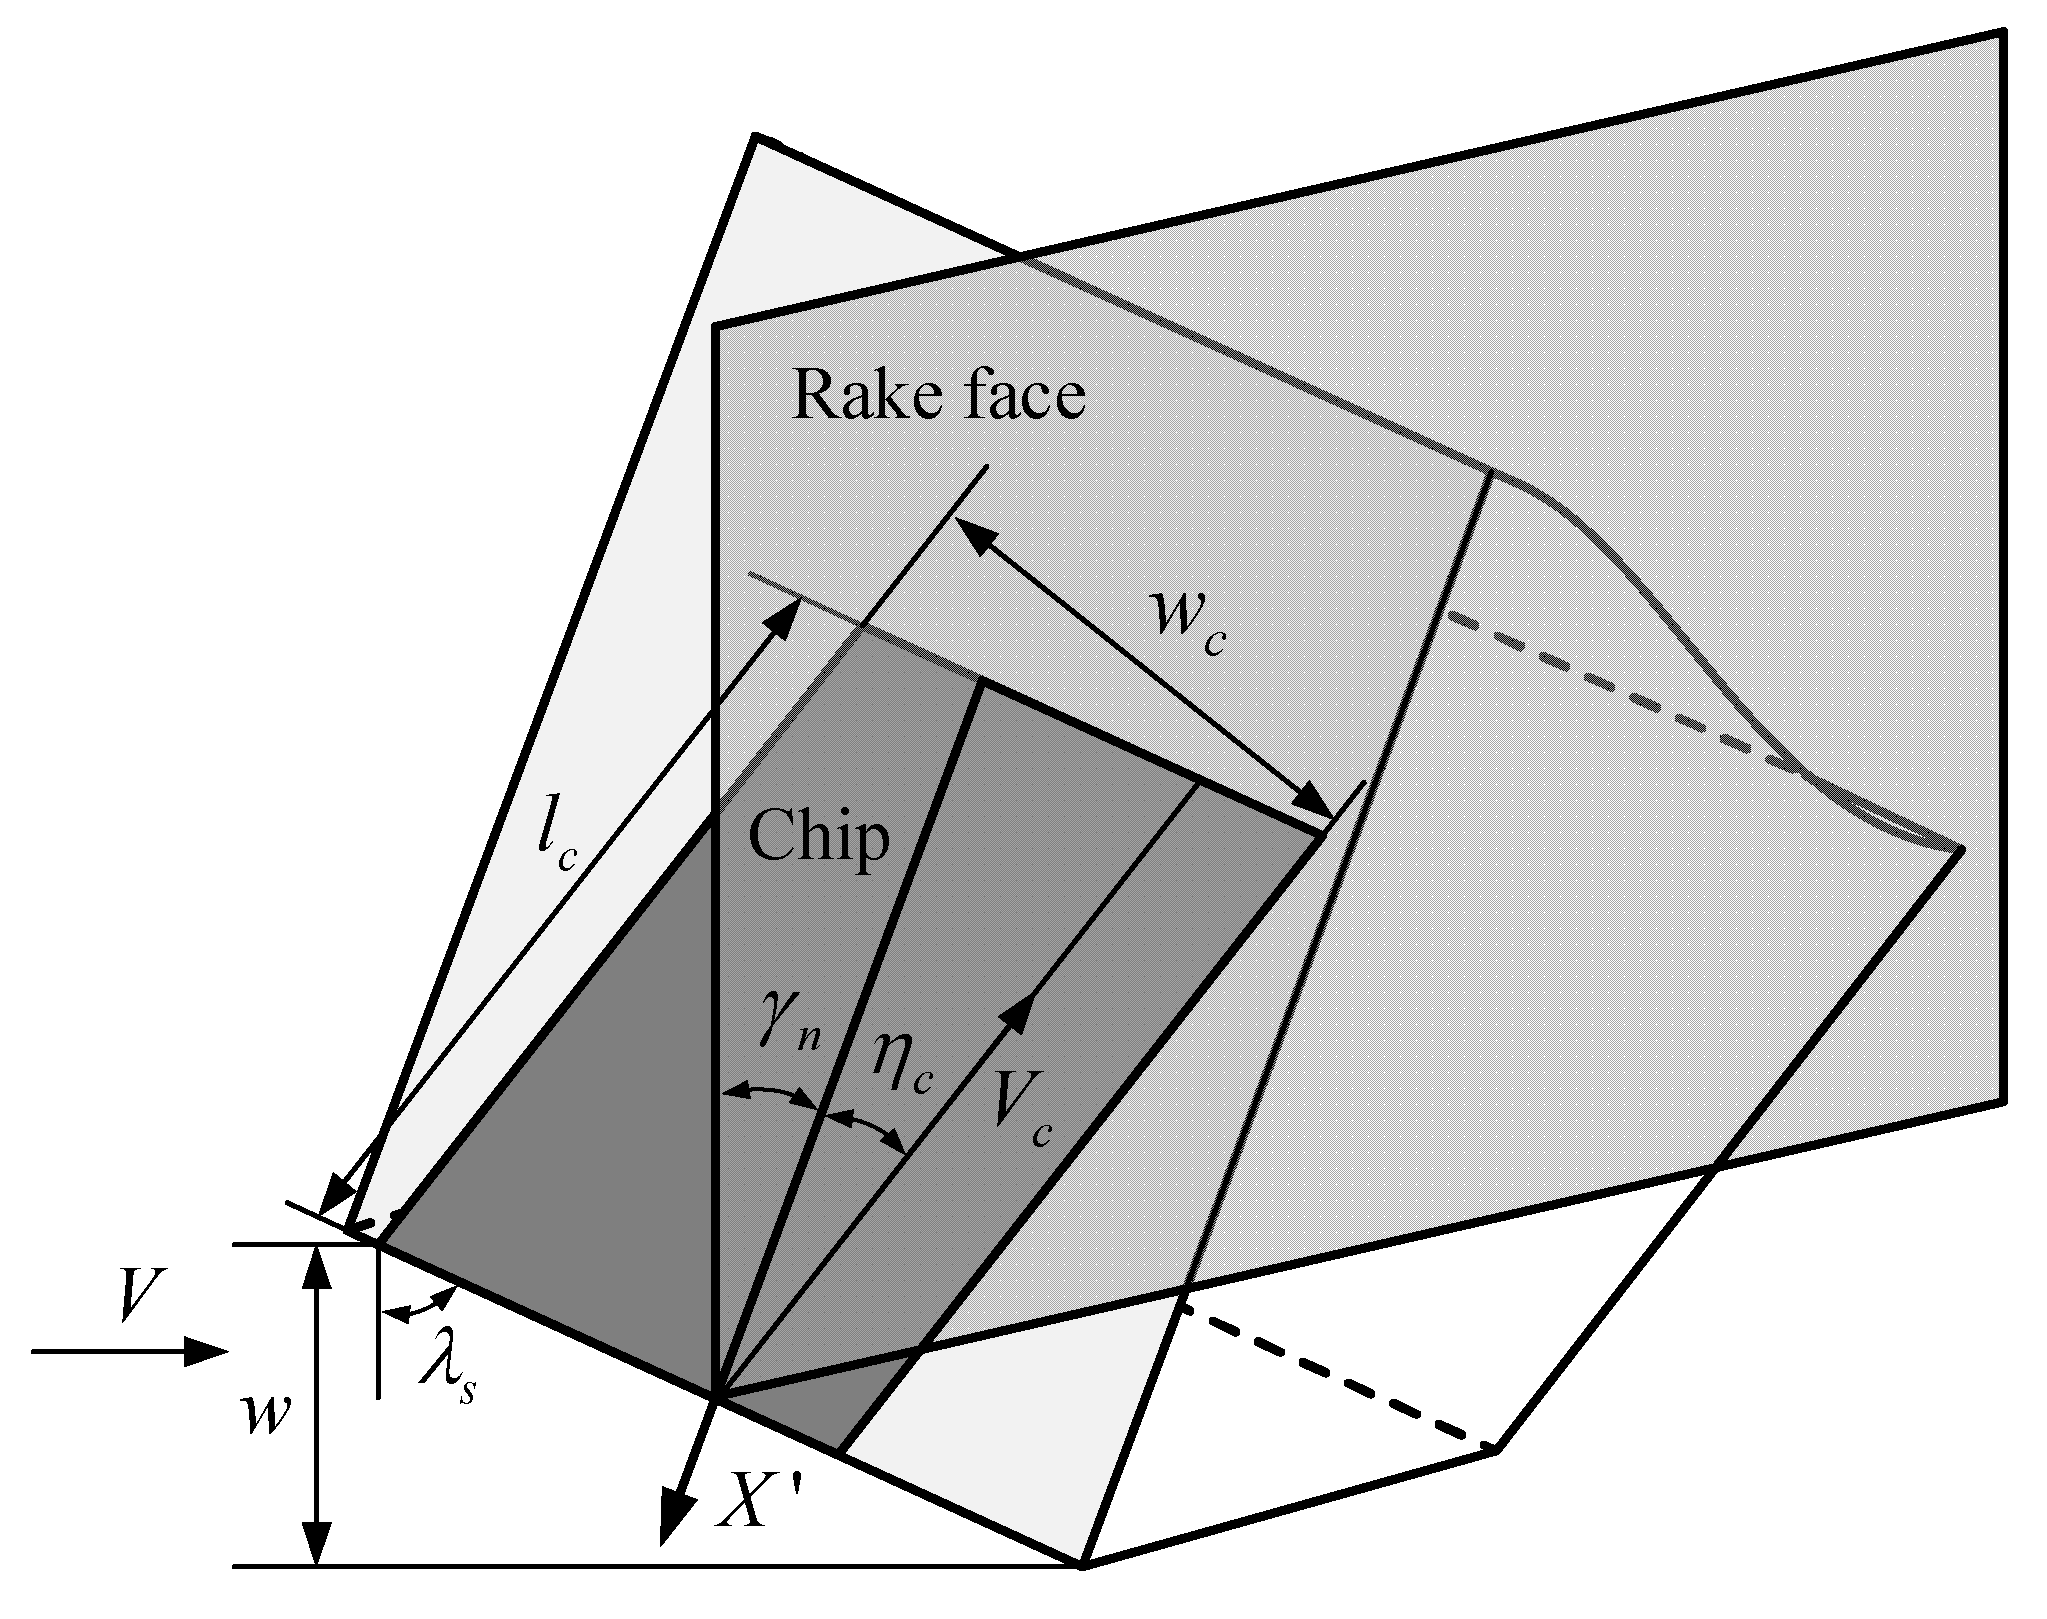
As illustrated in
Figure 6, it can be observed that the contact area between tool and chip is time-varying, which is caused by the time-varying contact length between the tool and chip derived from Equation (22).
In Equation (22), the calculation of the rake-chip contact length is a critical value for the prediction of temperature and stress distribution on the rake face. The Equation (23) in Moufki et al. [
39] is used here, but for the derivation of the undeformed chip thickness involved in Equation (23), see
Section 2.6.1 for details.
According to Shaw et al. [
40], the heat distribution ratio in the cutting process can be calculated by Equation (24).
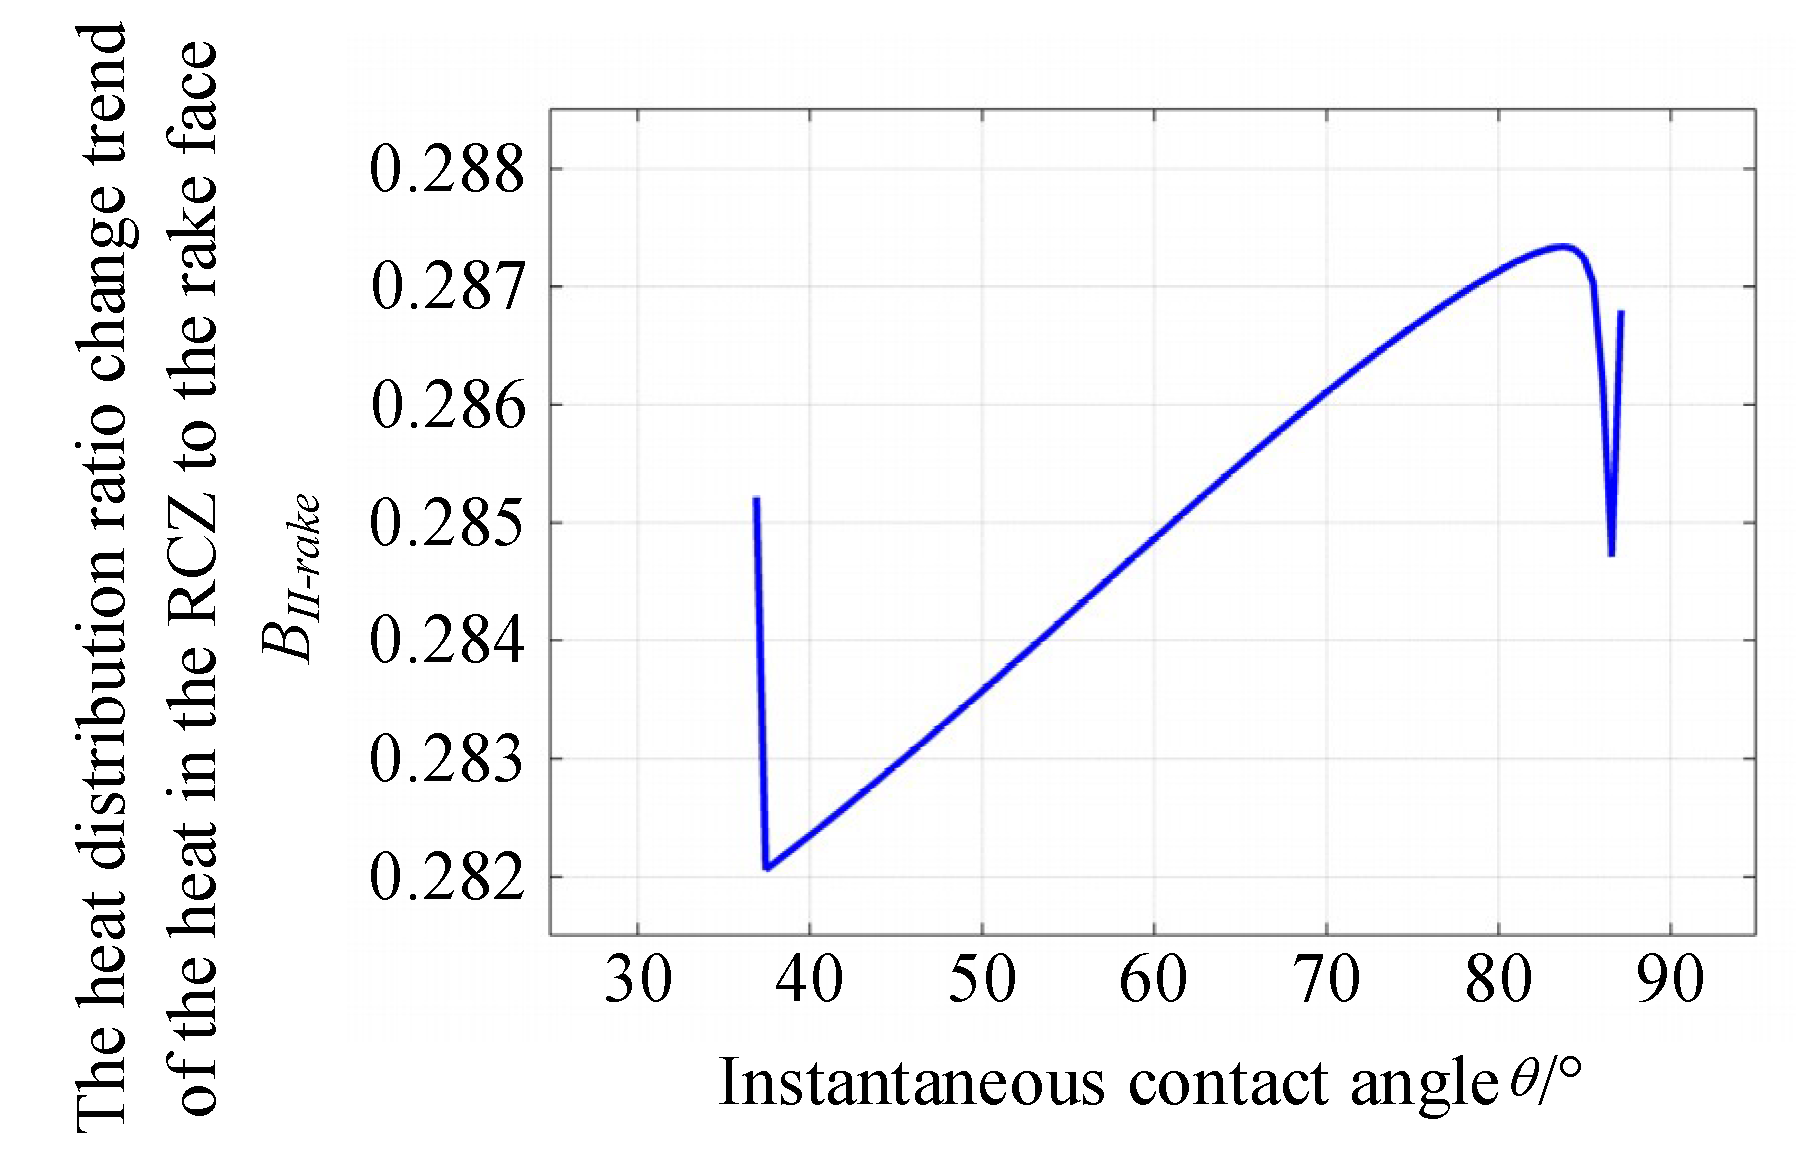
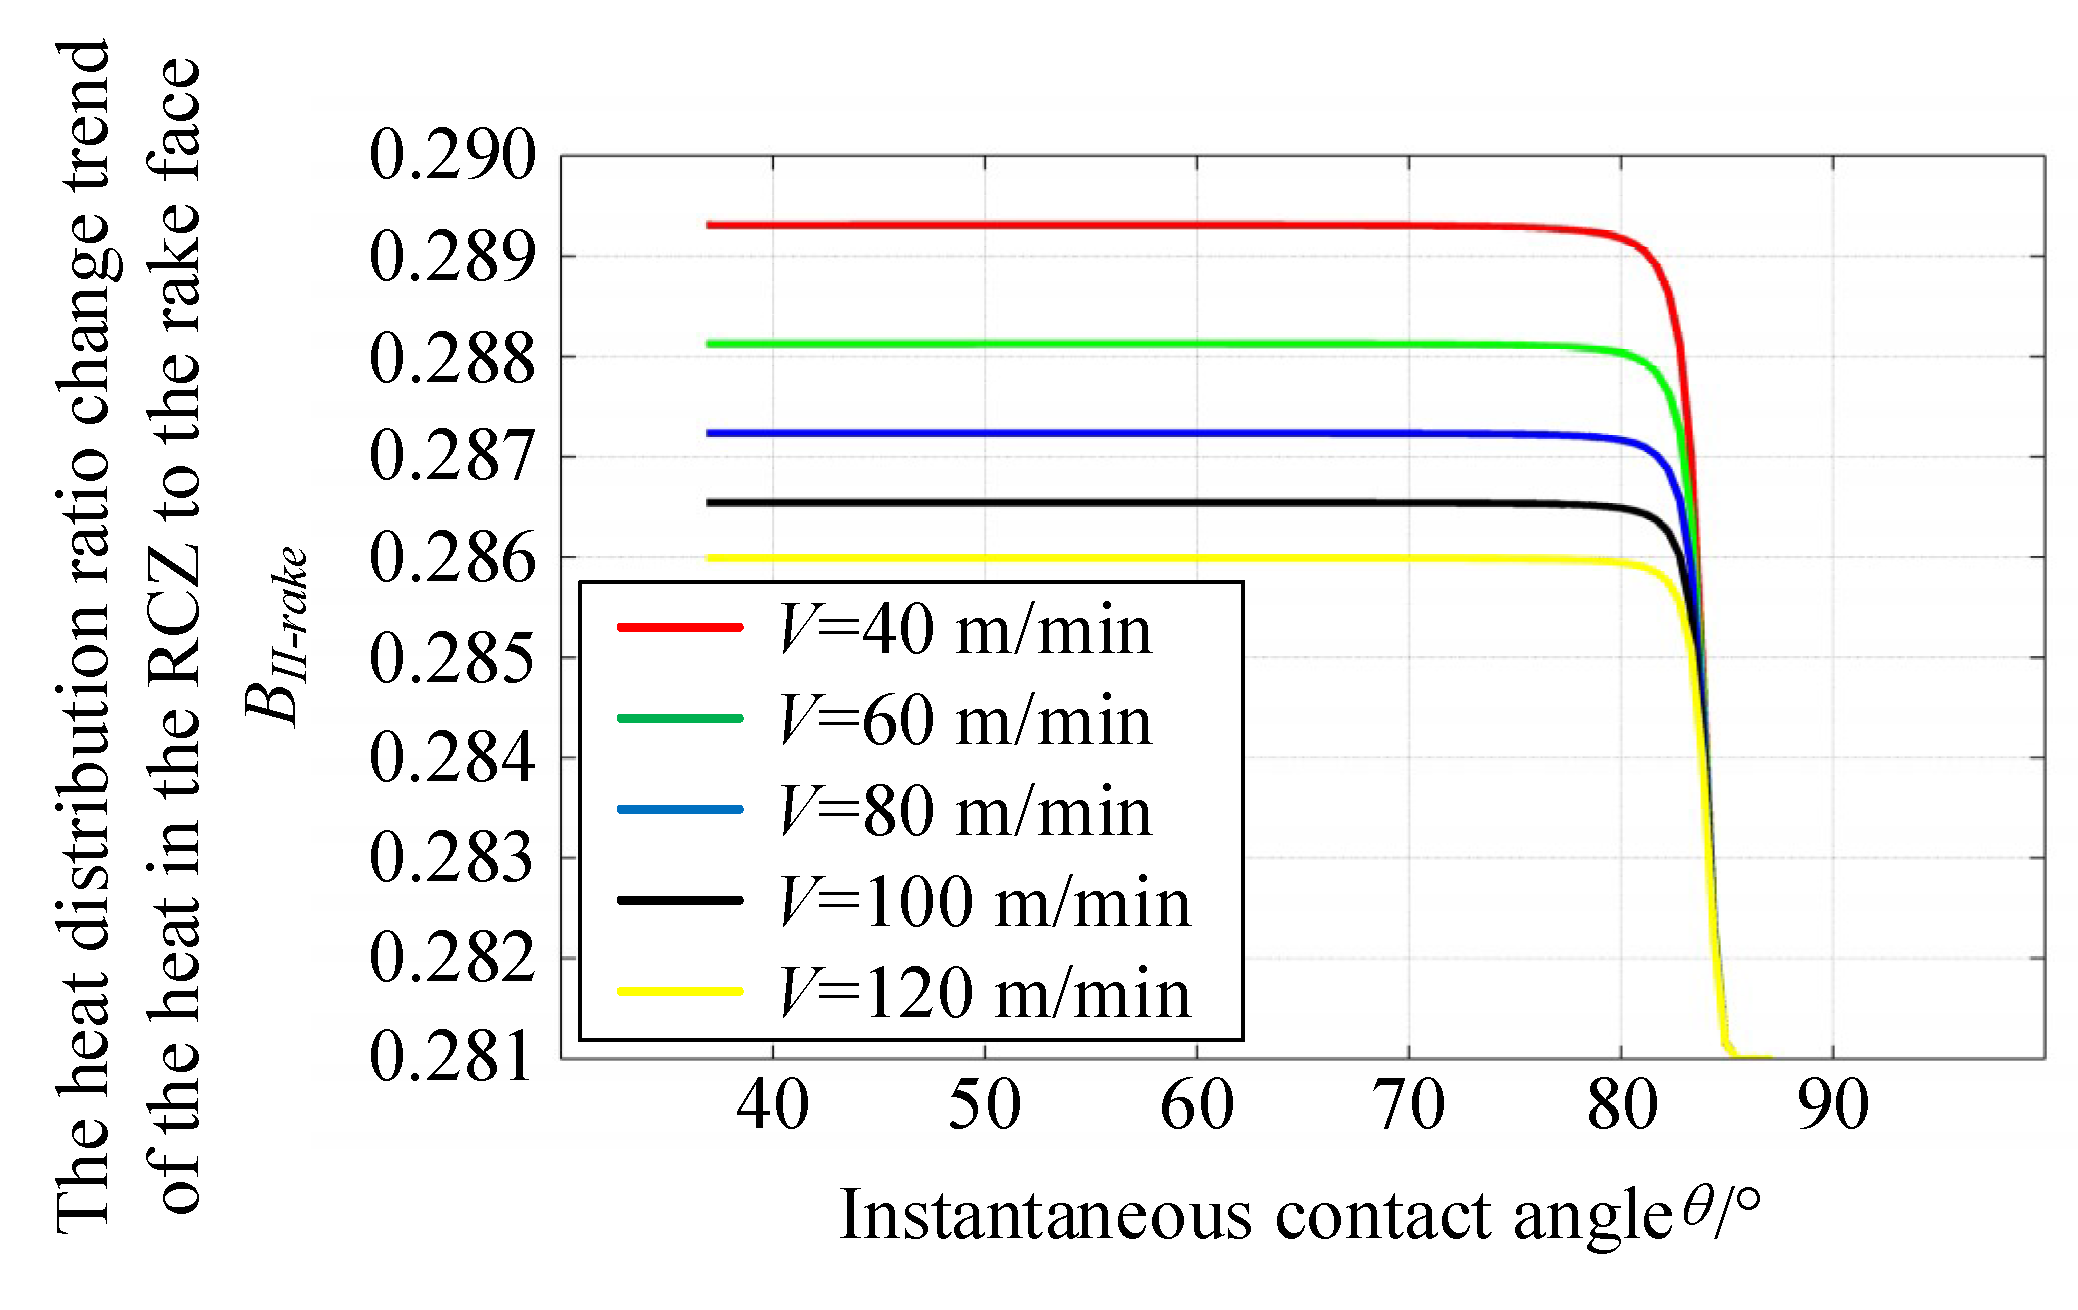
Because the rake-chip contact length during the peripheral milling process is time-varying, the heat distribution ratio of the heat source in the RCZ (BII-rake (θ)) is time-varying. Equation (23) is substituted into Equation (24) to calculate the heat distribution ratio (BII-rake (θ)).
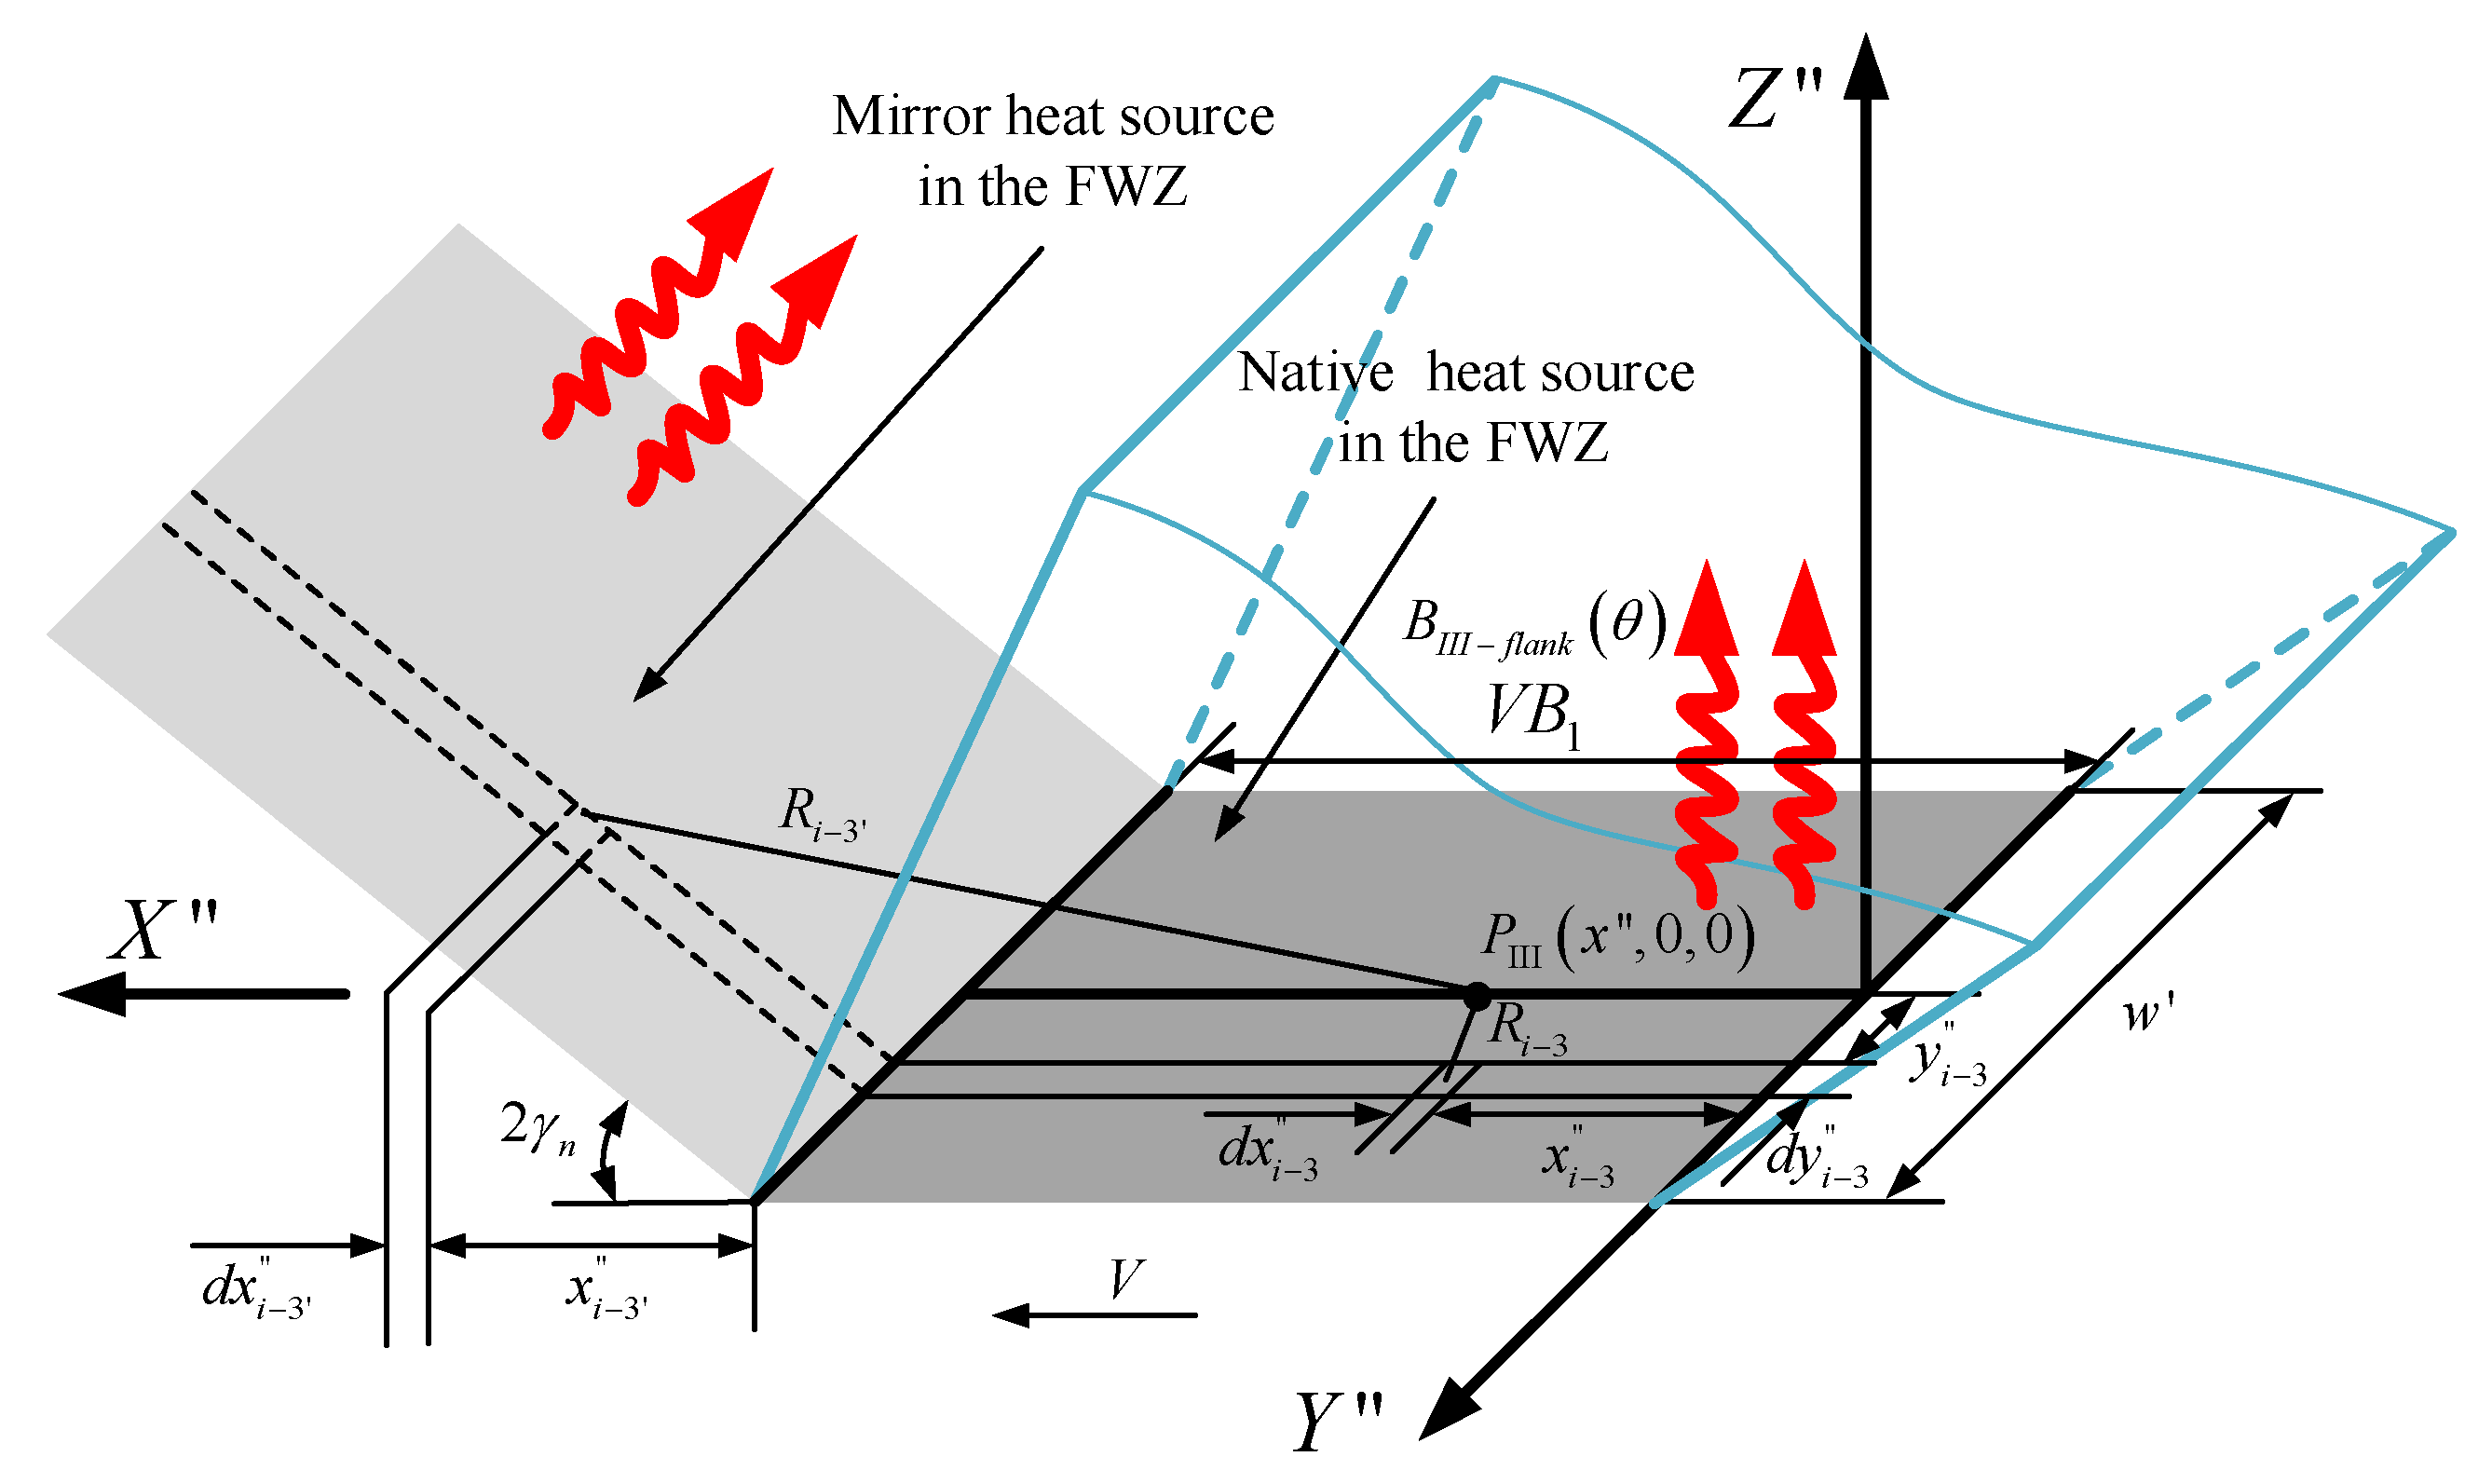
2.3. Temperature Rise Model of the Wear Band Affected by Heat Source in the FWZ
During the peripheral milling process, the heat source in the FWZ contacts with the tool, so the transient temperature field of wear land on the flank of end mills will inevitably be affected by the heat source in the FWZ. According to Huang et al. [
32], the temperature rise at any point of the tool flank rake is calculated by the heat source model in the FWZ, but the tool rake angle effect on the temperature rise is not considered. As mentioned in
Section 2.2, this paper considers the influence of rake angle on cutting temperature; the heat source in the FWZ is composed of both native and mirror heat sources, and their heat intensity are relatively similar (
Figure 7).
The temperature rises ΔT
flank-III (
x″, 0, 0) at any point
PIII (
x″, 0, 0) along
X″ direction can be calculated by Equations (25)–(27).
From Equation (25) to (27),
ΔTIII (
x″
, 0
, 0) and
ΔT III' (
x″
, 0
, 0) are the temperature rise caused by native heat source and mirror heat source in the FWZ, respectively. The distance from any point
PIII (
x″, 0, 0) along
X″ direction to the points of native and mirror heat sources in the FWZ can be measured by Equation (28).
Due to the non-uniformity of normal stress distribution in the wear band during the peripheral milling process, a non-uniform heat intensity is found in the FWZ. Further, according to the physical definition of heat intensity, the heat intensity of the FWZ (
qIII(
x″)) is calculated using Equation (29).
The friction between flank and machined surface is mostly sliding friction type. In order to simplify it to Coulomb friction type, the friction on the interface between tool and workpiece is obtained using Equation (30).
In Equation (30),
is the average friction coefficient on the interface between tool and workpiece, which is related to the average temperature of the interface between tool and workpiece. It is well accepted [
41] that both of them satisfy the following empirical formula:
,
. Moreover, it has been previously reported [
42] that
, and thus
.
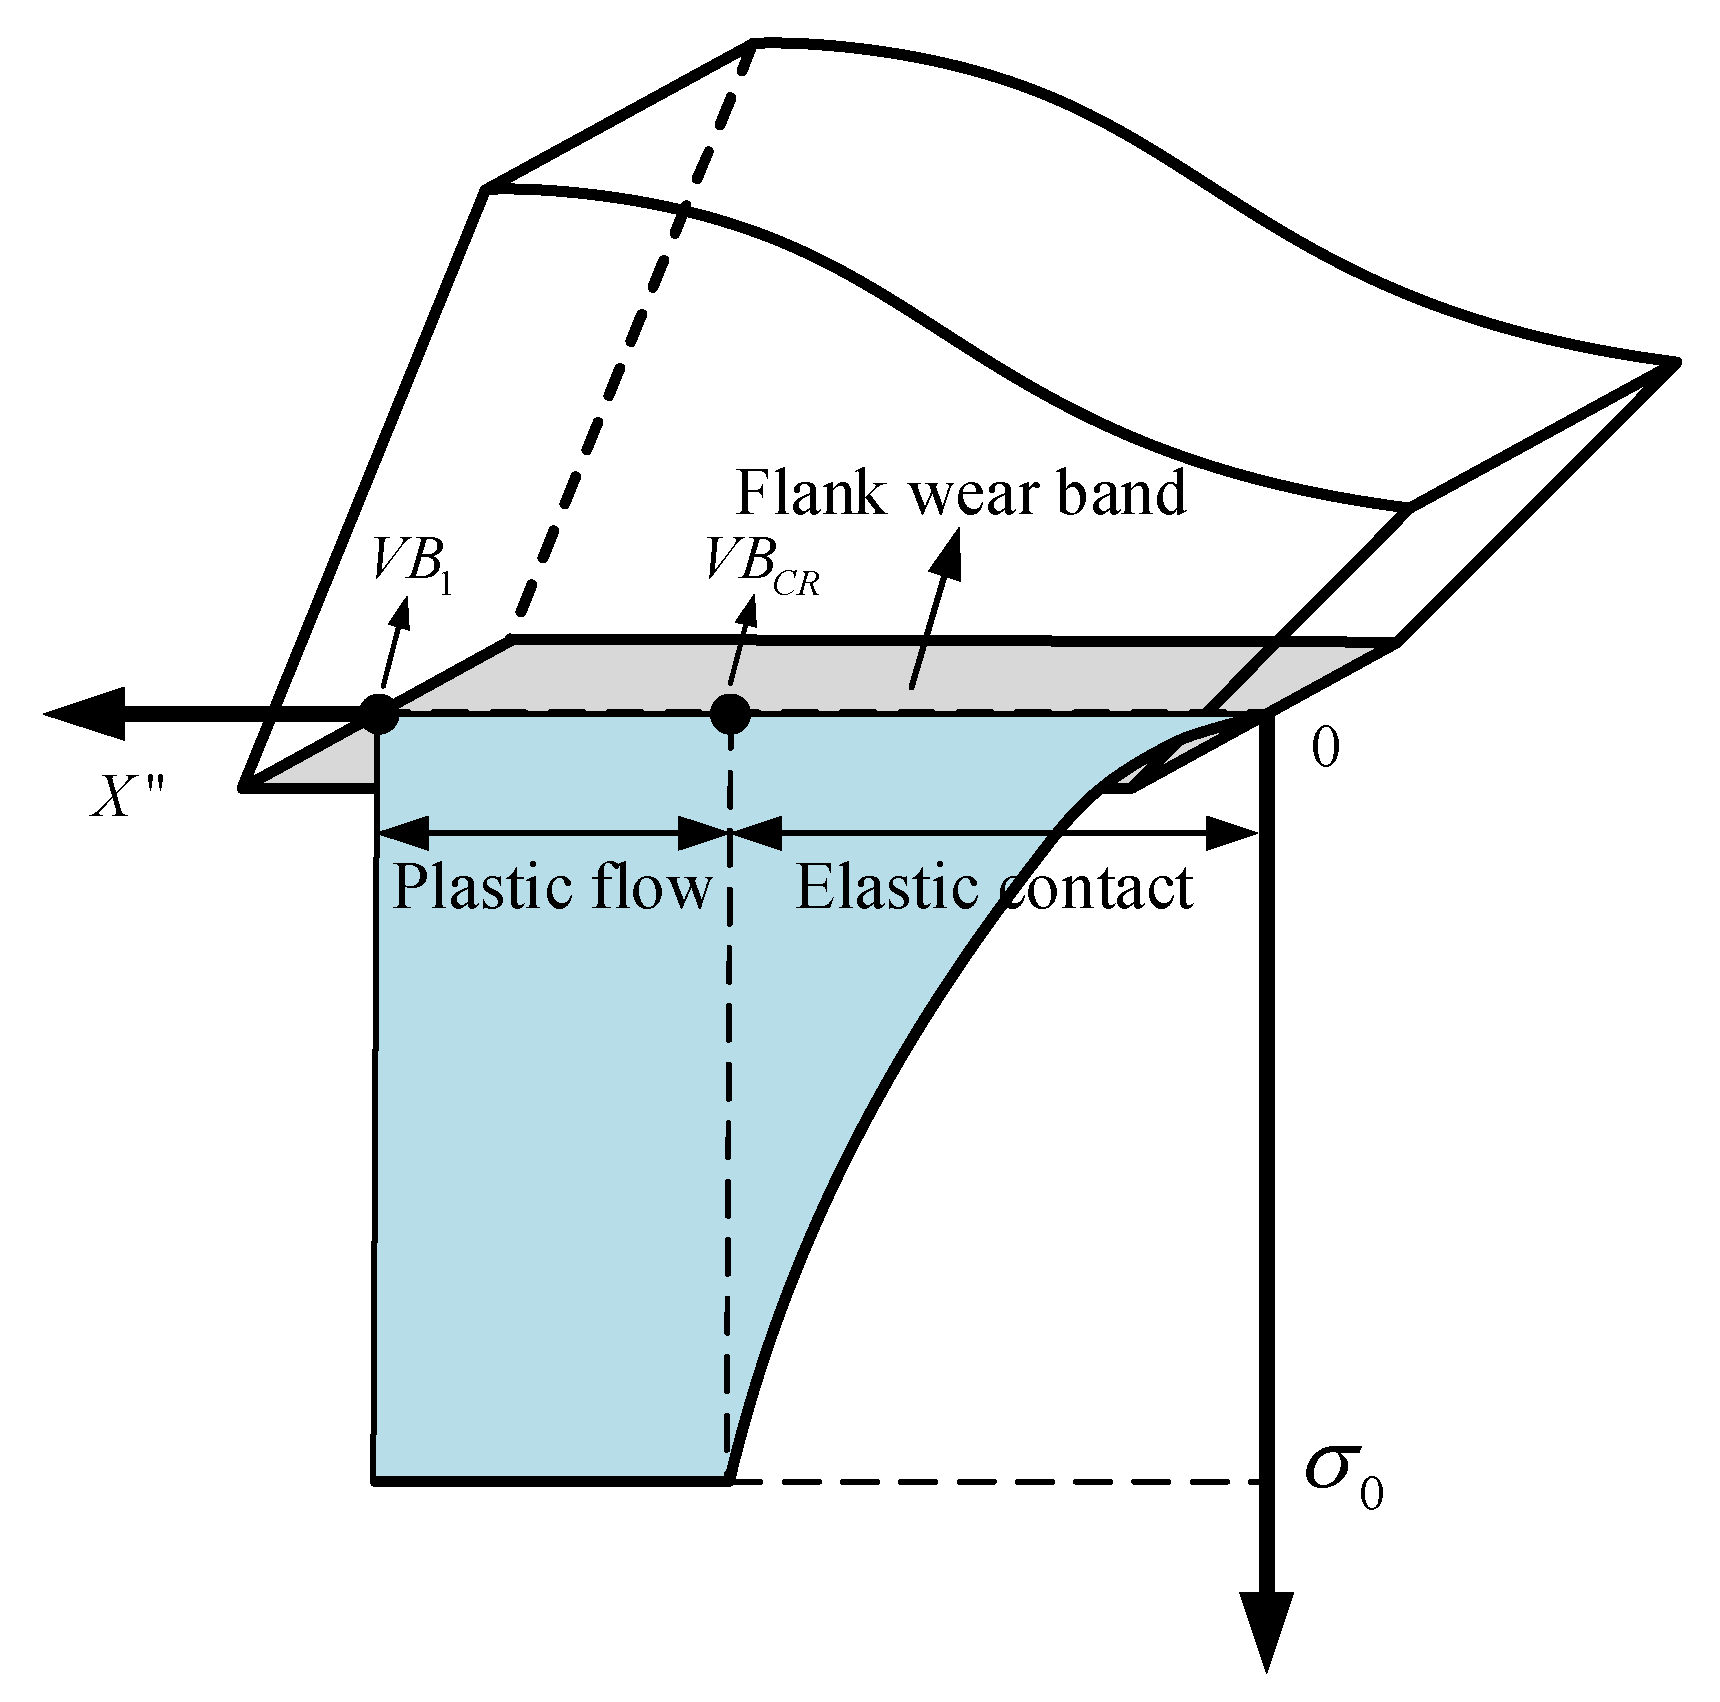
is the normal stress distribution in the middle of wear band on the flank. According to a previous study [
43], when the width of the flank wear band is small, elastic contact is found between machined surface and wear band, while a plastic flow phenomenon can occur when the wear band width is large. These may be due to the high temperatures and pressures existing near the cutting edge, such as plastic flow contact. As the referred to previous research [
44] and coordinate transformation shown in
Figure 8, the distribution of normal stress
over the wear band on the flank is determined, as shown in
Figure 8 and Equation (31).
In Equation (31),
VBCR is the critical point for both the plastic flow area and elastic contact area, while it also represents the width of the elastic contact area. The relationship between the width of the plastic flow area and the width of the wear band on the flank is fitted to previously published experimental data [
45]. According to a prior research [
46], when
VB1>VBCR, the normal stress
σtip on the tip of microelement can be calculated, as shown in Equation (32).
where η
w = 0.5cos
−1(m
w).
In Equation (32),
K is the ratio of the shear stress on the cutting edge to the shear flow stress on the workpiece, which is equal to the friction coefficient
μc of the cutting edge near the flank. Due to the bonding nature of contact between the wear band on the flank and the machined surface, a previous study [
47] has suggested that
μc is uniform.
mw is the slip line field angle of the wear band on the flank; its numerical value is equal to the friction coefficient
μc of the cutting edge near the flank. The value of the Ti6Al4V workpiece obtained from the current study is
mw =
μc = 0.85. According to a previous research [
46], if the proportion of undeformed chip thickness to cutting width is more than 5%, it is considered
ρ = 0°, and the obtained value is 0.8°.
According to Lee and Shaffer's principle (
), the direction of principal stress and the direction of maximum shear stress are adjusted to 45°, in order to determine the shear angle
φ. As shown in Equation (33), the formula for shear angle
φ is expressed as follows in Equation (33).
Basing on a prior research [
48], the heat distribution ratio in the cutting process can be calculated by Equation (34).
Owing to the undeformed chip thickness during the peripheral milling process and the flank length (VB1) are time-varying, respectively, which results in the result that the heat distribution ratio of the heat source in the FWZ (BIII-flank (θ)) is time-varying. the Equation (44) is substituted into Equation (34) to calculate the heat distribution ratio.
2.4. Temperature Drop Model of the Wear Band Affected by Dissipating Heat Source
Tool–workpiece contact is intermittent during the peripheral milling process, when the tool is out of contact with the workpiece, the heat sources in the PSZ, RCZ and FWZ will disappear, and then the dissipating heat sources will appear. Because the processing method in this paper is dry milling, the dissipating heat source at this time is caused by wear land on the flank of end mills and the natural convection cooling of air. Because air is between the wear land on the flank of end mills and the machined surface, the former is regarded as a dissipating heat source. The dissipating heat source is a fixed heat source relative to any point on the flank face, so the temperature drop model is analogous with the temperature rise model of the tool/workpiece heat source established by Huang et al. [
32]. It is assumed that the length of the dissipating heat source is the length of the wear band on the flank face and the width of dissipating heat source is the cutting width, as shown in
Figure 9. Temperature drop in wear land on the flank of end mills is affected by both native dissipating heat source and mirror dissipating heat source.
The temperature drop
ΔTflank-air (
x", 0, 0) at any point
Pair (
x″, 0, 0) along
X″ direction can be calculated by Equations (35)–(37).
From Equation (35) to (37),
ΔTair (
x″, 0, 0) and
ΔTair' (
x″, 0, 0) are the temperature drop caused by native dissipating heat source and mirror dissipating heat source, respectively. The distance from any point
Pair (
x″, 0, 0) along
X″ direction to the points of native dissipating and mirror dissipating heat sources can be measured by Equation (38).
According to Newton’s cooling law, the dissipating heat intensity is calculated by Equation (39).
In Equation (39), is the average air convective heat transfer coefficient, Tflank (x″, 0, 0) is the temperature at any point in the X″ direction of the flank wear band of end mills, and Te is the ambient temperature.
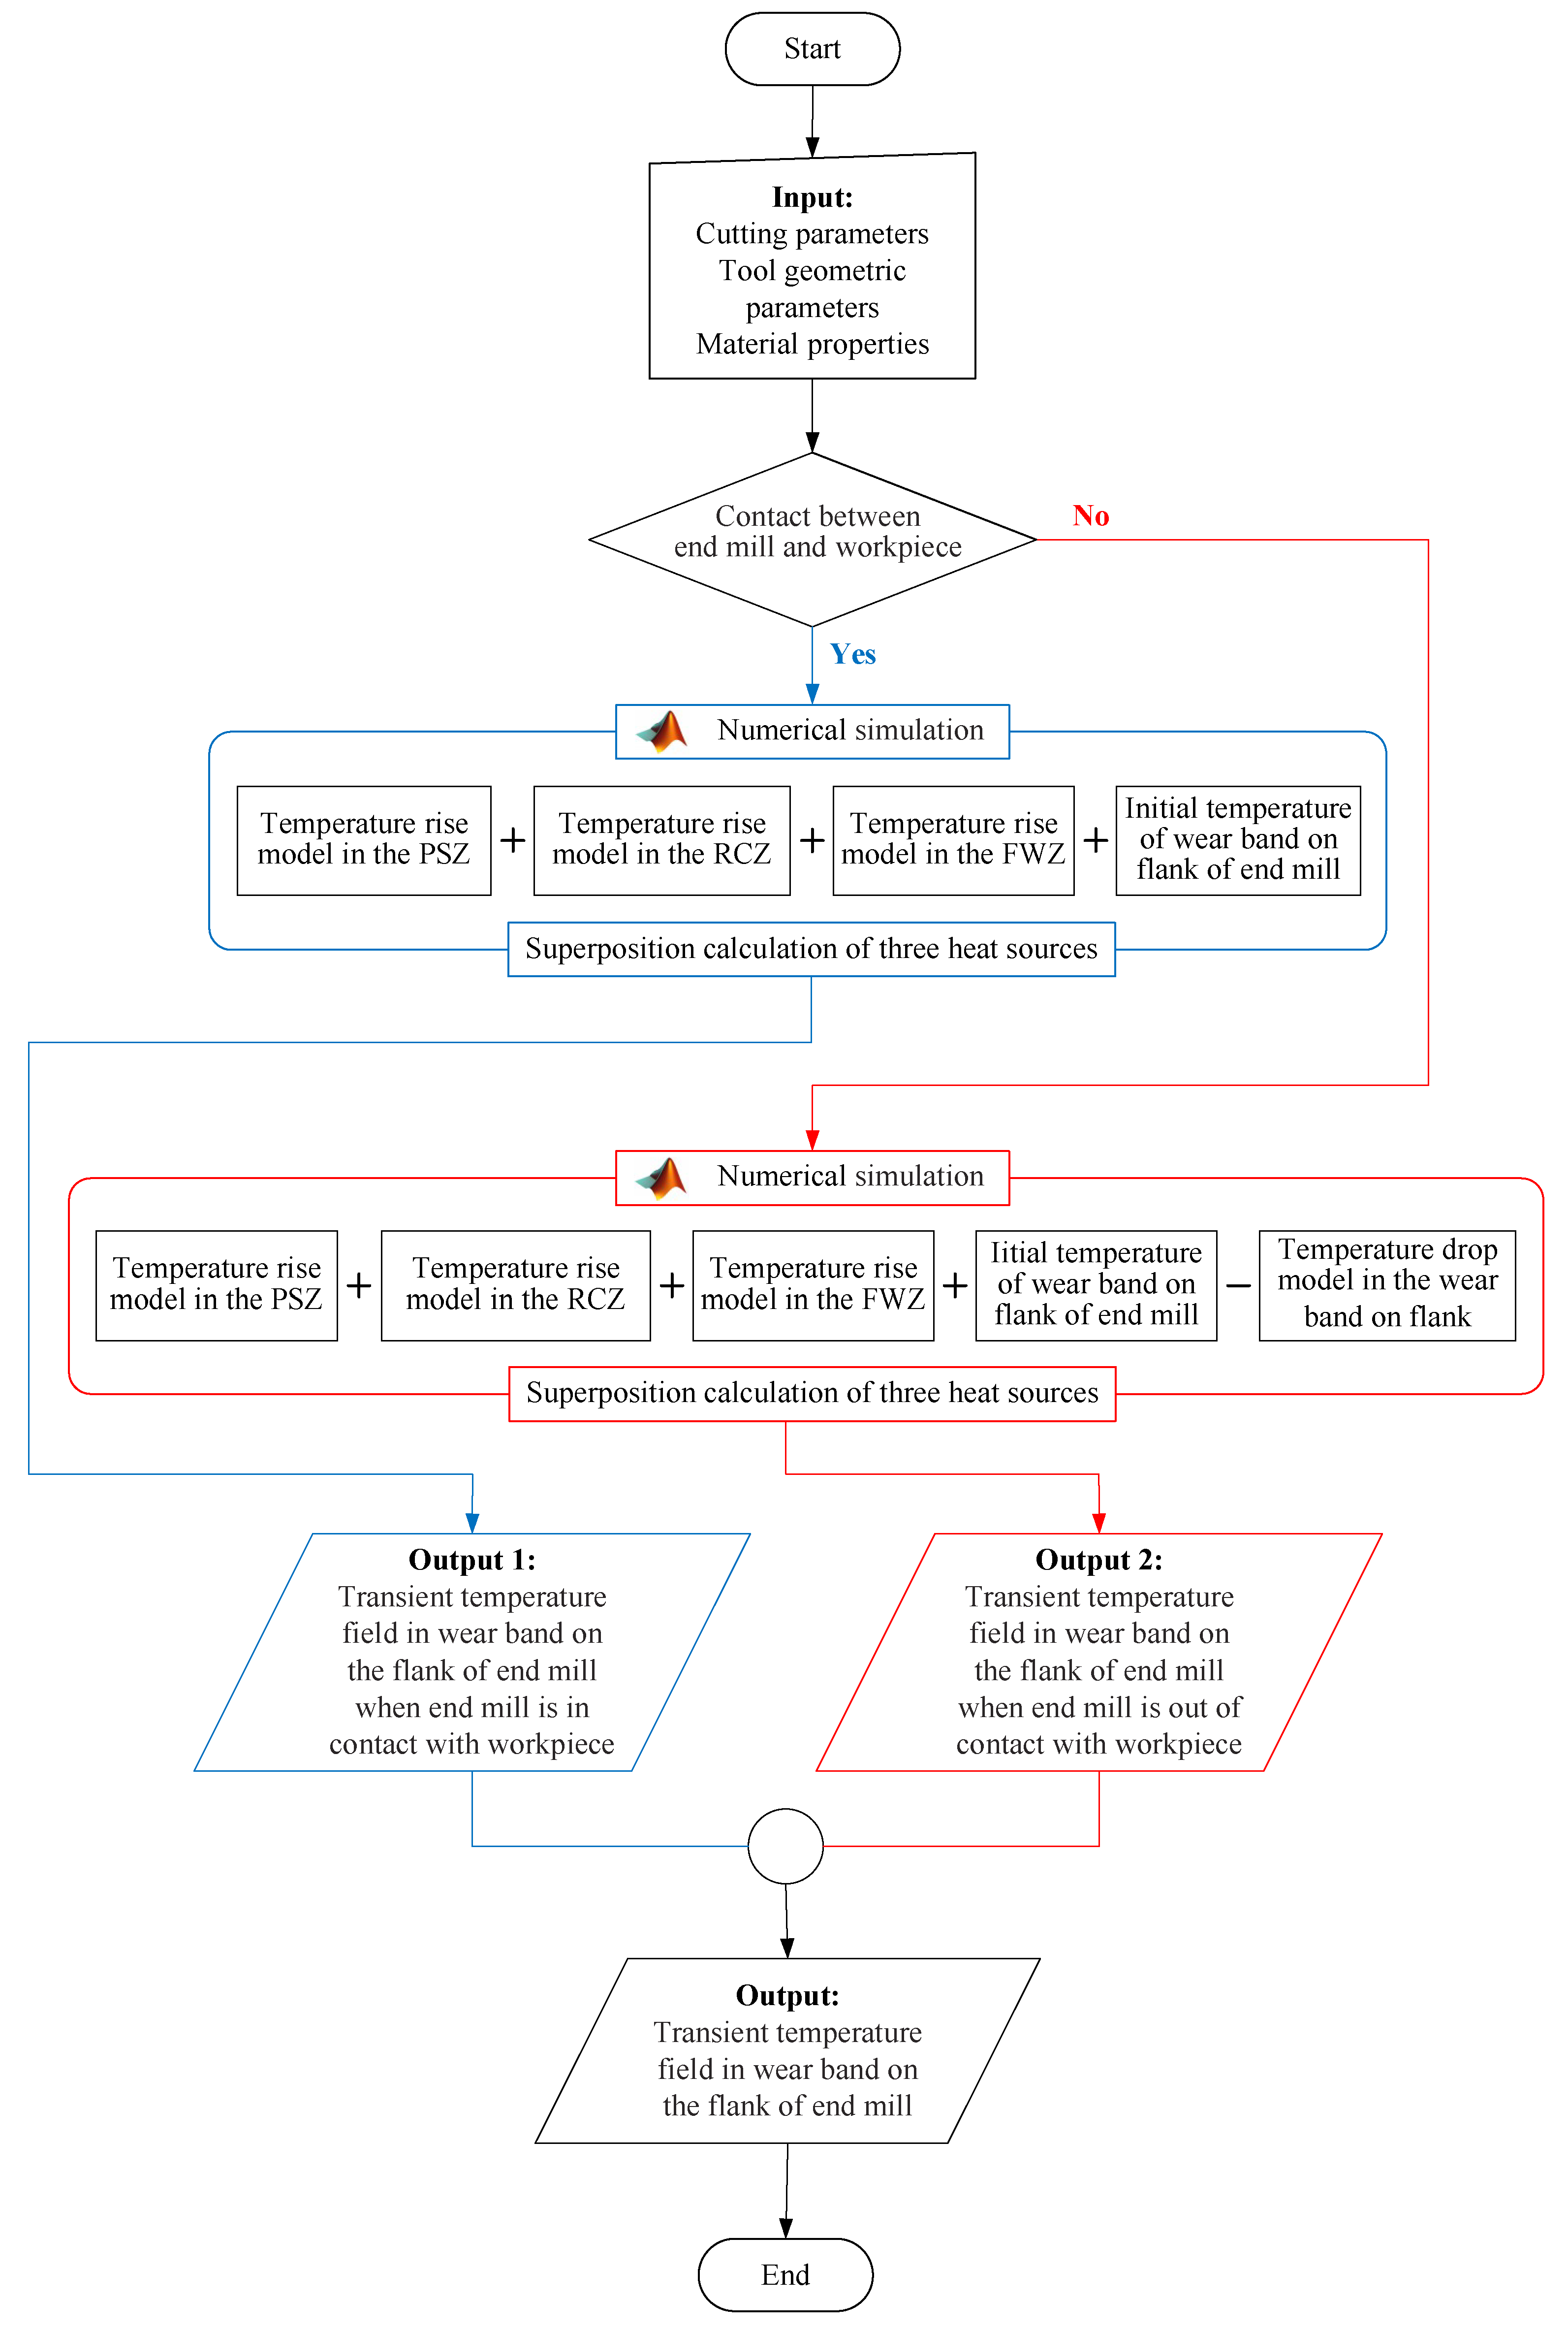
2.5. Transient Temperature Field in Wear Band on the Flank of End Mills
(1) When the edge is in contact with the workpiece, there will be heat sources in the PSZ, RCZ and FWZ, which will have a temperature rise effect on the transient temperature field of wear band on the flank of end mills. Therefore, considering the effects of heat sources in the PSZ, the RCZ and the FWZ on the transient temperature field of wear band on the flank of end mills, the temperature
Tin-flank (
x", 0, 0) at any point
P (
x″, 0, 0) along the
X″ direction can be calculated using Equation (40).
Further, the temperature at any point
P (
x″, 0, 0) along the
X″ direction of the wear band on the flank of end mills can be obtained from the coordinate system transformation and can be calculated using Equation (41).
(2) When the edge is out of contact with the workpiece, the heat sources in the PSZ, RCZ and FWZ disappear, and then the dissipated heat sources will appear, which will have a temperature drop effect on the transient temperature field of the wear band on the flank of end mills. Therefore, considering the effect of dissipation source on the transient temperature field of wear band on the flank of end mills, the temperature
Tout-flank (
x″, 0, 0) at any point
P (
x″, 0, 0) along the
X" direction can be calculated using Equation (42).
Based on the two kinds of contact relationship between tool and workpiece, the transient temperature field of wear band on the flank of end mills, the temperature
Tflank (
x″, 0, 0) at any point
P (
x″, 0, 0) along
X″ direction can be calculated using Equation (43).
In this part, the temperature field models of 2.1, 2.2, 2.3, and 2.4 were simulated and superimposed by MATLAB software (R2014a, The MathWorks, Natick, MA, USA, 2014). Consequently, the predicted results for the transient temperature field of the wear band on the flank of end mills were obtained. The modeling process is summarized in
Figure 10.
2.6. Derivation of Pertinent Physical Quantities in the Peripheral Milling
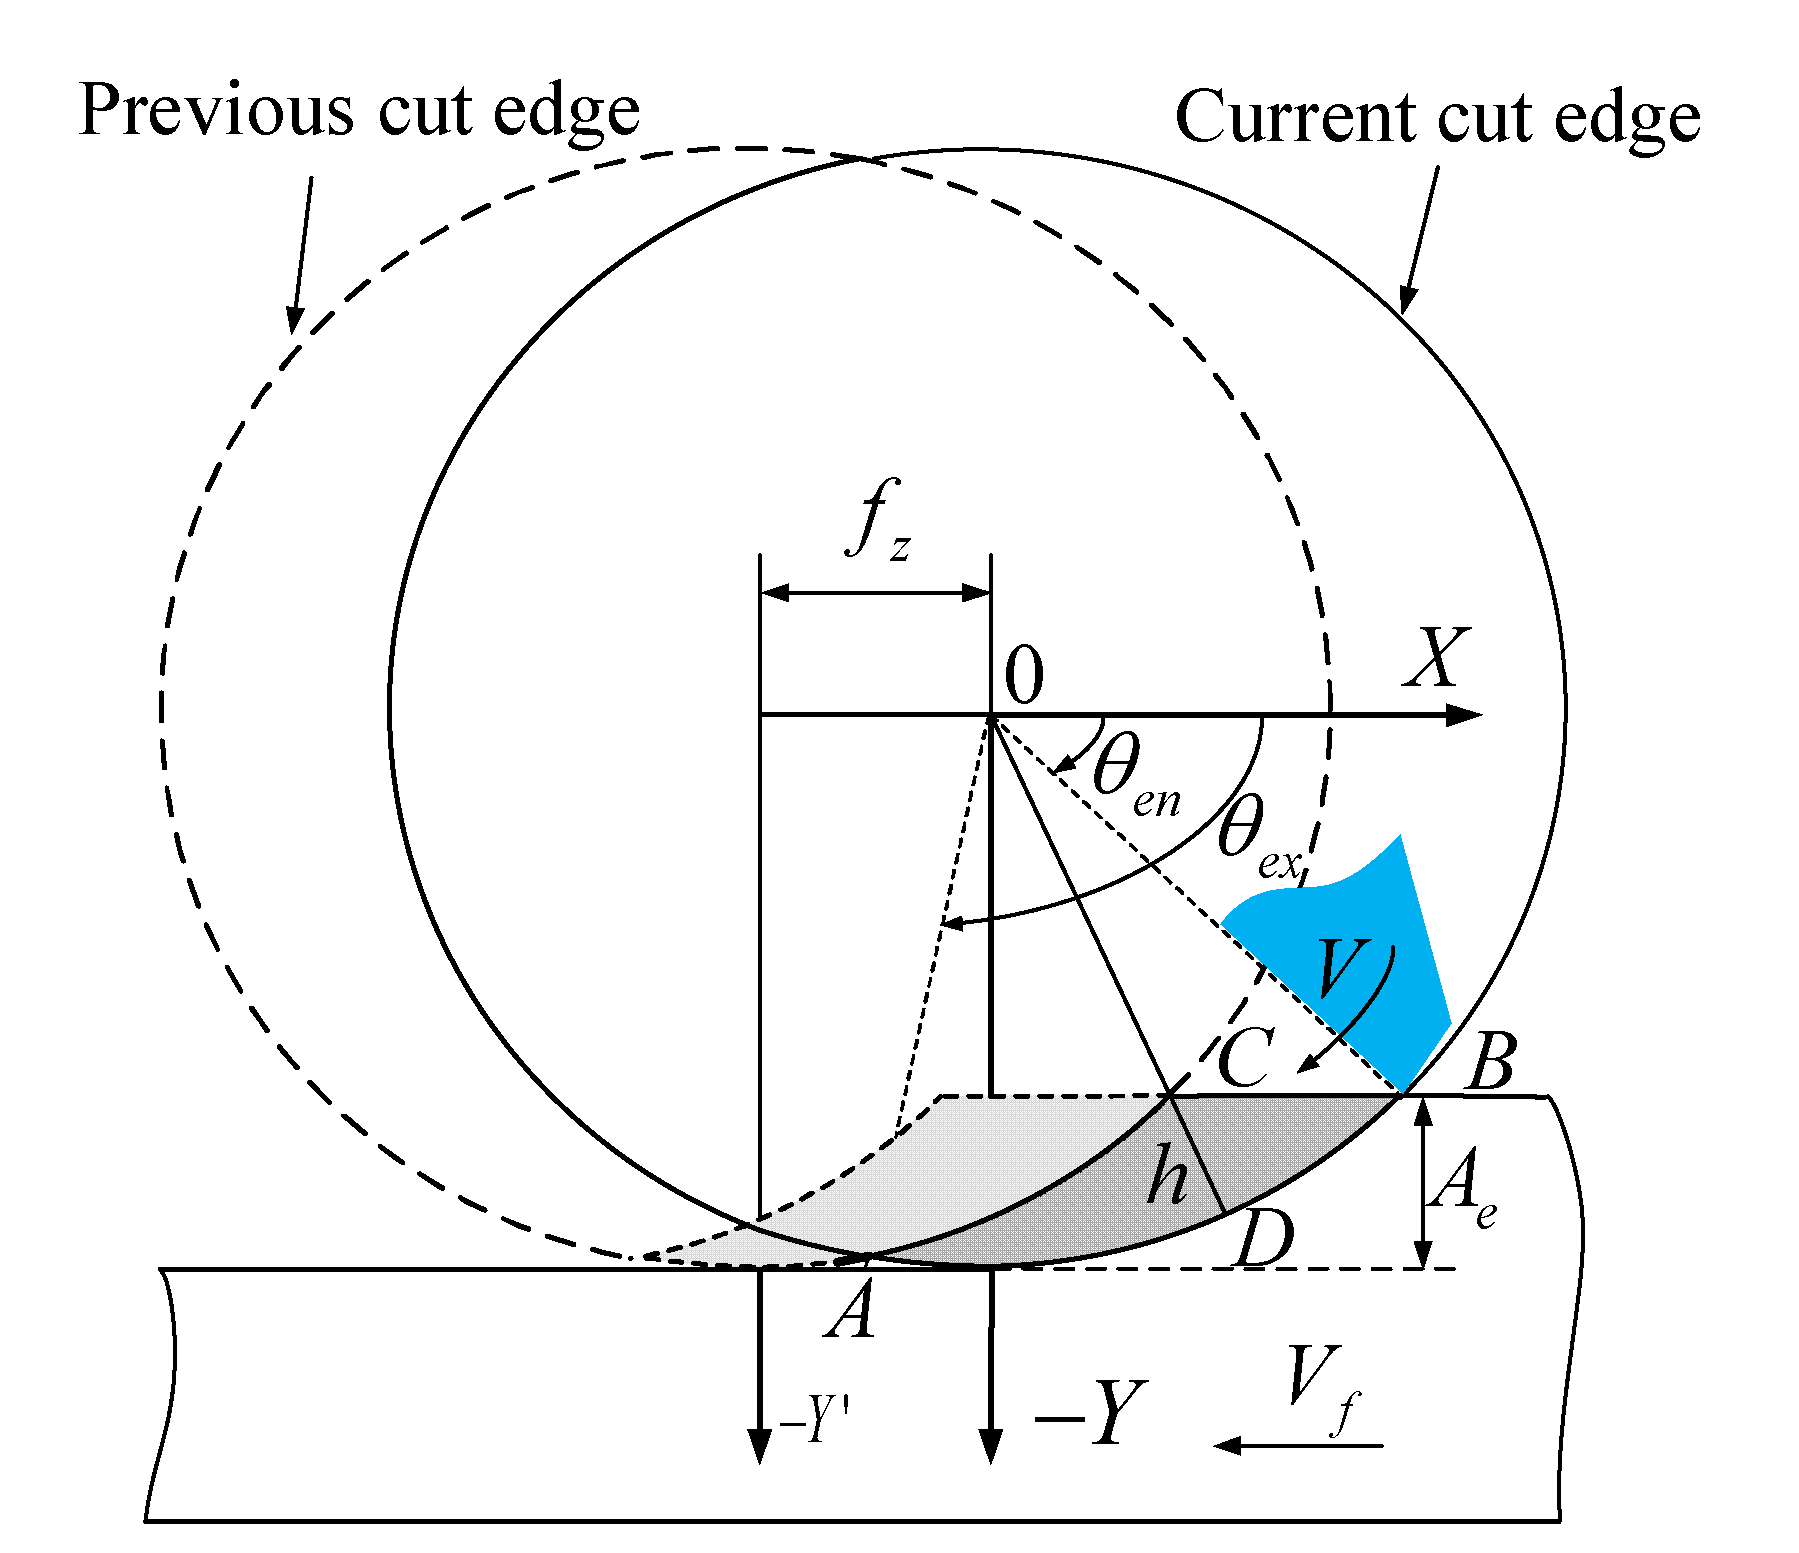
2.6.1. Determination of Undeformed Chip Thickness
The following assumptions were made for deriving the undeformed chip thickness:
As shown in
Figure 11 and Equation (44), the relationship among undeformed chip thickness and instantaneous contact angle, peripheral milling width and feed rate per tooth is deduced from a geometric relationship.
In Equation (44),
, , ,
2.6.2. Calculation of Instantaneous Contact Angle θ
The end mill is discretized along the direction of axial cutting depth into
m circular discs with thickness
w = dz = Ap/m (
Figure 12).
If m is large enough, the helical line BD is considered as a straight line. Therefore, in this study, ABC is regarded as a right triangle, indicating a corresponding relationship between them, as revealed by Equation (45).
When the instantaneous contact angle is θ, the secant satisfaction relationship in the sector is demonstrated in Equation (46).
As shown in Equation (47), the relationship among instantaneous contact angle θ, milling depth Ap and the number of discs m is examined using the simultaneous Equations of (45) and (46).
4. Conclusions
In sum, the transient temperature field characteristics of the wear band on the flank of end mills in the titanium alloy cutting process are studied by theoretical modeling and an experimental method, as shown below:
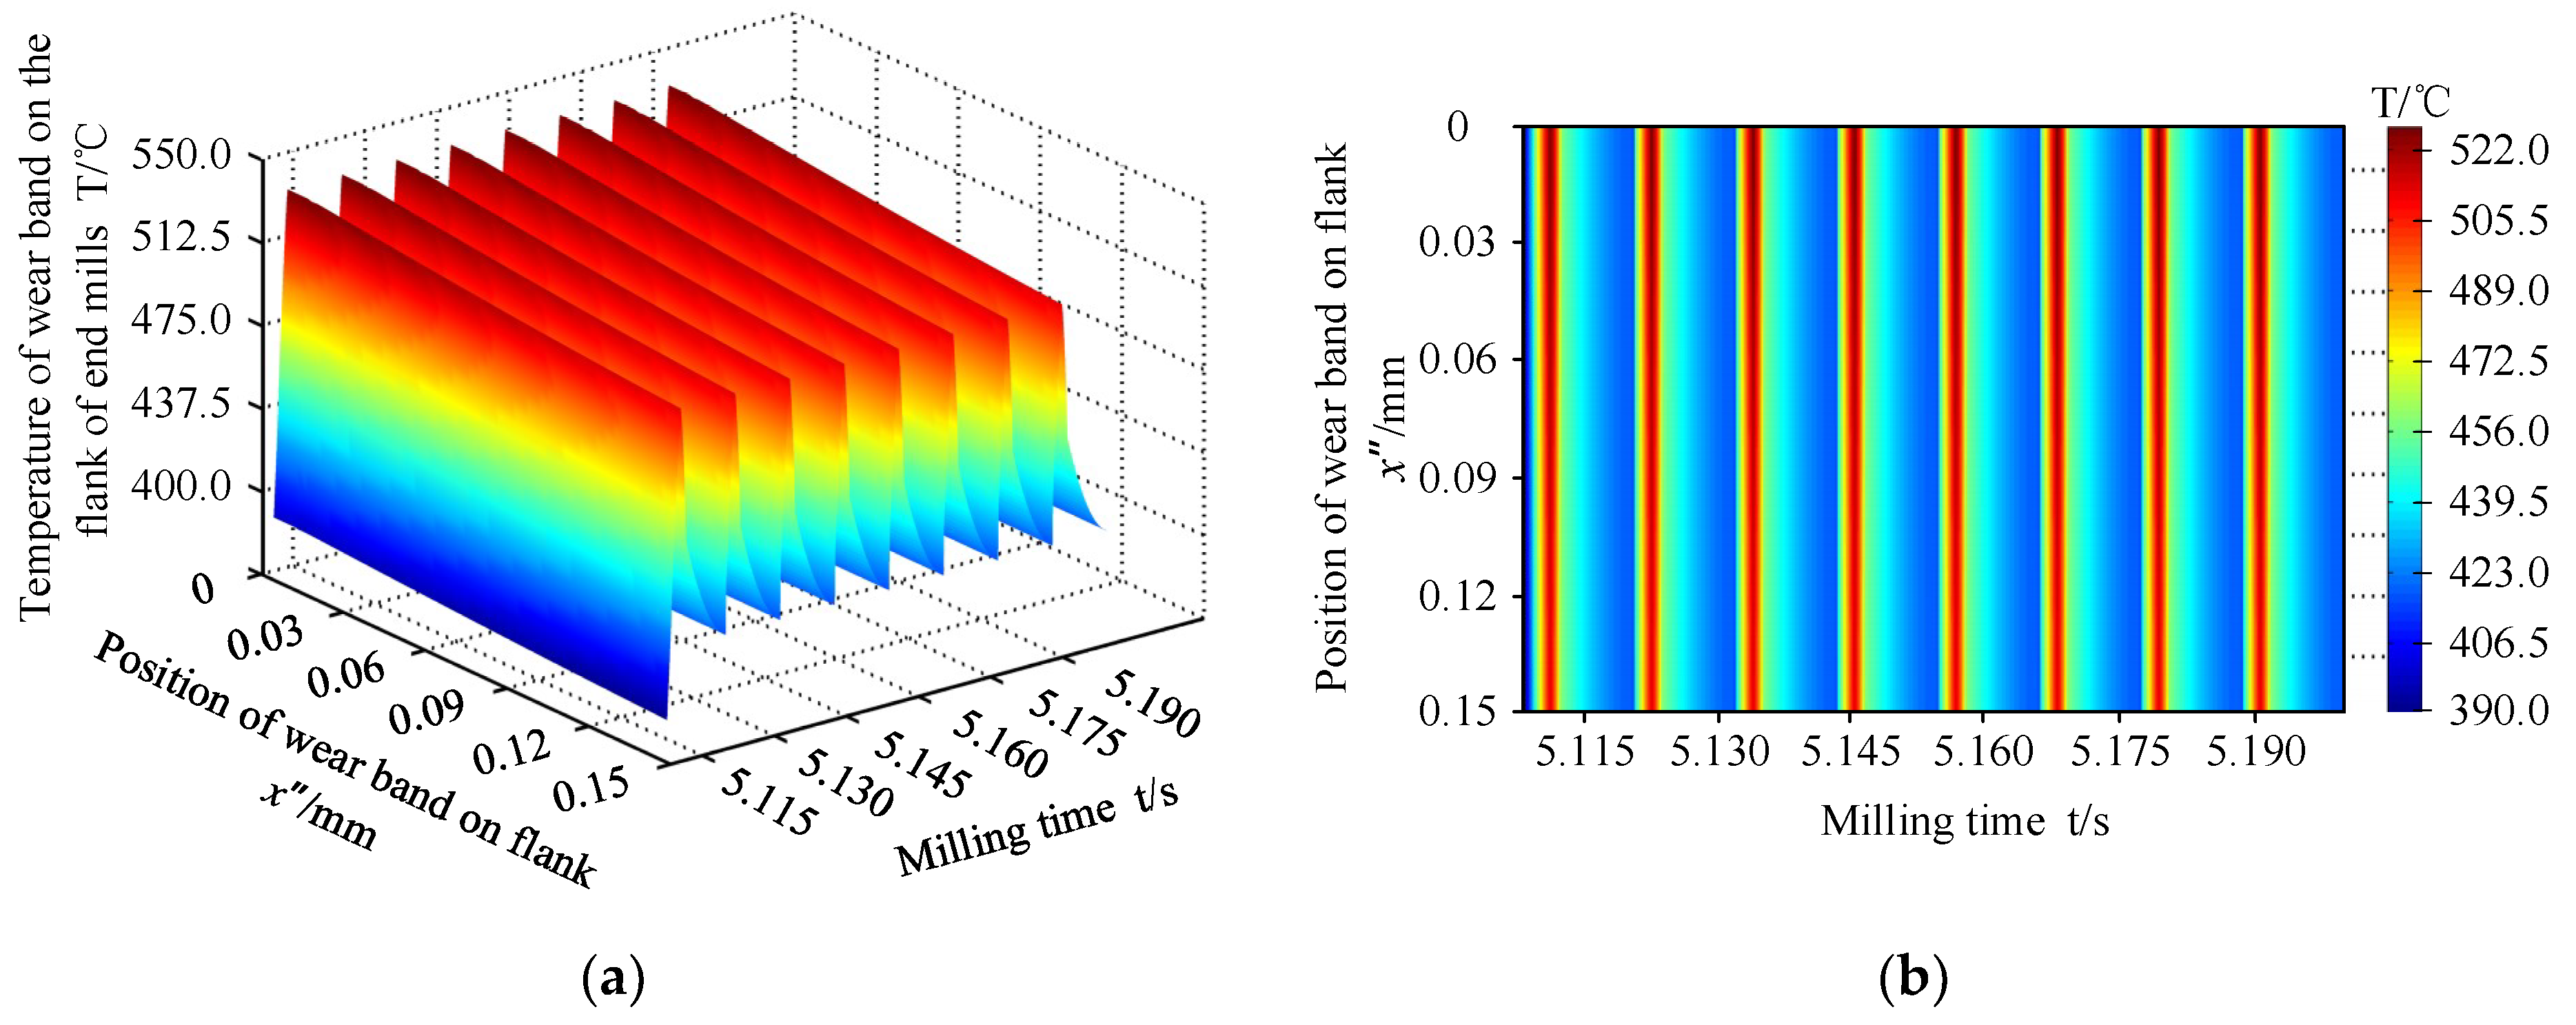
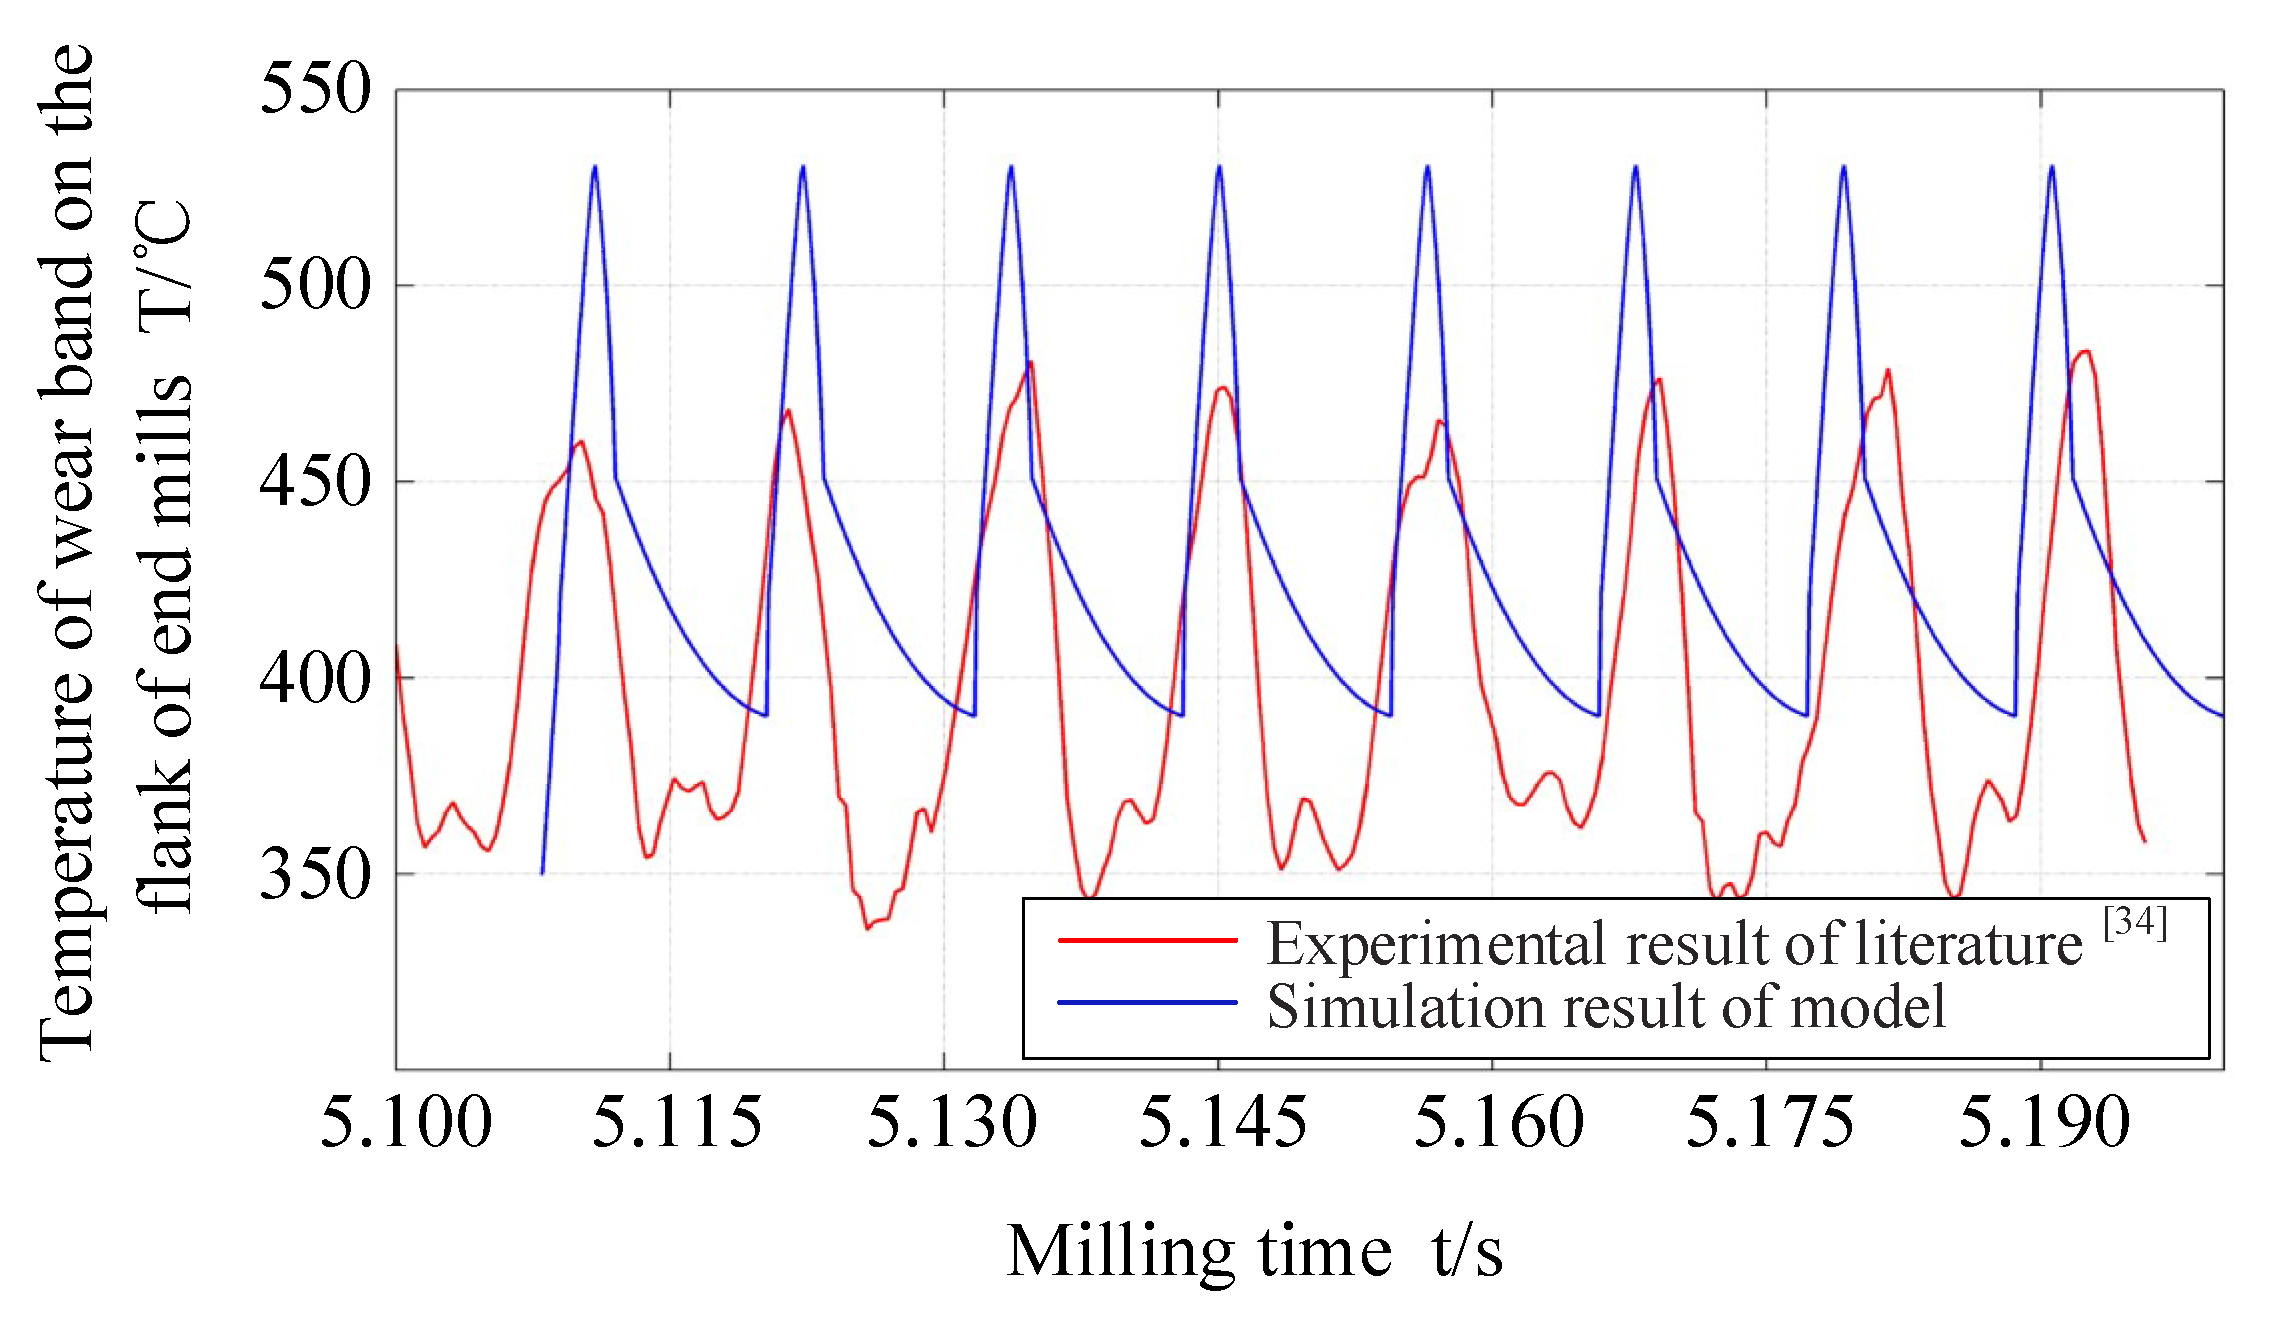
According to the temperature rise and drop in milling process, given the non-uniform heat intensity, heat distribution ratio and rake angle in the RCZ and FWZ, a transient temperature field model of wear band on the flank of end mills is established based on “moving heat source method”. The accuracy of the model is verified by both simulation and experimental results. The error ranged from 9.28% to 15.22%. When milling depth remains unchanged and milling speed is higher, heat distribution ratios of the heat source in the RCZ to the rake face may decrease, and the reduction ratio is most significant before the undeformed chip thickness reaches its maximum value. When milling speed remains unchanged and milling depth is greater, the heat distribution ratio of the heat source in the RCZ to the rake face may decrease, and the reduction rate is most significant before the undeformed chip thickness reaches its maximum value. When milling depth remains unchanged and milling speed is higher, the heat intensity in the RCZ is enhanced, and the enhancement rate is most significant when the undeformed chip thickness reaches its maximum value. When milling speed remains unchanged and milling depth is lower, the strength of the heat source in the RCZ is improved, and the enhancement rate is the most significant when the undeformed chip thickness reaches its maximum value. When milling depth and speed remain unchanged as well as milling speed and depth increase, the heat distribution ratio of the heat source in the FWZ to the wear band on the flank may be lowered, and the reduction rate decreases gradually with increasing undeformed chip thickness. When milling depth remains unchanged and milling speed is higher, the heat intensity in the FWZ is enhanced, and when the X″ coordinate value of the wear band of the flank is within the range of 0.09–0.15 mm, the enhancement rate appears to be most significant. When milling speed remains unchanged and milling depth is greater, the heat intensity in the FWZ may be weakened, and when the X″ coordinate value of wear band on the flank is within the range of 0.09–0.15 mm, the weakening rate is considered the most significant.


