Article

Limestone and Calcined Clay-Based Sustainable Cementitious Materials for 3D Concrete Printing: A Fundamental Study of Extrudability and Early-Age Strength Development

1
Faculty of Civil Engineering and Geosciences, Delft University of Technology, 2628 CN Delft, The Netherlands
2
Faculty of Architecture and the Built Environment, Delft University of Technology, 2628 BL Delft, The Netherlands
*
Author to whom correspondence should be addressed.
Submission received: 3 April 2019 / Revised: 23 April 2019 / Accepted: 25 April 2019 / Published: 30 April 2019
(This article belongs to the Special Issue Low Binder Concrete and Mortars)

Abstract

:
The goal of this study is to investigate the effects of different grades of calcined clay on the extrudability and early-age strength development under ambient conditions. Four mix designs were proposed. Three of them contained high, medium, and low grades of calcined clay, respectively, and one was the reference without calcined clay. In terms of extrudability, an extrusion test method based on the ram extruder was introduced to observe the quality of extruded material filaments, and to determine the extrusion pressure of tested materials at different ages. For evaluating the very early-age strength development, the penetration resistance test, the green strength test, and the ultrasonic pulse velocity test were applied. Furthermore, the mechanical properties of the developed mix designs were determined by the compressive strength test at 1, 7 and 28 days. Finally, the main finding of this study was that increasing the metakaolin content in calcined clay could significantly increase the extrusion pressures and green strength, shorten the initial setting time and enhance the compressive strength at 1, 7, and 28 days.

Graphical Abstract

1. Introduction

3D concrete printing (3DCP), also referred to as digital fabrication or additive manufacturing of concrete, has been under development by both the academic research and construction industries in the past decade [1,2,3]. The unique advantages of 3DCP over conventional concrete construction may include saving labors and costs, eliminating formwork, increasing flexibility in architecture design, as well as reducing the construction time [3,4,5,6]. Until now, there are two main approaches in 3DCP: the extrusion-based method and the powder-based method [2,7]. This study only focuses on the extrusion-based 3DCP, which generally employs an additive, layer-based, formwork-free extrusion and deposition process [7]. Considering conventional concrete technology principles, the extrusion-based 3DCP cannot be regarded as a sustainable construction method. As reported by Panda et al. [8], the amount of ordinary Portland cement (OPC) forms more than 70% of the binder in most of the available cementitious materials for 3DCP. To satisfy the required fresh properties of 3D printable concrete, such as pumpability and extrudability, the content of aggregate is significantly reduced, which leads to a further increased quantity of OPC in the mix design [9]. Producing OPC consumes massive energy and emits large amounts of greenhouse gases [10]. According to Dong et al. [11], the cement industry is responsible for nearly 7% of global total CO2 emission. Partially replacing OPC by supplementary cementitious materials (SCMs) might be a proper way to start making the printable concrete sustainable. Recently, many researchers started to look for suitable SCMs for decreasing the use of OPC in 3D printable concrete. The mix designs for 3DCP proposed by Nerella et al. [2] contain 55% of OPC (391 kg/m3), 30% of fly ash and 15% of microsilica in the binder. It is a good example to show the feasibility of using comparable content of fly ash and microsilica/silica fume to substitute OPC. The attempt of using a high volume of fly ash or slag to replace OPC can be found in the recent works by Panda et al. [12] and Panda and Tan [13], respectively. A large amount of limestone is also utilized by Bentz et al. [14] for developing a sustainable cementitious binder. However, many limitations may appear by using the common SCMs like fly ash, silica fume, slag, and limestone as the main ingredients of 3D printable cementitious materials for a long-term application. The main problem for silica fume and slag is the limited quantity of their production worldwide [15,16]. The amount of fly ash is relatively higher, whereas more than 66% of available fly ash is not suitable for blending with cement due to quality reasons [17]. Using the above 10% of limestone alone as the substitution of OPC in the binder would result in higher porosity and weaker strength [16,18].
Chen et al. [19] pointed out that it is worthwhile to use limestone and calcined clay as the OPC substitutions for developing sustainable and printable cementitious materials. Reasons include the following: (1) kaolinitic clay and limestone exist in abundance; (2) the production of calcined clay requires much lower heating temperature (700–850 °C). Manufacturing 1 ton of calcined clay may emit only 0.3 ton of CO2 [20] which is much less than producing the same mass of OPC (emitting 0.8–0.9 ton of CO2) [21]; (3) a mixture using limestone and calcined clay with 1:2 mass ratio not only could replace higher contents of OPC but generate carbo-aluminate hydrates which can fill the capillary pores [16]. The porosity refinement could contribute to increasing the compressive strength at an older age; (4) the lower grades of calcined clay (metakaolin content: 40–50%) also shows the comparable pozzolanic reactivity which has been demonstrated by Avet et al. [22]. Metakaolin (MK) or high grades of calcined kaolinitic clay with high purity and price is generally used by other industries, for instance, paper, ceramics and refractory [16]. In the concrete industry, it appears to be an economical choice to use lower grades of calcined clay, which are widely available compared to MK. However, the calcined clay sourced from different suppliers may contain various percentages of MK. Different calcined clay may have different compositions, secondary phases, fineness, and specific surfaces [22] which will influence the rheological behaviors of fresh cementitious materials. To our knowledge, at this moment few researchers are focusing on developing limestone and calcined clay-based cementitious materials for 3DCP. The effects of different grades of calcined clay (different MK content) on fresh behavior and early-age strength development is to be further explored.
Extrudability and early-age strength should be emphasized as two major constraints of developing printable cementitious materials. As cement is a time-dependent material, the workability of a given printable mix design is not constant and shows loss of consistency with time. Printability window/open time was used to describe the valid time for extruding the fresh material with acceptable quality [8,23]. Thus, the printability window/open time of a printable mix design could be understood as the timespan of extrudability. As explained by Roussel [24], extrusion behavior of fresh cementitious materials are dependent on several rheological parameters, such as yield stress, plastic viscosity and shear strength. Many experimental methods have been proposed from the literature to quantify how these rheological parameters change over time. Le et al. [7] used a shear vane apparatus to measure the change of shear strength of fresh mortar with time. More recently, rheological behavior of fresh cementitious materials were precisely determined by using a coaxial-cylinder rheometer (equipped with a unit cell and vane rotor) [4,25]. Besides, the ram extruder was also one method to characterize the extrudability of cement-based material [2]. The ram extruder could be regarded as a model to simulate the process of material extrusion and deposition in the 3DCP process. The extrusion technology as a cost-efficient and environmental-friendly fabrication method has been used in the cementitious materials industry for a long time [26] before applied in 3DCP. According to Perrot et al. [27], it is feasible to use a ram extruder as a rheo-tribometer to calculate the extrusion factors of the high yield fluids, such as bulk and shear yield stresses, wall friction yield stress, and others. The extrusion pressure could reflect the combined impacts of rheological and tribological properties of cement-based materials. Since a cement-based material is heterogeneous and time-dependent, the extrusion behavior should be changing with time. In this study, a new extrusion test based on the ram extruder is proposed for characterizing the extrudability of the developed limestone and calcined clay-based cementitious materials at different ages.
On the other hand, elimination of formwork in 3DCP introduces many challenges for developing printable cementitious materials. Without the supports from formwork, the extruded fresh mortar layer should emerge with high yield stress immediately to maintain the shape and sustain the load from subsequent layers once they are deposited [28]. That is the main reason why it is essential to monitor the mechanical performance of the printable mix design at an early age. In this study, the early age strength contains two sections: the green strength, as well as the compressive strength at 1, 7, and 28 days. The phase of green strength which was defined by Voigt et al. [29] is used to describe the uniaxial compressive strength of mixtures at the fresh state. According to the simulated building rates (1.1-6.2 m/h) from Perrot et al. [28], it will take at most 3h to print a large concrete component with a height of 3m. Taking the potential mixing and transporting time of fresh mortar into account, 4h is sufficient to indicate green strength development which plays a dominant factor for the layer stacking process. However, it is difficult to measure the green strength of mortar specimens in the fresh state. Wolfs et al. [30] gave a good example for determining the green strength of 3D printable mortar at different fresh material ages of t = 0, 15, 30, 60, and 90 min (The time zero was recorded after mixing, demolding, and placing the specimens). In another paper, Wolfs et al. [31] attempted to build a correlation between the results of uniaxial unconfined compression test and ultrasonic pulse velocity test for the fresh printable mortar. According to their findings, ultrasonic pulse wave transmission tests probably can be used as a non-destructive method to indicate the early-age mechanical performance of their 3D printable mortar. Besides, Ma et al. [32] believed that penetration resistance could be regarded as an essential factor to quantify the stiffness and strength development of cement-based materials at rest and it is also feasible to reflect the structural build-up behavior. In this study, the penetration resistance test, green strength test, and ultrasonic pulse velocity test were performed to evaluate the developed mix designs.
This paper provides a lab-scale methodology for developing limestone and calcined clay based sustainable cementitious material to be used in the 3DCP process. This research also aims to investigate the effects of different grades (different percentages of MK) of calcined clay on the extrudability and early-age strength development under ambient conditions. In terms of extrudability, an extrusion test method based on the ram extruder was introduced to determine the extrusion pressure of different mix designs at different ages. The shape quality of extruded filaments was also observed. To evaluate the early-age strength development, a series of tests were applied, including the penetration resistance test, the green strength test and the ultrasonic pulse velocity test. Furthermore, the mechanical performance of the developed mix designs was indicated by the compressive strength test at 1, 7, and 28 days.

2. Materials and Methods
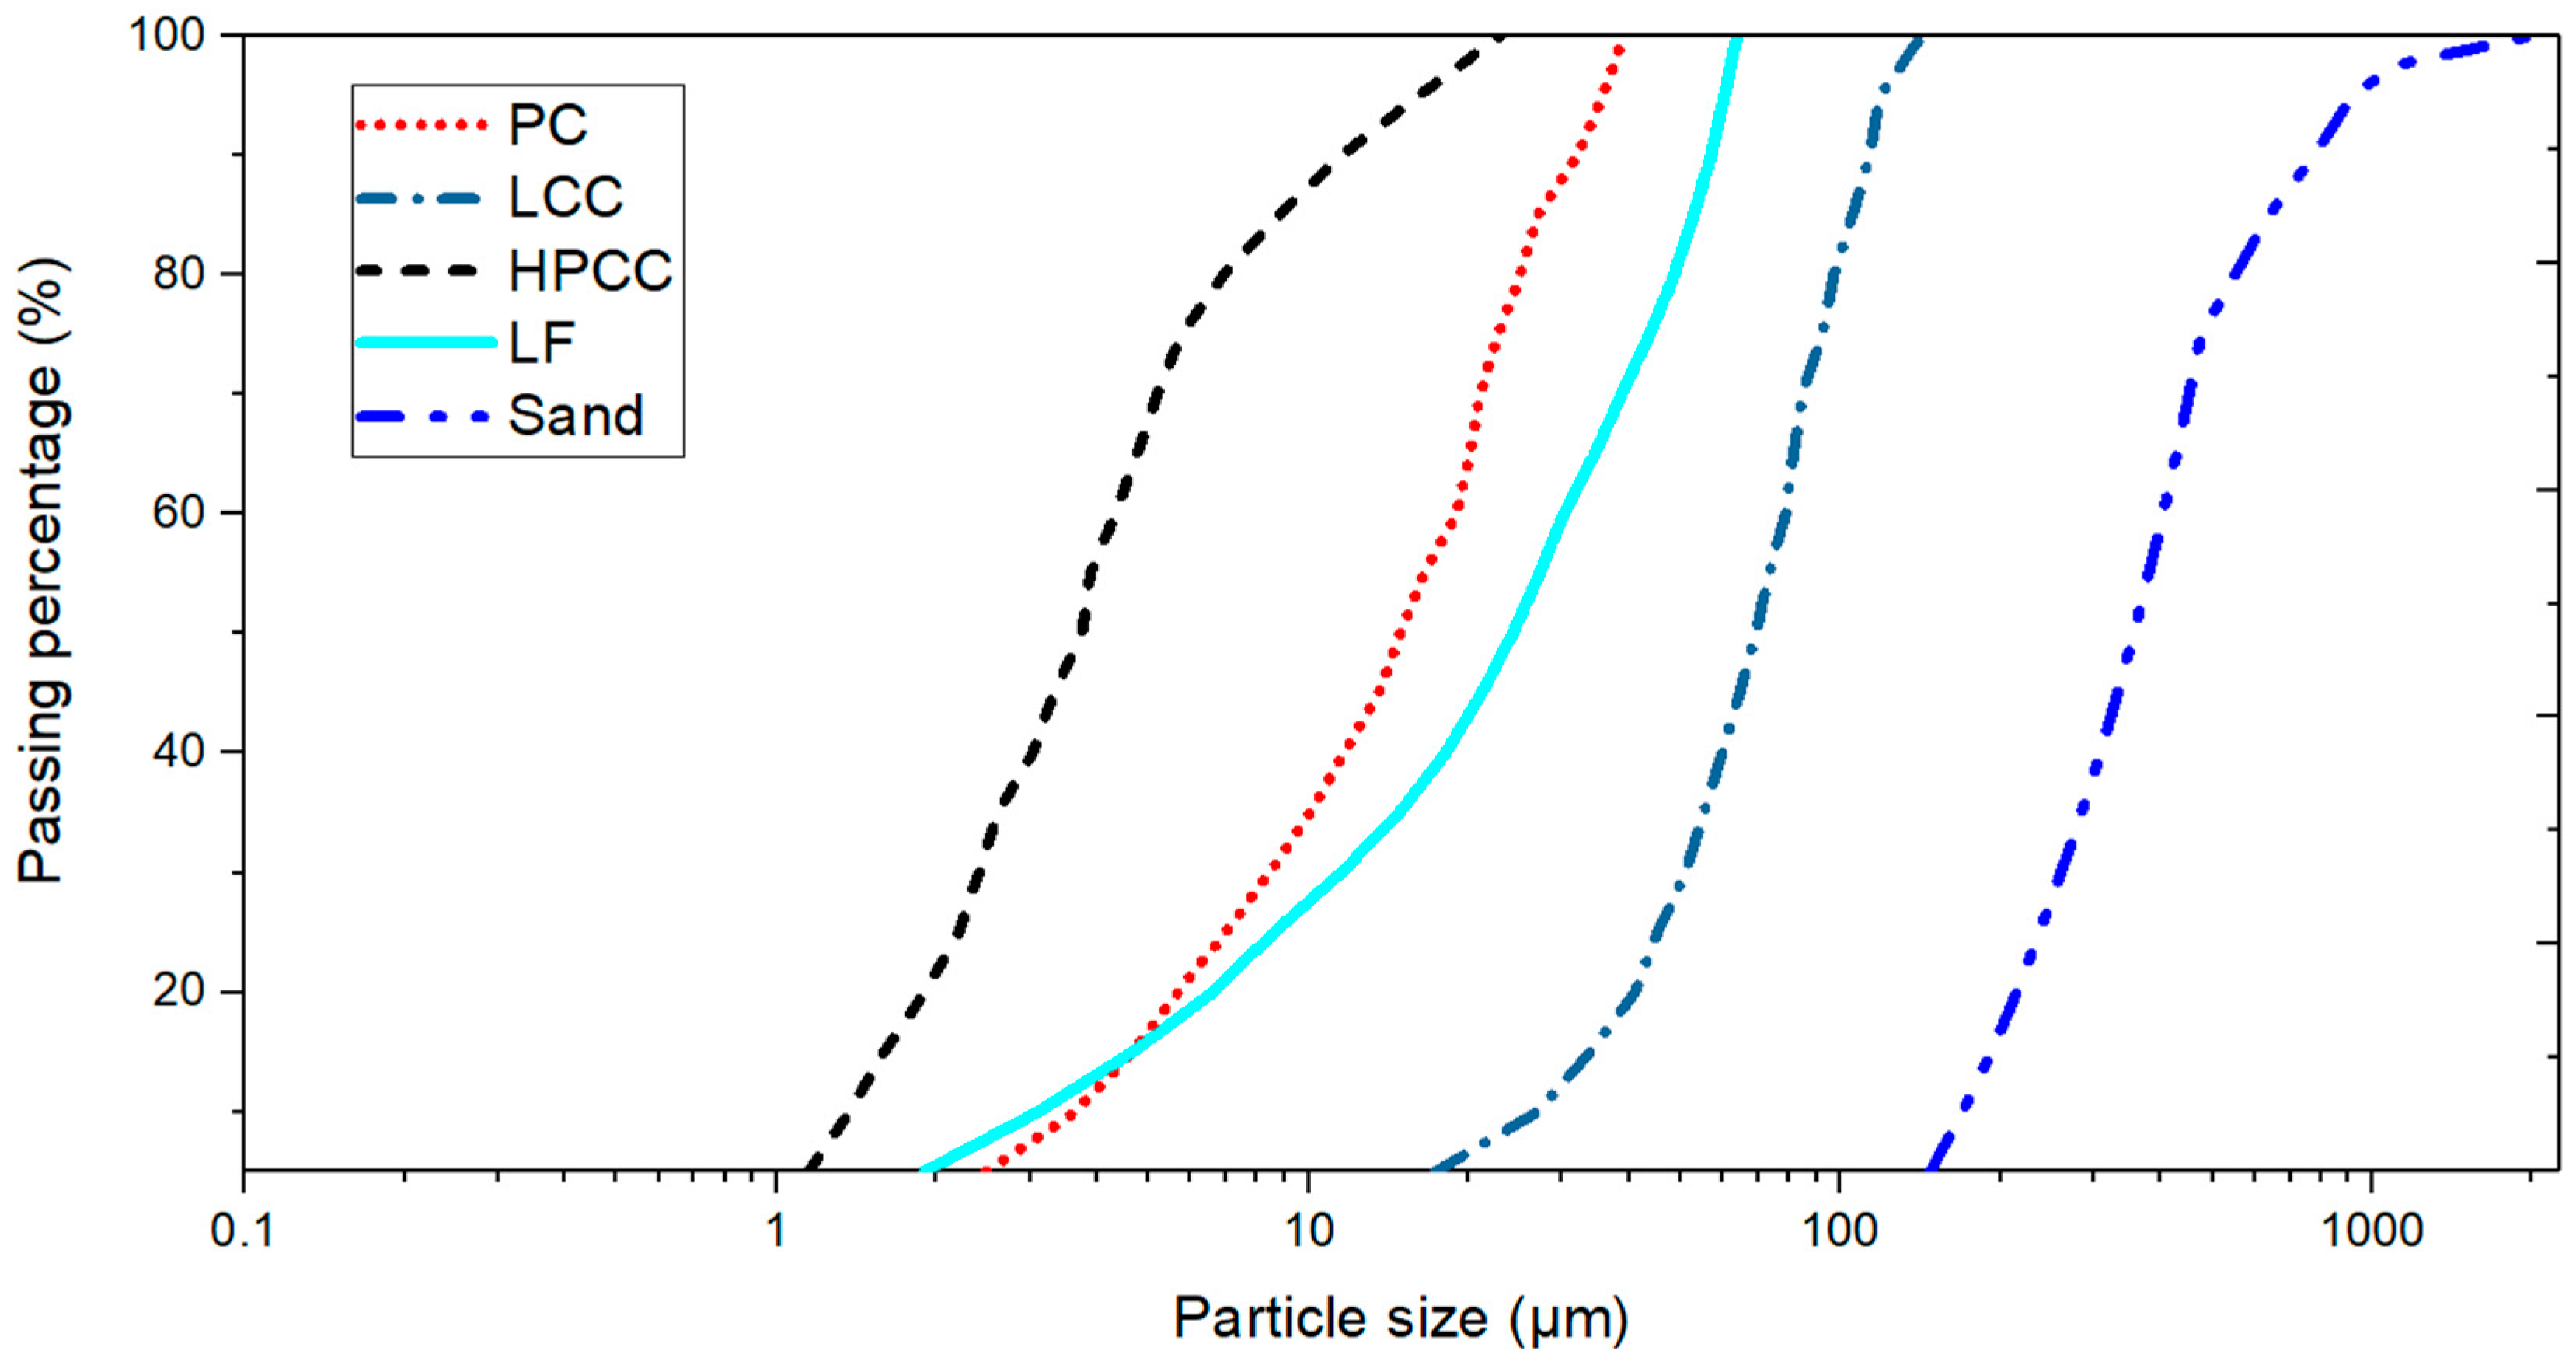
2.1. Raw Materials

A rapid hardening CEM I 52.5R type Portland cement (PC), a limestone filler (LF) and two types of calcined clay were used as the binder. The low-grade calcined clay (LCC) that contained 40–50% of MK and the high-grade calcined clay (HPCC) which contained near 90% of MK was produced by flash calcination of 95% kaolinite clay from Burgess (US). Different grades of calcined clay could be achieved by blending LCC and HPCC in different proportions. According to Chen et al. [9], most of the 3D concrete printers have limited nozzle sizes and up to 2 mm of sand was used in many studies [2,8,33]. Therefore, fine aggregate with a maximum diameter size of 2 mm was also selected in this study. Figure 1 shows the cumulative particle size distribution of all dry components. HPCC had the smallest average particle size amongst all of the dry components in this study. LCC contained a relatively higher content of coarse particles. The chemical composition of dry components was analyzed by X-ray fluorescence spectrometry (XRF) shown in Table 1. For figuring out the contents of the reactive SiO2 and Al2O3 in LCC and HPCC, a chemical dissolution method was utilized [34]. A proper amount of calcined clay was dissolved in dilute hydrochloric acid solution and afterward treated with boiling sodium carbonate solution [35]. The insoluble residue (I.R.) was rinsed, heated to around 950 °C, and cooled to the room’s temperature (20 °C). Finally, the residue part was weighed by a scale and tested by XRF. The mass loss due to chemical dissolution can be regarded as the amorphous phase content. The amount of reactive SiO2 and Al2O3 is given in Table 2. The molar mass ratios of Si/Al in the reactive part of LCC and HPCC were 0.33 and 0.74 respectively.
Besides, a Polycarboxylate Ether (PCE) based superplasticizer (MasterGlenium® 51, BASF) was adopted in this research to achieve the required flowability, pumpability, and extrudability of mixtures. As described by Marchon et al. [36], superplasticizer could be used in the cementitious material to reduce yield stress and viscosity for enhancing the material workability at a constant solids volume. On the other hand, decreasing the water content at constant yield stress is also beneficial to reduce the porosity of the hardened cementitious material that contributes to improving the mechanical properties and durability. Currently, PCE is reported as the most effective superplasticizer for commercial use [35,36]. While superplasticizer is only used for adjusting printing properties such as pumpability and extrudability, it still requires other admixtures to retain the shape of the deposited material upon extrusion. Based on the research of Figueiredo et al. [37], Ma and Wang [38] and Kazemian et al. [23], adding a small portion of viscosity modifying admixture (VMA) is a method to improve the shape stability and buildability of the printed layers. In this study, Hydroxy Propyl Methyl Cellulose (HPMC) was selected as the VMA for increasing cohesion of the printable mixture.

2.2. Mix Designs and Preparation of Fresh Materials

The suitable binder-to-sand mass ratio (B/S) was 1:1.5 and water-to-binder ratio (W/B) was selected as 0.3. The B/S ratio adopted for this research was the same as the optimal mix design suggested by Le et al. [7] and Panda and Tan [33]. There were two reasons for keeping the W/B as 0.3. As previously reported in the literature [3,8], a printable cementitious mortar must have no slump but should offer sufficient workability. For most of our mix designs, 0.3 was a suitable W/B to ensure the sufficient workability of extrusion without the slump. Second, the smaller value of the W/B could contribute to a dense matrix with a lower capillary porosity and better mechanical performance. Lower W/B was also found in the 3D printable mortar proposals of Le et al. [7] (W/B = 0.26) and Ma et al. [32] (W/B = 0.27). As shown in Table 3, 60% of Portland cement was replaced by calcined clay and limestone in the binder mix. Based on the study of Antoni et al. [39], the limestone-to-MK weight proportion of 1:2 showed the highest compressive strength during the first 28 days of curing. Avet et al. [22] demonstrated that the calcined clay with more than 40% of MK in the ternary blend cement (30% of calcined clay, 15% of limestone, 50% of Portland cement and 5% of gypsum) were obtained the comparable compressive strength with plain Portland cement after 7 days. Therefore, in this paper, the mass ratio of limestone-to-calcined clay was also kept as 1:2 in the mix of MIX-L, MIX-M and MIX-H. L, M and H represented the calcined clay with a low (40–50%), medium (about 62.5%) and high (about 75%) dosage of MK. The HPCC was used to substitute 25% and 50% of LCC in mixtures MIX-M and MIX-H, respectively. According to Antoni et al. [39], up to 2 wt.% (of the binder mass) of PCE for mortar has no significant impact on the hydration kinetics of limestone and calcined clay cement. Thus, the maximum PCE content was regarded as approximately 17 kg/m3. Without adding VMA, the fresh mixture showed similar properties as the self-compacting mortar. Based on test experiences [37], the VMA content was selected as 0.24 wt.% of the total binder mass to retain the initial printing shape. The mix design named MIX-R used LF to replace all calcined clay. MIX-R was not designed for printing, and its function was to determine the role of calcined clay on mechanical performance. Thus, MIX-R was only investigated by the penetration resistance test and compressive strength test (1, 7 and 28 days). For all tests in this paper, the fresh mortar samples were prepared following the mixing procedures of Table 4. Moreover, the time zero (t = 0) was defined as the time when the suspension (water and PCE) was added into the dry mixtures.

2.3. Penetration Resistance Test
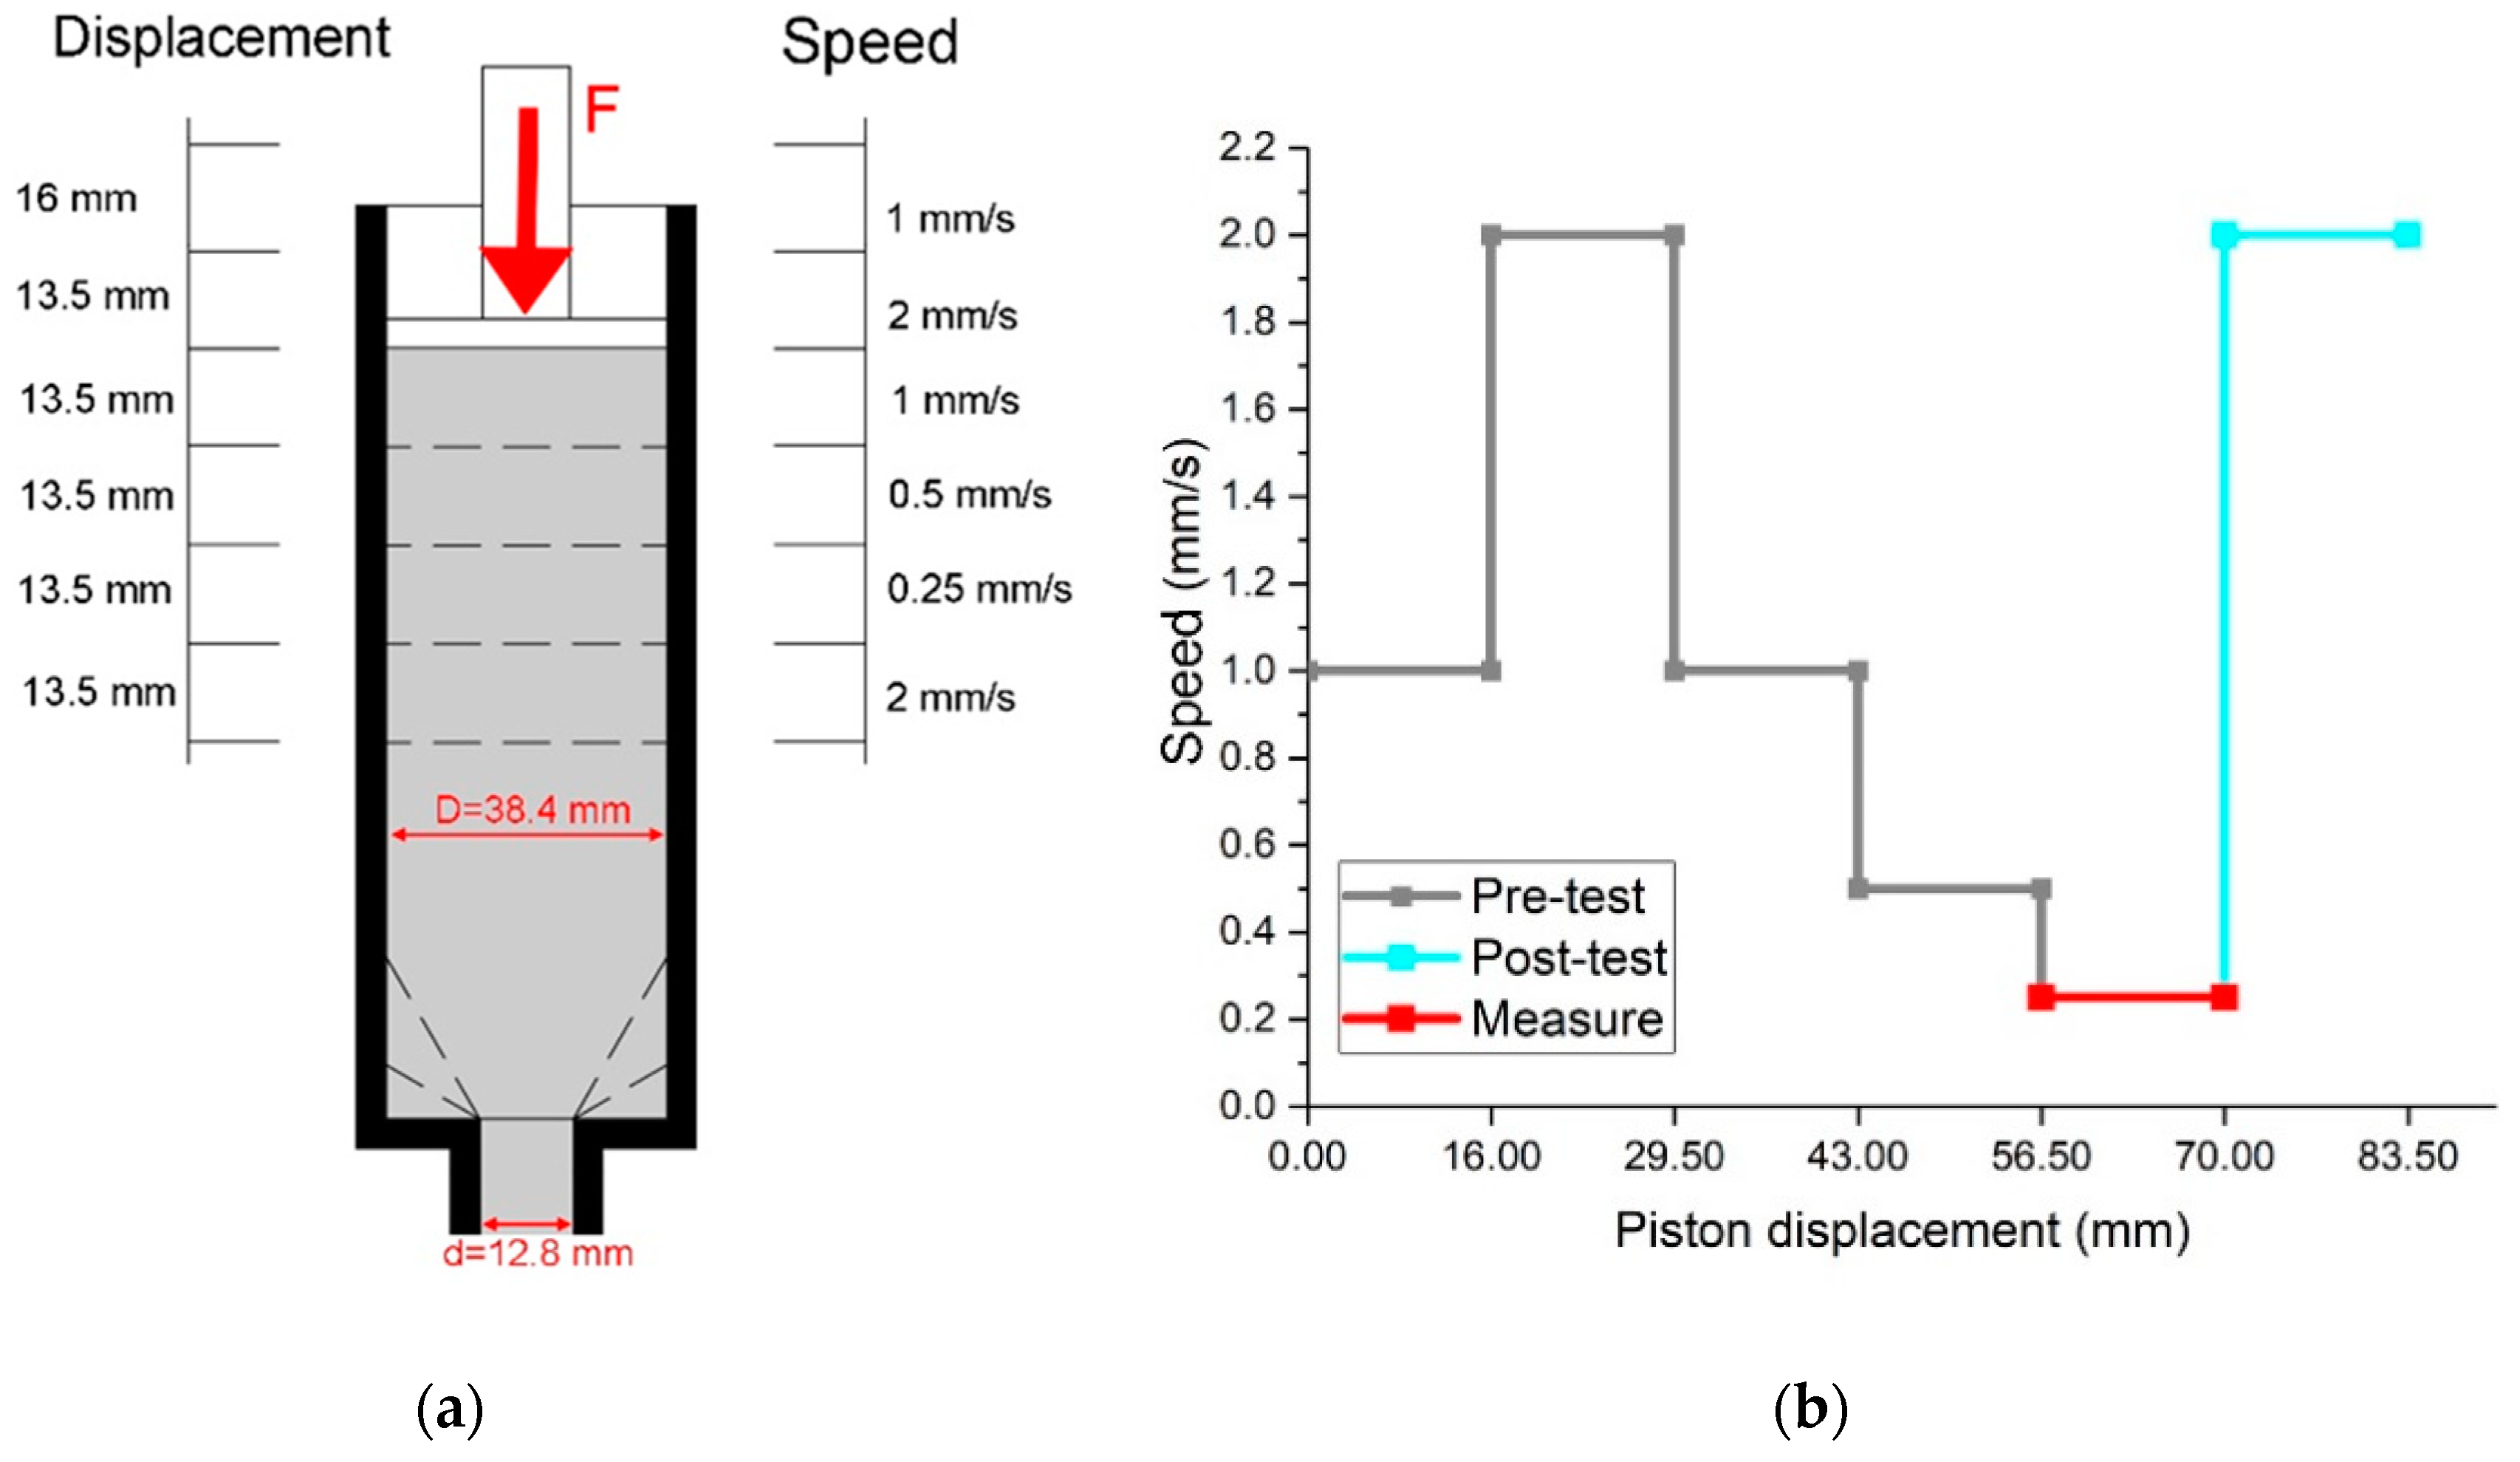
An automatic Vicat apparatus was used to determine the stiffness development and setting time of different mix designs. To investigate the structural build-up behaviors of cementitious materials, a penetration resistance test was used by Ma et al. [32]. In this paper, the entire test was performed under the specifications of NEN-EN 196-3 [40]. Before the initial set (penetration depth > 36.5 mm), the Vicat needle dropped automatically after every 10 min. Once the penetration depth was equal to or smaller than 36.5 mm, the next drop period was decreased to 5 min. In total there were 44 drops for each specimen.

2.4. Extrusion Test

The primary objective of this test was to quantify the change of extrusion pressure by using different mixtures at different ages. As shown in Figure 2, the ram extruder contains four stainless steel components: a stand, a long die with the round opening (inner-diameter: 12.8 mm, length: 102.4 mm), a barrel (inner-diameter: 38.4 mm, length: 125 mm) and a piston. In this case, the ram extruder is built on the Instron universal testing machine that can apply the extrusion force and record the test results. For each experiment, 1 L of fresh mortar that was prepared as given in Table 4. After the mixing process, the required volume (about 0.16 L) of fresh material was filled into the barrel and die. The remaining material was collected into a sealed plastic bag. Before performing the extrusion test, a Fluon ring was inserted in the notch of the piston. The surface of the piston and Fluon ring were lubricated by Dow Corning® 7 Release Compound to reduce the friction between the piston and barrel. The test was controlled by the actuator at a predefined speed for a specific displacement. As shown in Figure 3, the pre-test starts from the displacement of 0 mm to 56.5 mm. The piston moves into the barrel at 1 mm/s in the first stage (0 mm to 16 mm). Afterward, different speeds (2, 1, and 0.5 mm/s) were continuously performed to apply sufficient shear stress in the material. From the displacement of 56.5 mm to 70 mm, data readings were collected under 0.25 mm/s of loading rate. It has been found that 13.5 mm was long enough to get a steady-state regime of the extrusion process under the speed of 0.25 mm/s. Finally, the test ended at 2 mm/s to the maximum displacement of 83.5 mm. In total, the test duration was approximately 2 minutes. For each mix design, the material was tested at different ages, t = 10, 25, 45, 60, 90, 120, and 150 min. The test can be terminated earlier if the mixture has a relatively short initial setting time. Three repeated tests for every mix design were conducted to achieve the average results. The testing took place entirely under the same environmental condition (temperature: 20 ± 2 °C; relative humidity: 50 ± 5%). A high-resolution camera was used to take pictures of the final product of the extrusion test. Those filaments were used to assess the printing quality of the evaluated mixtures.

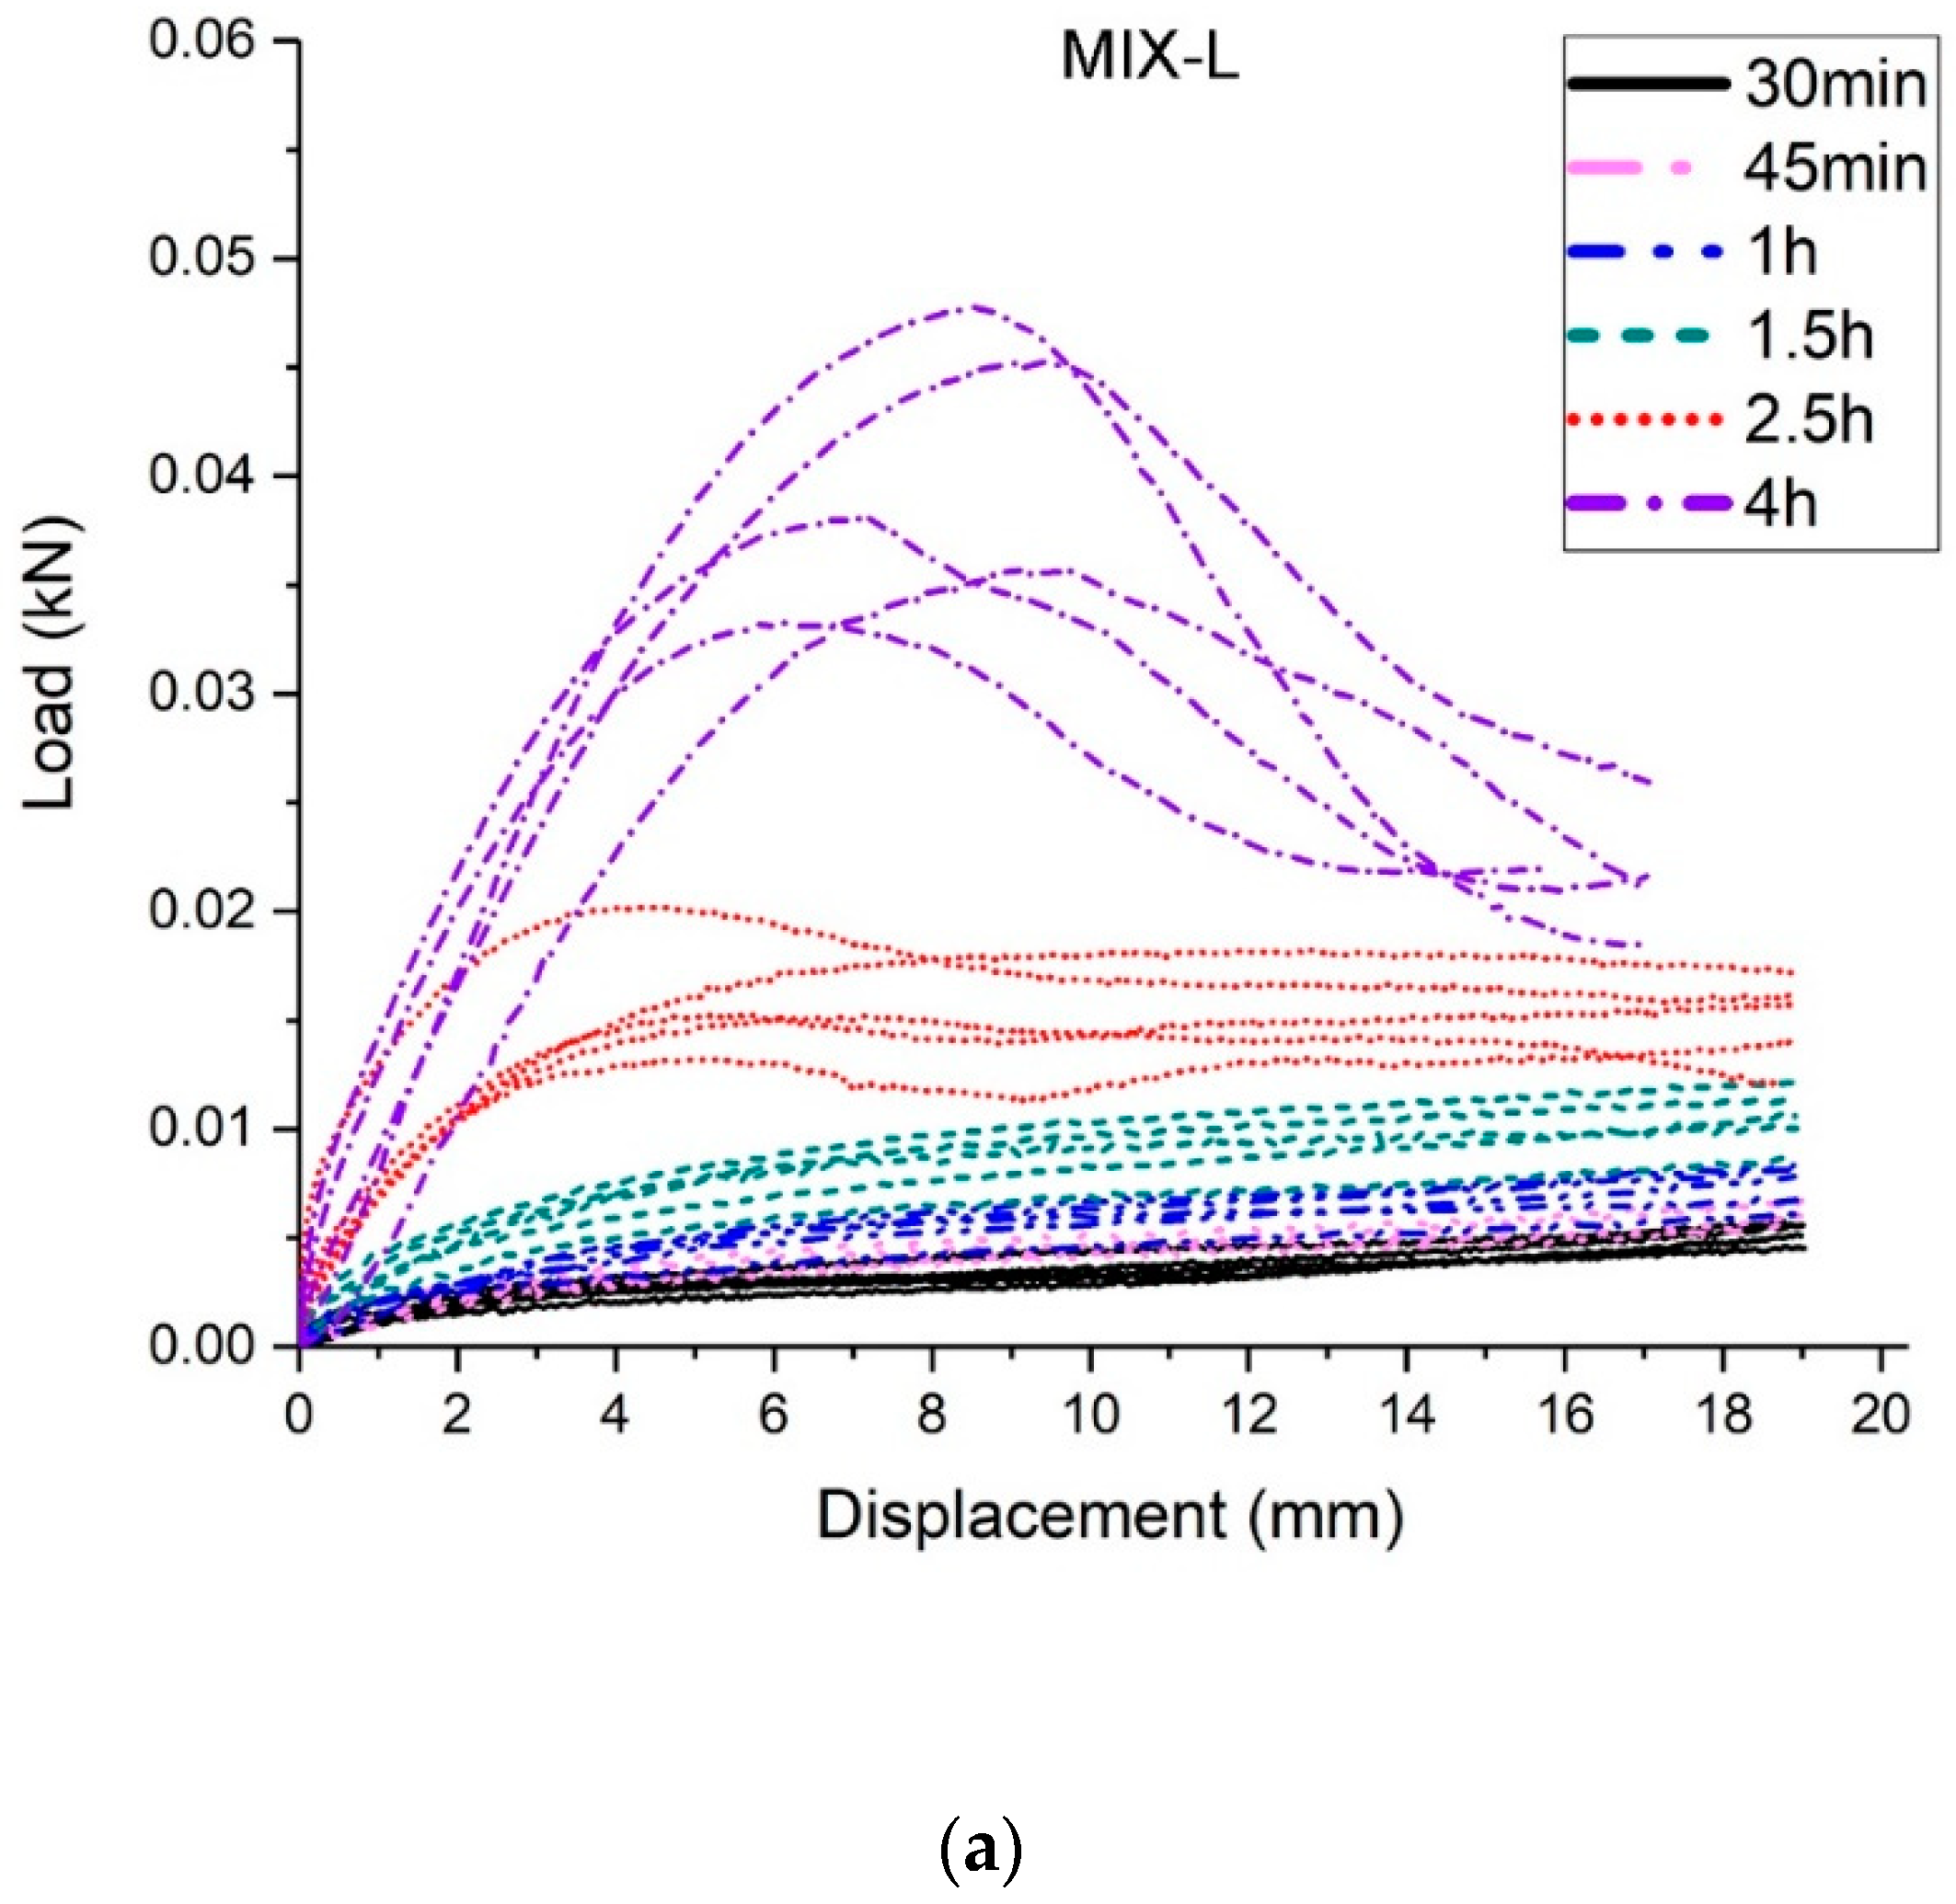
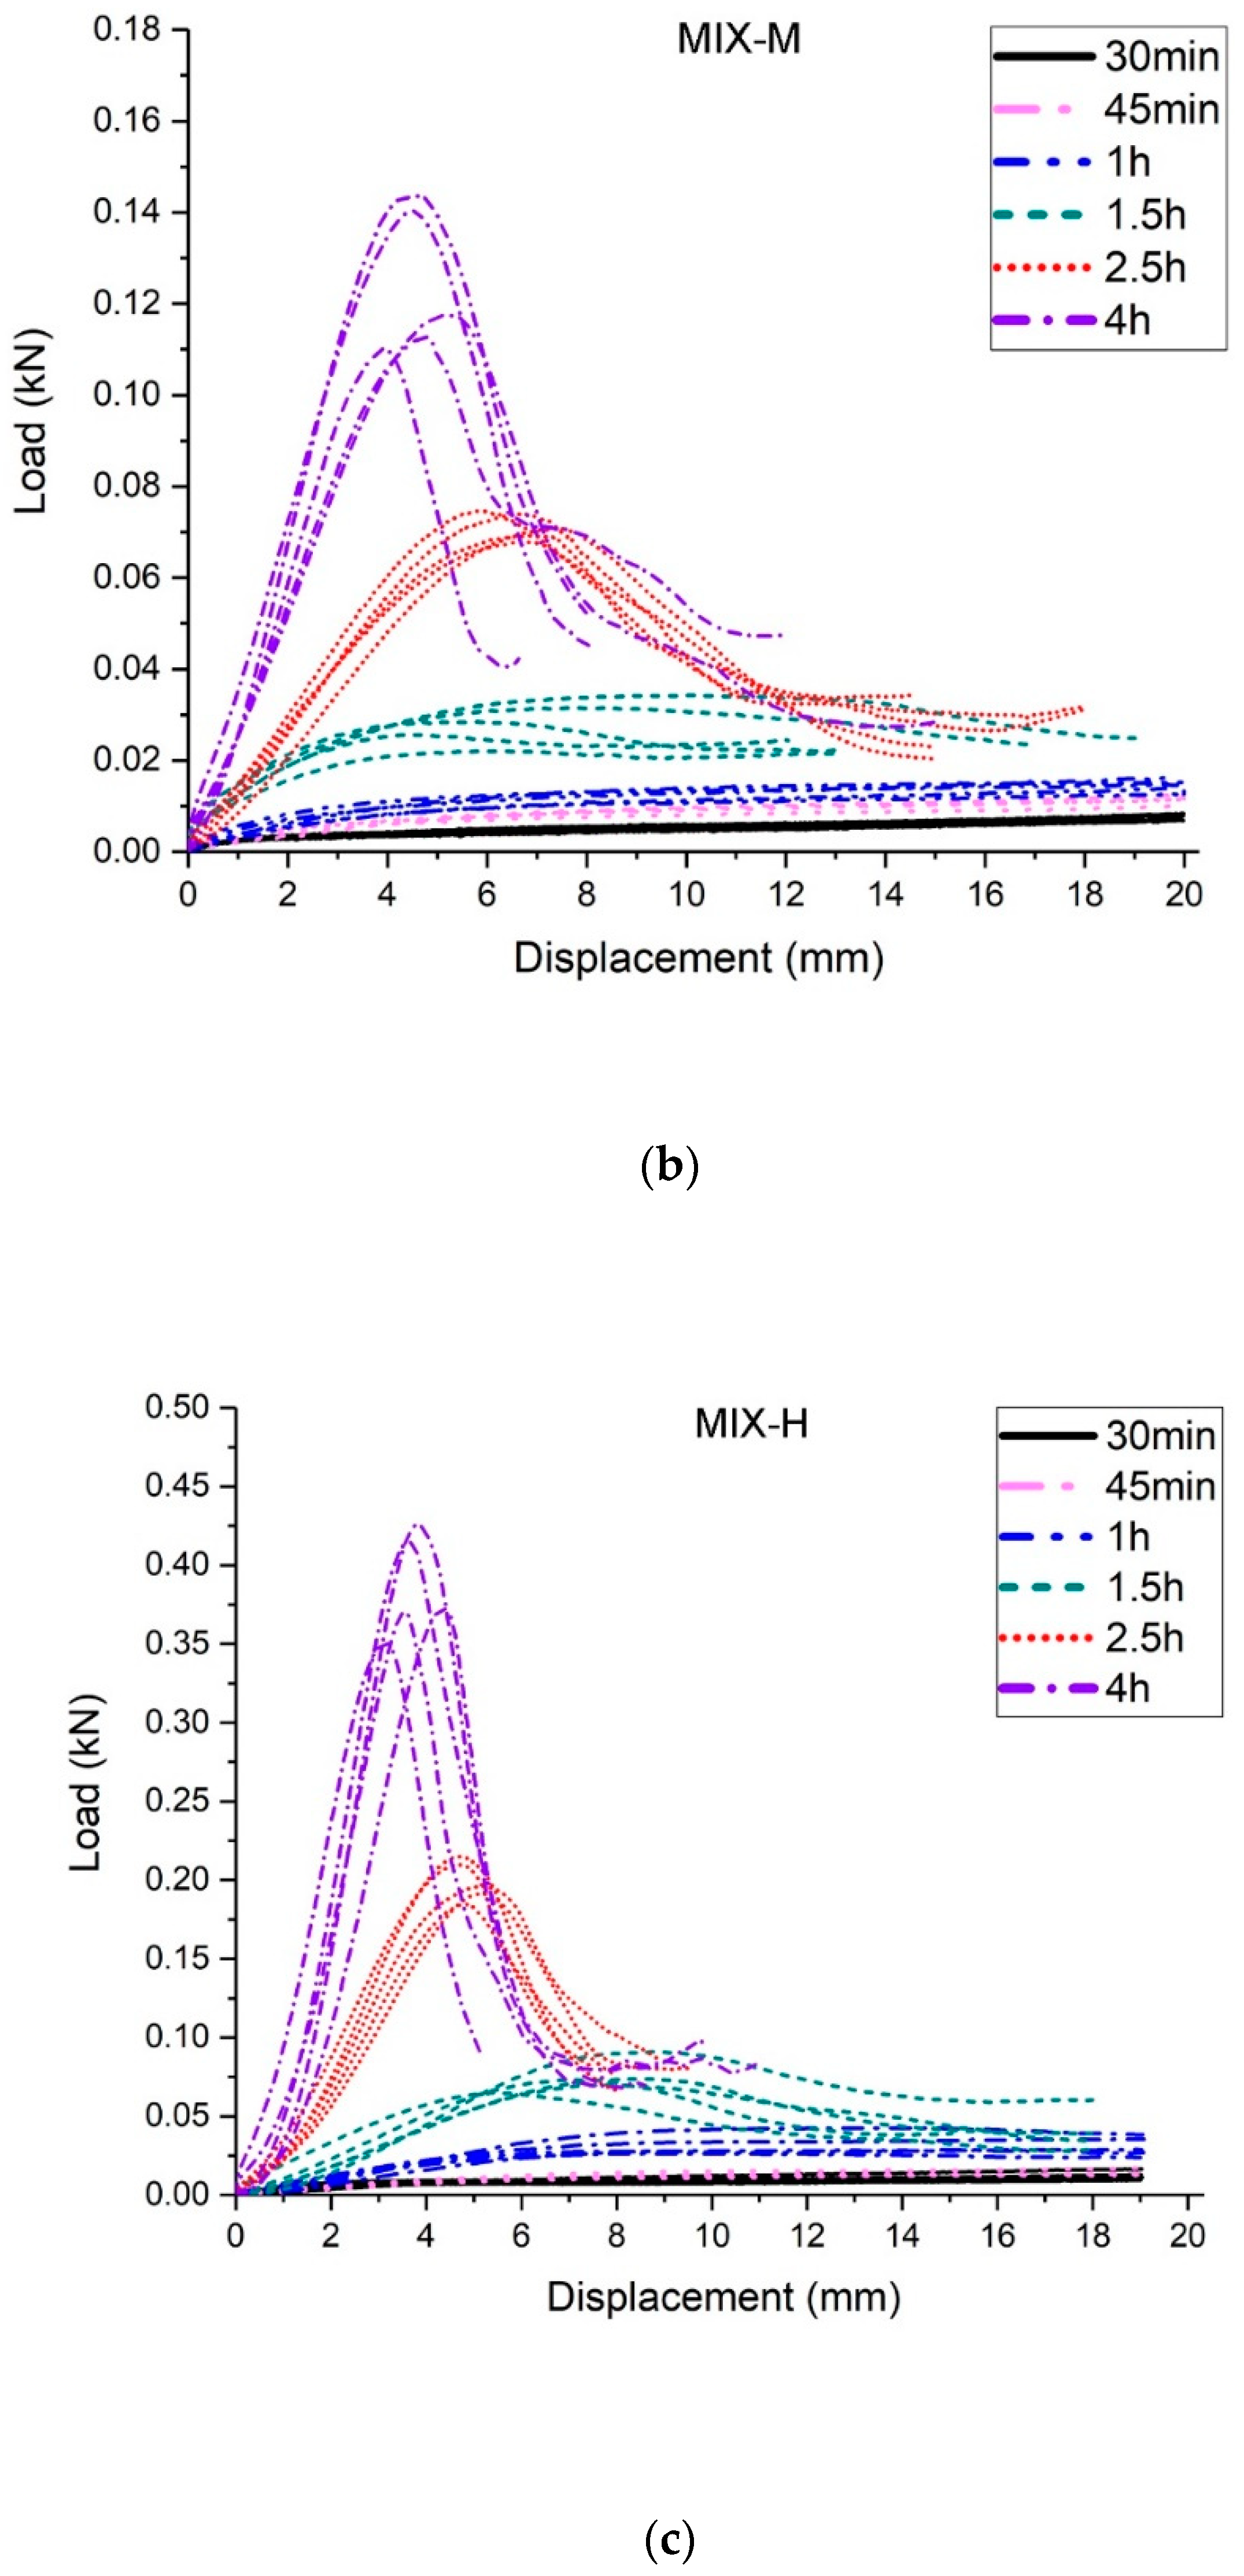
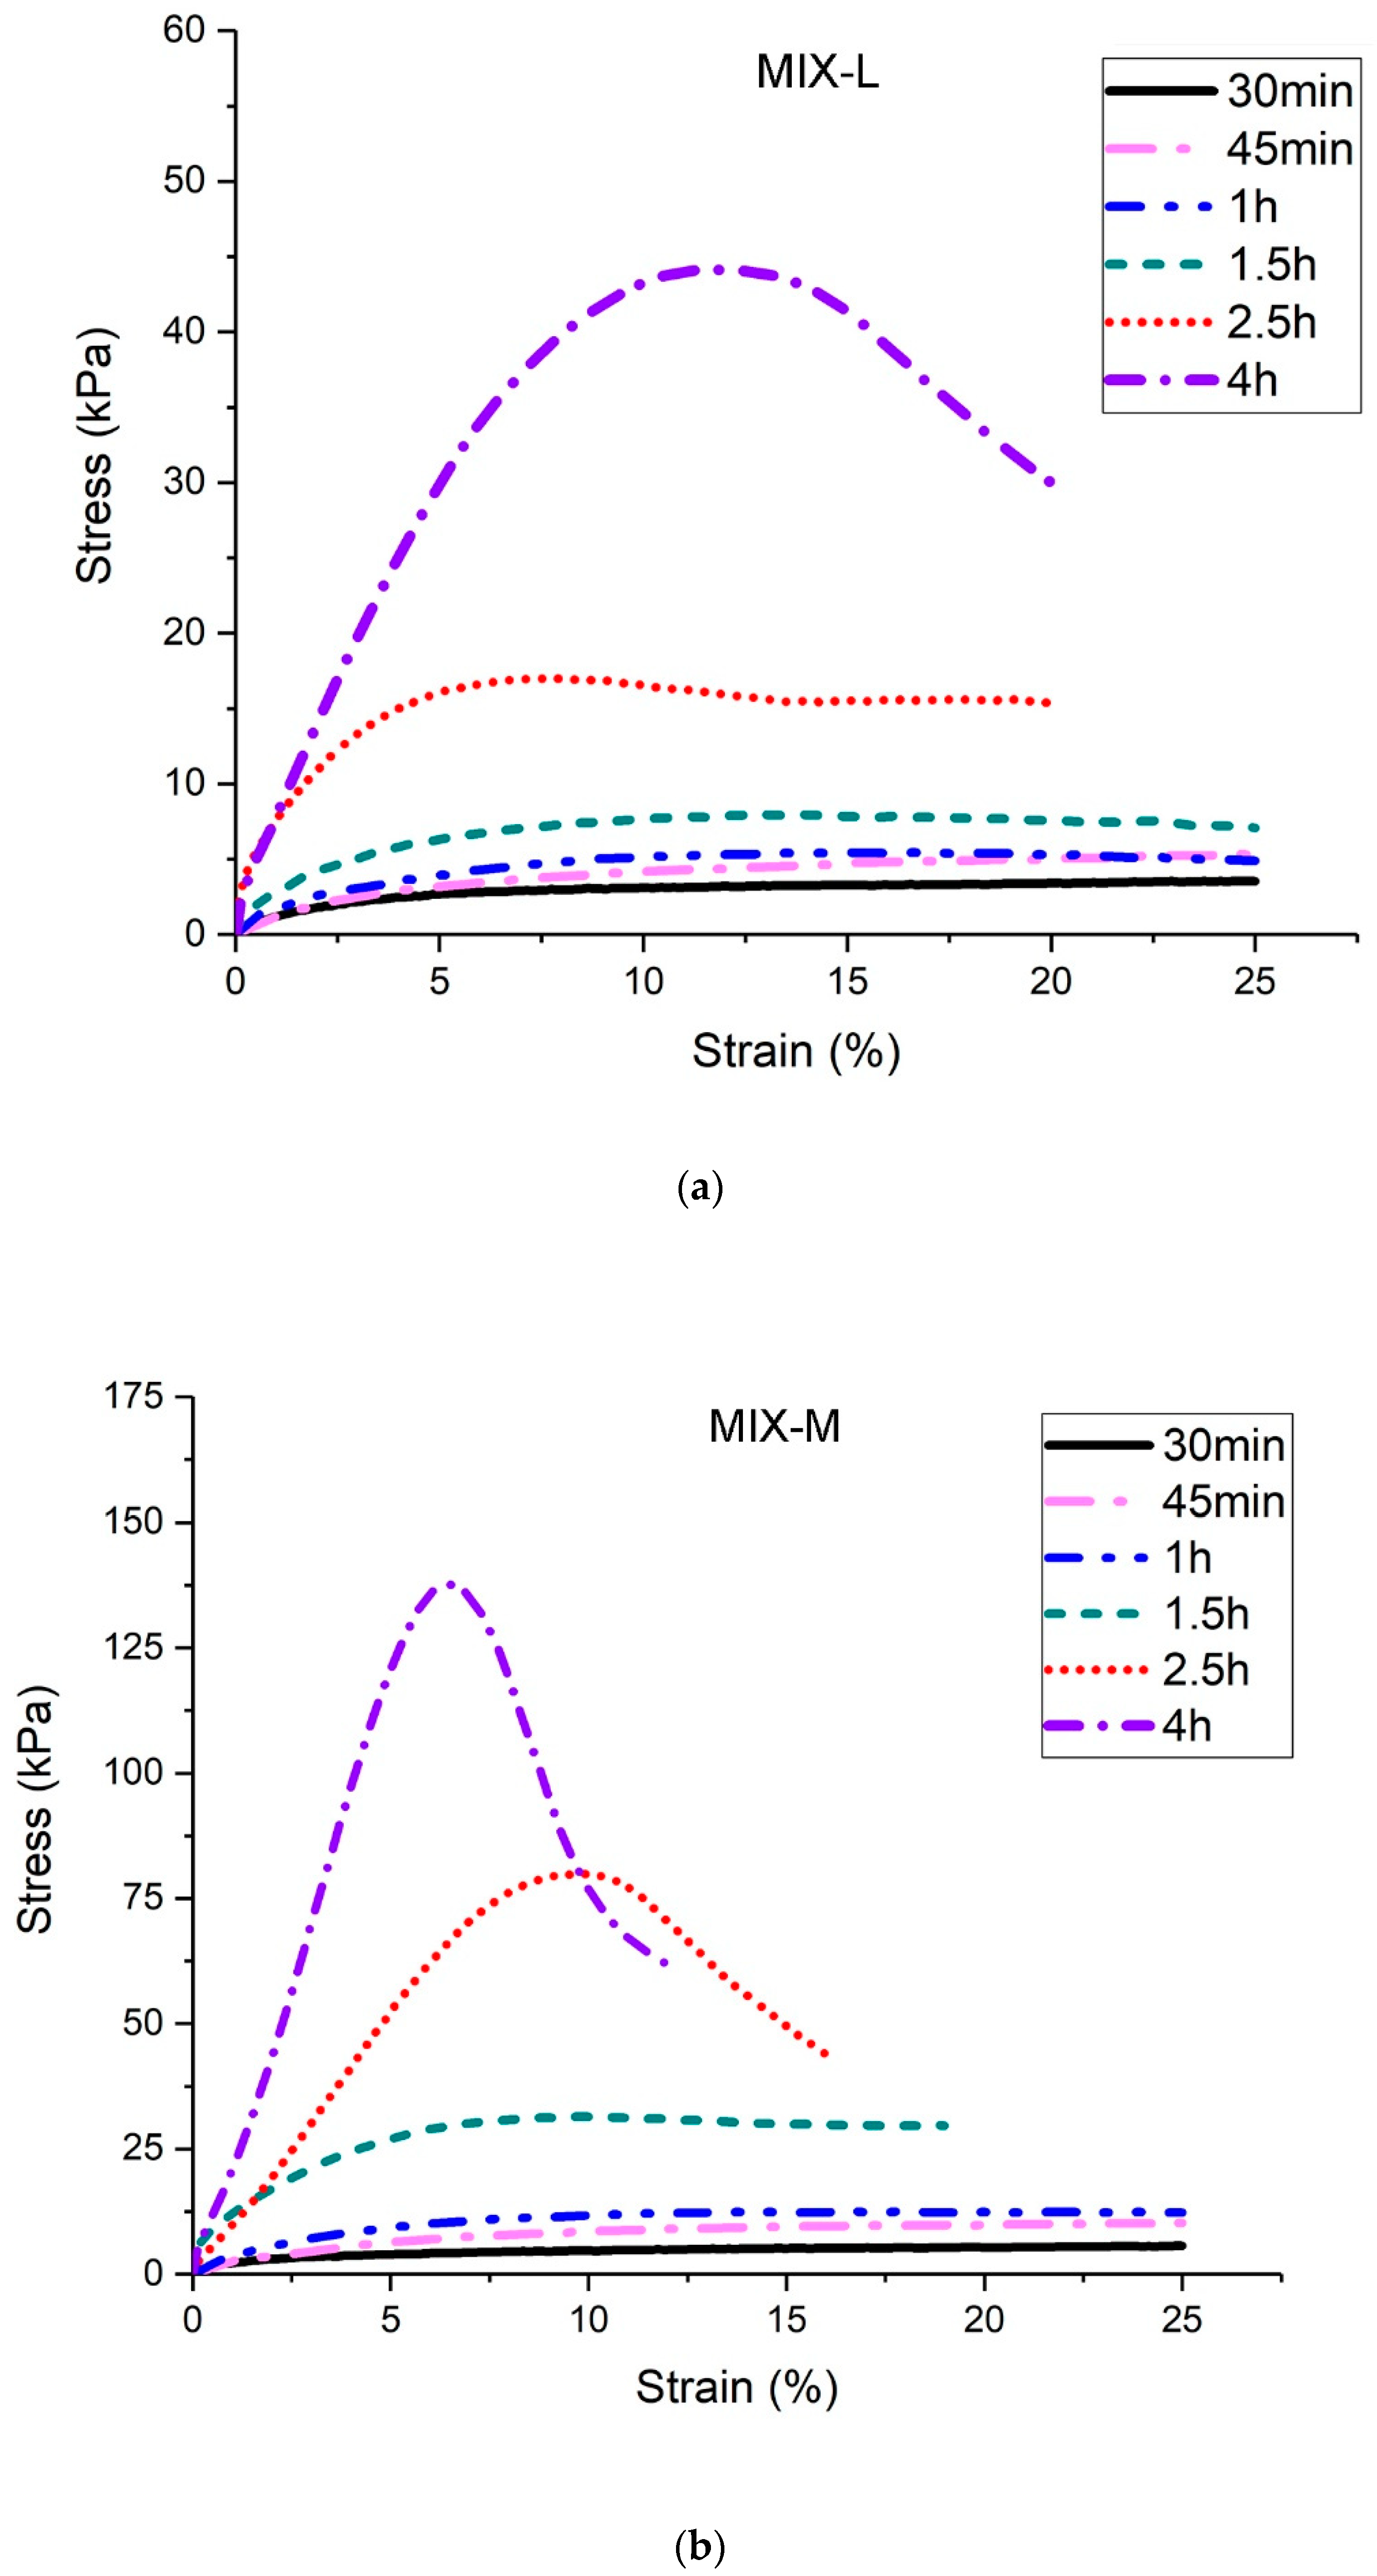
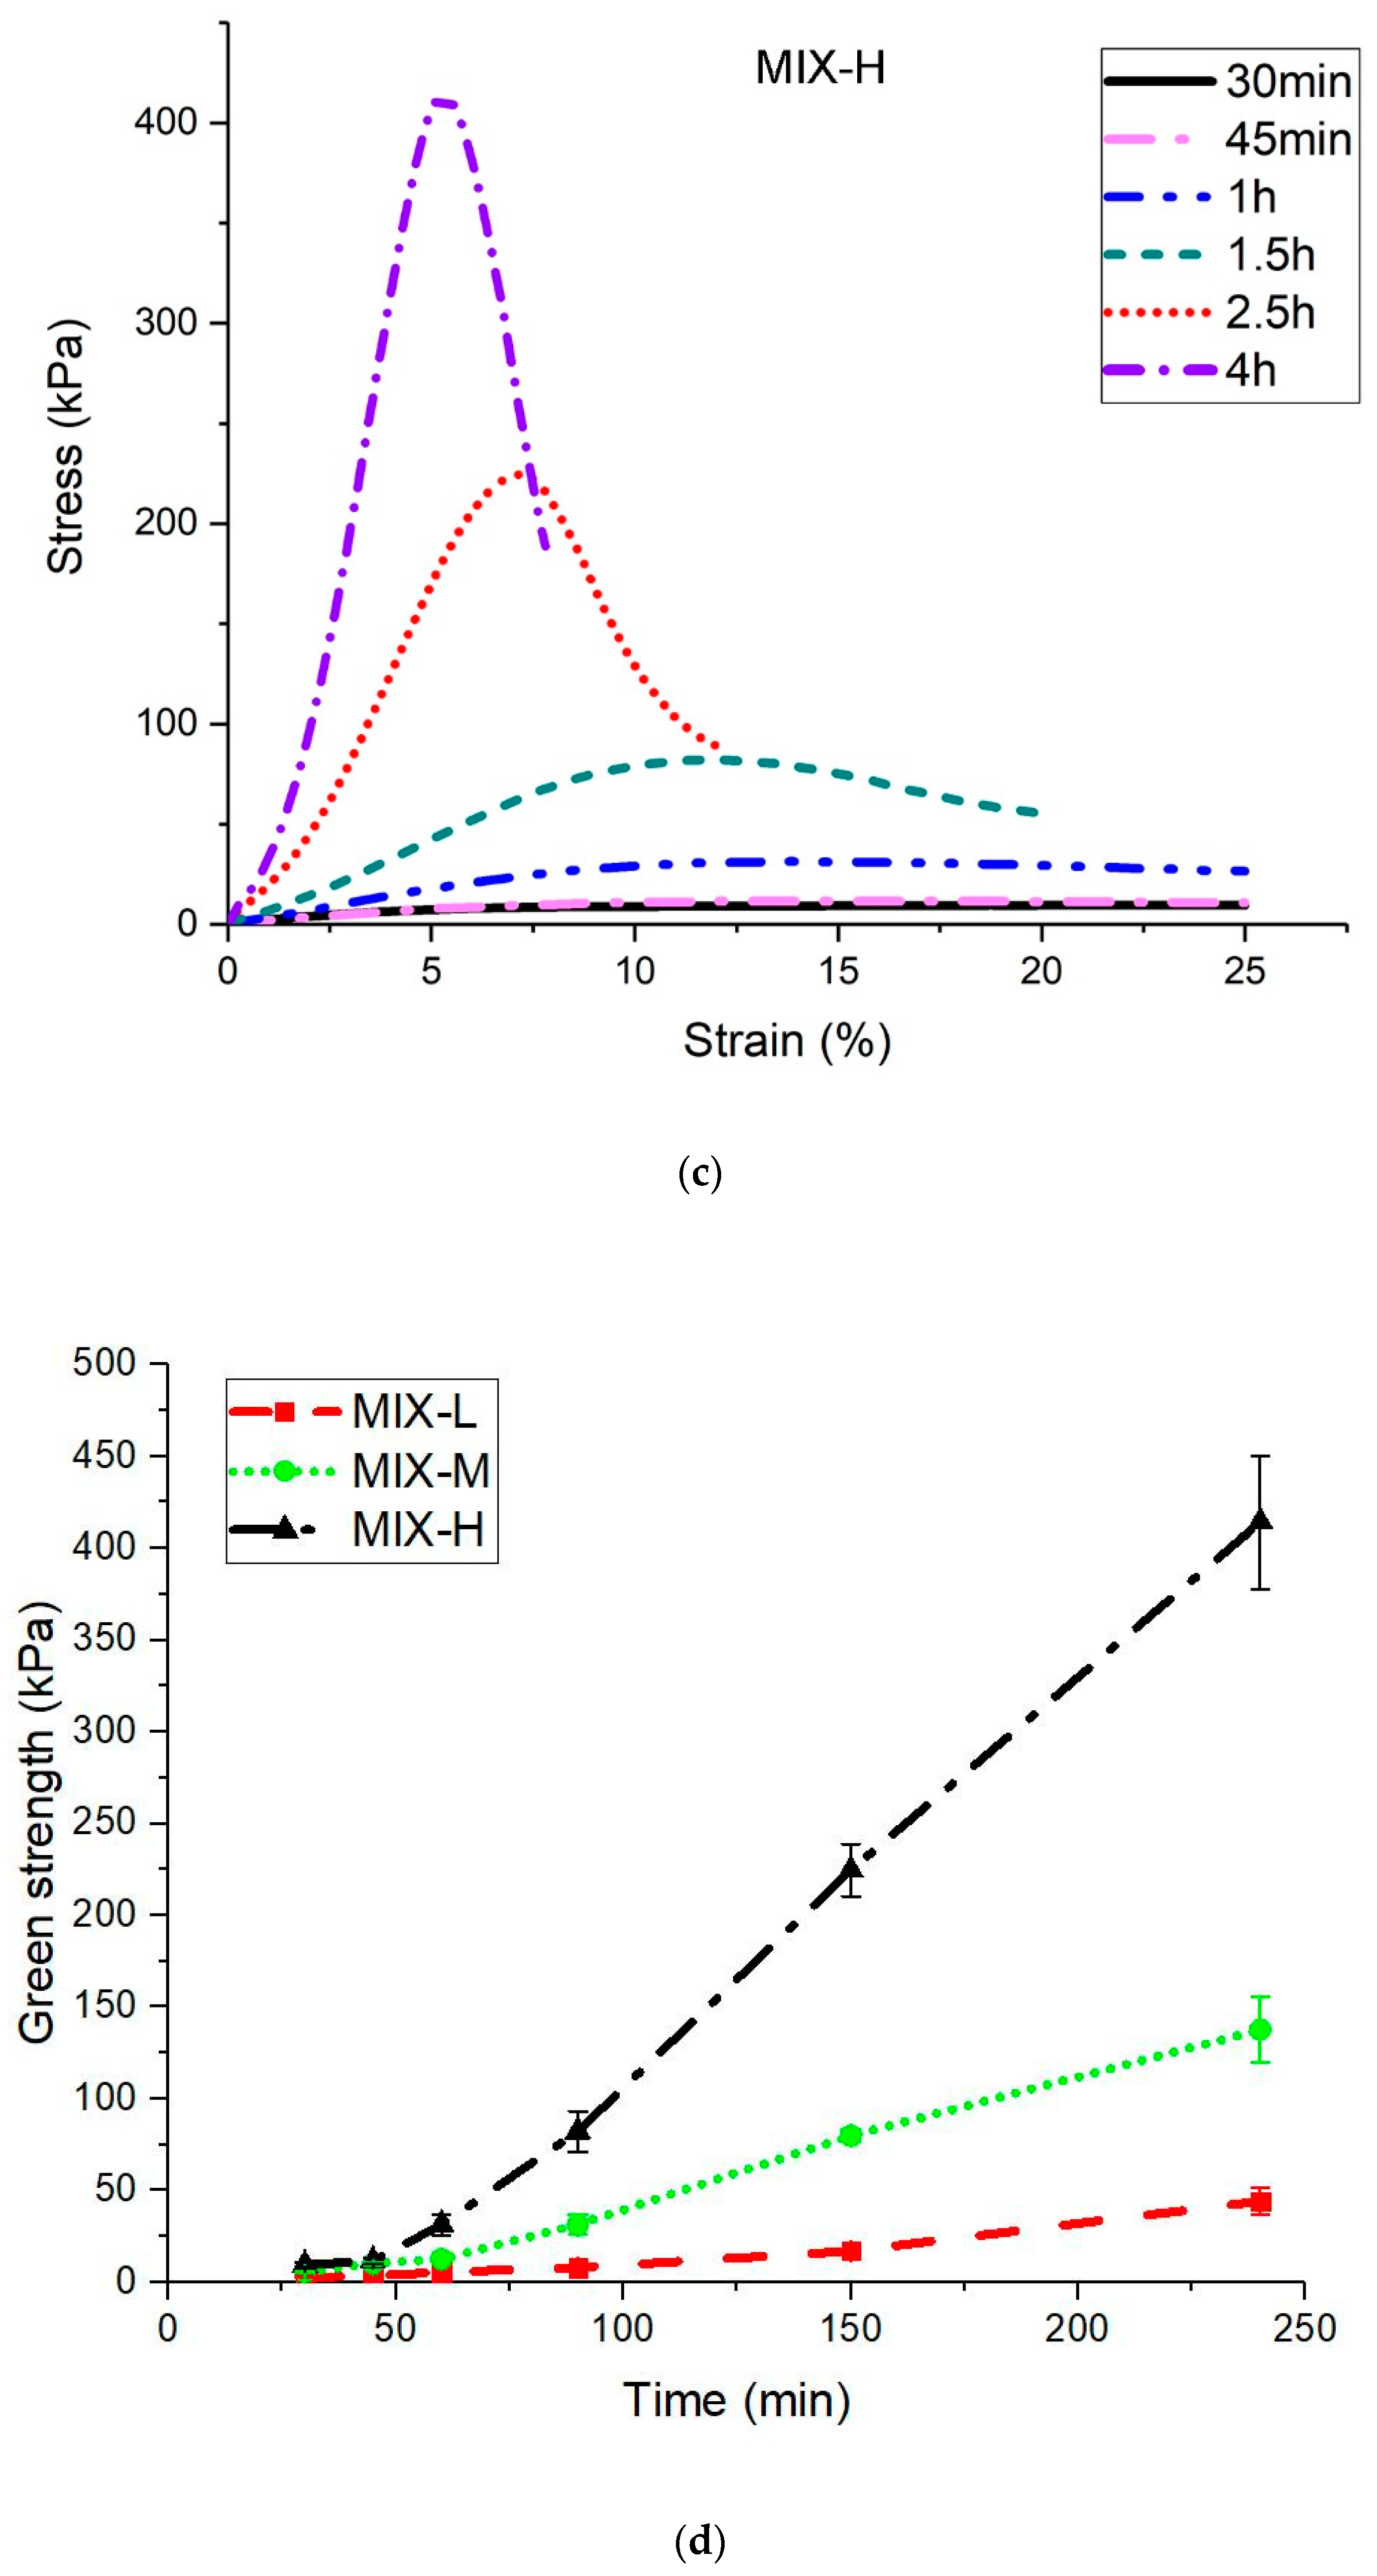
2.5. Green Strength Test

Plastic cylindrical molds with internal diameter (d) of 33.5 mm and 67.5 mm height (h) were used to make samples to investigate the green strength of the fresh mixtures. As Wolfs et al. [30] mentioned, nearly h = 2d can satisfy the requirement of forming a diagonal shear failure plane. Before pouring the fresh mortar, a silicon spray was used to coat the interior surface of molds for easily demolding later. All of the fresh samples were compacted on a vibration table with 30 Hz for 6–8s to reduce air bubbles. The samples were covered by a plastic film and carefully demolded just 30s earlier before performing the uniaxial unconfined compression test. For each mix design proposal, the samples were tested at the ages of t = 30, 45, 60, 90, 150, and 240 min (4 h). Five specimens were prepared for each fresh mortar age. 30 specimens for testing per mixture. The same Instron universal testing machine, equipped with a 10 kN load cell and employed for the extrusion tests was also used for the green strength assessment. A double layer of plastic film covered both sides of a sample. The Polytetrafluoroethylene (PTFE) spray was applied between two plastic sheets to reduce the friction between the sample and base plates. The tests were conducted using displacement control at a rate of 0.2 mm/s. The maximum displacement was 20 mm. Each test took about 2min in total and strain values up to 30% were eventually achieved. A short test is preferable to preserve the fresh properties of the material under evaluation. The casting and test processes were performed under the same environmental condition (temperature: 20 ± 2 °C; relative humidity: 50 ± 5%). A high-resolution camera was used to acquire images during the mechanical test. Vertical and lateral deformations were obtained by image analysis using ImageJ. The cross-section of each sample was determined through a MATLAB-code.

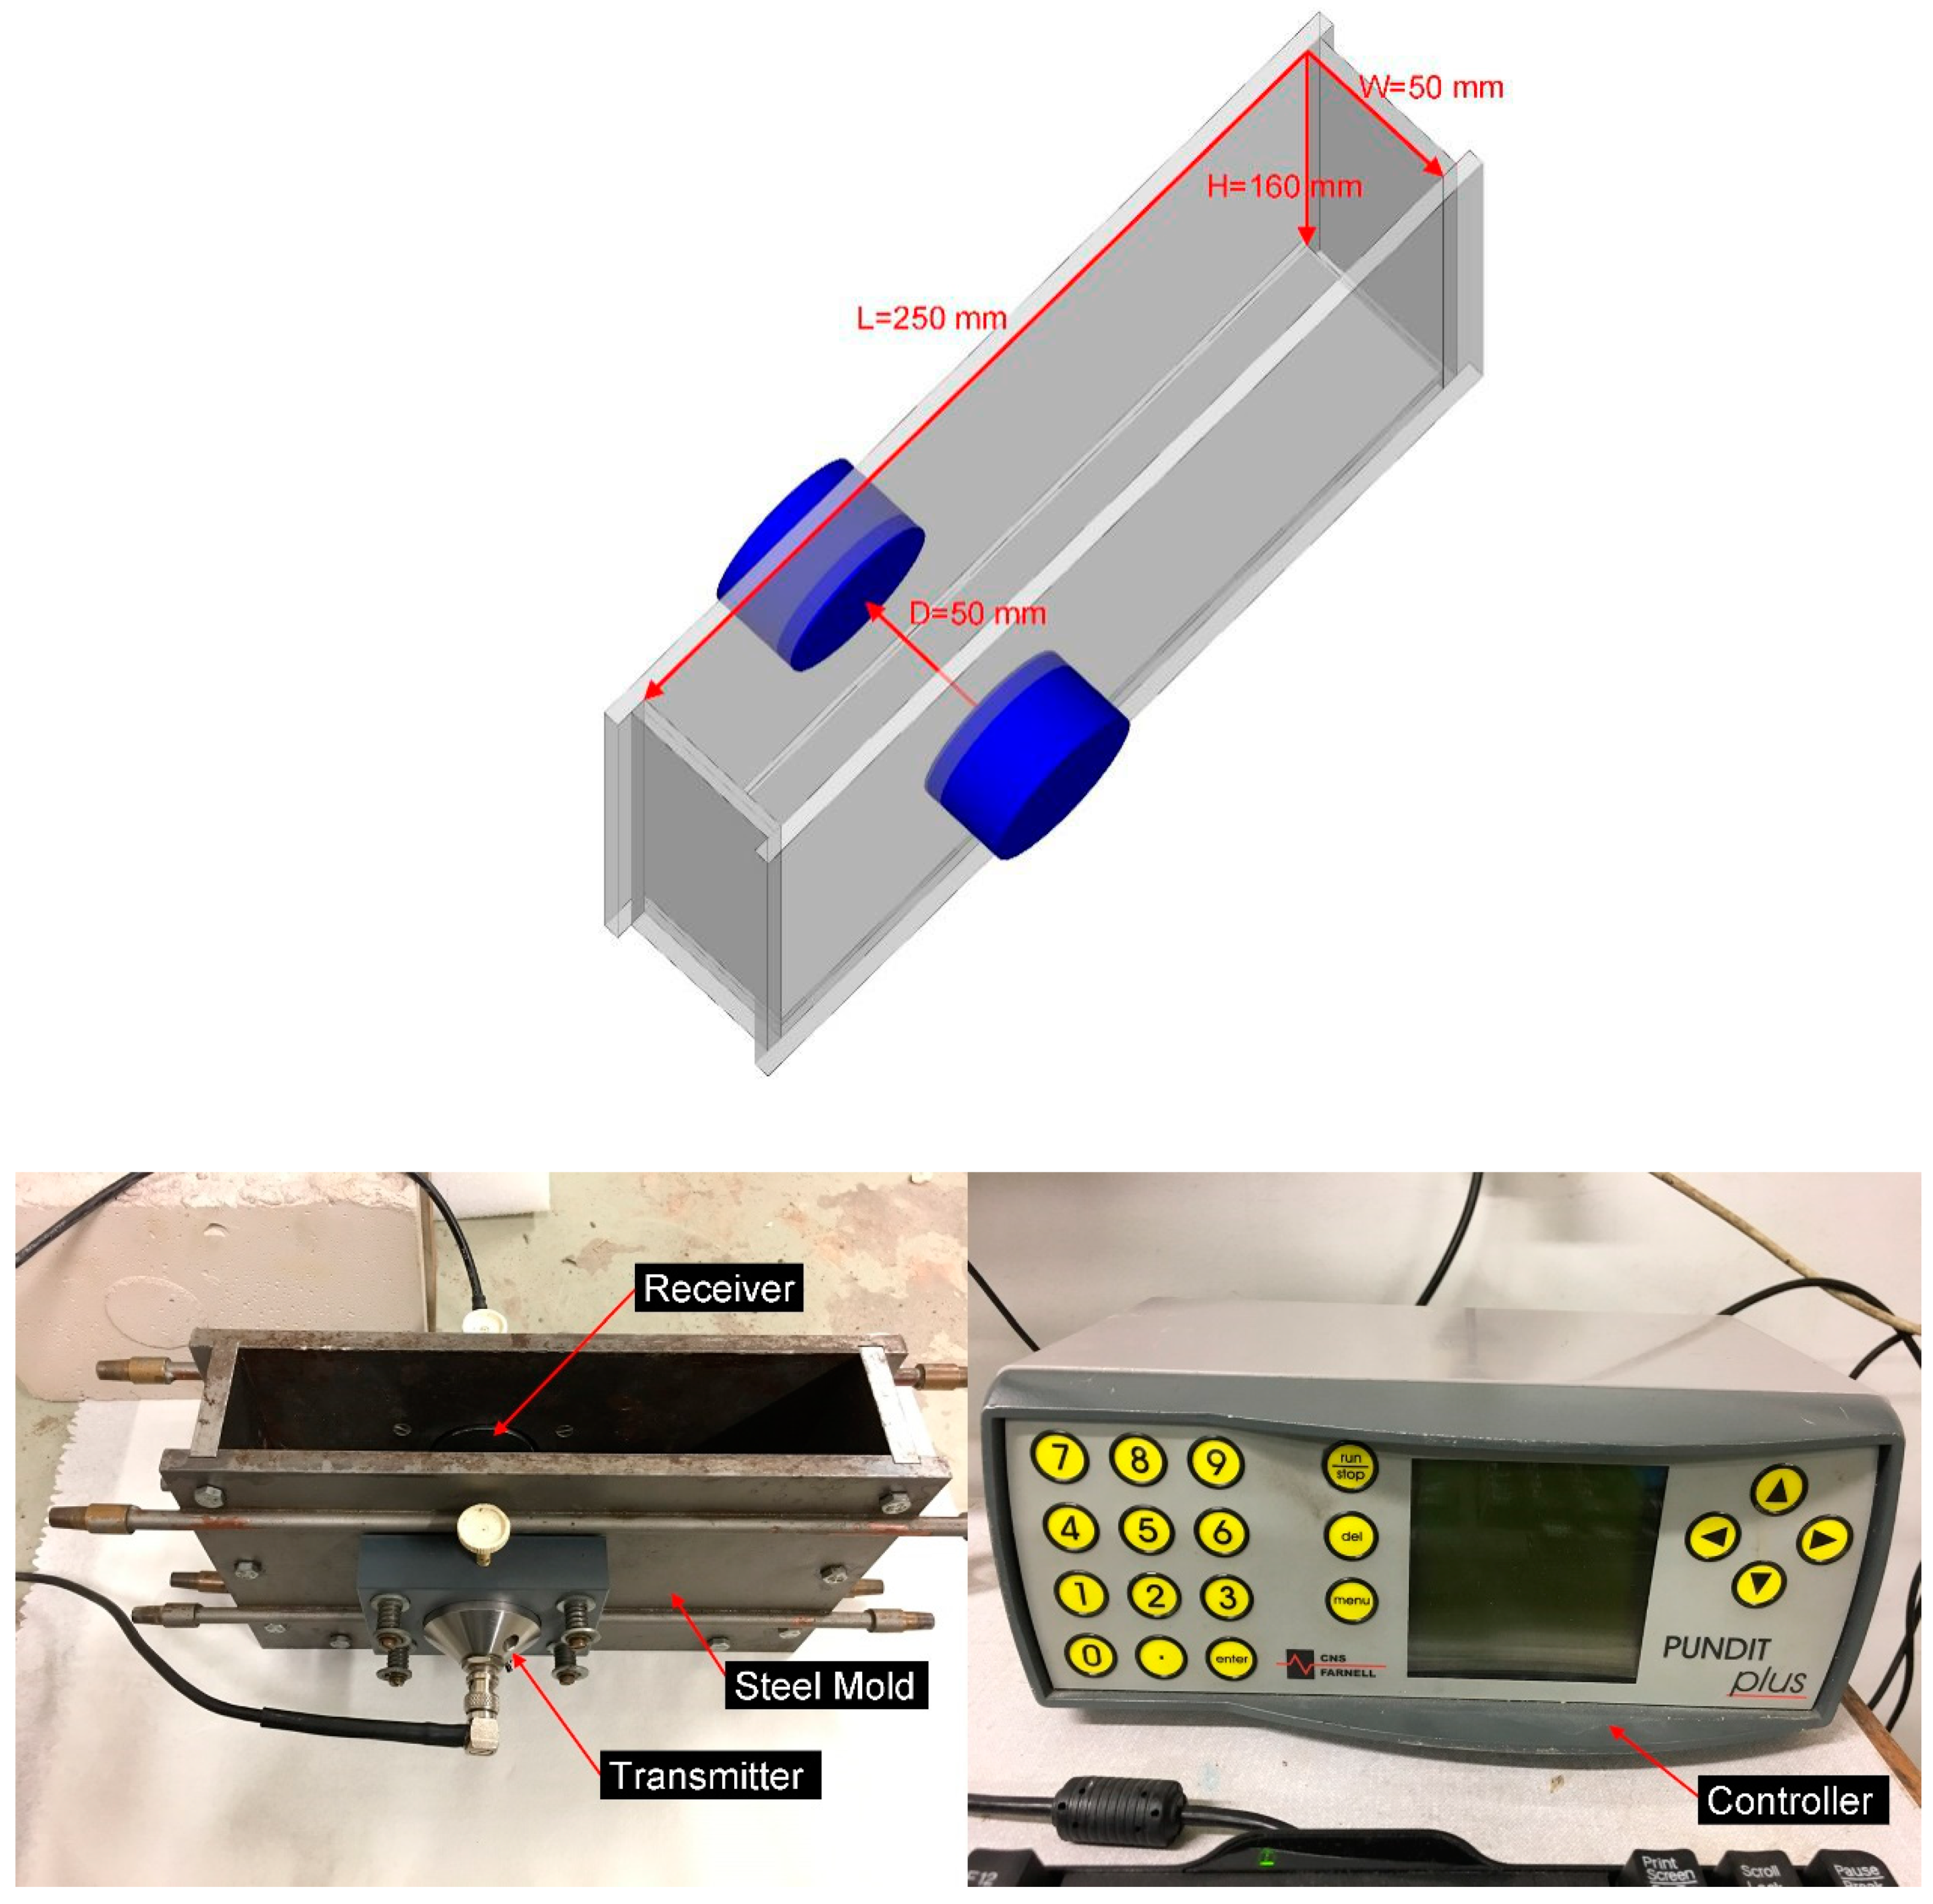
2.6. Ultrasonic Pulse Velocity Test

This test was performed based on NEN-EN 12504-4 [41] and Wolfs et al. [31]. A Pundit ultrasonic pulse velocity test apparatus which could transmit and receive longitudinal wave (P-wave) was used. For keeping the constant test time of green strength test, the fresh mortar specimen was tested in the periods from 30 to 240 min. As shown in Figure 4, the ultrasonic pulse velocity test system contains a transmitter, a receiver and a steel rectangle mold with internal length (250 mm), width (50 mm) and height (160 mm). The transmitter and receiver were placed and fixed on both sides of the mold with a distance of 50 mm. After pouring the fresh mortar into the mold, the sample was compacted by jolting 5 times to attain the homogeneous state. A thin plastic sheet was used to cover the sample to avoid water loss during the test. Within the test periods (4 h), one P-wave was sent per second. With the hardening of mortar, the transmitting time of P-wave was getting shorter. The P-wave velocity (v) can be calculated by v = D/t, where D (50 mm) is the distance between the transmitter and receiver, t is the transmitting time. For each mix design, 3 times of repeated ultrasonic pulse velocity test were conducted to get the average result. All tests were performed in similar environmental conditions with Section 2.5.

2.7. Compressive Strength Test

Compressive strength values were measured on mold-cast specimens. Mold-cast specimens were cured and stored at the fog room (20 ± 2 °C, above 99% RH) and tested at 1, 7 and 28 days to monitor the development of compressive strength with time. 6 samples were prepared for each mix design at the same age. All samples were tested in accordance with the specifications of NEN-EN 196-1 [42]. The loading rate was kept at 2.4 kN/s for each trial.

3. Results and Discussion

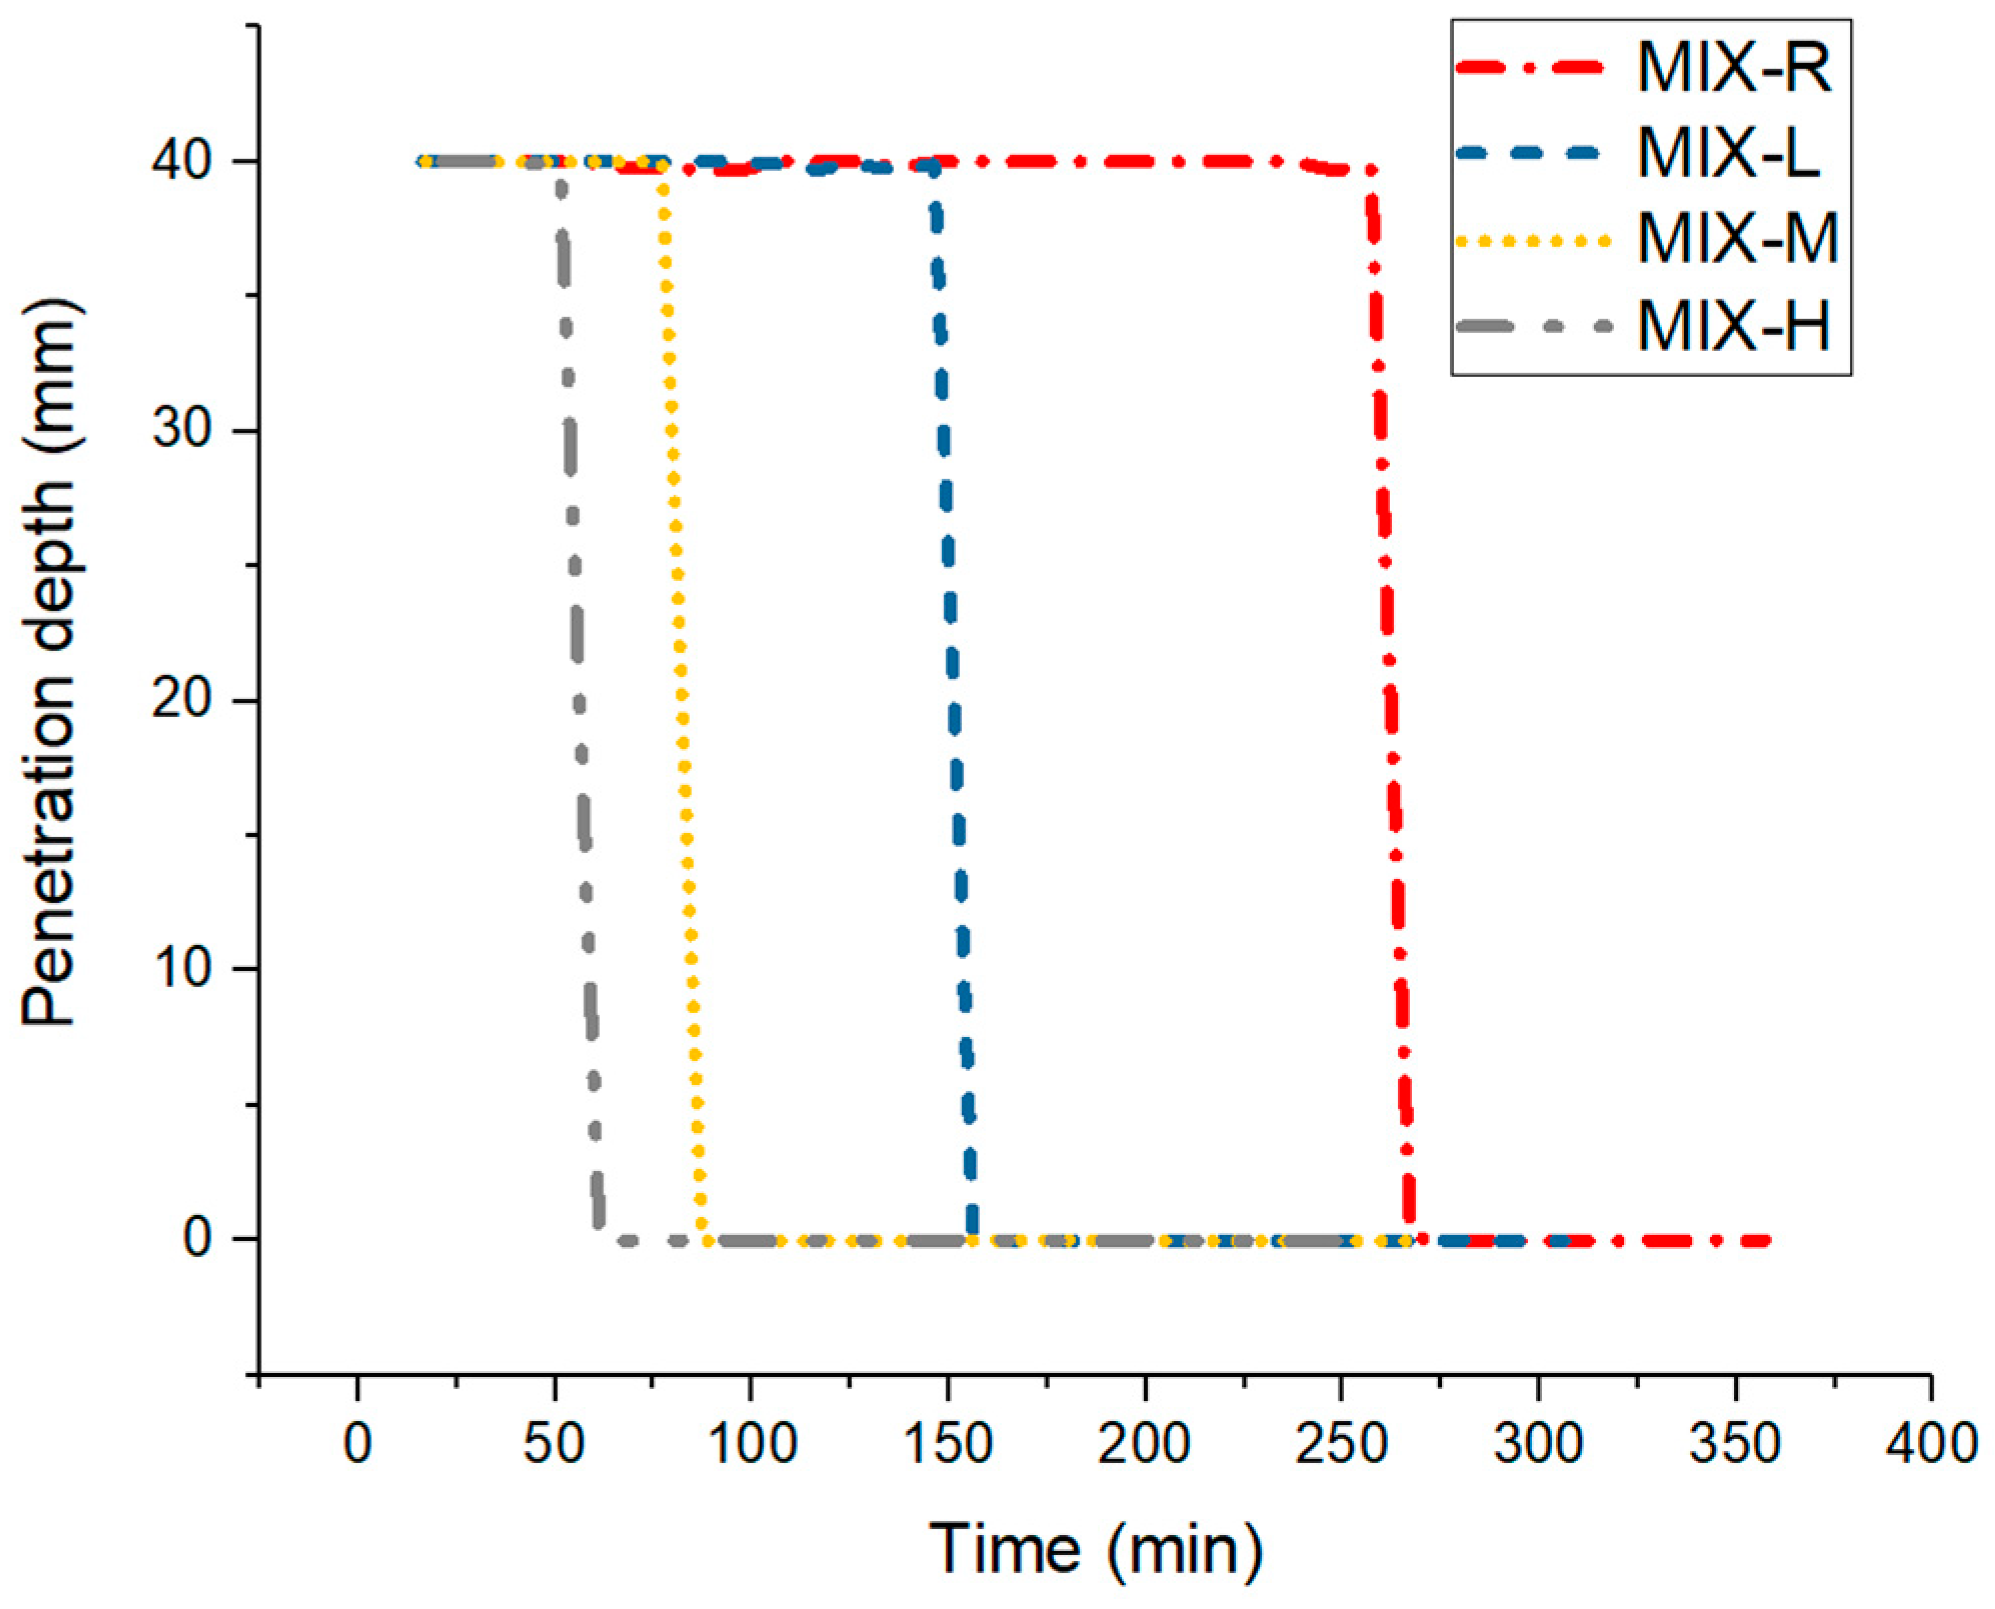
3.1. Penetration Resistance Test
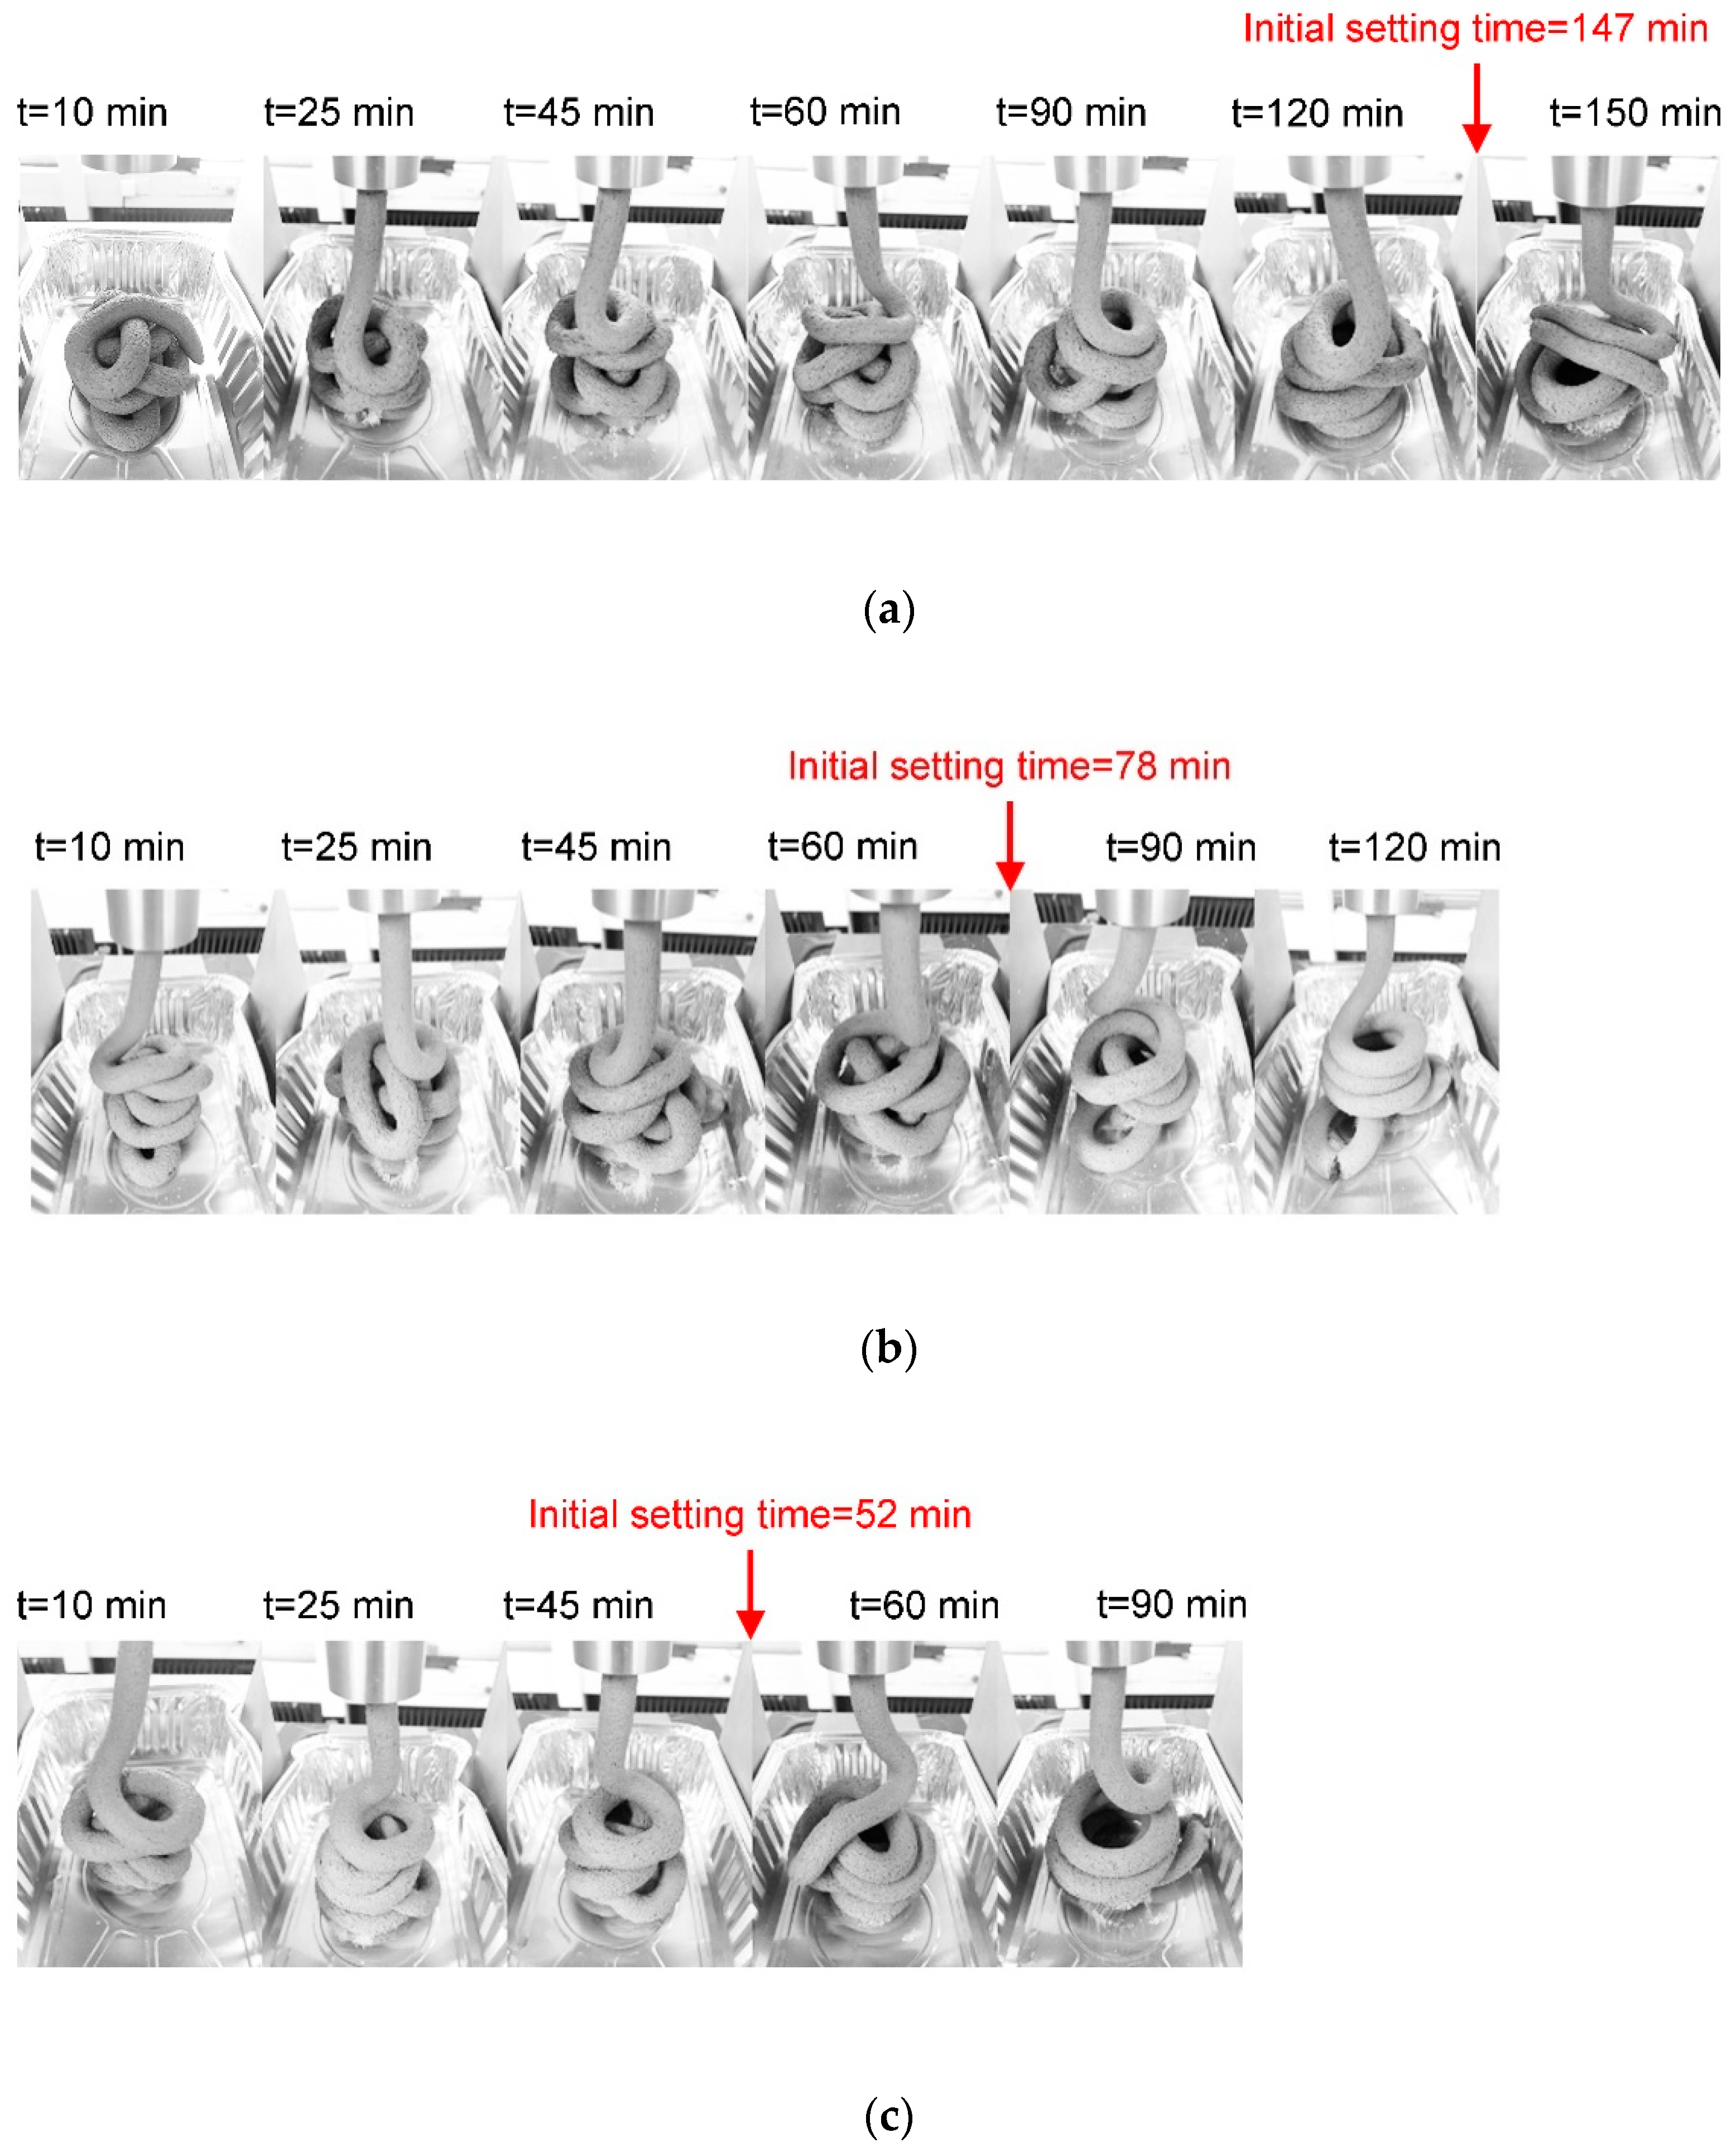
The penetration resistance test results of all mix designs are shown in Figure 5. It was found that the transfer time between 40 mm and 0 mm of penetration depth is very short for all mix designs in this study. The sudden stiffening phase change may be attributed to the presence of VMA, which could prolong the initial setting time and has a small impact on the final set. Based on this test, it is not possible to measure the initial and final setting time for these mixtures precisely. The initial setting time of mixtures MIX-L, MIX-M and MIX-H are about 52, 78, and 147 min, respectively. The initial setting time was significantly reduced by increasing the content of MK in calcined clay. Without adding any calcined clay, the initial set was about 258 min in the case of mixture MIX-R.

3.2. Extrusion Test

An example of extrusion force (or load) with respect to piston displacement at the different material ages is presented in Figure 6a, which contains three zones: pre-testing (blue), measuring (red), and post-testing (white). The reasons why the pre-testing zone was designed in the beginning were explained as follows: (1) compacting the tested material. According to test experiences, pouring the dough-like material by hand made it difficult to fill the barrel and die. Thus, voids might get entrapped between the tested material and the extruder. On the other hand, the tested material might also contain many air voids as there was no vibrating process. The pre-testing procedures could compact the tested materials to reduce the effects of voids. (2) re-shearing the tested material. Due to the admixtures such as PCE and VMA, the mixture showed thixotropic properties. According to Marchon et al. [36], the fresh cementitious materials remained in the dynamic state and showed relatively small yield stress by under the constant shear stress in the printing system during mixing, pumping and extruding. After deposition, the static yield stress of fresh materials increased immediately to meet the requirements of buildability. In this test, the fresh material stayed at rest between two extrusion trials. Thus, it was essential to use pre-testing to ‘activate’ the fresh material from the static state to the dynamic state. From a microstructural point of view, after mixing with water, the fresh cementitious material first enters into the flocculation phase due to the colloidal attractive forces. Afterward, nucleation of hydrates happened at the pseudo-contact points between particles within the particles network. The hydrate bridges between flocculated cement particles contained higher energy at this stage. When the non-reversible hydrate bonds were generated between particles, the fresh material entered into the phase of structuration. The bonds between particles could be broken by higher forces from shearing or remixing and rebuilt again at rest with the reservoir of chemical species. From the macroscopic view, it was a reversible process to show the thixotropic behaviors of the material. With time passing, the energy required to break those hydrate bridges increased which could be determined as the increase of extrusion pressure with time in this test [24].
As shown in Figure 6a, the extrusion force remained zero at the start until the piston touching the tested material in the barrel. In the second velocity protocol (2 mm/s) of the pre-testing zone, the load increased at the beginning of the test and then reached a steady state. The curves in this zone kept the relatively linear development under the following two constant velocities except for the tested material at the ages of 90 and 120 min. The irrational growth may be attributed to parts of the tested mortar being already hardened in the barrel. Finally, the extrusion force nearly reached the even state for all curves in the measuring zone. The driving velocity increases again from 0.25 to 2 mm/s and the extrusion process is terminated (the curves were cut-off before the end of the test). According to Perrot et al. [27] and Nerella et al. [2], the dramatic load increase with 2 mm/s of piston rate in the pre-testing zone might be partially due to the compacting of the tested material. In their cases, when the material was continuously extruded, the curves showed a slight and gradual decrease since the reduction of inner wall friction. Because of the limited extrusion distance (about 13.5 mm) by each driving velocity in our test, the slight reduction of frictional resistance was hard to be clarified. The decreasing trend was also not clear in the results of Zhou et al. [26]. Thus, we assumed the inner wall friction was consistently the same in the measuring zone. The extrusion pressure (P) in the measuring zone could be calculated by P = 4F/πD2, where F is related to the average extrusion force under 0.25 mm/s of piston rate in the measuring zone and D represents the inner diameter of the barrel. The extrusion pressures of mixtures MIX-L, MIX-M and MIX-H at different ages are demonstrated in Figure 6b. The mix design with a higher content of MK showed the higher extrusion pressure with time.
As explained by Lothenbach et al. [43], most SCMs, including MK, could be regarded as fillers at the early-age, due to the pozzolanic reaction was mainly dependent on the hydrated cement products which were generated after alite hydration. One of the principal mechanisms about filler effect was illustrated as the finer SCMs could provide extra surface as nucleation sites for the hydration products. Mixtures MIX-H and MIX-M had a much higher growth rate of extrusion pressures with time to compare with that of mixture MIX-L. The extra MK in the matrix might accelerate the phase change of cement particles from flocculation to structuration. That could be one reason to explain the decreased initial setting time with an increased amount of MK addition. Besides, the HPCC used in this study had very small average particle diameter size (d50 = 3.75 μm, see Figure 1) which might physically increase the inner friction between particles and the number of available nucleation surfaces in the system. Figure 7 gives the extruded filaments collected after each extrusion test. Even at the age of 10 min, the extruded filaments of mixtures MIX-L, MIX-M and MIX-H showed stable shapes. The curves of mixtures MIX-H and MIX-M showed significantly high extrusion pressures as well as substantial standard deviations after the initial setting time. The high load was potentially harmful to the experimental setup.

3.3. Green Strength Test

The load and displacement results of mixtures MIX-L, MIX-M, and MIX-H are seen in Figure 8a–c. The changes in the mechanical performance of each mix design at a very early age (t = 30, 45, 60, 90, 150 and 240 min) were quite evident. For each mix design, the older samples (t = 90, 150 and 240 min) had a higher peak force than the samples with younger ages (t = 30, 45 and 60 min). As shown in Figure 8a–c, for each specimen, the load increased near linearly with the vertical displacement in the initial path. After that stage, the increasing rate of the load was reduced as deformation grew. The specimens with the younger ages, such as t = 30, 45, and 60 min, had a rising load as the deformation increased until reaching a certain height. Whereas the older specimens (t = 90, 150 and 240 min) showed a load decrease after the peak force. Wolfs et al. [30] and Panda et al. [44] explained this phenomenon. They mentioned that the difference between older and young ages samples was the occurrence of lateral deformations and failure mode. The specimens with the age of t = 30, 45, and 60 min had relatively small stiffness which led to an expansion in the horizontal direction with significant deformation. As shown in Figure 9, the younger specimens fail by barreling instead to generate a distinct crack pattern. The area of cross-section grows under the increases of vertical displacement. The squeezing process resulted in force increases. However, the older specimens showed a typical failure pattern. After the peak force, the load decreased causes the formation of fractures. The older had higher brittleness and lower ductility than the younger specimens.
A high-resolution camera recorded the lateral displacement of each sample. Through using ImageJ (see Figure 8d) and MATLAB, the change of cross section area was determined. For each sample at the very early ages (t = 30, 45, 60 and 90 min), true stresses were calculated using the updated areas of the cross-section. Thus, the load-displacement curves in Figure 8a–c were transferred into the stress and strain curves with the average results demonstrated in Figure 10a–c. All curves were cut-off after the peak stress which is regarded as the ultimate green strength. The self-weight of the sample was excluded in the calculation, since the failure plane of each sample may happen at a different height [30]. In this study, the green strength of mixtures MIX-L, MIX-M, and MIX-H at the different ages are illustrated in Figure 10d. Increasing MK content in calcined clay could significantly increase the green strength. Mixture MIX-H showed the highest green strength and strength development rate from 30 min to 240 min. The test results in this section indicated that increasing MK content in calcined clay could benefit the very early-age strength development which may be used to improve the buildability of the fresh mixtures in 3DCP process.

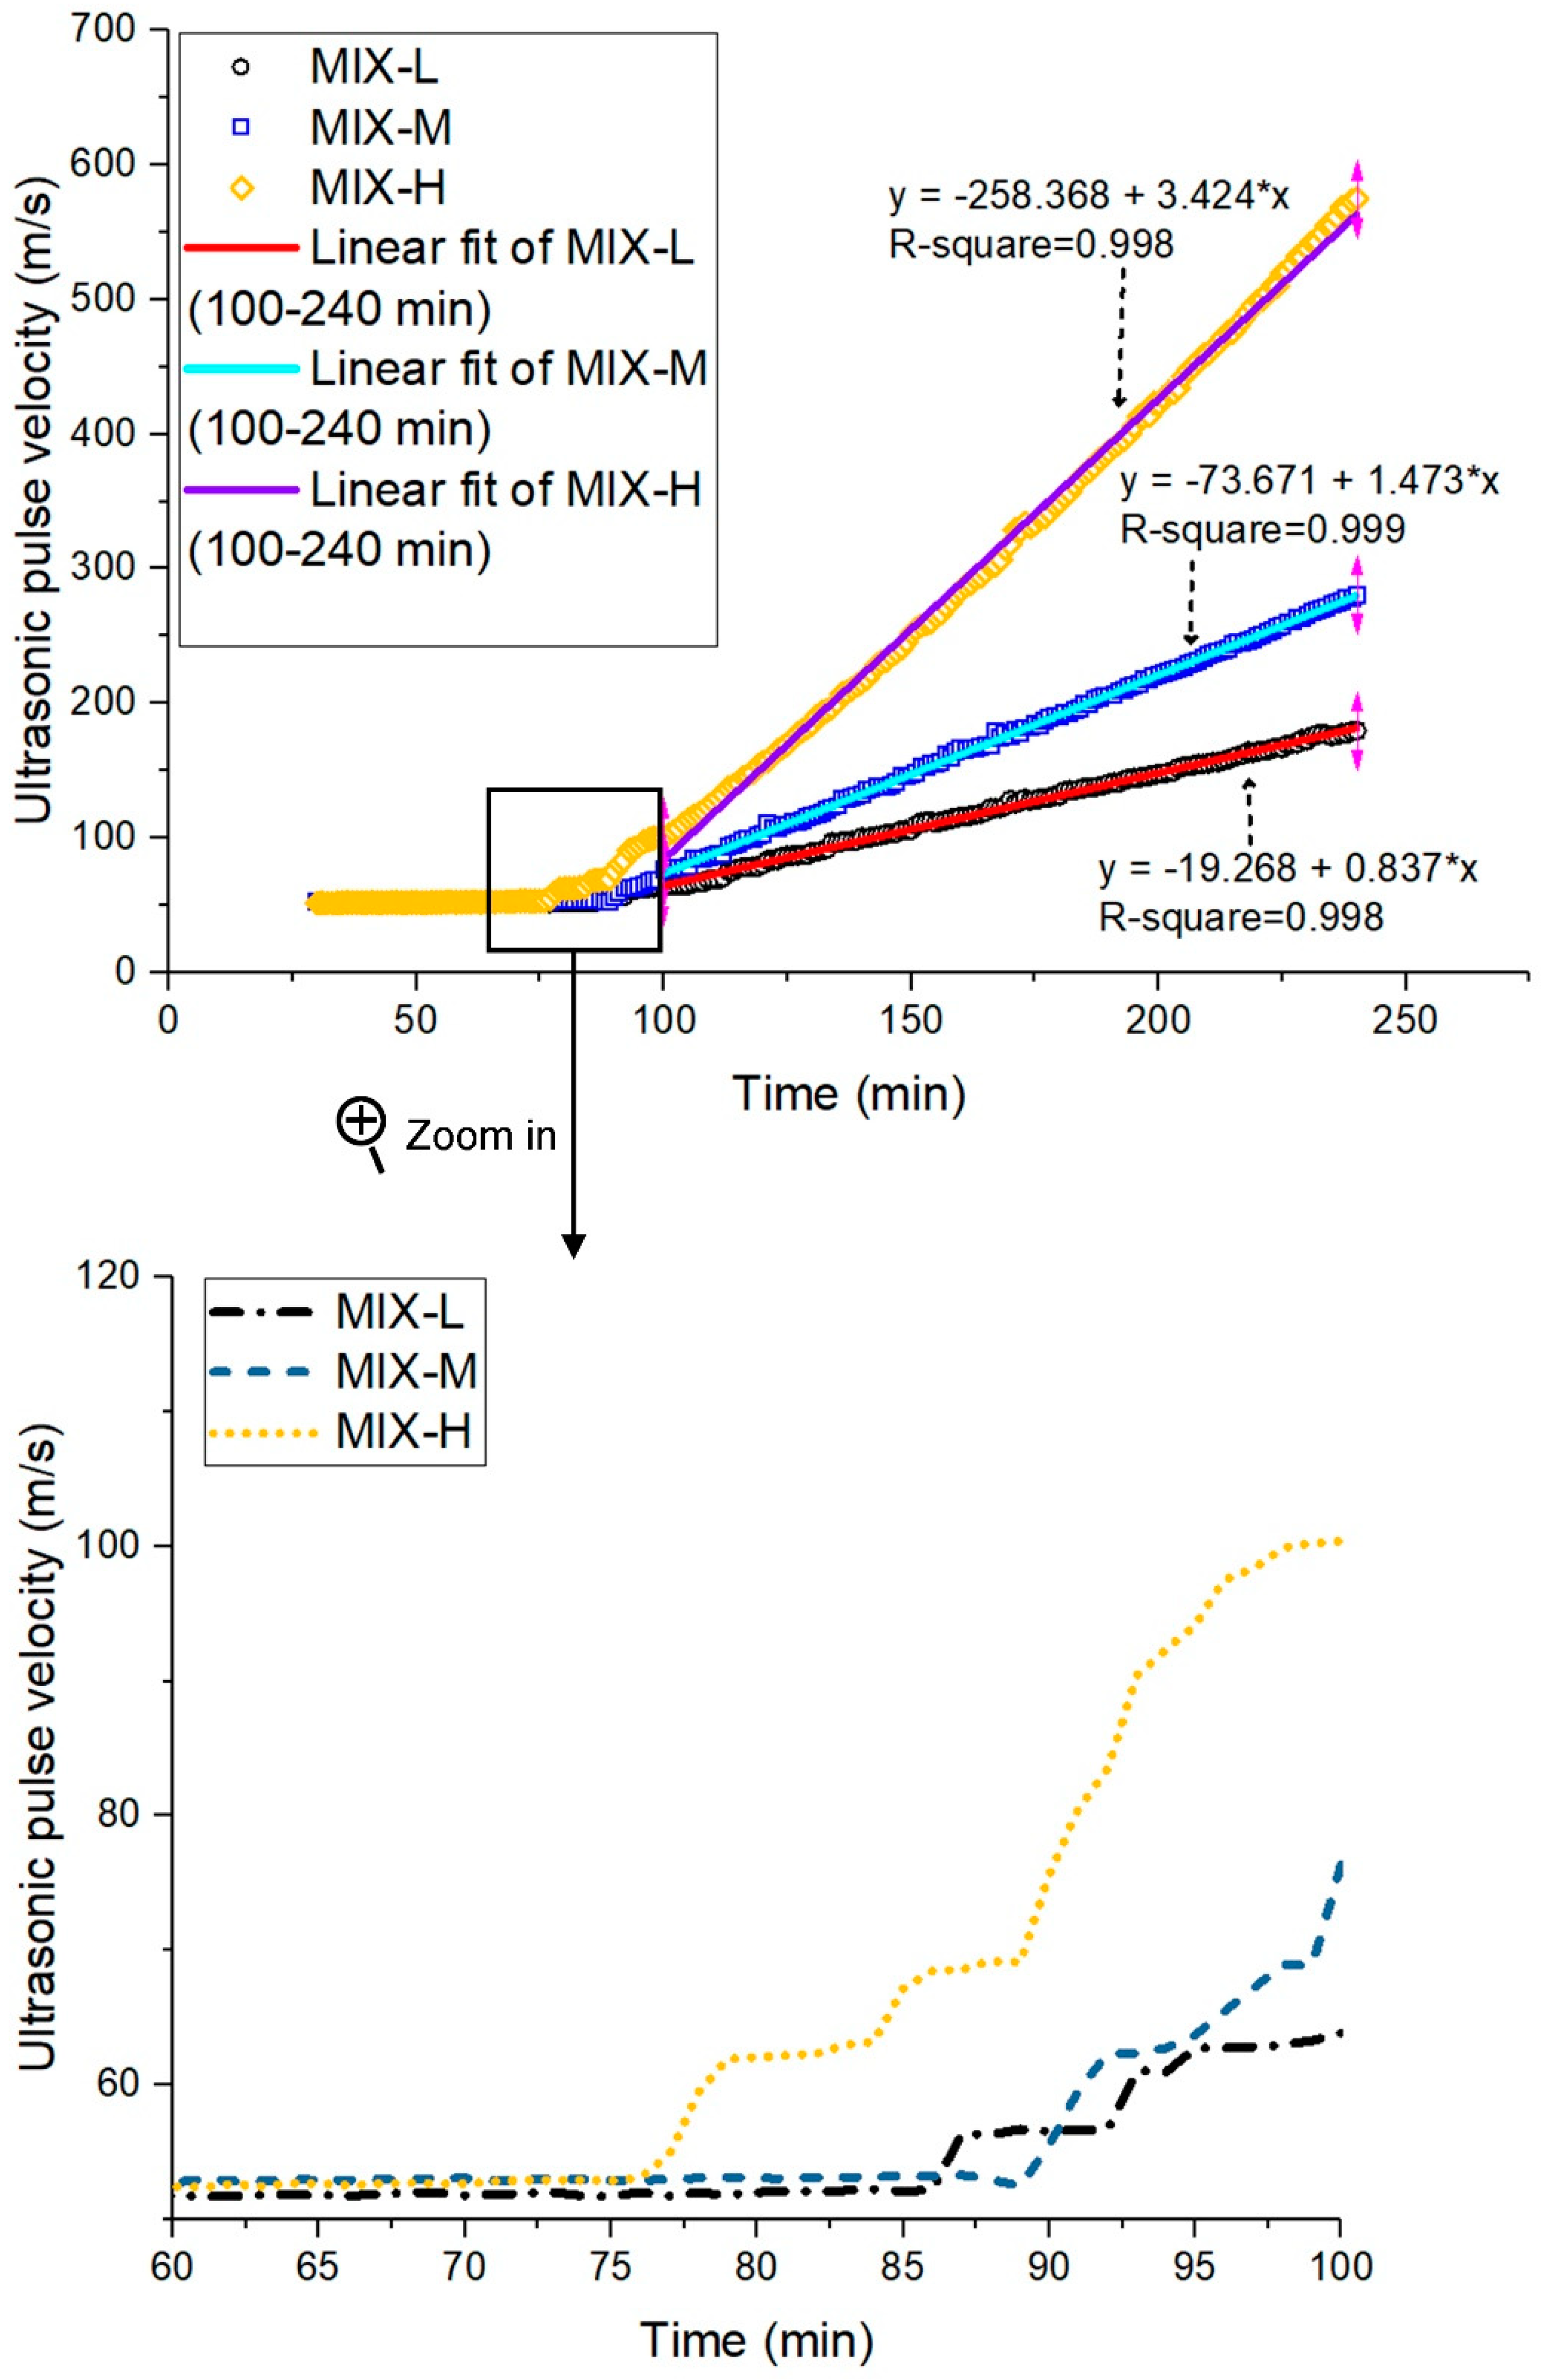
3.4. Ultrasonic Pulse Velocity Test

The ultrasonic wave transmission measurement might be used to investigate the development of solid phases in the microstructure of cementitious materials. The results of the ultrasonic pulse velocity tests are presented in Figure 11. In the first hour, the measured values were stabilized at about 52 m/s. It might be because the specimens are somewhat fluid in this period and their stiffness is too low to be measured by the machine. After about 75 min, the p-wave velocity in the sample of mixture MIX-H showed nearly linear development with time in the studied time frame. The curves of mixtures MIX-L and MIX-M had a similar developing trend approximately 10 min later. Based on the linear fit of measuring results from 100 min to the end in Figure 11, mixture MIX-H demonstrates the highest gradient (about 3.424). Mixture MIX-M has a slightly higher slope than mixture MIX-L. The increase of p-wave velocity could reflect the growth of internal microstructure for cementitious materials. Therefore, this test could indicate that increasing the content of MK in calcined clay could accelerate the internal structure development in the first 4h.

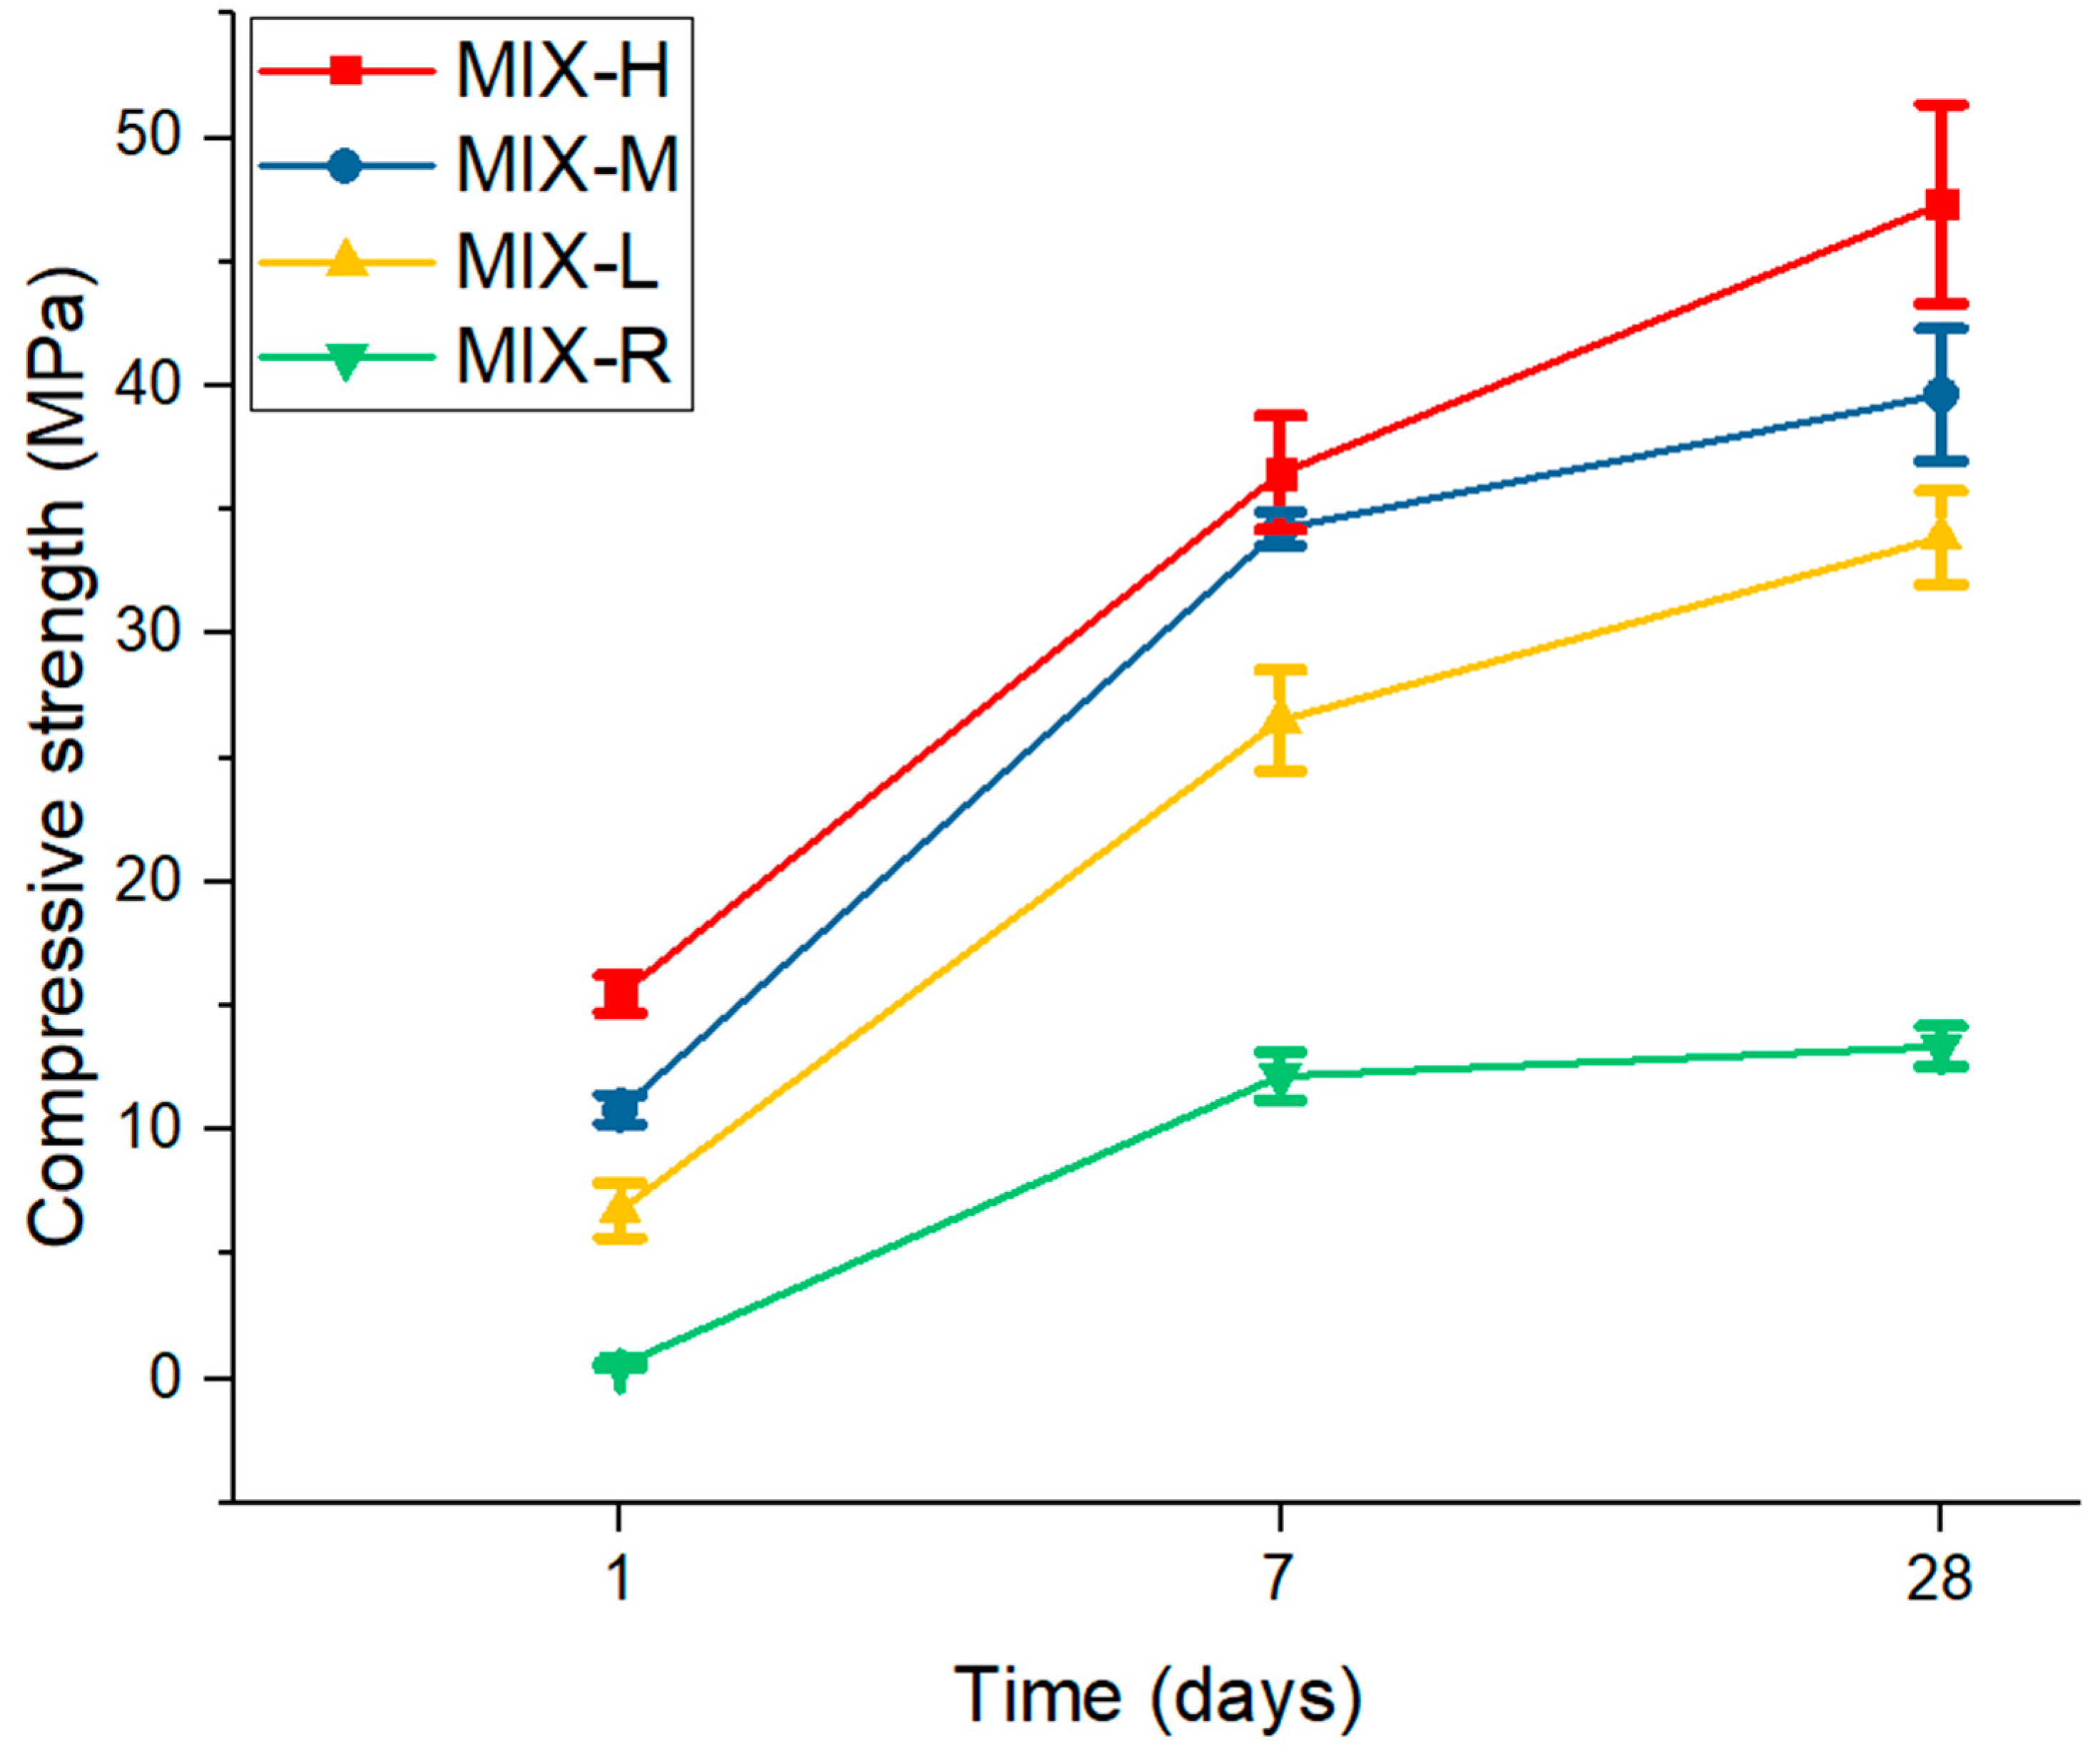
3.5. Compressive Strength at 1, 7 and 28 Days

The compressive strength values at 1, 7, and 28 days are given in Figure 12. Mix designs contained calcined clay showed higher strength than mixture MIX-R at all ages. For mixtures MIX-L, MIX-M, and MIX-H, the higher content of MK in calcined clay led to the higher compressive strength. Mixture MIX-H showed the highest compressive strength within 28 days. Avet et al. [22] mentioned that the mortar compressive strength of different grades of calcined clay based cementitious materials seemed only depended on the calcined kaolinite clay (MK) content regardless of other compositions, secondary phases, fineness and specific surfaces of the calcined clay. That also agreed with our test results.

4. Conclusions

This paper was a fundamental study to develop the limestone and calcined clay based sustainable cementitious materials for the extrusion-based 3DCP. Four mix designs with different binder compositions were proposed in this study. Mixtures MIX-L, MIX-M, and MIX-H contained 40% of Portland cement, 20% of limestone and 40% of calcined clay in the binder. While the different grades of calcined clay were used, respectively. Mixture MIX-R as the reference mix design had 40% of Portland cement and 60% of limestone as the binder. All mix designs were investigated through penetration resistance test and compressive strength test at 1, 7, and 28 days. The most important goal of this paper was to investigate the effects of different grades (MK content) of calcined clay on extrudability and the early-age strength development. Thus, the mixtures were also evaluated by the extrusion test, green strength test and ultrasonic pulse velocity test. The main findings of this study are summarized as follow.
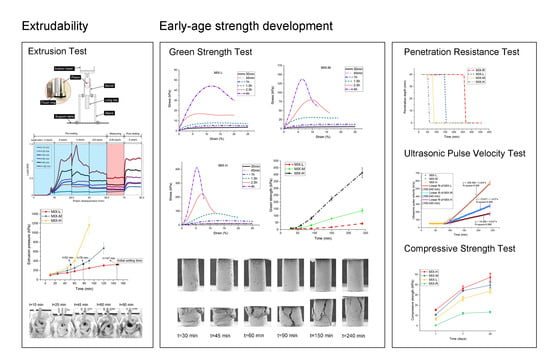
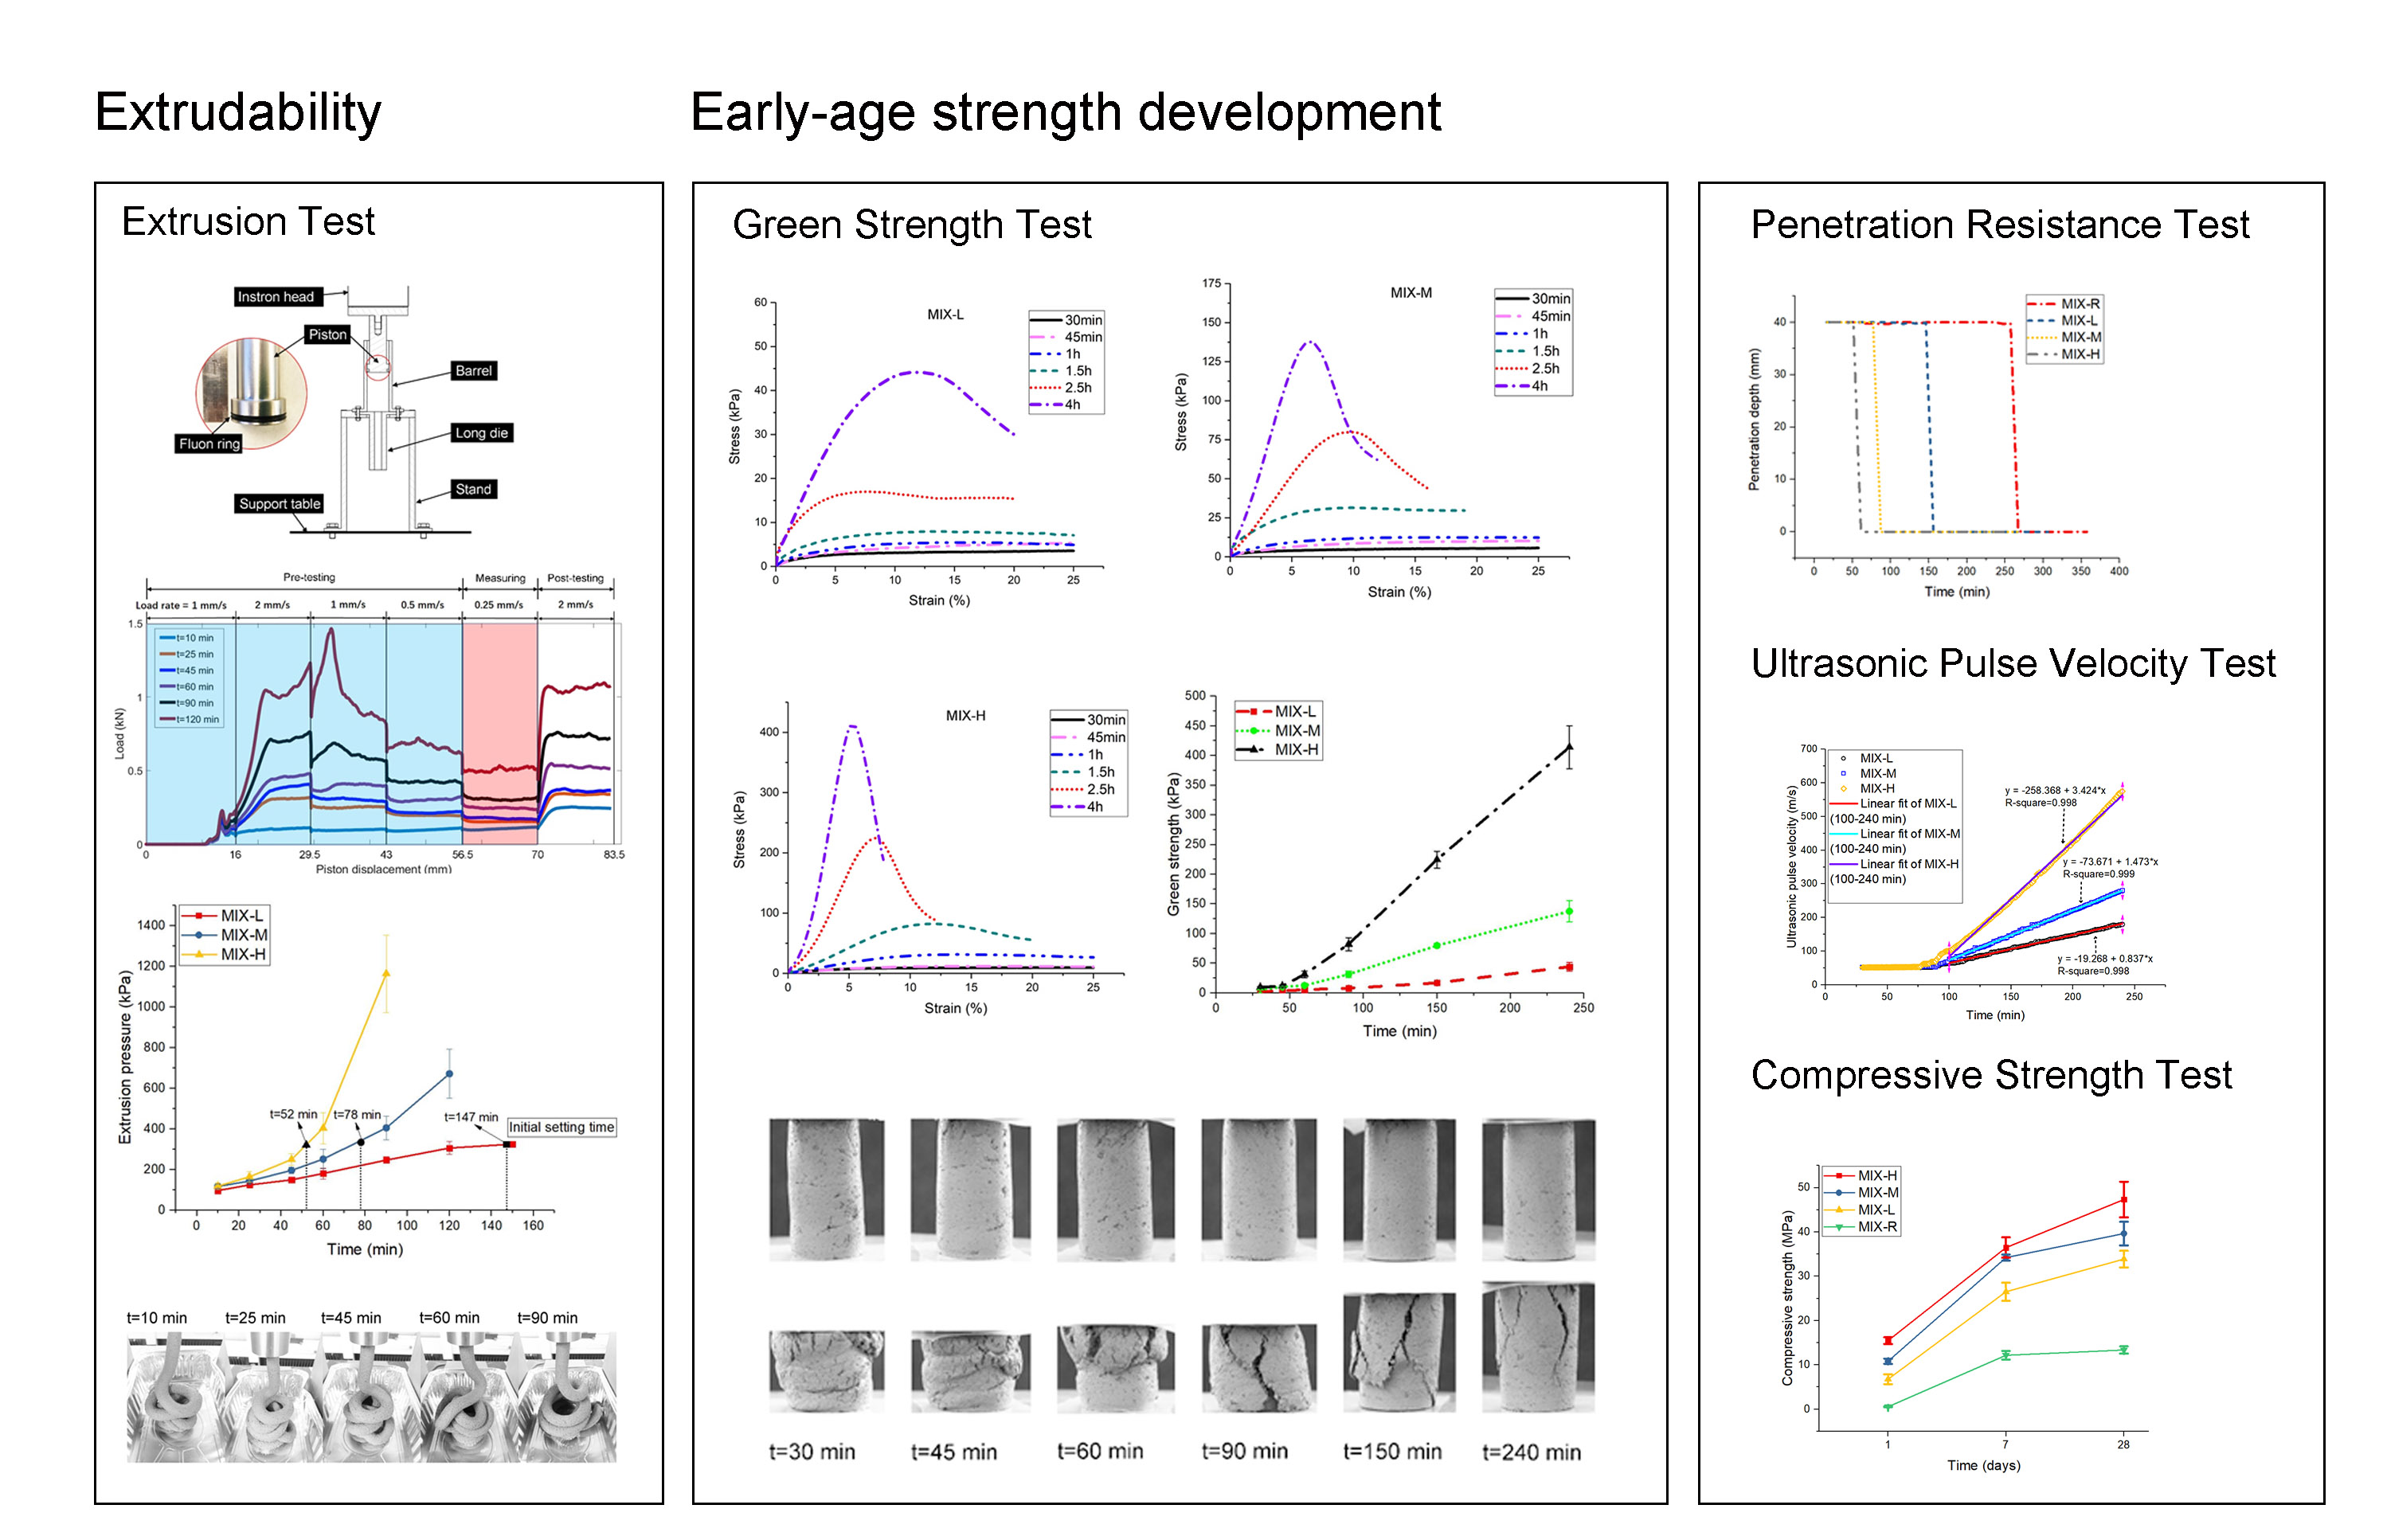
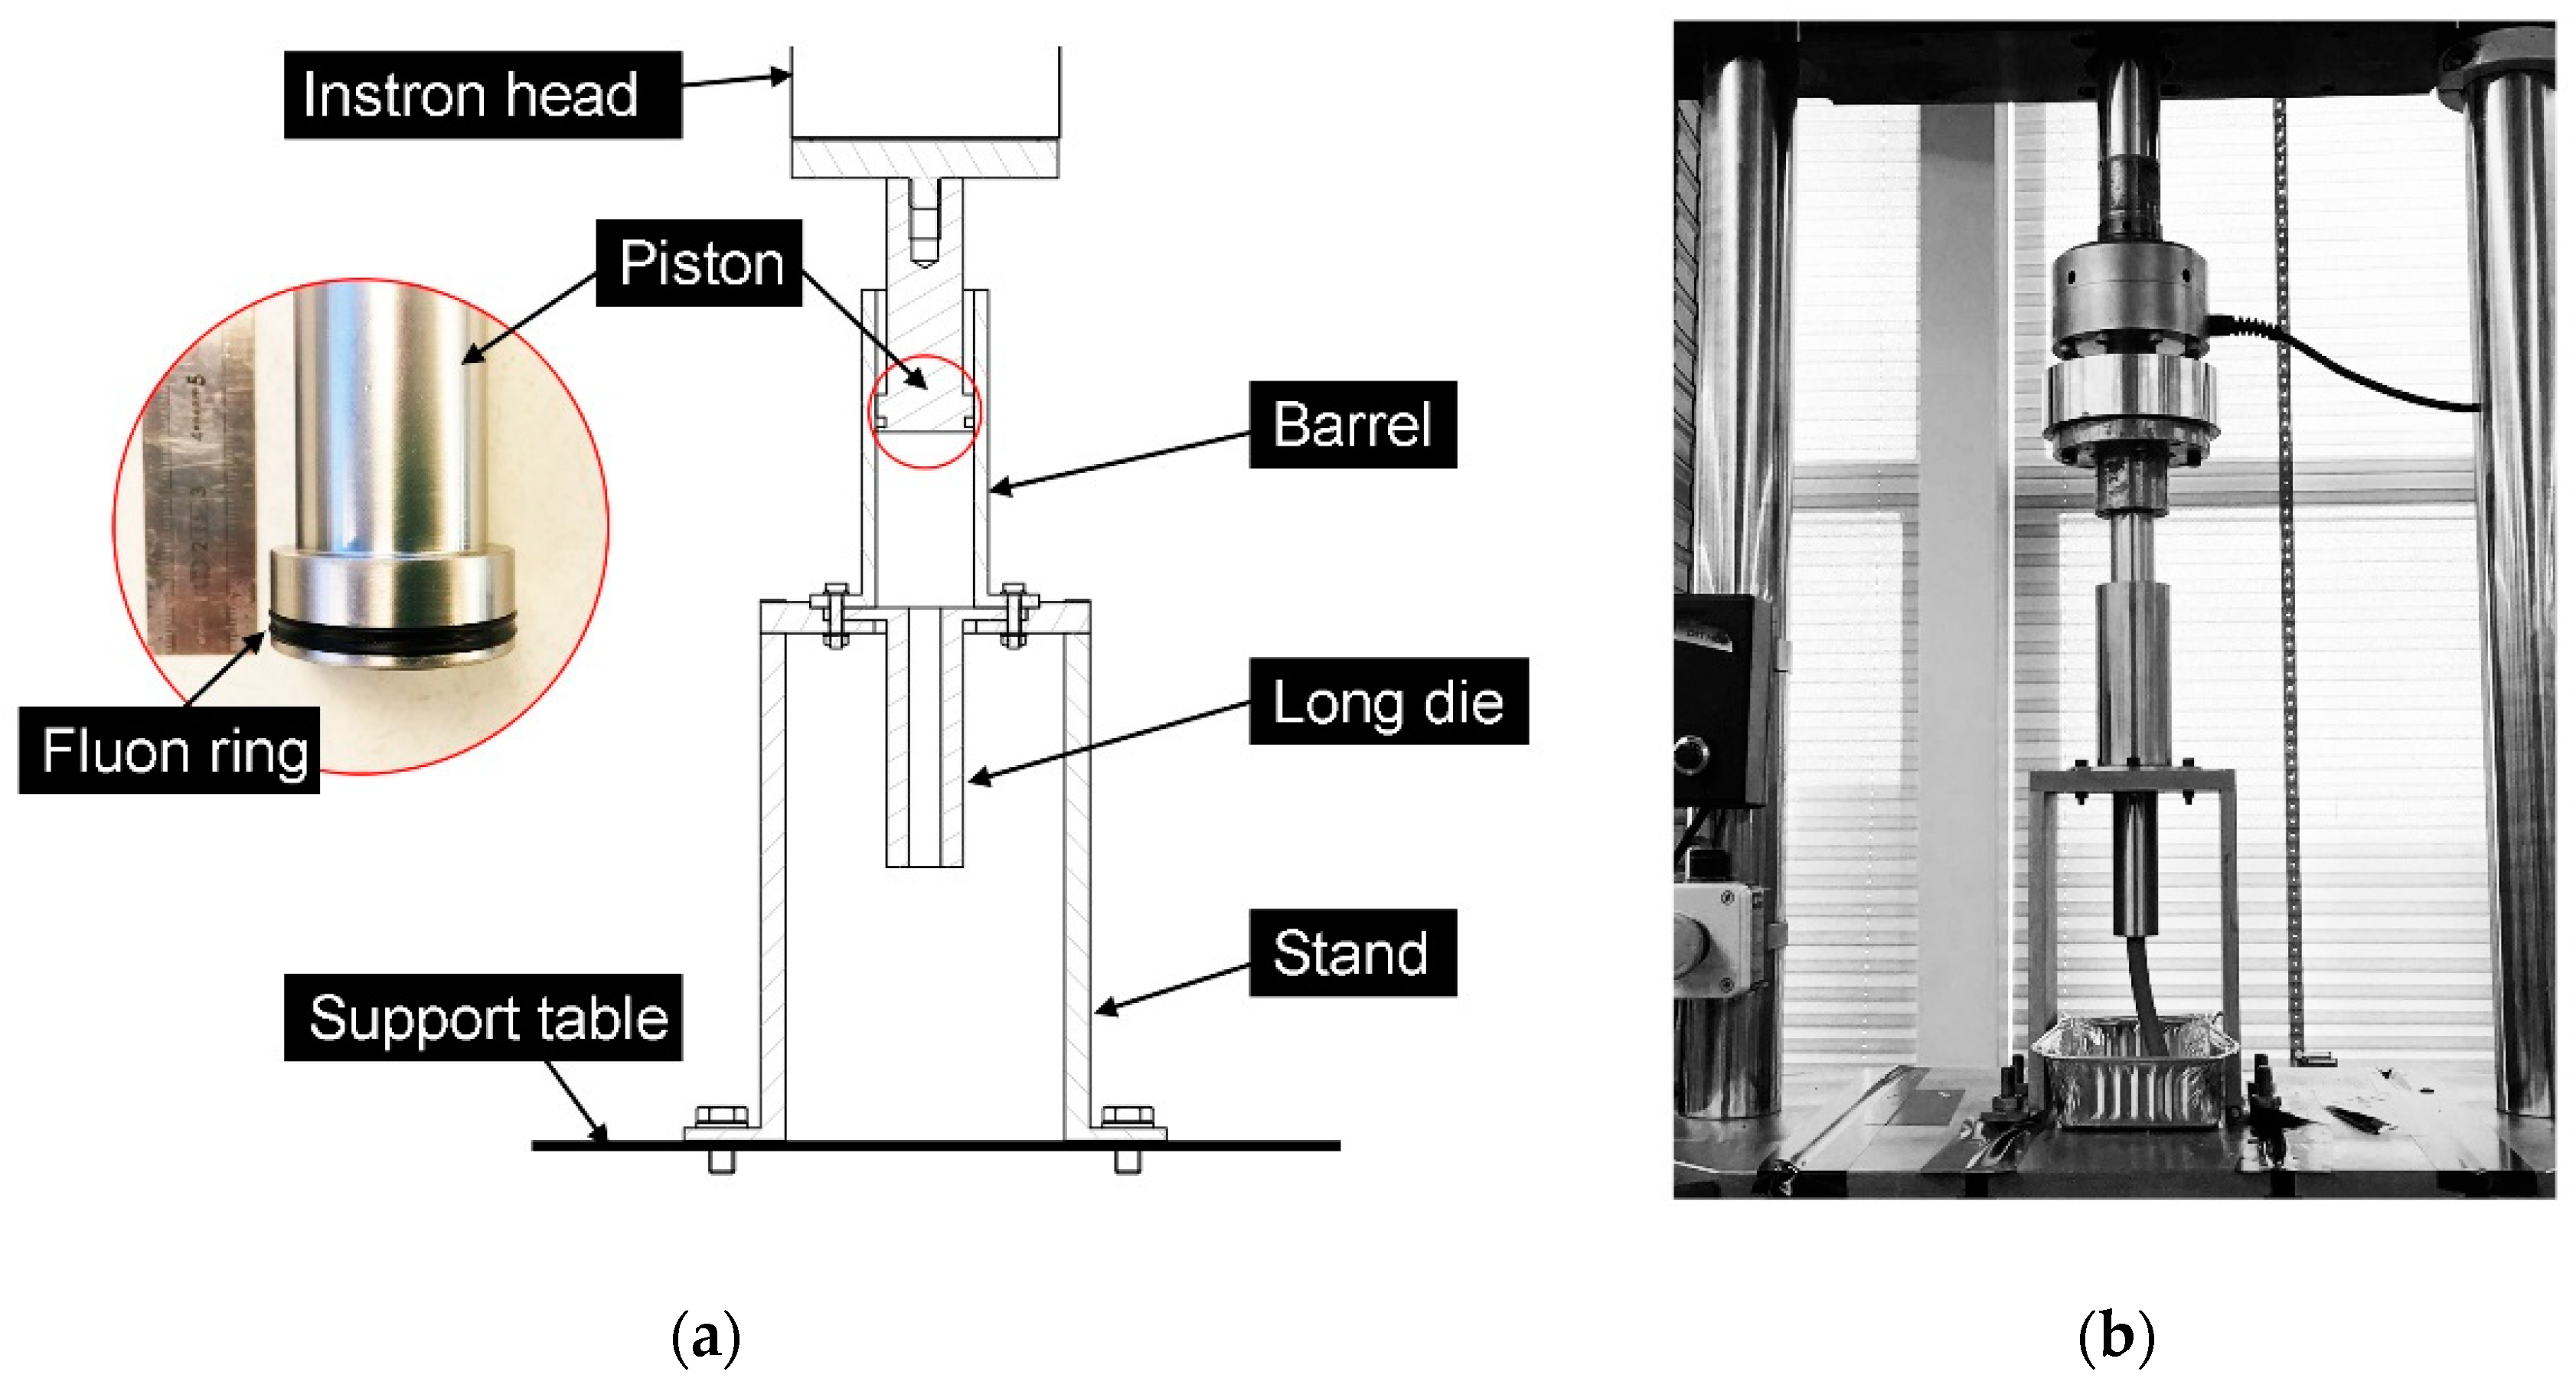
  • A lab-scale extrusion test method based on the ram extruder was proposed in this study to efficiently observe the extruded filaments of the fresh mixture and quantify the required extrusion pressures at different ages. Mixtures MIX-L, MIX-M, and MIX-H showed good shape stability at the ages before their initial setting time. The extrusion pressures and the growth rate of pressure with time were significantly increased by increasing the MK content in calcined clay. Thus, using a higher grade of calcined clay may increase the extrusion shear strength of fresh mixtures which may bring difficulties for extruding and reduce the printability window/open time.
  • According to all results found during this study, increasing the MK dosage in calcined clay could significantly accelerate the initial cement hydration. Consequently, higher mechanical performance in the early stages (green strength) were achieved. Moreover, the buildability and structural build-up behavior of mix designs for 3DCP could be enhanced by using higher grades of calcined clay.
  • Compared with mixture MIX-R, mix designs with calcined clay showed shorter initial setting time and higher compressive strength at 1, 7, and 28 days.
  • Increasing the content of MK in calcined clay could significantly reduce the initial setting time and increase the compressive strength at 1, 7, and 28 days.
  • Within the first 4h, the filler effect of the calcined clay may play a dominant role to promote the phase change of flocculation, nucleation and structuration of cement particles from the microstructure view. Increasing the percentage of MK in calcined clay could increase the content of very small particles in the binder system, which may enhance nucleation and facilitate the microstructure development.
  • Overall, it is essential to find the balance between extrudability and early-age strength to apply the discussed mix designs in 3DCP. Results of this research showed that the MK content of calcined clay plays a key role in the performance of printable cementitious mortars.

Author Contributions

Conceptualization, Y.C.; Formal analysis, Y.C. and Z.L.; Investigation, Y.C. and Z.L.; Methodology, Y.C. and S.C.F.; Software, Y.C.; Supervision, O.C., F.V. and E.S.; Visualization, Y.C.; Writing – original draft, Y.C.; Writing – review & editing, Z.L., S.C.F., O.C., F.V. and E.S.

Funding

Yu Chen and Zhenming Li would like to acknowledge the funding supported by the China Scholarship Council (CSC) under grant No. 201807720005 and No. 201506120072 respectively. In addition, Stefan Chaves Figueiredo would like to acknowledge the funding from Science Without Borders from the National Council for Scientific and Technological Development of Brazil (201620/2014-6).

Acknowledgments

Burgess Pigment Company is thanked for the donation of the Optipozz® Burgess metakaolin. The authors appreciate Dr. Caglar Yalcinkaya and Mr. Maiko van Leeuwen for their supports in tests.

Conflicts of Interest

The authors declare no conflict of interest.

References

  1. Buswell, R.A.; Leal de Silva, W.R.; Jones, S.Z.; Dirrenberger, J. 3D printing using concrete extrusion: A roadmap for research. Cem. Concr. Res. 2018, 112, 37–49. [Google Scholar] [CrossRef]
  2. Nerella, V.N.; Näther, M.; Iqbal, A.; Butler, M.; Mechtcherine, V. Inline quantification of extrudability of cementitious materials for digital construction. Cem. Concr. Compos. 2019, 95, 260–270. [Google Scholar] [CrossRef]
  3. Bos, F.; Wolfs, R.; Ahmed, Z.; Salet, T. Additive manufacturing of concrete in construction: Potentials and challenges of 3D concrete printing. Virtual Phys. Prototyp. 2016, 11, 209–225. [Google Scholar] [CrossRef]
  4. Paul, S.C.; Tay, Y.W.D.; Panda, B.; Tan, M.J. Fresh and hardened properties of 3D printable cementitious materials for building and construction. Arch. Civ. Mech. Eng. 2018, 18, 311–319. [Google Scholar] [CrossRef]
  5. Reiter, L.; Wangler, T.; Roussel, N.; Flatt, R.J. The role of early age structural build-up in digital fabrication with concrete. Cem. Concr. Res. 2018, 112, 86–95. [Google Scholar] [CrossRef]
  6. Panda, B.; Paul, S.C.; Hui, L.J.; Tay, Y.W.D.; Tan, M.J. Additive manufacturing of geopolymer for sustainable built environment. J. Clean. Prod. 2017, 167, 281–288. [Google Scholar] [CrossRef]
  7. Le, T.T.; Austin, S.A.; Lim, S.; Buswell, R.A.; Gibb, A.G.F.; Thorpe, T. Mix design and fresh properties for high-performance printing concrete. Mater. Struct. 2012, 45, 1221–1232. [Google Scholar] [CrossRef]
  8. Panda, B.; Unluer, C.; Tan, M.J. Investigation of the rheology and strength of geopolymer mixtures for extrusion-based 3D printing. Cem. Concr. Compos. 2018, 94, 307–314. [Google Scholar] [CrossRef]
  9. Chen, Y.; Veer, F.; Copuroglu, O. A Critical Review of 3D Concrete Printing as a Low CO2 Concrete Approach. Heron 2017, 62, 167–194. [Google Scholar]
  10. Meyer, C. The greening of the concrete industry. Cem. Concr. Compos. 2009, 31, 601–605. [Google Scholar] [CrossRef]
  11. Dong, Y.H.; Ng, S.T.; Kwan, A.H.K.; Wu, S.K. Substituting local data for overseas life cycle inventories—A case study of concrete products in Hong Kong. J. Clean. Prod. 2015, 87, 414–422. [Google Scholar] [CrossRef]
  12. Panda, B.; Ruan, S.; Unluer, C.; Jen, M. Improving the 3D printability of high volume fly ash mixtures via the use of nano attapulgite clay. Compos. Part B 2019, 165, 75–83. [Google Scholar] [CrossRef]
  13. Panda, B.; Tan, M.J. Material properties of 3D printable high-volume slag cement. In Proceedings of the First International Conference on 3D Construction Printing (3DcP) in Conjunction with the 6th International Conference on Innovative Production and Construction (IPC 2018), Melbourne, Australia, 26–28 November 2018. [Google Scholar]
  14. Bentz, D.P.; Jones, S.Z.; Bentz, I.R.; Peltz, M.A. Towards the formulation of robust and sustainable cementitious binders for 3-D additive construction by extrusion. Constr. Build. Mater. 2018, 175, 215–224. [Google Scholar] [CrossRef]
  15. Glavind, M. Sustainability of Cement, Concrete and Cement Replacement Materials in Construction; Woodhead Publishing Limited: Cambridge, UK, 2009; ISBN 978-1-84569-349-7. [Google Scholar]
  16. Scrivener, K.; Martirena, F.; Bishnoi, S.; Maity, S. Calcined clay limestone cements (LC3). Cem. Concr. Res. 2018, 114, 49–56. [Google Scholar] [CrossRef]
  17. Snellings, R. Assessing, Understanding and Unlocking Supplementary Cementitious Materials. Rilem Tech. Lett. 2016, 1, 50–55. [Google Scholar] [CrossRef]
  18. Matschei, T.; Lothenbach, B.; Glasser, F.P. The role of calcium carbonate in cement hydration. Cem. Concr. Res. 2007, 37, 551–558. [Google Scholar] [CrossRef]
  19. Chen, Y.; Veer, F.; Copuroglu, O.; Schlangen, E. Feasibility of Using Low CO2 Concrete Alternatives in Extrusion-Based 3D Concrete Printing. In Proceedings of the RILEM International Conference on Concrete and Digital Fabrication, Zurich, Switzerland, 10–12 September 2018; pp. 269–276. [Google Scholar]
  20. Huang, W.; Kazemi-Kamyab, H.; Sun, W.; Scrivener, K. Effect of replacement of silica fume with calcined clay on the hydration and microstructural development of eco-UHPFRC. Mater. Des. 2017, 121, 36–46. [Google Scholar] [CrossRef]
  21. Arbi, K.; Nedeljković, M.; Zuo, Y.; Ye, G. A Review on the Durability of Alkali-Activated Fly Ash/Slag Systems: Advances, Issues, and Perspectives. Ind. Eng. Chem. Res. 2016, 55, 5439–5453. [Google Scholar] [CrossRef]
  22. Avet, F.; Snellings, R.; Alujas Diaz, A.; Ben Haha, M.; Scrivener, K. Development of a new rapid, relevant and reliable (R3) test method to evaluate the pozzolanic reactivity of calcined kaolinitic clays. Cem. Concr. Res. 2016, 85, 1–11. [Google Scholar] [CrossRef]
  23. Kazemian, A.; Yuan, X.; Cochran, E.; Khoshnevis, B. Cementitious materials for construction-scale 3D printing: Laboratory testing of fresh printing mixture. Constr. Build. Mater. 2017, 145, 639–647. [Google Scholar] [CrossRef]
  24. Roussel, N. Rheological requirements for printable concretes. Cem. Concr. Res. 2018, 112, 76–85. [Google Scholar] [CrossRef]
  25. Nerella, V.N.; Beigh, M.A.B.; Fataei, S.; Mechtcherine, V. Strain-based approach for measuring structural build-up of cement pastes in the context of digital construction. Cem. Concr. Res. 2018, 115, 530–544. [Google Scholar] [CrossRef]
  26. Zhou, X.; Li, Z.; Fan, M.; Chen, H. Rheology of semi-solid fresh cement pastes and mortars in orifice extrusion. Cem. Concr. Compos. 2013, 37, 304–311. [Google Scholar] [CrossRef]
  27. Perrot, A.; Mélinge, Y.; Rangeard, D.; Micaelli, F.; Estellé, P.; Lanos, C. Use of ram extruder as a combined rheo-tribometer to study the behaviour of high yield stress fluids at low strain rate. Rheol. Acta 2012, 51, 743–754. [Google Scholar] [CrossRef]
  28. Perrot, A.; Rangeard, D.; Pierre, A. Structural built-up of cement-based materials used for 3D-printing extrusion techniques. Mater. Struct. 2016, 49, 1213–1220. [Google Scholar] [CrossRef]
  29. Voigt, T.; Malonn, T.; Shah, S.P. Green and early age compressive strength of extruded cement mortar monitored with compression tests and ultrasonic techniques. Cem. Concr. Res. 2006, 36, 858–867. [Google Scholar] [CrossRef]
  30. Wolfs, R.J.M.; Bos, F.P.; Salet, T.A.M. Early age mechanical behaviour of 3D printed concrete: Numerical modelling and experimental testing. Cem. Concr. Res. 2018, 106, 103–116. [Google Scholar] [CrossRef]
  31. Wolfs, R.J.M.; Bos, F.P.; Salet, T.A.M. Correlation between destructive compression tests and non-destructive ultrasonic measurements on early age 3D printed concrete. Constr. Build. Mater. 2018, 181, 447–454. [Google Scholar] [CrossRef]
  32. Ma, G.; Li, Z.; Wang, L. Printable properties of cementitious material containing copper tailings for extrusion based 3D printing. Constr. Build. Mater. 2018, 162, 613–627. [Google Scholar] [CrossRef]
  33. Panda, B.; Tan, M.J. Experimental study on mix proportion and fresh properties of fly ash based geopolymer for 3D concrete printing. Ceram. Int. 2018, 44, 10258–10265. [Google Scholar] [CrossRef]
  34. Li, Z.; Zhang, S.; Zuo, Y.; Chen, W.; Ye, G. Chemical deformation of metakaolin based geopolymer. Cem. Concr. Res. 2019, 120, 108–118. [Google Scholar] [CrossRef]
  35. NEN-EN 196-2 Method of Testing Cement—Part 2: Chemical Analysis of Cement; NEN: Delft, The Netherlands, 2013.
  36. Marchon, D.; Kawashima, S.; Bessaies-Bey, H.; Mantellato, S.; Ng, S. Hydration and rheology control of concrete for digital fabrication: Potential admixtures and cement chemistry. Cem. Concr. Res. 2018, 112, 96–110. [Google Scholar] [CrossRef]
  37. Figueiredo, S.C.; Rodrıguez, C.R.; Ahmed, Z.Y.; Bos, D.H.; Xu, Y.; Salet, T.A.M.; Copuroglu, O.; Schlangen, E.; Bos, F.P. An approach to develop printable strain hardening cementitious composites. Mater. Des. 2019, 169, 107651. [Google Scholar] [CrossRef]
  38. Ma, G.; Wang, L. A critical review of preparation design and workability measurement of concrete material for largescale 3D printing. Front. Struct. Civ. Eng. 2017, 12, 1–19. [Google Scholar] [CrossRef]
  39. Antoni, M.; Rossen, J.; Martirena, F.; Scrivener, K. Cement substitution by a combination of metakaolin and limestone. Cem. Concr. Res. 2012, 42, 1579–1589. [Google Scholar] [CrossRef]
  40. NEN-EN 196-3—Methods of Testing Cement—Part 3: Determination of Setting Times and Soundness; NEN: Delft, The Netherlands, 2017.
  41. NEN-EN 12504-4:2005—Testing Concrete—Part 4: Determination of Ultrasonic Pulse Velocity; NEN: Delft, The Netherlands, 2005.
  42. NEN-EN 196-1—Methods of Testing Cement—Part 1: Determination of Strength; NEN: Delft, The Netherlands, 2016.
  43. Lothenbach, B.; Scrivener, K.; Hooton, R.D. Supplementary cementitious materials. Cem. Concr. Res. 2011, 41, 1244–1256. [Google Scholar] [CrossRef]
  44. Panda, B.; Hui, L.J.; Tan, M.J. Mechanical properties and deformation behaviour of early age concrete in the context of digital construction. Compos. Part B Eng. 2019, 165, 563–571. [Google Scholar] [CrossRef]
Figure 1. Particle size distribution of dry components.
Applsci 09 01809 g001
Figure 2. (a) Section drawing of the ram extruder; (b) Photograph of the ram extruder.
Applsci 09 01809 g002
Figure 3. (a) Diagram of the extrusion process controlled by the actuator; (b) Predefined speed and displacement for the extrusion test.
Applsci 09 01809 g003
Figure 4. The ultrasonic pulse velocity test apparatus.
Applsci 09 01809 g004
Figure 5. Results of the penetration resistance test by a Vicat apparatus.
Applsci 09 01809 g005
Figure 6. (a) Load and piston displacement test results of mixture MIX-L at different ages. Blue area – the pre-test process for reaching the dynamic status; red area – the test process for taking the average value. (b) Comparison of extrusion pressures (under 0.25 mm/s of piston rate) between mix designs at different ages.
Applsci 09 01809 g006
Figure 7. (a) Extruded filaments of mixture MIX-L; (b) Extruded filaments of mixture MIX-M; (c) Extruded filaments of mixture MIX-H.
Applsci 09 01809 g007
Figure 8. (a) The load and displacement curve of mixture MIX-L; (b) The load and displacement curve of mixture MIX-M; (c) The load and displacement curve of mixture MIX-H. (d) An example of a post-processed image obtained with the help of ImageJ.
Applsci 09 01809 g008aApplsci 09 01809 g008bApplsci 09 01809 g008c
Figure 9. Mixture MIX-H samples in the green strength test. Photographs of demolded samples at different ages (first row); Photographs of damaged samples at different ages (second row).
Applsci 09 01809 g009
Figure 10. (a) The average stress and strain curve of mixture MIX-L; (b) The average stress and strain curve of mixture MIX-M; (c) The average stress and strain curve of mixture MIX-H; (d) Comparison of green strength of mix designs at different ages. The relative standard deviation (RSD) of peak stresses is under 20% which is similar to the findings of Wolfs et al. [30].
Applsci 09 01809 g010aApplsci 09 01809 g010b
Figure 11. Measuring results of ultrasonic pulse velocity for mixtures MIX-L, MIX-M and MIX-H. The linear fit based on measuring results from 100 min to 240 min.
Applsci 09 01809 g011
Figure 12. Measuring results of ultrasonic pulse velocity for mixtures MIX-L, MIX-M, and MIX-H. The linear fit based on measuring results from 100 min to 240 min.
Applsci 09 01809 g012
Table 1. The chemical composition of the main components in the binder (wt. %).
Oxide (wt. %)SiO2Al2O3CaOFe2O3K2OTiO2ZrO2OtherTotal
PC17.44.168.72.80.60.306.1100.0
LF0.2039.60.100060.1100.0
LCC55.138.40.62.60.21.10.11.9100.0
HPCC47.350.600.50.21.300.1100.0
Table 2. Reactivity of low-grade calcined clay (LCC) and high-grade calcined clay (HPCC) (wt. %).
Components (wt. %)I.R.Reactive ContentReactive SiO2Reactive Al2O3Other Reactive Phases
LCC 51.248.812.332.04.5
HPCC 24.975.134.639.90.6
Table 3. Mix Designs.
TypePCCalcined ClayLFSandWaterPCEVMA
(kg/m3)LCC (kg/m3)HPCC (kg/m3)(kg/m3)(kg/m3)(kg/m3)(kg/m3)(kg/m3)
MIX-R331004971242248172
MIX-L33133101661242248172
MIX-M331248831661242248172
MIX-H3311661651661242248172
Table 4. Timeline and procedures of fresh mortar preparation.
Time (min:s)Steps Followed
-4:00Homogenizing dry components, mixing with the low speed by a planetary mixer (HOBART).
0:00While mixing with the low speed, add the blended liquid (water and superplasticizer).
4:00Pause, scraping the walls and blade (A dough-like mixture is generated).
4:30Mixing with the high speed. (until the dough-like material adhere to the walls of the bowl).
8:00Stop, start to fill molds or do other tests

