1. Introduction
The wide existence of the transient voltage in the power grid threatens the insulation system of high-voltage plants, which often causes the grid faults [
1]. The accurate measurement of transient voltage is the key for the fault analysis, the optimized insulation design and the standardization of high-voltage testing techniques.
Various types of transient voltages can be found in a power grid. The fastest transient voltages (i.e., very fast front overvoltage, VFFO) usually appear at a gas-insulated switchgear (GIS), which is caused by the operation of the GIS disconnectors [
2,
3,
4]. A VFFO commonly has high frequency components of approximately 100 MHz and a rising time of several nanoseconds [
5]. For the fast-front transient voltages, the rising time is normally in the range of 0.1 μs to 20 μs [
5]. In terms of a transient voltage caused by normal operation, the rising time is in the range of microseconds. It is noted that these transient voltages are usually superimposed on the power-frequency voltage, which requires a wide bandwidth and fast response speed for the voltage measuring system to be well measured. Moreover, portability and safety are also advised for developing a voltage measuring system.
Subject to the requirements of insulation and capacity, traditional electrotechnical voltage measuring techniques usually bring huge sized and heavy weighted equipment, especially for those applied in an extra-high voltage (EHV) or ultra-high voltage (UHV) power grids. It is also noted that their bandwidth and response speed are unfavorably limited. For example, the capacitance-voltage transformer (CVT) which is a commonly used voltage measuring device in the high-voltage AC power grid typically has a weight of hundreds of kilograms (for 500 kV) and a bandwidth lower than 1 kHz [
6,
7,
8]. Besides, the bushing tap is applied mainly to measure the transient voltage during a substation commissioning, of which the performance is mainly affected by the manufacturing process and the bushing structure. As a consequence, the upper bandwidth is generally not higher than 5 MHz for a bushing tap technique [
9,
10,
11]. In addition, the portability cannot be achieved on these techniques.
Thus, subject to the future demand of the power system, it is highly expected to develop a safe and easy-to-apply voltage measuring technique. For a quasi-static problem, since the electric field is considered to be irrotational, the space electric field around a conductor is linear to the potential of the conductor. Based on the measuring technique for the electric field, a non-contacted measuring method for transient voltage could be possible. On the other hand, as the development of optical sensing technology, several electro-optical effects have been used for measuring electric fields. The electro-chromatic effect has a response time of ~100 s, and it is suitable only for extremely low-frequency electric field measurement [
12,
13]. The Kerr effect is a quadratic electro-optic effect and normally has a small electro-optic coefficient. Thus, the sensors based on the Kerr effect have a low sensitivity [
14,
15]. The Pockels effect is known as a linear electro-optic effect, which means the output voltage is linear to the measured electric field. The sensor based on the Pockels effect normally has a fast response speed, small size, and are passive. It is particularly used for the measurement of high-amplitude transient electric field [
16].
In this paper, based on the linear correspondence between the transient voltage and the transient electric-field caused, a non-contact transient voltage measuring technique was proposed. An integrated optical electric-field sensor based on the Pockels effect was introduced to implement the field measurement. The measuring system was developed and tested for its bandwidth and response speed. A series of measured lightning transient voltages and typical switching transient voltages were presented. Finally, the characteristics of these measured transient voltages and the decoupling issues were discussed.
2. Measuring Method and Measuring System
2.1. Method
For a quasi-static problem, the voltage
U(
t) of the conductor is linear to the electric field
E(
t) caused by it, which can be expressed as:
Normally, the voltage waveform of a transient process includes the power-frequency component and the transient component. Since the amplitude of the power-frequency voltage is known for a power grid, by comparing the amplitudes of the power-frequency voltage and the measured power-frequency electric field, the coefficient k in (1) can be given.
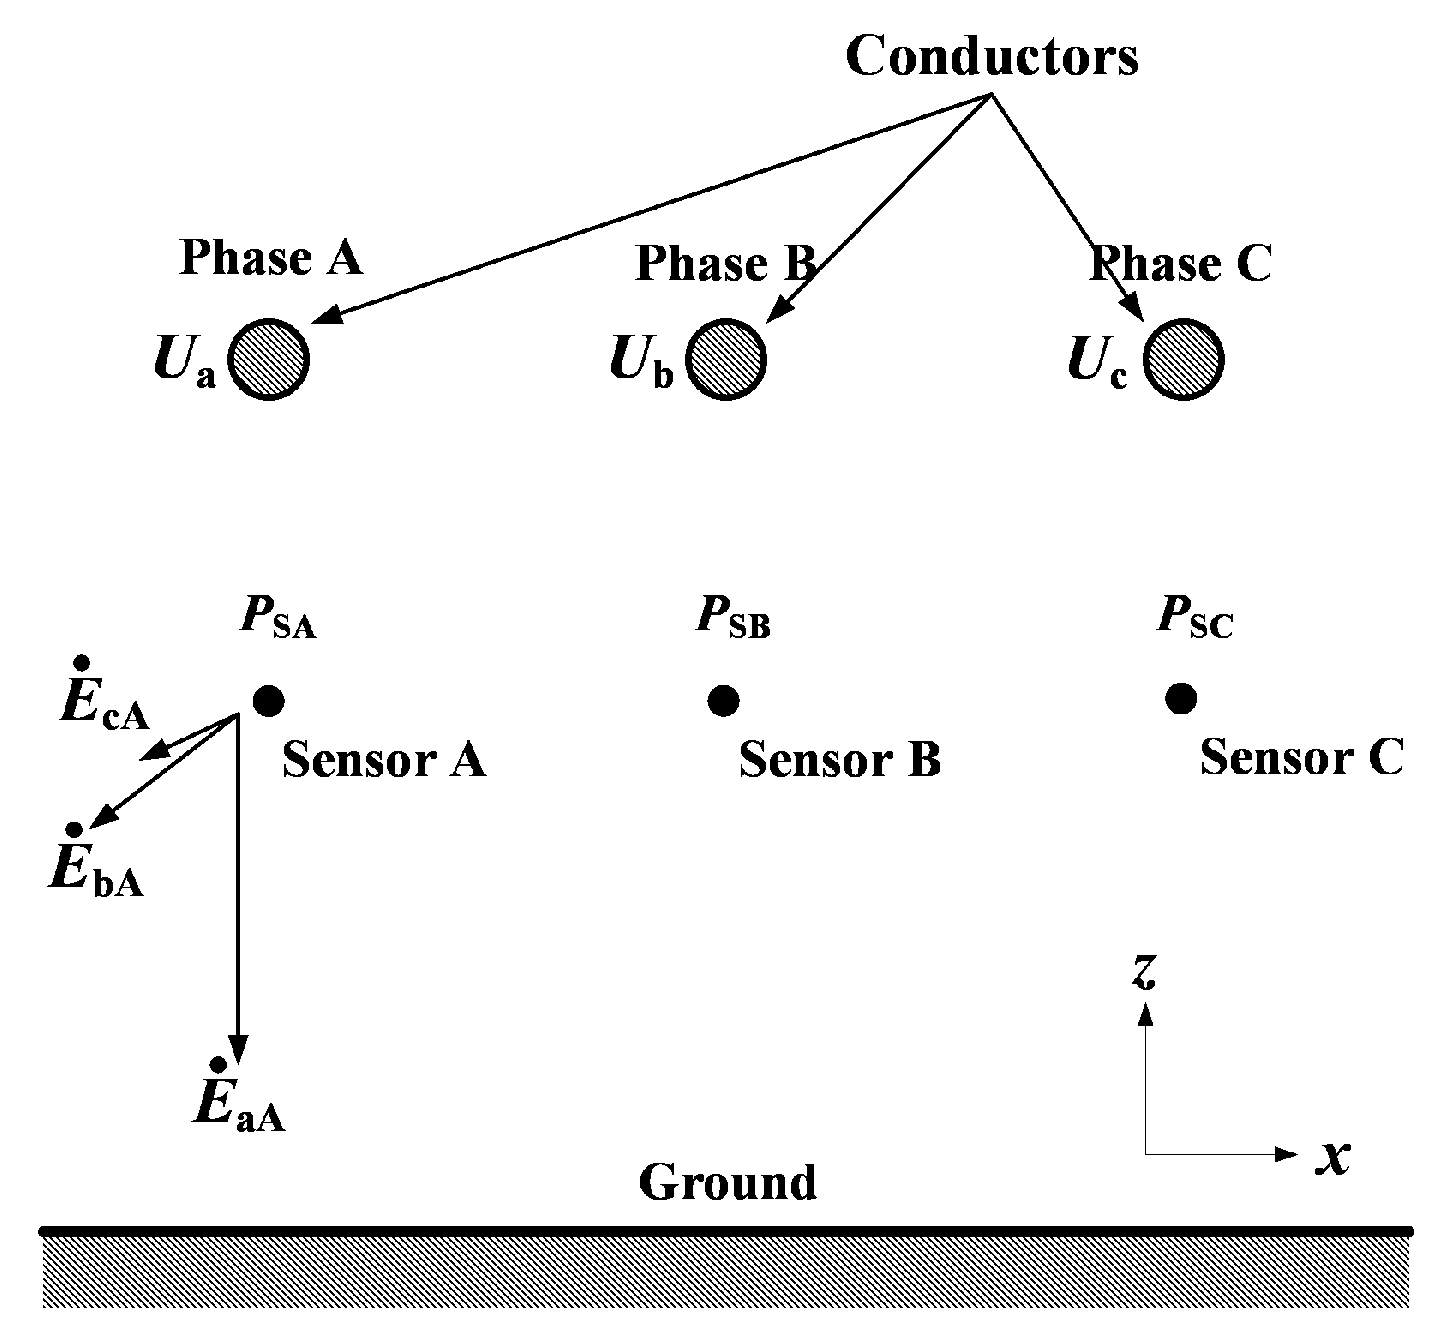
In an actual AC power system, the transmission line contains three phase conductors, which unavoidably leads to the coupling effect for the non-contact measuring technique as illustrated in
Figure 1. Beneath each phase conductor, an electric-field sensor is installed denoted as Sensor A, Sensor B, and Sensor C for the corresponding phase.
Sensors are arranged at the height level with enough air insulation clearance against corresponding conductors. As conductors are energized, the potentials of three-phase conductors produce electric fields at sensor’s locations denoted by
PSA,
PSB, and
PSC in
Figure 1. Taking
PSA as an example, the electric field at
PSA is a compound electric field contributed by
EaA,
EbA, and
EcA which can be decomposed into the components in the x-axis (
EaA-x,
EbA-x,
EcA-x) and z-axis (
EaA-z,
EbA-z,
EcA-z) respectively. The total electric field at
PSA (
EA) can be given by:
where
k is a coefficient equalling to the ratio of electric field detected to the origin potential. The first letter in the subscript of
k represents the phase conductor producing the aimed electric field, and the second letter represents the phase under investigation. To integrate three phases, the electric field matrix can be written as follows:
Equation (3) can be divided into
and
Based on either (4) or (5), the voltage waveforms on a conductor can be given by measuring the electric fields in the case that the k matrix is known.
2.2. Sensor
An integrated optical electric-field sensor is developed based on the Pockels effect [
17,
18,
19]. In this optical sensor, an optical waveguide is fabricated on a LiNbO
3 substrate by titanium diffusion. The refractive index of the optical waveguide would be changed under an external electric field (
E). Thus, while a polarized light passes through the optical waveguide, there would be a phase difference between its vertical and horizontal components. The modulated polarized light was transmitted to a common path interferometer via a polarization maintaining optical fiber, while the phase difference caused by external electric-field is demodulated into light intensity. Eventually, the light intensity is transferred into an electrical signal (
Uout) by a laser receiver. The relationship between
E and
Uout is given as [
20,
21]:
where
A represents the photoelectric conversion coefficient and the transmission loss.
b denotes the extinction ratio.
ϕ0 can be controlled near π/2 through the production of the sensor. In the case that the external electric field is much smaller than the half-wave electric field (
Eπ), by Taylor’s expansion, (6) can be rewritten as:
Thus, the output voltage of the optical electric-field measuring system is linear to the external electric field.
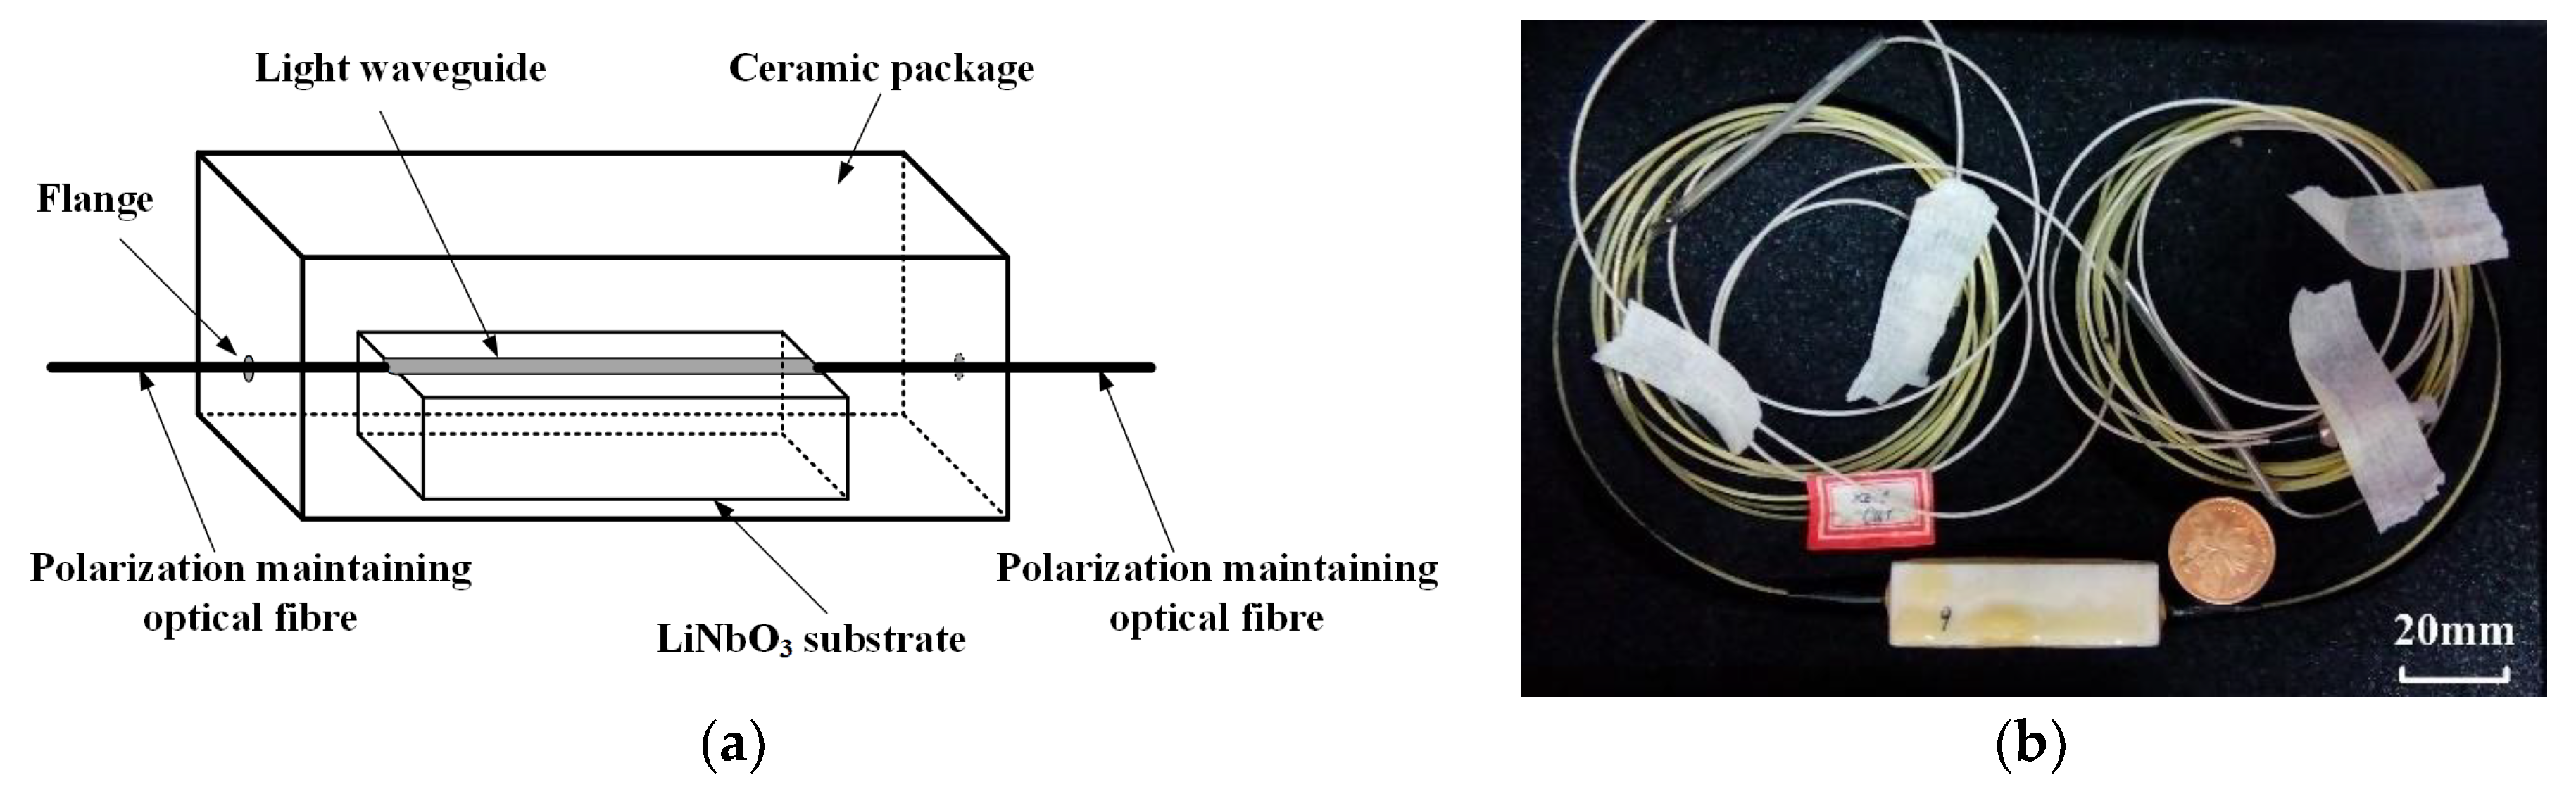
Figure 2 shows the schematic diagram of the developed optical sensor which has the dimensions of 18 mm by 18 mm by 48 mm and a weight of dozens of grams. The sensors, as well as the input and output fibres, are made of dielectric materials which could guarantee the safety under high-voltage conditions. Moreover, the sensor indicates a good directivity as it is sensitive to the electric-field component perpendicular to the front of the sensor. On the field measurement, the sensor is usually facing the measured conductor. Thus, instead of (4), (5) is normally used to compute the transient voltage.
2.3. Measuring System
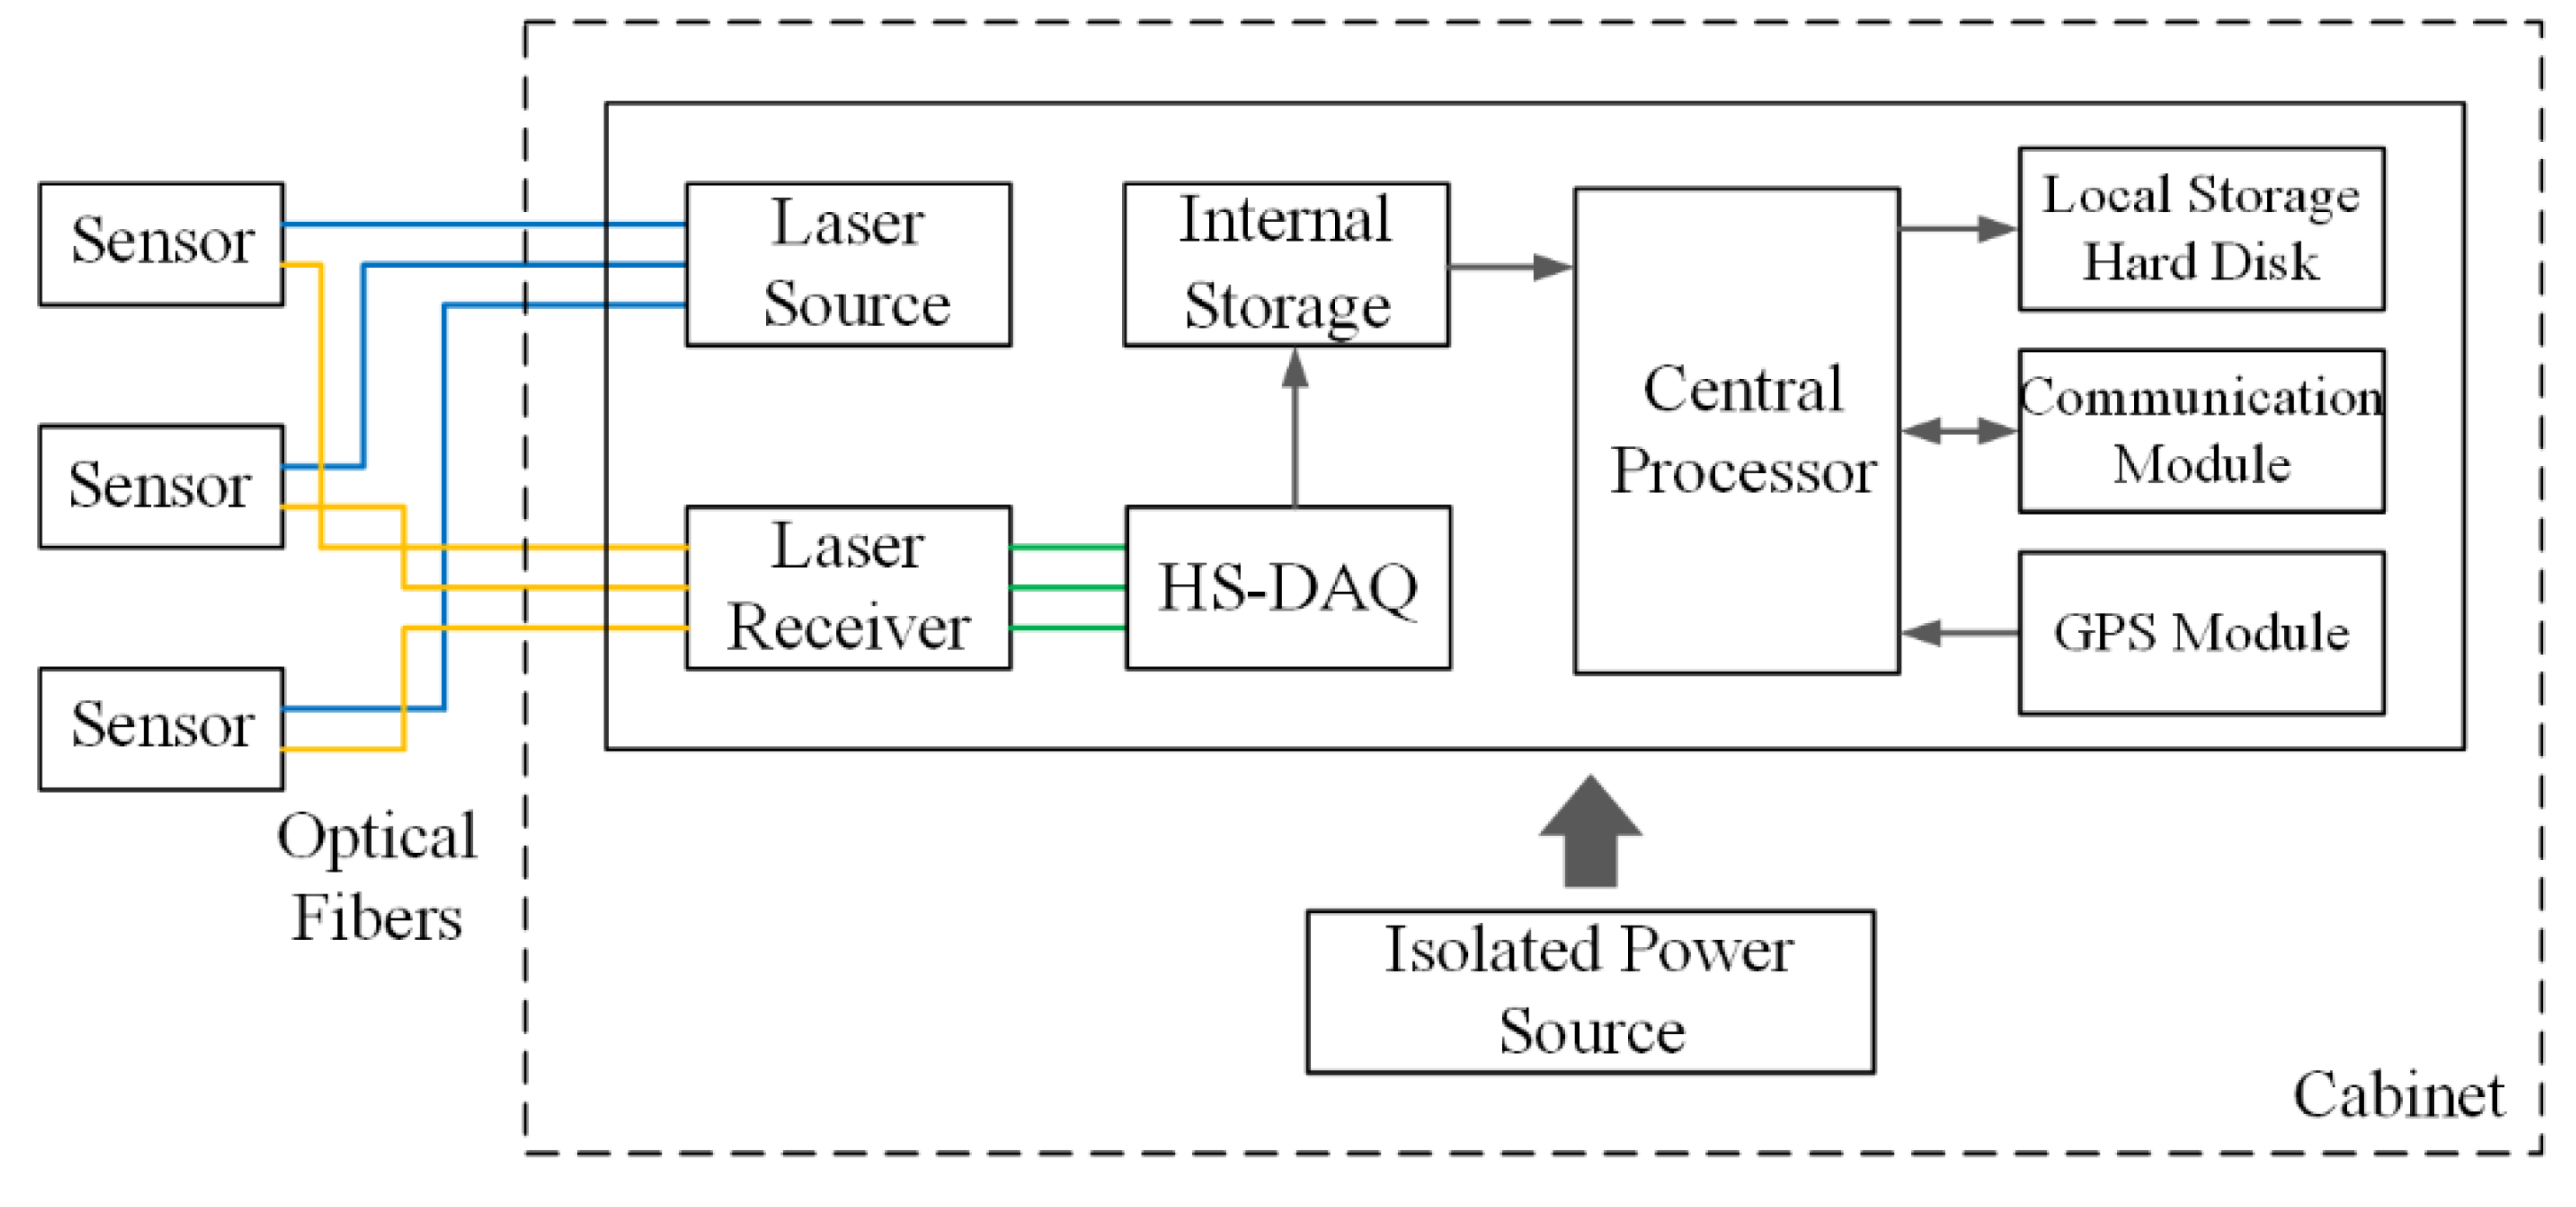
The measuring system contains an optical electric-field measuring unit and a data processing unit. The optical electric-field measuring unit includes optical sensors, a laser source, a laser receiver, and transmission fibers. The output analog signals of the laser receiver are converted into digital signals by a high-speed data acquisition card (HS-DAQ) with 4 acquisition channels and a sampling ratio of 40 MS/s. The digital signals are temporarily stored in the internal storage and further analyzed by the central processor to determine whether a transient process occurs. While the system is triggered by the transient voltage, the transient voltage waveform from 20 ms before to 80 ms after the triggering will be stored into the local storage hard disk. Simultaneously, 400 milliseconds voltage waveform after the triggering time would also be recorded with a sampling ratio of 20 kS/s. All these signals are timed by a GPS module with the error of less than 100 ns. The field measured signal will be transmitted to the central station by a 4G wireless communication module. Thus, the HS-DAQ, the central processor, the internal storage, the hard disk, the GPS module, and the communication module constitute the data processing system. Except for the sensors and optical fibers, all the other devices are integrated into a cabinet or a portable suitcase and powered by an isolated power supply. The general connection diagram of the measuring system is shown in
Figure 3.
Due to the nature of randomness for the lightning strike, the sensors used for measuring lightning transient voltages are installed outdoor for a long term. To protect them from environmental effects, sensor containers are used, which are supported by a grounded metal tube to the same level of the base of adjacent insulators, as shown in
Figure 4a. For the measurement of switching transient voltage, the sensors are just supported by an insulating rod temporarily, as shown in
Figure 4b. On both arrangements, the clearances between the sensor and the high-voltage conductor are no shorter than the necessary distance specified in [
5].
2.4. Performance Test
To ensure that the developed measuring system meets the performance requirements for the transient voltage measurement, a series of tests including the response speed and frequency response have been carried out in the laboratory.
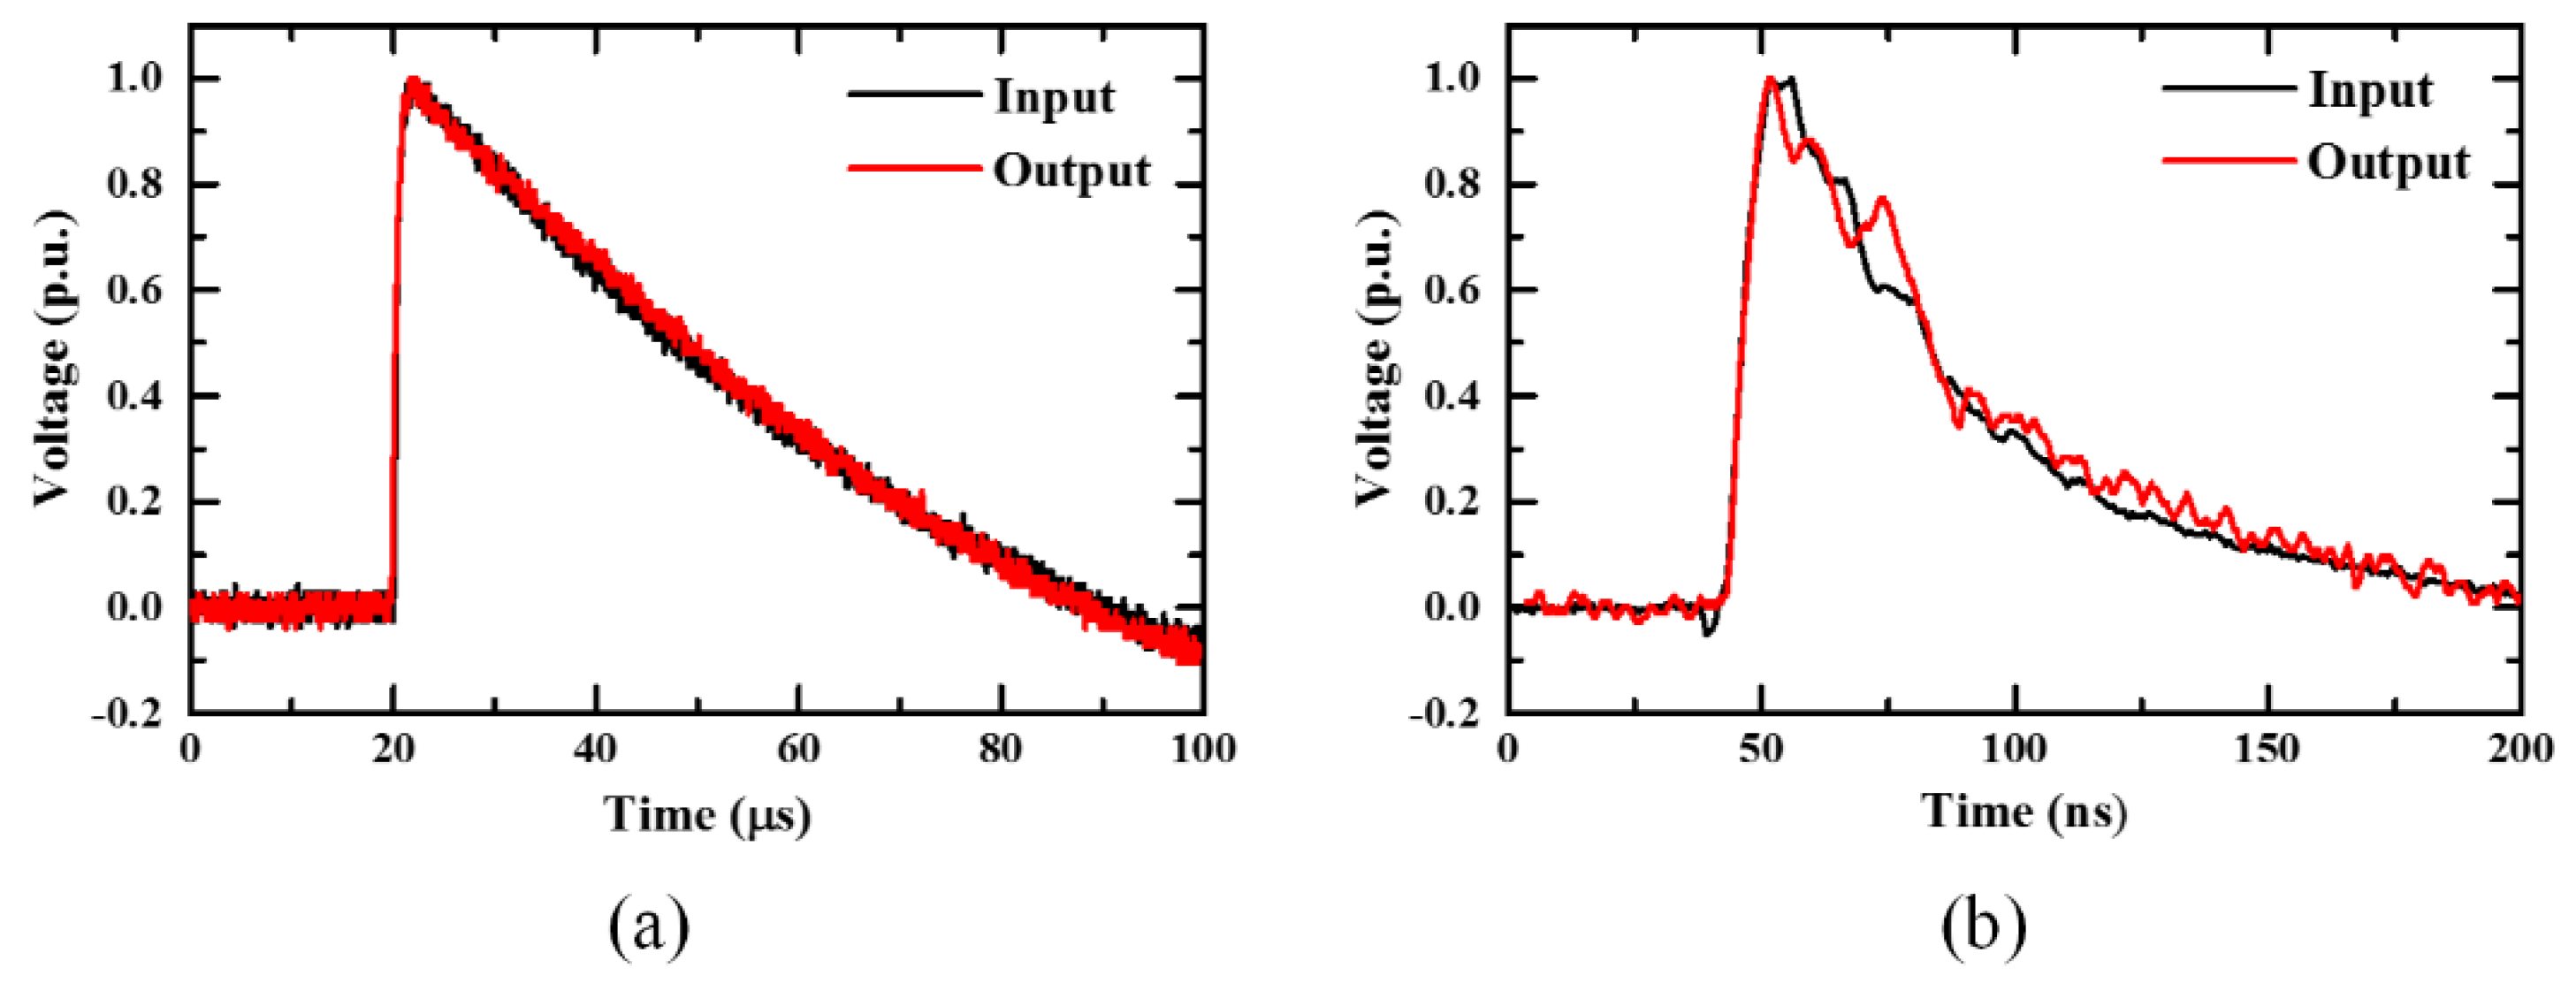
A 5 kV 1.2/30 μs lighting impulse was imposed on a circular-shape plane-plane gap with the gap distance of 10 cm and the radius of 50 cm. A 996:1 standard impulse voltage divider was employed to offer the standard measuring result. The normalized measuring results of the developed measuring system and the standard divider are shown in
Figure 5a. To determine the response time of the measuring system which is in the range of nanoseconds, a bounded wave electromagnetic pulse simulator, composed of charging transformer, impulse capacitor, sharping switch, parallel-plate transmission line, and matching resistor was employed, to generate a pulse with 6 ns for the rise time and 38 ns for the half time. A 104.2:1 standard resistive divider was used to offer standard measuring results. The normalized measuring results are shown in
Figure 5b, which indicates that the response time of the measuring system is less than 6 ns.
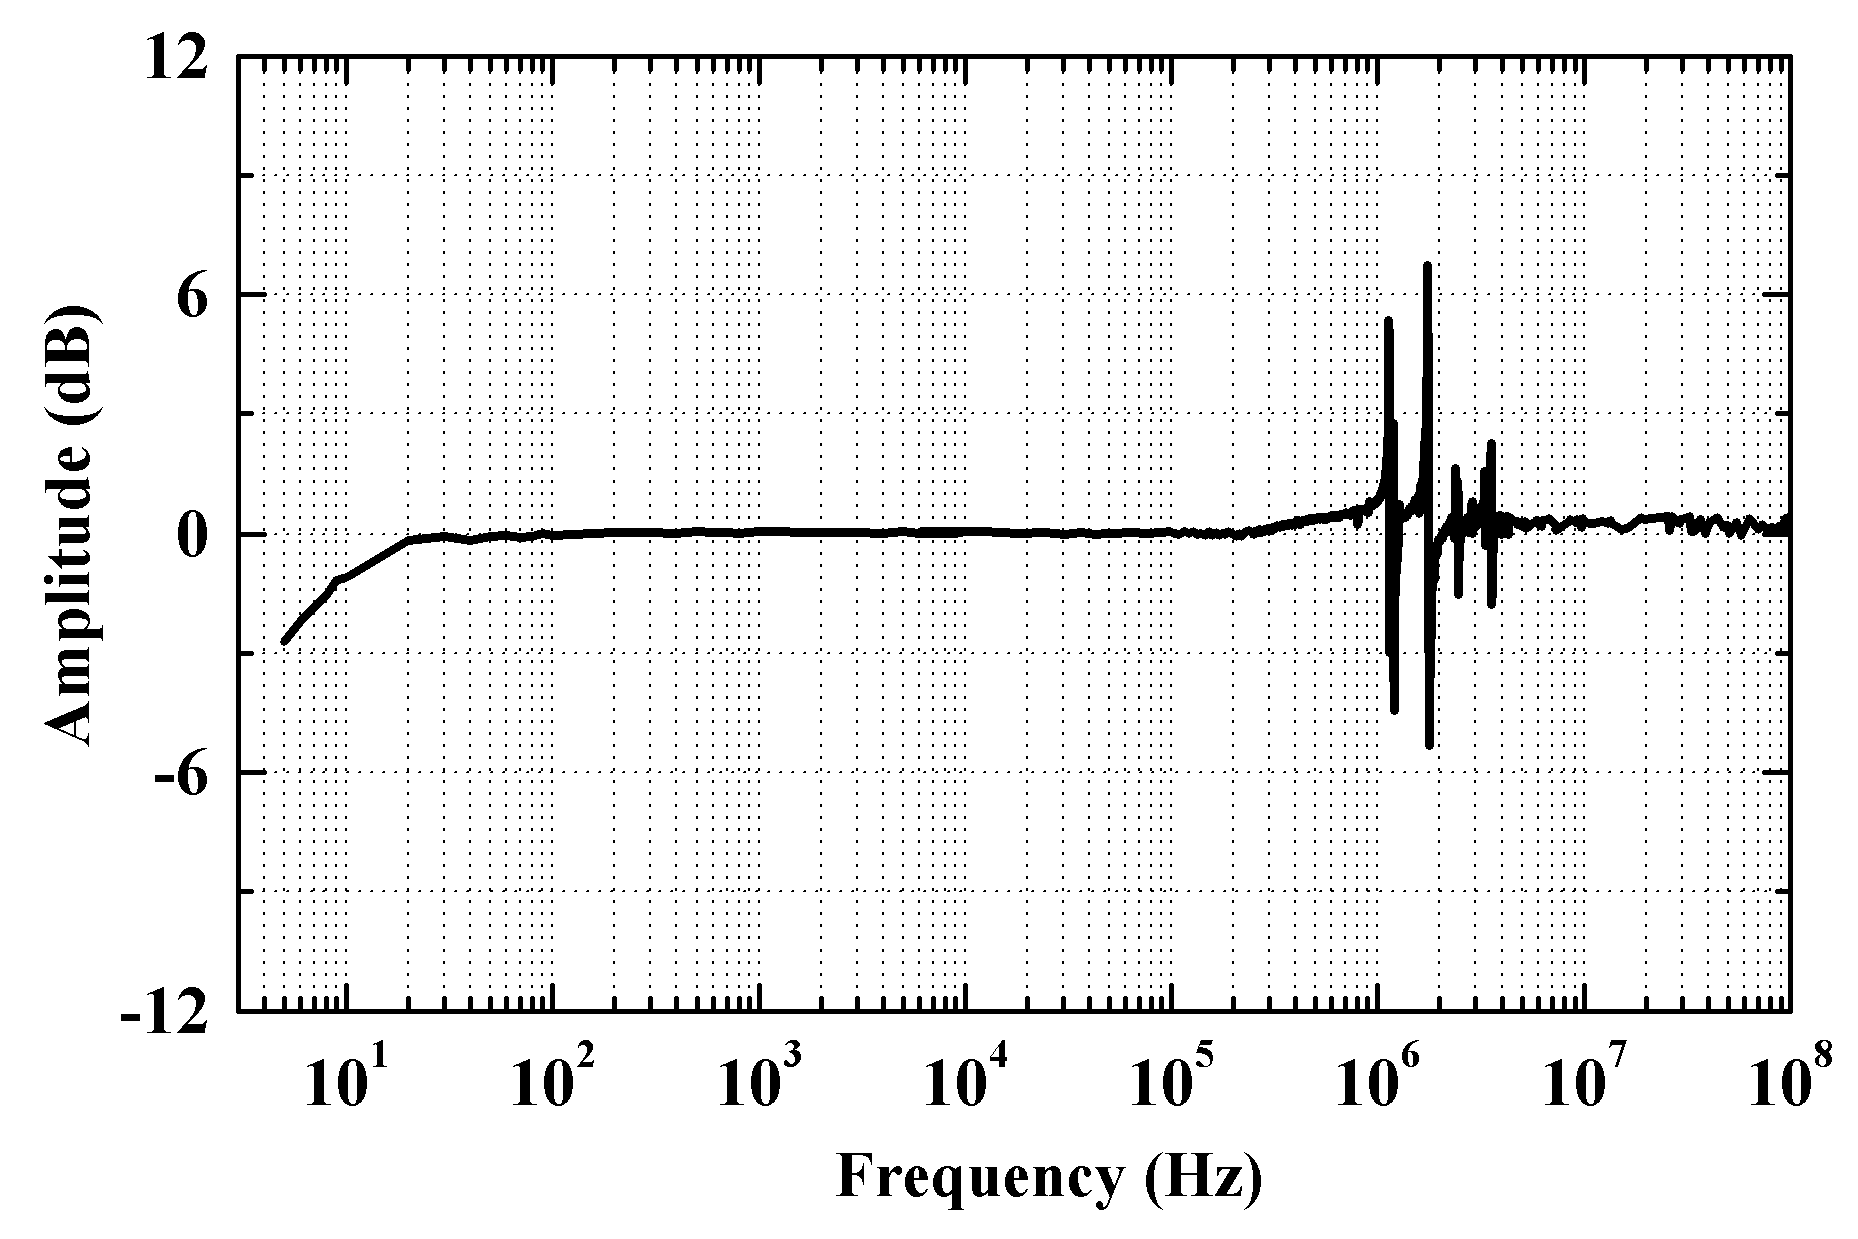
To conduct the frequency response test, a signal generator was employed to generate a standard sinusoidal voltage from 5 Hz to 250 kHz. The frequency response of a higher frequency range is determined by a sharp voltage impulse which was imposed on a transverse electric and magnetic field (TEM) cell. The amplitude-frequency response is shown in
Figure 6. Except for individual resonant frequencies, the curve of the amplitude-frequency response is flat from 5 Hz to 100 MHz.
Based on the characteristics of transient voltages defined in [
5], performances of the measuring system developed in this paper have satisfied the requirements for measuring field transient voltages in AC high-voltage power grid.
3. Results
3.1. Lightning Transient Voltages
3.1.1. Field Test Overview
Considering the randomness of lightning strikes, the measuring system was installed for a certain duration in a 220 kV Yan-Zhuang overhead transmission line connecting the Yanshenshang substation (Y-substation) and the Zhuangshang substation (Z-substation) with 78 towers and the length of 39.8 km. The area of the transmission lines has an average ground flash density about 1.012 times/km2 in 2015 and 2.155 times/km2 in 2016. Measuring systems were arranged on the entrances of Y-substation and Z-substation respectively.
The causes for the transient voltage in a substation are various, including the operations, lightning strikes, electro-magnetic interferences, etc. To distinguish the actual lightning transient voltage, the measuring systems are synchronized with the lightning location system of China (LLS). The LLS includes over 940 lightning detection terminals covering most areas of China. Its average detection efficiency is higher than 90% and the location errors are smaller than 500 m. The errors of GPS clock used in the measuring system and LLS are both within one hundred nanoseconds.
A ground flash event usually contains the first stroke and several subsequent strokes. The period between two continuous strokes is usually longer than 30 ms [
22]. Since the length of Yan-Zhuang line is 39.8 km, the difference of the triggering time of the measuring systems and the LLS will not be longer than 150 μs. Thus, the recorded data is considered to be a lightning transient voltage waveform caused by an involved ground flash, while the measuring system is triggered and the LLS has recorded a ground flash near the Yan-Zhuang line in 1 ms. Moreover, both the event that the measuring equipment is triggered and a ground flash strike to the point near the monitored transmission line are of small probabilities. When two small-probability events happen almost at the same time, it is believed that these two observed processes are the same event.
3.1.2. Typical Measurement Results
In 2017, a total of 832 pieces of data were recorded by the two measuring systems. 650 pieces of data were recorded by the system in Z-substation and 184 pieces of data had been recorded by the system in the Y-substation. 307 pieces of data can be synchronized with a ground flash recorded by the LLS.
Once a lightning stroke was recorded by two measuring systems, the double-end traveling wave location method (DTLM) is activated to determine the position along the Yan-Zhuang line and nearest to the lightning stroke point.
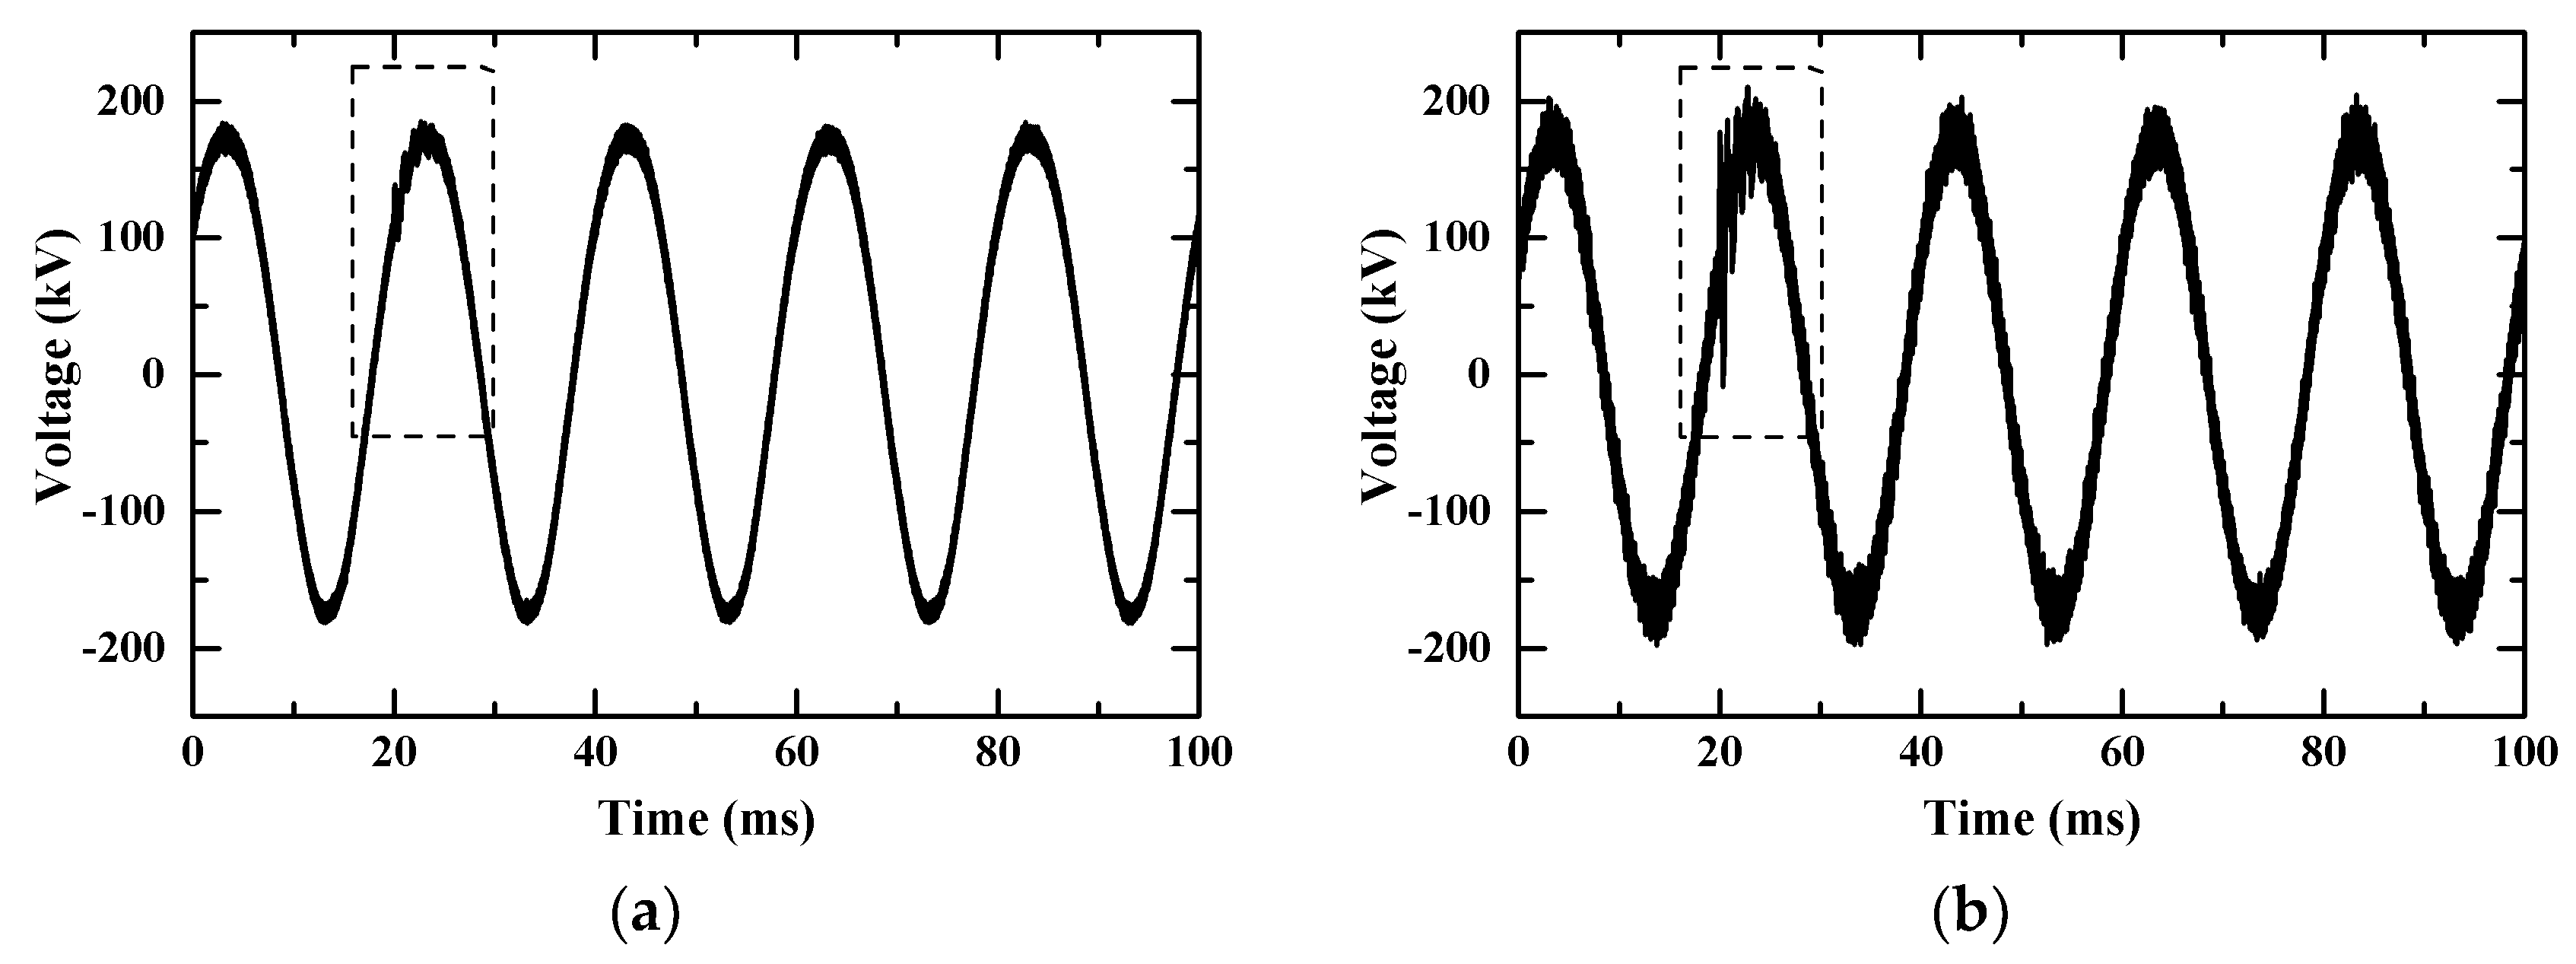
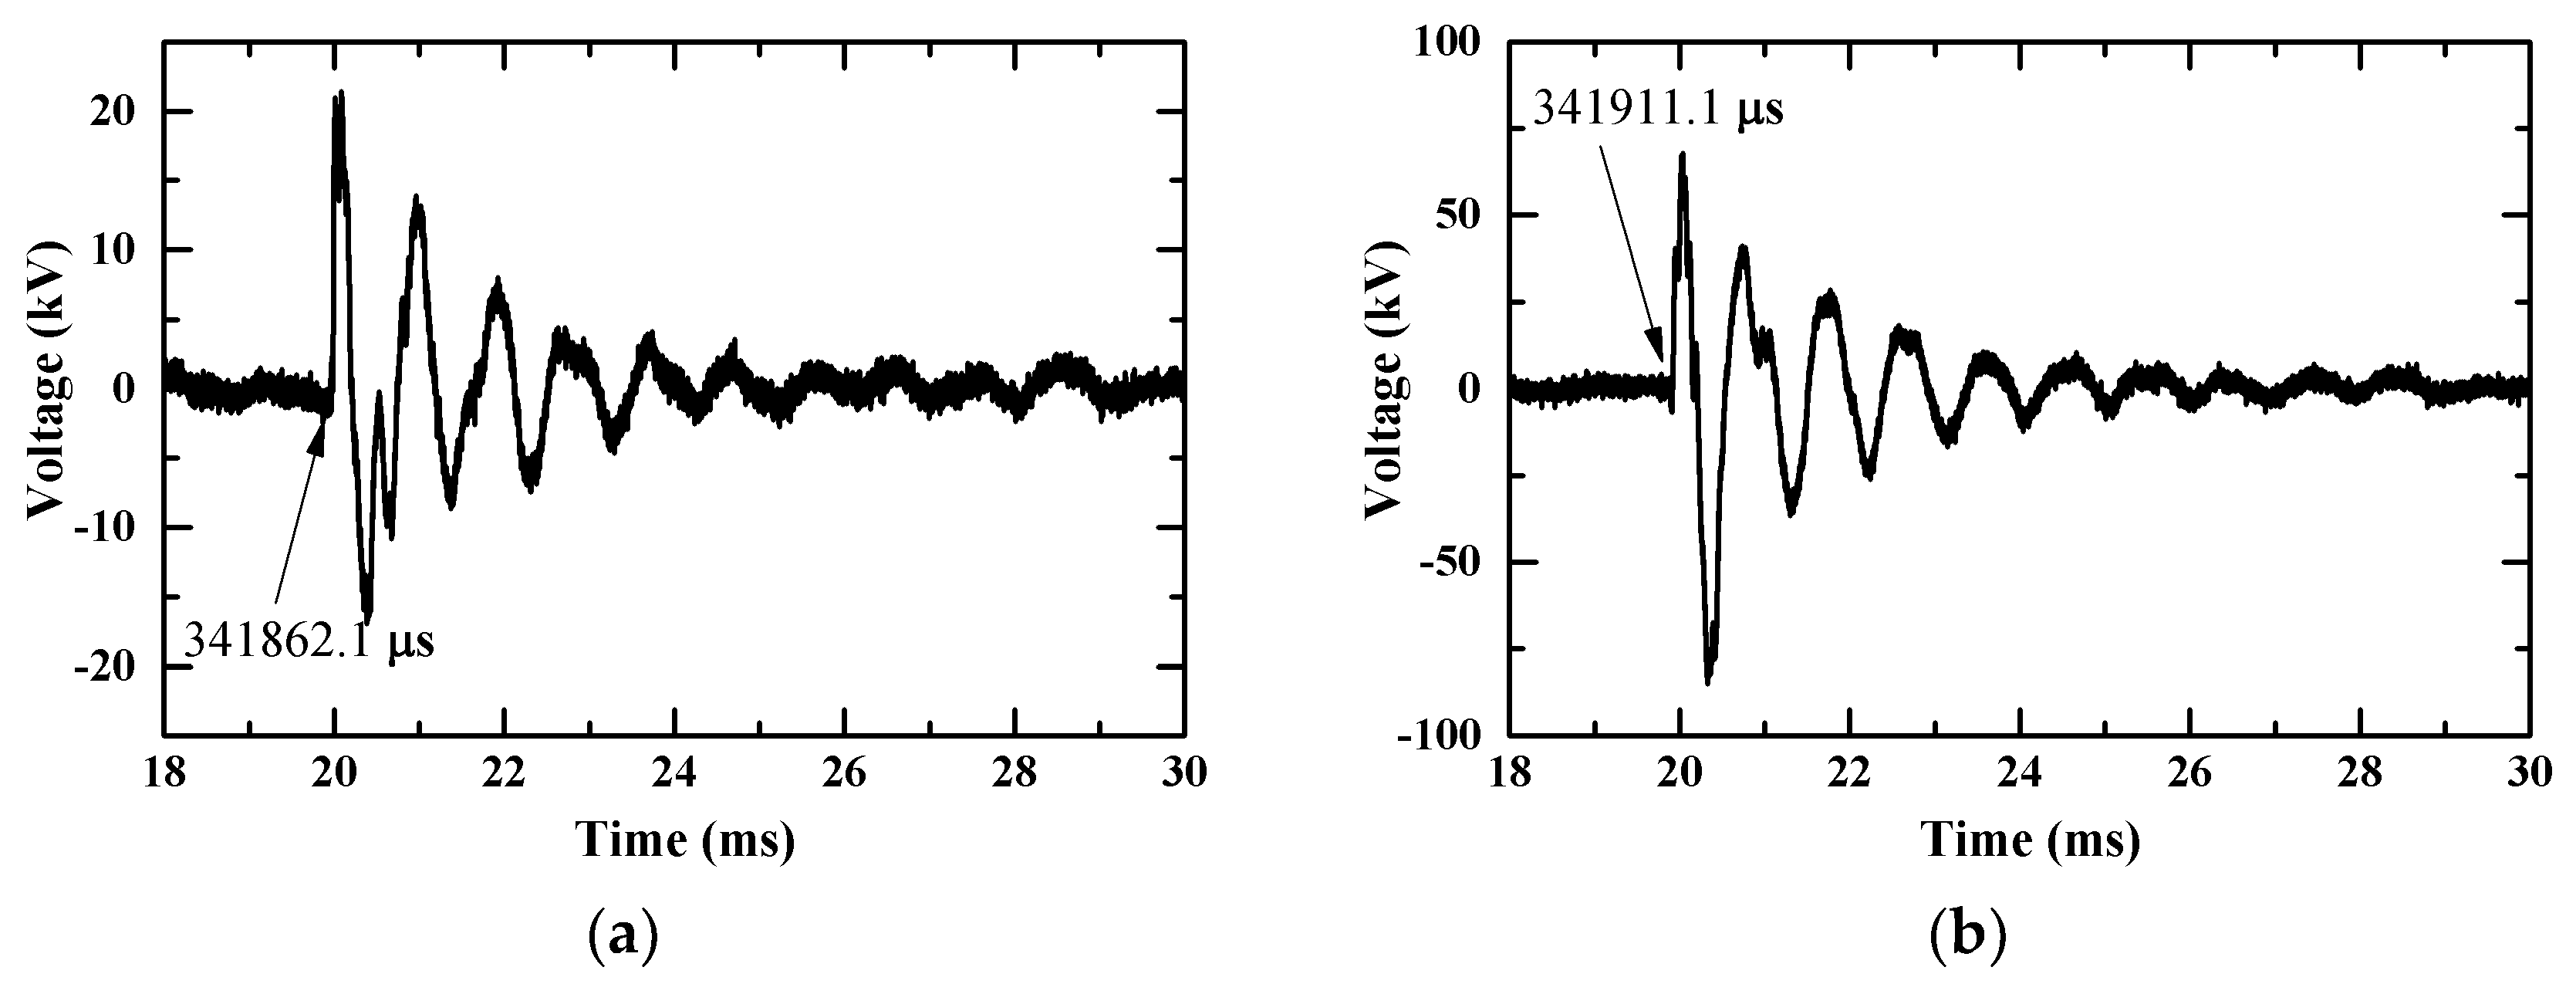
On 13:58:27, May 14th, 2017, the two measuring systems were triggered in succession and the original recorded voltage waveforms from the sensors of phase C are shown in
Figure 7. Obvious voltage fluctuations can be seen in the dotted box. After filtering out the power frequency signal, the lightning transient voltage waveforms are shown in
Figure 8. As shown in the figures, the arriving time of lightning transient voltage for the Y-substation and Z-substation are estimated to be 341,862.1 μs and 341,911.1 μs, respectively. The time difference is 49.0 μs. According to DTLM, the initial position (which is usually the position nearest to the lightning stroke point on the transmission line) of the lightning transient traveling wave is about 12.41 km away from the Y-substation, which is between No. 25 tower and No. 26 tower. Meanwhile, LLS indicated that there was a lightning stroke with a return stroke current of −49.5 kA near No. 23 tower. The location error could be caused by the sag of transmission lines, the distortion of transient voltage during transmitting, the nonideal traveling velocity, and the randomness of the lightning stroke.
3.2. Switching Transient Voltages
3.2.1. Field Test Overview
Series of switching transient voltages were measured by a portable measuring system during the commissioning of 500 kV middle Tibet power grid. In this power grid, the transmission lines are mostly longer than 150 km with an average altitude beyond 3000 m. The operations for the transient voltage measurement mainly include:
- (1)
switching on the no-load long overhead transmission line;
- (2)
switching on the no-load power transformer in the substation;
- (3)
switching off the no-load power transformer in the substation.
For the operation (1), the sensors were arranged under the end terminal of the transmission lines and the sensors were arranged under the entrance conductors of the transformers for the operation (2) and (3).
3.2.2. Typical Measuring Results
(1) Transient voltages during switching on the Tang-Xiang transmission line
Tang-Xiang transmission line connects the 500 kV Batang substation and the 500 kV Xiangcheng substation. The length of this line is about 190 km with the common-tower double-transmission scheme. Before the energization, the line is disconnected at both sides with a suspended potential. The sensors are arranged under the conductors on the Batang substation. The energization process is accomplished by switching on the breakers on the Xiangcheng substation to connect the line to the 500 kV bus bar.
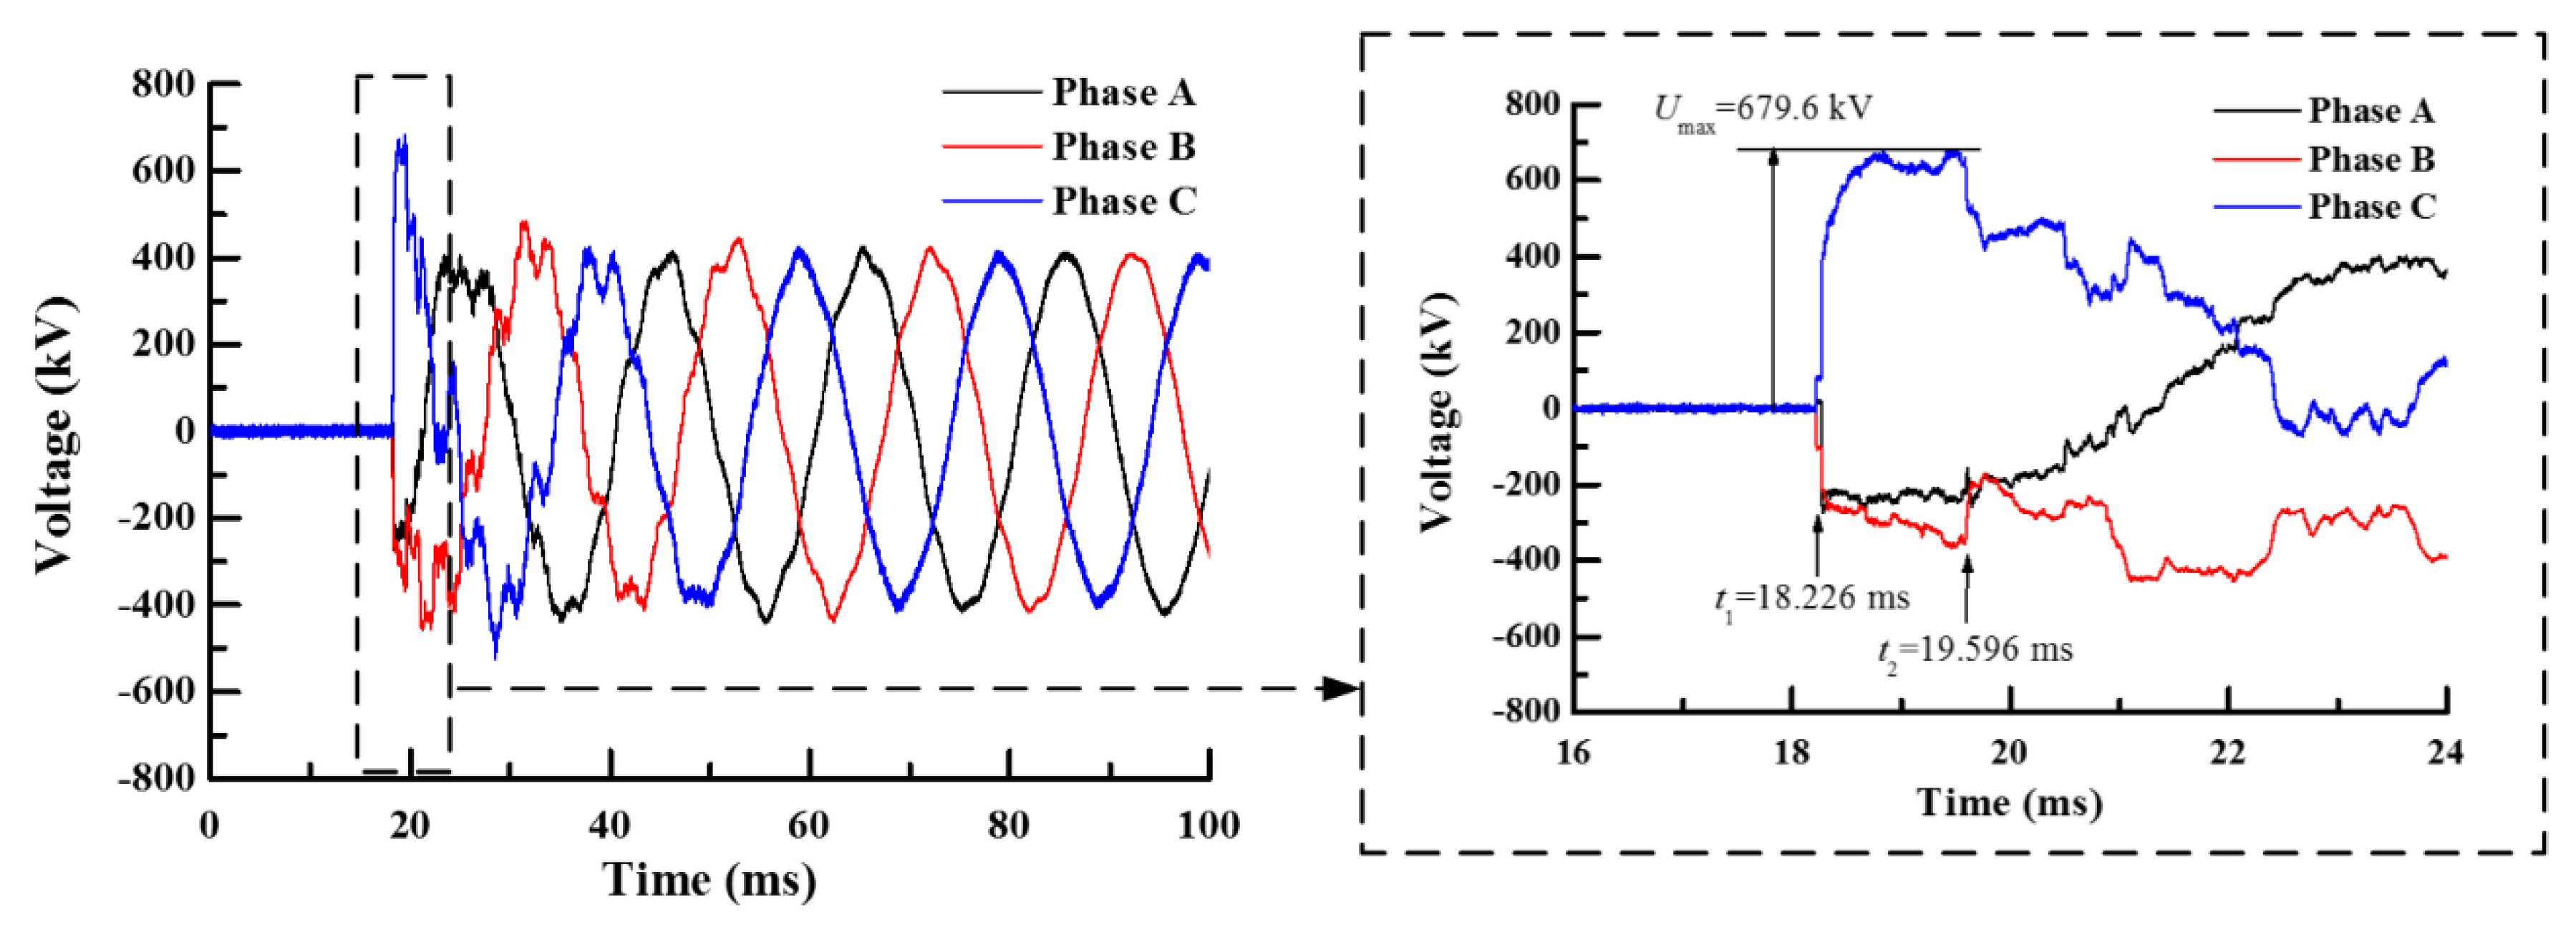
The typical measuring result after the decoupling process for this type of switching transient voltage is shown in
Figure 9. The maximum overvoltage (
Umax) of 679.6 kV appeared on the Phase C which is was 1.66 times as the rated value. While the conductor of Phase C was energized, a negative edge of the voltage formed on Phase B at the Xiangcheng side which then reached the Batang side (sensor installed) at
t1 (18.226 ms). Then this edge further transmitted back to the Xiangcheng substation and then reflected back to the Batang side at
t2 (19.596 ms). During the period between
t1 and
t2, the traveling wave had passed through the transmission line twice. Thus, the actual average velocity of the traveling wave on this line was estimated to be about 2.77 × 10
8 m/s. Moreover, this estimated velocity from field measured data can be used in the fault determination in the future.
(2) Transient voltages during switching on a power transformer to the bus bar
The transient voltages on switching the #3 power transformer onto the 500 kV bus bar on Batang substation were measured and the typical measured results are shown in
Figure 10. To avoid involving overvoltage caused by magnetizing rush current during switching on a no-load power transformer, the closing resistors, and phase selection closing strategy were used during the operations. According to
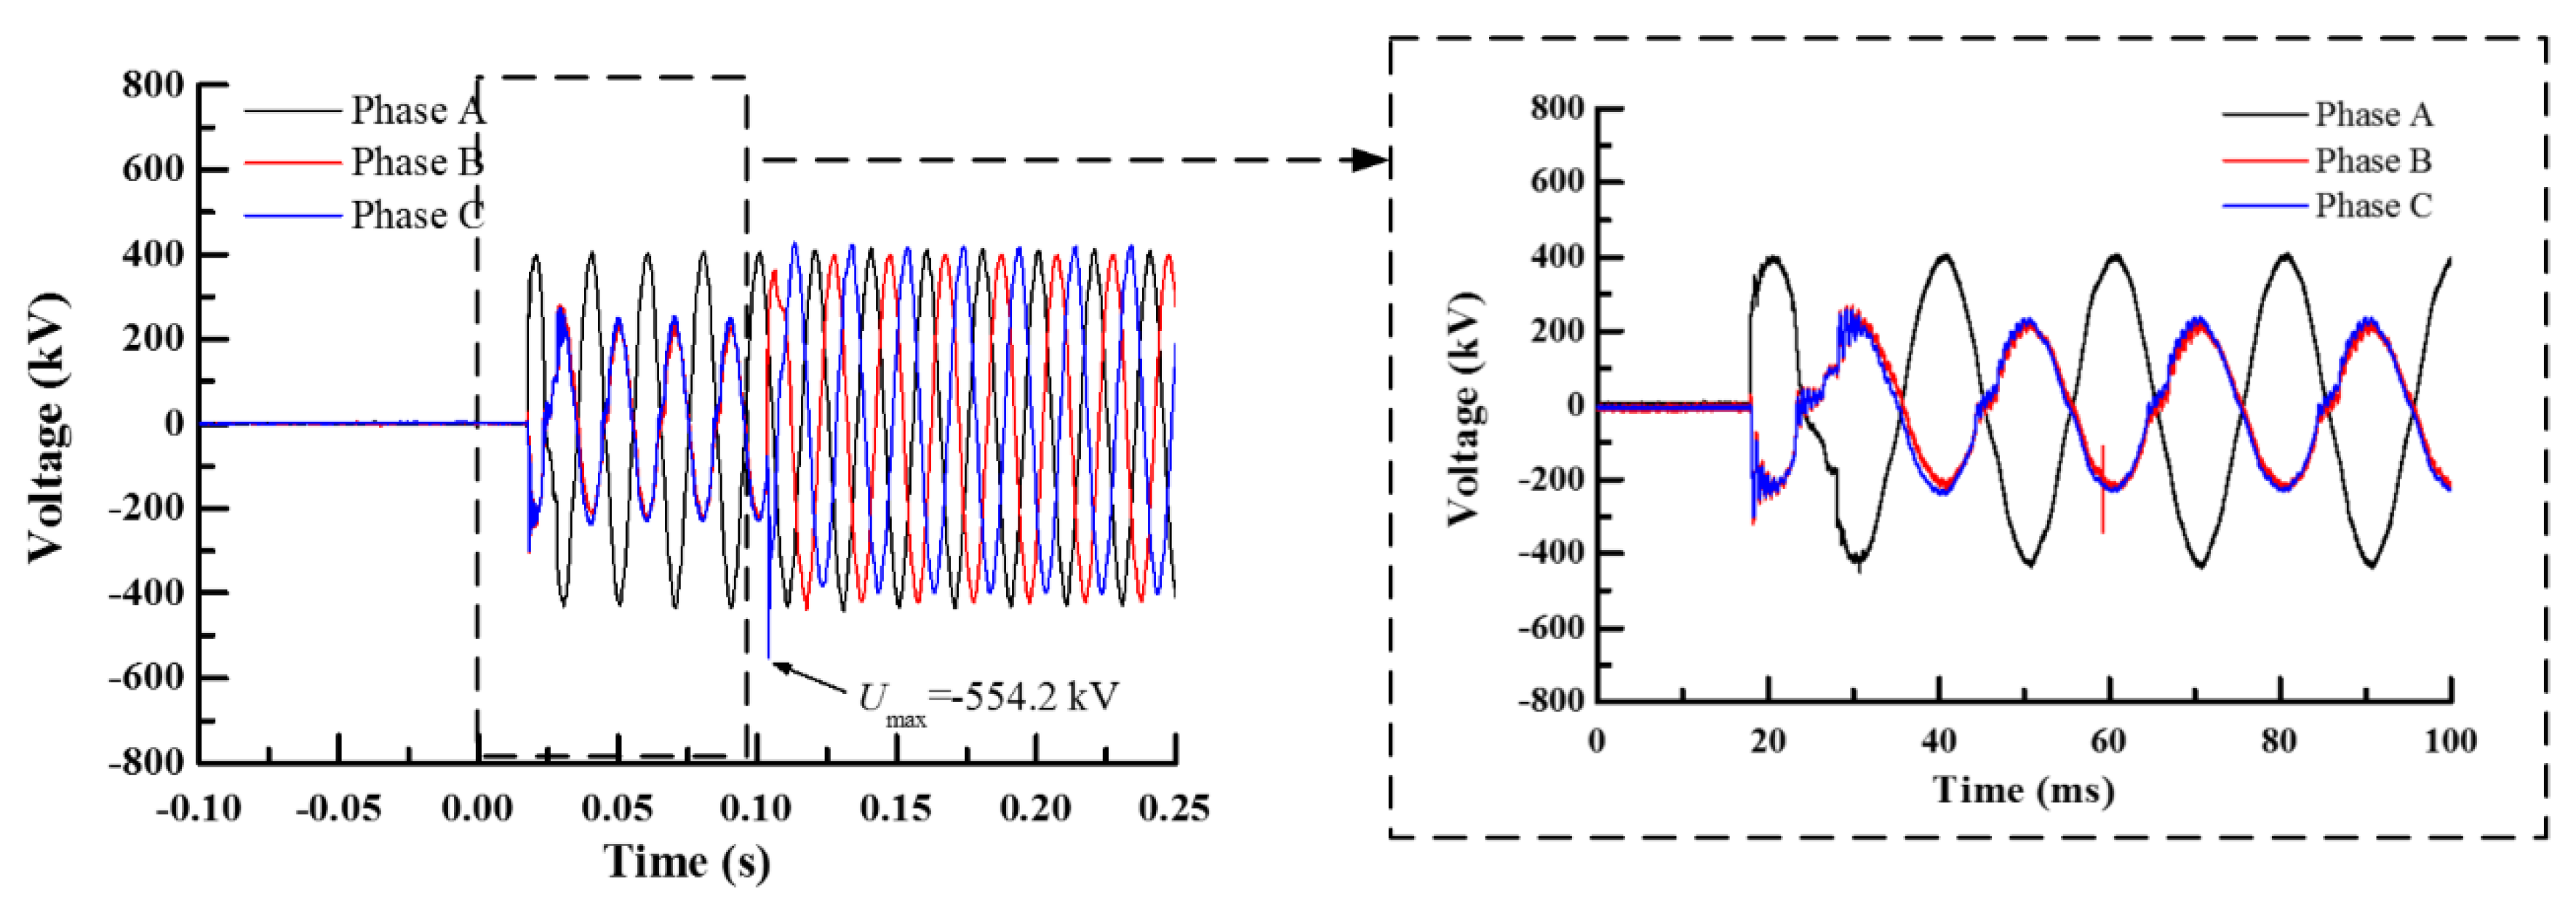
Figure 10, the breaker of Phase A were closed firstly and the voltage on the Phase A conductor reached the rated value immediately. Though the breaker for Phase B and Phase C were still open, the voltage on these two phases rose to about half of the rated value. This is because the flux linkage in the power transformer had been established by the winding of Phase A and the winding for the three phases were in the same flux linkage. About four and a quarter periods later (85.84 ms), the breakers of Phase B and Phase C were closed, and a transient overvoltage of approximately 554.2 kV (1.36 p.u.) can be found on Phase C.
(3) Transient voltages during switching off a power transformer from the bus bar
While switching off the no-load power transformer under non-zero running current, since the current flowing through an inductance never suddenly changes, the residual running current will charge the capacitance connecting to the transformer. This energization process would produce transient overvoltage. The amplitude of the overvoltage mainly depends on the current upon switching off the power transformer. Theoretically, a larger current leads to a higher overvoltage.
The transient voltage while switching off the #3 power transformer from the 500 kV bus bar on Batang substation is shown in
Figure 11. The breaker of Phase C was opened while the voltage just crossed the zero level with a low value. For a no-load power transformer, it can be treated as an inductance of which the current lags the voltage by 90°, indicating the current flowing through Phase C was near its peak value while the breaker opened. In this case, there is an overvoltage with an amplitude of −703.9 kV (1.73 p.u.) on Phase C, while the voltages on Phase A and Phase B are relatively lower.
4. Discussion
4.1. Data Decoupling
According to the measuring principle, a decoupling process is necessary to recover the actual voltage waveforms on a high-voltage conductor from the original measured data, for which the coefficient matrix is the key. Under an ideal condition, the coefficient matrix can be found by static electric field analysis. However, the actual on-site situation brings about unpredictable variations to the matrix. Therefore, determining the matrix from field measured data is more effective and reasonable. In [
23], an example for acquiring the coefficient matrix according to the field measured data is presented in which three capacitor voltage dividers for three phases are switched onto the bus bar by disconnectors. Since the switching processes for the three phases are not absolutely synchronized, the changes of transient voltages would appear asynchronously on the conductors. Taking Phase A as an example, if a sharp voltage change happens in Phase A, all the sensors for the three phases will record an electric field change. According to the definition of
k, the first column of the coefficient matrix could be determined. Using the same method, the second and third columns could also be found by recording a sharp voltage change on Phase B and Phase C. Moreover, based on the phase difference and amplitude among three-phase power frequency voltage, several equations could also be established to solve the
k coefficient in (5). Above three switching transient measurement results are all decoupled.
For the 220 kV Yan-Zhuang overhead transmission line, no asynchronous transient process has been recorded by far. Thus, it is unfortunate that no opportunity has been given to solve the decoupling coefficients. Instead, a calibration work has been planned on the next power outage of this line. In the calibration, the impulse voltage will be applied to each phase conductor by turns to obtain the decoupling coefficients. However, since the data recorded is all triggered by induction strokes, the three-phase waveforms of transient voltages are synchronized with the same variation trend. Moreover, the coefficients in the matrix of (5) have the same polarity. With linear superposition, in (5), the variation trends of the measured electric field waveform (E) and the transient voltage waveform (U) would be the same in the time domain.
Setting the waveform on Phase A, Phase B, and Phase C are
UA(
t),
UB(
t), and
UC(
t), respectively. Since they have the same variation trend, they can express as:
where
Un(
t) is a normalized waveform, and
ma,
mb, and
mc are the amplitude coefficients for
UA(
t),
UB(
t), and
UC(
t), respectively. Taking
Ea-z(t) in (5) as an example, it can be express as:
It is obvious that the composite electric field has the same variation trend with the original transient voltages. In other words, they will have the same value of time parameters, such as the rising time and half wave time. However, the amplitude value needs to implement the decoupling process.
4.2. Characteristics of Lightning Transient Voltages
The general waveform of the measured lightning transient voltage is a damped oscillation curve. The duration of oscillation can be several milliseconds. The distribution of rising time (
tr) and half wave time (
th) are shown in
Figure 12. The rising time (
tr) of measured lightning transient voltage varies from several microseconds to about 200 microseconds. The distribution of
tr is mainly in the region from 10 μs to 50 μs with a middle value of approximately 34.3 μs. The half wave time (
th) varies from several tens of microseconds to about 350 microseconds. The distribution of
th is mainly in the region from 40 μs to 160 μs with a middle value of about 105.25 μs. These features are much different from those of the standard lightning impulse voltage [
24]. Thus, it is necessary to conduct research on the insulation performances under the standard lightning impulse voltage and the actual lightning voltage they suffered.
5. Conclusions
To measure the transient voltages in an AC power grid safely, a non-contact measuring method was developed. An integrated optical electric-field sensor based on the Pockels effect was developed, as well as the measuring system. These measuring systems were used to monitor the lightning transient voltages and measure the typical switching transient voltages.
(1) The measuring system has a response time less than 6 nanoseconds and a relatively flat amplitude-frequency characteristic from 5 Hz to 100 MHz. Its performances meet the requirements for measuring transient voltages in an AC power grid.
(2) In 2017, 307 lightning transient voltage waveforms were recorded on a 220 kV overhead transmission line. All of these transients were caused by induction strokes with damped oscillation waveforms illustrated. Their rising time varies from several microseconds to about 200 microseconds, of which the middle value is 34.3 μs. The distribution of rising time mainly ranges from 10 μs to 50 μs. The half wave time varies from several tens of microseconds to about 350 microseconds, of which the middle value is 105.25 μs. The distribution of half wave time mainly ranges from 40 μs to 160 μs. These features are much different from those of the standard lightning impulse voltage.
(3) Three types of typical switching transient voltages, including switching on the no-load long transmission line, switching on the no-load power transformer, and switching off the no-load power transformer, were measured during the commissioning of 500 kV middle Tibet power grid. A 1.73 p.u. overvoltage was recorded during switching off the no-load power transformer because the breaker cut off the current near its peak value.
(4) Based on the wave transmission theory, the lightning stroke position, the actual transmission velocity of the traveling wave can be estimated with an accurate time of the transient voltage.
The new measuring technology based on optical electric-field sensor supply a more convenient field measuring method for transient voltages.
Author Contributions
Methodology, S.X.; equipment development, S.X., H.Y. (Huaiyuan Yang); field experiment, Y.Z., H.Y. (Huaiyuan Yang), H.Y. (Hao Yu), X.C., and S.X.; project administration, S.C.; writing—original draft preparation, S.X., C.Z.; writing—review and editing, R.H., Z.M.
Funding
This research was funded by the science and technology project of SGCC, grant number 52199918000G.
Acknowledgments
The authors wish to thank the anonymous reviewers, whose comments assisted in improving the clarity of the paper.
Conflicts of Interest
The authors declare no conflict of interest.
References
- Xie, S.; Su, S.; He, H.; Guo, R.; Liu, F.; Zhang, C. Internal Overvoltage and Insulation Coordination of Electrode Line in HVDC Project. High Volt. Eng. 2018, 22, 2331–2337. [Google Scholar]
- Lu, B.; Shi, Y.; Zhan, H.; Duan, S. VFTO Suppression by Selection of a Combination of Initial Phase Angle and Contact Velocity. IEEE Trans. Power Deliv. 2017, 33, 1115–1123. [Google Scholar] [CrossRef]
- Bamne, S.; Kinhekar, N. Estimation and Analysis of VFTO at Various Locations in 132kV GIS Substation. In Proceedings of the 2018 International Conference on Computation of Power, Energy, Information and Communication (ICCPEIC), Chennai, India, 28–29 March 2018. [Google Scholar]
- Zhao, L.; Ye, L.; Wang, S. Research on Very Fast Transient Overvoltage During Switching of Disconnector in 550kV GIS. In Proceedings of the 2018 IEEE 3rd International Conference on Integrated Circuits and Microsystems (ICICM), Shanghai, China, 24–26 November 2018. [Google Scholar]
- International Electrotechnical Commission. IEC 60071-1 Insulation Co-Ordination—Part 1: Definitions, Principle and Rules; IEC Central Office: Geneva, Switzerland, 2006; p. 8. [Google Scholar]
- Feng, Y.; Wang, X.; Chen, X.M.; Wu, S.P.; Mao, A.L. Influence of Circuit Parameters of Capacitor Voltage Transformer on Grid Harmonic Voltage Measurements. Proc. CSEE 2014, 34, 4968–4974. [Google Scholar]
- Xiao, Y.; Fu, J.; Hu, B.; Li, X.; Deng, C. Problems of Voltage Transducer in Harmonic Measurement. IEEE Trans. Power Deliv. 2004, 19, 1483–1487. [Google Scholar] [CrossRef]
- Ghassemi, F.; Gale, P.; Cumming, T.; Coutts, C. Harmonic Voltage Measurements using CVTs. IEEE Trans. Power Deliv. 2005, 20, 443–449. [Google Scholar]
- Sima, W.X.; Lan, H.T.; Du, L.; Sun, C.X.; Yao, C.G.; Yang, Q. Study on Response Characteritics of Voltage Sensor Mounted at the Tap of Transformer Bushing. Proc. CSEE 2006, 26, 172–176. [Google Scholar]
- Malewski, R.; Douville, J.; Lavallee, L. Measurement of switching transients in 735 kV substations and assessment of their severity for transformer insulation. IEEE Trans. Power Deliv. 1988, 3, 1380–1390. [Google Scholar] [CrossRef]
- Ma, G.M.; Li, C.R.; Quan, J.T.; Jiang, J. Measurement of VFTO Based on the Transformer Bushing Sensor. IEEE Trans. Power Deliv. 2011, 26, 684–692. [Google Scholar] [CrossRef]
- Hanson, L.K.; Fajer, J.; Thompson, M.A.; Zerner, M.C. Electrochromic effects of charge separation in bacterial photo synthesis: Theoretical models. J. Am. Chem. Soc. 1987, 109, 4728–4730. [Google Scholar] [CrossRef]
- Fernandez-Valdivielso, C.; Matias, I.R.; Gorraiz, M.; Arregui, F.J.; Bariain, C.; Lopez-Amo, M. Low Cost Electric Field Optical Fiber Detector. In Proceedings of the Optical Fiber Sensors Conference Technical Digest, Portland, OR, USA, 6–10 May 2002. [Google Scholar]
- Shimizu, R.; Matsuoka, M.; Kato, K.; Hayakawa, N.; Hikita, M.; Okubo, H. Development of Kerr electro-optic 3-d electric field measuring technique and its experimental verification. IEEE Trans. Dielectr. Electr. Insul. 1996, 3, 191–196. [Google Scholar] [CrossRef]
- Zahn, M. Optical, electrical and electromechanical measurement methodologies of field, charge and polarization in dielectrics. IEEE Trans. Dielectr. Electr. Insul. 1998, 5, 627–650. [Google Scholar] [CrossRef]
- Zeng, R.; Wang, B.; Niu, B.; Yu, Z. Development and Application of Integrated Optical Sensors for Intense E-Field Measurement. Sensors 2012, 12, 11406–11434. [Google Scholar] [CrossRef] [PubMed] [Green Version]
- Hidaka, K. Progress in Japan of space charge field measurement in gaseous dielectric using a pockels sensor. IEEE Electr. Insul. Mag. 1996, 12, 17–28. [Google Scholar] [CrossRef]
- Kuhara, Y.; Hamasaki, Y.; Kawakami, A.; Murakami, Y.; Tatsumi, M.; Takimoto, H.; Tada, K.; Mitsui, T. BSO/fibre-optic Voltmeter with Excellent Temperature Stability. Electron. Lett. 1982, 18, 1055–1056. [Google Scholar] [CrossRef]
- Mitsui, T.; Hosoe, K.; Usami, H.; Miyamoto, S. Development of Fiber-optic Voltage Sensors and Magnetic-field Sensors. IEEE Trans. Power Deliv. 1987, 2, 87–93. [Google Scholar] [CrossRef]
- Kanda, M.; Masterson, K.D. Optically Sensed EM-field Probes for Pulsed Fields. Proc. IEEE 1992, 80, 209–215. [Google Scholar] [CrossRef]
- Bulmer, C.H.; Burns, W.K.; Moeller, R.P. Linear Interferometric Waveguide Modulator for Electromagnetic-Field Detection. Opt. Lett. 1980, 5, 176–178. [Google Scholar] [CrossRef] [PubMed]
- Cooray, G.V. The Lightning Flash, 2nd ed.; The Institution of Engineering and Technology: London, UK, 2008; p. 191. [Google Scholar]
- Xie, S.; Wang, H.; Zeng, R. Overvoltage Measurement Technique Based on Integrated Optical Electric Field Sensor. High Volt. Eng. 2016, 42, 2929–2935. [Google Scholar]
- International Electrotechnical Commission. IEC 60060-3 High Voltage Test Techniques—Part 3 Definitions and Requirements for On-Site Tests; IEC Central Office: Geneva, Switzerland, 2006; p. 17. [Google Scholar]
© 2019 by the authors. Licensee MDPI, Basel, Switzerland. This article is an open access article distributed under the terms and conditions of the Creative Commons Attribution (CC BY) license (http://creativecommons.org/licenses/by/4.0/).


