Article

Effects of Hepatic Steatosis on Non-Invasive Liver Fibrosis Measurements Between Hepatitis B and Other Etiologies

1
Department of Gastroenterology and Hepatology, Chang Gung Memorial Hospital, Linkou Medical Center, Tao-Yuan 333, Taiwan
2
Department of Public Health and Center of Biostatistics, Chang Gung University College of Medicine, Tao-Yuan 333, Taiwan
3
Division of Molecular and Genomic Medicine, National Health Research Institute, Taipei 115, Taiwan
4
Department of Medical imaging and Radiological Sciences, College of Medicine, Institute for Radiological Research, Chang Gung University, Taoyuan 333, Taiwan
5
Department of Internal Medicine, Chang Gung Memorial Hospital, Linkou Medical Center, Tao-Yuan 333, Taiwan
*
Author to whom correspondence should be addressed.
Submission received: 3 April 2019 / Revised: 2 May 2019 / Accepted: 6 May 2019 / Published: 13 May 2019
(This article belongs to the Special Issue Ultrasound Technology for Clinical Diagnosis and Decisions Making)

Abstract

:
Fibrosis-4 (FIB4), transient elastography (TE), and acoustic radiation force impulse (ARFI) are popular modalities to assess liver fibrosis. Their cutoff values for degrees of fibrosis vary between studies. The influence of hepatic steatosis on fibrosis measurements for different etiologies was evaluated. Data from a consecutive series of patients who received fibrosis measurement were included for the training group. An additional series with histology served as the validation group. A standardized protocol was performed for both TE and ARFI, mostly by a single technician. Patients with alcoholism, autoimmune disease, active inflammation, or who were receiving therapy were excluded. The training group included 215 patients and the validation group included 221. The correlation of liver stiffness between TE and ARFI was good (R2 linear = 0.798; p < 0.001). Different correlations between ARFI and TE were noted between high and low control attenuation parameter (CAP) values (cutoff: 290 dB/m), especially in the non-hepatitis B subgroups. Relatively lower FIB4 and TE values were seen in the high CAP versus low CAP in patients with histology-proven non-alcoholic fatty liver disease and chronic hepatitis C. FIB4 cutoff values were >25% lower among F2-F4 stages and the TE cutoff value for F4 was 8.5% lower in the high versus low CAP group. Such findings were not observed in chronic hepatitis B. Different fibrogenesis mechanisms between hepatitis B and non-B are discussed. We conclude that hepatic steatosis significantly impacts FIB4 and TE fibrosis measurements in non-hepatitis B-related liver diseases. Fibrosis grade should be interpreted with caution in severe steatosis.

1. Introduction

Liver inflammation and the subsequent scaring process will induce liver fibrosis. Liver cirrhosis is an end stage of hepatic fibrosis characterized by distortion of the hepatic architecture and change of blood perfusion. Patients with cirrhosis are susceptible to a variety of complications and their life expectancy can be markedly reduced. Subjects with moderate fibrosis is generally an indication for specific therapy to prevent liver cirrhosis. The gold standard for liver fibrosis evaluation is a liver biopsy. However, a biopsy is an invasive procedure with risks of bleeding, infection or organ injury. Many non-invasive methods have been developed for the evaluation of liver fibrosis.
The fibrosis-4 (FIB4) index, transient elastography (TE) and acoustic radiation force impulse (ARFI) imaging are the three most popular non-invasive modalities for the assessment of liver fibrosis [1,2,3,4,5]. However, the cutoff values for fibrosis staging vary between institutes and liver disease etiologies (Supplementary Table S1). These three modalities are generally well-correlated, but they each have different advantages and limitations. FIB4 is calculated from routine laboratory data in addition to age [6]. It is inexpensive but has a relatively low area under the receiver operating characteristic curve (AUROC) values [7]. TE measurement by FibroScan (Echosens, Paris, France) is a well-standardized modality for the measurement of both liver fibrosis and steatosis [8,9,10]. Although the AUROC, sensitivity, and specificity of TE are all excellent, with values near 0.9 for the diagnosis of Hepatitis C Virus (HCV)-related liver cirrhosis [1,10,11], a considerable failure rate in the presence of obesity has been well documented [12]. The FibroScan XL probe was designed to overcome this issue; however, selecting between the FibroScan M and XL probes remains a problem, as does comparing data collected between the two probes [8,13,14,15,16]. In addition, without guided imaging, the measurements may be misleading if focal lesions in the right hepatic lobe are present [17]. In contrast, ARFI enables the selection of an optimal location for measurements. However, the study protocol for ARFI is relatively poorly standardized, and there are concerns regarding inter-observer and inter-location variation [18]. It should be noted that conventional ultrasound is also useful in screening for liver cirrhosis [19,20]. However, it is a subjective modality, and the bright liver echo pattern may mask the coarseness of the liver parenchyma in the presence of steatosis [21]. Ultrasound based-elastography has the great advantage of enabling the measurement of liver stiffness in patients with steatosis [2,8,9]. The prevalence of hepatic steatosis is increasing; it was around 20% between 2003 and 2015 and is expected to increase to 27% by 2030 [22,23,24]. Since there are currently different staging cutoff values for various etiologies (Supplementary Table S1), this study sought to improve the interpretation of liver fibrosis. The effects of hepatic steatosis and various etiologies on non-invasive modalities to determine liver stiffness were evaluated in non-biopsy cases, and the findings were validated in histology-proven cases.

2. Materials and Methods

2.1. Patients

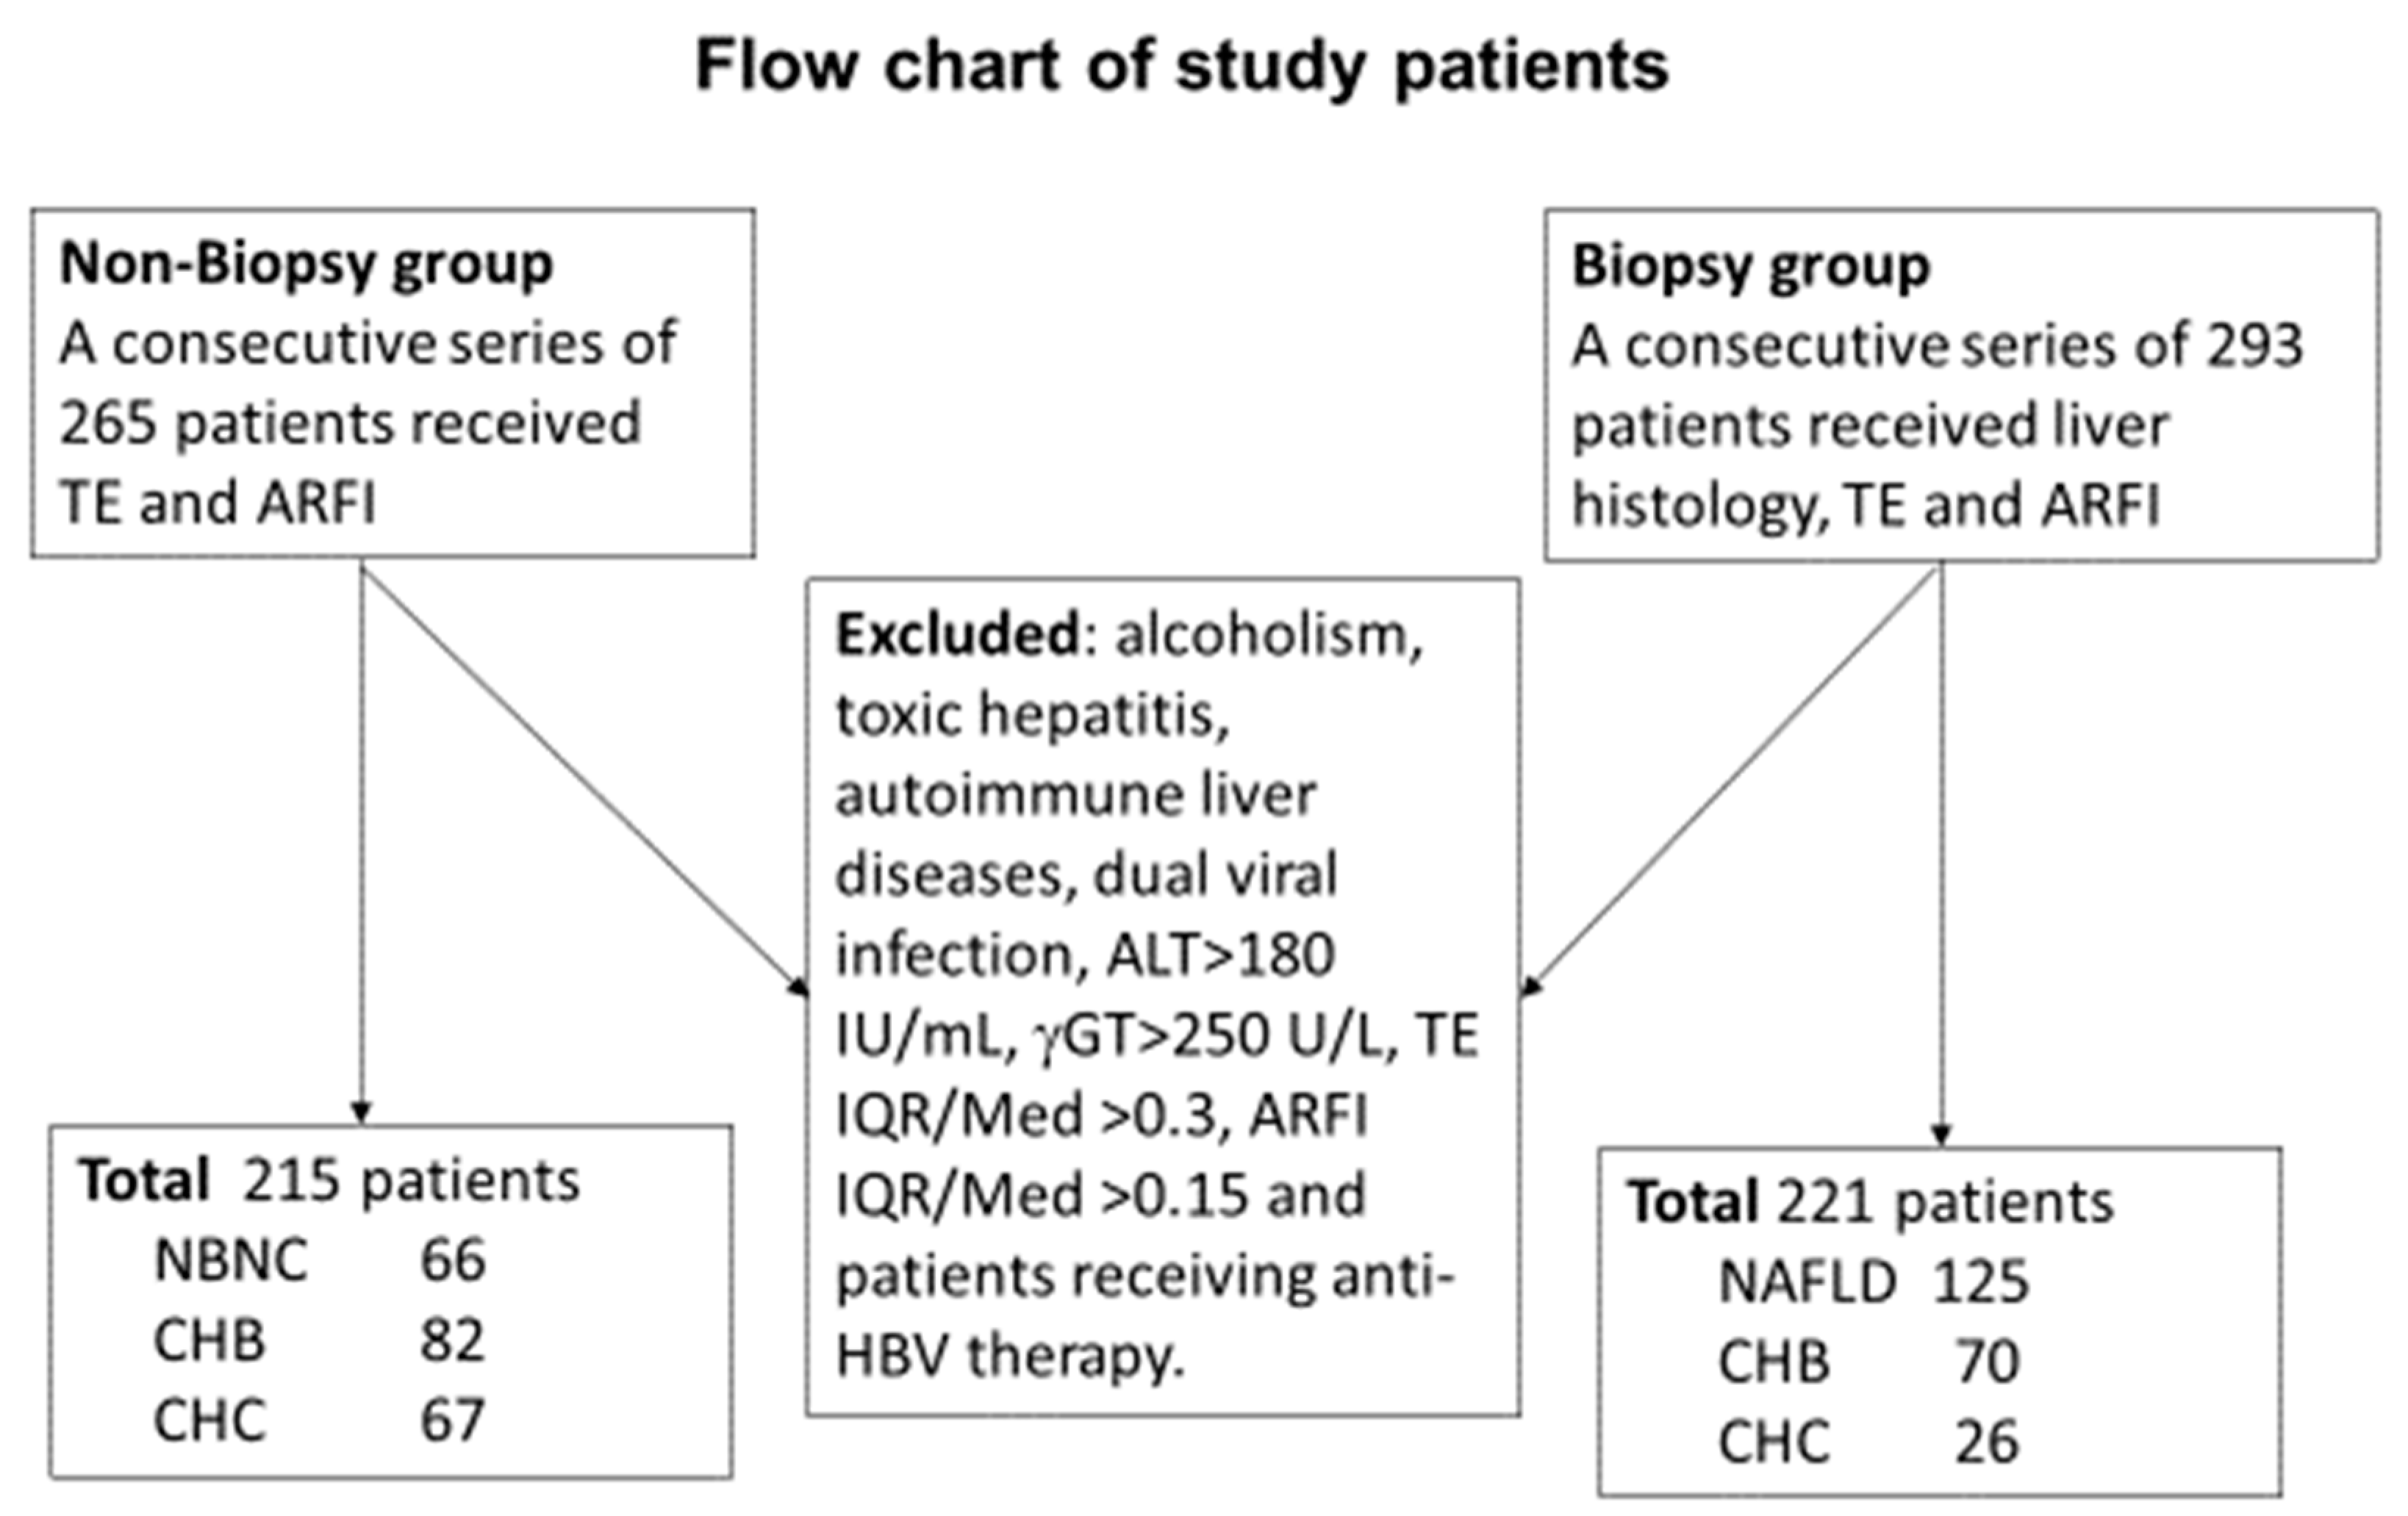
A consecutive series of patients who received a diagnosis of liver fibrosis and underwent laboratory evaluations between January and August 2017 were retrospectively enrolled in the initial non-biopsy training group. An additional series of patients who underwent liver histology studies between July 2016 and February 2019 were prospectively enrolled in the biopsy group.
Hemogram blood testing, liver biochemistry, and serology tests were performed for all patients, as described in our previous reports [7,18]. The patients were divided into three groups according to the presence or absence of viral markers: patients seronegative for hepatitis B surface antigen (HBsAg) and HCV antibodies (anti-HCV) were classified into the non-B/non-C liver cirrhosis (NBNC) group; while patients seropositive for either HBsAg or anti-HCV were classified into the chronic hepatitis B (CHB) or chronic hepatitis C (CHC) group, respectively. For patients who received liver histology study, those in the NBNC group with fat cell fractions greater than 5% were classified as having non-alcoholic fatty liver disease (NAFLD).
All patients considered for this study were over 18 years of age. Patients with decompensated liver disease, an alanine aminotransferase (ALT) level >180 IU/mL, a gamma glutamyl transpeptidase level >250 U/L, toxic hepatitis, alcoholism, autoimmune liver diseases, dual viral infection, or who were receiving therapy were excluded.
This study was approved by the Institute Review Board of Chang Gung Memorial Hospital (IRB:104-2353C, 201801283B0 and 201601928B0). Written informed consent was obtained from all participants prior to commencing the study.

2.2. Methods

All participants received the following evaluations within four weeks of the liver histology study: hemogram, liver biochemistry, assessment of viral markers, ARFI, and TE. All related data were officially reported in the hospital’s electronic database prior to obtaining the liver histology report. The FIB4 index was calculated according to the method published by Vallet-Pichard et al. [6]. The FIB-4 values were calculated automatically using the formula: age (years) × AST [U/L]/(platelets [109/L] × (ALT [U/L])1/2).
TE measurements (FibroScan 502 touch machine; Echosens) were obtained according to the manufacturer’s standard protocol. After at least three hours of fasting, ten measurements were done from the right intercostal space with the patient in the supine posture. Selection of the M or XL probe was determined by the device. Liver steatosis was measured by the control attenuation parameter (CAP) value during the TE study. ARFI (Acuson S2000; Siemens Healthcare, Erlangen, Germany) imaging was conducted according to the published guidelines by obtaining measurements in two locations [25], with slight modification [7,18]. Briefly, two locations from the right intercostal space were selected for assessment; one was at the right upper liver and the other was at the right lower liver based on optimal 2D imaging. At each location, 10 measurements were performed with the area of interest perpendicular to the skin. The mean of the medians from the two locations was recorded. Patients maintained slow spontaneous breathing during the measurements. Most of the measurements were conducted by an ultrasound technologist with 25 years of experience.
The liver fibrosis status in the non-biopsy group was estimated according to our experience in ARFI studies (in press, JMU 2019). The cutoff values for the estimated fibrosis scores of <2, 2, 3, and 4 were as follows: 1.25, 1.32, 1.79 m/s for the NBNC group; 1.22, 1.32, 1.46 m/s for the CHB group; and 1.23, 1.37, 1.71 m/s for the CHC group. The severity of liver fibrosis in the biopsy group was determined according to the METAVIR fibrosis grading system [26]. For patients with non-alcoholic fatty liver diseases (NAFLD), diagnosis and fibrosis grading were based on the criteria published by Kleiner et al. [27]. All TE data were correlated with the ARFI measurements and then stratified according to the CAP value.

2.3. Statistics

Patient characteristics were expressed as the number and percentage, or the mean ± standard deviation (SD), as appropriate. Continuous variables of the three independent groups were compared using Student’s t-test and one-way analysis of variance (ANOVA) with Bonferroni correction. Categorical variables were tested using Fisher’s exact test, the chi-square test, or the chi-square test for trend, as applicable. A generalized linear model was used for correlation analysis between the ARFI and TE studies, and the interaction between different CAP groups was also analyzed. The receiver-operating characteristic (ROC) curves and AUROC values were calculated to determine the best predictive points for different histology fibrosis scores. After determining the ideal cutoff values, diagnostic sensitivity and specificity were calculated for discrimination of F2 to 4, F3 to 4, and F4 versus other fibrosis stages. Statistical analyses were performed using SPSS software (version 22; SPSS Inc., Chicago, IL, USA), and a p-value of <0.05 was considered to indicate statistical significance.

3. Results

A total of 215 patients who underwent FIB4, TE, and ARFI measurements were included retrospectively in the non-biopsy group. In this group, 66 cases were classified as NAFLD, 82 as CHB, and 67 as CHC. An additional group of 221 consecutive patients who underwent liver histology studies were enrolled in the validation group. In this group, 125 cases were classified as NAFLD, 70 as CHB, and 26 as CHC (Figure 1).
In the non-biopsy training group, more men were included than women (p < 0.001; Table 1a), particularly in the CHB subgroup. The CHB subgroup had the youngest mean age (53.38 ± 10.91), followed by the NBNC (57.10 ± 11.10) and CHC (62.48 ± 9.67) subgroups (statistical significance of differences can be summarized by the following formula: [(NBNC = CHB) ≠ CHC]). The body mass index (BMI) was higher in the NBNC subgroup than in the viral hepatitis subgroups [NBNC ≠ (CHB = CHC)]. The platelet count was lower in the CHC subgroup than in NBNC subgroup [NBNC ≠ CHC], while the AST and ALT levels were lower in the CHB subgroup than in the other two subgroups [CHB ≠ (NBNC = CHC)]. The estimated fibrosis score 4 was least frequent in the CHB subgroup (14.6%), followed by NBNC (24.2%), while it was the highest in the CHC (31.3%) subgroup (p = 0.033).
In the biopsy group, hepatocellular carcinoma (HCC) was more frequent among the chronic hepatitis subgroups than the NAFLD subgroup ([NAFLD ≠ (HCB = CHC)]; Table 1b). The mean age was younger in NAFLD (49.85 ± 13.43 years) than CHC (57.91 ± 8.35 years, p = 0.007). ALT levels were elevated in the NAFLD subgroup compared to the other two subgroups [NAFLD ≠ (CHB = CHC)]. The platelet count was higher, and the prothrombin time (INR) was lower, in the NAFLD subgroup than in the viral hepatitis subgroups [NAFLD ≠ (CHB = CHC)]. Lower fibrosis grades with higher fat cell fractions were noted in the NAFLD subgroup than in the viral hepatitis subgroups [NAFLD ≠ (CHB = CHC)]. Sixteen-one (48.8%) patients in the NAFLD subgroup had fat cell fractions greater than 66%, compared to only 15.4% and 15.7% of patients in the CHB and CHC subgroups, respectively. Liver stiffness was successfully measured by TE and ARFI in all study patients. However, 5 patients with ARFI measurement interquartile ranges (IQR)/median values greater than 15% and two with TE measurement IQR/median values greater than 30% were excluded from this study.
In the non-biopsy group, lower liver stiffness values measured by FIB4, ARFI, and TE were noted in the CHB subgroup in comparison to the CHC subgroup [(B ≠ C); Table 2a]. CAP levels were higher in the NBNC subgroup than in the CHC subgroup (N ≠ C).
In the biopsy group, liver fibrosis scores more severe in the viral hepatitis subgroups than the NBNC subgroup [N ≠ (B = C); Table 2b]. The liver stiffness measurements were generally more severe in CHC than in NAFLD [(N ≠ C); Table 2a]. The fat cell fraction was higher in the NAFLD subgroup [N ≠ (B = C)] than in the viral hepatitis groups.
The CAP values were correlated with the histology fat cell fractions (R2 linear = 0.615, Spearman’s rho p < 0.001) in all participants. However, the correlation reached a plateau when the CAP values were ≥290 dB/m (R2 linear = 0.009).
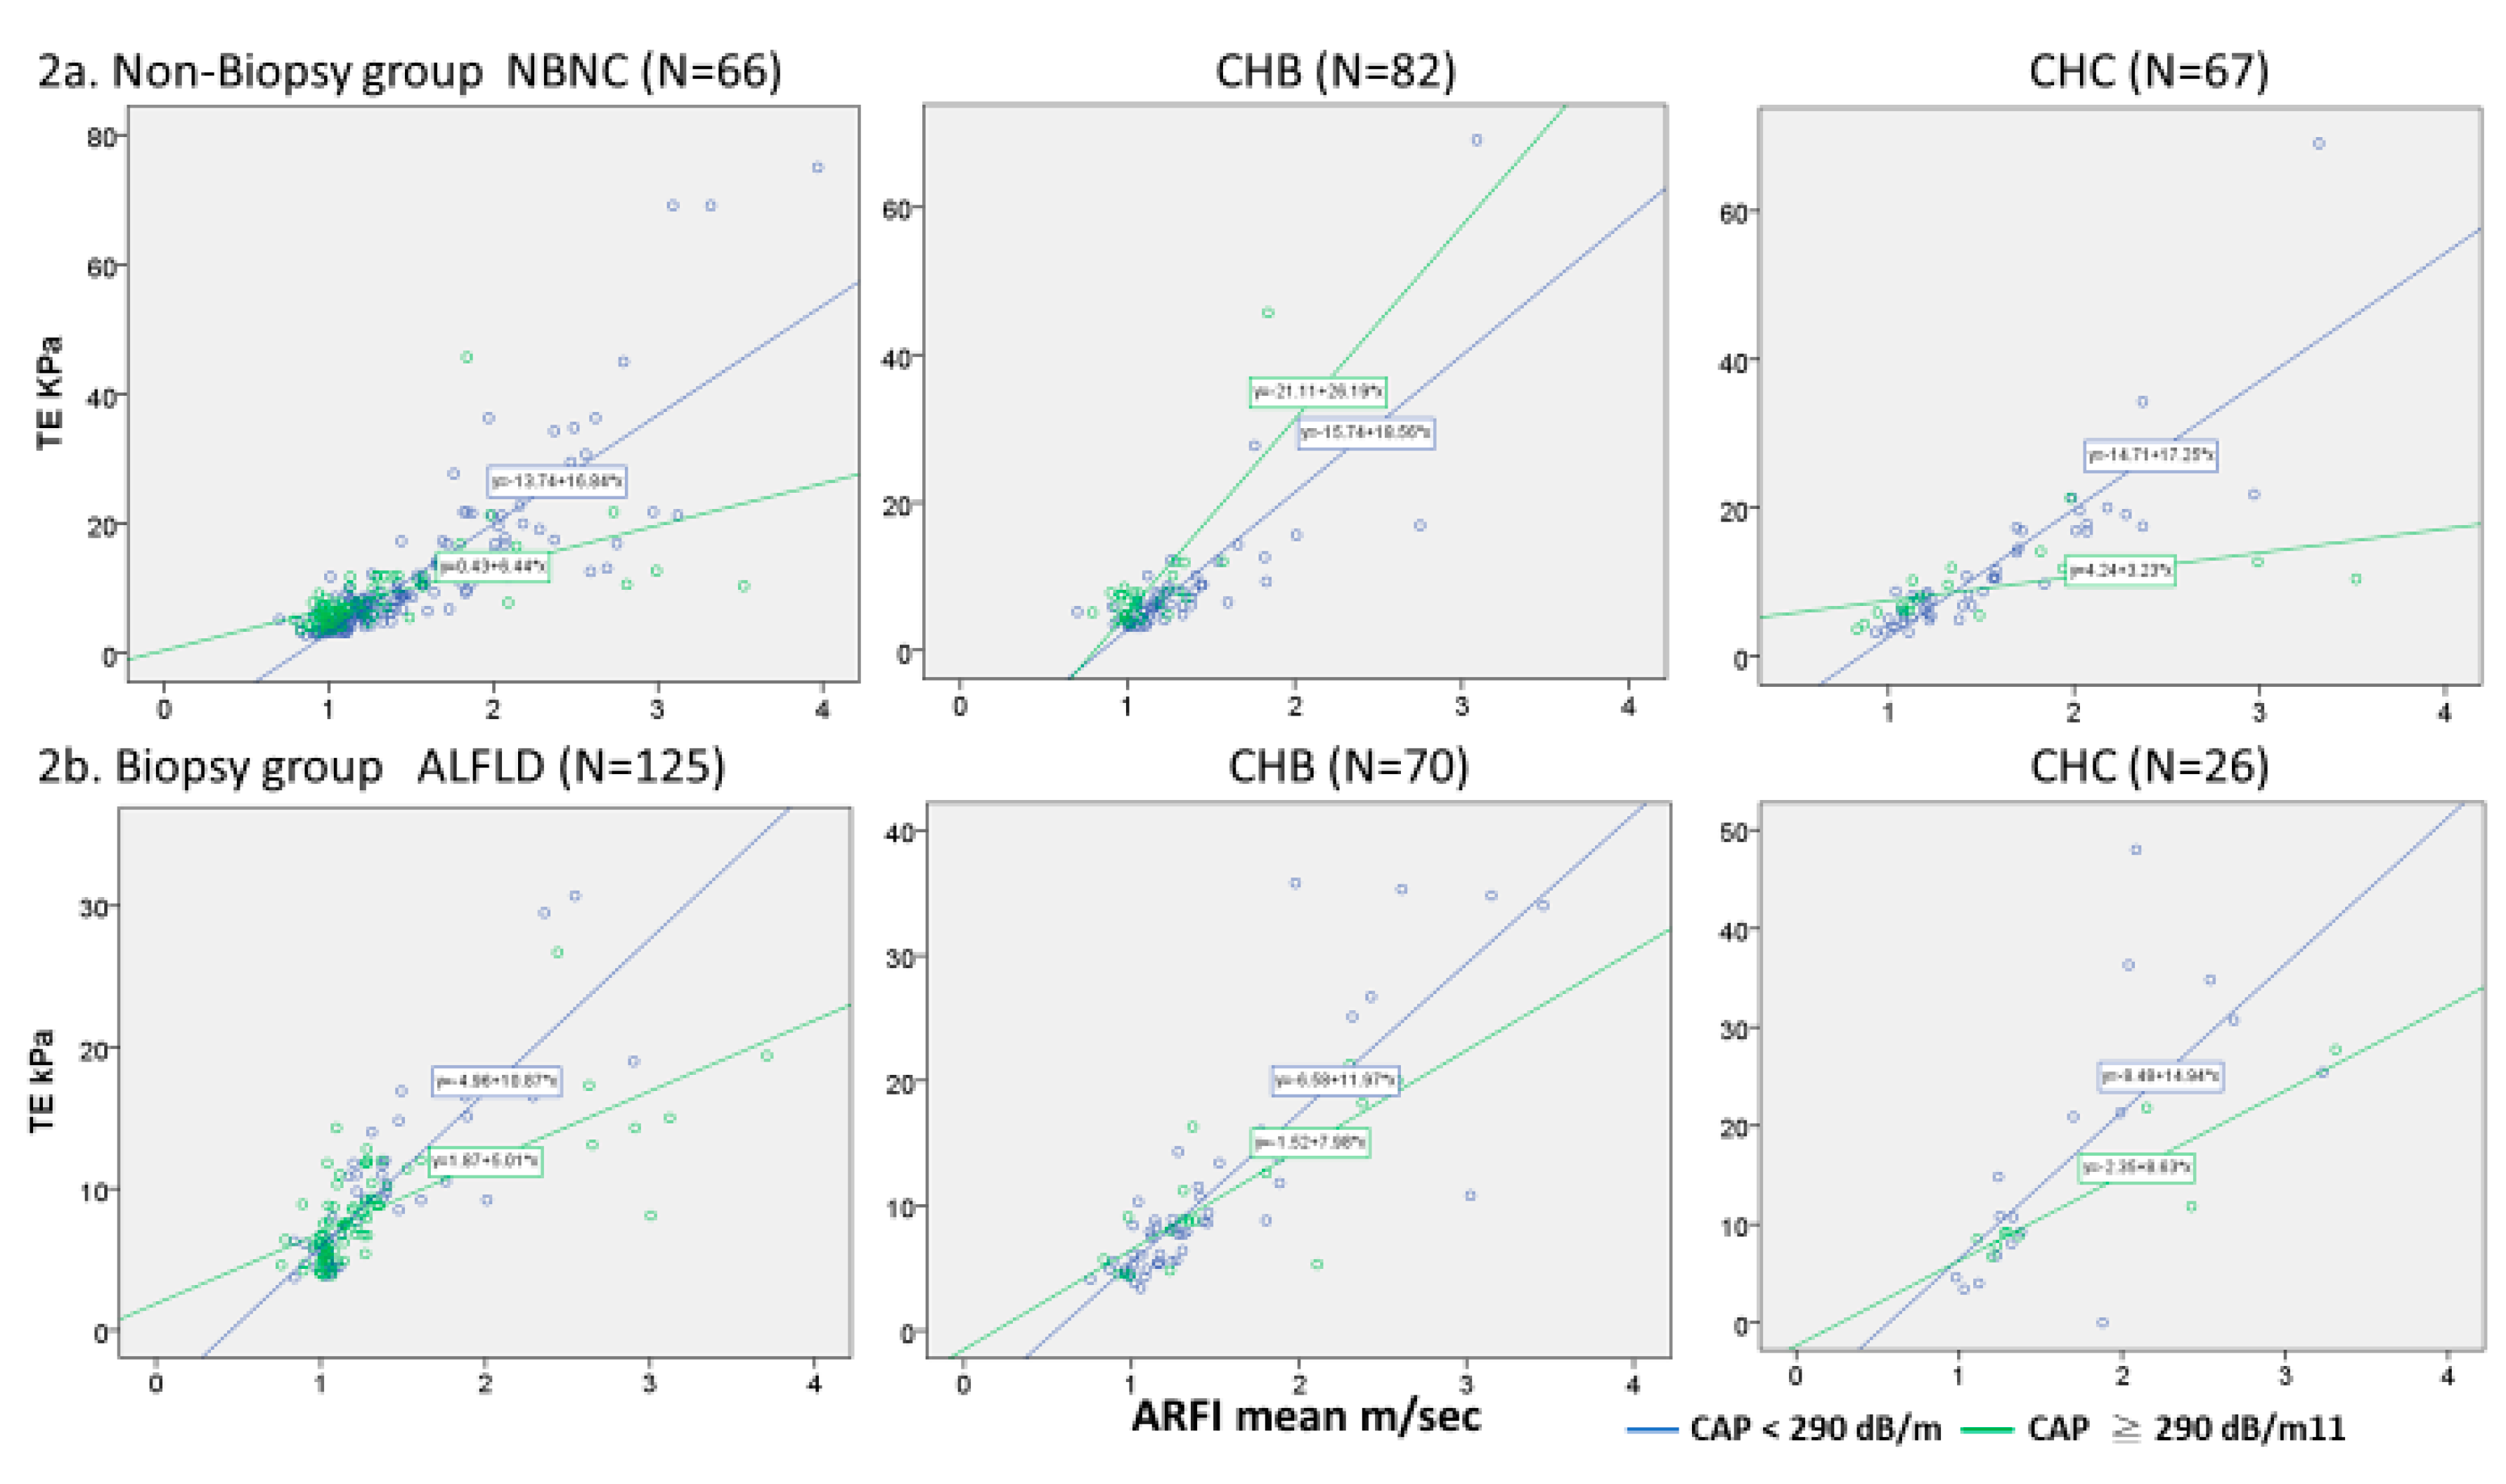
The correlation between the TE and the mean ARFI value in total cases was good (R2 = 0.798, Spearman’s rho p < 0.001). In the presence of severe steatosis, the TE value was relatively lower than the ARFI value, which was evident by the lower slope among the high CAP versus the low CAP patients in both the biopsy and non-biopsy groups (Figure 2). This pattern was seen in the NAFLD and CHC patients, but not in the CHB patients. In the CHB patients within the non-biopsy group, liver stiffness values measured by TE were paradoxically higher in the high CAP patients than in the low CAP patients.
When patients in the NAFLD and CHC subgroups were stratified by CAP and histological fibrosis scores, the mean fibrosis values measured by FIB4 index tended to be lower in the high CAP patients than in the low CAP patients at the various fibrosis stages (Table 3a, p ≤ 0.002). As for the TE studies, significant or marginal differences in mean values between the high versus low CAP groups are listed in Table 3a (p = 0.03–0.071). A similar pattern was not present in the ARFI measurements in non-CHB patients (Table 3a). Such a trend was not present in the various fibrosis grades among patients with CHB between the low and high CAP groups (Table 3b).
Since the NAFLD and CHC subgroups had similar behavior in liver stiffness measurements, we evaluated their liver stiffness cutoff values between high and low CAP groups together (Table 4). We found that there was a 25.1% to 30.7% reduction in FIB4 cutoff values between the high CAP versus low CAP groups of patients with moderate fibrosis to cirrhosis (F2-4). The TE cutoff value for diagnosis of liver cirrhosis was 8.5% lower in the high cap versus low cap group. There was no difference (−2.4% to 1.3%) in ARFI cutoff values between the high and low CAP groups in different fibrosis stages.
In addition to the parameter of FIB4 index, differences between CAP groups were comprised of higher AST level (68.27 ± 41.48 vs. 54.03 ± 19.57 U/L, p = 0.013) and older age (57.21 ± 12.37 vs. 48.85 ± 11.76 years, p < 0.001) in the low CAP versus the high CAP group.

4. Discussion

We found that hepatic steatosis has a significant effect on liver fibrosis measurements by TE or FIB4 in both the biopsy and non-biopsy groups. While this phenomenon mainly occurred in patients with NAFLD or CHC, it also occurred with low effect in those with CHB.
To better understand the value and limitations of CAP, we correlated CAP with semi-quantified fat cell fraction by liver histology. The correlation was linear in all participants (R2 linear = 0.615) and reached a plateau when the CAP value was ≥ 290 dB/m (R2 linear = 0.009). Our findings are consistent with those of previous studies. [28,29] Based on this observation, we divided our patients into high and low CAP groups using a cutoff value of 290 dB/m.
In the non-biopsy training group, the correlation between TE and ARFI was good for all three etiologies (Figure 2a). However, the linear regression slopes differed between the high and low CAP patients among the NBNC and CHC subgroups (Figure 2a). These findings were also noted in the validation biopsy group (Figure 2b). In addition, when NAFLD or HCV patients in the biopsy group were stratified by CAP and histology fibrosis scores, significantly lower TE (p = 0.071–0.030) and FIB4 (p ≤ 0.002, Table 3a) measurements in the F2-F4 stages were noted in the high CAP group than in the low CAP group. Our findings confirm the findings by Gaias et al. [30], which showed that liver stiffness values were lower than expected in NAFLD patients with advanced fibrosis (F3) and severe steatosis (fat cell fraction >33%).
Regarding the TE and FIB4 measurements, values in the high CAP patients tended to be lower than those in the low CAP patients (Table 3a). When the cutoff values in the NAFLD and CHC subgroup were evaluated together, the FIB4 cutoff values in moderate fibrosis to cirrhosis (F2 to 4) were 25.1% to 30.7% lower in the high CAP groups than in the low CAP groups (Table 4). Similar findings were observed for the TE cutoff value. The cutoff value for diagnosis of liver cirrhosis was 8.5% lower in the high CAP than the low CAP group. Therefore, liver stiffness measurements should be interpreted with caution for patients with severe steatosis in cases of NAFLD or CHC. ARFI measurement is less influenced by steatosis, and the differences between CAP groups were small (−2.4% to 1.3%).
It is interesting to note that liver steatosis confers minor effects on liver stiffness measurements in patients with CHB (Table 3b). We suspect that this phenomenon is related to the different fibrogenesis rates and fat cell fractions in CHB cases compared to other etiologies. CHB was associated with a relatively lower fat cell fraction in accordance with other previous studies [31,32]. HBV infection leads to lower levels of triglycerides, which may affect the development of NAFLD [33]. Furthermore, HBV X protein can inhibit the secretion of apolipoprotein B, which is an important component in the formation of very-low-density and low-density lipoproteins [34,35]. HBV-infected individuals have been shown to have significantly higher serum adiponectin levels compared to healthy individuals [36], and hepatic steatosis is inversely associated with adiponectin level [37]. In addition to the lower hepatic fat cell fraction, Dong et al. [38] reported that in a series of 81 CHB patients who underwent TE, ARFI, and Forns index measurements, inflammation, rather than hepatic steatosis, significantly impacted the level of fibrosis measured by all three modalities. These findings are consistent with the results of this study, possibly indicating that the fibrosis structure differs between CHB and other etiologies.
Several characteristics can be mentioned according to the various etiologies of fibrogenesis. Both NAFLD and CHC are associated with slow, progressive inflammation and fibrogenesis [39,40], and liver cirrhosis developed over several decades after diagnosis. In CHB patients, however, a severe flare-up can rapidly progress to liver cirrhosis within months or years due to bridging hepatic necrosis [41,42,43]. In addition, an uneven distribution of inflammation with the presence of relatively non-inflamed zones can be seen in these patients [44]. These manifestations indicate that fibrosis in CHB happens quickly and is less dense than non-HBV fibrosis. Our previous ARFI study proposed that different severities of inflammation may account for the differences observed between CHB and CHC patients [18]. In this study, even with the exclusion of patients with ALT levels >180 IU/L, liver stiffness measurements differed between the low and high CAP patients in the NAFLD and CHC subgroups, but not in the CHB subgroup. A report from Furuya et al. revealed that macronodular liver regeneration was more likely to occur in HBsAg positive than in non-HBsAg positive liver cirrhosis (49.0% vs. 37.2%, p < 0.01) [45], which might be related to the uneven distribution of bridging hepatic necrosis and fibrosis in patients with HBV-related liver cirrhosis. This observation supports the supposition that the structure of fibrosis may differ between HBV and non-HBV-related liver cirrhosis.
One of the cases in this series showed liver cirrhosis that had rapidly developed seven months after an ALT flare-up. This process was evident based on consecutive liver biopsies, which showed a progression from bridging hepatic necrosis to bridging fibrosis, and finally the formation of cirrhotic nodules. This inflammatory response induced HBeAg seroconversion and viral clearance. The fibrosis spontaneously regressed to METAVIR F1 34 years later (Supplementary Figure S1). Although we have only detailed one such case in this report, similar cases of bridging hepatic necrosis with rapid progression to cirrhosis [41,42,43] and spontaneous resolution of liver cirrhosis [46] have been published.
We conclude that hepatic steatosis greatly impacts the FIB4 and TE measurements of fibrosis in non-HBV-related liver diseases, possibly due to structural differences in liver fibrosis between HBV- and non-HBV-related liver diseases. The cutoff values may need to be adjusted for patients with severe steatosis.

Supplementary Materials

The following are available online at https://0-www-mdpi-com.brum.beds.ac.uk/2076-3417/9/9/1961/s1, Figure S1: A 22-year-old HBeAg positive female rapidly developed liver cirrhosis that spontaneously resolved 34 years later, Table S1: Cutoff values in different fibrosis grades.

Author Contributions

D.-I.T. designed the experiments. C.-J.C. wrote the manuscript in consultation with D.I.T., P.-K.T. and P.-H.T. analyzed data and offered suggestions. S.-F.H. offered pathology analysis. T.-H.H. performed ARFI and fibroscan study. W.-T.Y. and J.T. corrected collected and organized data.

Funding

This research was supported by the grant from Chang Gung Memorial Hospital (CIRPG3H0021, CMRPG3E1121 and 106-2221-E-182-023-MY3).

Acknowledgments

We would like to thank Uni-Edit (www.uni-edit.net) for editing and proofreading this manuscript.

Conflicts of Interest

All authors declare no conflict of interest.

References

  1. Erman, A.; Sathya, A.; Nam, A.; Bielecki, J.M.; Feld, J.J.; Thein, H.H.; Wong, W.W.L.; Grootendorst, P.; Krahn, M.D. Estimating chronic hepatitis C prognosis using transient elastography-based liver stiffness: A systematic review and meta-analysis. J. Viral. Hepat. 2017, 25, 502–513. [Google Scholar] [CrossRef] [PubMed]
  2. Hashemi, S.A.; Alavian, S.M.; Gholami-Fesharaki, M. Assessment of transient elastography (FibroScan) for diagnosis of fibrosis in non-alcoholic fatty liver disease: A systematic review and meta-analysis. Casp. J. Intern. Med. 2016, 7, 242–252. [Google Scholar]
  3. Crossan, C.; Tsochatzis, E.A.; Longworth, L.; Gurusamy, K.; Papastergiou, V.; Thalassinos, E.; Mantzoukis, K.; Rodriguez-Peralvarez, M.; O’Brien, J.; Noel-Storr, A.; et al. Cost-effectiveness of noninvasive liver fibrosis tests for treatment decisions in patients with chronic hepatitis B in the UK: Systematic review and economic evaluation. J. Viral. Hepat. 2016, 23, 139–149. [Google Scholar] [CrossRef]
  4. Bota, S.; Herkner, H.; Sporea, I.; Salzl, P.; Sirli, R.; Neghina, A.M.; Peck-Radosavljevic, M. Meta-analysis: ARFI elastography versus transient elastography for the evaluation of liver fibrosis. Liver Int. 2013, 33, 1138–1147. [Google Scholar] [CrossRef] [PubMed] [Green Version]
  5. Houot, M.; Ngo, Y.; Munteanu, M.; Marque, S.; Poynard, T. Systematic review with meta-analysis: Direct comparisons of biomarkers for the diagnosis of fibrosis in chronic hepatitis C and B. Aliment. Pharmacol. Ther. 2016, 43, 16–29. [Google Scholar] [CrossRef] [PubMed]
  6. Vallet-Pichard, A.; Mallet, V.; Nalpas, B.; Verkarre, V.; Nalpas, A.; Dhalluin-Venier, V.; Fontaine, H.; Pol, S. FIB-4: An inexpensive and accurate marker of fibrosis in HCV infection. Comparison with liver biopsy and fibrotest. Hepatology 2007, 46, 32–36. [Google Scholar] [CrossRef]
  7. Lee, C.H.; Wan, Y.L.; Hsu, T.H.; Huang, S.-F.; Yu, M.-C.; Lee, W.-C.; Tsui, P.-H.; Chen, Y.-C.; Lin, C.-Y.; Tai, D.-I. Interpretation US elastography in chronic hepatitis B with or without anti-HBV therapy. Appl. Sci. 2017, 7, 1164. [Google Scholar] [CrossRef]
  8. Vuppalanchi, R.; Siddiqui, M.S.; Van Natta, M.L.; Hallinan, E.; Brandman, D.; Kowdley, K.; Neuschwander-Tetri, B.A.; Loomba, R.; Dasarathy, S.; Abdelmalek, M.; et al. Performance characteristics of vibration-controlled transient elastography for evaluation of nonalcoholic fatty liver disease. Hepatology 2018, 67, 134–144. [Google Scholar] [CrossRef]
  9. Roulot, D.; Roudot-Thoraval, F.; Kontchou, N.G.; Costes, J.L.; Elourimi, G.; Le Clesiau, H.; Ziol, M.; Beaugrand, M. Concomitant screening for liver fibrosis and steatosis in French type 2 diabetic patients using Fibroscan. Liver Int. 2017, 37, 1897–1906. [Google Scholar] [CrossRef]
  10. Sasso, M.; Tengher-Barna, I.; Ziol, M.; Miette, V.; Fournier, C.; Sandrin, L.; Poupon, R.; Cardoso, A.C.; Marcellin, P.; Douvin, C.; et al. Novel controlled attenuation parameter for noninvasive assessment of steatosis using Fibroscan((R)): Validation in chronic hepatitis C. J. Viral Hepat. 2012, 19, 244–253. [Google Scholar] [CrossRef]
  11. Shaheen, A.A.; Wan, A.F.; Myers, R.P. FibroTest and FibroScan for the prediction of hepatitis C-related fibrosis: A systematic review of diagnostic test accuracy. Am. J. Gastroenterol. 2007, 102, 2589–2600. [Google Scholar] [CrossRef]
  12. Castera, L.; Foucher, J.; Bernard, P.H.; Carvalho, F.; Allaix, D.; Merrouche, W.; Couzigou, P.; de Lédinghen, V. Pitfalls of liver stiffness measurement: A 5-year prospective study of 13,369 examinations. Hepatology 2010, 51, 828–835. [Google Scholar] [CrossRef]
  13. Cassinotto, C.; Lapuyade, B.; Ait-Ali, A.; Vergniol, J.; Gaye, D.; Foucher, J.; Bailacq-Auder, C.; Chermak, F.; Le Bail, B.; de Lédinghen, V. Liver fibrosis: Noninvasive assessment with acoustic radiation force impulse elastography—comparison with FibroScan M and XL probes and FibroTest in patients with chronic liver disease. Radiology 2013, 269, 283–292. [Google Scholar] [CrossRef]
  14. De Ledinghen, V.; Wong, V.W.; Vergniol, J.; Wong, G.L.; Foucher, J.; Chu, S.H.; Le Bail, B.; Choi, P.C.; Chermak, F.; Yiu, K.K.; et al. Diagnosis of liver fibrosis and cirrhosis using liver stiffness measurement: Comparison between M and XL probe of FibroScan(R). J. Hepatol. 2012, 56, 833–839. [Google Scholar] [CrossRef] [PubMed]
  15. De Ledinghen, V.; Vergniol, J.; Foucher, J.; El-Hajbi, F.; Merrouche, W.; Rigalleau, V. Feasibility of liver transient elastography with FibroScan using a new probe for obese patients. Liver Int. 2010, 30, 1043–1048. [Google Scholar] [CrossRef] [PubMed]
  16. Friedrich-Rust, M.; Hadji-Hosseini, H.; Kriener, S.; Herrmann, E.; Sircar, I.; Kau, A.; Zeuzem, S.; Bojunga, J. Transient elastography with a new probe for obese patients for non-invasive staging of non-alcoholic steatohepatitis. Eur. Radiol. 2010, 20, 2390–2396. [Google Scholar] [CrossRef] [PubMed]
  17. Lu, Q.; Ling, W.; Lu, C.; Li, J.; Ma, L.; Quan, J.; He, D.; Liu, J.; Yang, J.; Wen, T.; et al. Hepatocellular carcinoma: Stiffness value and ratio to discriminate malignant from benign focal liver lesions. Radiology 2015, 275, 880–888. [Google Scholar] [CrossRef] [PubMed]
  18. Tai, D.I.; Tsay, P.K.; Jeng, W.J.; Weng, C.C.; Huang, S.F.; Huang, C.H.; Lin, S.M.; Chiu, C.T.; Chen, W.T.; Wan, Y.L. Differences in liver fibrosis between patients with chronic hepatitis B and C: Evaluation by acoustic radiation force impulse measurements at 2 locations. J. Ultrasound Med. 2015, 34, 813–821. [Google Scholar] [CrossRef]
  19. Tai, D.I.; Lin, S.M.; Sheen, I.S.; Chu, C.M.; Lin, D.Y.; Liaw, Y.F. Long-term outcome of hepatitis B e antigen-negative hepatitis B surface antigen carriers in relation to changes of alanine aminotransferase levels over time. Hepatology 2009, 49, 1859–1867. [Google Scholar] [CrossRef] [Green Version]
  20. Tai, D.I.; Tsay, P.K.; Chen, W.T.; Chu, C.M.; Liaw, Y.F. Relative roles of HBsAg seroclearance and mortality in the decline of HBsAg prevalence with increasing age. Am. J. Gastroenterol. 2010, 105, 1102–1109. [Google Scholar] [CrossRef]
  21. Saverymuttu, S.H.; Joseph, A.E.; Maxwell, J.D. Ultrasound scanning in the detection of hepatic fibrosis and steatosis. Br. Med. J. 1986, 292, 13–15. [Google Scholar] [CrossRef]
  22. Farrell, G.C. Non-alcoholic steatohepatitis: What is it, and why is it important in the Asia-Pacific region? J. Gastroenterol. Hepatol. 2003, 18, 124–138. [Google Scholar] [CrossRef] [Green Version]
  23. Araujo, A.R.; Rosso, N.; Bedogni, G.; Tiribelli, C.; Bellentani, S. Global epidemiology of non-alcoholic fatty liver disease/non-alcoholic steatohepatitis: What we need in the future. Liver Int. 2018, 38, 47–51. [Google Scholar] [CrossRef]
  24. Estes, C.; Razavi, H.; Loomba, R.; Younossi, Z.; Sanyal, A.J. Modeling the epidemic of nonalcoholic fatty liver disease demonstrates an exponential increase in burden of disease. Hepatology 2018, 67, 123–133. [Google Scholar] [CrossRef]
  25. Dietrich, C.F.; Bamber, J.; Berzigotti, A.; Bota, S.; Cantisani, V.; Castera, L.; Cosgrove, D.; Ferraioli, G.; Friedrich-Rust, M.; Gilja, O.H.; et al. EFSUMB guidelines and recommendations on the clinical use of liver ultrasound elastography, update 2017 (long version). Ultraschall Med. 2017, 38, e16–e47. [Google Scholar]
  26. Bedossa, P.; Poynard, T. An algorithm for the grading of activity in chronic hepatitis C. The METAVIR cooperative study group. Hepatology 1996, 24, 289–293. [Google Scholar] [CrossRef]
  27. Kleiner, D.E.; Brunt, E.M.; Van Natta, M.; Behling, C.; Contos, M.J.; Cummings, O.W.; Ferrell, L.D.; Liu, Y.C.; Torbenson, M.S.; Unalp-Arida, A.; et al. Design and validation of a histological scoring system for nonalcoholic fatty liver disease. Hepatology 2005, 41, 1313–1321. [Google Scholar] [CrossRef] [PubMed] [Green Version]
  28. Sasso, M.; Beaugrand, M.; de Ledinghen, V.; Douvin, C.; Marcellin, P.; Poupon, R.; Sandrin, L.; Miette, V.; et al. Controlled attenuation parameter (CAP): A novel VCTE™ guided ultrasonic attenuation measurement for the evaluation of hepatic steatosis: Preliminary study and validation in a cohort of patients with chronic liver disease from various causes. Ultrasound Med. Biol. 2010, 36, 1825–1835. [Google Scholar] [CrossRef]
  29. Karlas, T.; Petroff, D.; Garnov, N.; Böhm, S.; Tenckhoff, H.; Wittekind, C.; Wiese, M.; Schiefke, I.; Linder, N.; Schaudinn, A.; et al. Non-invasive assessment of hepatic steatosis in patients with NAFLD using controlled attenuation parameter and 1H-MR spectroscopy. PLoS ONE 2014, 9, e91987. [Google Scholar] [CrossRef] [PubMed]
  30. Gaia, S.; Carenzi, S.; Barilli, A.L.; Bugianesi, E.; Smedile, A.; Brunello, F.; Marzano, A.; Rizzetto, M. Reliability of transient elastography for the detection of fibrosis in non-alcoholic fatty liver disease and chronic viral hepatitis. J. Hepatol. 2011, 54, 64–71. [Google Scholar] [CrossRef] [PubMed]
  31. Cheng, Y.L.; Wang, Y.J.; Kao, W.Y.; Chen, P.H.; Huo, T.I.; Huang, Y.H.; Lan, K.H.; Su, C.W.; Chan, W.L.; Lin, H.C.; et al. Inverse association between hepatitis B virus infection and fatty liver disease: A large-scale study in populations seeking for check-up. PLoS ONE 2013, 8, e72049. [Google Scholar] [CrossRef]
  32. Joo, E.J.; Chang, Y.; Yeom, J.S.; Ryu, S. Hepatitis B virus infection and decreased risk of nonalcoholic fatty liver disease: A cohort study. Hepatology 2017, 65, 828–835. [Google Scholar] [CrossRef]
  33. Lin, C.W.; Huang, X.L.; Liu, H.L.; Wang, Y. Interactions of hepatitis B virus infection with nonalcoholic fatty liver disease: Possible mechanisms and clinical impact. Dig. Dis. Sci. 2015, 60, 3513–3524. [Google Scholar] [CrossRef]
  34. Kang, S.K.; Chung, T.W.; Lee, J.Y.; Lee, Y.C.; Morton, R.E.; Kim, C.H. The hepatitis B virus X protein inhibits secretion of apolipoprotein B by enhancing the expression of N-acetylglucosaminyltransferase III. J. Biol. Chem. 2004, 279, 28106–28112. [Google Scholar] [CrossRef] [PubMed]
  35. Chiang, C.H.; Yang, H.I.; Jen, C.L.; Lu, S.N.; Wang, L.Y.; You, S.L.; Su, J.; Iloeje, U.H.; Chen, C.J.; REVEAL-HBV Study Group. Association between obesity, hypertriglyceridemia and low hepatitis B viral load. Int. J. Obes. 2013, 37, 410–415. [Google Scholar] [CrossRef]
  36. Chiang, C.H.; Lai, J.S.; Hung, S.H.; Lee, L.T.; Sheu, J.C.; Huang, K.C. Serum adiponectin levels are associated with hepatitis B viral load in overweight to obese hepatitis B virus carriers. Obesity 2013, 21, 291–296. [Google Scholar] [CrossRef] [Green Version]
  37. Frederiksen, L.; Nielsen, T.L.; Wraae, K.; Hagen, C.; Frystyk, J.; Flyvbjerg, A.; Brixen, K.; Andersen, M. Subcutaneous rather than visceral adipose tissue is associated with adiponectin levels and insulin resistance in young men. J. Clin. Endocrinol. Metab. 2009, 94, 4010–4015. [Google Scholar] [CrossRef] [PubMed]
  38. Dong, D.R.; Hao, M.N.; Li, C.; Peng, Z.; Liu, X.; Wang, G.P.; Ma, A.L. Acoustic radiation force impulse elastography, FibroScan(R), Forns’ index and their combination in the assessment of liver fibrosis in patients with chronic hepatitis B, and the impact of inflammatory activity and steatosis on these diagnostic methods. Mol. Med. Rep. 2015, 11, 4174–4182. [Google Scholar] [CrossRef] [PubMed]
  39. Hajarizadeh, B.; Grebely, J.; Dore, G.J. Epidemiology and natural history of HCV infection. Nat. Rev. Gastroenterol. Hepatol. 2013, 10, 553–562. [Google Scholar] [CrossRef]
  40. Lindenmeyer, C.C.; McCullough, A.J. The natural history of nonalcoholic fatty liver disease: An evolving view. Clin. Liver Dis. 2018, 22, 11–21. [Google Scholar] [CrossRef]
  41. Chen, T.J.; Liaw, Y.F. The prognostic significance of bridging hepatic necrosis in chronic type B hepatitis: A histopathologic study. Liver 1988, 8, 10–16. [Google Scholar] [CrossRef] [PubMed]
  42. Liaw, Y.F.; Tai, D.I.; Chu, C.M.; Pao, C.C.; Chen, T.J. Acute exacerbation in chronic type B hepatitis: Comparison between HBeAg and antibody-positive patients. Hepatology 1987, 7, 20–23. [Google Scholar] [CrossRef]
  43. Liaw, Y.F.; Tai, D.I.; Chu, C.M.; Chen, T.J. The development of cirrhosis in patients with chronic type B hepatitis: A prospective study. Hepatology 1988, 8, 493–496. [Google Scholar] [CrossRef] [PubMed]
  44. Michitaka, K.; Horiike, N.; Nadano, S.; Onji, M.; Ohta, Y. Change of hepatitis B virus DNA distribution associated with the progression of chronic hepatitis. Liver 1988, 8, 247–253. [Google Scholar] [CrossRef] [PubMed]
  45. Furuya, K.; Nakamura, M.; Yamamoto, Y.; Togei, K.; Otsuka, H. Macroregenerative nodule of the liver. A clinicopathologic study of 345 autopsy cases of chronic liver disease. Cancer 1988, 61, 99–105. [Google Scholar] [CrossRef]
  46. Ohkoshi, S.; Hirono, H.; Watanabe, K.; Hasegawa, K.; Kamimura, K.; Yano, M. Natural regression of fibrosis in chronic hepatitis B. World. J. Gastroenterol. 2016, 22, 5459–5466. [Google Scholar] [CrossRef] [PubMed]
Figure 1. Flow chart of study patients.
Applsci 09 01961 g001
Figure 2. Correlation between Tranient elastography (TE) and Acoustic radiation force impulse (ARFI) fibrosis measurements in the various control attenuation parameter (CAP) and etiology groups. (a) The correlations between the high and low CAP groups differed significantly in all etiology groups (p < 0.001). A similar pattern of lower measurements of TE liver stiffness in the high CAP group versus the low CAP group was found in non-B/non-C liver cirrhosis (NBNC) and chronic hepatitis C (CHC) patients, Paradoxically, higher TE liver stiffness measurements were recorded in the high CAP patients than in the low CAP patients among those with CHB. (b) Similar correlation patterns were noted in the biopsy group for each etiology subgroup with a smaller difference between high CAP verse low CAP group in those with CHB.
Applsci 09 01961 g002
Table 1. (a) Demography of patients without liver histology study; (b) Demography of patients received liver histology study.
(a)
(a)
Total CasesNBNC (N) 66HBV (B) 82HCV (C) 67Multiple Comparisons
Male (%)44 (66.7)76 (92.7)35 (52.2)B ≠ (N = C)
Body mass index26.80 ± 4.6024.89 ± 3.3424.81 ± 3.83N ≠ (B = C)
Age (year)57.10 ± 11.1053.38 ± 10.9162.48 ± 9.67(N = B) ≠ C
AST (IU/L)51.53 ± 49.5135.05 ± 13.2956.12 ± 30.66B ≠ (N = C)
ALT (IU/L)52.35 ± 38.4735.54± 19.0561.88 ± 39.80B ≠ (N = C)
Platelets (109/L)203.3± 76.91179.9 ± 67.77164.06 ± 60.04N ≠ C
Spleen index18.77 ± 8.7718.98 ± 10.3617.61 ± 8.19NS
Estimated fibrosis score *
4 (%)16 (24.2)12 (14.6)21 (31.3)B ≠ (N = C)
3 (%)8 (121.1)11 (13.4)14 (20.9)P = 0.033
2 (%)5 (7.6)12 (14.6)2 (3.0)
≦1 (%)37 (56.1)47 (57.3)30 (44.8)
* Cutoff values of meanARFI (m/sec) for fibrosis scores 1~4 in different etiologies: NBNC (1.79,1.32,1.25); CHB (1.46,1.32,1.22); CHC (1.71,1.37,1.23)
(b)
(b)
Total CasesNAFLD (N) 125HBV (B) 70HCV (C) 26Multiple Comparisons
Male75 (60.0 %) 40 (57.1 %)11 (42.3 %)NS
HCC1 (0.8 %) 9 (12.9 %)4 (15.4 %)N ≠ (B = C)
Age (year)49.85 ± 13.4352.03 ± 11.0157.91 ± 8.35N ≠ C
Body mass index27.95 ± 3.9726.60 ± 4.8327.34 ± 4.42NS
AST (IU/L)58.22 ± 29.2155.27 ± 40.3368.92 ± 40.30NS
ALT (IUL)92.70 ± 41.1673.07 ± 50.1476.23 ± 55.55N ≠ B
Bilirubin (mg/dL)0.74 ± 0.340.91 ± 0.87 0.81 ± 0.26 NS
Platelets (109/L)251.0 ± 64.1191.2 ± 60.8189.1 ± 73.8N ≠ (B = C)
Prothrombin time INR1.03 ± 0.111.08 ± 0.081.13 ± 0.11N ≠ (B = C)
Spleen index (cm2)17.16 ± 6.3815.81 ± 6.3415.78 ± 5.75NS
Fibrosis score
48 (5.6 %) 13 (18.6%)9 (34.6%)N ≠ (B = C)
330 (24.0 %) 19 (27.1 %)9 (34.6%)
29 (7.2 %) 18 (25.7%)2 (7.7%)
≦179 (63.2 %) 20 (28.6%)6 (23.1%)
Steatosis grade
0 <5%0 (0 %)27 (38.6%)9 (34.6%)N ≠ (B = C)
1 5–33%29 (23.2 %)26 (37.1%)9 (34.6%)
2 34–66%35 (28.0 %)6 (8.6%)4 (15.4%)
3 >66%61 (48.8 %)11 (15.7%)4 (15.4%)
Table 2. (a) Liver fibrosis and steatosis parameters in patients who did not receive liver histology study; (b) Liver fibrosis and steatosis parameters in patients who received liver histology study.
(a)
(a)
NAFLD (N) N = 66CHB (B) N = 82CHC (C) N = 87Multiple Comparisons
Mean ARFI, m/sec1.40 ± 0.591.24 ± 0.361.57 ± 0.60B ≠ C
Location A1.40 ± 0.611.24 ± 0.371.57 ± 0.60B ≠ (N = C)
Location B1.38 ± 0.611.24 ± 0.361.57 ± 0.61B ≠ (N = C)
IQR/Median0.08 ± 0.030.08 ± 0.030.08 ± 0.03NS
TE, kPa 10.00 ± 10.148.43 ± 8.8211.84 ± 9.85B ≠ C
IQR/Med0.11 ± 0.110.10 ± 0.050.09 ± 0.04NS
CAP, dB/m265.3 ± 54.2256.7 ± 54.5249.2 ± 52.4NS
FIB42.47 ± 2.462.27 ± 1.893.43 ± 2.44(N = B) ≠ C
(b)
(b)
NAFLD (N)CHB (B)CHC (C)Multiple Comparisons
N = 125N = 70N = 26
Mean ARFI, m/s1.34 ± 0.531.45 ± 0.581.71 ± 0.67N ≠ C
Location A1.35 ± 0.561.45 ± 0.561.69 ± 0.69N ≠ C
Location B1.32 ± 0.511.45 ± 0.611.73 ± 0.68N ≠ C
IQR/Median0.08 ± 0.040.09 ± 0.050.09 ± 0.06NS
TE, kPa8.95 ± 4.8210.53 ± 7.8015.43 ± 12.04(N = B) ≠ C
IQR/Median0.10 ± 0.040.10 ± 0.040.10 ± 0.05NS
CAP, dB/m304.4 ± 43.0264.5 ± 46.9254.5 ± 46.0N ≠ (B = C)
FIB41.39 ± 0.922.11 ± 1.423.09 ± 1.96N ≠ B ≠ C
Histology
Fibrosis score1.58 ± 1.162.31 ± 1.162.73 ± 1.31N ≠ (B = C)
Fat cell %58.10 ± 28.5723.50 ± 29.2024.42 ± 29.75N ≠ (B = C)
Table 3. (a) CAP grades and fibrosis measurements of NAFLD and CHC patients by different modalities; (b) CAP grades and fibrosis measurements of CHB patients by different modalities.
(a)
(a)
CAP <290 dB/mCAP ≧ 290 dB/m
MetavirNoMean ± SDNoMean ± SDp Value
Mean ARFI (m/sec)≥2361.72 ± 0.55 301.79 ± 0.770.659
≥1561.50 ± 0.54761.41 ± 0.630.416
Total641.44 ± 0.54871.37 ± 0.600.487
TE (kPa)≥23616.24 ± 9.923012.71 ± 5.320.071
≥15612.46 ± 9.56769.38 ± 4.680.030
Total6411.59± 9.23878.95 ± 4.560.038
FIB4≥2333.02± 1.63311.88 ± 1.200.002
≥1562.37 ± 1.62761.38± 0.960.000
Total642.20 ± 1.58871.30 ± 0.930.000
(b)
(b)
CAP <290 dB/mCAP ≧290 dB/m
Fibrosis scoreNoMean ± SDNoMean ± SDp Value
Mean ARFI≥2391.57 ± 0.63 111.67 ± 0.560.631
(m/sec)≥1491.46 ± 0.60181.49 ± 0.540.845
Total521.43 ± 0.60181.49 ± 0.540.718
TE kPa≥23912.14± 9.141112.69 ± 5.750.852
≥14310.94 ± 8.611610.37 ± 5.560.798
Total5210.58 ± 8.481810.37 ± 5.560.923
FIB4≥2392.53 ± 1.50111.88 ± 0.990.189
≥1432.35 ± 1.54161.56 ± 0.940.046
Total522.29 ± 1.52181.56 ± 0.940.059
Table 4. Effect of hepatic steatosis on cutoff values of liver fibrosis scores in NAFLD and CHC patients.
CAP < 290 dB/mCAP ≥ 290 dB/mCutoff
AUROCCutoffSensitivitySpecificityAUROCCutoffSensitivitySpecificityDifference% *
F4 (N = 10 vs. <F4 (N = 54)F4 (N = 7) vs. <F4 (N = 81)
ARFI m/s0.9111.6550.8000.8520.9491.6950.8570.889−0.04−2.4%
TE kPa0.91413.000.9000.8520.95911.900.8570.8771.18.5%
FIB40.8242.4170.8000.7410.9051.6750.8570.8150.74230.7%
F3-4 (N = 32) vs. <F3 (N = 32)F3-4 (N = 24) vs. <F3 (N = 64)
ARFI m/s0.9381.2900.8130.8750.8821.2730.8330.7970.0171.3%
TE kPa0.9289.250.8130.8440.8869.0000.7920.7970.252.7%
FIB40.8961.7620.7810.7190.7951.2510.7080.7030.51129.0%
F2-4 (N = 29) vs. <F2 (N = 35)F2-4 (N = 31) vs. <F2 (N = 57)
ARFI m/s0.9171.2250.8860.8970.8381.2430.8060.772−0.018−1.5%
TE kPa0.9058.8500.8290.8280.8918.7500.8390.7890.11.1%
FIB40.8851.6410.8000.7390.7971.2290.7420.7370.41225.1%
* Compared with cutoff value in CAP < 290 dB/m group.

