Classification of Primary Cerebral Lymphoma and Glioblastoma Featuring Dynamic Susceptibility Contrast and Apparent Diffusion Coefficient

 ,
,  , ,
, ,
Abstract
:
1. Introduction
2. Materials and Methods
2.1. Patients
2.2. Acquisition and Postprocessing
2.2.1. MRI
2.2.2. Imaging Protocol and Sequence Details
2.2.3. Postprocessing
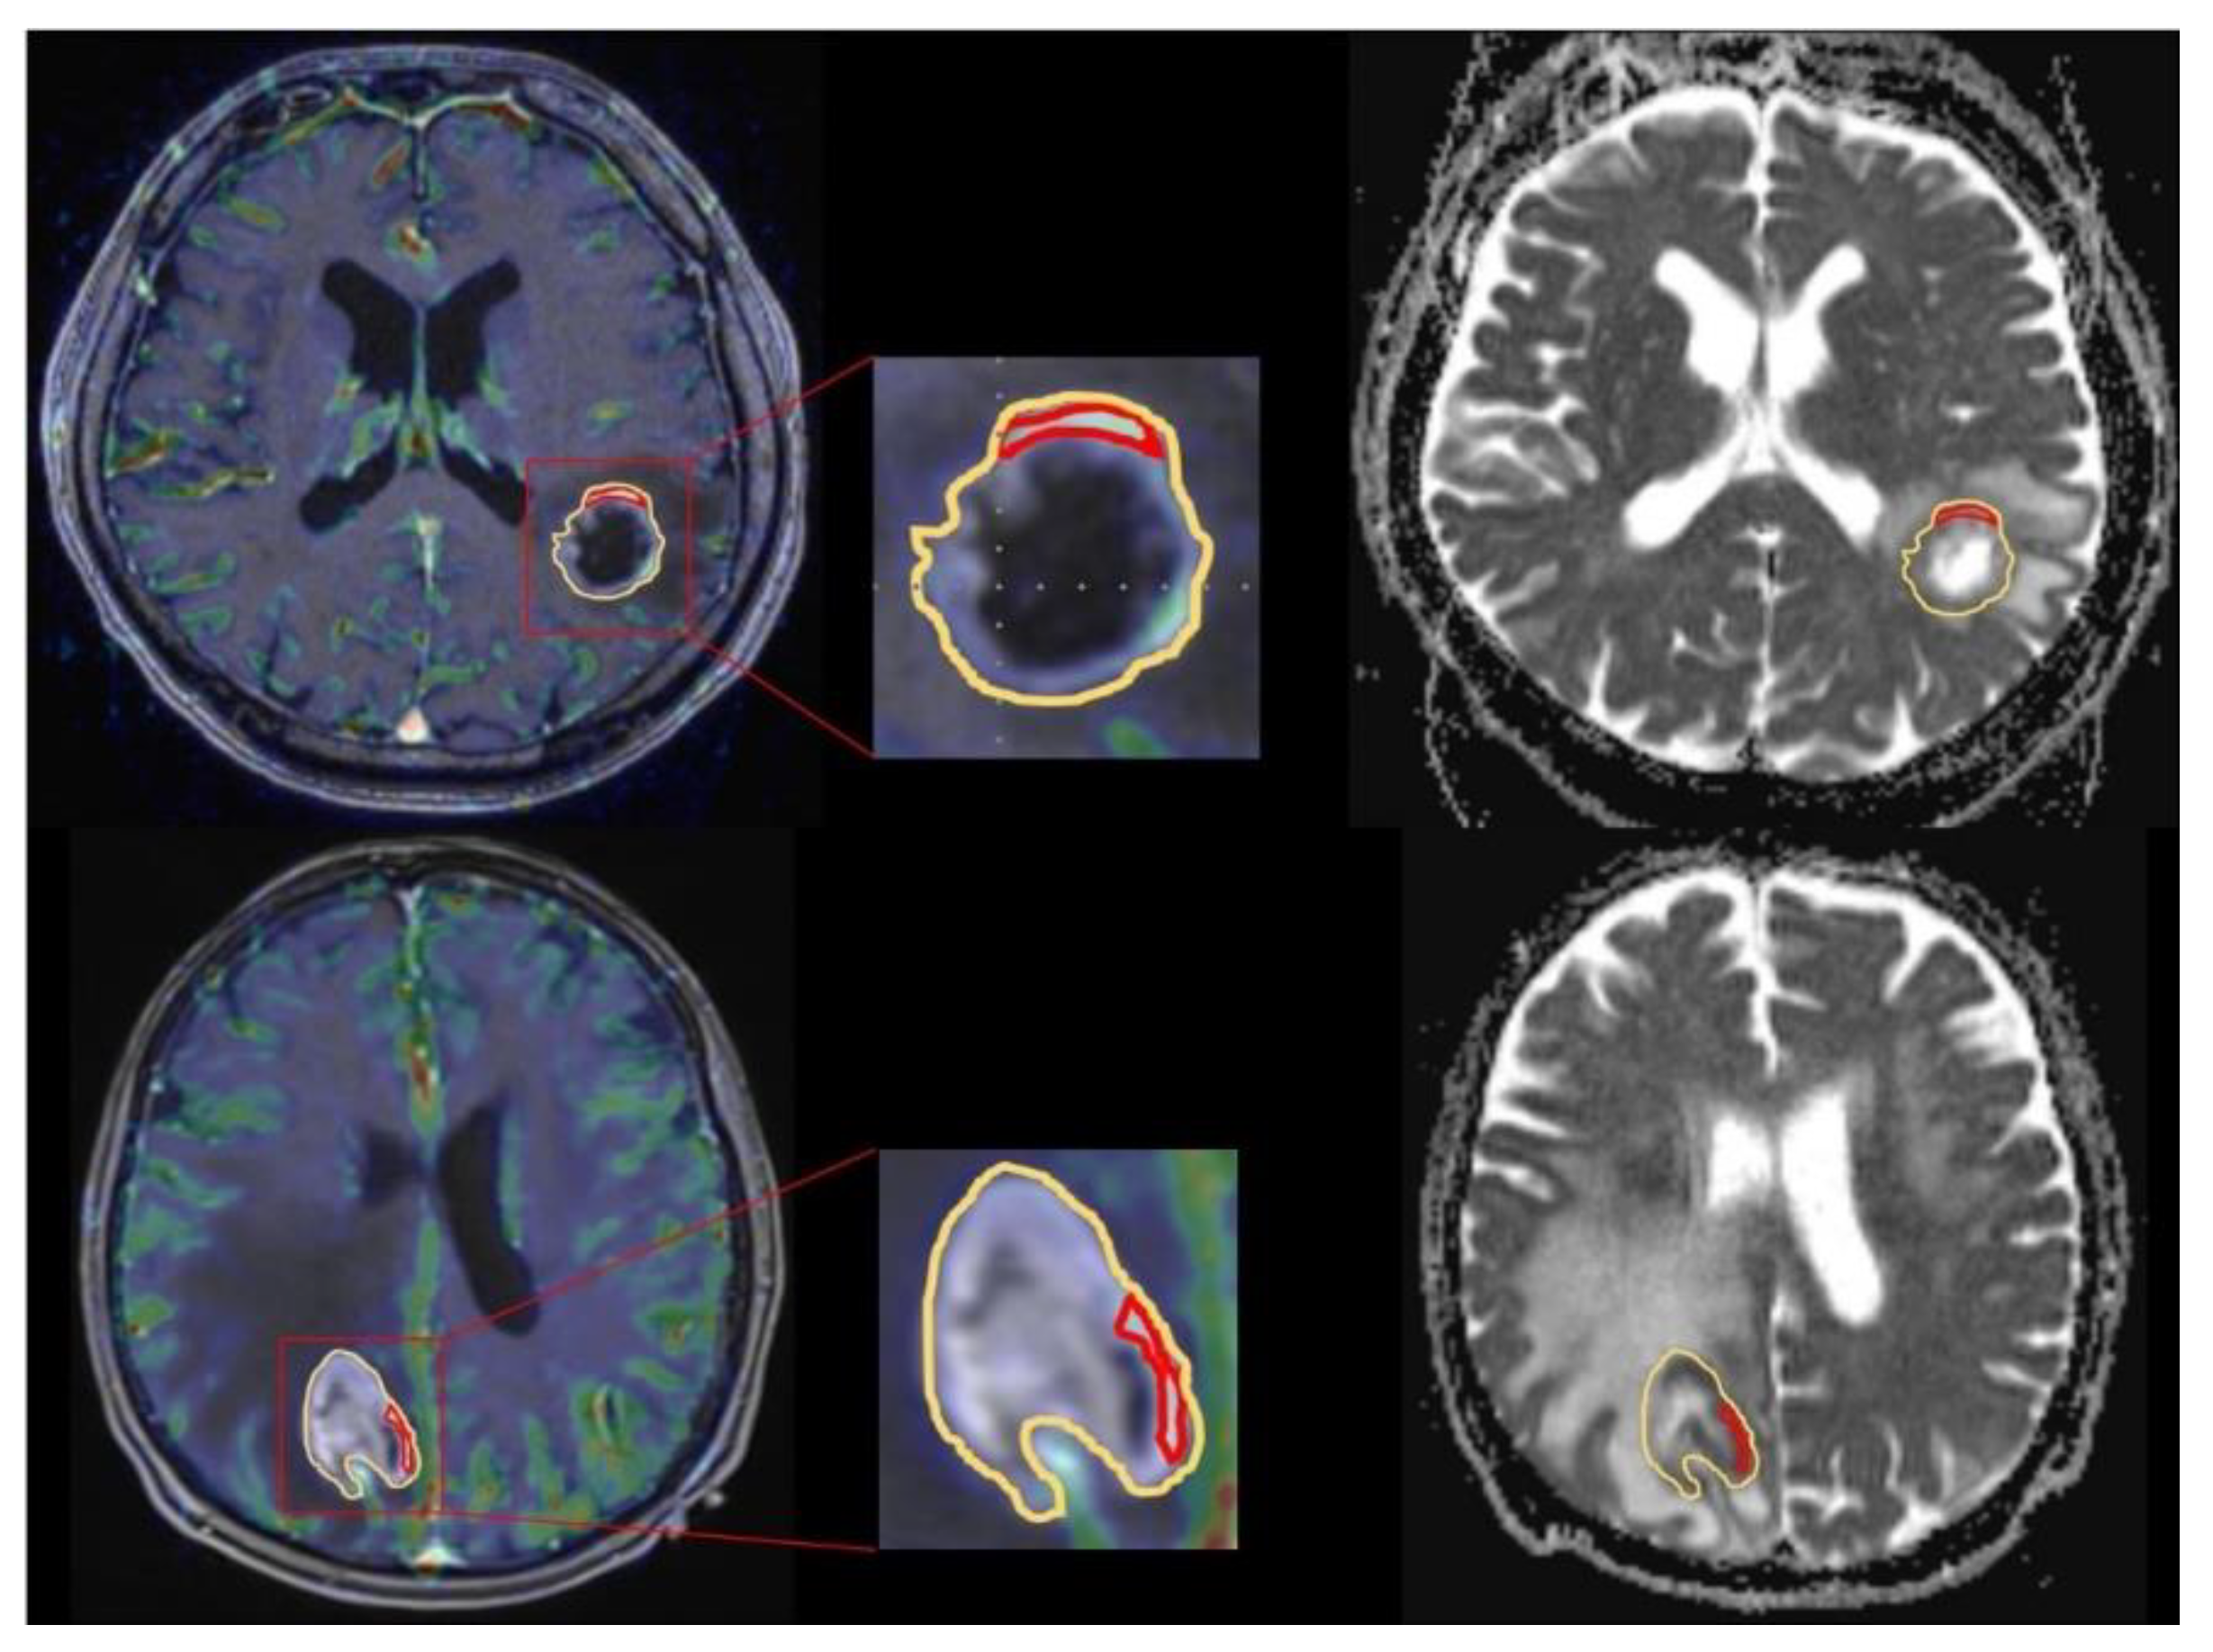
2.3. Data Evaluation
2.4. Statistical Analysis
3. Results
3.1. Patients
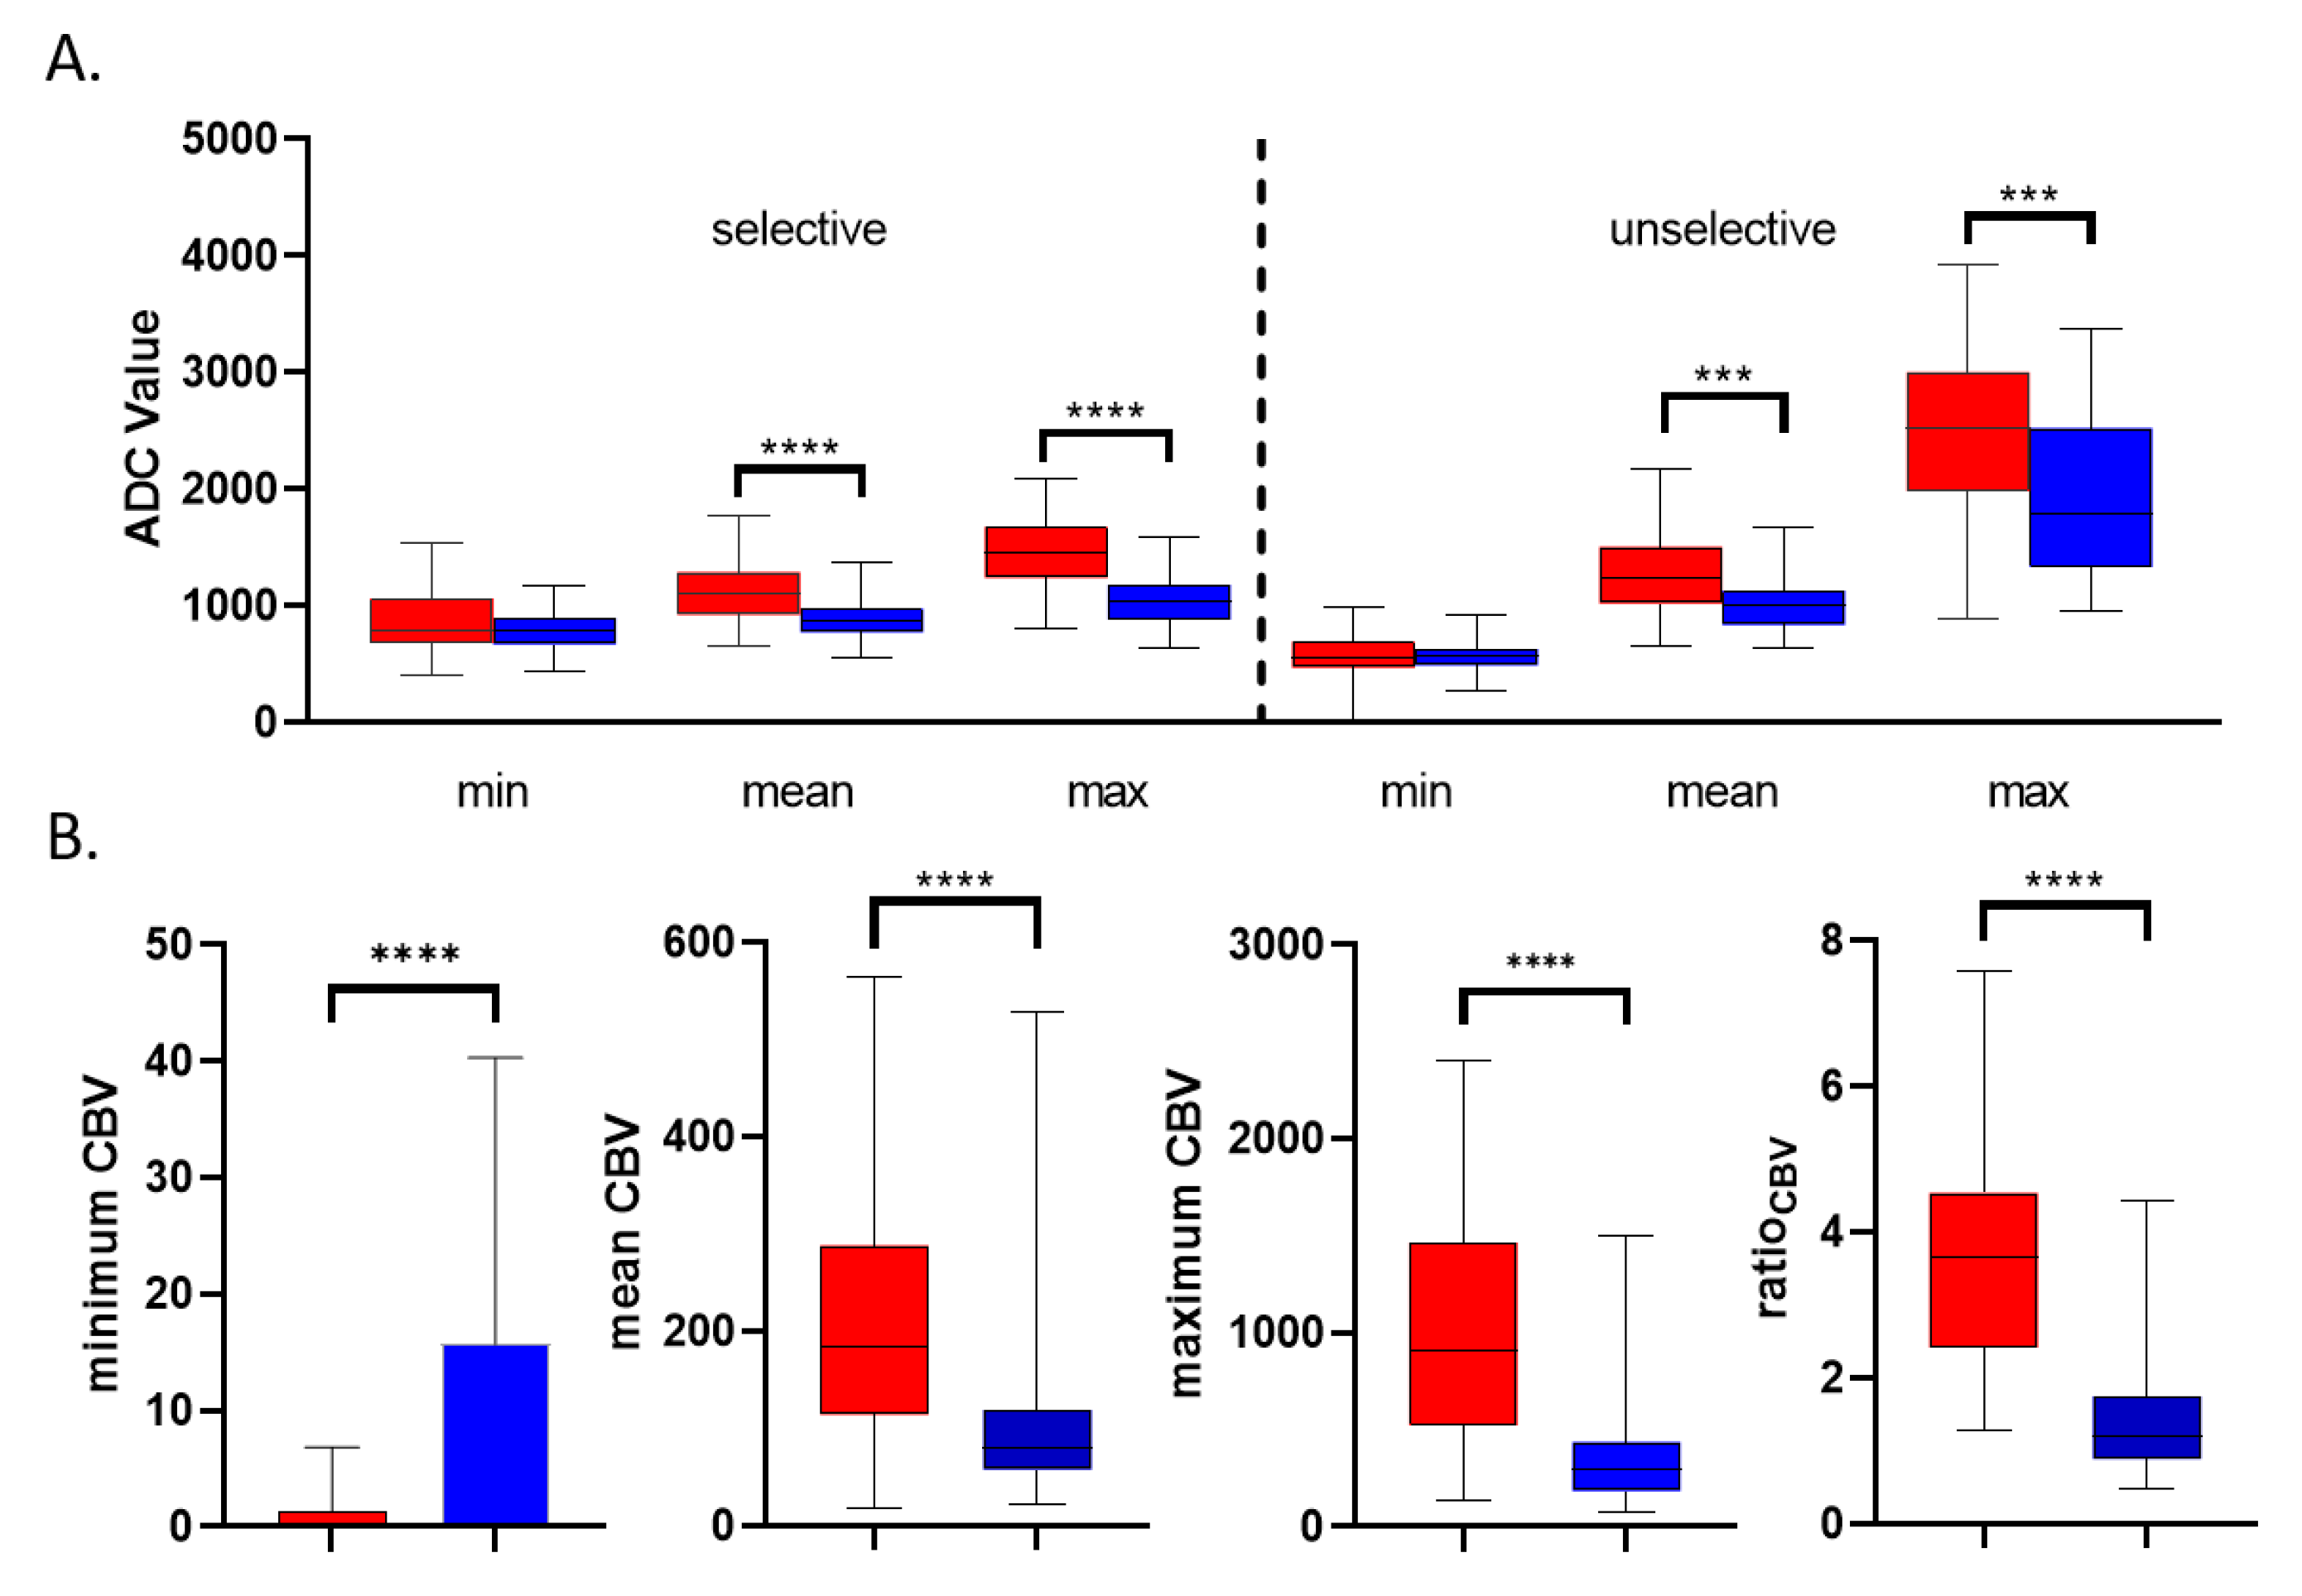
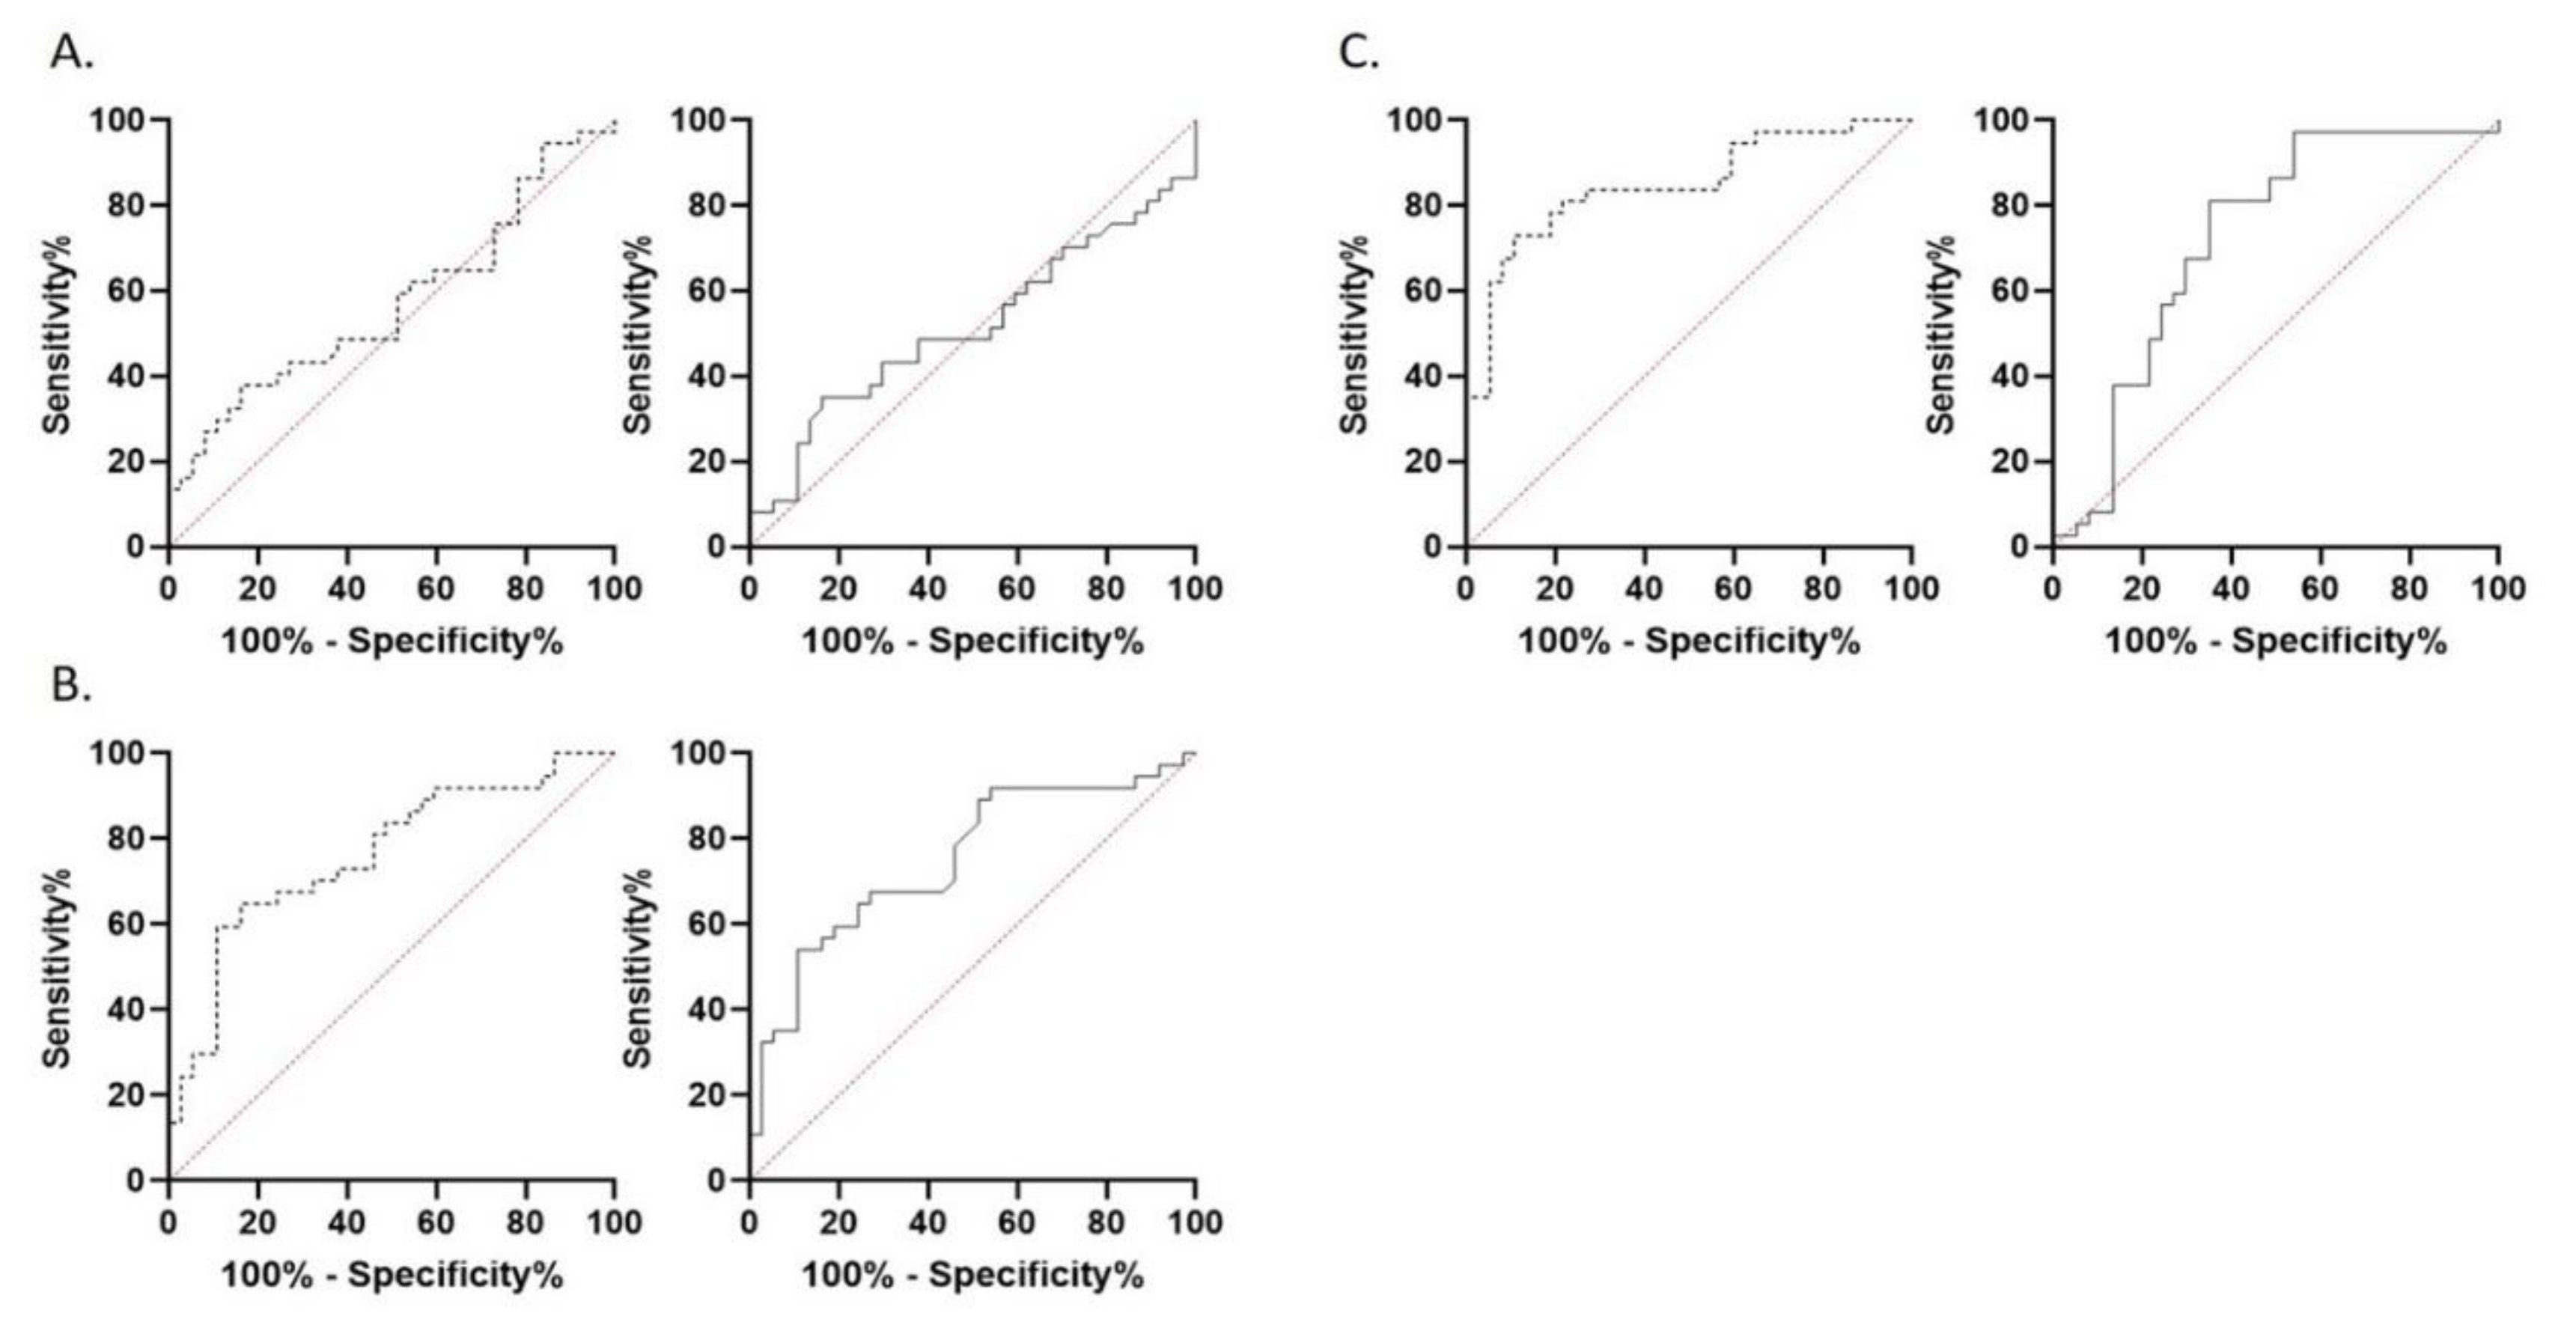
3.2. DWI Results
3.3. CBV Results
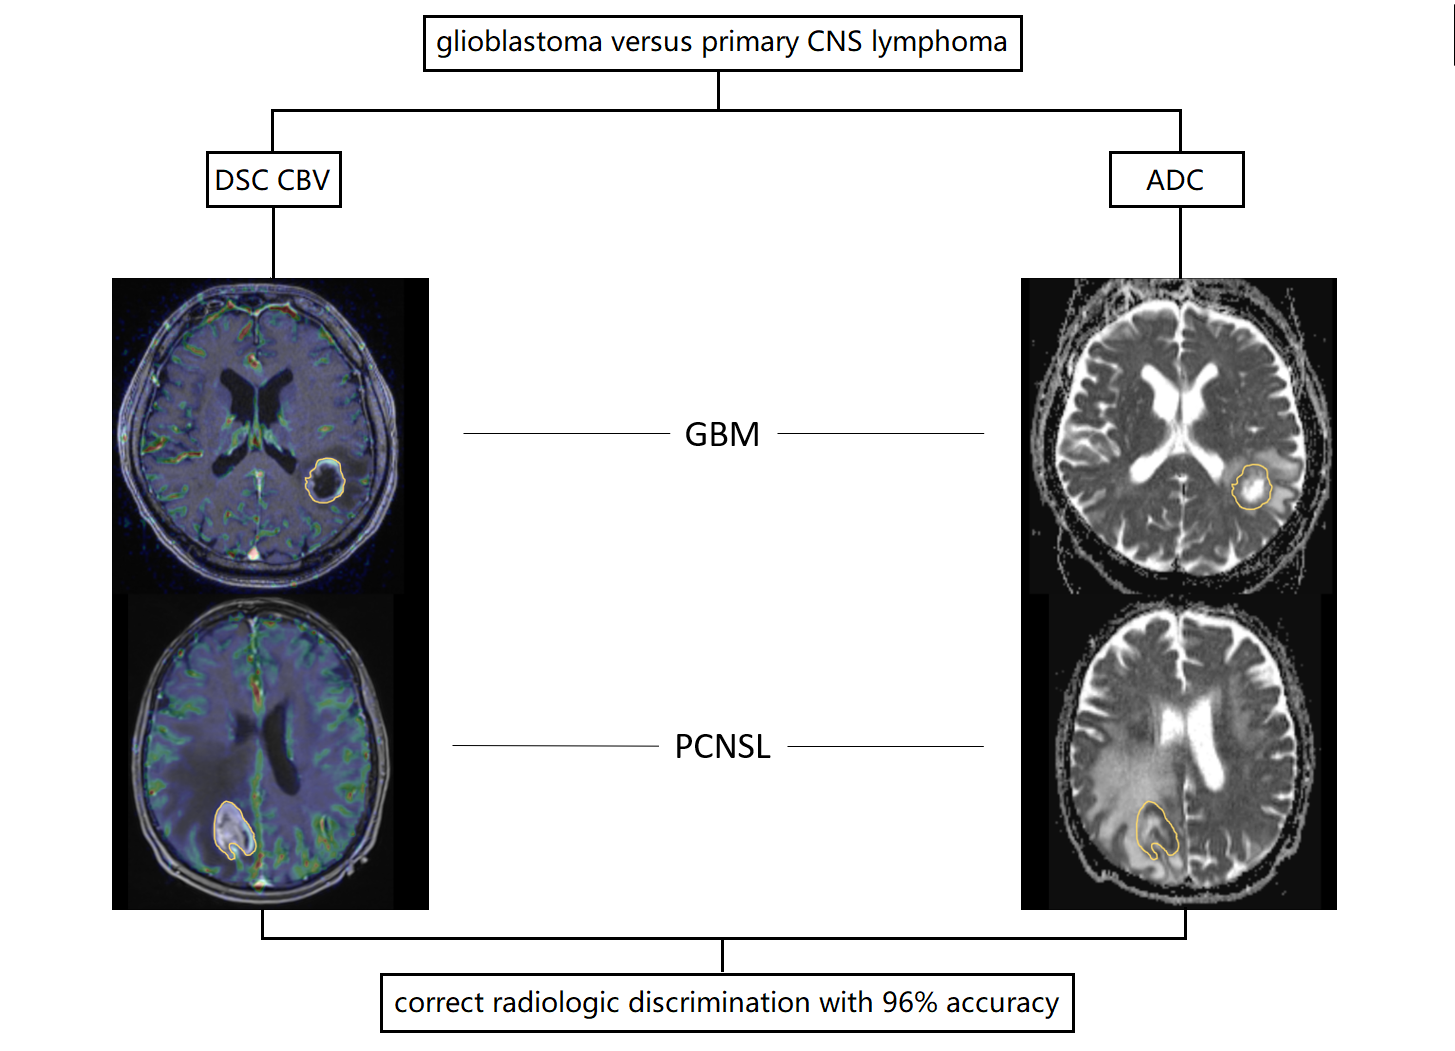
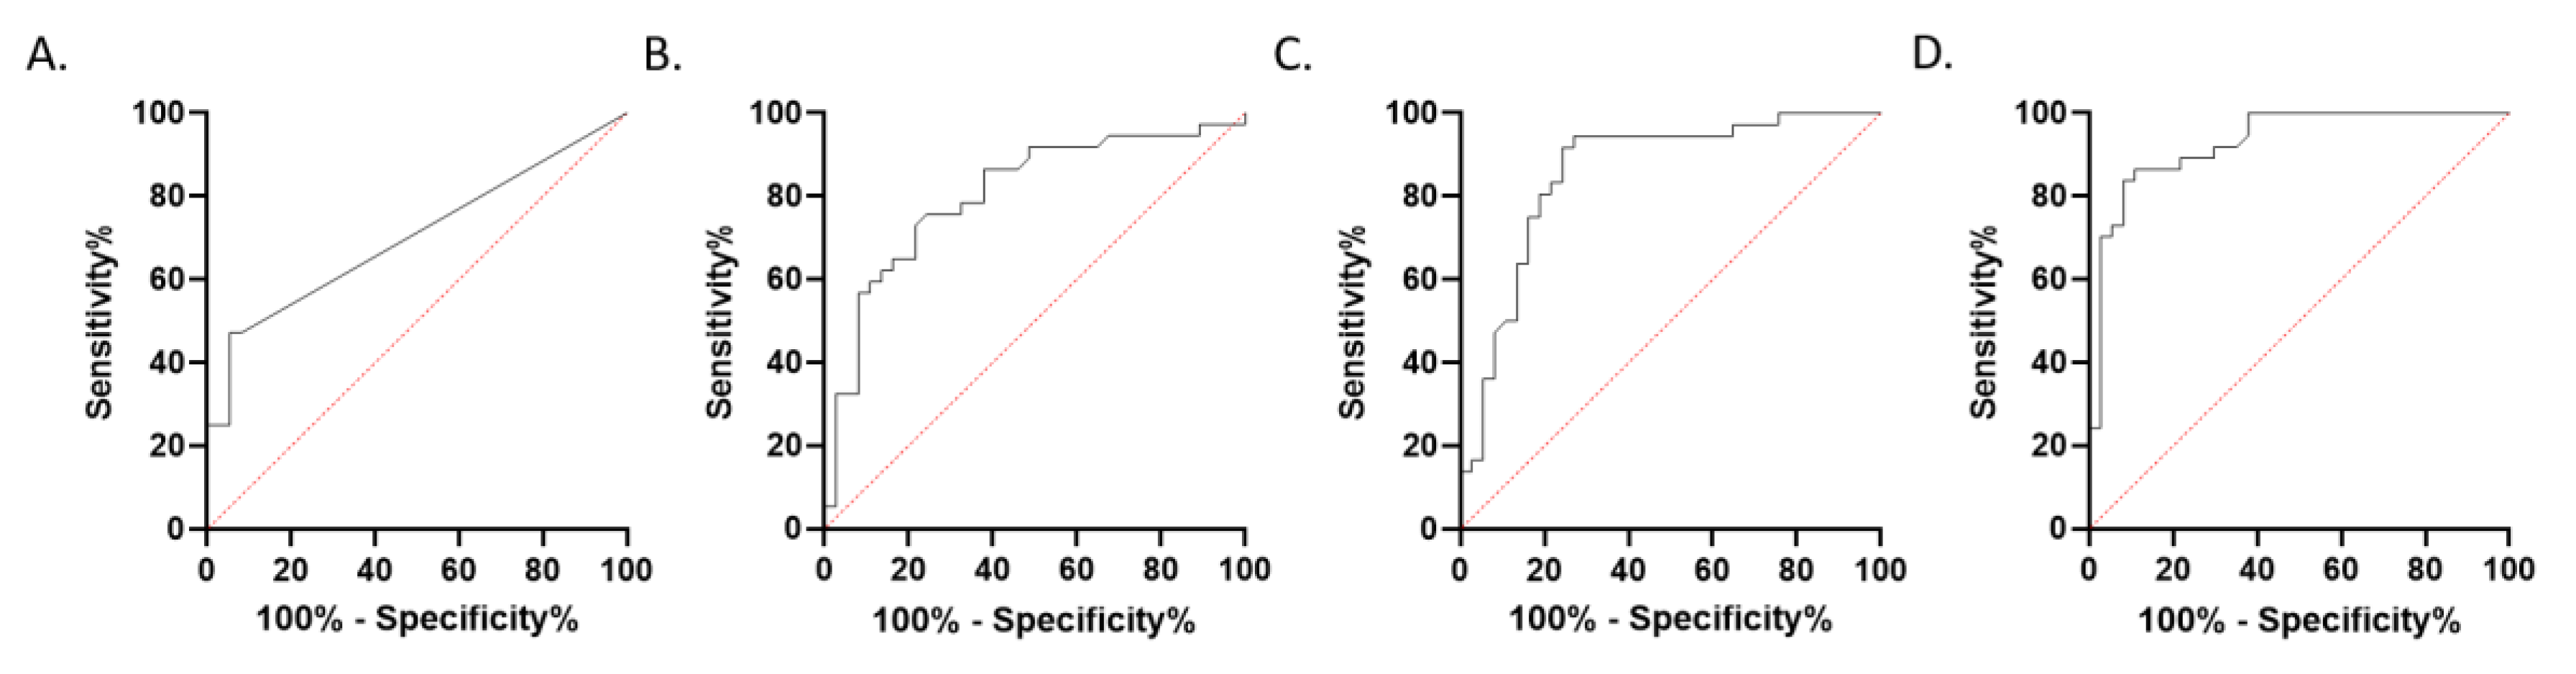
3.4. Multiparametric Assessment
4. Discussion
Author Contributions
Funding
Conflicts of Interest
References
- Ostrom, Q.T.; Gittleman, H.; Fulop, J.; Liu, M.; Blanda, R.; Kromer, C.; Wolinsky, Y.; Kruchko, C.; Barnholtz-Sloan, J.S. CBTRUS Statistical Report: Primary Brain and Central Nervous System Tumors Diagnosed in the United States in 2008–2012. Neuro Oncol. 2015, 17 (Suppl. 4), iv1–iv62. [Google Scholar] [CrossRef] [PubMed]
- Alexander, B.M.; Cloughesy, T.F. Adult Glioblastoma. J. Clin. Oncol. 2017, 35, 2402–2409. [Google Scholar] [CrossRef] [PubMed]
- Davis, M.E. Glioblastoma: Overview of Disease and Treatment. Clin. J. Oncol. Nurs. 2016, 20 (Suppl. 5), S2–S8. [Google Scholar] [CrossRef] [PubMed] [Green Version]
- Gerstner, E.R.; Batchelor, T.T. Primary central nervous system lymphoma. Arch. Neurol. 2010, 67, 291–297. [Google Scholar] [CrossRef] [PubMed]
- Alifieris, C.; Trafalis, D.T. Glioblastoma multiforme: Pathogenesis and treatment. Pharmacol. Ther. 2015, 152, 63–82. [Google Scholar] [CrossRef] [PubMed]
- Hoang-Xuan, K.; Bessell, E.; Bromberg, J.; Hottinger, A.F.; Preusser, M.; Ruda, R.; Schlegel, U.; Siegal, T.; Soussain, C.; Abacioglu, U.; et al. Diagnosis and treatment of primary CNS lymphoma in immunocompetent patients: Guidelines from the European Association for Neuro-Oncology. Lancet Oncol. 2015, 16, e322–e332. [Google Scholar] [CrossRef] [Green Version]
- Doskaliyev, A.; Yamasaki, F.; Ohtaki, M.; Kajiwara, Y.; Takeshima, Y.; Watanabe, Y.; Takayasu, T.; Amatya, V.J.; Akiyama, Y.; Sugiyama, K.; et al. Lymphomas and glioblastomas: Differences in the apparent diffusion coefficient evaluated with high b-value diffusion-weighted magnetic resonance imaging at 3T. Eur. J. Radiol. 2012, 81, 339–344. [Google Scholar] [CrossRef] [PubMed]
- Toh, C.H.; Wei, K.C.; Chang, C.N.; Ng, S.H.; Wong, H.F. Differentiation of primary central nervous system lymphomas and glioblastomas: Comparisons of diagnostic performance of dynamic susceptibility contrast-enhanced perfusion MR imaging without and with contrast-leakage correction. AJNR Am. J. Neuroradiol. 2013, 34, 1145–1149. [Google Scholar] [CrossRef] [PubMed] [Green Version]
- Radbruch, A.; Wiestler, B.; Kramp, L.; Lutz, K.; Baumer, P.; Weiler, M.; Roethke, M.; Sahm, F.; Schlemmer, H.P.; Wick, W.; et al. Differentiation of glioblastoma and primary CNS lymphomas using susceptibility weighted imaging. Eur. J. Radiol. 2013, 82, 552–556. [Google Scholar] [CrossRef] [PubMed]
- Kickingereder, P.; Wiestler, B.; Sahm, F.; Heiland, S.; Roethke, M.; Schlemmer, H.P.; Wick, W.; Bendszus, M.; Radbruch, A. Primary central nervous system lymphoma and atypical glioblastoma: Multiparametric differentiation by using diffusion-, perfusion-, and susceptibility-weighted MR imaging. Radiology 2014, 272, 843–850. [Google Scholar] [CrossRef] [PubMed] [Green Version]
- Saini, J.; Gupta, P.K.; Awasthi, A.; Pandey, C.M.; Singh, A.; Patir, R.; Ahlawat, S.; Sadashiva, N.; Mahadevan, A.; Gupta, R.K. Multiparametric imaging-based differentiation of lymphoma and glioblastoma: Using T1-perfusion, diffusion, and susceptibility-weighted MRI. Clin. Radiol. 2018, 73, 986.e7–986.e15. [Google Scholar] [CrossRef] [PubMed]
- Lu, X.; Xu, W.; Wei, Y.; Li, T.; Gao, L.; Fu, X.; Yao, Y.; Wang, L. Diagnostic performance of DWI for differentiating primary central nervous system lymphoma from glioblastoma: A systematic review and meta-analysis. Neurol. Sci. 2019, 40, 947–956. [Google Scholar] [CrossRef] [PubMed]
- Suh, C.H.; Kim, H.S.; Jung, S.C.; Park, J.E.; Choi, C.G.; Kim, S.J. MRI as a diagnostic biomarker for differentiating primary central nervous system lymphoma from glioblastoma: A systematic review and meta-analysis. J. Magn. Reson. Imaging 2019, 50, 560–572. [Google Scholar] [CrossRef]
- Xu, W.; Wang, Q.; Shao, A.; Xu, B.; Zhang, J. The performance of MR perfusion-weighted imaging for the differentiation of high-grade glioma from primary central nervous system lymphoma: A systematic review and meta-analysis. PLoS ONE 2017, 12, e0173430. [Google Scholar] [CrossRef]
- Horger, M.; Fenchel, M.; Nägele, T.; Moehle, R.; Claussen, C.D.; Beschorner, R.; Ernemann, U. Water diffusivity: Comparison of primary CNS lymphoma and astrocytic tumor infiltrating the corpus callosum. AJR Am. J. Roentgenol. 2009, 193, 1384–1387. [Google Scholar] [CrossRef]
- Ahn, S.J.; Shin, H.J.; Chang, J.H.; Lee, S.K. Differentiation between primary cerebral lymphoma and glioblastoma using the apparent diffusion coefficient: Comparison of three different ROI methods. PLoS ONE 2014, 9, e112948. [Google Scholar] [CrossRef] [PubMed]
- Stensjøen, A.L.; Solheim, O.; Kvistad, K.A.; Håberg, A.K.; Salvesen, Ø.; Berntsen, E.M. Growth dynamics of untreated glioblastomas in vivo. Neuro Oncol. 2015, 17, 1402–1411. [Google Scholar] [CrossRef] [PubMed] [Green Version]
- Delgado-López, P.D.; Corrales-García, E.M. Survival in glioblastoma: A review on the impact of treatment modalities. Clin. Transl. Oncol. 2016, 18, 1062–1071. [Google Scholar] [CrossRef] [PubMed]
- Batash, R.; Asna, N.; Schaffer, P.; Francis, N.; Schaffer, M. Glioblastoma Multiforme, Diagnosis and Treatment; Recent Literature Review. Curr. Med. Chem. 2017, 24, 3002–3009. [Google Scholar] [CrossRef] [PubMed]


| Contrast-Enhanced T1 MP-RAGE | DWI | DSC Perfusion with Leakage Correction | |
|---|---|---|---|
| TR (ms) | 2200 | 7600 | 2010 |
| TE (ms) | 2.67 | 86 | 30 |
| Flip angle (°) | 8 | 90 | 90 |
| FOV (mm2) | 250 | 230 | 230 |
| matrix (pixel) | 256 × 256 | 324 × 372 | 128 × 128 |
| voxel size (mm) | 1.0 × 1.0 × 1.0 | 1.2 × 1.2 × 5 | 1.8 × 1.8 × 3 |
| acquisition time (min) | 4:59 | 1:25 | 1:48 |
| Cut-off | Correctly Classified (%) | Identified GBM Patients | Identified PCNSL Patients | AUC | |
|---|---|---|---|---|---|
| CBVmin | 4.5 | 69 | 35 of 37 | 16 of 37 | 0.703 |
| CBVmax | 473 | 78 | 29 of 37 | 29 of 37 | 0.857 |
| CBVmean | 129.5 | 76 | 27 of 37 | 29 of 37 | 0.804 |
| ratioCBV | 2.2 | 86 | 31 of 37 | 33 of 37 | 0.930 |
| ADCsel min | 982 | 68 | 13 of 37 | 31 of 37 | 0.573 |
| ADCsel mean | 1066 | 72 | 23 of 37 | 30 of 37 | 0.762 |
| ADCsel max | 1314 | 80 | 26 of 37 | 33 of 37 | 0.847 |
| ADCunsel min | 642 | 68 | 13 of 37 | 31 of 37 | 0.516 |
| ADCunsel mean | 1220 | 70 | 19 of 37 | 33 of 37 | 0.750 |
| ADCunsel max | 1973 | 70 | 28 of 37 | 24 of 37 | 0.722 |
| Multiparameter model | - | 100 | 37 of 37 | 37 of 37 | 1 |
Publisher’s Note: MDPI stays neutral with regard to jurisdictional claims in published maps and institutional affiliations. |
© 2020 by the authors. Licensee MDPI, Basel, Switzerland. This article is an open access article distributed under the terms and conditions of the Creative Commons Attribution (CC BY) license (http://creativecommons.org/licenses/by/4.0/).
Share and Cite
Eisenhut, F.; Schmidt, M.A.; Putz, F.; Lettmaier, S.; Fröhlich, K.; Arinrad, S.; Coras, R.; Luecking, H.; Lang, S.; Fietkau, R.; et al. Classification of Primary Cerebral Lymphoma and Glioblastoma Featuring Dynamic Susceptibility Contrast and Apparent Diffusion Coefficient. Brain Sci. 2020, 10, 886. https://0-doi-org.brum.beds.ac.uk/10.3390/brainsci10110886
Eisenhut F, Schmidt MA, Putz F, Lettmaier S, Fröhlich K, Arinrad S, Coras R, Luecking H, Lang S, Fietkau R, et al. Classification of Primary Cerebral Lymphoma and Glioblastoma Featuring Dynamic Susceptibility Contrast and Apparent Diffusion Coefficient. Brain Sciences. 2020; 10(11):886. https://0-doi-org.brum.beds.ac.uk/10.3390/brainsci10110886
Chicago/Turabian StyleEisenhut, Felix, Manuel A. Schmidt, Florian Putz, Sebastian Lettmaier, Kilian Fröhlich, Soheil Arinrad, Roland Coras, Hannes Luecking, Stefan Lang, Rainer Fietkau, and et al. 2020. "Classification of Primary Cerebral Lymphoma and Glioblastoma Featuring Dynamic Susceptibility Contrast and Apparent Diffusion Coefficient" Brain Sciences 10, no. 11: 886. https://0-doi-org.brum.beds.ac.uk/10.3390/brainsci10110886