Lacking Pace but Not Precision: Age-Related Information Processing Changes in Response to a Dynamic Attentional Control Task

 ,
,  and
and
Abstract
:1. Introduction
1.1. Attentional Control
1.2. Study Rationale
2. Materials and Methods
2.1. Participants
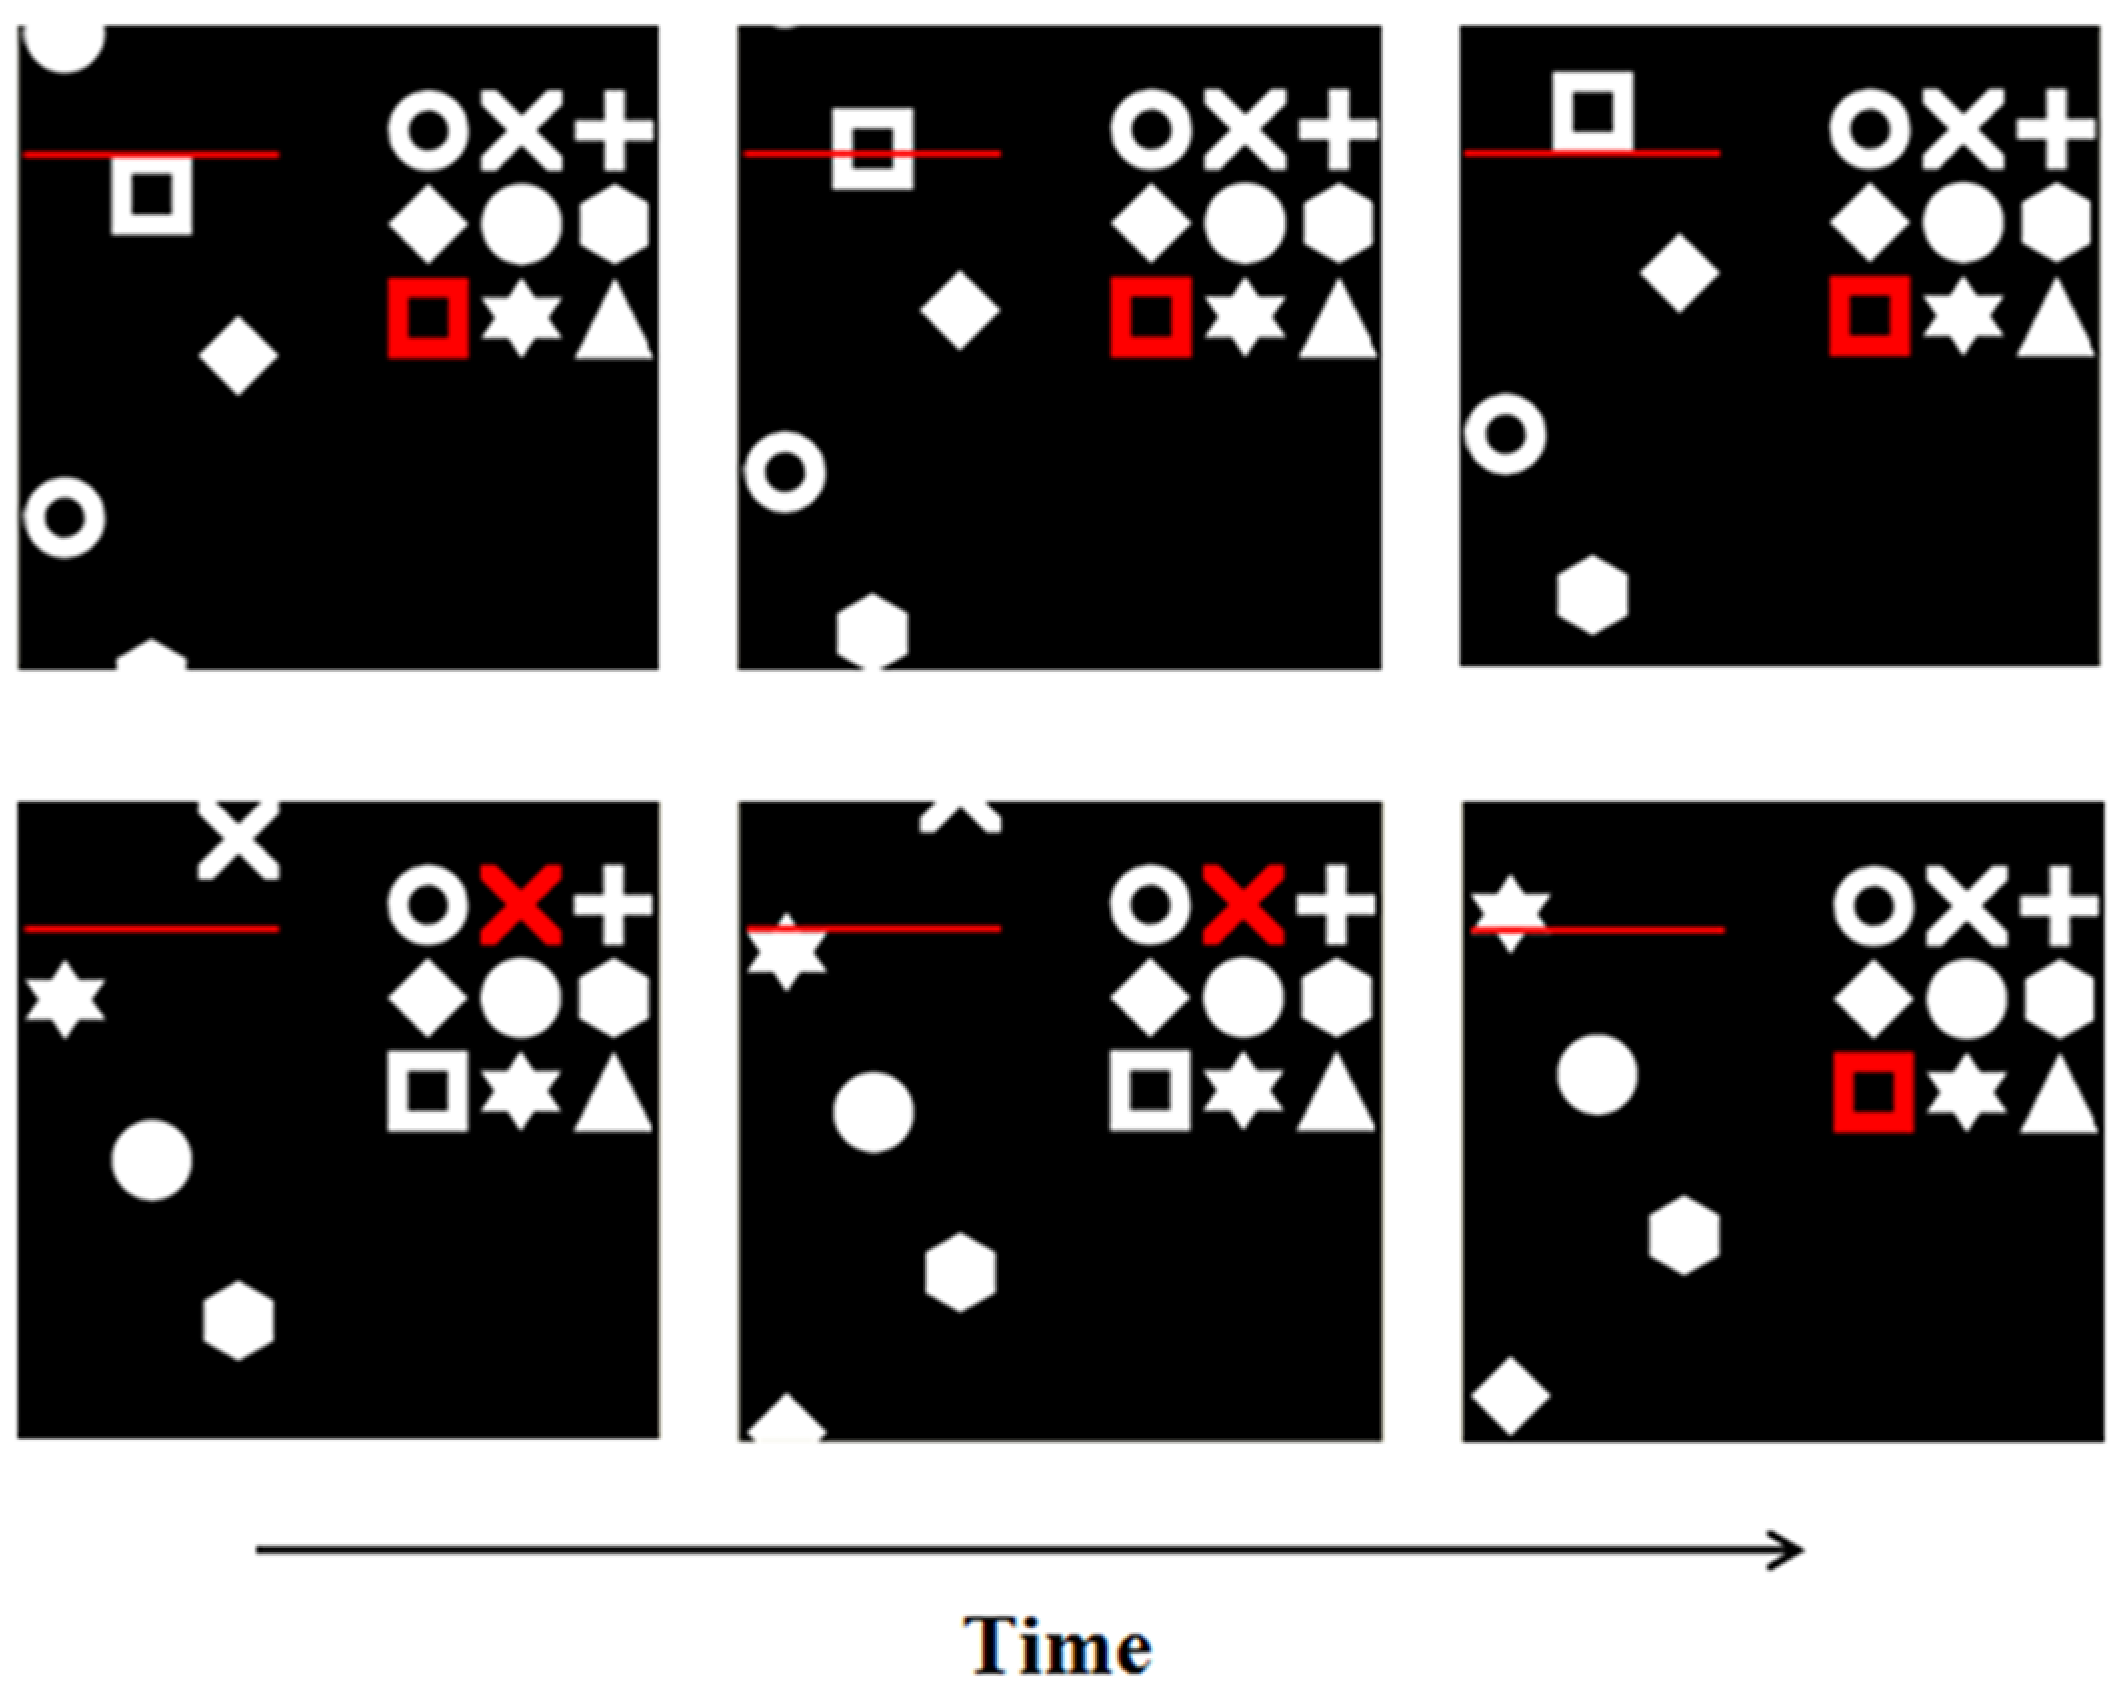
2.2. Materials and Procedures
2.3. Data Analysis and Results
3. Discussion
3.1. Potential Study Limitations
3.2. Future Studies
Author Contributions
Funding
Acknowledgments
Conflicts of Interest
References
- Kuznetsova, K.A.; Maniega, S.M.; Ritchie, S.J.; Cox, S.R.; Storkey, A.J.; Starr, J.M.; Wardlau, J.M.; Deary, I.J.; Bastin, M.E. Brain white matter structure and information processing speed in healthy older age. Brain. Struct. Funct. 2016, 221, 3223–3235. [Google Scholar] [CrossRef] [Green Version]
- Yang, Y.; Bender, A.R.; Raz, N. Age related differences in reaction time components and diffusion properties of normal-appearing white matter in healthy adults. Neuropsychologia 2015, 66, 246–258. [Google Scholar] [CrossRef] [PubMed] [Green Version]
- Haynes, B.I.; Bauermeister, S.; Bunce, D. A systematic review of longitudinal associations between reaction time intraindividual variability and age-related cognitive decline or impairment, dementia and mortality. J. Int. Neuropsychol. Soc. 2017, 23, 431–445. [Google Scholar] [CrossRef] [PubMed] [Green Version]
- Hong, Z.; Ng, K.K.; Sim, S.K.; Ngeow, M.Y.; Zheng, H.; Lo, J.C.; Chee, M.W.; Zhou, J. Differential age-dependent associations of gray matter volume and white matter integrity with processing speed in healthy older adults. Neuroimage 2015, 123, 42–50. [Google Scholar] [CrossRef] [PubMed]
- Bielak, A.A.M.; Cherbuin, N.; Bunce, D.; Anstey, K.J. Intraindividual variability is a fundamental phenomenon of Aging: Evidence from an 8-year longitudinal study across young, middle and older adulthood. Develop. Psych. 2014, 50, 143–151. [Google Scholar] [CrossRef]
- Jackson, J.D.; Balota, D.A.; Duchek, J.M.; Head, D. White matter integrity and reaction time intraindividual variability in healthy aging and early-stage Alzheimer’s Disease. Neuropsychologia 2012, 50, 357–366. [Google Scholar] [CrossRef] [Green Version]
- Bunce, D.; Haynes, B.I.; Lord, S.R.; Gschwind, Y.J.; Kochan, N.A.; Reppermund, S.; Brodaty, H.; Sachdev, P.S.; Delbaere, K. Intraindividual stepping reaction time variability predicts falls in older adults with mild cognitive impairment. J. Gerontol. A Biol. Sci. Med. Sci. 2016, 72, 832–837. [Google Scholar] [CrossRef] [Green Version]
- Aichele, S.; Rabbitt, P.; Ghisletta, P. Think fast, feel fine, live long: A 29-year study of cognition, health, and survival in middle-aged and older adults. Psychol. Sci. 2016, 4, 518–529. [Google Scholar] [CrossRef] [Green Version]
- Kochan, N.A.; Bunce, D.; Pont, S.; Crawford, J.D.; Brodaty, H.; Sachdev, P.S. Is intraindividual reaction time variability an independent cognitive predictor of mortality in old age? Findings from the Sydney memory and ageing study. PLoS ONE 2017, 12, e0181719. [Google Scholar] [CrossRef]
- Troyer, A.K.; Vandermorris, S.; Murphy, K.J. Intraindividual variability on associative memory tasks is elevated in amnestic mild cognitive impairment. Neuropsychologia 2016, 90, 110–116. [Google Scholar] [CrossRef]
- Richards, E.; Bayer, A.; Hanley, C.; Norris, J.E.; Tree, J.J.; Tales, A. Reaction time and visible white matter lesions in subcortical ischemic vascular cognitive impairment. J. Alz. Dis. 2019, 72, 859–865. [Google Scholar] [CrossRef] [PubMed] [Green Version]
- Richards, E.; Bayer, A.; Hanley, C.; Norris, J.E.; Tales, A. Subcortical ischemic vascular cognitive impairment: Insights from reaction time measures. J. Alz. Dis. 2019, 723, 845–857. [Google Scholar] [CrossRef] [Green Version]
- Tales, A.; Leonards, U.; Bompas, A.; Snowden, R.; Phillips, M.; Porter, G.; Hawworth, J.; Wilcock, G.; Bayer, A. Intra-individual reaction time variability in amnestic mild cognitive impairment: A precursor to dementia? J. Alz. Dis. 2012, 32, 457–466. [Google Scholar] [CrossRef]
- Bayer, A.; Phillips, M.; Porter, G.; Leonards, U.; Bompas, A.; Tales, A. Abnormal inhibition of return in mild cognitive impairment: Is it specific to the presence of prodromal dementia? J. Alz. Dis. 2014, 40, 177–189. [Google Scholar] [CrossRef] [PubMed]
- Haworth, J.; Phillips, M.; Newson, M.; Rogers, P.J.; Torrens-Burton, A.; Tales, A. Measuring information processing speed in mild cognitive impairment: Clinical versus research dichotomy. J. Alz. Dis. 2016, 51, 263–275. [Google Scholar] [CrossRef] [PubMed] [Green Version]
- Panwar, N.; Purohit, D.; Deo Sinha, V.; Joshi, M. Evaluation of extent and pattern of neurocognitive functions in mild and moderate traumatic brain injury patients by using Montreal Cognitive Assessment (MoCA) score as a screening tool: An observational study from India. Asian J. Psychiatry 2019, 41, 60–65. [Google Scholar] [CrossRef]
- Hedden, T.; Van Dijk, K.R.A.; Shire, E.H.; Sperling, R.A.; Johnson, K.A.; Buckner, R.L. Failure to modulate attentional control in advanced aging linked to white matter pathology. Cereb. Cortex. 2012, 22, 1038–1051. [Google Scholar] [CrossRef]
- Rensink, R.A. The dynamic representation of scenes. Vis. Cogn. 2000, 7, 17–42. [Google Scholar] [CrossRef]
- Guest, D.; Howard, C.J.; Brown, L.A.; Gleeson, H. Aging and the rate of visual information processing. J. Vis. 2015, 15, 1–25. [Google Scholar] [CrossRef] [Green Version]
- Dymowski, A.R.; Owens, J.A.; Ponsford, J.L.; Willmott, C. Speed of processing and strategy control of attention after traumatic brain injury. J. Clin. Exp. Neuropsychol. 2015, 37, 1024–1035. [Google Scholar] [CrossRef]
- Sylvester, C.Y.C.; Wager, T.D.; Lacey, S.C.; Hernandez, L. Switching attention and resolving interference: fMRI measures of executive functions. Neuropsychologia 2003, 41, 357–370. [Google Scholar] [CrossRef]
- Cieslik, E.C.; Mueller, V.I.; Eickhoff, C.R.; Langner, R.; Eickhoff, S.B. Three key regions for supervisory attentional control: Evidence from neuroimaging meta-analyses. Neurosci. Biobehav. Rev. 2015, 48, 22–34. [Google Scholar] [CrossRef] [PubMed] [Green Version]
- Maylor, E.A.; Wing, A.M. Age differences in postural stability are increased by additional cognitive demands. J. Gerontol. Ser. B Psychol. Sci. Soc. Sci. 1996, 51, 143–154. [Google Scholar] [CrossRef] [PubMed] [Green Version]
- Teasdale, N.; Bard, C.; LaRue, J.; Fleury, M. On the cognitive penetrability of posture control. Exp. Aging Res. 1993, 19, 1–3. [Google Scholar] [CrossRef] [PubMed]
- Maylor, E.A.; Lavie, N. The influence of perceptual load on age differences in selective attention. Psychol. Aging 1998, 13, 563–573. [Google Scholar] [CrossRef]
- Tales, A.; Muir, J.; Jones, R.; Bayer, A.; Snowden, R.J. The effects of saliency and task difficulty on visual search performance in ageing and Alzheimer’s disease. Neuropsychologia 2004, 42, 335–345. [Google Scholar] [CrossRef] [PubMed]
- Vaportzis, E.; Georgiou-Karistianis, N.; Stout, J.C. Dual task performance in normal aging: A compaison of choice reaction time tasks. PLoS ONE 2013, 8, e60265. [Google Scholar] [CrossRef] [Green Version]
- Tales, A.; Snowden, R.J.; Phillips, M.; Haworth, J.; Porter, G.; Wilcock, G.; Bayer, A. Exogenous phasic alerting and spatial orienting in mild cognitive impairment compared to healthy ageing: Study outcome is related to target response. Cortex 2011, 47, 180–190. [Google Scholar] [CrossRef]
- Eimer, M. The neural basis of attentional control in visual search. Trends Cogn. Sci. 2014, 18. [Google Scholar] [CrossRef] [Green Version]
- Torrens-Burton, A.; Basoudan, N.; Bayer, A.; Tales, A. Perception and reality of cognitive function: Information processing speed, perceived memory function and perceived task difficulty in older adults. J. Alz. Dis. 2017, 60, 1601–1609. [Google Scholar] [CrossRef] [Green Version]
- Heitz, R.P. The speed-accuracy tradeoff: History, physiology, methodology, and behaviour. Front. Neurosci. 2014, 8, 150. [Google Scholar] [CrossRef] [PubMed] [Green Version]
- Hird, M.A.; Egeto, P.; Fischer, C.E.; Naglie, G.; Schweizer, T.A. A systematic review and meta-analysis of on-road simulator and cognitive driving assessment in Alzheimer’s disease and mild cognitive impairment. J. Alz. Dis. 2016, 53, 713–729. [Google Scholar] [CrossRef] [PubMed]
- Callaghan, E.; Holland, C.; Kessler, K. Age-related changes in the ability to switch between temporal and spatial attention. Front. Ageing Neurosci. 2017, 9, 28. [Google Scholar] [CrossRef] [Green Version]
- Stinchcombe, A.; Gagnon, S.; Zhang, J.J.; Montembeault, P.; Bedard, M. Fluctuating attentional demand in the simulated driving assessment: The roles of age and driving complexity. Traffic Inj. Prev. 2011, 12, 576–587. [Google Scholar] [CrossRef] [PubMed]
- Tsang, P.S. Ageing and attentional control. Q. J. Exp. Psychol. 2013, 66, 1517–1547. [Google Scholar] [CrossRef] [PubMed] [Green Version]
- Roca, J.; Castro, C.; López-Ramón, M.F.; Lupiáñez, J. Measuring vigilence while assessing the function of the three attentional networks: The ANI-Vigilance task. J. Neurosci. Methods. 2011, 198, 312–324. [Google Scholar] [CrossRef]
- McManus, B.; Heaton, K.; Stavrinos, D. Commercial motor vehicle driving performance: An examination of attentional resources and control using a driving simulator. J. Exp. Psychol. Appl. 2017, 23, 191–203. [Google Scholar] [CrossRef]
- Pyun, J.-M.; Kang, M.J.; Kim, S.; Baek, M.J.; Wang, M.J.; Kim, S.Y. Driving cessation and cognitive dysfunction in patients with mild cognitive impairment. J. Clin. Med. 2018, 7, 545. [Google Scholar] [CrossRef] [Green Version]
- Liddle, J.; Turpin, M.; Carlson, G.; McKenna, K. The needs and experiences related to driving cessation for older people. Br. J. Occup. Therapy 2008, 71, 379–388. [Google Scholar] [CrossRef]
- Musselwhite, C.B.; Shergold, I. Examining the process of driving cessation in later life. EU. J. Ageing 2013, 10, 89–100. [Google Scholar] [CrossRef] [Green Version]
- Whelihan, W.M.; DiCarlo, M.A.; Paul, R.H. The relationship of neuropsychological functioning to driving competence in older persons with early cognitive decline. Arch. Clin. Neuropsychol. 2005, 20, 217–228. [Google Scholar] [CrossRef] [PubMed] [Green Version]
- Hanley, C.J.; Tales, A. Anodal tDCS improves attentional control in older adults. Exp. Gerontol. 2019, 115, 88–95. [Google Scholar] [CrossRef] [PubMed] [Green Version]
- Taylor, M.; Creelman, C.D. PEST: Efficient estimates on probability functions. J. Acoust. Soc. Am. 1967, 41, 782–787. [Google Scholar] [CrossRef]
- Aschenbrenner, A.J.; Balota, D.A. Dynamic adjustments of attentional control in healthy aging. Psychol. Aging 2017, 32, 1–15. [Google Scholar] [CrossRef] [PubMed]
- Nasreddine, Z.S.; Phillips, N.A.; Bédirian, V.; Charbonneau, S.; Whitehead, V.; Collin, I.; Cummings, J.L.; Chertkow, H. The Montreal Cognitive Assessment, MoCA: A brief screening tool for mild cognitive impairment. J. Am. Geriatr. 2005, 53, 695–699. [Google Scholar] [CrossRef]
- Gilewski, M.J.; Zelinski, E.M.; Schaie, K.W. The Memory functioning questionnaire for assessment of memory complaints in adulthood and old age. Psychol. Aging 1990, 5, 482–490. [Google Scholar] [CrossRef]
- Nelson, H.E.; Willison, J.R. National Adult Reading Test (NART). Test Manual Including New Data Supplement, NFER-Nelson, Windsor; NFER-Nelson Publishing Company Ltd.: London, UK, 1991. [Google Scholar]
- Stern, Y. Cognitive Reserve. Neuropsychologia 2009, 47, 2015–2028. [Google Scholar] [CrossRef]
- Dykiert, D.; Deary, I.J. Retrospective validation of WTAR and NART scores as estimators of prior cognitive ability using the Lothian Birth Cohort 1936. Psychol. Assess. 2013, 25, 1361–1366. [Google Scholar] [CrossRef] [Green Version]
- Olaithe, M.; Bucks, R.S.; Eastwood, P.; Hillman, D.; Skinner, T.; James, A.; Hunter, M.; Gavett, B. A brief report: The national adult reading test (NART) is a stable assessment of premorbid intelligence across disease severity in obstructive sleep apnea (OSA). J. Sleep Res. 2019. [Google Scholar] [CrossRef]
- Osone, A.; Arai, R.; Hakamada, R.; Shimoda, K. Cognitive and brain reserve in conversion and reversion in patients with mild cognitive impairment over 12 months of follow-up. J. Clin. Exp. Neuropsychol. 2016, 38, 1084–1093. [Google Scholar] [CrossRef]
- Alosco, M.L.; Spitznagel, M.B.; Raz, N.; Cohen, R.; Sweet, L.H.; Van Dulmen, M.; Colbert, L.H.; Josephson, R.; Waechter, D.; Hughes, J.; et al. Cognitive reserve moderates the association between heart failure and cognitive impairment. J. Clin. Exp. Neuropsychol. 2012, 34, 1–10. [Google Scholar] [CrossRef] [PubMed] [Green Version]
- Tales, A.; Basoudan, N. Anxiety in old age and dementia- implications for clinical and research practice. Neuropsychiatry 2016, 6, 142–148. [Google Scholar] [CrossRef] [Green Version]
- Reimers, S.; Maylor, S. Gender effects on reaction time variability and trial-to-trial performance: Reply to Deary and Der. Aging Neuropsychol. Cogn. 2005, 13, 479–489. [Google Scholar] [CrossRef] [PubMed]
- Jessen, F.; Amariglio, R.E.; Buckley, R.F.; Van Der Flier, W.M.; Han, Y.; Molinuevo, J.L.; Rabin, L.; Rentz, D.M.; Rodrigo-Gomez, O.; Saykin, A.J.; et al. The characterization of subjective cognitive decline. Lancet Neurol. 2020, 19, 271–278. [Google Scholar] [CrossRef]
- Kroenke, K.; Spitzer, R.L.; Williams, J.B. The PHQ-9. J. Gen. Intern. Med. 2001, 16, 606–613. [Google Scholar] [CrossRef]
- Löwe, B.; Decker, O.; Müller, S.; Brähler, E.; Schellberg, D.; Herzog, W.; Herzberg, P.Y. Validation and standardization of the Generalized Anxiety Disorder Screener (GAD-7) in the general population. Med. Care. 2008, 46, 266–274. [Google Scholar] [CrossRef]
- Wood, R.L.l.; Bigler, E. Problems Assessing Executive Dysfunction in Neurobehavioural Disability. In Neurobehavioural Disability and Social Handicap Following Traumatic Brain Injury; McMillan, T.M., Wood, R.L., Eds.; Psychology Press and Routledge Classic: Oxfordshire, UK, 2017. [Google Scholar]


| Age (Years) | Education Level (Years) | NART | MoCA Score | MFQ (Total Score) | PHQ-9 | GAD-7 | |
|---|---|---|---|---|---|---|---|
| Young Adults | 20 (2.1) | 14.7 (3.5) | - | 27.0 (2.1) | - | 6.3 (4.4) | 4.8 (4.3) |
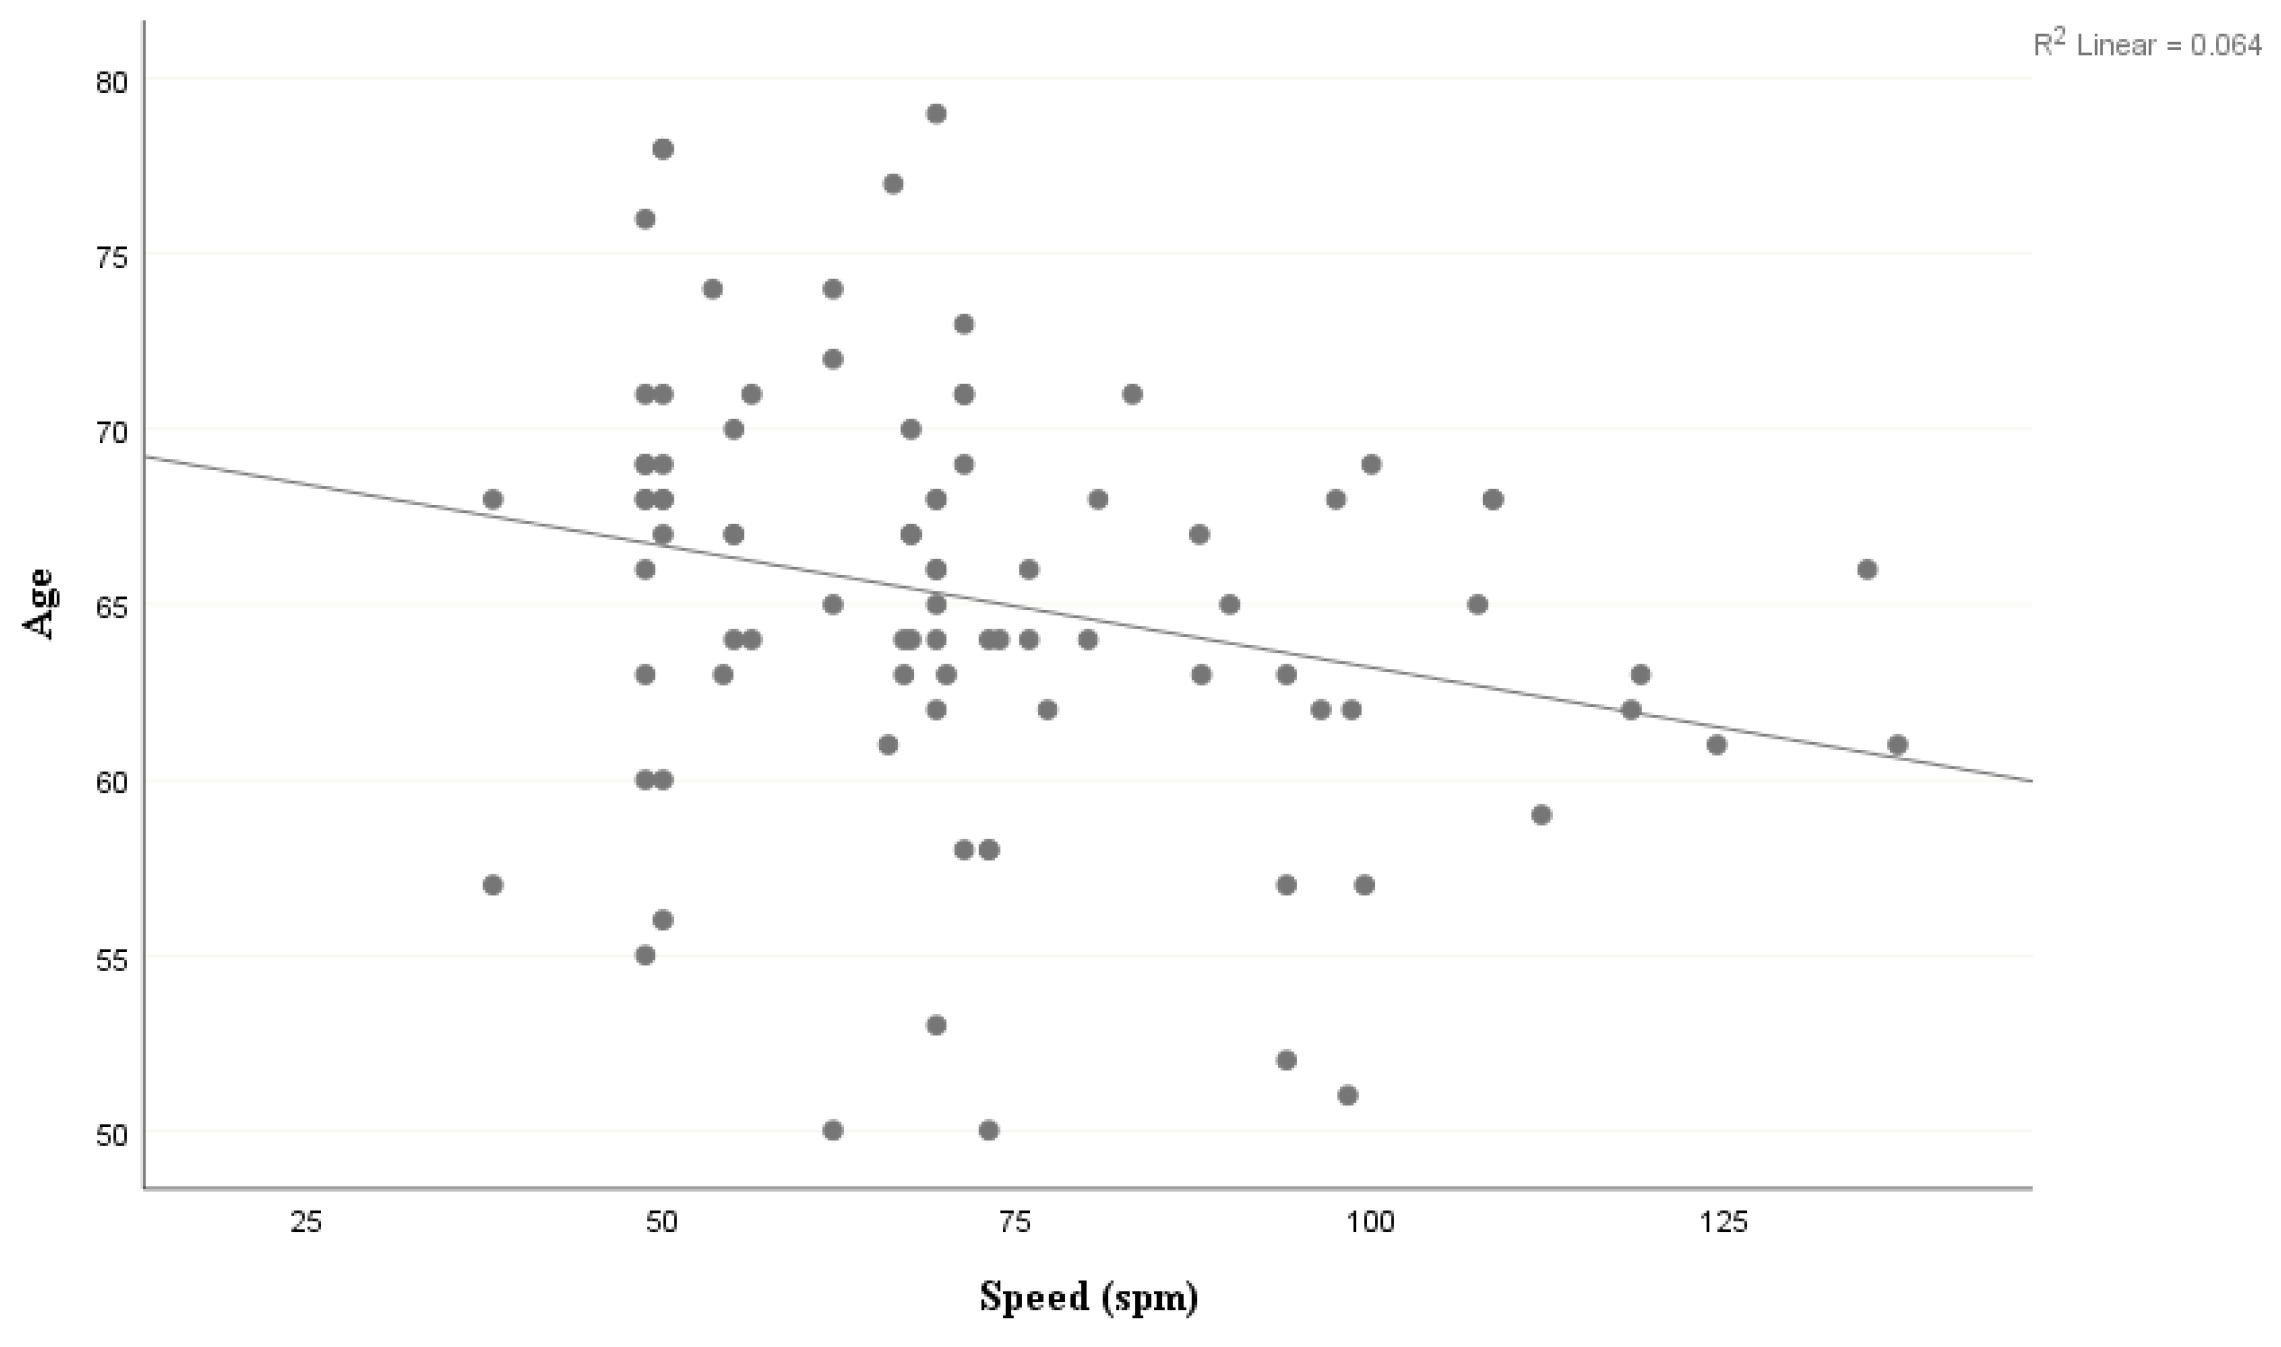
| Older Adults | 65 (6.1) Range 50–79 | 15.1 (4.8) | 41.4 (5.4) | 27.4 (2.2) | 292.8 (48.8) | 3.2 (3.1) | 2.3 (2.5) |
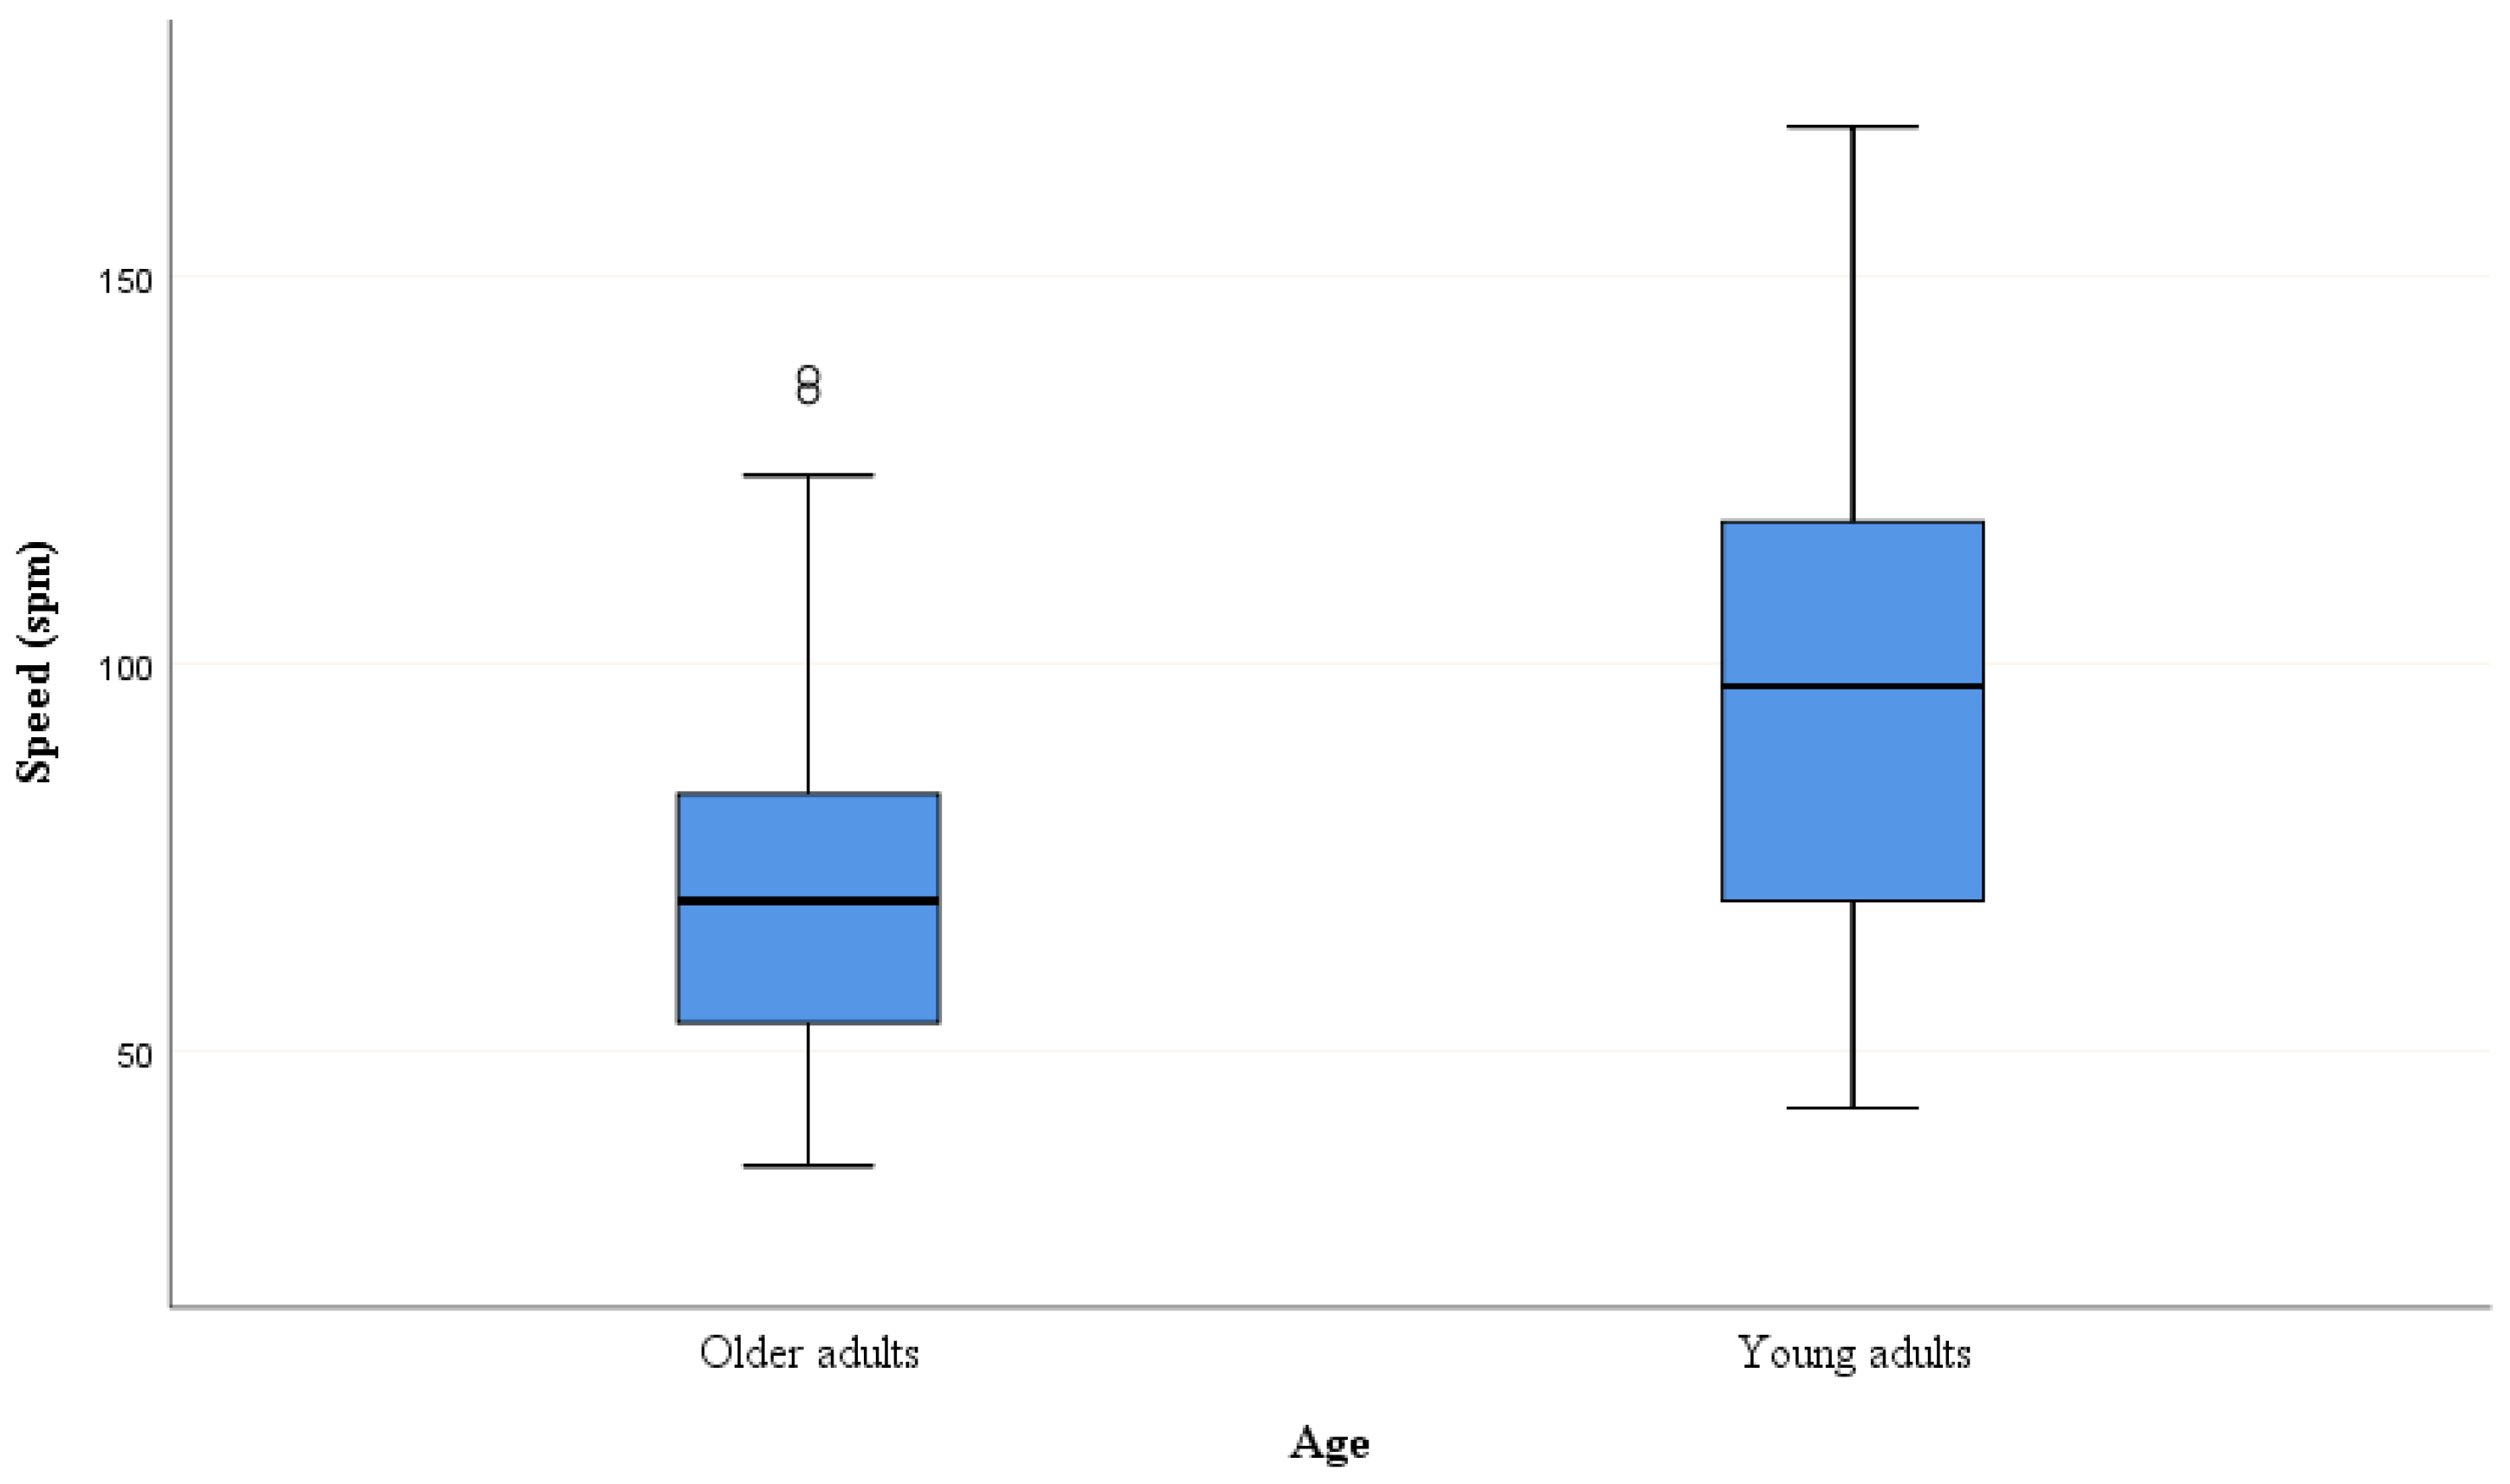
| Mean spm | % Accuracy | |
|---|---|---|
| Young Adults | 94.78 (29.69) | 83.82 (9.15) |
| Older Adults | 71.74 (22.26) | 83.16 (13.63) |
© 2020 by the authors. Licensee MDPI, Basel, Switzerland. This article is an open access article distributed under the terms and conditions of the Creative Commons Attribution (CC BY) license (http://creativecommons.org/licenses/by/4.0/).
Share and Cite
Torrens-Burton, A.; Hanley, C.J.; Wood, R.; Basoudan, N.; Norris, J.E.; Richards, E.; Tales, A. Lacking Pace but Not Precision: Age-Related Information Processing Changes in Response to a Dynamic Attentional Control Task. Brain Sci. 2020, 10, 390. https://0-doi-org.brum.beds.ac.uk/10.3390/brainsci10060390
Torrens-Burton A, Hanley CJ, Wood R, Basoudan N, Norris JE, Richards E, Tales A. Lacking Pace but Not Precision: Age-Related Information Processing Changes in Response to a Dynamic Attentional Control Task. Brain Sciences. 2020; 10(6):390. https://0-doi-org.brum.beds.ac.uk/10.3390/brainsci10060390
Chicago/Turabian StyleTorrens-Burton, Anna, Claire J. Hanley, Rodger Wood, Nasreen Basoudan, Jade Eloise Norris, Emma Richards, and Andrea Tales. 2020. "Lacking Pace but Not Precision: Age-Related Information Processing Changes in Response to a Dynamic Attentional Control Task" Brain Sciences 10, no. 6: 390. https://0-doi-org.brum.beds.ac.uk/10.3390/brainsci10060390