A Novel Connectome-based Electrophysiological Study of Subjective Cognitive Decline Related to Alzheimer’s Disease by Using Resting-state High-density EEG EGI GES 300


 ,
,  , and
, and
Abstract
:
1. Introduction
1.1. Clinical Validity of SCD in AD Continuum
1.2. Brain Connectome in SCD
1.3. Overview of Sections of the Manuscript
1.4. Study Aim
2. Materials and Methods
2.1. Settings and Participants
2.2. Neuropsychological Assessment
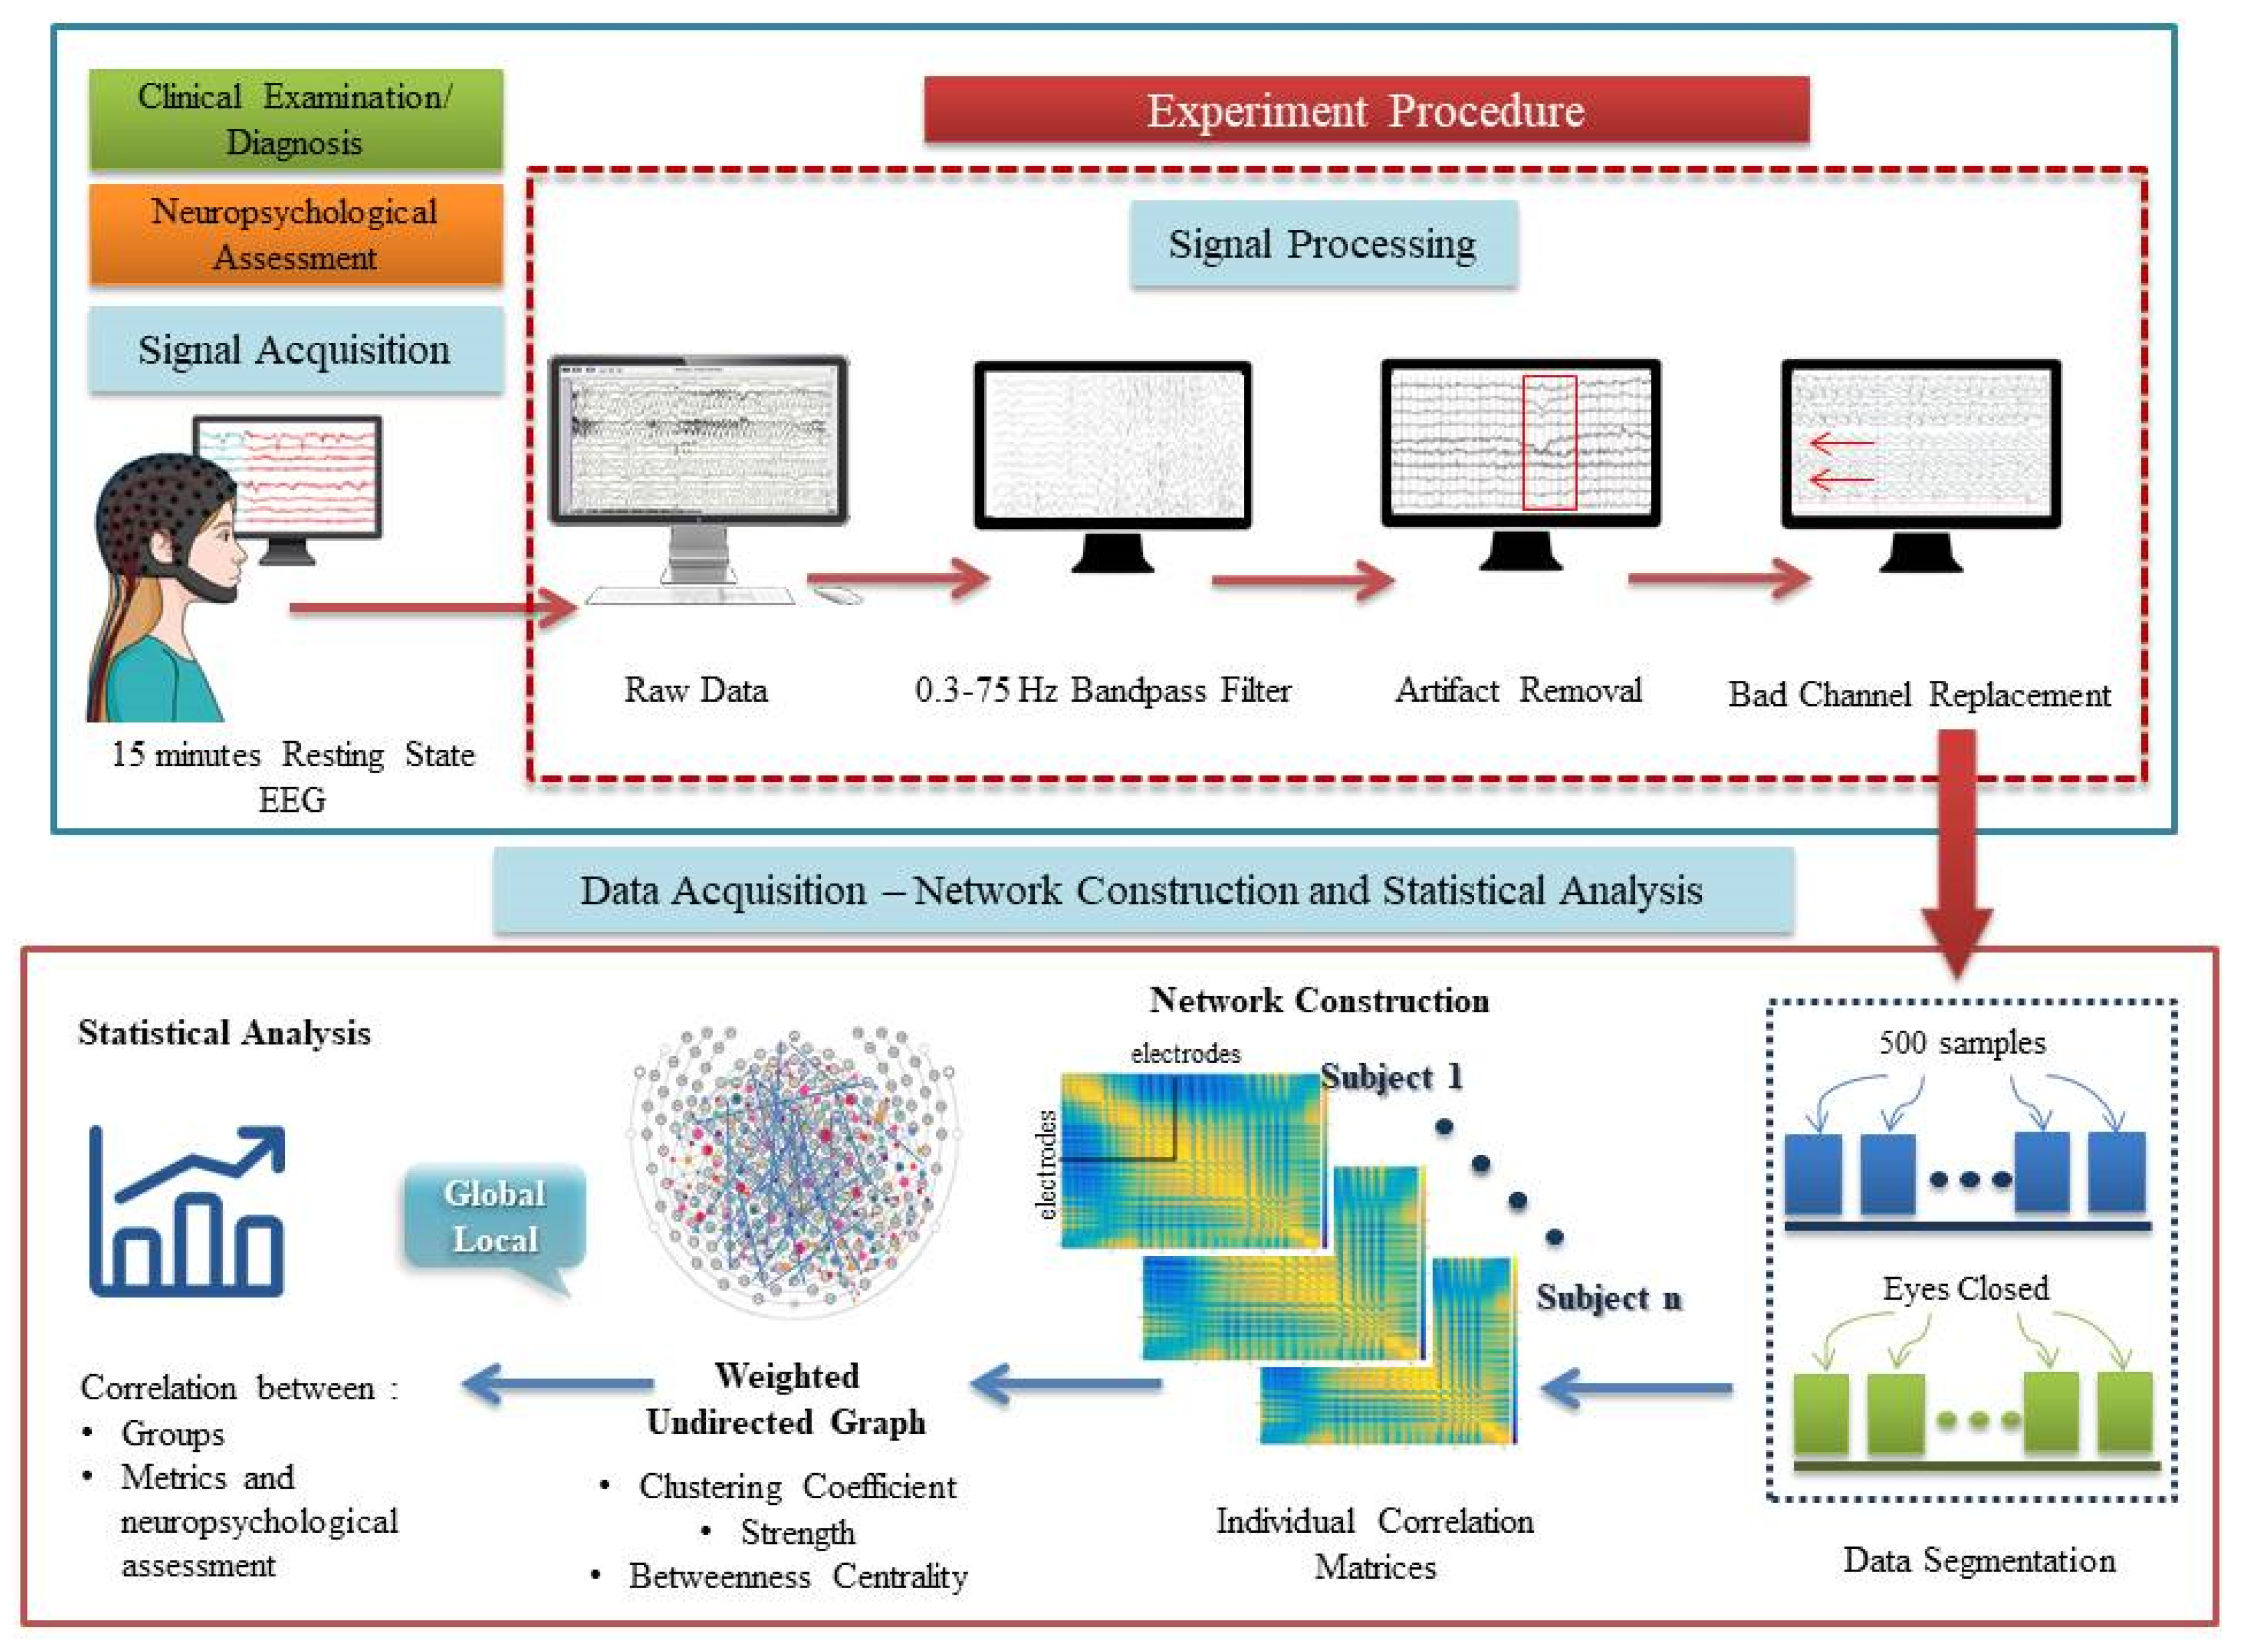
2.3. Resting State EEG Recording
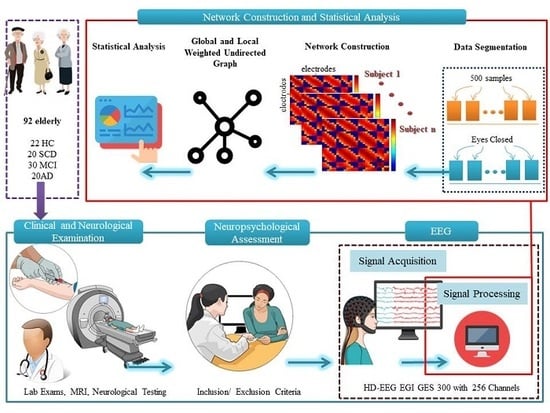
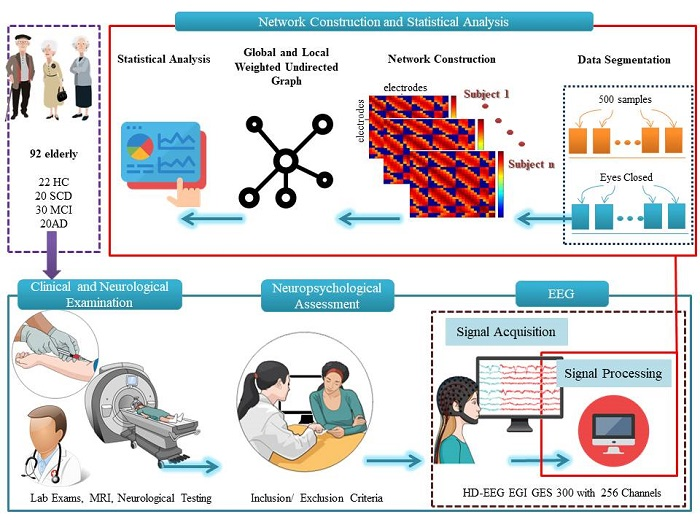
2.4. EEG Data Acquisition and Network Construction
2.5. Connectivity: Pearson Correlation Coefficient (PCC)
2.5.1. Global Brain and Local Parietal Network Analysis
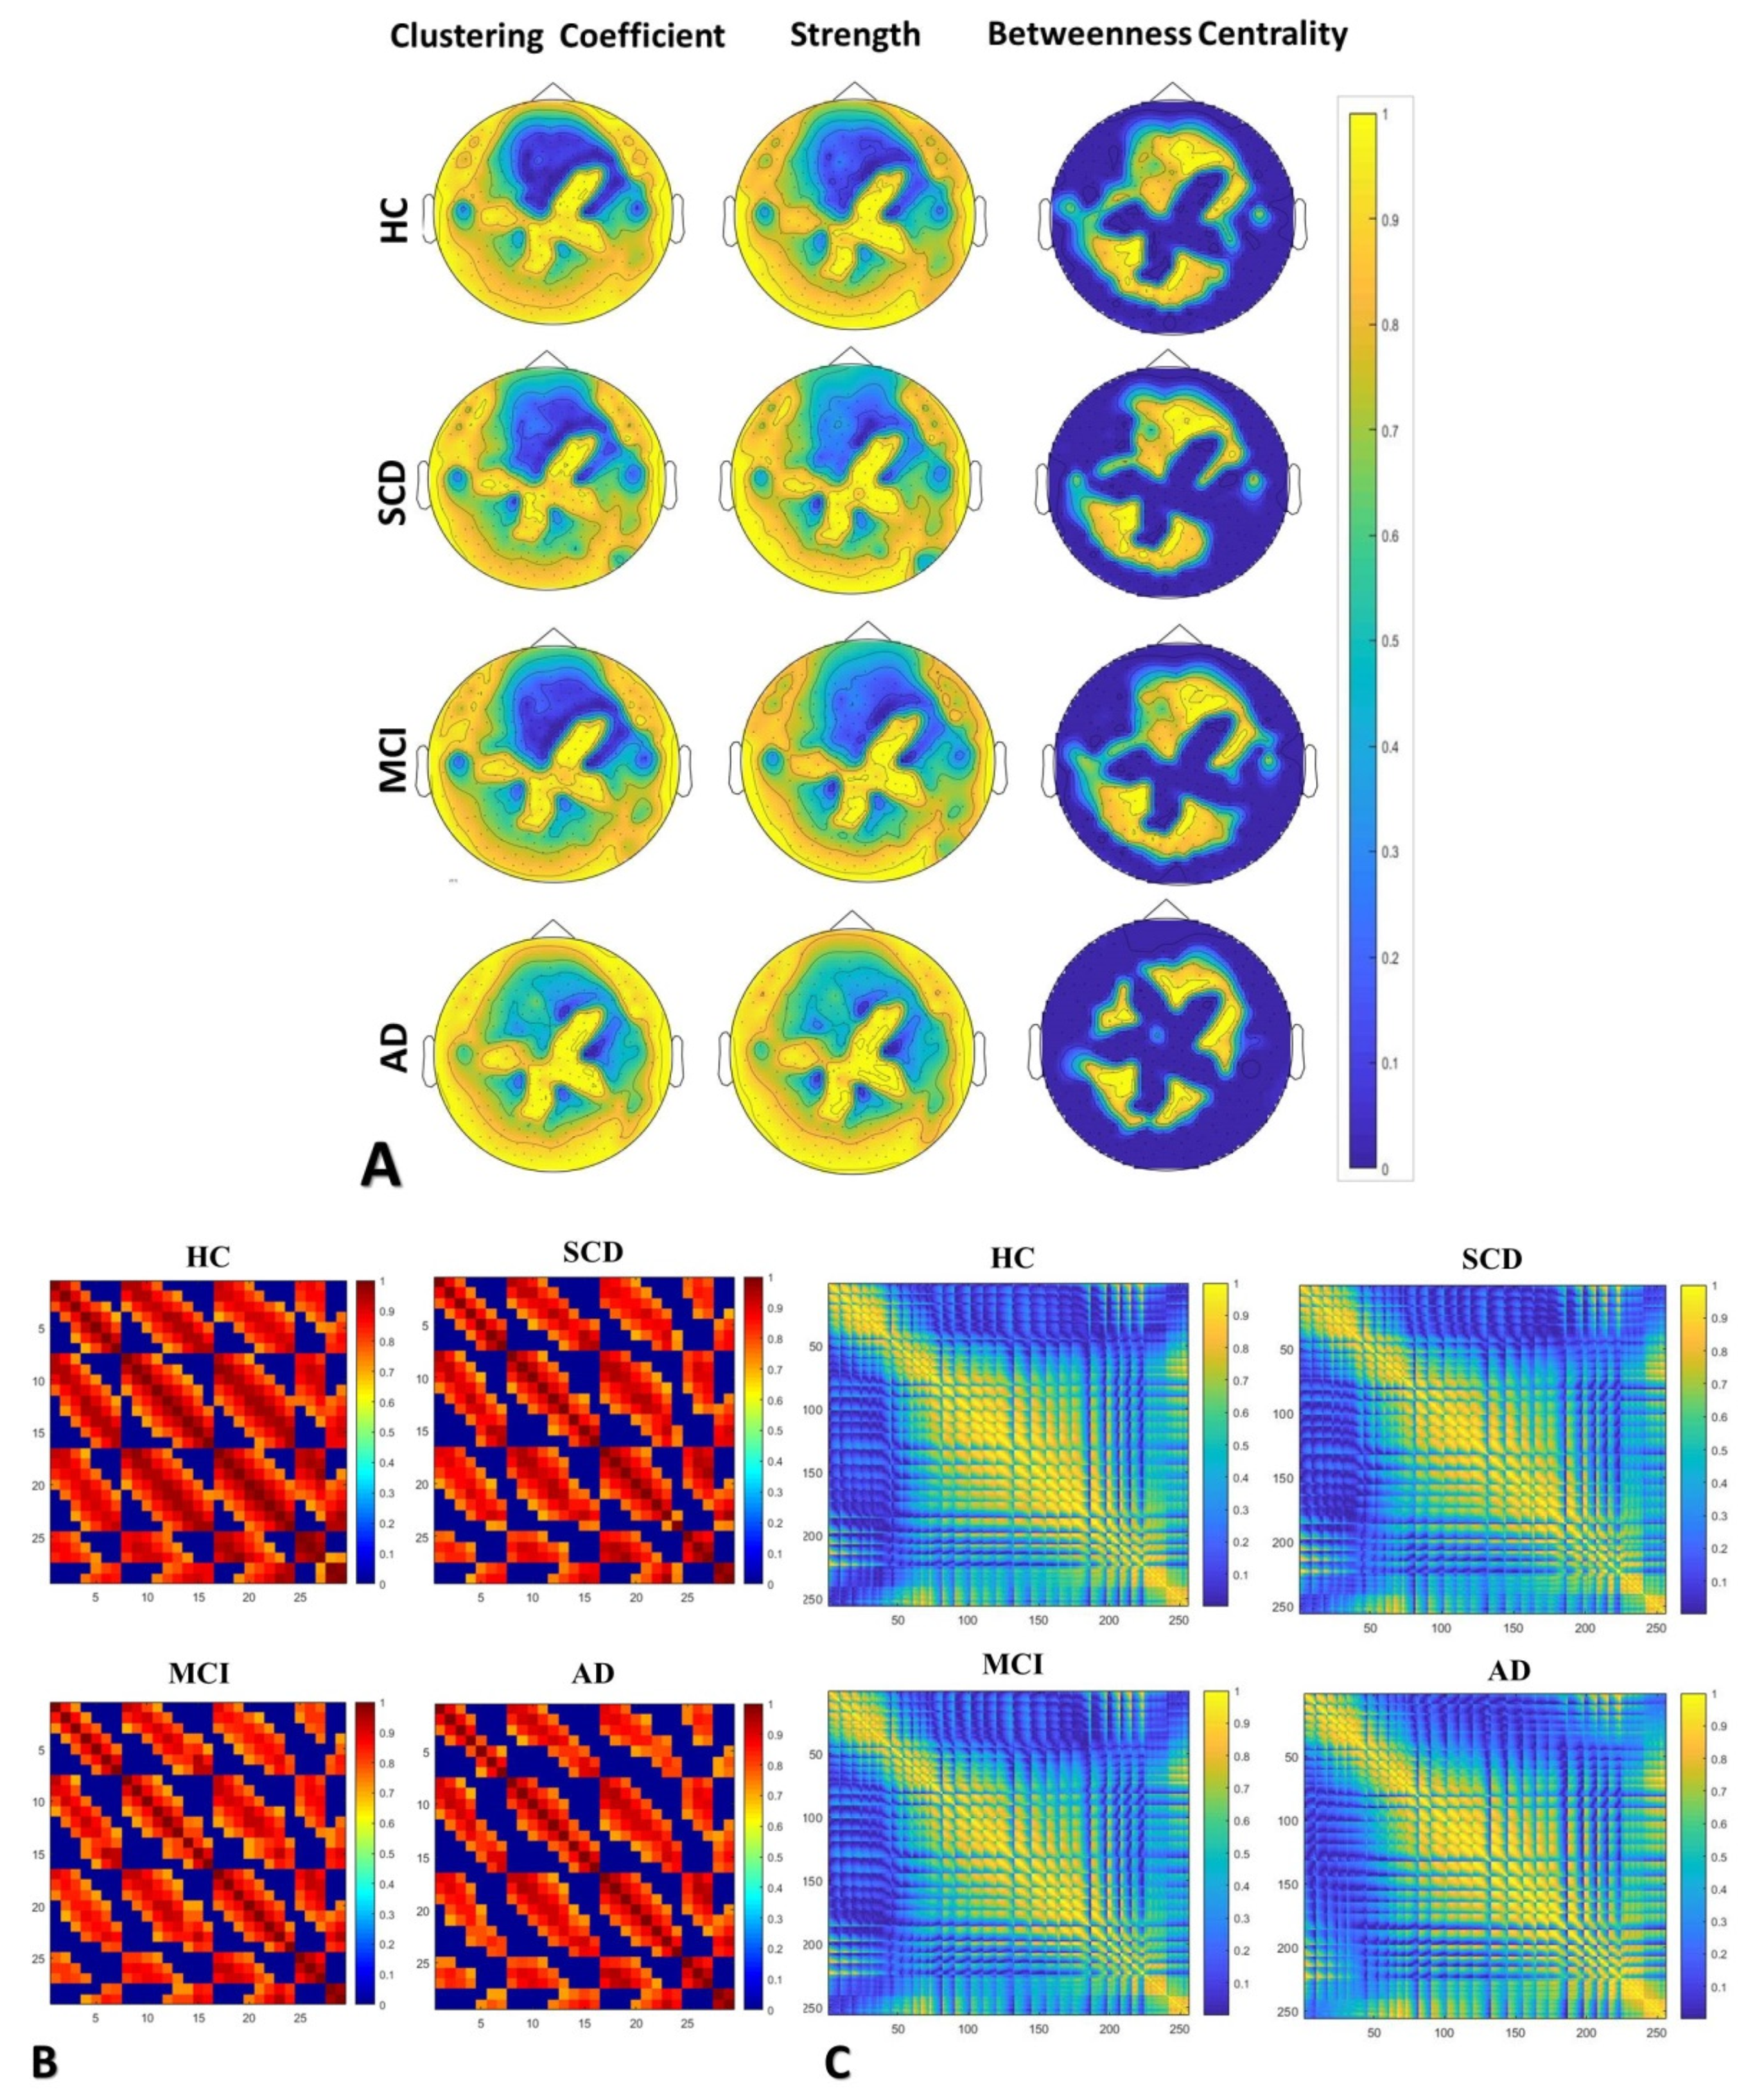
Clustering Coefficient (CC)
Strength (S)
Betweenness Centrality (BC)
2.5.2. Statistical Analysis
3. Results
3.1. Neuropsychological Assessment of HC, SCD, MCI and AD
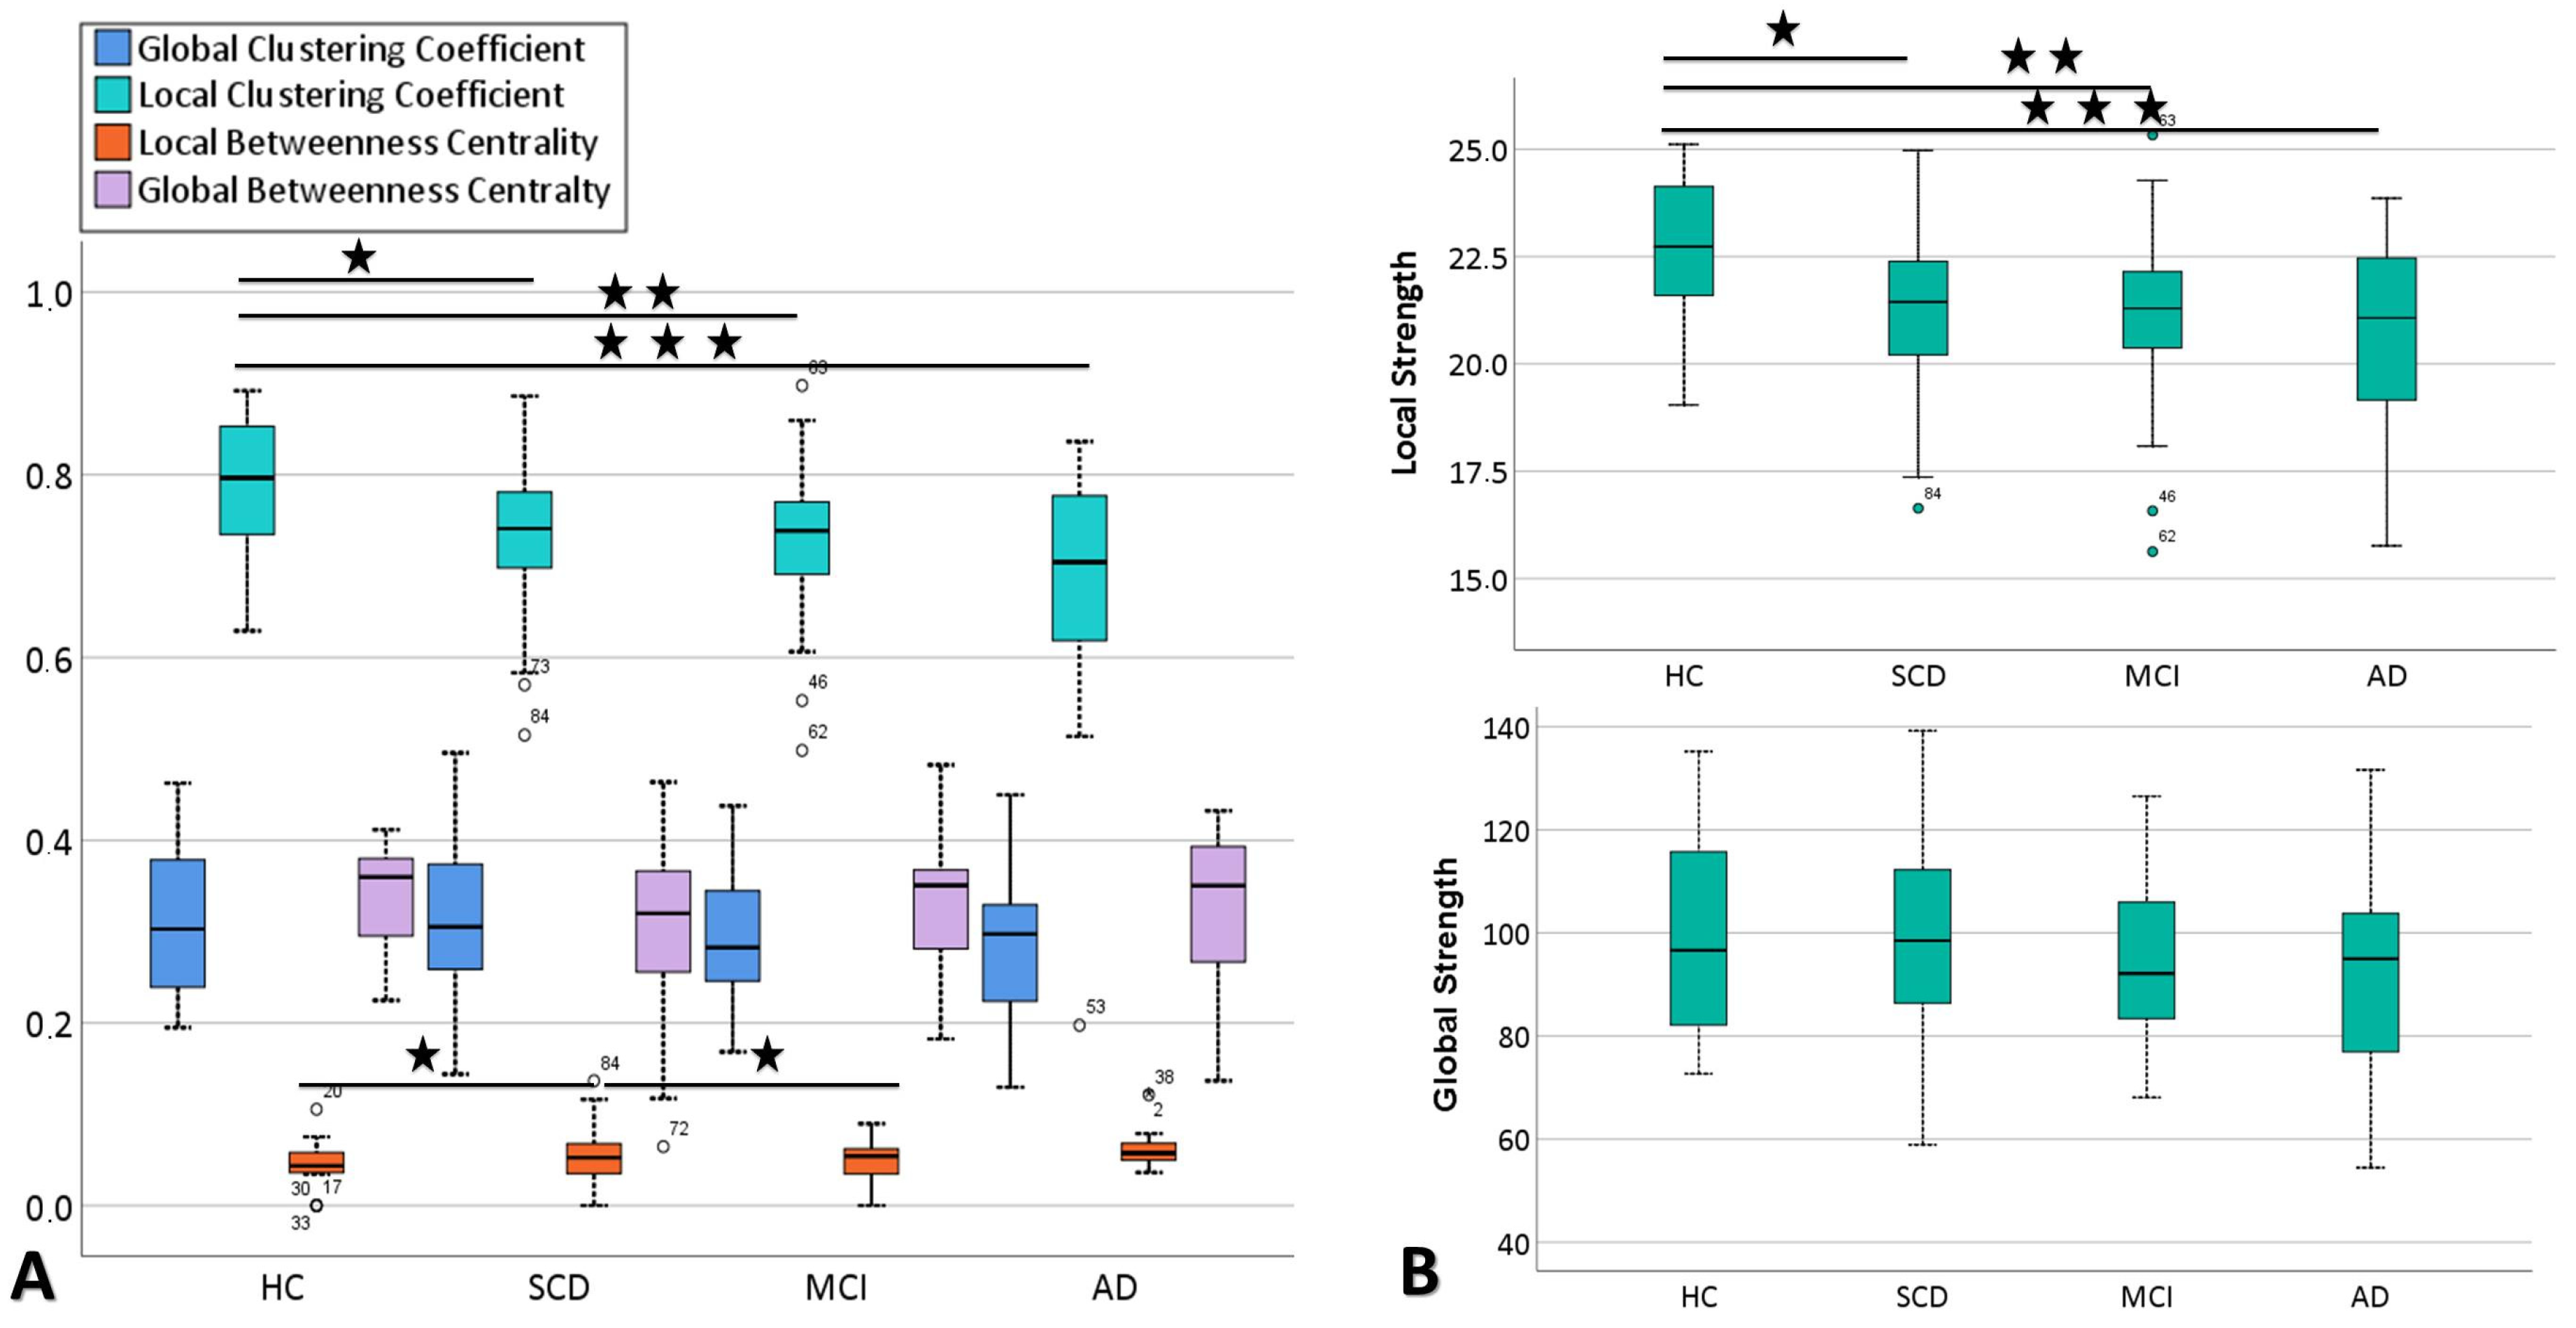
3.2. Comparison of Network Properties between HC, SCD, MCI and AD
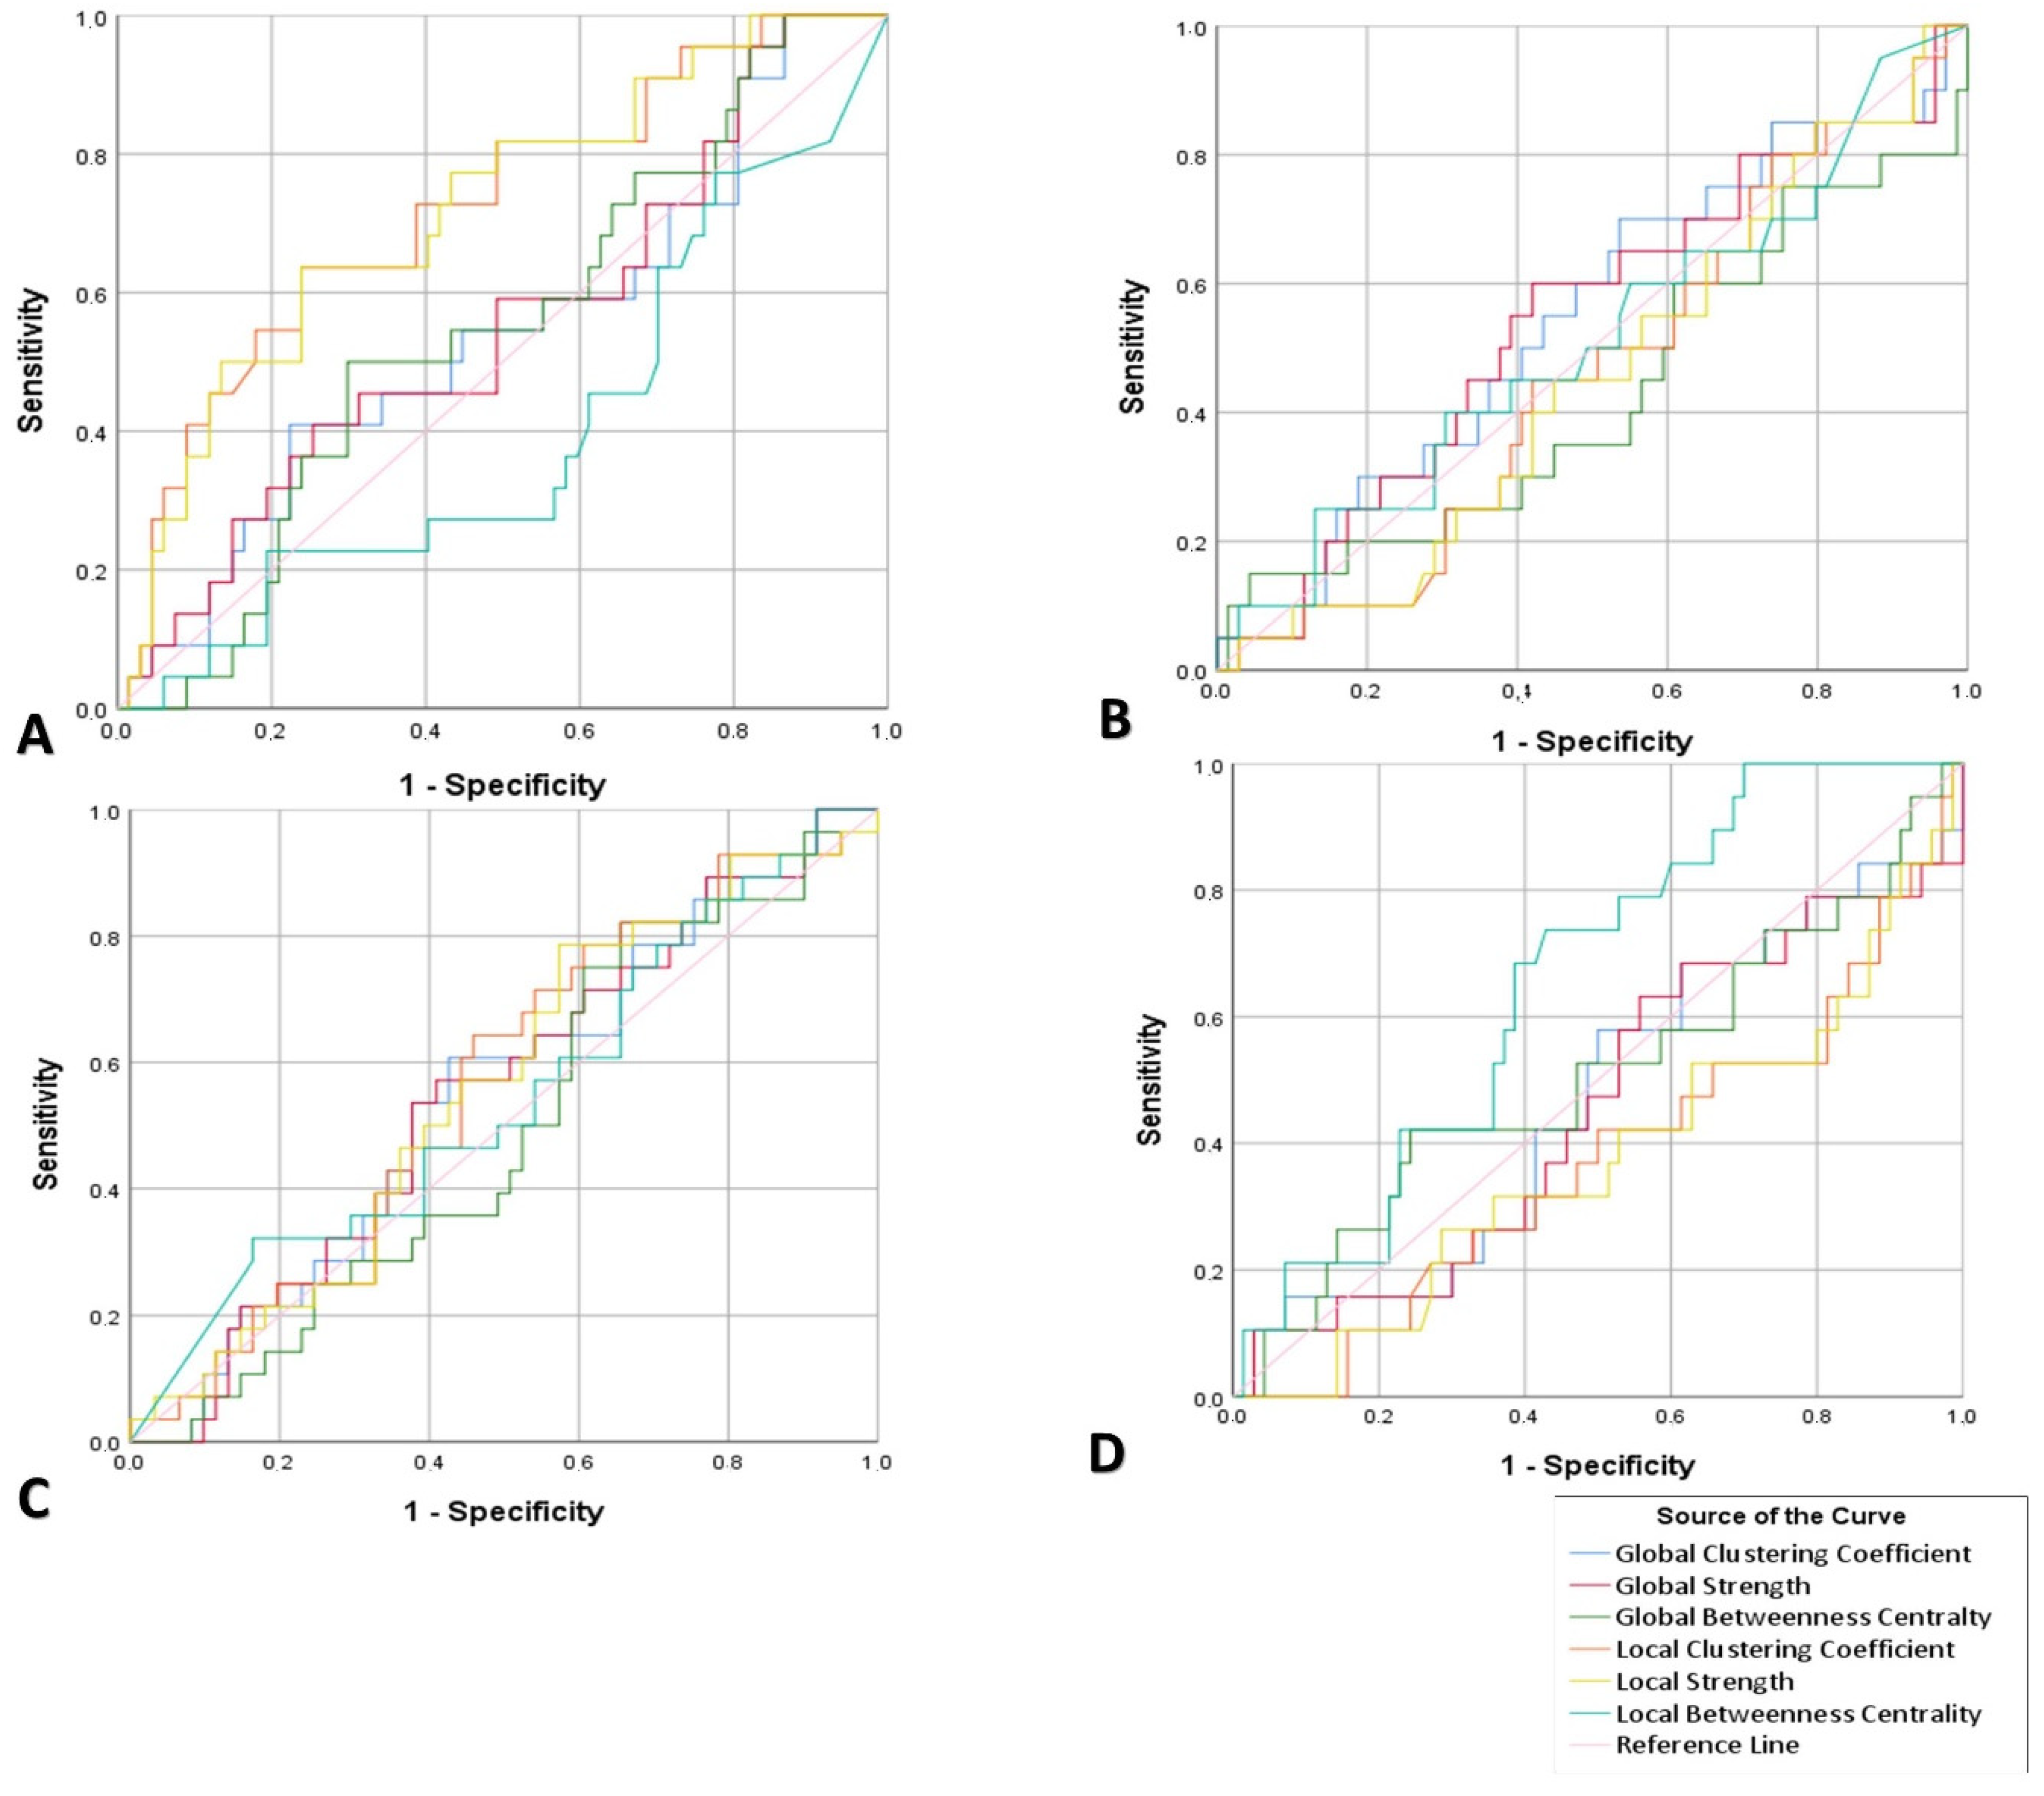
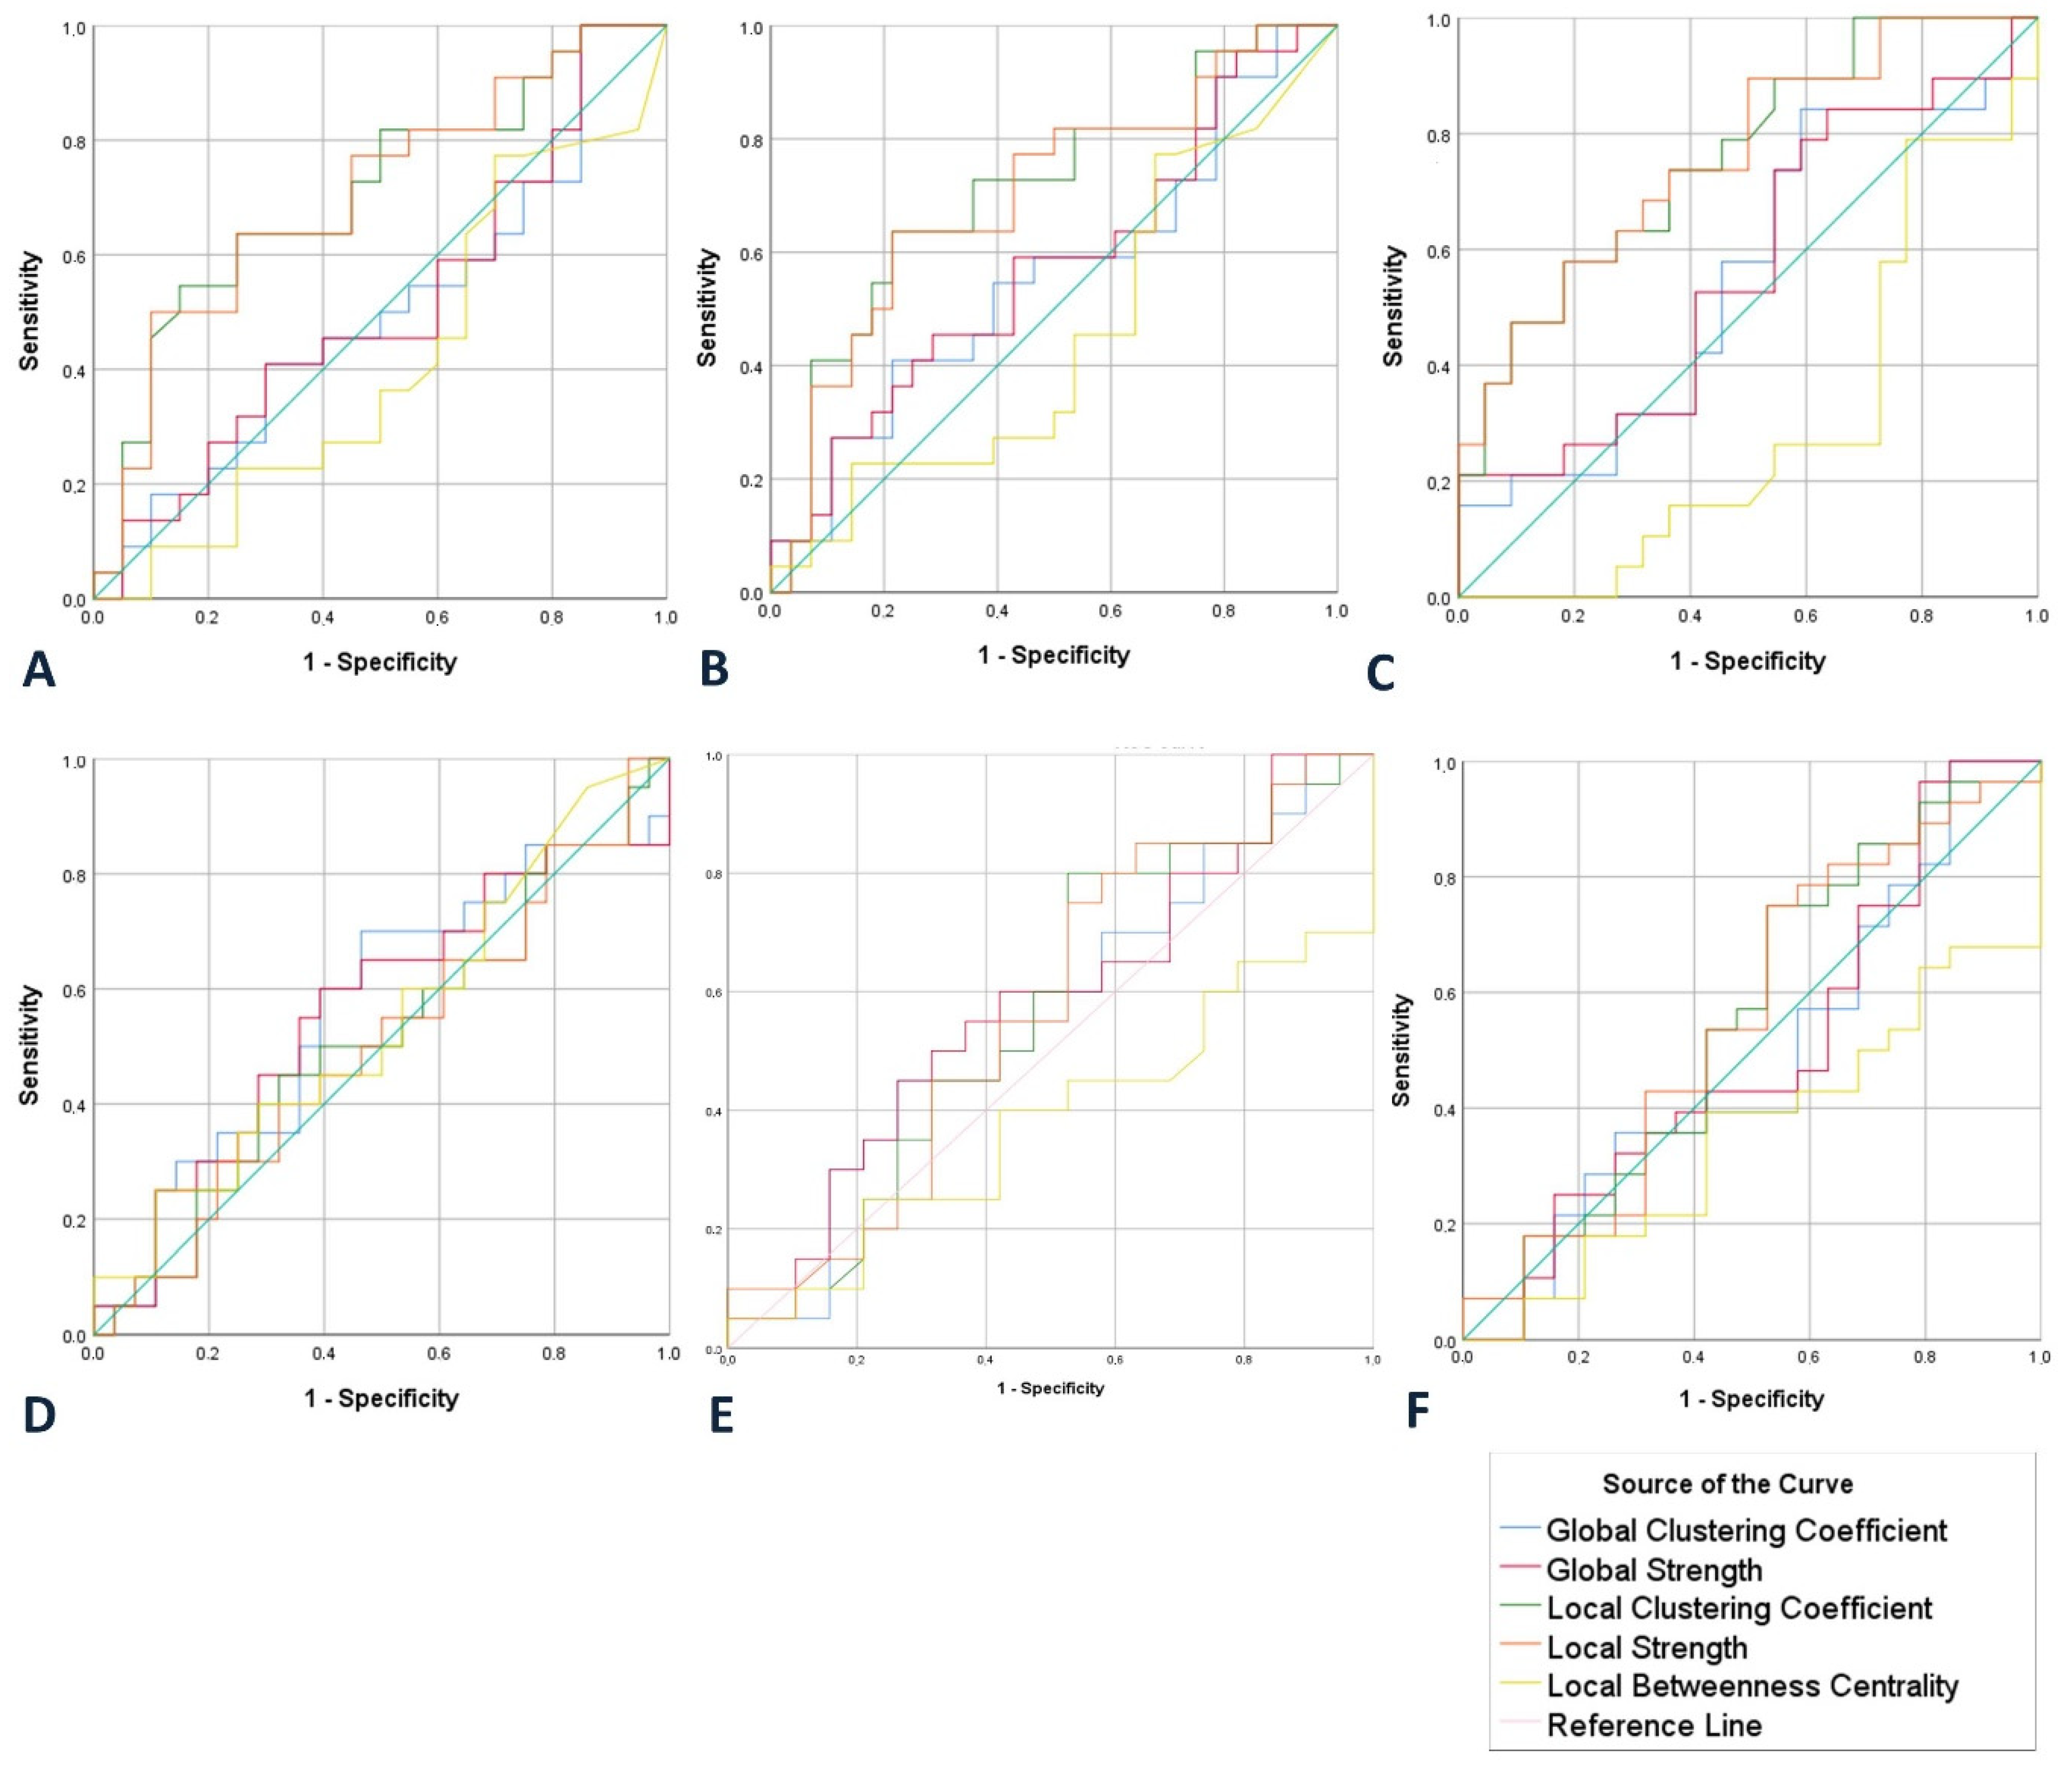
3.3. Sensitivity and Specificity of Network Properties
3.4. Correlation between Neuropsychological Assessment and Network Properties
4. Discussion
5. Limitations
6. Conclusions
Author Contributions
Funding
Acknowledgments
Conflicts of Interest
References
- Jansen, W.J.; Ossenkoppele, R.; Knol, D.L.; Tijms, B.M.; Scheltens, P.; Verhey, F.R.J.; Visser, P.J.; Amyloid Biomarker Study Group; Aalten, P.; Aarsland, D.; et al. Prevalence of cerebral amyloid pathology in persons without dementia: A meta-analysis. JAMA 2015, 313, 1924–1938. [Google Scholar] [CrossRef] [PubMed]
- Bishop, N.A.; Lu, T.; Yankner, B.A. Neural mechanisms of ageing and cognitive decline. Nature 2010, 464, 529–535. [Google Scholar] [CrossRef] [PubMed] [Green Version]
- Heuvel, M.R.V.D.; Pol, H.H. Exploring the brain network: A review on resting-state fMRI functional connectivity. Eur. Neuropsychopharmacol. 2010, 20, 519–534. [Google Scholar] [CrossRef] [PubMed]
- Worbe, Y. Neuroimaging signature of neuropsychiatric disorders. Curr. Opin. Neurol. 2015, 28, 358–364. [Google Scholar] [CrossRef] [PubMed]
- Petersen, R.C.; Smith, G.E.; Waring, S.C.; Ivnik, R.J.; Tangalos, E.G.; Kokmen, E. Mild cognitive impairment: Clinical characterization and outcome. Arch. Neurol. 1999, 56, 303–308. [Google Scholar] [CrossRef]
- Schmand, B.; Jonker, C.; Hooijer, C.; Lindeboom, J. Subjective memory complaints may announce dementia. Neurology 1996, 46, 121–125. [Google Scholar] [CrossRef] [Green Version]
- Mazzon, G.; De Dea, F.; Cattaruzza, T.; Manganotti, P.; Monti, F.; Accardo, A. Memorization Test and Resting State EEG Components in Mild and Subjective Cognitive Impairment. Curr. Alzheimer Res. 2018, 15, 809–819. [Google Scholar] [CrossRef]
- Reisberg, B.; Gauthier, S. Current evidence for subjective cognitive impairment (SCI) as the pre-mild cognitive impairment (MCI) stage of subsequently manifest Alzheimer’s disease. Int. Psychogeriatrics 2008, 20, 1–16. [Google Scholar] [CrossRef]
- Rodda, J.; Dannhauser, T.M.; Cutinha, D.J.; Shergill, S.; Walker, Z. Subjective cognitive impairment: Increased prefrontal cortex activation compared to controls during an encoding task. Int. J. Geriatr. Psychiatry 2009, 24, 865–874. [Google Scholar] [CrossRef]
- Lazarou, I.; Adam, K.; Georgiadis, K.I.; Tsolaki, A.C.; Nikolopoulos, S.; Kompatsiaris, I.; Tsolaki, M. Can a Novel High-Density EEG Approach Disentangle the Differences of Visual Event Related Potential (N170), Elicited by Negative Facial Stimuli, in People with Subjective Cognitive Impairment? J. Alzheimer’s Dis. 2018, 65, 543–575. [Google Scholar] [CrossRef]
- Jessen, F.; Amariglio, R.E.; Van Boxtel, M.; Breteler, M.; Ceccaldi, M.; Chételat, G.; Dubois, B.; Dufouil, C.; Ellis, K.; Van Der Flier, W.M.; et al. A conceptual framework for research on subjective cognitive decline in preclinical Alzheimer’s disease. Alzheimer’s Dement. 2014, 10, 844–852. [Google Scholar] [CrossRef] [PubMed] [Green Version]
- Reisberg, B.; Shulman, M.B.; Torossian, C.; Leng, L.; Zhu, W. Outcome over seven years of healthy adults with and without subjective cognitive impairment. Alzheimer’s Dement. 2010, 6, 11–24. [Google Scholar] [CrossRef] [Green Version]
- Jonker, C.; Geerlings, M.I.; Schmand, B. Are memory complaints predictive for dementia? A review of clinical and population-based studies. Int. J. Geriatr. Psychiatry 2000, 15, 983–991. [Google Scholar] [CrossRef]
- Moreno-Grau, S.; Ruiz, A. Genome research in pre-dementia stages of Alzheimer’s disease. Expert Rev. Mol. Med. 2016, 18, 11. [Google Scholar] [CrossRef]
- Mitchell, A.J.; Beaumont, H.; Ferguson, D.; Yadegarfar, M.; Stubbs, B. Risk of dementia and mild cognitive impairment in older people with subjective memory complaints: Meta-analysis. Acta Psychiatr. Scand. 2014, 130, 439–451. [Google Scholar] [CrossRef] [PubMed]
- Babiloni, C.; Visser, P.J.; Frisoni, G.; De Deyn, P.P.; Bresciani, L.; Jelic, V.; Nagels, G.; Rodriguez, G.; Rossini, P.M.; Vecchio, F.; et al. Cortical sources of resting EEG rhythms in mild cognitive impairment and subjective memory complaint. Neurobiol. Aging 2010, 31, 1787–1798. [Google Scholar] [CrossRef] [PubMed]
- Shu, N.; Wang, X.; Bi, Q.; Zhao, T.; Han, Y. Disrupted Topologic Efficiency of White Matter Structural Connectome in Individuals with Subjective Cognitive Decline. Radiology 2018, 286, 229–238. [Google Scholar] [CrossRef] [PubMed] [Green Version]
- Jessen, F.; Feyen, L.; Freymann, K.; Tepest, R.; Maier, W.; Heun, R.; Schild, H.-H.; Scheef, L. Volume reduction of the entorhinal cortex in subjective memory impairment. Neurobiol. Aging 2006, 27, 1751–1756. [Google Scholar] [CrossRef]
- Hayes, J.M.; Tang, L.; Viviano, R.P.; Van Rooden, S.; Ofen, N.; Damoiseaux, J.S. Subjective memory complaints are associated with brain activation supporting successful memory encoding. Neurobiol. Aging 2017, 60, 71–80. [Google Scholar] [CrossRef]
- Van Rooden, S.; Buijs, M.; Van Vliet, M.E.; Versluis, M.J.; Webb, A.G.; Oleksik, A.M.; Van De Wiel, L.; Middelkoop, H.A.M.; Blauw, G.J.; Weverling-Rynsburger, A.W.E.; et al. Cortical phase changes measured using 7-T MRI in subjects with subjective cognitive impairment, and their association with cognitive function. NMR Biomed. 2014, 29, 1289–1294. [Google Scholar] [CrossRef]
- Hays, C.C.; Zlatar, Z.Z.; Campbell, L.; Meloy, M.J.; Wierenga, C.E. Subjective Cognitive Decline Modifies the Relationship Between Cerebral Blood Flow and Memory Function in Cognitively Normal Older Adults HHS Public Access Mesh terms (6). J. Int. Neuropsychol. Soc. 2018, 24, 213–223. [Google Scholar] [CrossRef] [PubMed] [Green Version]
- Elfgren, C.; Gustafson, L.; Vestberg, S.; Risberg, J.; Rosén, I.; Ryding, E.; Passant, U. Subjective experience of memory deficits related to clinical and neuroimaging findings. Dement. Geriatr. Cogn. Disord. 2003, 16, 84–92. [Google Scholar] [CrossRef] [PubMed]
- Rodda, J.; Dannhauser, T.; Cutinha, D.; Shergill, S.; Walker, Z. Subjective cognitive impairment: Functional MRI during a divided attention task. Eur. Psychiatry 2011, 26, 457–462. [Google Scholar] [CrossRef]
- Van Der Flier, W.M.; Buchem, M.; Weverling-Rijnsburger, A.; Mutsaers, E.; Bollen, E.; Admiraal-Behloul, F.; Westendorp, R.; Middelkoop, H. Memory complaints in patients with normal cognition are associated with smaller hippocampal volumes. J. Neurol. 2004, 251, 671–675. [Google Scholar] [CrossRef] [PubMed]
- López-Sanz, D.; Garcés, P.; Álvarez, B.; Delgado-Losada, M.L.; López-Sanz, D.; Maestú, F. Network Disruption in the Preclinical Stages of Alzheimer’s Disease: From Subjective Cognitive Decline to Mild Cognitive Impairment. Int. J. Neural Syst. 2017, 27, 1750041. [Google Scholar] [CrossRef]
- Hafkemeijer, A.; Altmann-Schneider, I.; Oleksik, A.M.; Van De Wiel, L.; Middelkoop, H.A.; Van Buchem, M.A.; Van Der Grond, J.; Rombouts, S.A. Increased Functional Connectivity and Brain Atrophy in Elderly with Subjective Memory Complaints. Brain Connect. 2013, 3, 353–362. [Google Scholar] [CrossRef]
- Bajo, R.; Castellanos, N.P.; López, M.E.; Ruiz, J.M.; Montejo, P.; Montenegro, M.; Llanero, M.; Gil, P.; Yubero, R.; Baykova, E.; et al. Early dysfunction of functional connectivity in healthy elderly with subjective memory complaints. AGE 2011, 34, 497–506. [Google Scholar] [CrossRef] [Green Version]
- Wang, Y.; Risacher, S.L.; West, J.D.; McDonald, B.C.; Magee, T.R.; Farlow, M.R.; Gao, S.; O’Neill, D.P.; Saykin, A.J. Altered Default Mode Network Connectivity in Older Adults with Cognitive Complaints and Amnestic Mild Cognitive Impairment. J. Alzheimer’s Dis. 2013, 35, 751–760. [Google Scholar] [CrossRef] [Green Version]
- Yan, T.; Wang, W.; Yang, L.; Chen, K.; Chen, R.; Han, Y. Rich club disturbances of the human connectome from subjective cognitive decline to Alzheimer’s disease. Theranostics 2018, 8, 3237–3255. [Google Scholar] [CrossRef]
- Contreras, J.A.; Goñi, J.; Risacher, S.L.; Amico, E.; Yoder, K.; Dzemidzic, M.; West, J.D.; McDonald, B.C.; Farlow, M.R.; Sporns, O.; et al. Cognitive complaints in older adults at risk for Alzheimer’s disease are associated with altered resting-state networks. Alzheimer’s Dement. Diagnosis Assess. Dis. Monit. 2017, 6, 40–49. [Google Scholar] [CrossRef]
- Verfaillie, S.C.; Slot, R.E.R.; Dicks, E.; Prins, N.D.; Overbeek, J.; Teunissen, C.E.; Scheltens, P.; Barkhof, F.; Van Der Flier, W.M.; Tijms, B.M. A more randomly organized grey matter network is associated with deteriorating language and global cognition in individuals with subjective cognitive decline. Hum. Brain Mapp. 2018, 39, 3143–3151. [Google Scholar] [CrossRef] [PubMed]
- Verfaillie, S.C.; Binette, A.P.; Vachon-Presseau, É.; Tabrizi, S.; Savard, M.; Bellec, P.; Ossenkoppele, R.; Scheltens, P.; Van Der Flier, W.M.; Breitner, J.C.; et al. Subjective Cognitive Decline Is Associated With Altered Default Mode Network Connectivity in Individuals With a Family History of Alzheimer’s Disease. Biol. Psychiatry Cogn. Neurosci. Neuroimag. 2018, 3, 463–472. [Google Scholar] [CrossRef] [PubMed]
- Broyd, S.J.; Demanuele, C.; Debener, S.; Helps, S.K.; James, C.J.; Sonuga-Barke, E.J. Default-mode brain dysfunction in mental disorders: A systematic review. Neurosci. Biobehav. Rev. 2009, 33, 279–296. [Google Scholar] [CrossRef] [PubMed]
- Georgiadis, K.I.; Laskaris, N.; Nikolopoulos, S.; Kompatsiaris, I. Exploiting the heightened phase synchrony in patients with neuromuscular disease for the establishment of efficient motor imagery BCIs. J. Neuroeng. Rehabilitation 2018, 15, 90. [Google Scholar] [CrossRef]
- Xu, P.; Xiong, X.C.; Xue, Q.; Tian, Y.; Peng, Y.; Zhang, R.; Li, P.Y.; Wang, Y.P.; Yao, D.Z. Recognizing mild cognitive impairment based on network connectivity analysis of resting EEG with zero reference. Physiol. Meas. 2014, 35, 1279–1298. [Google Scholar] [CrossRef]
- Zheng, W.; Yao, Z.; Xie, Y.; Fan, J.; Hu, B. Identification of Alzheimer’s Disease and Mild Cognitive Impairment Using Networks Constructed Based on Multiple Morphological Brain Features. Biol. Psychiatry Cogn. Neurosci. Neuroimag. 2018, 3, 887–897. [Google Scholar] [CrossRef]
- López-Sanz, D.; Bruña, R.; Garcés, P.; Martin-Buro, M.C.; Walter, S.; Delgado, M.L.; Montenegro, M.; López-Sanz, D.; Marcos, A.; Maestú, F. Functional Connectivity Disruption in Subjective Cognitive Decline and Mild Cognitive Impairment: A Common Pattern of Alterations. Front. Aging Neurosci. 2017, 9, 1051. [Google Scholar] [CrossRef]
- Wang, X.-N.; Zeng, Y.; Chen, G.-Q.; Zhang, Y.-H.; Li, X.-Y.; Hao, X.-Y.; Yu, Y.; Zhang, M.; Sheng, C.; Li, Y.-X.; et al. Abnormal organization of white matter networks in patients with subjective cognitive decline and mild cognitive impairment. Oncotarget 2016, 7, 48953–48962. [Google Scholar] [CrossRef] [Green Version]
- Hu, X.; Harzem, J.; Huang, B.; Weber, B.; Jessen, F. Abnormal Functional Connectivity Within Default Mode Network in Persons With Subjective Cognitive Decline: Self-Reflection of Own Memory Deficits? Alzheimer’s Dement. 2016, 12, P39. [Google Scholar] [CrossRef]
- Jeon, Y.; Kim, B.; Kim, J.E.; Kim, B.R.; Ban, S.; Jeong, J.H.; Kwon, O.; Rhie, S.J.; Ahn, C.-W.; Kim, J.-H.; et al. Effects of Ganglioside on Working Memory and the Default Mode Network in Individuals with Subjective Cognitive Impairment: A Randomized Controlled Trial. Am. J. Chin. Med. 2016, 44, 489–514. [Google Scholar] [CrossRef]
- Franzmeier, N.; Duzel, E.; Jessen, F.; Buerger, K.; Levin, J.; Duering, M.; Dichgans, M.; Haass, C.; Suarez-Calvet, M.; Fagan, A.M.; et al. Left frontal hub connectivity delays cognitive impairment in autosomal-dominant and sporadic Alzheimer’s disease. Brain 2018, 141, 1186–1200. [Google Scholar] [CrossRef] [PubMed] [Green Version]
- Dillen, K.; Jacobs, H.I.L.; Kukolja, J.; Richter, N.; Von Reutern, B.; Onur, Ö.A.; Langen, K.-J.; Fink, G.R. Functional Disintegration of the Default Mode Network in Prodromal Alzheimer’s Disease. J. Alzheimer’s Dis. 2017, 59, 169–187. [Google Scholar] [CrossRef] [PubMed]
- López-Sanz, D.; Bruña, R.; Garcés, P.; Camara, C.; Serrano, N.; Rodríguez-Rojo, I.C.; Delgado, M.L.; Montenegro, M.; López-Higes, R.; Yus, M.; et al. Alpha band disruption in the AD-continuum starts in the Subjective Cognitive Decline stage: A MEG study. Sci. Rep. 2016, 6, 37685. [Google Scholar] [CrossRef] [PubMed]
- Li, K.; for the Alzheimer’s Disease Neuroimaging Initiative; Luo, X.; Zeng, Q.; Jiaerken, Y.; Xu, X.; Huang, P.; Shen, Z.; Xu, J.; Wang, C.; et al. Aberrant functional connectivity network in subjective memory complaint individuals relates to pathological biomarkers. Transl. Neurodegener. 2018, 7, 27. [Google Scholar] [CrossRef] [Green Version]
- Li, X.-Y.; Tang, Z.-C.; Sun, Y.; Tian, J.; Liu, Z.; Han, Y. White matter degeneration in subjective cognitive decline: A diffusion tensor imaging study. Oncotarget 2016, 7, 54405–54414. [Google Scholar] [CrossRef] [Green Version]
- Córdova-Palomera, A.; Kaufmann, T.; Persson, K.; Alnæs, D.; Doan, N.T.; Moberget, T.; Lund, M.J.; Barca, M.L.; Engvig, A.; Brækhus, A.; et al. Disrupted global metastability and static and dynamic brain connectivity across individuals in the Alzheimer’s disease continuum. Sci. Rep. 2017, 7, 40268. [Google Scholar] [CrossRef] [Green Version]
- Selnes, P.; Fjell, A.M.; Gjerstad, L.; Bjørnerud, A.; Wallin, A.; Due-Tønnessen, P.; Grambaite, R.; Stenset, V.; Fladby, T. White matter imaging changes in subjective and mild cognitive impairment. Alzheimer’s Dement. 2012, 8, S112–S121. [Google Scholar] [CrossRef]
- Badhwar, A.; Tam, A.; Dansereau, C.; Orban, P.; Hoffstaedter, F.; Bellec, P. Resting-state network dysfunction in Alzheimer’s disease: A systematic review and meta-analysis. Alzheimer’s Dement. Diagn. Assess. Dis. Monit. 2017, 8, 73–85. [Google Scholar] [CrossRef]
- Dickerson, B.C.; Sperling, R.A. Large-scale functional brain network abnormalities in alzheimer’s disease: Insights from functional neuroimaging. Behav. Neurol. 2009, 21, 63–75. [Google Scholar] [CrossRef]
- Rodda, J.; Okello, A.; Edison, P.; Dannhauser, T.; Brooks, D.J.; Walker, Z. 11C-PIB PET in subjective cognitive impairment. Eur. Psychiatry 2010, 25, 123–125. [Google Scholar] [CrossRef]
- Wang, K.; Liang, M.; Wang, L.; Tian, L.; Zhang, X.; Li, K.; Jiang, T. Altered functional connectivity in early Alzheimer’s disease: A resting-state fMRI study. Hum. Brain Mapp. 2007, 28, 967–978. [Google Scholar] [CrossRef] [PubMed]
- Mevel, K.; Chételat, G.; Eustache, F.; Desgranges, B. The Default Mode Network in Healthy Aging and Alzheimer’s Disease. Int. J. Alzheimer’s Dis. 2011, 2011, 1–9. [Google Scholar] [CrossRef] [PubMed] [Green Version]
- Li, Y.; Yao, Z.; Zhang, H.; Hu, B.; Initiative, F.T.A.D.N. Indirect relation based individual metabolic network for identification of mild cognitive impairment. J. Neurosci. Methods 2018, 309, 188–198. [Google Scholar] [CrossRef] [PubMed] [Green Version]
- Daianu, M.; Dennis, E.L.; Jahanshad, N.; Nir, T.M.; Toga, A.W.; Jack, C.R.; Weiner, M.W.; Thompson, P. Alzheimer’s disease disrupts rich club organization in brain connectivity networks. In Proceedings of the 2013 IEEE 10th International Symposium on Biomedical Imaging, San Francisco, CA, USA, 7–11 April 2013; pp. 266–269. [Google Scholar]
- Daianu, M.; Jahanshad, N.; Villalon-Reina, J.E.; Mendez, M.F.; Bartzokis, G.; Jimenez, E.E.; Joshi, A.; Barsuglia, J.P.; Thompson, P. Rich club network analysis shows distinct patterns of disruption in frontotemporal dementia and Alzheimer’s disease. Math. Vis. 2014, 2014, 13–22. [Google Scholar]
- Cai, S.-M.; Chen, W.; Liu, D.-B.; Tang, M.; Chen, X. Complex network analysis of brain functional connectivity under a multi-step cognitive task. Phys. A Stat. Mech. Its Appl. 2017, 466, 663–671. [Google Scholar] [CrossRef] [Green Version]
- Zhang, H.-Y.; Wang, S.-J.; Xing, J.; Liu, B.; Ma, Z.-L.; Yang, M.; Zhang, Z.-J.; Teng, G.-J. Detection of PCC functional connectivity characteristics in resting-state fMRI in mild Alzheimer’s disease. Behav. Brain Res. 2009, 197, 103–108. [Google Scholar] [CrossRef]
- Wang, L.; Zang, Y.; He, Y.; Liang, M.; Zhang, X.; Tian, L.; Wu, T.; Jiang, T.; Li, K. Changes in hippocampal connectivity in the early stages of Alzheimer’s disease: Evidence from resting state fMRI. NeuroImage 2006, 31, 496–504. [Google Scholar] [CrossRef]
- Zanchi, D.; Montandon, M.-L.; Sinanaj, I.; Rodriguez, C.; Depoorter, A.; Herrmann, F.; Borgwardt, S.; Giannakopoulos, P.; Haller, S. Decreased Fronto-Parietal and Increased Default Mode Network Activation is Associated with Subtle Cognitive Deficits in Elderly Controls. Neurosignals 2017, 25, 127–138. [Google Scholar] [CrossRef] [Green Version]
- Machulda, M.M.; Senjem, M.; Weigand, S.D.; Smith, G.; Ivnik, R.J.; Boeve, B.F.; Knopman, D.S.; Petersen, R.C.; Jack, C.R. Functional magnetic resonance imaging changes in amnestic and nonamnestic mild cognitive impairment during encoding and recognition tasks. J. Int. Neuropsychol. Soc. 2009, 15, 372–382. [Google Scholar] [CrossRef] [Green Version]
- Schwindt, G.C.; Black, S.E. Functional imaging studies of episodic memory in Alzheimer’s disease: A quantitative meta-analysis. NeuroImage 2009, 45, 181–190. [Google Scholar] [CrossRef]
- Hämäläinen, A.; Pihlajamäki, M.; Tanila, H.; Hänninen, T.; Niskanen, E.; Tervo, S.; Karjalainen, P.; Vanninen, R.L.; Soininen, H. Increased fMRI responses during encoding in mild cognitive impairment. Neurobiol. Aging 2007, 28, 1889–1903. [Google Scholar] [CrossRef] [PubMed]
- Lazarou, I.; Nikolopoulos, S.; Dimitriadis, S.I.; Kompatsiaris, I.; Spilioti, M.; Tsolaki, M. Is brain connectome research the future frontier for subjective cognitive decline? A systematic review. Clin. Neurophysiol. 2019, 130, 1762–1780. [Google Scholar] [CrossRef] [PubMed]
- Jones, D.T.; Knopman, D.S.; Gunter, J.L.; Graff-Radford, J.; Vemuri, P.; Boeve, B.F.; Petersen, R.C.; Weiner, M.W.; Jack, C.R.; Initiative, A.D.N. Cascading network failure across the Alzheimer’s disease spectrum. Brain 2015, 139, 547–562. [Google Scholar] [CrossRef] [PubMed]
- Brodbeck, V.; Spinelli, L.; Lascano, A.M.; Wissmeier, M.; Vargas, M.I.; Vulliemoz, S.; Pollo, C.; Schaller, K.; Michel, C.M.; Seeck, M. Electroencephalographic source imaging: A prospective study of 152 operated epileptic patients. Brain 2011, 134, 2887–2897. [Google Scholar] [CrossRef] [PubMed]
- Odabaee, M.; Freeman, W.J.; Colditz, P.B.; Ramon, C.; Vanhatalo, S. Spatial patterning of the neonatal EEG suggests a need for a high number of electrodes. NeuroImage 2013, 68, 229–235. [Google Scholar] [CrossRef] [PubMed] [Green Version]
- Petrov, Y.; Nador, J.; Hughes, C.; Tran, S.; Yavuzcetin, O.; Sridhar, S. Ultra-dense EEG sampling results in two-fold increase of functional brain information. NeuroImage 2014, 90, 140–145. [Google Scholar] [CrossRef] [PubMed]
- Freeman, W.J.; Holmes, M.D.; Burke, B.C.; Vanhatalo, S. Spatial spectra of scalp EEG and EMG from awake humans. Clin. Neurophysiol. 2003, 114, 1053–1068. [Google Scholar] [CrossRef] [Green Version]
- Stam, C.J. Use of magnetoencephalography (MEG) to study functional brain networks in neurodegenerative disorders. J. Neurol. Sci. 2010, 289, 128–134. [Google Scholar] [CrossRef]
- Boersma, M.; Smit, D.J.; De Bie, H.M.; Van Baal, G.C.M.; Boomsma, R.I.; De Geus, E.J.; De Waal, H.A.D.-V.; Stam, C.J. Network analysis of resting state EEG in the developing young brain: Structure comes with maturation. Hum. Brain Mapp. 2011, 32, 413–425. [Google Scholar] [CrossRef]
- Koenig, T.; Prichep, L.; Dierks, T.; Hubl, D.; Wahlund, L.; John, E.; Jelic, V. Decreased EEG synchronization in Alzheimer’s disease and mild cognitive impairment. Neurobiol. Aging 2005, 26, 165–171. [Google Scholar] [CrossRef] [Green Version]
- He, Y.; Chen, Z.; Gong, G.; Evans, A.C. Neuronal Networks in Alzheimer’s Disease. Neuroscientist 2009, 15, 333–350. [Google Scholar] [CrossRef]
- Beason-Held, L.L. Dementia and the default mode. Curr. Alzheimer Res. 2011, 8, 361–365. [Google Scholar] [CrossRef] [PubMed]
- Ahmadlou, M.; Adeli, A.; Bajo, R.; Adeli, H. Complexity of functional connectivity networks in mild cognitive impairment subjects during a working memory task. Clin. Neurophysiol. 2014, 125, 694–702. [Google Scholar] [CrossRef] [PubMed] [Green Version]
- McBride, J.; Zhao, X.; Munro, N.; Smith, C.; Jicha, G.; Jiang, Y. Resting EEG Discrimination of Early Stage Alzheimer’ s Disease from Normal Aging Using Inter-Channel Coherence Network Graphs. Ann. Biomed. Eng. 2013, 41, 1233–1242. [Google Scholar] [CrossRef] [PubMed] [Green Version]
- Trambaiolli, L.R.; Falk, T.H.; Fraga, F.; Anghinah, R.; Lorena, A.C. EEG spectro-temporal modulation energy: A new feature for automated diagnosis of Alzheimer’s disease. In Proceedings of the 2011 Annual International Conference of the IEEE Engineering in Medicine and Biology Society, Boston, MA, USA, 30 August–3 September 2011; pp. 3828–3831. [Google Scholar] [CrossRef] [Green Version]
- Vecchio, F.; Miraglia, F.; Marra, C.; Quaranta, D.; Vita, M.G.; Bramanti, P.; Rossini, P.M. Human Brain Networks in Cognitive Decline: A Graph Theoretical Analysis of Cortical Connectivity from EEG Data. J. Alzheimer’s Dis. 2014, 41, 113–127. [Google Scholar] [CrossRef]
- Lazarou, I.; Karakostas, A.; Stavropoulos, T.G.; Tsompanidis, T.; Meditskos, G.; Kompatsiaris, I.; Tsolaki, M. A Novel and Intelligent Home Monitoring System for Care Support of Elders with Cognitive Impairment. J. Alzheimer’s Dis. 2016, 54, 1561–1591. [Google Scholar] [CrossRef]
- Koedam, E.L.G.E.; Lauffer, V.; Van Der Vlies, A.E.; Van Der Flier, W.M.; Scheltens, P.; Pijnenburg, Y.A. Early-Versus Late-Onset Alzheimer’s Disease: More than Age Alone. J. Alzheimer’s Dis. 2010, 19, 1401–1408. [Google Scholar] [CrossRef] [Green Version]
- Noble, J.M.; Scarmeas, N. Cognitive Impairment among individuals with mild cognitive impairment. Improv. Oral Health Elderly. Interdiscip. Approach 2008, 20, 99–126. [Google Scholar]
- Pierce, A.L.; Bullain, S.S.; Kawas, C.H. Late-Onset Alzheimer Disease. Neurol. Clin. 2017, 35, 283–293. [Google Scholar] [CrossRef] [Green Version]
- McKhann, G.; Drachman, D.; Folstein, M.; Katzman, R.; Price, D.; Stadlan, E.M. Clinical diagnosis of Alzheimer’s disease: Report of the NINCDS-ADRDA Work Group under the auspices of Department of Health and Human Services Task Force on Alzheimer’s Disease. Neurology 1984, 34, 939–944. [Google Scholar] [CrossRef] [PubMed] [Green Version]
- Petersen, R.C. Mild cognitive impairment. Lancet 2006, 367, 1979. [Google Scholar] [CrossRef] [Green Version]
- Dubois, B.; Feldman, H.H.; Jacova, C.; Hampel, H.; Molinuevo, J.L.; Blennow, K.; DeKosky, S.T.; Gauthier, S.; Selkoe, D.; Bateman, R.J.; et al. Advancing research diagnostic criteria for Alzheimer’s disease: The IWG-2 criteria. Lancet Neurol. 2014, 13, 614–629. [Google Scholar] [CrossRef]
- McKhann, G.M.; Knopman, D.S.; Chertkow, H.; Hyman, B.T.; Jack, C.R.; Kawas, C.H.; Klunk, W.; Koroshetz, W.J.; Manly, J.J.; Mayeux, R.; et al. The diagnosis of dementia due to Alzheimer’s disease: Recommendations from the National Institute on Aging-Alzheimer’s Association workgroups on diagnostic guidelines for Alzheimer’s disease. Alzheimer’s Dement. 2011, 7, 263–269. [Google Scholar] [CrossRef] [Green Version]
- Molinuevo, J.L.; Rabin, L.A.; Amariglio, R.; Buckley, R.; Dubois, B.; Ellis, K.; Ewers, M.; Hampel, H.; Klöppel, S.; Rami, L.; et al. Implementation of subjective cognitive decline criteria in research studies. Alzheimer’s Dement. 2016, 13, 296–311. [Google Scholar] [CrossRef] [Green Version]
- Glodzik, L.; Reisberg, B.; De Santi, S.; Babb, J.S.; Pirraglia, E.; Rich, K.E.; Brys, M.; De Leon, M. Subjective Memory Complaints: Presence, Severity and Future Outcome in Normal Older Subjects. Dement. Geriatr. Cogn. Disord. 2007, 24, 177–184. [Google Scholar] [CrossRef]
- Chasson, G.S.; Williams, M.T.; Davis, D.M.; Combs, J.Y. Missed diagnoses in African Americans with obsessive-compulsive disorder: The structured clinical interview for DSM-IV Axis I disorders (SCID-I). BMC Psychiatry 2017, 17, 258. [Google Scholar] [CrossRef] [Green Version]
- Reisberg, B.; Ferris, S.H.; De Leon, M.; Crook, T. The Global Deterioration Scale for assessment of primary degenerative dementia. Am. J. Psychiatry 1982, 139, 1136–1139. [Google Scholar] [CrossRef] [Green Version]
- Reisberg, B.; Ferris, S.H. Brief Cognitive Rating Scale (BCRS). Psychopharmacol. Bull. 1988, 24, 629–636. [Google Scholar]
- Folstein, M.F.; Folstein, S.E.; McHugh, P.R. “Mini-mental state”. A practical method for grading the cognitive state of patients for the clinician. J. Psychiatr. Res. 1975, 12, 189–198. [Google Scholar] [CrossRef]
- Osterrieth, P.A. Le test de copie d’une figure complexe; contribution à l’étude de la perception et de la mémoire. [Test of copying a complex figure; contribution to the study of perception and memory]. Arch. Psychol. 1944, 30, 206–356. [Google Scholar]
- Wilson, B.; Cockburn, J.; Baddeley, A.; Hiorns, R. The development and validation of a test battery for detecting and monitoring everyday memory problems. J. Clin. Exp. Neuropsychol. 1989, 11, 855–870. [Google Scholar] [CrossRef] [PubMed]
- Borkowski, J.G.; Benton, A.L.; Spreen, O. Word fluency and brain damage. Neuropsychologia 1967, 5, 135–140. [Google Scholar] [CrossRef]
- Tombaugh, T.N. Trail Making Test A and B: Normative data stratified by age and education. Arch. Clin. Neuropsychol. 2004, 19, 203–214. [Google Scholar] [CrossRef]
- Kounti, F.; Tsolaki, M.; Kiosseoglou, G. Functional cognitive assessment scale (FUCAS): A new scale to assess executive cognitive function in daily life activities in patients with dementia and mild cognitive impairment. Hum. Psychopharmacol. Clin. Exp. 2006, 21, 305–311. [Google Scholar] [CrossRef] [PubMed]
- Cummings, J.L.; Mega, M.; Gray, K.; Rosenberg-Thompson, S.; Carusi, D.A.; Gornbein, J. The Neuropsychiatric Inventory: Comprehensive assessment of psychopathology in dementia. Neurology 1994, 44, 2308. [Google Scholar] [CrossRef] [PubMed] [Green Version]
- Cohen, S.; Kamarck, T.; Mermelstein, R.; Mermelstein, T.K. A Global Measure of Perceived Stress. J. Health Soc. Behav. 1983, 24, 385. [Google Scholar] [CrossRef]
- Ferree, T.C.; Luu, P.; Russell, G.S.; Tucker, D.M. Scalp electrode impedance, infection risk, and EEG data quality. Clin. Neurophysiol. 2001, 112, 536–544. [Google Scholar] [CrossRef]
- Bressler, S.L.; Menon, V. Large-scale brain networks in cognition: Emerging methods and principles. Trends Cogn. Sci. 2010, 14, 277–290. [Google Scholar] [CrossRef]
- Dimitriadis, S.I.; López, M.E.; Bruña, R.; Cuesta, P.; Marcos, A.; Maestú, F.; Pereda, E. How to Build a Functional Connectomic Biomarker for Mild Cognitive Impairment From Source Reconstructed MEG Resting-State Activity: The Combination of ROI Representation and Connectivity Estimator Matters. Front. Mol. Neurosci. 2018, 12, 1–21. [Google Scholar] [CrossRef]
- Neuner, I.; Arrubla, J.; Werner, C.J.; Hitz, K.; Boers, F.; Kawohl, W.; Shah, N.J. The Default Mode Network and EEG Regional Spectral Power: A Simultaneous fMRI-EEG Study. PLoS ONE 2014, 9, e88214. [Google Scholar] [CrossRef] [PubMed] [Green Version]
- Electrical Geodesics Inc. Geodesic Sensor Net Technical Manual; Electrical Geodesics Inc.: Eugene, OR, USA, 2007. [Google Scholar]
- Rubinov, M.; Sporns, O. Complex network measures of brain connectivity: Uses and interpretations. NeuroImage 2010, 52, 1059–1069. [Google Scholar] [CrossRef] [PubMed]
- Tsolaki, M.; Kakoudaki, T.; Verykouki, E.; Pattakou, V. Prevalence of Mild Cognitive Impairment in Individuals Aged over 65 in a Rural Area in North Greece. Adv. Alzheimer’s Dis. 2014, 3, 11–19. [Google Scholar] [CrossRef] [Green Version]
- Azad, N.; Al Bugami, M.; Loy-English, I. Gender differences in dementia risk factors. Gend. Med. 2007, 4, 120–129. [Google Scholar] [CrossRef]
- Prince, M.; Wimo, A.; Guerchet, M.; Gemma-Claire, A.; Wu, Y.-T.; Prina, M. World Alzheimer Report 2015: The Global Impact of Dementia–An analysis of prevalence, incidence, cost and trends. Alzheimer’s Dis. Int. 2015, 84. [Google Scholar]
- Cid-Fernández, S.; Lindín, M.; Díaz, F. Neurocognitive and Behavioral Indexes for Identifying the Amnestic Subtypes of Mild Cognitive Impairment. J. Alzheimer’s Dis. 2017, 60, 633–649. [Google Scholar] [CrossRef] [Green Version]
- Agosta, F.; Pievani, M.; Geroldi, C.; Copetti, M.; Frisoni, G.; Filippi, M. Resting state fMRI in Alzheimer’s disease: Beyond the default mode network. Neurobiol. Aging 2012, 33, 1564–1578. [Google Scholar] [CrossRef]
- Rombouts, S.A.; Barkhof, F.; Goekoop, R.; Stam, C.J.; Scheltens, P. Altered resting state networks in mild cognitive impairment and mild Alzheimer’s disease: An fMRI study. Hum. Brain Mapp. 2005, 26, 231–239. [Google Scholar] [CrossRef]
- Guo, C.C.; Gorno-Tempini, M.L.; Gesierich, B.; Henry, M.; Trujillo, A.; Shany-Ur, T.; Jovicich, J.; Robinson, S.; Kramer, J.H.; Rankin, K.P.; et al. Anterior temporal lobe degeneration produces widespread network-driven dysfunction. Brain 2013, 136, 2979–2991. [Google Scholar] [CrossRef] [Green Version]
- Jacobs, H.I.L.; Gronenschild, E.; Evers, E.; Ramakers, I.H.G.B.; Hofman, P.A.; Backes, W.H.; Jolles, J.; Verhey, F.R.J.; Van Boxtel, M.P. Visuospatial processing in early Alzheimer’s disease: A multimodal neuroimaging study. Cortex 2015, 64, 394–406. [Google Scholar] [CrossRef]
- Greene, S.J.; Killiany, R.; Initiative, T.A.D.N. Subregions of the inferior parietal lobule are affected in the progression to Alzheimer’s disease. Neurobiol. Aging 2010, 31, 1304–1311. [Google Scholar] [CrossRef] [PubMed] [Green Version]
- Jacobs, H.I.L.; Van Boxtel, M.P.; Jolles, J.; Verhey, F.R.J.; Uylings, H.B.M. Parietal cortex matters in Alzheimer’s disease: An overview of structural, functional and metabolic findings. Neurosci. Biobehav. Rev. 2012, 36, 297–309. [Google Scholar] [CrossRef] [PubMed]
- Villain, N.; Desgranges, B.; Viader, F.; De La Sayette, V.; Mézenge, F.; Landeau, B.; Baron, J.C.; Eustache, F.; Chételat, G. Relationships between hippocampal atrophy, white matter disruption, and gray matter hypometabolism in Alzheimer’s disease. J. Neurosci. 2008, 28, 6174–6181. [Google Scholar] [CrossRef] [PubMed]
- Buckner, R.L.; Snyder, A.Z.; Shannon, B.J.; LaRossa, G.; Sachs, R.; Fotenos, A.F.; Sheline, Y.I.; Klunk, W.; Mathis, C.A.; Morris, J.C.; et al. Molecular, Structural, and Functional Characterization of Alzheimer’s Disease: Evidence for a Relationship between Default Activity, Amyloid, and Memory. J. Neurosci. 2005, 25, 7709–7717. [Google Scholar] [CrossRef] [Green Version]
- Jagust, W.J.; Eberling, J.L.; Wu, C.C.; Finkbeiner, A.; Mungas, D.; Valk, P.E.; Haan, M.N. Brain function and cognition in a community sample of elderly Latinos. Neurology 2002, 59, 378–383. [Google Scholar] [CrossRef]
- Seo, E.H.; Lee, D.Y.; Lee, J.-M.; Park, J.-S.; Sohn, B.K.; Choe, Y.M.; Woo, J.I.; Lee, N.S. Whole-brain Functional Networks in Cognitively Normal, Mild Cognitive Impairment, and Alzheimer’s Disease. PLoS ONE 2013, 8, e53922. [Google Scholar] [CrossRef] [Green Version]
- Vecchio, F.; Miraglia, F.; Rossini, P.M. Connectome: Graph theory application in functional brain network architecture. Clin. Neurophysiol. Pr. 2017, 2, 206–213. [Google Scholar] [CrossRef]
- Tijms, B.M.; Yeung, H.M.; Sikkes, S.A.; Möller, C.; Smits, L.L.; Stam, C.J.; Scheltens, P.; Van Der Flier, W.M.; Barkhof, F. Single-Subject Gray Matter Graph Properties and Their Relationship with Cognitive Impairment in Early- and Late-Onset Alzheimer’s Disease. Brain Connect. 2014, 4, 337–346. [Google Scholar] [CrossRef]
- Engels, M.M.; Stam, C.J.; Van Der Flier, W.M.; Scheltens, P.; De Waal, H.; Van Straaten, E.C. Declining functional connectivity and changing hub locations in Alzheimer’s disease: An EEG study. BMC Neurol. 2015, 15, 145. [Google Scholar] [CrossRef] [Green Version]
- Sanz-Arigita, E.J.; Schoonheim, M.M.; Damoiseaux, J.S.; Rombouts, S.A.R.B.; Maris, E.; Barkhof, F.; Scheltens, P.; Stam, C.J. Loss of ‘Small-World’ Networks in Alzheimer’s Disease: Graph Analysis of fMRI Resting-State Functional Connectivity. PLoS ONE 2010, 5, e13788. [Google Scholar] [CrossRef] [Green Version]
- Zhao, S.; Rangaprakash, D.; Liang, P.; Deshpande, G. Deterioration from healthy to mild cognitive impairment and Alzheimer’s disease mirrored in corresponding loss of centrality in directed brain networks. Brain Inf. 2019, 6, 1–11. [Google Scholar] [CrossRef] [PubMed]
- Tijms, B.M.; Möller, C.; Vrenken, H.; Wink, A.M.; De Haan, W.; Van Der Flier, W.M.; Stam, C.J.; Scheltens, P.; Barkhof, F. Single-Subject Grey Matter Graphs in Alzheimer’s Disease. PLoS ONE 2013, 8, e58921. [Google Scholar] [CrossRef]
- Jacobs, H.I.L.; Radua, J.; Lückmann, H.C.; Sack, A.T. Meta-analysis of functional network alterations in Alzheimer’s disease: Toward a network biomarker. Neurosci. Biobehav. Rev. 2013, 37, 753–765. [Google Scholar] [CrossRef] [PubMed]
- Stam, C.; Jones, B.; Nolte, G.; Breakspear, M.; Scheltens, P. Small-World Networks and Functional Connectivity in Alzheimer’s Disease. Cereb. Cortex 2006, 17, 92–99. [Google Scholar] [CrossRef] [Green Version]
- Tóth, B.; File, B.; Boha, R.; Kardos, Z.; Hidasi, Z.; Gaál, Z.A.; Csibri, E.; Salacz, P.; Stam, C.J.; Molnár, M. EEG network connectivity changes in mild cognitive impairment—Preliminary results. Int. J. Psychophysiol. 2014, 92, 1–7. [Google Scholar] [CrossRef]
- Sexton, C.E.; Kalu, U.G.; Filippini, N.; Mackay, C.E.; Ebmeier, K.P. A meta-analysis of diffusion tensor imaging in mild cognitive impairment and Alzheimer’s disease. Neurobiol. Aging 2011, 32, 2322.e5–2322.e18. [Google Scholar] [CrossRef]
- Jacobs, H.I.; Hopkins, D.A.; Mayrhofer, H.C.; Bruner, E.; van Leeuwen, F.W.; Raaijmakers, W.; Schmahmann, J.D. The cerebellum in Alzheimer’ s disease: Evaluating its role in cognitive decline. Brain 2018, 141, 37–47. [Google Scholar] [CrossRef]
- Toniolo, S.; Serra, L.; Olivito, G.; Marra, C.; Bozzali, M. Patterns of Cerebellar Gray Matter Atrophy Across Alzheimer’ s Disease Progression. Front. Cell. Neurosci. 2018, 12, 1–8. [Google Scholar] [CrossRef]
- Petersen, R.C.; Doody, R.; Kurz, A.; Mohs, R.C.; Morris, J.C.; Rabins, P.V.; Ritchie, K.; Rossor, M.; Thal, L.; Winblad, B. Current concepts in mild cognitive impairment. Arch. Neurol. 2001, 58, 1985–1992. [Google Scholar] [CrossRef]
- Stam, C.J.; Van Der Made, Y.; Pijnenburg, Y.A.L.; Scheltens, P. EEG synchronization in mild cognitive impairment and Alzheimer’s disease. Acta Neurol. Scand. 2003, 108, 90–96. [Google Scholar] [CrossRef]
- Zeng, K.; Wang, Y.; Ouyang, G.; Bian, Z.; Wang, L.; Li, X. Complex network analysis of resting state EEG in amnestic mild cognitive impairment patients with type 2 diabetes. Front. Comput. Neurosci. 2015, 9, 270. [Google Scholar] [CrossRef] [PubMed] [Green Version]
- Hata, M.; Kazui, H.; Tanaka, T.; Ishii, R.; Canuet, L.; Pascual-Marqui, R.D.; Aoki, Y.; Ikeda, S.; Kanemoto, H.; Yoshiyama, K.; et al. Functional connectivity assessed by resting state EEG correlates with cognitive decline of Alzheimer’s disease—An eLORETA study. Clin. Neurophysiol. 2016, 127, 1269–1278. [Google Scholar] [CrossRef] [PubMed] [Green Version]
- Choi, J.; Ku, B.; You, Y.G.; Jo, M.; Kwon, M.; Choi, Y.; Jung, S.; Ryu, S.; Park, E.; Go, H.; et al. Resting-state prefrontal EEG biomarkers in correlation with MMSE scores in elderly individuals. Sci. Rep. 2019, 9, 10468. [Google Scholar] [CrossRef] [PubMed] [Green Version]
- Cohen, M.X. Analyzing Neural Time Series Data: Theory and Practice; MIT Press: Cambridge, MA, USA, 2014. [Google Scholar]
- Sakkalis, V. Review of advanced techniques for the estimation of brain connectivity measured with EEG/MEG. Comput. Biol. Med. 2011, 41, 1110–1117. [Google Scholar] [CrossRef]


| Groups | ||||
|---|---|---|---|---|
| HC | SCD | MCI | AD | |
| Age | 67.22 (4.03) | 64.90 (7.92) | 70.40 (5.96) | 73.20 (8.17) |
| Gender (M:F) | 8:14 | 7:13 | 8:22 | 8:12 |
| Years of Education | 13.16 (4.59) | 13.75 (3.29) | 11.45 (4.06) | 9.77 (5.51) |
| Diagnosis | HC | SCD | MCI | AD | |||||
|---|---|---|---|---|---|---|---|---|---|
| Neuropsychological Tests | Mean | SD | Mean | SD | Mean | SD | Mean | SD | p-Value |
| MMSE | 29.13 | 0.99 | 29.25 | 1.06 | 27.13 ** | 2.55 | 22.30 | 3.35 | 0.001 |
| NPI | 0.00 | 0.00 | 0.30 | 0.73 | 2.81 | 6.08 | 2.75 | 4.23 | 0.092 |
| FRSSD total score | 1.58 * | 2.50 | 3.20 | 1.57 | 4.00 ** | 1.51 | 6.75 | 6.60 | 0.002 |
| FUCAS total score | 42.00 | 0.00 | 42.55 | 1.27 | 44.77 ** | 3.40 | 50.375 | 8.99 | 0.001 |
| TRAIL-B | 143.00 | 54.86 | 144.75 | 49.64 | 262.42 ** | 137.61 | 147.00 | 149.18 | 0.002 |
| RBMT immediate recall | 17.40 | 2.70 | 14.18 | 3.28 | 12.71 ** | 4.04 | 10.30 | 2.48 | 0.015 |
| RBMT delayed recall | 15.40 | 2.07 | 13.09 | 3.23 | 12.04 | 4.07 | 9.50 | 3.31 | 0.070 |
| ROCFT copy | 33.50 | 2.12 | 33.68 | 1.65 | 30.23 | 5.05 | 22.80 | 13.43 | 0.005 |
| ROCFT delayed recall | 31.00 * | 1.41 | 22.08 | 5.69 | 13.54 ** | 5.76 | 9.90 | 9.16 | 0.001 |
| RAVLT 1 | 7.33 | 3.05 | 7.23 | 2.75 | 5.19 | 2.08 | 4.60 | 2.07 | 0.035 |
| RAVLT 2 | 5.00 * | 0 | 7.35 | 3.83 | 5.33 | 2.19 | 5.40 | 3.84 | 0.201 |
| RAVLT total score | 53.33 | 13.86 | 53.88 | 12.56 | 33.38 | 16.09 | 34.00 | 16.85 | 0.001 |
| RAVLT 4 | −1.33 | 0.57 | 1.23 | 6.20 | −1.76 | 2.99 | −2.20 | 4.6 | 0.208 |
| FAS | 14.3 | 3.20 | 12.18 | 3.69 | 9.49 ** | 3.75 | 10.66 | 3.67 | 0.073 |
| HC | SCD | MCI | AD | |||||||
|---|---|---|---|---|---|---|---|---|---|---|
| Mean | SD | Mean | SD | Mean | SD | Mean | SD | p-Value | ||
| Local | Clustering Coefficient | 0.79 | 0.07 | 0.73 * | 0.09 | 0.72 ** | 0.09 | 0.68 *** | 0.11 | 0.004 |
| Strength | 22.56 | 1.65 | 21.11 * | 2.10 | 20.83 ** | 2.25 | 20.12 *** | 2.67 | 0.004 | |
| Betweenness Centrality | 0.044 | 0.03 | 0.056 * | 0.03 | 0.047 + | 0.02 | 0.06 | 0.02 | 0.431 | |
| Global | Clustering Coefficient | 0.311 | 0.079 | 0.308 | 0.088 | 0.291 | 0.072 | 0.285 | 0.091 | 0.681 |
| Strength | 99.24 | 18.08 | 97.70 | 20.19 | 94.01 | 16.20 | 91.88 | 21.92 | 0.569 | |
| Betweenness Centrality | 0.33 | 0.05 | 0.30 | 0.11 | 0.33 | 0.06 | 0.32 | 0.08 | 0.531 | |
| Groups | Global/Local | Network Property | AUC (%) | Threshold Value | Sensitivity (%) | Specificity (%) |
|---|---|---|---|---|---|---|
| HC vs. SCD, MCI and AD | Local | Clustering Coefficient | 74 | 0.78 | 64 | 78 |
| Strength | 74 | 22.38 | 64 | 79 | ||
| Betweenness Centrality | 40 | 0.31 | 64 | 39 | ||
| Global | Clustering Coefficient | 55 | 0.5 | 41 | 78 | |
| Strength | 56 | 106.65 | 41 | 75 | ||
| Betweenness Centrality | 55 | 0.04 | 73 | 24 | ||
| SCD vs. HC, MCI and AD | Local | Clustering Coefficient | 51 | 0.79 | 90 | 25 |
| Strength | 52 | 22.85 | 90 | 25 | ||
| Betweenness Centrality | 51 | 0.69 | 80 | 26 | ||
| Global | Clustering Coefficient | 55 | 0.28 | 70 | 44 | |
| Strength | 55 | 97.11 | 60 | 58 | ||
| Betweenness Centrality | 43 | 0.28 | 75 | 25 | ||
| MCI vs. SCD, HC and AD | Local | Clustering Coefficient | 57 | 0.75 | 67 | 52 |
| Strength | 57 | 22.14 | 77 | 40 | ||
| Betweenness Centrality | 54 | 0.05 | 61 | 43 | ||
| Global | Clustering Coefficient | 54 | 0.30 | 61 | 57 | |
| Strength | 54 | 94.48 | 57 | 58 | ||
| Betweenness Centrality | 49 | 0.37 | 71 | 40 | ||
| AD vs. HC, SCD and MCI | Local | Clustering Coefficient | 66 | 0.70 | 55 | 75 |
| Strength | 65 | 20.37 | 55 | 76 | ||
| Betweenness Centrality | 66 | 0.05 | 68 | 62 | ||
| Global | Clustering Coefficient | 55 | 0.32 | 75 | 41 | |
| Strength | 56 | 72.31 | 25 | 93 | ||
| Betweenness Centrality | 51 | 0.28 | 73 | 27 |
| Groups | Global/Local | Network Property | AUC (%) | Threshold Value | Sensitivity (%) | Specificity (%) |
|---|---|---|---|---|---|---|
| HC vs. SCD | Local | Clustering Coefficient | 71 | 0.78 | 75 | 64 |
| Strength | 71 | 22.34 | 75 | 64 | ||
| Betweenness Centrality | 41 | 0.033 | 77 | 30 | ||
| Global | Clustering Coefficient | 49 | 0.185 | 15 | 100 | |
| Strength | 51 | 69.829 | 15 | 100 | ||
| HC vs. MCI | Local | Clustering Coefficient | 73 | 0.78 | 80 | 64 |
| Strength | 79 | 22.31 | 80 | 64 | ||
| Betweenness Centrality | 45 | 0.036 | 77 | 32 | ||
| Global | Clustering Coefficient | 44 | 0.259 | 74 | 36 | |
| Strength | 43 | 86.773 | 68 | 36 | ||
| HC vs. AD | Local | Clustering Coefficient | 79 | 0.73 | 65 | 82 |
| Strength | 79 | 21.16 | 65 | 82 | ||
| Betweenness Centrality | 29 | 0.068 | 79 | 23 | ||
| Global | Clustering Coefficient | 58 | 0.351 | 85 | 41 | |
| Strength | 59 | 107.412 | 85 | 36 | ||
| SCD vs. MCI | Local | Clustering Coefficient | 54 | 0.76 | 70 | 45 |
| Strength | 53 | 19.80 | 27 | 85 | ||
| Betweenness Centrality | 54 | 0.060 | 40 | 71 | ||
| Global | Clustering Coefficient | 57 | 0.285 | 54 | 70 | |
| Strength | 56 | 93.358 | 54 | 65 | ||
| SCD vs. AD | Local | Clustering Coefficient | 63 | 0.69 | 50 | 80 |
| Strength | 62 | 20.41 | 55 | 70 | ||
| Betweenness Centrality | 38 | 0.071 | 25 | 79 | ||
| Global | Clustering Coefficient | 57 | 0.317 | 75 | 45 | |
| Strength | 59 | 97.879 | 65 | 55 | ||
| MCI vs. AD | Local | Clustering Coefficient | 58 | 0.70 | 55 | 70 |
| Strength | 58 | 20.50 | 55 | 70 | ||
| Betweenness Centrality | 35 | 0.058 | 36 | 58 | ||
| Global | Clustering Coefficient | 51 | 0.241 | 30 | 79 | |
| Strength | 52 | 70.799 | 20 | 96 |
| Domain | Neuropsychological Tests | Clustering Coefficient | Strength | Betweenness Centrality |
|---|---|---|---|---|
| Global Cognition | MMSE | 0.158 | 0.141 | −0.254 * |
| Mood | NPI | −0.082 | −0.083 | 0.149 |
| Memory and Executive Function | RBMT immediate recall | 0.167 | 0.146 | −0.251 |
| RBMT delayed recall | 0.205 | 0.186 | −0.362 * | |
| ROCFT copy | 0.119 | 0.085 | −0.501 ** | |
| ROCFT recall | 0.169 | 0.149 | −0.501 | |
| Learning | RAVLT recall | 0.152 | 0.144 | −0.042 |
| RAVLT learning | 0.018 | 0.014 | −0.062 | |
| Daily Functionality | FUCAS total score | −0.053 | −0.028 | 0.281 * |
| FRSSD total score | −0.070 | −0.053 | 0.244 | |
| FRSSD sleep | −0.286 * | −0.280 | 0.522 ** |
© 2020 by the authors. Licensee MDPI, Basel, Switzerland. This article is an open access article distributed under the terms and conditions of the Creative Commons Attribution (CC BY) license (http://creativecommons.org/licenses/by/4.0/).
Share and Cite
Lazarou, I.; Georgiadis, K.; Nikolopoulos, S.; Oikonomou, V.P.; Tsolaki, A.; Kompatsiaris, I.; Tsolaki, M.; Kugiumtzis, D. A Novel Connectome-based Electrophysiological Study of Subjective Cognitive Decline Related to Alzheimer’s Disease by Using Resting-state High-density EEG EGI GES 300. Brain Sci. 2020, 10, 392. https://0-doi-org.brum.beds.ac.uk/10.3390/brainsci10060392
Lazarou I, Georgiadis K, Nikolopoulos S, Oikonomou VP, Tsolaki A, Kompatsiaris I, Tsolaki M, Kugiumtzis D. A Novel Connectome-based Electrophysiological Study of Subjective Cognitive Decline Related to Alzheimer’s Disease by Using Resting-state High-density EEG EGI GES 300. Brain Sciences. 2020; 10(6):392. https://0-doi-org.brum.beds.ac.uk/10.3390/brainsci10060392
Chicago/Turabian StyleLazarou, Ioulietta, Kostas Georgiadis, Spiros Nikolopoulos, Vangelis P. Oikonomou, Anthoula Tsolaki, Ioannis Kompatsiaris, Magda Tsolaki, and Dimitris Kugiumtzis. 2020. "A Novel Connectome-based Electrophysiological Study of Subjective Cognitive Decline Related to Alzheimer’s Disease by Using Resting-state High-density EEG EGI GES 300" Brain Sciences 10, no. 6: 392. https://0-doi-org.brum.beds.ac.uk/10.3390/brainsci10060392