Cerebrospinal Fluid α-Synuclein Species in Cognitive and Movements Disorders

 , and
, and
Abstract
:1. Introduction
2. Materials and Methods
2.1. Patients
2.2. Cerebrospinal Fluid Markers
2.3. Statistical Analysis
3. Results
4. Discussion
5. Conclusions
Supplementary Materials
Author Contributions
Funding
Institutional Review Board Statement
Informed Consent Statement
Data Availability Statement
Acknowledgments
Conflicts of Interest
References
- Rajput, A.H.; Rozdilsky, B.; Rajput, A. Accuracy of clinical diagnosis in parkinsonism—A prospective study. Can. J. Neurol. Sci. 1991, 18, 275–278. [Google Scholar] [CrossRef] [PubMed] [Green Version]
- Respondek, G.; Roeber, S.; Kretzschmar, H.; Troakes, C.; Al-Sarraj, S.; Gelpi, E.; Gaig, C.; Chiu, W.Z.; van Swieten, J.C.; Oertel, W.H.; et al. Accuracy of the National Institute for Neurological Disorders and Stroke/Society for Progressive Supranuclear Palsy and neuroprotection and natural history in Parkinson plus syndromes criteria for the diagnosis of progressive supranuclear palsy. Mov. Disord. 2013, 28, 504–509. [Google Scholar] [CrossRef] [PubMed]
- Mendez, M.F.; Shapira, J.S.; McMurtray, A.; Licht, E.; Miller, B.L. Accuracy of the clinical evaluation for frontotemporal dementia. Arch Neurol. 2007, 64, 830–835. [Google Scholar] [CrossRef] [PubMed] [Green Version]
- Hughes, A.J.; Daniel, S.E.; Ben-Shlomo, Y.; Lees, A.J. The accuracy of diagnosis of parkinsonian syndromes in a specialist movement disorder service. Brain 2002, 125, 861–870. [Google Scholar] [CrossRef] [PubMed] [Green Version]
- McKhann, G.M.; Knopman, D.S.; Chertkow, H.; Hyman, B.T.; Jack, C.R.; Kawas, C.H., Jr.; Klunk, W.E.; Koroshetz, W.J.; Manly, J.J.; Mayeux, R.; et al. The diagnosis of dementia due to Alzheimer’s disease: Recommendations from the National Institute on Aging-Alzheimer’s Association workgroups on diagnostic guidelines for Alzheimer’s disease. Alzheimers Dement. 2011, 7, 263–269. [Google Scholar] [CrossRef] [PubMed] [Green Version]
- Dubois, B.; Feldman, H.H.; Jacova, C.; Hampel, H.; Molinuevo, J.L.; Blennow, K.; DeKosky, S.T.; Gauthier, S.; Selkoe, D.; Bateman, R.; et al. Advancing research diagnostic criteria for Alzheimer’s disease: The IWG-2 criteria. Lancet Neurol. 2014, 13, 614–629. [Google Scholar] [CrossRef]
- Mollenhauer, B.; Locascio, J.J.; Schulz-Schaeffer, W.; Sixel-Doring, F.; Trenkwalder, C.; Schlossmacher, M.G. alpha-Synuclein and tau concentrations in cerebrospinal fluid of patients presenting with parkinsonism: A cohort study. Lancet Neurol. 2011, 10, 230–240. [Google Scholar] [CrossRef]
- Wang, Y.; Shi, M.; Chung, K.A.; Zabetian, C.P.; Leverenz, J.B.; Berg, D.; Srulijes, K.; Trojanowski, J.Q.; Lee, V.M.; Siderowf, A.D.; et al. Phosphorylated alpha-synuclein in Parkinson’s disease. Sci. Transl. Med. 2012, 4, 121ra20. [Google Scholar] [CrossRef] [Green Version]
- Shi, M.; Bradner, J.; Hancock, A.M.; Chung, K.A.; Quinn, J.F.; Peskind, E.R.; Galasko, D.; Jankovic, J.; Zabetian, C.P.; Kim, H.M.; et al. Cerebrospinal fluid biomarkers for Parkinson disease diagnosis and progression. Ann. Neurol. 2011, 69, 570–580. [Google Scholar] [CrossRef] [Green Version]
- Tokuda, T.; Qureshi, M.M.; Ardah, M.T.; Varghese, S.; Shehab, S.A.; Kasai, T.; Ishigami, N.; Tamaoka, A.; Nakagawa, M.; El-Agnaf, O.M. Detection of elevated levels of alpha-synuclein oligomers in CSF from patients with Parkinson disease. Neurology 2010, 75, 1766–1772. [Google Scholar] [CrossRef]
- Parnetti, L.; Chiasserini, D.; Bellomo, G.; Giannandrea, D.; De Carlo, C.; Qureshi, M.M.; Ardah, M.T.; Varghese, S.; Bonanni, L.; Borroni, B.; et al. Cerebrospinal fluid Tau/alpha-synuclein ratio in Parkinson’s disease and degenerative dementias. Mov. Disord. 2011, 26, 1428–1435. [Google Scholar] [CrossRef] [PubMed]
- Fujiwara, H.; Hasegawa, M.; Dohmae, N.; Kawashima, A.; Masliah, E.; Goldberg, M.S.; Shen, J.; Takio, K.; Iwatsubo, T. alpha-Synuclein is phosphorylated in synucleinopathy lesions. Nat. Cell Biol. 2002, 4, 160–164. [Google Scholar] [CrossRef] [PubMed]
- Nishie, M.; Mori, F.; Fujiwara, H.; Hasegawa, M.; Yoshimoto, M.; Iwatsubo, T.; Takahashi, H.; Wakabayashi, K. Accumulation of phosphorylated alpha-synuclein in the brain and peripheral ganglia of patients with multiple system atrophy. Acta Neuropathol. 2004, 107, 292–298. [Google Scholar] [CrossRef] [PubMed]
- Kazantsev, A.G.; Kolchinsky, A.M. Central role of alpha-synuclein oligomers in neurodegeneration in Parkinson disease. Arch Neurol. 2008, 65, 1577–1581. [Google Scholar] [CrossRef] [PubMed]
- Foulds, P.G.; Mitchell, J.D.; Parker, A.; Turner, R.; Green, G.; Diggle, P.; Hasegawa, M.; Taylor, M.; Mann, D.; Allsop, D. Phosphorylated alpha-synuclein can be detected in blood plasma and is potentially a useful biomarker for Parkinson’s disease. FASEB J. 2011, 25, 4127–4137. [Google Scholar] [CrossRef] [PubMed]
- Hansson, O.; Hall, S.; Ohrfelt, A.; Zetterberg, H.; Blennow, K.; Minthon, L.; Nagga, K.; Londos, E.; Varghese, S.; Majbour, N.K.; et al. Levels of cerebrospinal fluid alpha-synuclein oligomers are increased in Parkinson’s disease with dementia and dementia with Lewy bodies compared to Alzheimer’s disease. Alzheimers Res. Ther. 2014, 6, 25. [Google Scholar] [CrossRef] [Green Version]
- Van Steenoven, I.; Majbour, N.K.; Vaikath, N.N.; Berendse, H.W.; van der Flier, W.M.; van de Berg, W.D.J.; Teunissen, C.E.; Lemstra, A.W.; El-Agnaf, O.M.A. alpha-Synuclein species as potential cerebrospinal fluid biomarkers for dementia with lewy bodies. Mov. Disord. 2018, 33, 1724–1733. [Google Scholar] [CrossRef] [Green Version]
- Majbour, N.K.; Vaikath, N.N.; Eusebi, P.; Chiasserini, D.; Ardah, M.; Varghese, S.; Haque, M.E.; Tokuda, T.; Auinger, P.; Calabresi, P.; et al. Longitudinal changes in CSF alpha-synuclein species reflect Parkinson’s disease progression. Mov. Disord. 2016, 31, 1535–1542. [Google Scholar] [CrossRef]
- Majbour, N.K.; Chiasserini, D.; Vaikath, N.N.; Eusebi, P.; Tokuda, T.; van de Berg, W.; Parnetti, L.; Calabresi, P.; El-Agnaf, O.M.A. Increased levels of CSF total but not oligomeric or phosphorylated forms of alpha-synuclein in patients diagnosed with probable Alzheimer’s disease. Sci. Rep. 2017, 7, 40263. [Google Scholar] [CrossRef]
- Postuma, R.B.; Berg, D.; Stern, M.; Poewe, W.; Olanow, C.W.; Oertel, W.; Obeso, J.; Marek, K.; Litvan, I.; Lang, A.E.; et al. MDS clinical diagnostic criteria for Parkinson’s disease. Mov. Disord. 2015, 30, 1591–1601. [Google Scholar] [CrossRef]
- Gilman, S.; Wenning, G.K.; Low, P.A.; Brooks, D.J.; Mathias, C.J.; Trojanowski, J.Q.; Wood, N.W.; Colosimo, C.; Durr, A.; Fowler, C.J.; et al. Second consensus statement on the diagnosis of multiple system atrophy. Neurology 2008, 71, 670–676. [Google Scholar] [CrossRef] [PubMed]
- Hoglinger, G.U.; Respondek, G.; Stamelou, M.; Kurz, C.; Josephs, K.A.; Lang, A.E.; Mollenhauer, B.; Muller, U.; Nilsson, C.; Whitwell, J.L.; et al. Clinical diagnosis of progressive supranuclear palsy: The movement disorder society criteria. Mov. Disord. 2017, 32, 853–864. [Google Scholar] [CrossRef] [PubMed]
- Armstrong, M.J.; Litvan, I.; Lang, A.E.; Bak, T.H.; Bhatia, K.P.; Borroni, B.; Boxer, A.L.; Dickson, D.W.; Grossman, M.; Hallett, M.; et al. Criteria for the diagnosis of corticobasal degeneration. Neurology 2013, 80, 496–503. [Google Scholar] [CrossRef] [PubMed] [Green Version]
- Piguet, O.; Hornberger, M.; Mioshi, E.; Hodges, J.R. Behavioural-variant frontotemporal dementia: Diagnosis, clinical staging, and management. Lancet Neurol. 2011, 10, 162–172. [Google Scholar] [CrossRef]
- Sachdev, P.; Kalaria, R.; O’Brien, J.; Skoog, I.; Alladi, S.; Black, S.E.; Blacker, D.; Blazer, D.G.; Chen, C.; Chui, H.; et al. Diagnostic criteria for vascular cognitive disorders: A VASCOG statement. Alzheimer Dis. Assoc. Disord. 2014, 28, 206–218. [Google Scholar] [CrossRef] [Green Version]
- Simonsen, A.H.; Herukka, S.K.; Andreasen, N.; Baldeiras, I.; Bjerke, M.; Blennow, K.; Engelborghs, S.; Frisoni, G.B.; Gabryelewicz, T.; Galluzzi, S.; et al. Recommendations for CSF AD biomarkers in the diagnostic evaluation of dementia. Alzheimers Dement. 2017, 13, 274–284. [Google Scholar] [CrossRef] [Green Version]
- Molinuevo, J.L.; Blennow, K.; Dubois, B.; Engelborghs, S.; Lewczuk, P.; Perret-Liaudet, A.; Teunissen, C.E.; Parnetti, L. The clinical use of cerebrospinal fluid biomarker testing for Alzheimer’s disease diagnosis: A consensus paper from the Alzheimer’s Biomarkers Standardization Initiative. Alzheimers Dement. 2014, 10, 808–817. [Google Scholar] [CrossRef]
- Majbour, N.K.; Vaikath, N.N.; van Dijk, K.D.; Ardah, M.T.; Varghese, S.; Vesterager, L.B.; Montezinho, L.P.; Poole, S.; Safieh-Garabedian, B.; Tokuda, T.; et al. Oligomeric and phosphorylated alpha-synuclein as potential CSF biomarkers for Parkinson’s disease. Mol. Neurodegener. 2016, 11, 7. [Google Scholar] [CrossRef] [Green Version]
- Del Campo, M.; Mollenhauer, B.; Bertolotto, A.; Engelborghs, S.; Hampel, H.; Simonsen, A.H.; Kapaki, E.; Kruse, N.; Le Bastard, N.; Lehmann, S.; et al. Recommendations to standardize preanalytical confounding factors in Alzheimer’s and Parkinson’s disease cerebrospinal fluid biomarkers: An update. Biomark. Med. 2012, 6, 419–430. [Google Scholar] [CrossRef]
- Constantinides, V.C.; Paraskevas, G.P.; Emmanouilidou, E.; Petropoulou, O.; Bougea, A.; Vekrellis, K.; Evdokimidis, I.; Stamboulis, E.; Kapaki, E. CSF biomarkers beta-amyloid, tau proteins and a-synuclein in the differential diagnosis of Parkinson-plus syndromes. J. Neurol. Sci. 2017, 382, 91–95. [Google Scholar] [CrossRef]
- Bourbouli, M.; Rentzos, M.; Bougea, A.; Zouvelou, V.; Constantinides, V.C.; Zaganas, I.; Evdokimidis, I.; Kapaki, E.; Paraskevas, G.P. Cerebrospinal Fluid TAR DNA-Binding Protein 43 Combined with Tau Proteins as a Candidate Biomarker for Amyotrophic Lateral Sclerosis and Frontotemporal Dementia Spectrum Disorders. Dement. Geriatr. Cogn. Disord. 2017, 44, 144–152. [Google Scholar] [CrossRef] [PubMed]
- Kapaki, E.; Paraskevas, G.P.; Emmanouilidou, E.; Vekrellis, K. The diagnostic value of CSF alpha-synuclein in the differential diagnosis of dementia with Lewy bodies vs. normal subjects and patients with Alzheimer’s disease. PLoS ONE 2013, 8, e81654. [Google Scholar] [CrossRef] [PubMed] [Green Version]
- Park, M.J.; Cheon, S.M.; Bae, H.R.; Kim, S.H.; Kim, J.W. Elevated levels of alpha-synuclein oligomer in the cerebrospinal fluid of drug-naive patients with Parkinson’s disease. J. Clin. Neurol. 2011, 7, 215–222. [Google Scholar] [CrossRef] [PubMed] [Green Version]
- Paleologou, K.E.; Kragh, C.L.; Mann, D.M.; Salem, S.A.; Al-Shami, R.; Allsop, D.; Hassan, A.H.; Jensen, P.H.; El-Agnaf, O.M.A. Detection of elevated levels of soluble alpha-synuclein oligomers in post-mortem brain extracts from patients with dementia with Lewy bodies. Brain 2009, 132, 1093–1101. [Google Scholar] [CrossRef] [PubMed] [Green Version]
- El-Agnaf, O.M.; Salem, S.A.; Paleologou, K.E.; Curran, M.D.; Gibson, M.J.; Court, J.A.; Schlossmacher, M.G.; Allsop, D. Detection of oligomeric forms of alpha-synuclein protein in human plasma as a potential biomarker for Parkinson’s disease. FASEB J. 2006, 20, 419–425. [Google Scholar] [CrossRef]
- Sengupta, U.; Guerrero-Munoz, M.J.; Castillo-Carranza, D.L.; Lasagna-Reeves, C.A.; Gerson, J.E.; Paulucci-Holthauzen, A.A.; Krishnamurthy, S.; Farhed, M.; Jackson, G.R.; Kayed, R.; et al. Pathological interface between oligomeric alpha-synuclein and tau in synucleinopathies. Biol. Psychiatry 2015, 78, 672–683. [Google Scholar] [CrossRef]
- Swirski, M.; Miners, J.S.; de Silva, R.; Lashley, T.; Ling, H.; Holton, J.; Revesz, T.; Love, S. Evaluating the relationship between amyloid-beta and alpha-synuclein phosphorylated at Ser129 in dementia with Lewy bodies and Parkinson’s disease. Alzheimers Res. Ther. 2014, 6, 77. [Google Scholar] [CrossRef] [Green Version]
- Barbour, R.; Kling, K.; Anderson, J.P.; Banducci, K.; Cole, T.; Diep, L.; Fox, M.; Goldstein, J.M.; Soriano, F.; Seubert, P.; et al. Red blood cells are the major source of alpha-synuclein in blood. Neurodegener. Dis. 2008, 5, 55–59. [Google Scholar] [CrossRef]
- Mollenhauer, B.; Batrla, R.; El-Agnaf, O.; Galasko, D.R.; Lashuel, H.A.; Merchant, K.M.; Shaw, L.M.; Selkoe, D.J.; Umek, R.; Vanderstichele, H.; et al. A user’s guide for alpha-synuclein biomarker studies in biological fluids: Perianalytical considerations. Mov. Disord. 2017, 32, 1117–1130. [Google Scholar] [CrossRef]
- Vaikath, N.N.; Hmila, I.; Gupta, V.; Erskine, D.; Ingelsson, M.; El-Agnaf, O.M.A. Antibodies against alpha-synuclein: Tools and therapies. J. Neurochem. 2019, 150, 612–625. [Google Scholar] [CrossRef] [Green Version]
- Stewart, T.; Sossi, V.; Aasly, J.O.; Wszolek, Z.K.; Uitti, R.J.; Hasegawa, K.; Yokoyama, T.; Zabetian, C.P.; Leverenz, J.B.; Stoessl, A.J.; et al. Phosphorylated alpha-synuclein in Parkinson’s disease: Correlation depends on disease severity. Acta Neuropathol Commun. 2015, 3, 7. [Google Scholar] [CrossRef] [PubMed] [Green Version]
- Aasly, J.O.; Johansen, K.K.; Bronstad, G.; Waro, B.J.; Majbour, N.K.; Varghese, S.; Alzahmi, F.; Paleologou, K.E.; Amer, D.A.; Al-Hayani, A.; et al. Elevated levels of cerebrospinal fluid alpha-synuclein oligomers in healthy asymptomatic LRRK2 mutation carriers. Front. Aging Neurosci. 2014, 6, 248. [Google Scholar] [CrossRef] [PubMed]
- Majbour, N.K.; Aasly, J.O.; Hustad, E.; Thomas, M.A.; Vaikath, N.N.; Elkum, N.; van de Berg, W.D.J.; Tokuda, T.; Mollenhauer, B.; Berendse, H.W.; et al. CSF total and oligomeric alpha-Synuclein along with TNF-alpha as risk biomarkers for Parkinson’s disease: A study in LRRK2 mutation carriers. Transl. Neurodegener. 2020, 9, 15. [Google Scholar] [CrossRef] [PubMed]
- Compta, Y.; Valente, T.; Saura, J.; Segura, B.; Iranzo, A.; Serradell, M.; Junque, C.; Tolosa, E.; Valldeoriola, F.; Munoz, E.; et al. Correlates of cerebrospinal fluid levels of oligomeric- and total-alpha-synuclein in premotor, motor and dementia stages of Parkinson’s disease. J. Neurol. 2015, 262, 294–306. [Google Scholar] [CrossRef] [PubMed]
- Urakami, K.; Mori, M.; Wada, K.; Kowa, H.; Takeshima, T.; Arai, H.; Sasaki, H.; Kanai, M.; Shoji, M.; Ikemoto, K.; et al. A comparison of tau protein in cerebrospinal fluid between corticobasal degeneration and progressive supranuclear palsy. Neurosci. Lett. 1999, 259, 127–129. [Google Scholar] [CrossRef]


| PD n = 13 | MSA n = 9 | PSP n = 13 | CBD n = 9 | AD n = 51 | FTD n = 26 | VD n = 14 | p-Value | |
|---|---|---|---|---|---|---|---|---|
| Sex (m/f) | 8/5 | 6/3 | 9/4 | 4/5 | 18/33 | 15/11 | 9/5 | 0.132 † |
| Age | 57.5 (11.1) | 61.4 (9.3) | 60.8 (5.2) | 68.9 (8.0) | 66.5 (11.0) | 59.6 (8.7) | 71.1 (10.9) | 0.001 * |
| Disease duration (y) | 7.0 (4.0–8.0) | 3.0 (1.5–3.0) | 3.0 (1.5–3.0) | 2.0 (2.0–2.5) | 3.0 (2.0–5.0) | 3.0 (2.0–5.0) | 3.0 (2.0–3.0) | 0.010 ‡ |
| UPDRS | 24.5 (16.5) | 15.4 (17.9) | 20.5 (11.4) | 26.0 (8.7) | NA | NA | NA | 0.442 * |
| MMSE | 28 (26–29) | 29 (26–29.5) | 24 (22.5–28.5) | 24 (19.5–28) | 19 (13–23) | 24 (17–27) | 22 (20–24) | <0.0001 ‡ |
| Clox 2 test | 13 (10–13) | 13 (12–14.5) | 9.5 (8.0–10.0) | 8 (2–10) | 10 (5–12) | 12 (8–14) | 8 (7–12) | 0.002 ‡ |
| FAB | 14.5 (10–16) | 14.5 (12.5–16.5) | 11 (10–14) | 9.5 (6.5–12.5) | 10 (7–13) | 11 (3–12) | 11 (6–12) | 0.055 ‡ |
| 5-word delayed recall test | 5 (5–5) | 5 (5–5) | 5 (4–5) | 4 (3–5) | 1.5 (1–3) | 4.5 (0–5) | 5 (4–5) | 0.003 ‡ |
| Diagnosis | Analyses | |||||||||
|---|---|---|---|---|---|---|---|---|---|---|
| I. Classical CSF AD Biomarkers | ||||||||||
| PD n = 13 | MSA n = 9 | PSP n = 13 | CBD n = 9 | AD n = 51 | FTD n = 26 | VD n = 14 | All Subgroups | Movement Disorders | Dementias | |
| τT (pg/mL) | 216 (183–259) | 305 (211–360) | 202 (167–291) | 359 (309–454) | 649 (477–900) | 351 (227–450) | 278 (272–347) | <0.0001 * | 0.017 * | <0.0001 * |
| Aβ42 (pg/mL) | 716 (579–930) | 604 (572–819) | 690 (559–885) | 867 (555–1004) | 459 (405–596) | 755 (640–896) | 651 (570–727) | <0.0001 * | 0.891 * | <0.0001 * |
| τP-181 (pg/mL) | 36 (28–49) | 37 (47–42) | 30 (25–50) | 44 (32–104) | 72 (57–98) | 41 (33–46) | 48 (35–56) | <0.0001 * | 0.364 * | <0.0001 * |
| τT/Aβ42 | 0.30 (0.27–0.34) | 0.45 (0.32–0.55) | 0.33 (0.29–0.40) | 0.45 (0.41–0.55) | 1.35 (1.00–2.12) | 0.47 (0.29–0.71) | 0.38 (0.30–0.61) | <0.0001 ‡ | 0.001 ‡ | <0.0001 ‡ |
| τP-181/τT | 0.17 (0.15–0.19) | 0.12 (0.12–0.16) | 0.15 (0.14–0.16) | 0.14 (0.13–0.16) | 0.12 (0.09–0.14) | 0.13 (0.09–0.17) | 0.18 (0.13–0.20) | <0.0001 ‡ | 0.053 ‡ | 0.022 ‡ |
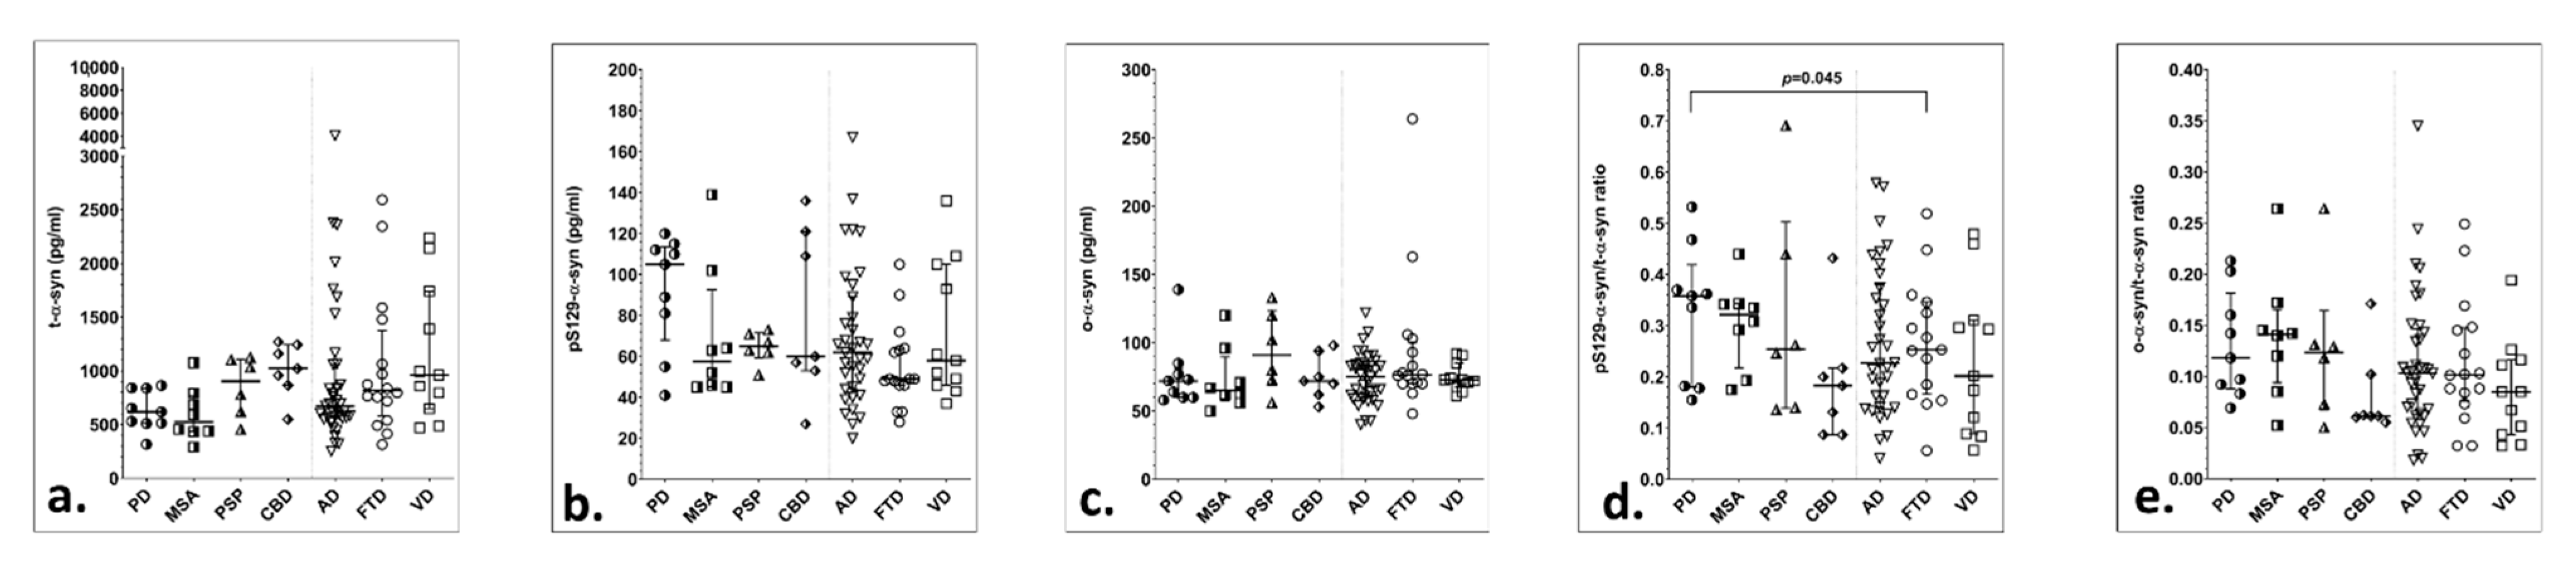
| II. CSF α-syn Species in All Patients | ||||||||||
| PD n = 13 | MSA n = 9 | PSP n = 13 | CBD n = 9 | AD n = 51 | FTD n = 26 | VD n = 14 | ||||
| t-α-syn (pg/mL) | 652 (530–841) | 591 (438–686) | 882 (618–1102) | 958 (549–1158) | 690 (574–1240) | 792 (539–1063) | 908 (600–1564) | 0.346 ‡ | 0.107 ‡ | 0.653 ‡ |
| pS129-α-syn (pg/mL) | 85 (55–110) | 54 (46–64) | 67 (56–78) | 60 (53–109) | 59 (47–79) | 49 (34–72) | 55 (46–93) | 0.279 * | 0.976 * | 0.547 * |
| ο-α-syn (pg/mL) | 75 (64–85) | 67 (62–73) | 80 (70–111) | 72 (62–81) | 74 (61–87) | 76 (66–88) | 73.5 (71–91) | 0.753 ‡ | 0.448 ‡ | 0.630 ‡ |
| pS129-α-syn/t-α-syn | 0.13 (0.05–0.17) | 0.14 (0.08–0.18) | 0.06 (0.05–0.11) | 0.11 (0.05–0.14) | 0.09 (0.04–0.14) | 0.06 (0.06–0.08) | 0.08 (0.03–0.11) | 0.190 ‡ | 0.270 ‡ | 0.212 ‡ |
| ο-α-syn/t-α-syn | 0.11 (0.08–0.14) | 0.14 (0.11–0.15) | 0.09 (0.06–0.13) | 0.06 (0.06–0.10) | 0.09 (0.06–0.13) | 0.10 (0.08–0.13) | 0.09 (0.05–0.13) | 0.243 * | 0.378 * | 0.172 * |
| III. CSF α-syn Species after Exclusion of Patients with Blood Contamination | ||||||||||
| PD n = 9 | MSA n = 8 | PSP n = 6 | CBD n = 7 | AD n = 37 | FTD n = 16 | VD n = 11 | ||||
| t- a -syn (pg/mL) | 618 (513–837) | 523 (436–739) | 903 (618–1102) | 1022 (865–1243) | 670 (567–1059) | 816 (629–1271) | 960 (648–1741) | 0.069 | 0.016 | 0.275 |
| pS129-α-syn (pg/mL) | 105 (81–112) | 58 (46–83) | 65 (62–71) | 60 (53–121) | 62 (44–89) | 49 (46–64) | 58 (46–105) | 0.211 | 0.392 | 0.368 |
| o-α-syn (pg/mL) | 72 (60–77) | 65 (59–84) | 91 (73–120) | 72 (62–94) | 75 (61–84) | 77 (70–98) | 73 (68–85) | 0.499 | 0.379 | 0.400 |
| pS129-α -syn/t-α-syn | 0.17 (0.13–0.23) | 0.14 (0.07–0.18) | 0.08 (0.06–0.12) | 0.06 (0.05–0.14) | 0.11 (0.06–0.15) | 0.06 (0.04–0.08) | 0.09 (0.03–0.11) | 0.039 | 0.130 | 0.147 |
| o-α-syn/t-α-syn | 0.12 (0.09–0.16) | 0.14 (0.10–0.16) | 0.12 (0.07–0.13) | 0.06 (0.06–0.10) | 0.10 (0.06–0.14) | 0.10 (0.08–0.15) | 0.09 (0.04–0.12) | 0.223 | 0.155 * | 0.470 |
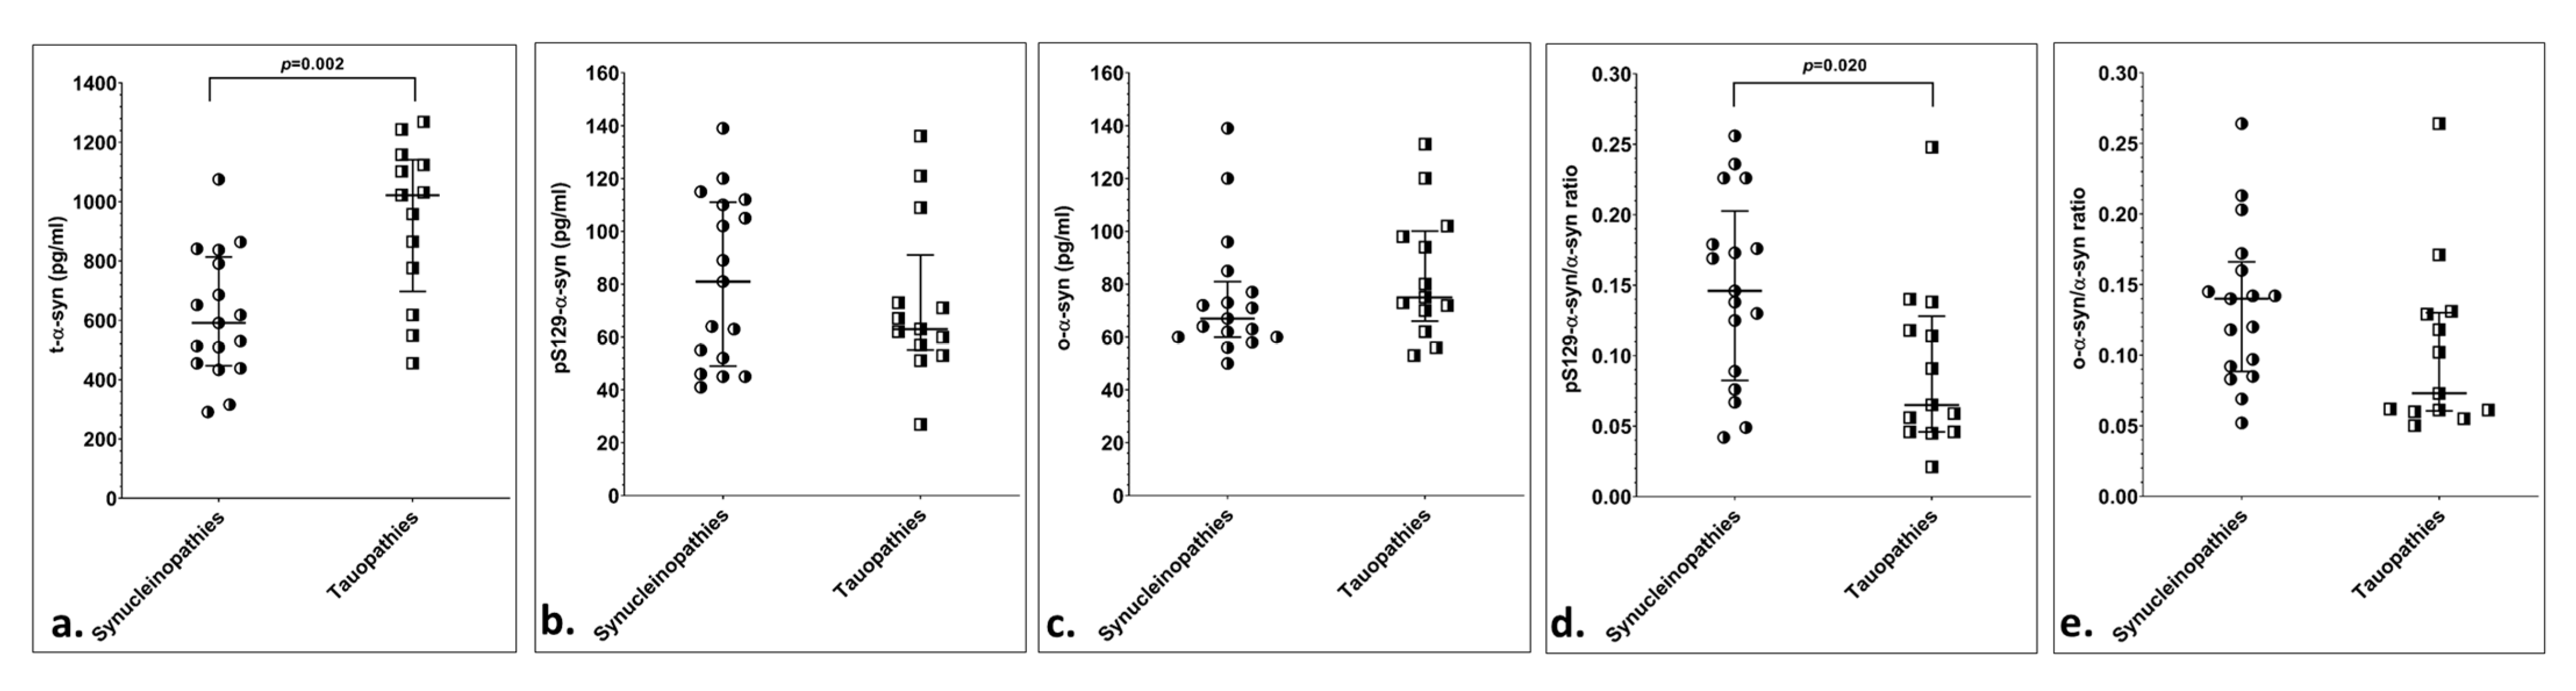
| I. Classical CSF AD Biomarkers | |||
| Synucleinopathies n = 22 | Tauopathies n = 22 | p-Value | |
| τT (pg/mL) | 246 (184–309) | 278 (192–359) | <0.799 * |
| Aβ42 (pg/mL) | 696 (576–895) | 774 (557–895) | <0.916 * |
| τP-181 (pg/mL) | 37 (30–46) | 43 (28–55) | <0.873 * |
| τT/Aβ42 | 0.31 (0.29–0.38) | 0.39 (0.31–0.45) | <0.175 ‡ |
| τP-181/τT | 0.15 (0.12–0.17) | 0.14 (0.14–0.16) | <0.918 ‡ |
| t-α-syn (pg/mL) | 632 (509–837) | 883 (605–1124) | 0.034 ‡ |
| pS129-α-syn (pg/mL) | 64 (46–105) | 65 (53–95) | 0.819 * |
| II. CSF α-syn Species in All Patients | |||
| Synucleinopathies n = 22 | Tauopathies n = 22 | ||
| o-α-syn (pg/mL) | 72.5 (62–85) | 76 (62–98) | 0.681 ‡ |
| pS129-α-syn/t-α-syn | 0.13 (0.07–0.18) | 0.08 (0.05–0.12) | 0.119 ‡ |
| ο-α-syn/t-α-syn | 0.12 (0.08–0.15) | 0.08 (0.06–0.13) | 0.116 * |
| III. CSF α-syn Species after Exclusion of Patients with Blood Contamination | |||
| Synucleinopathies n = 17 | Tauopathies n = 13 | ||
| t-α-syn (pg/mL) | 591 (455–791) | 1022 (776–1124) | 0.002 |
| pS129-α syn (pg/mL) | 81 (52–110) | 63 (57–73) | 0.711 |
| o-α-syn (pg/mL) | 67 (60–77) | 75 (70–98) | 0.229 |
| pS129-α-syn/t-α-syn | 0.15 (0.09–0.18) | 0.07 (0.05–0.12) | 0.020 |
| o-α-syn/t-α-syn | 0.14 (0.09–0.16) | 0.07 (0.06–0.13) | 0.059 |
Publisher’s Note: MDPI stays neutral with regard to jurisdictional claims in published maps and institutional affiliations. |
© 2021 by the authors. Licensee MDPI, Basel, Switzerland. This article is an open access article distributed under the terms and conditions of the Creative Commons Attribution (CC BY) license (http://creativecommons.org/licenses/by/4.0/).
Share and Cite
Constantinides, V.C.; Majbour, N.K.; Paraskevas, G.P.; Abdi, I.; Safieh-Garabedian, B.; Stefanis, L.; El-Agnaf, O.M.; Kapaki, E. Cerebrospinal Fluid α-Synuclein Species in Cognitive and Movements Disorders. Brain Sci. 2021, 11, 119. https://0-doi-org.brum.beds.ac.uk/10.3390/brainsci11010119
Constantinides VC, Majbour NK, Paraskevas GP, Abdi I, Safieh-Garabedian B, Stefanis L, El-Agnaf OM, Kapaki E. Cerebrospinal Fluid α-Synuclein Species in Cognitive and Movements Disorders. Brain Sciences. 2021; 11(1):119. https://0-doi-org.brum.beds.ac.uk/10.3390/brainsci11010119
Chicago/Turabian StyleConstantinides, Vasilios C., Nour K. Majbour, George P. Paraskevas, Ilham Abdi, Bared Safieh-Garabedian, Leonidas Stefanis, Omar M. El-Agnaf, and Elisabeth Kapaki. 2021. "Cerebrospinal Fluid α-Synuclein Species in Cognitive and Movements Disorders" Brain Sciences 11, no. 1: 119. https://0-doi-org.brum.beds.ac.uk/10.3390/brainsci11010119