
Differences in Performance of ASD and ADHD Subjects Facing Cognitive Loads in an Innovative Reasoning Experiment

 , ,
, ,
Abstract
:1. Introduction
1.1. The Structure of Aristotle’s Syllogism and Its Relation to Cognitive Processes
- A: All X are Y
- I: Some X are Y
- E: No X is Y
- O: Some X are not Y
1.2. Syllogistic Reasoning, Linguistic, and Visuo-Spatial Systems and Executive Function (EF)
1.3. Complexity and MSE in Normal and ‘Pathological’ Conditions
1.4. Emotional Regulation (ER) or Control in ASD and ADHD
2. Materials and Methods
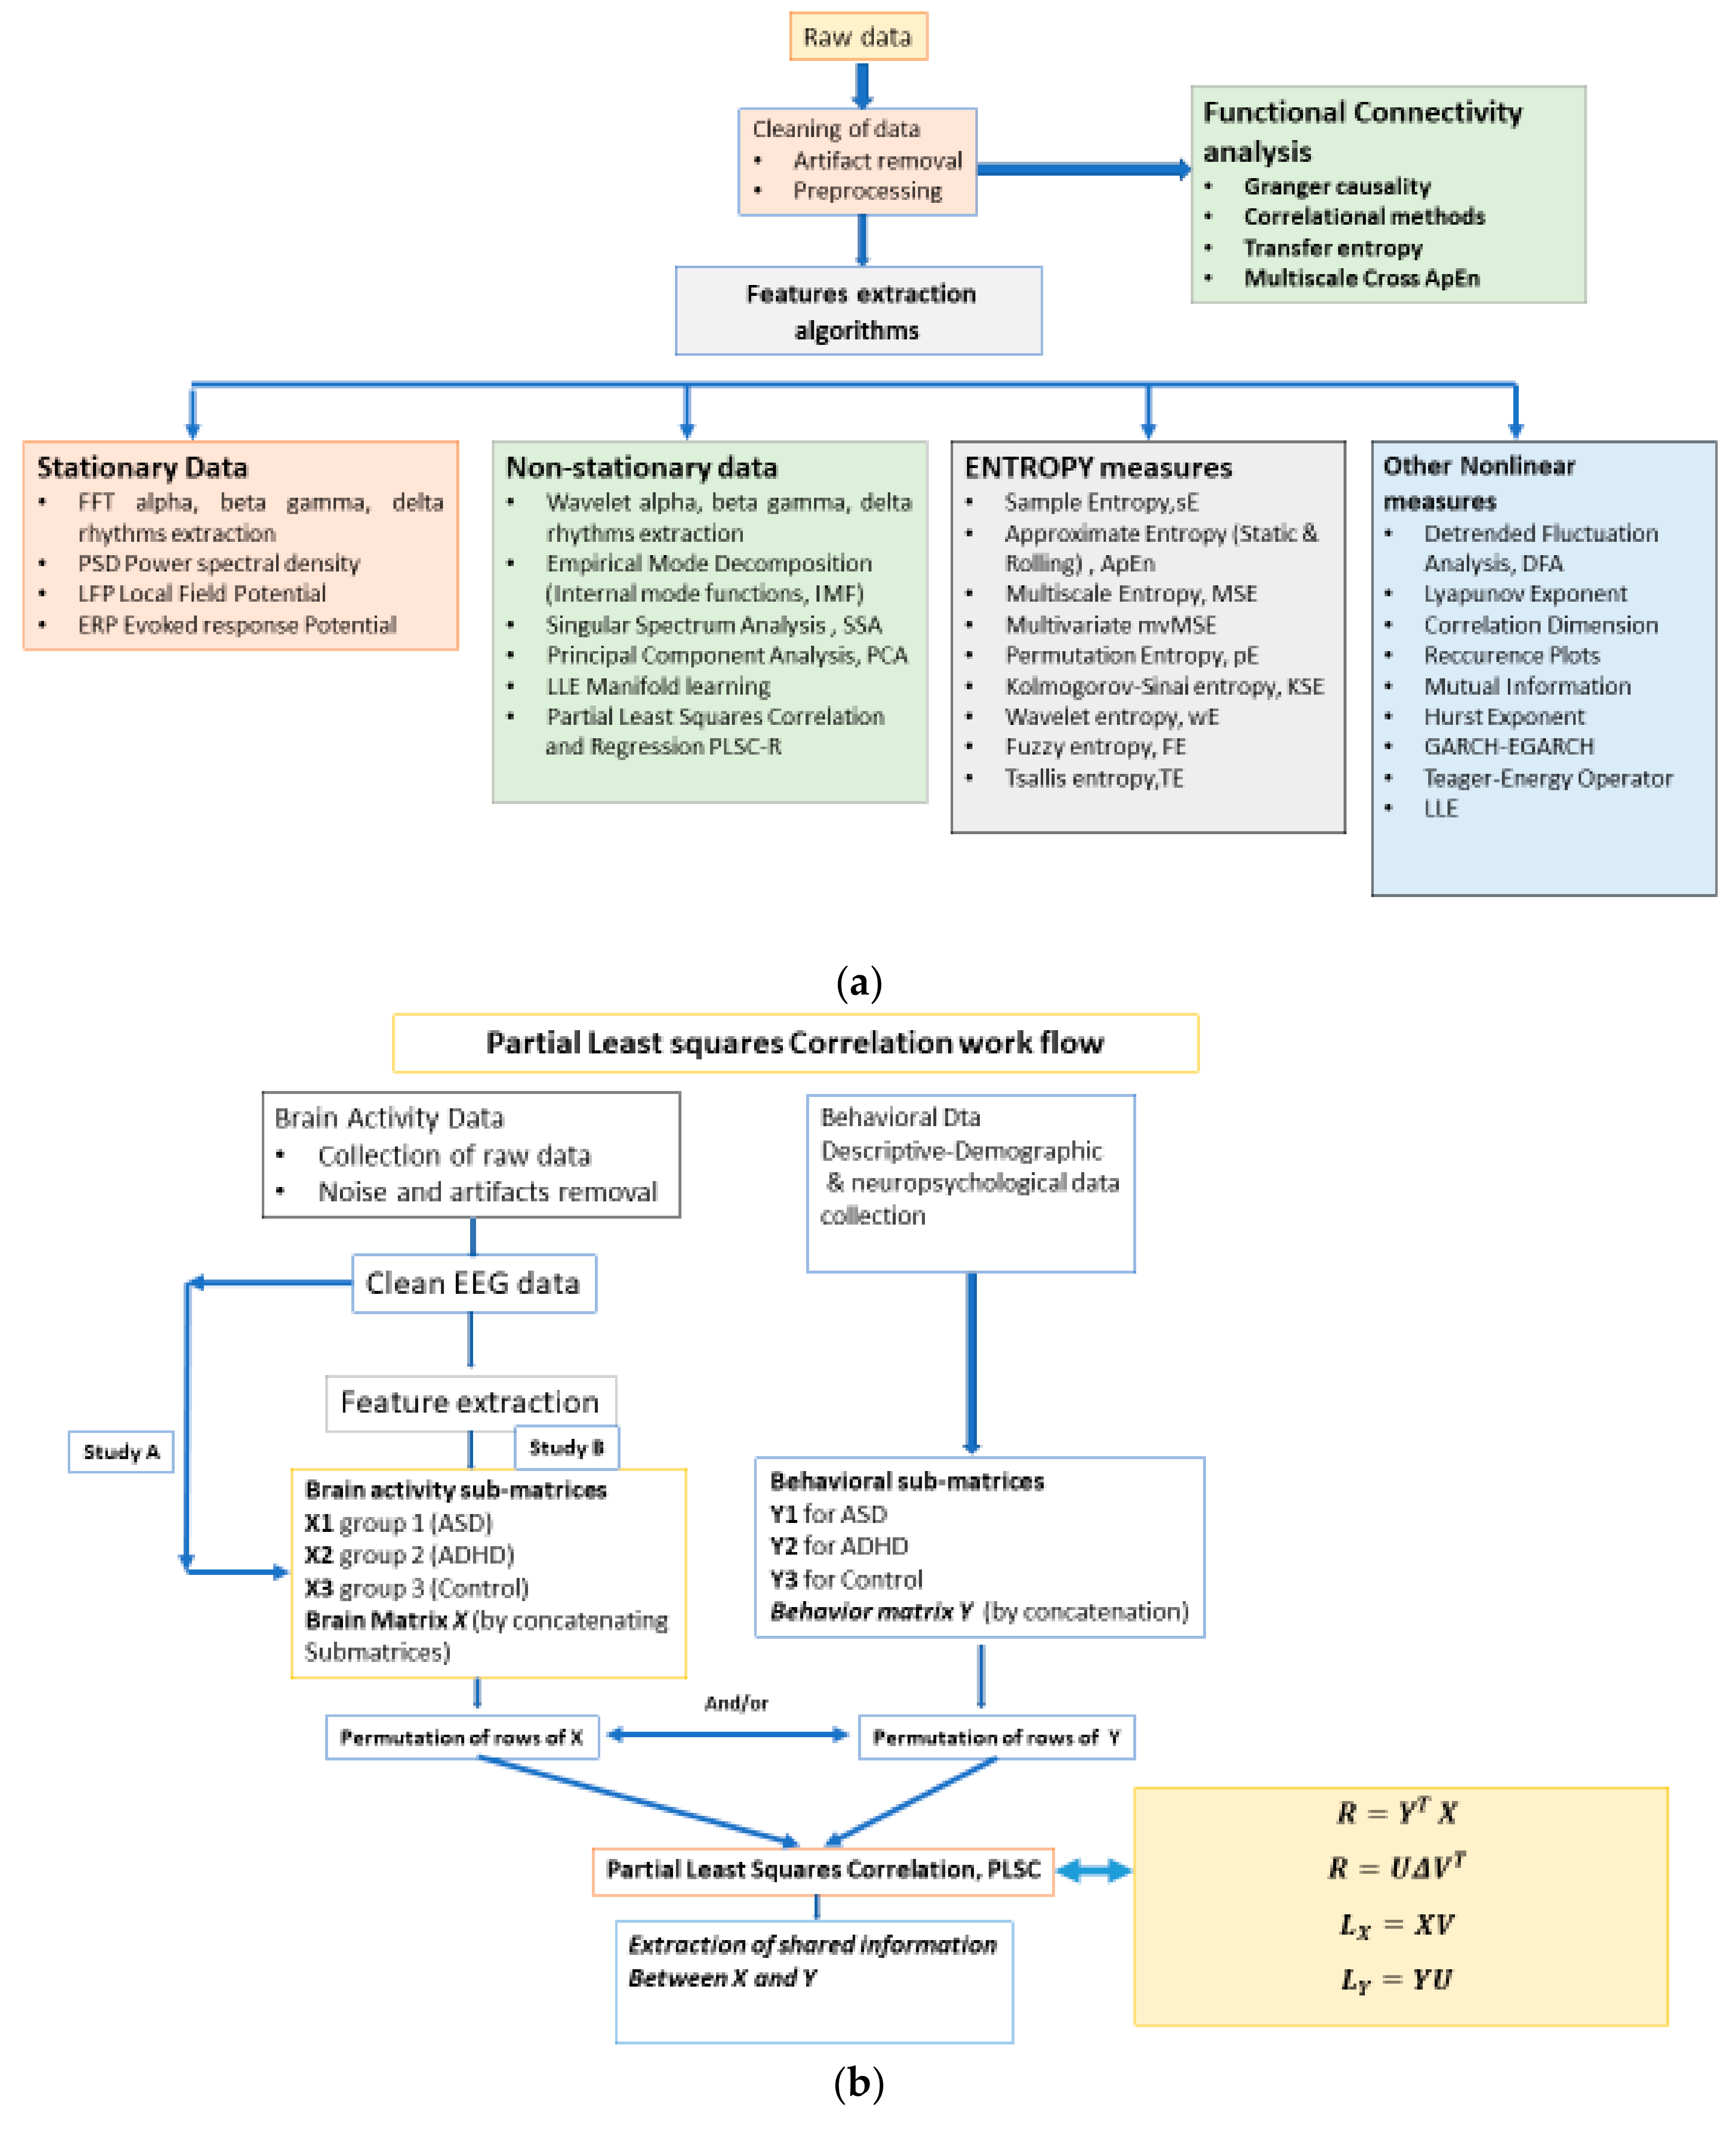
2.1. The Workflow
2.2. Participants
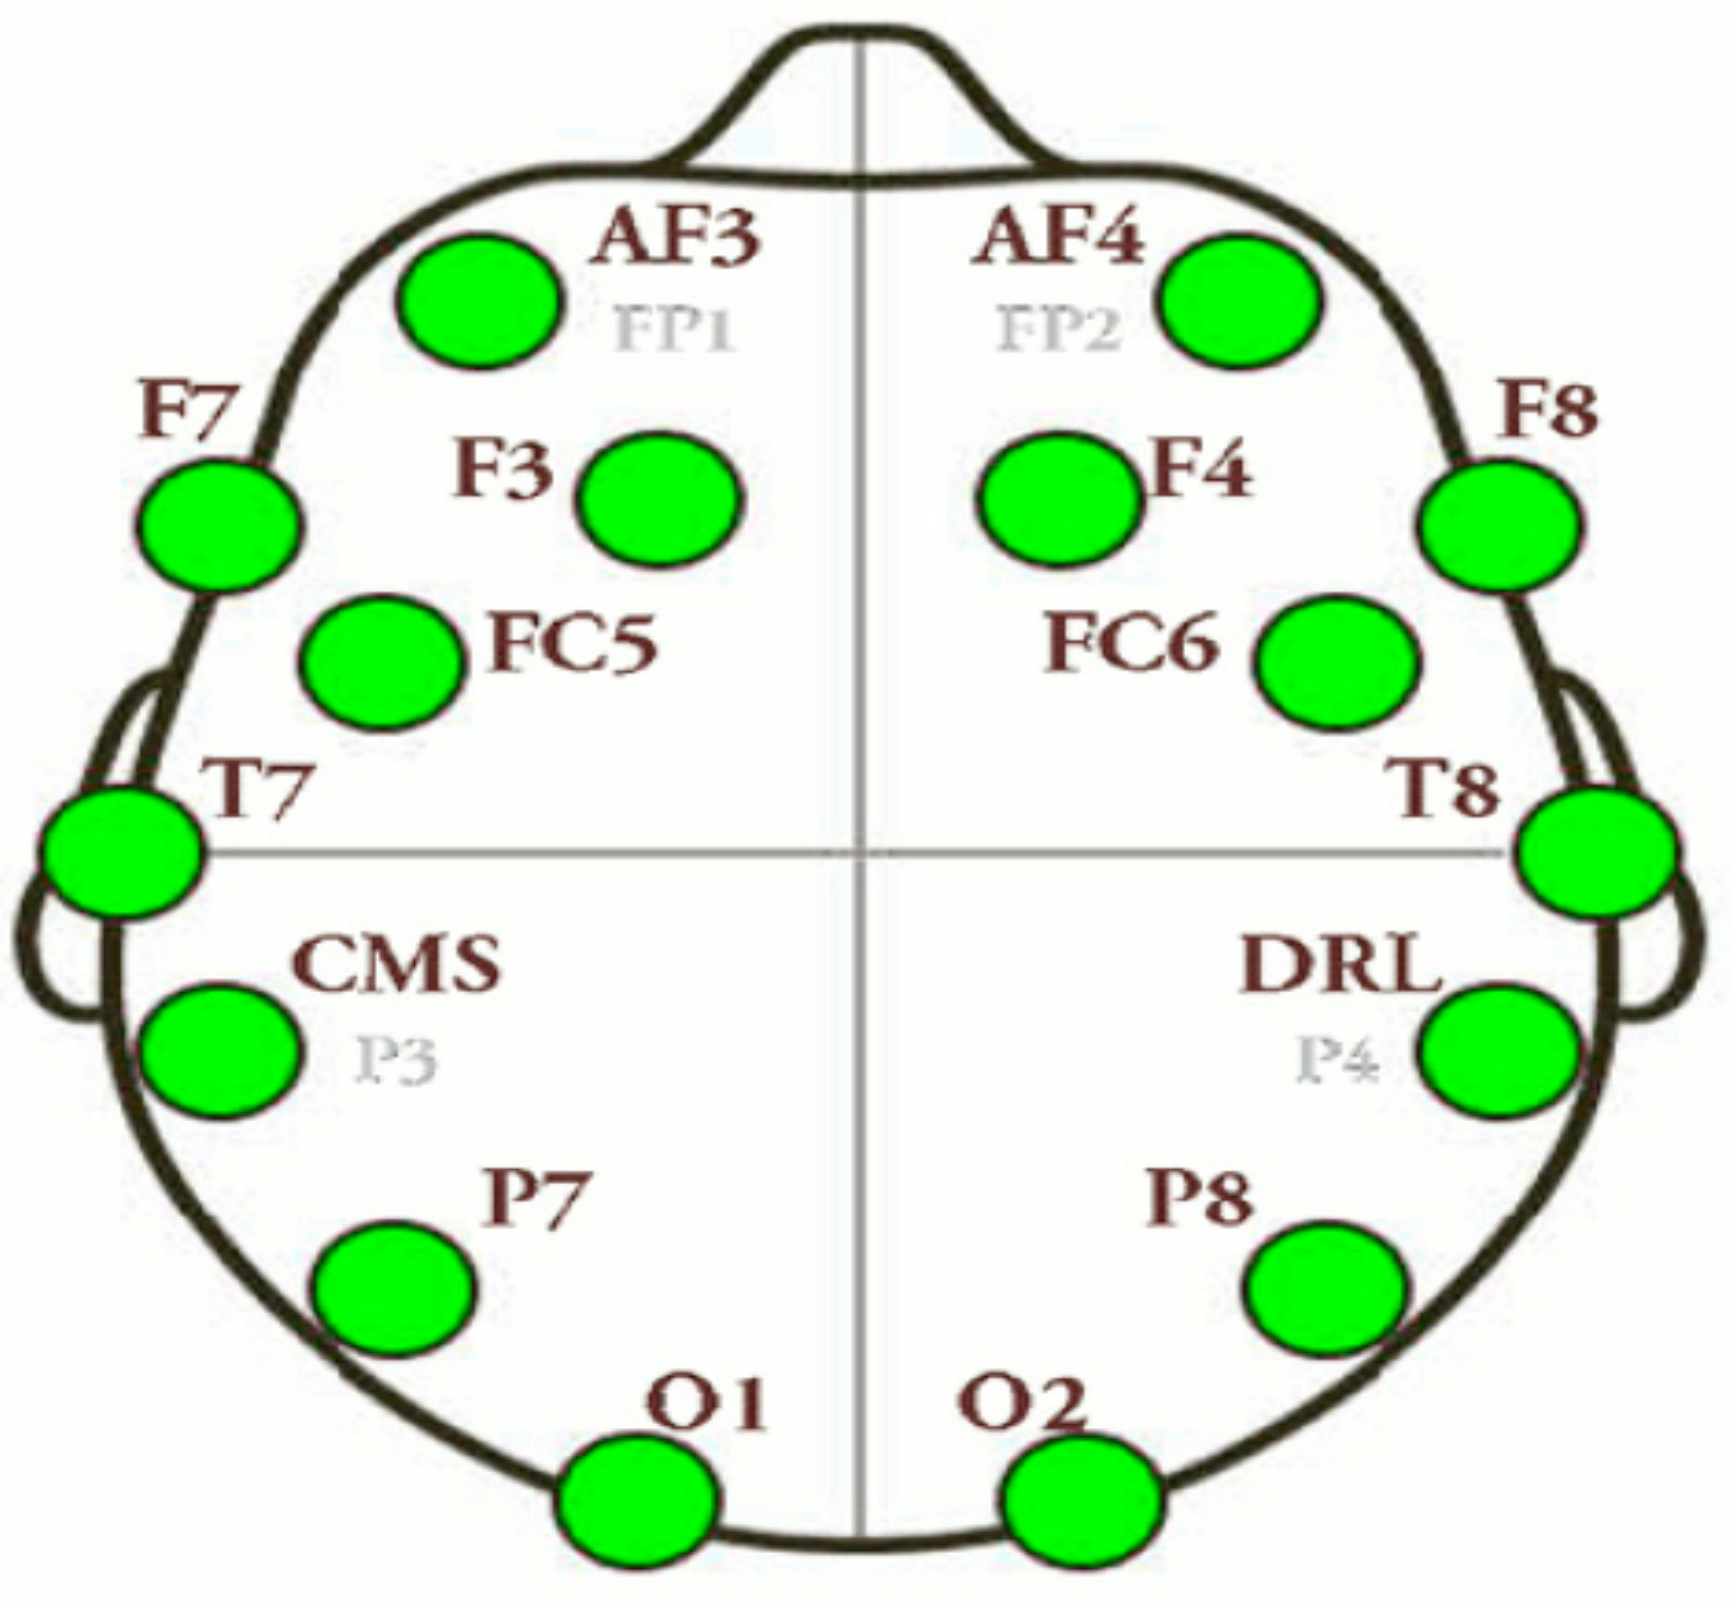
2.3. EEG Recordings
2.4. Tasks Description. The Aristotle Experiment
2.4.1. Stimuli and Procedures Stimuli
2.4.2. Behavioral Data and Procedure
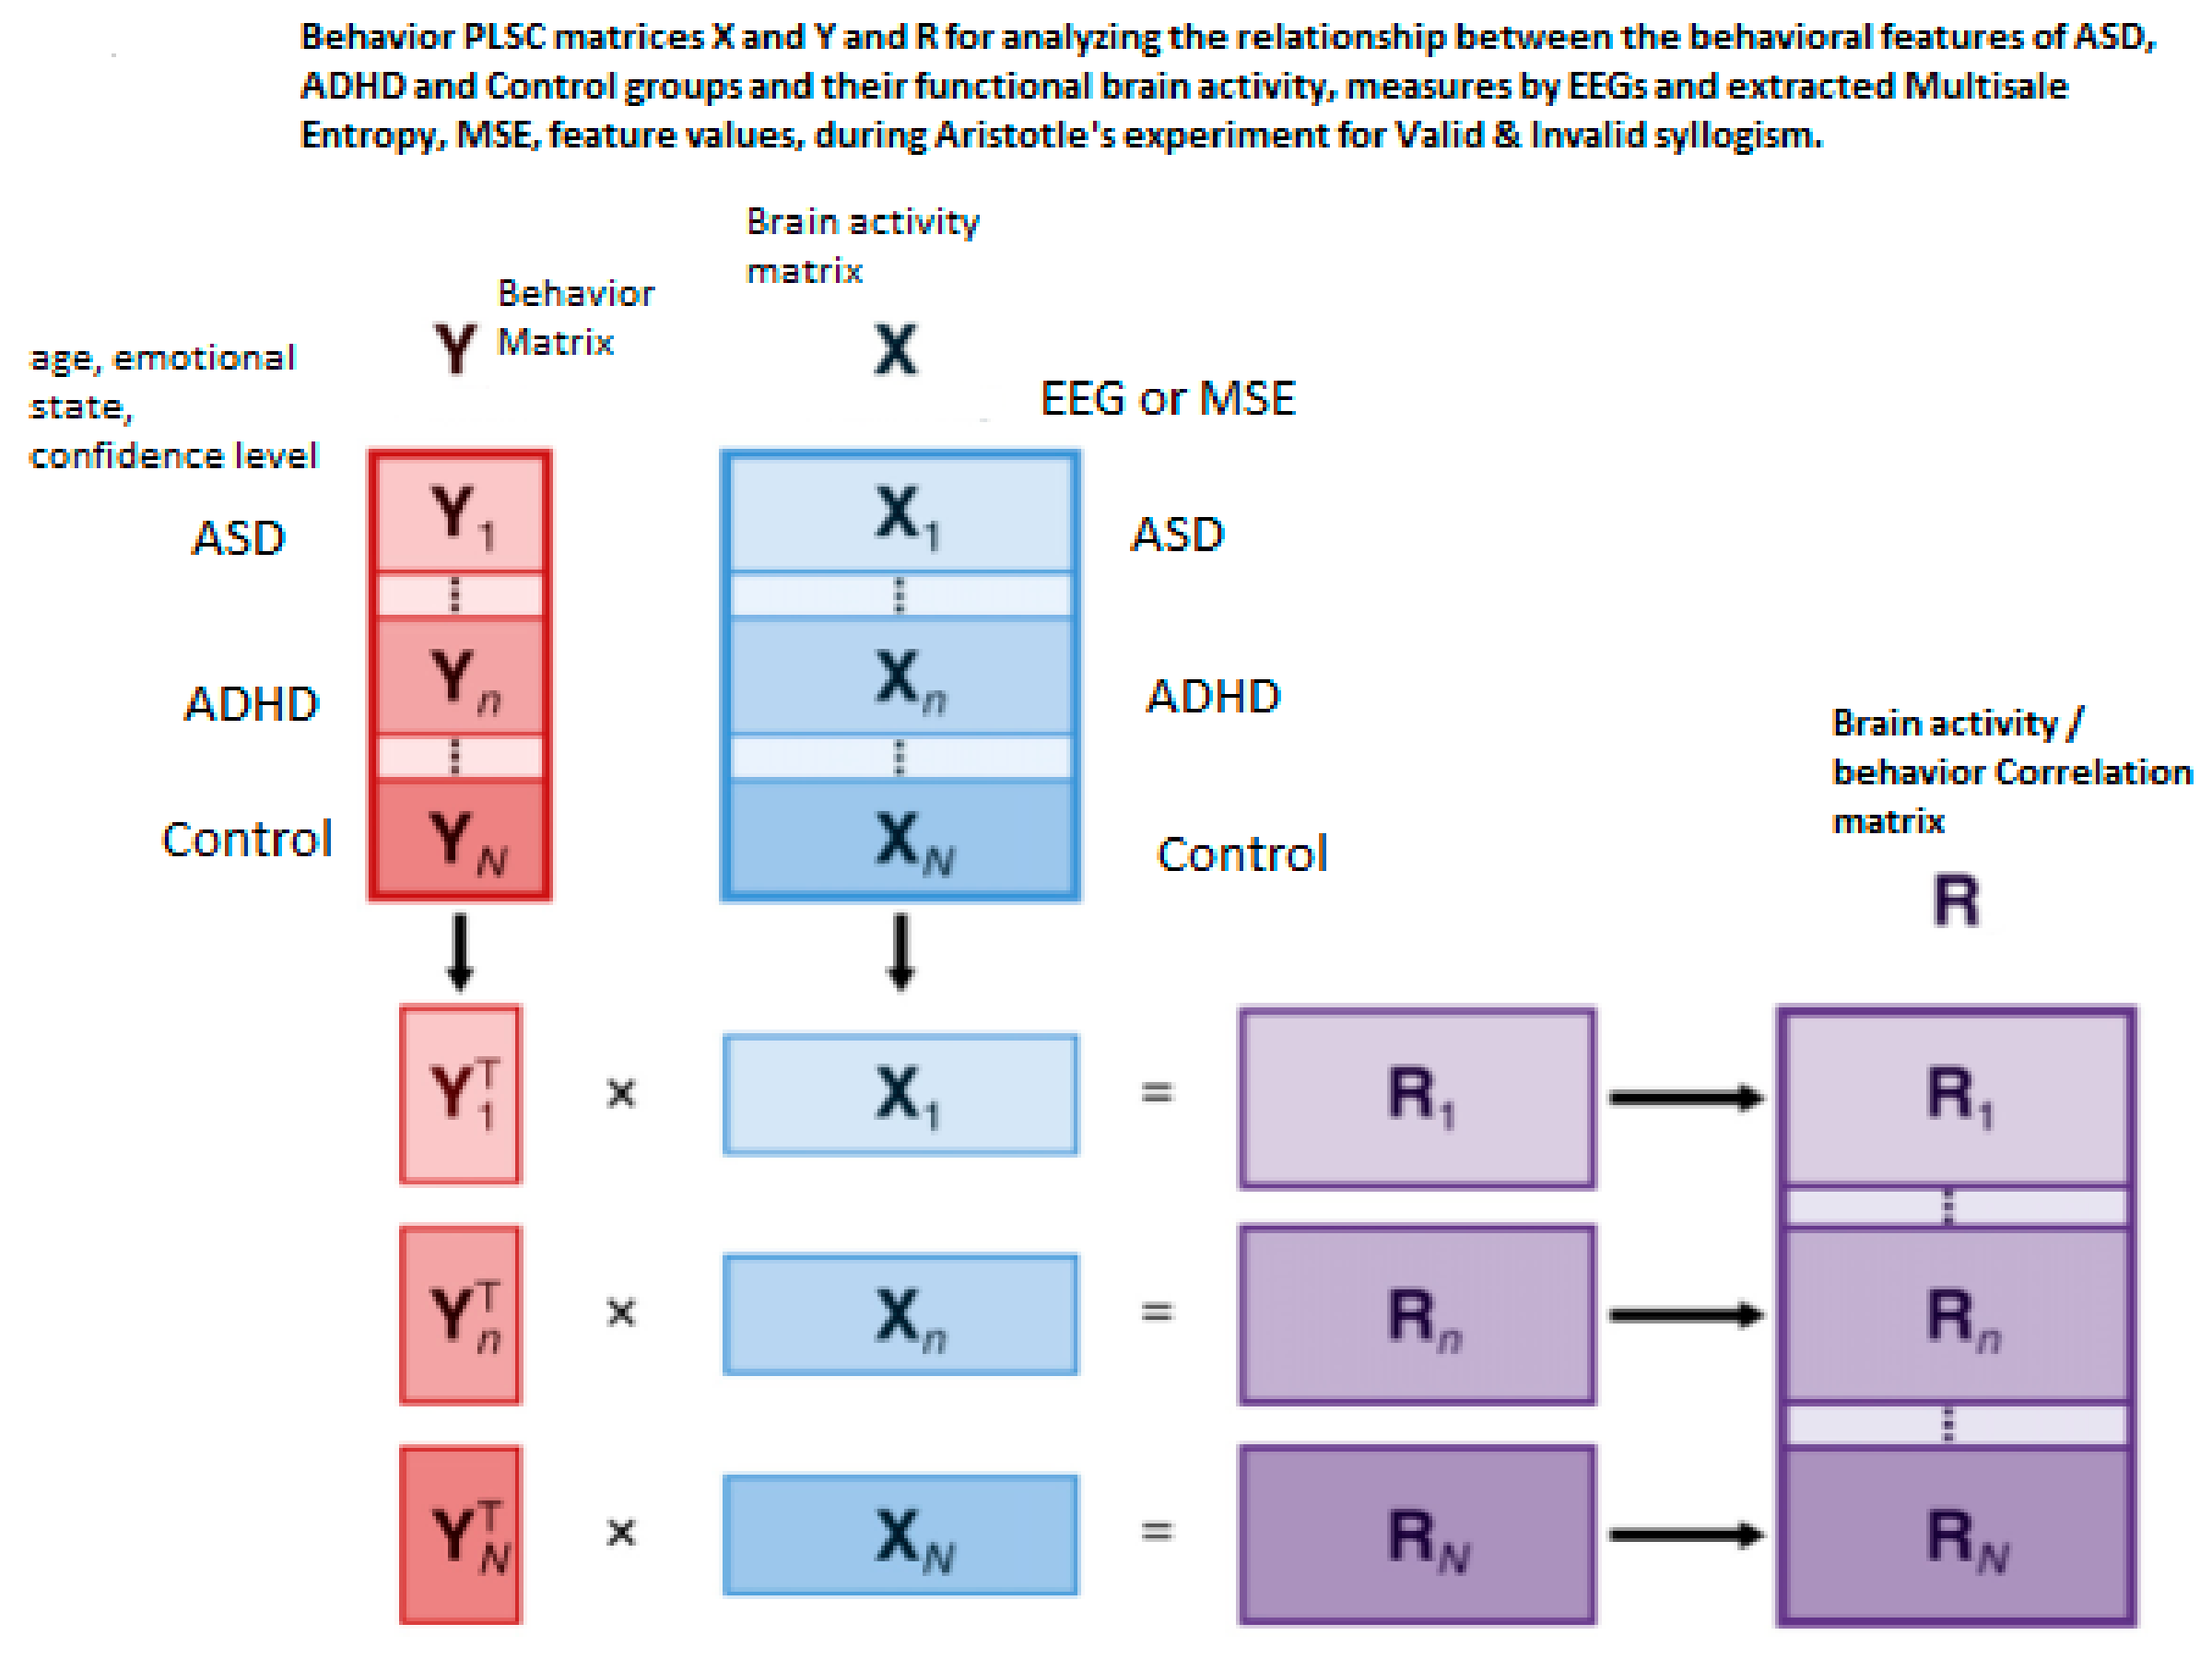
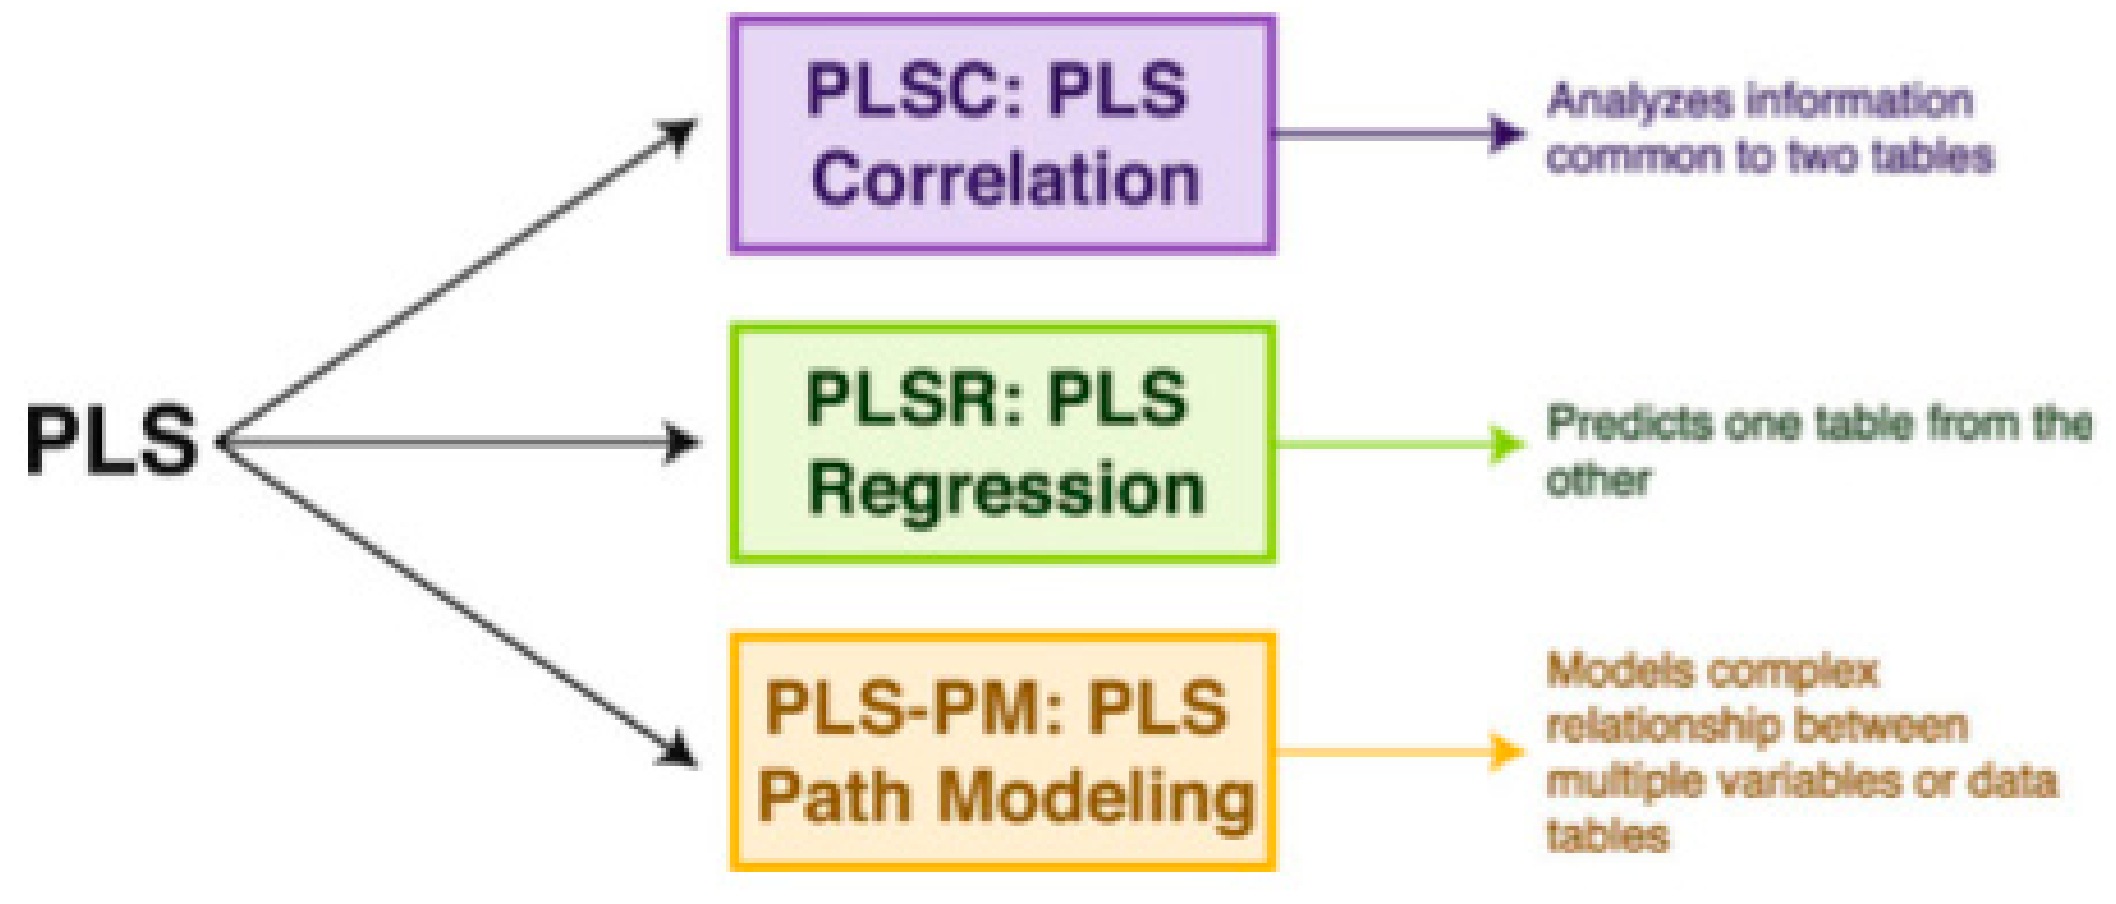
2.5. The Partial Least Square Correlation (PLSC) Method
2.5.1. Common Inertia in PLSC and Significance of Inferences in PLSC and Permutation Test
2.5.2. Brain Functional Connectivity Analysis via Seed-PLSC within the Default Model Network (DMN). ASD and ADHD Abnormalities in DMN’s Connectivity
DMN
Seed-PLS Functional Connectivity and DMN
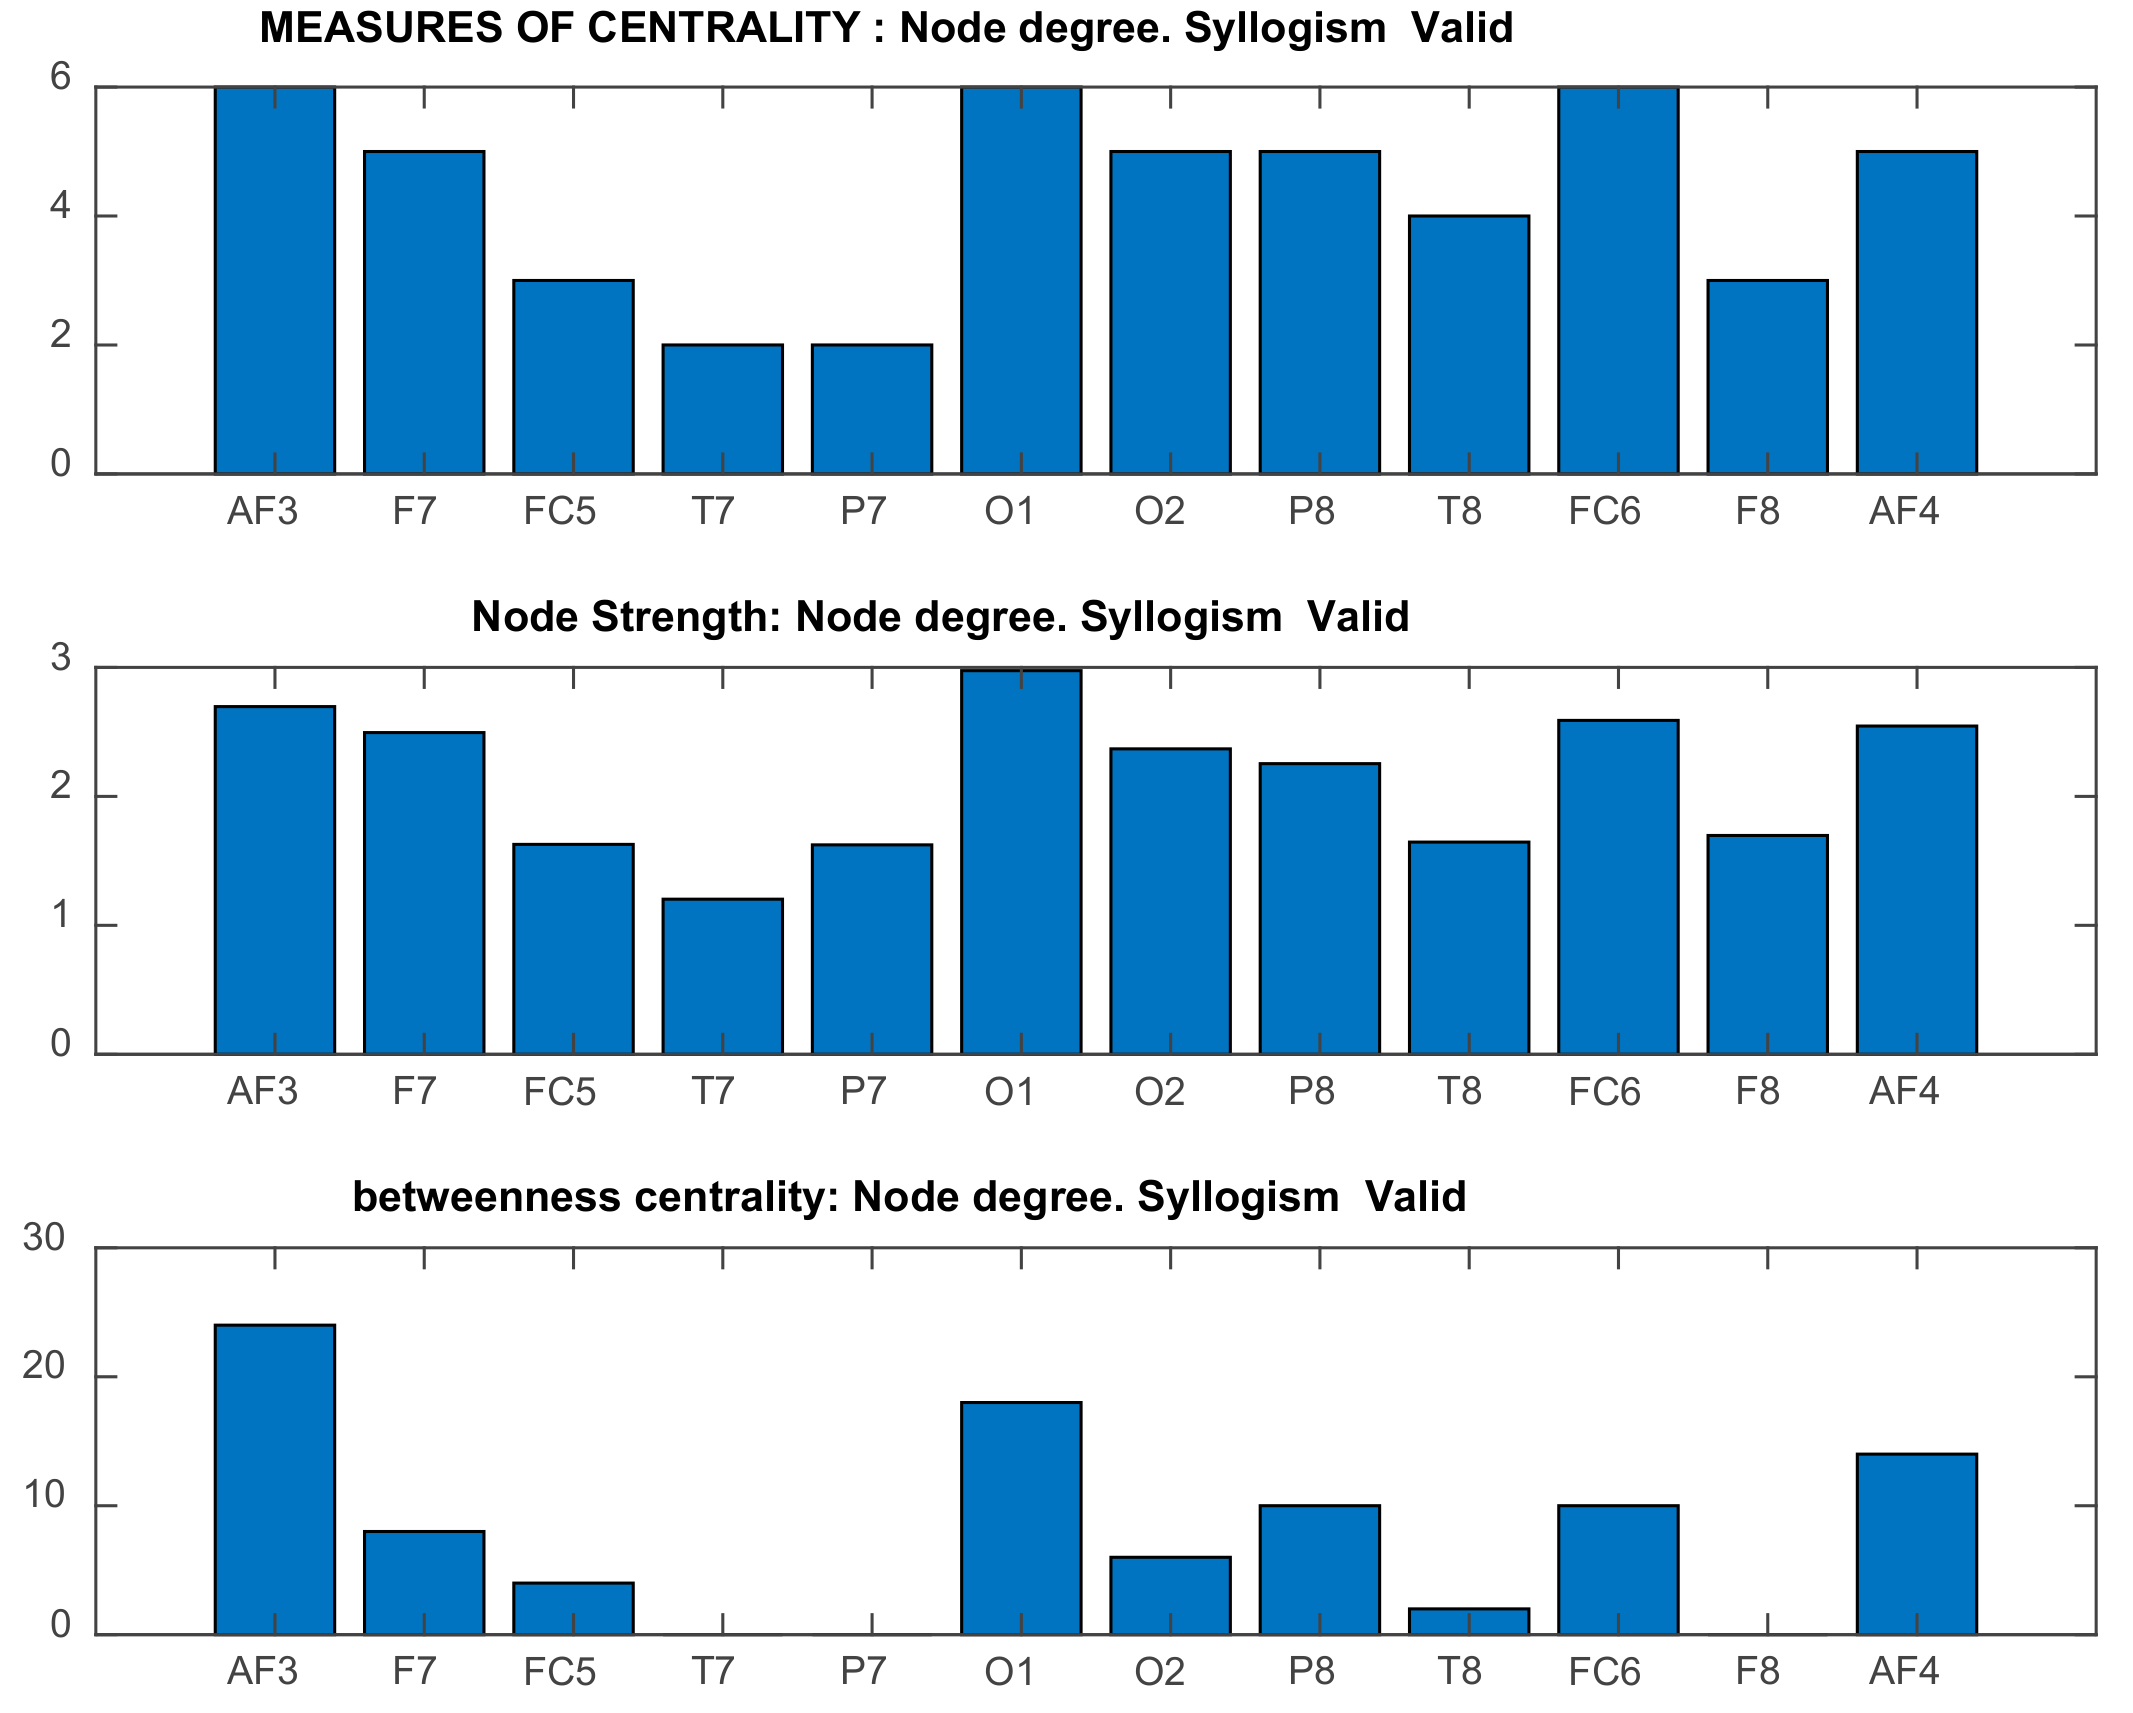
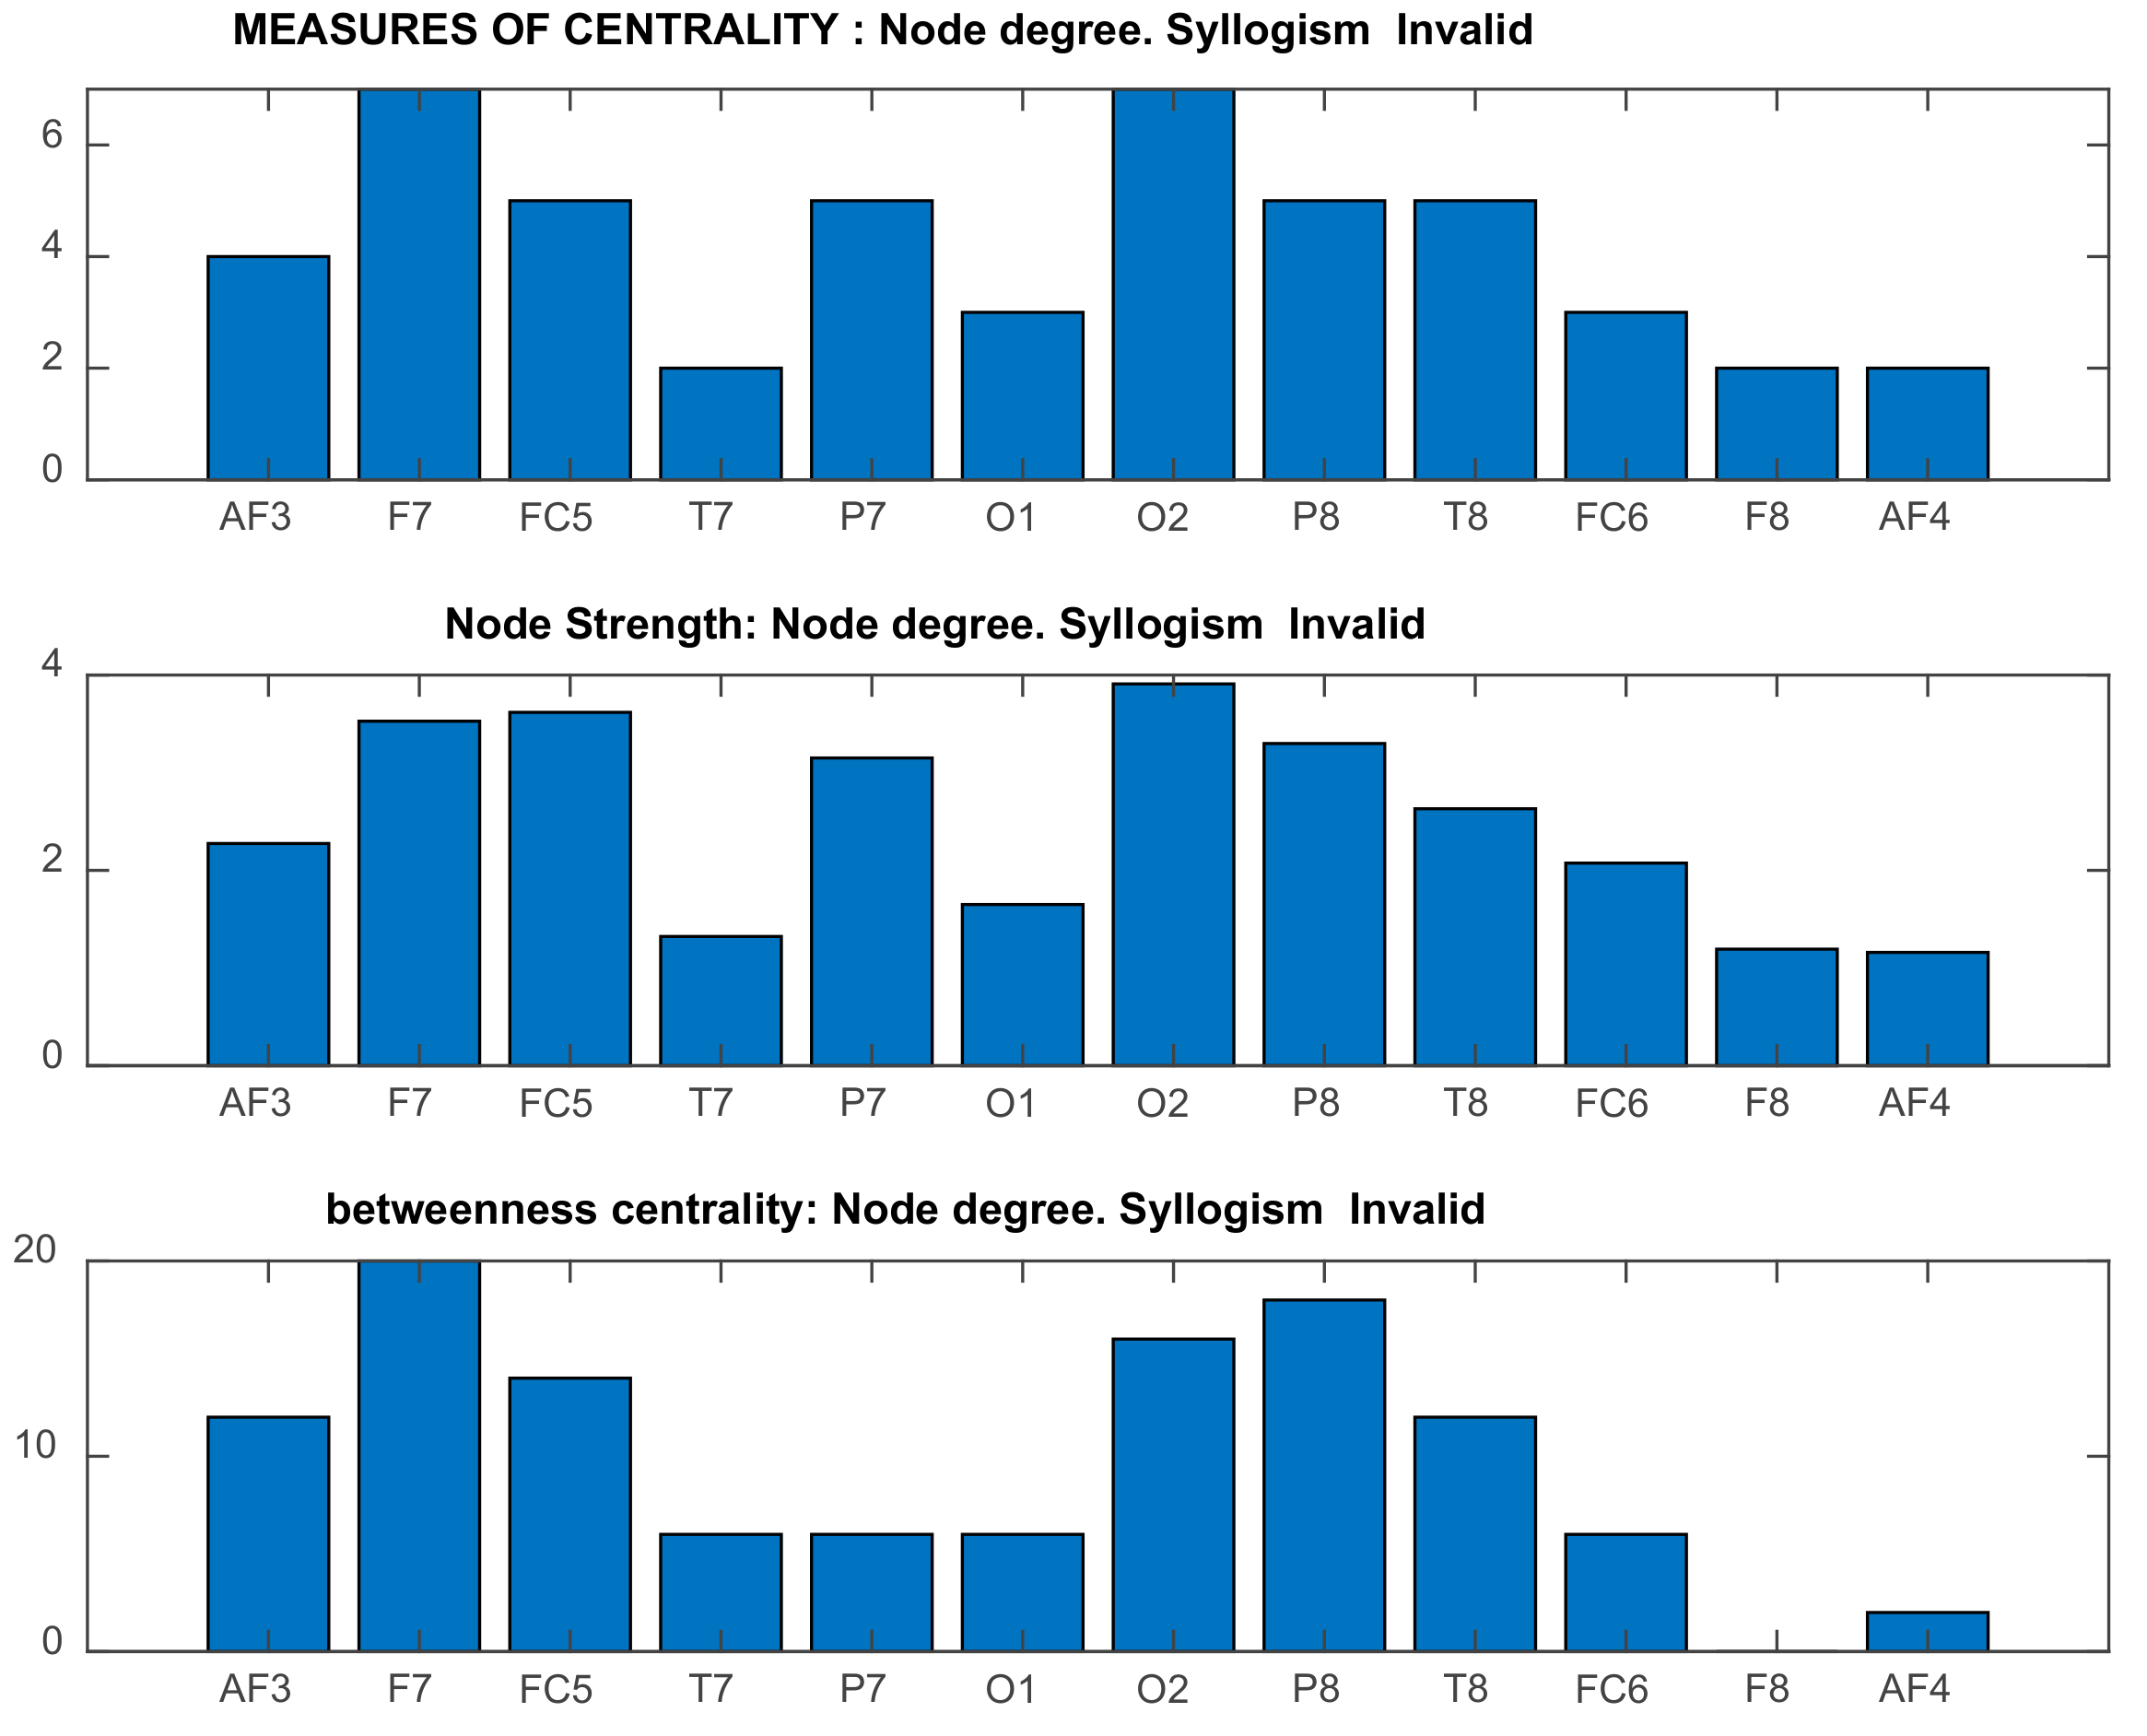
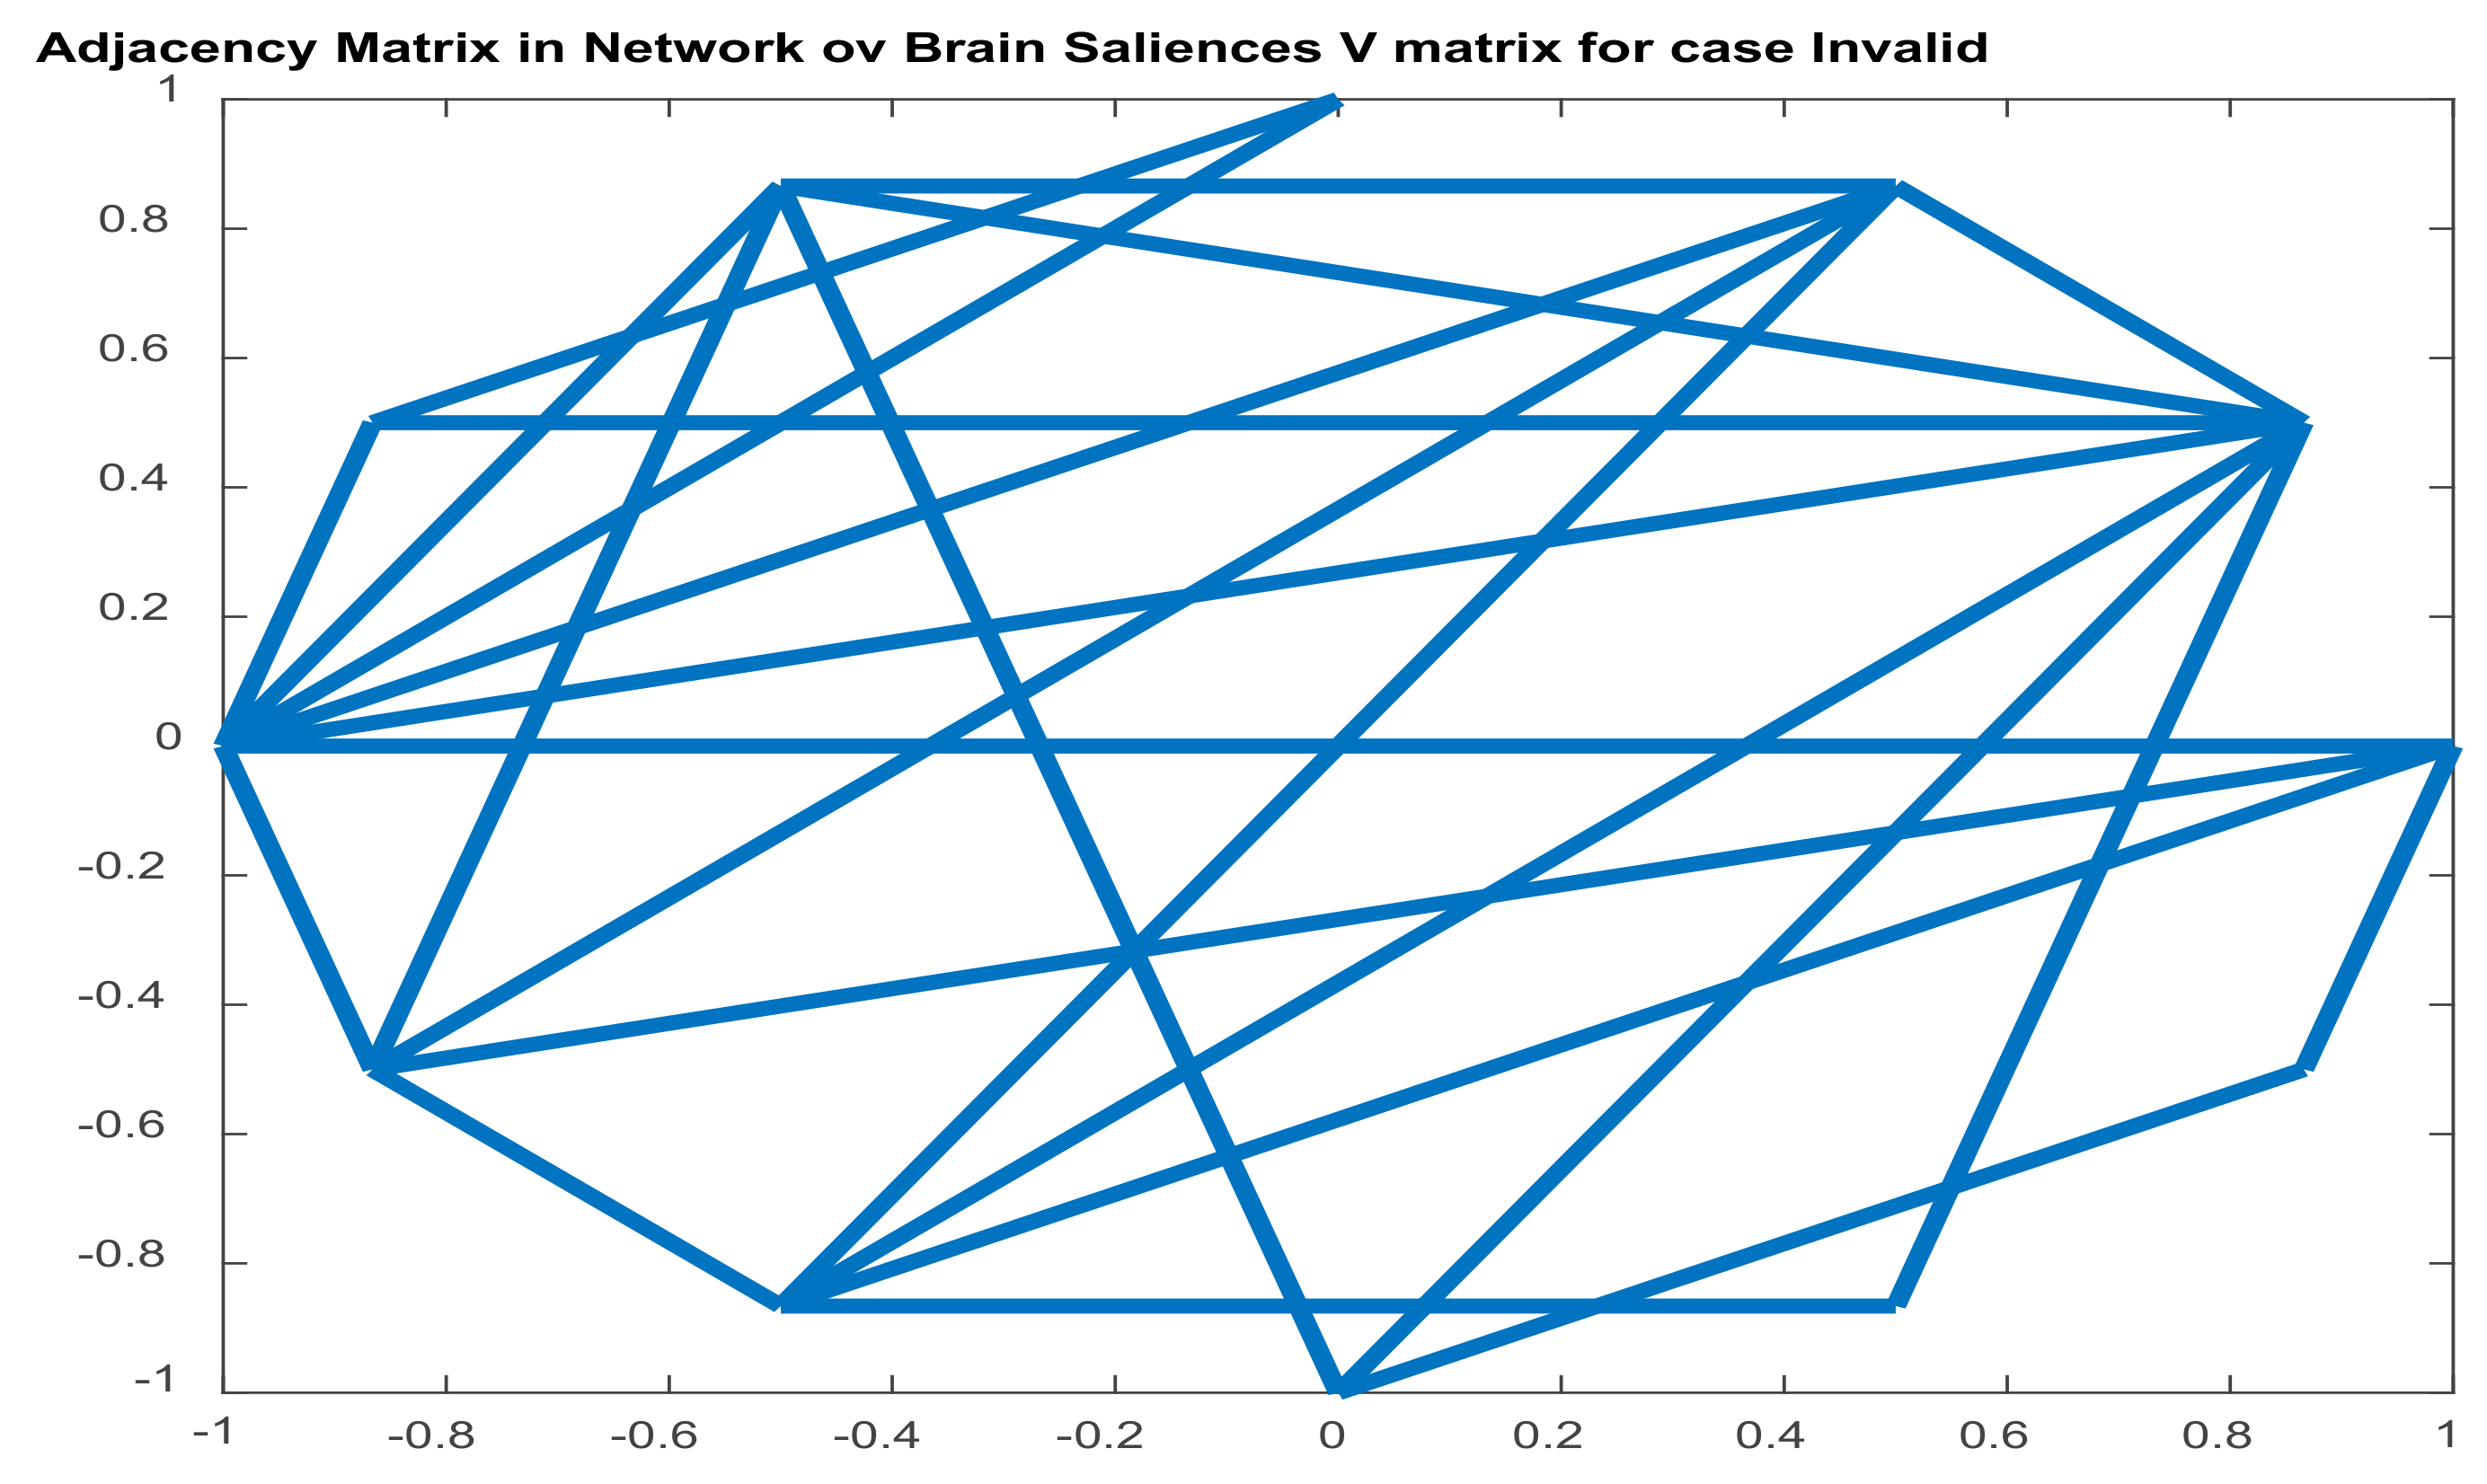
2.5.3. Graph-Theoretic, Functional Connectivity Measures Applied on Seed Brain Salience Matrix V
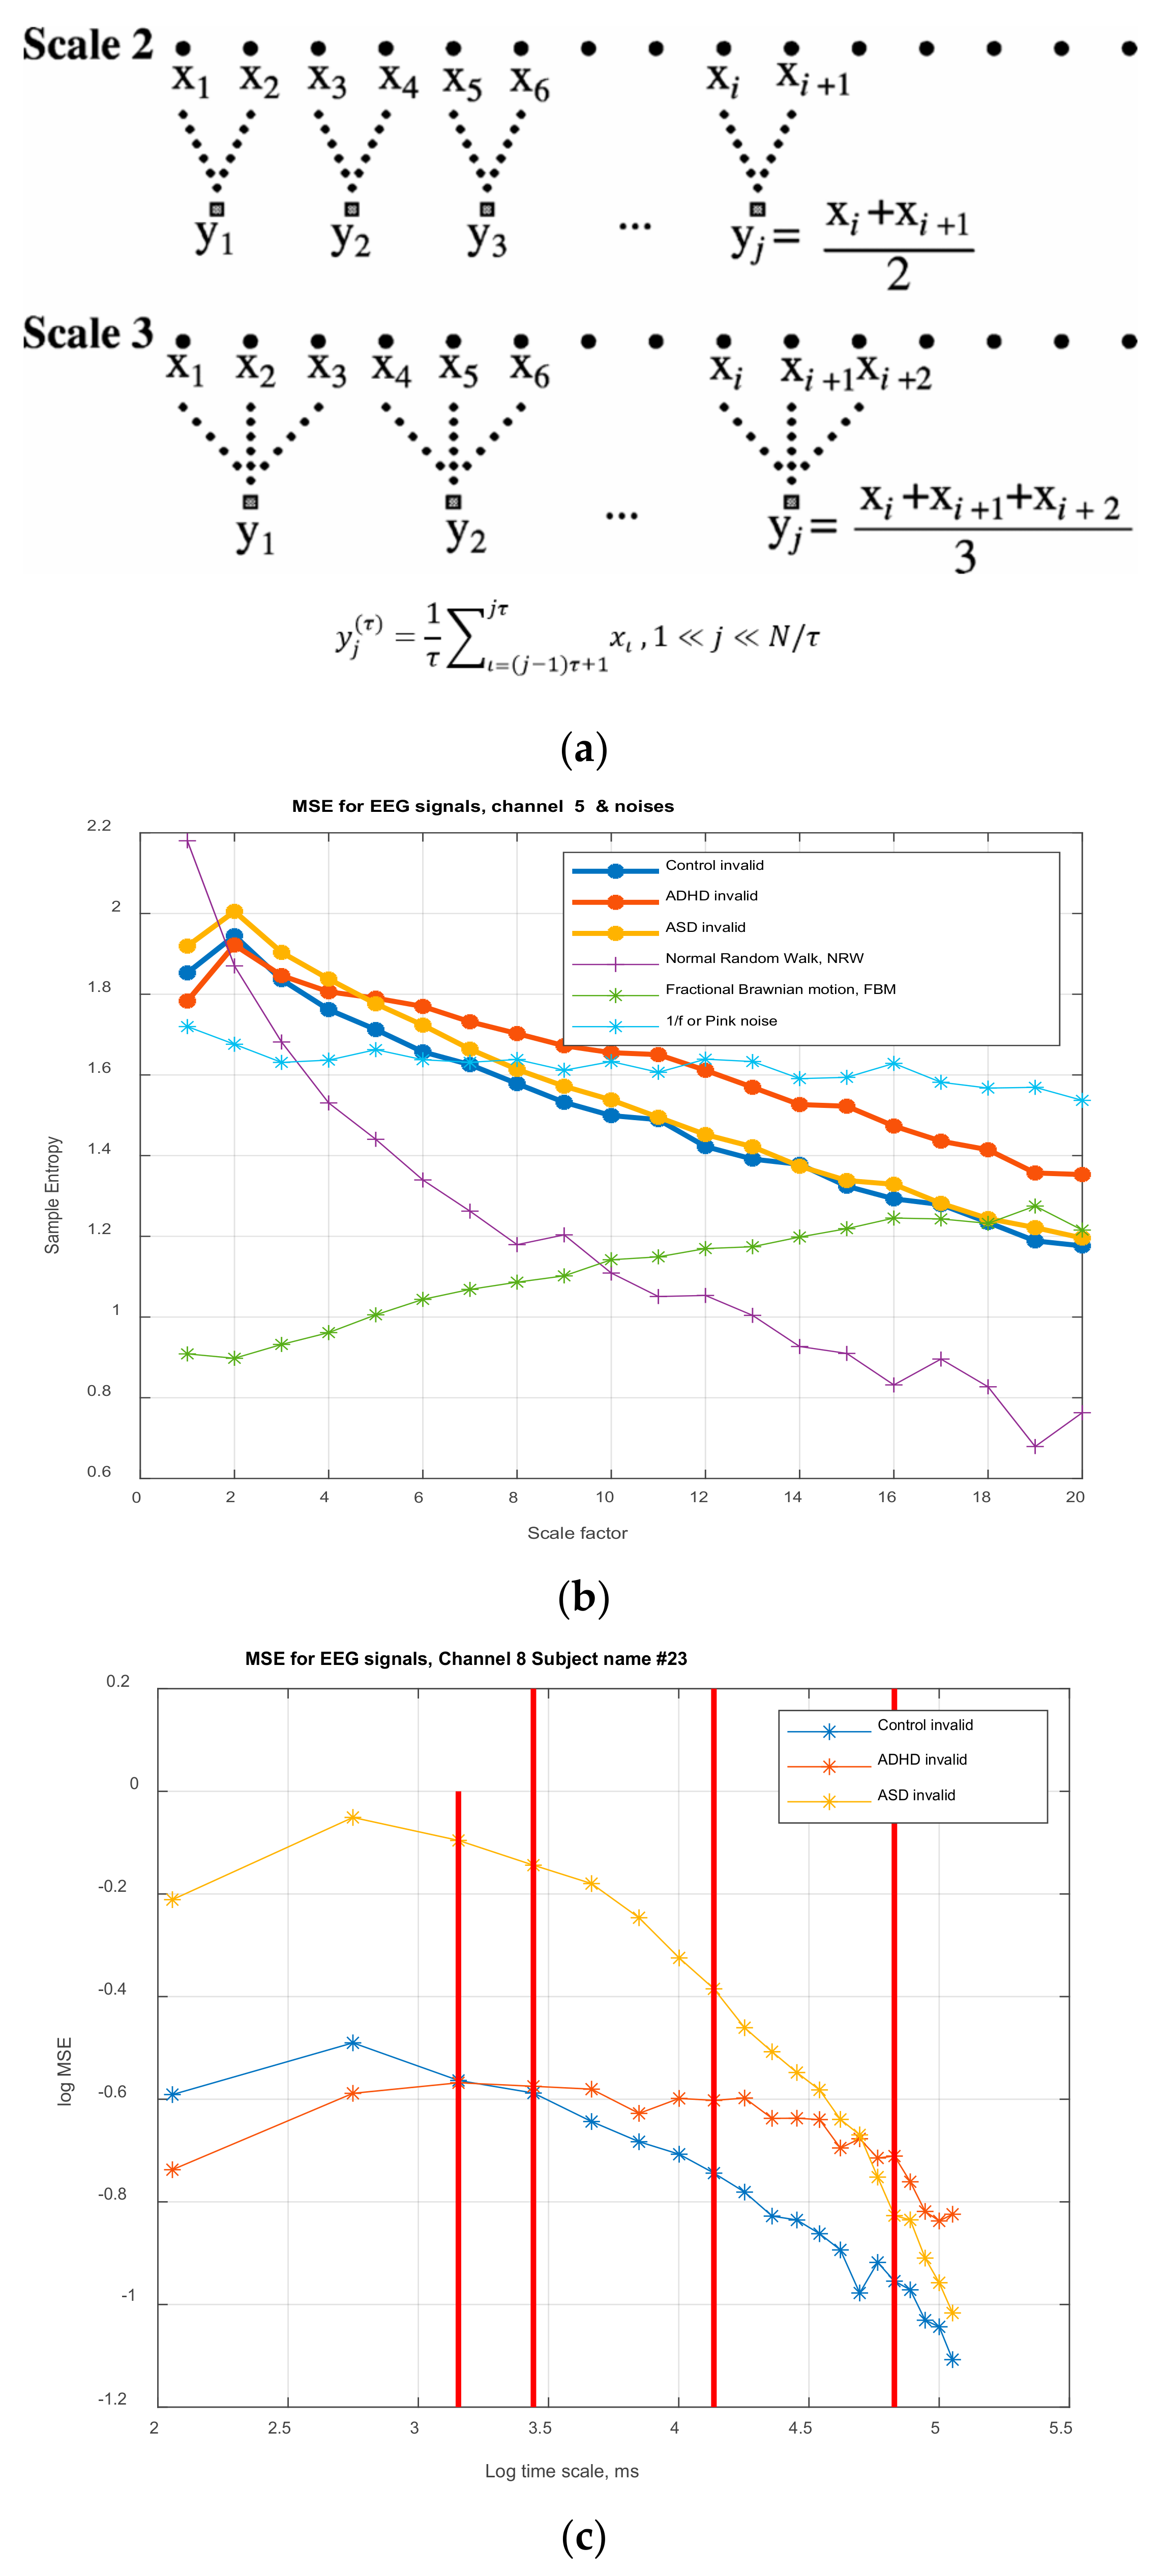
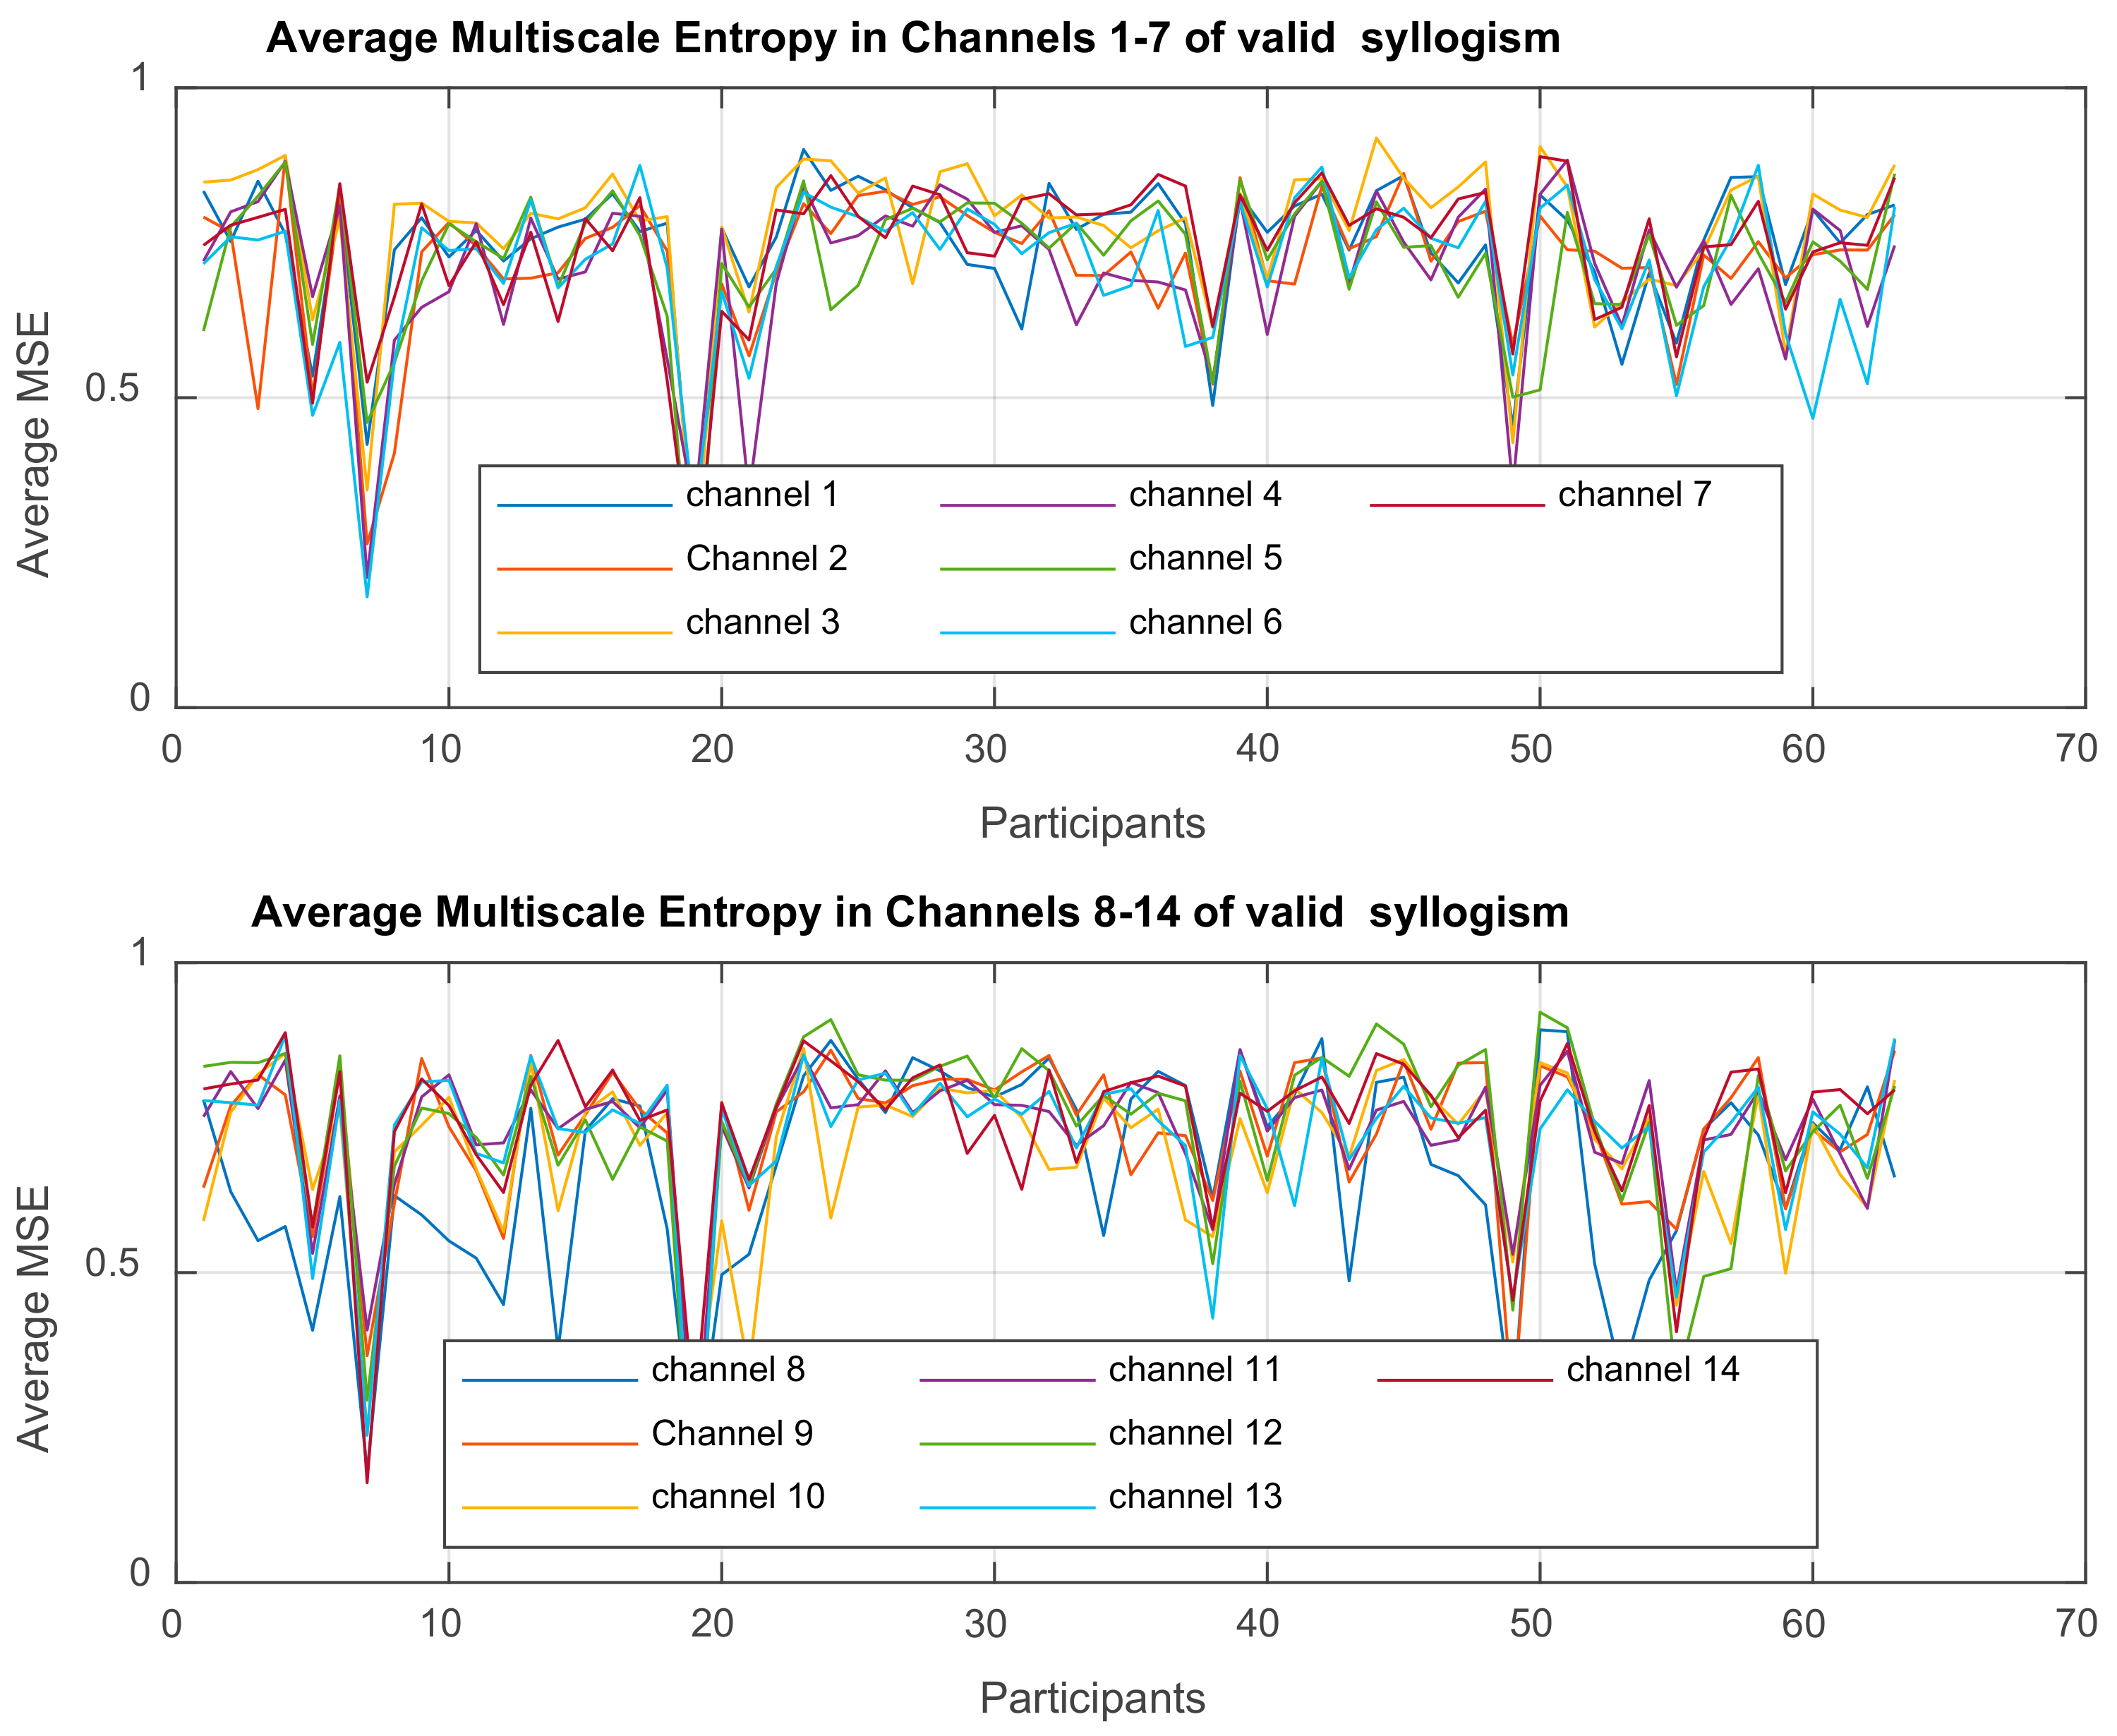
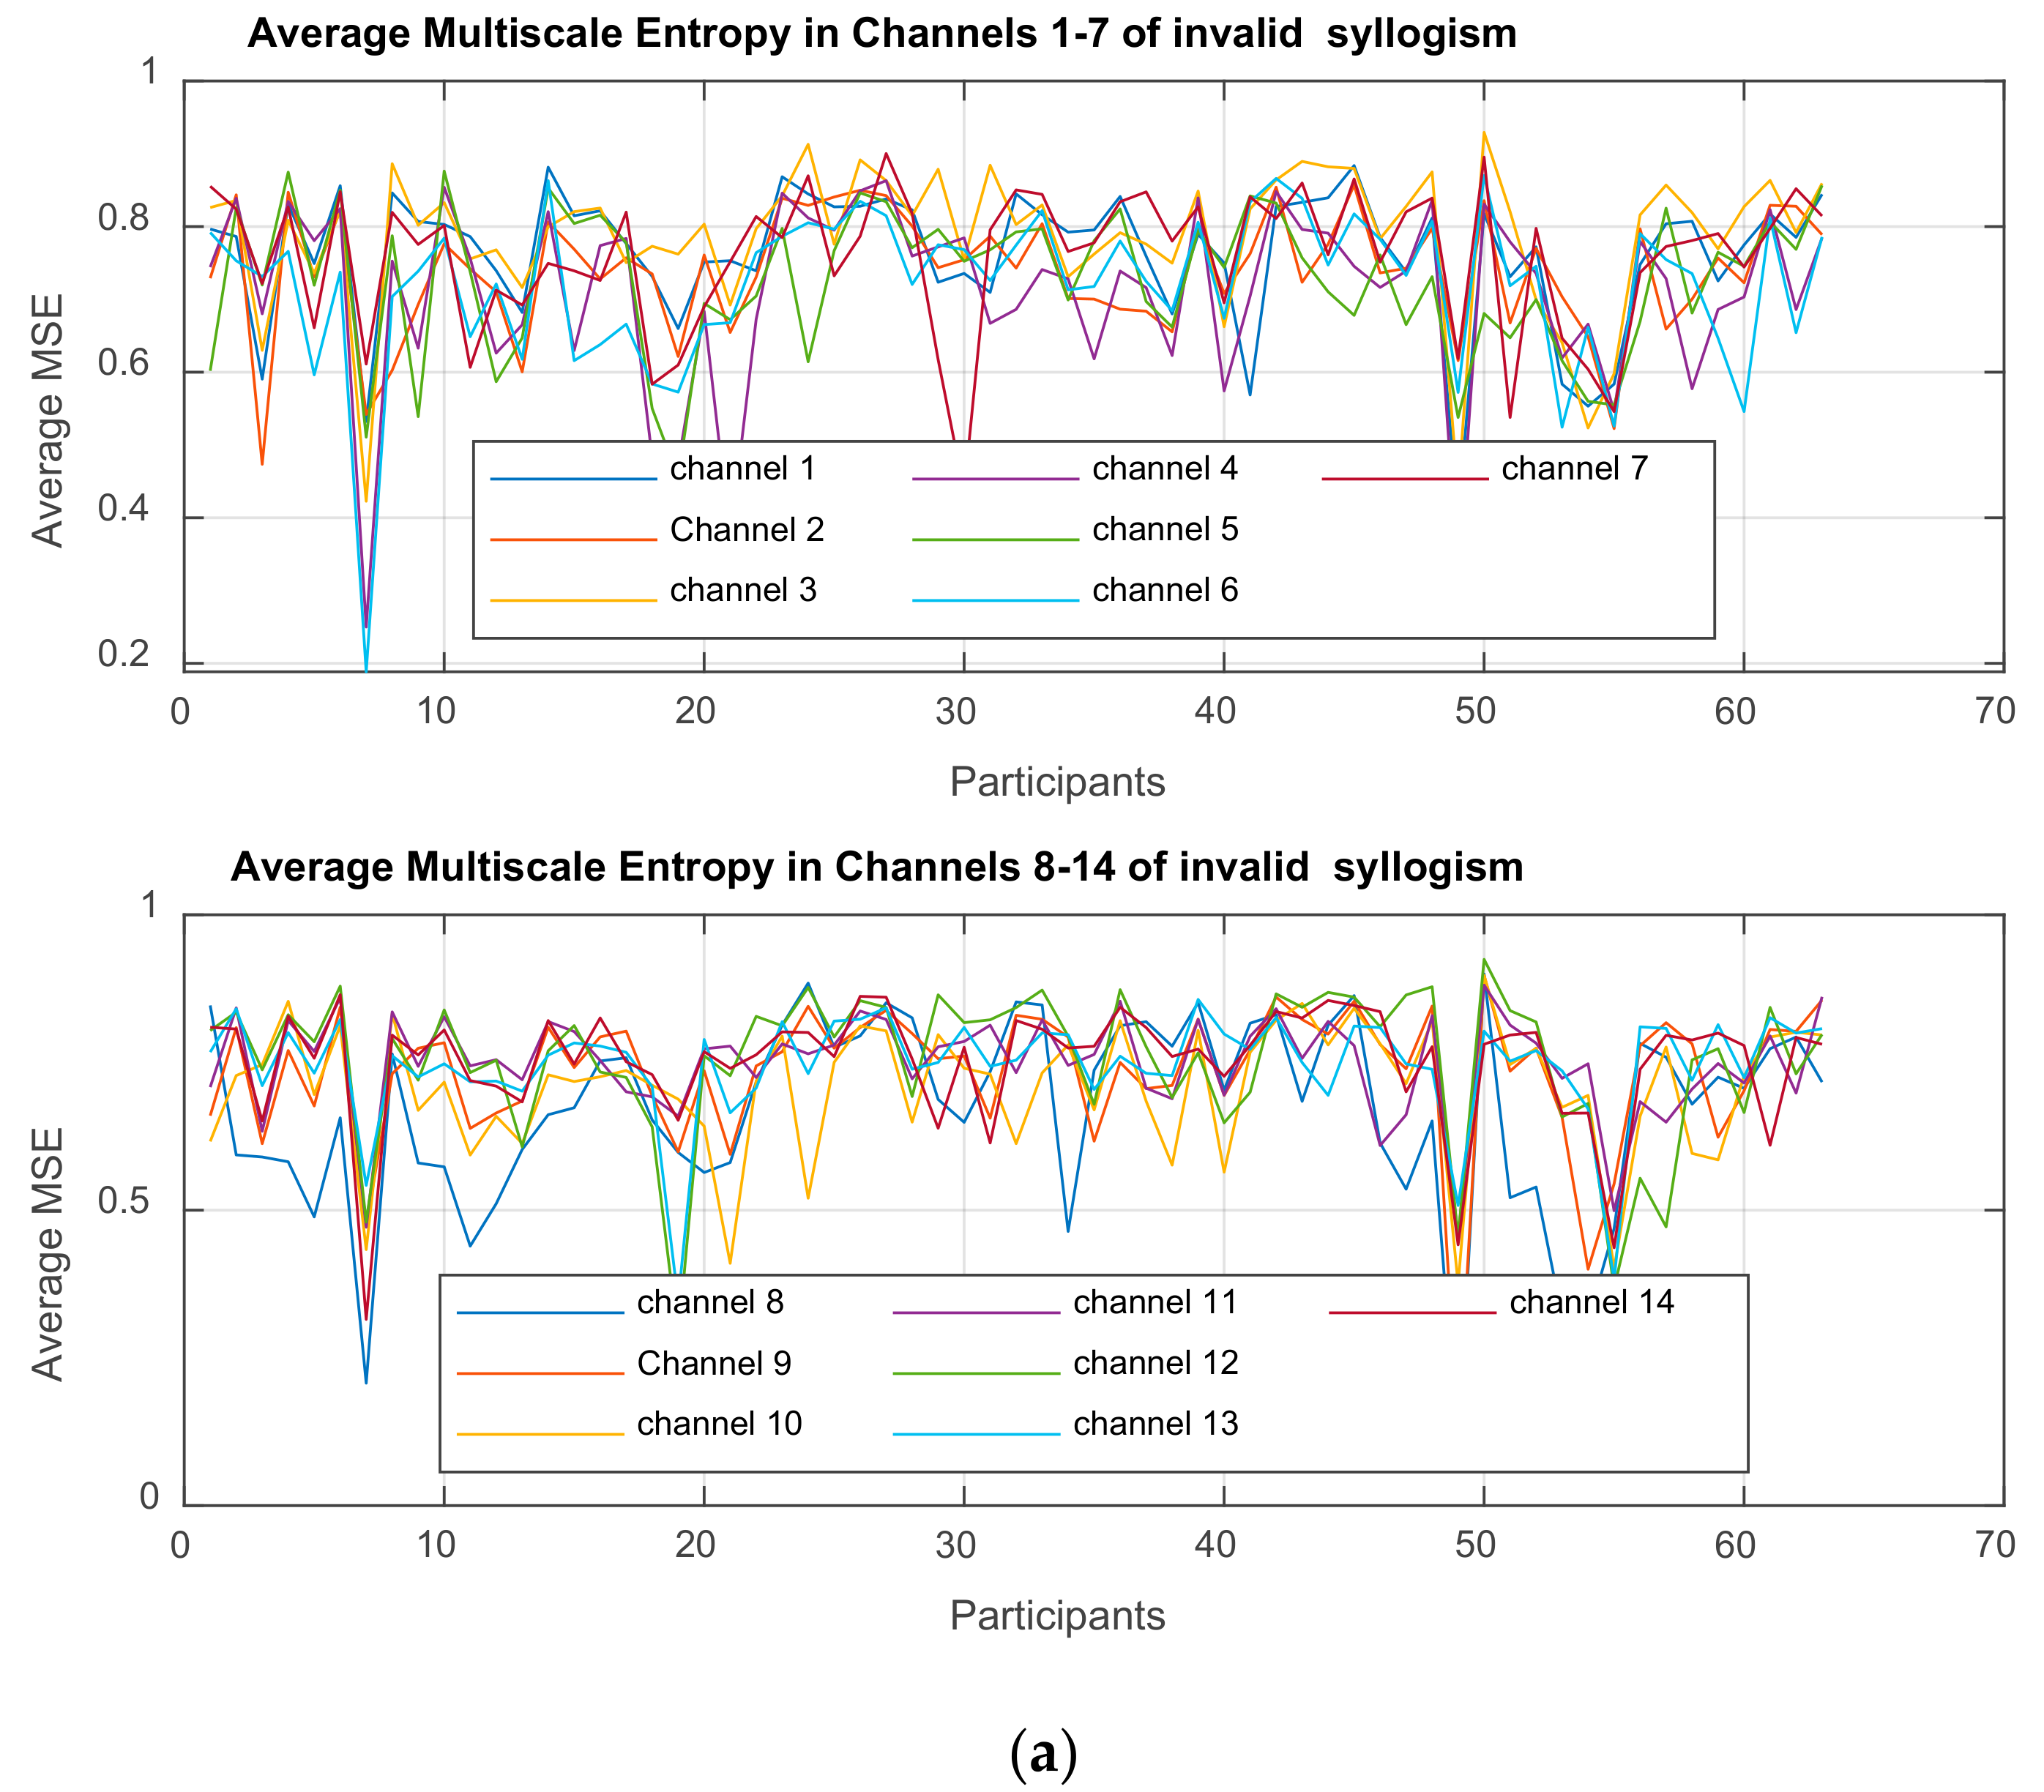
Multiscale Entropy MSE
is computed for each time-series

3. Results
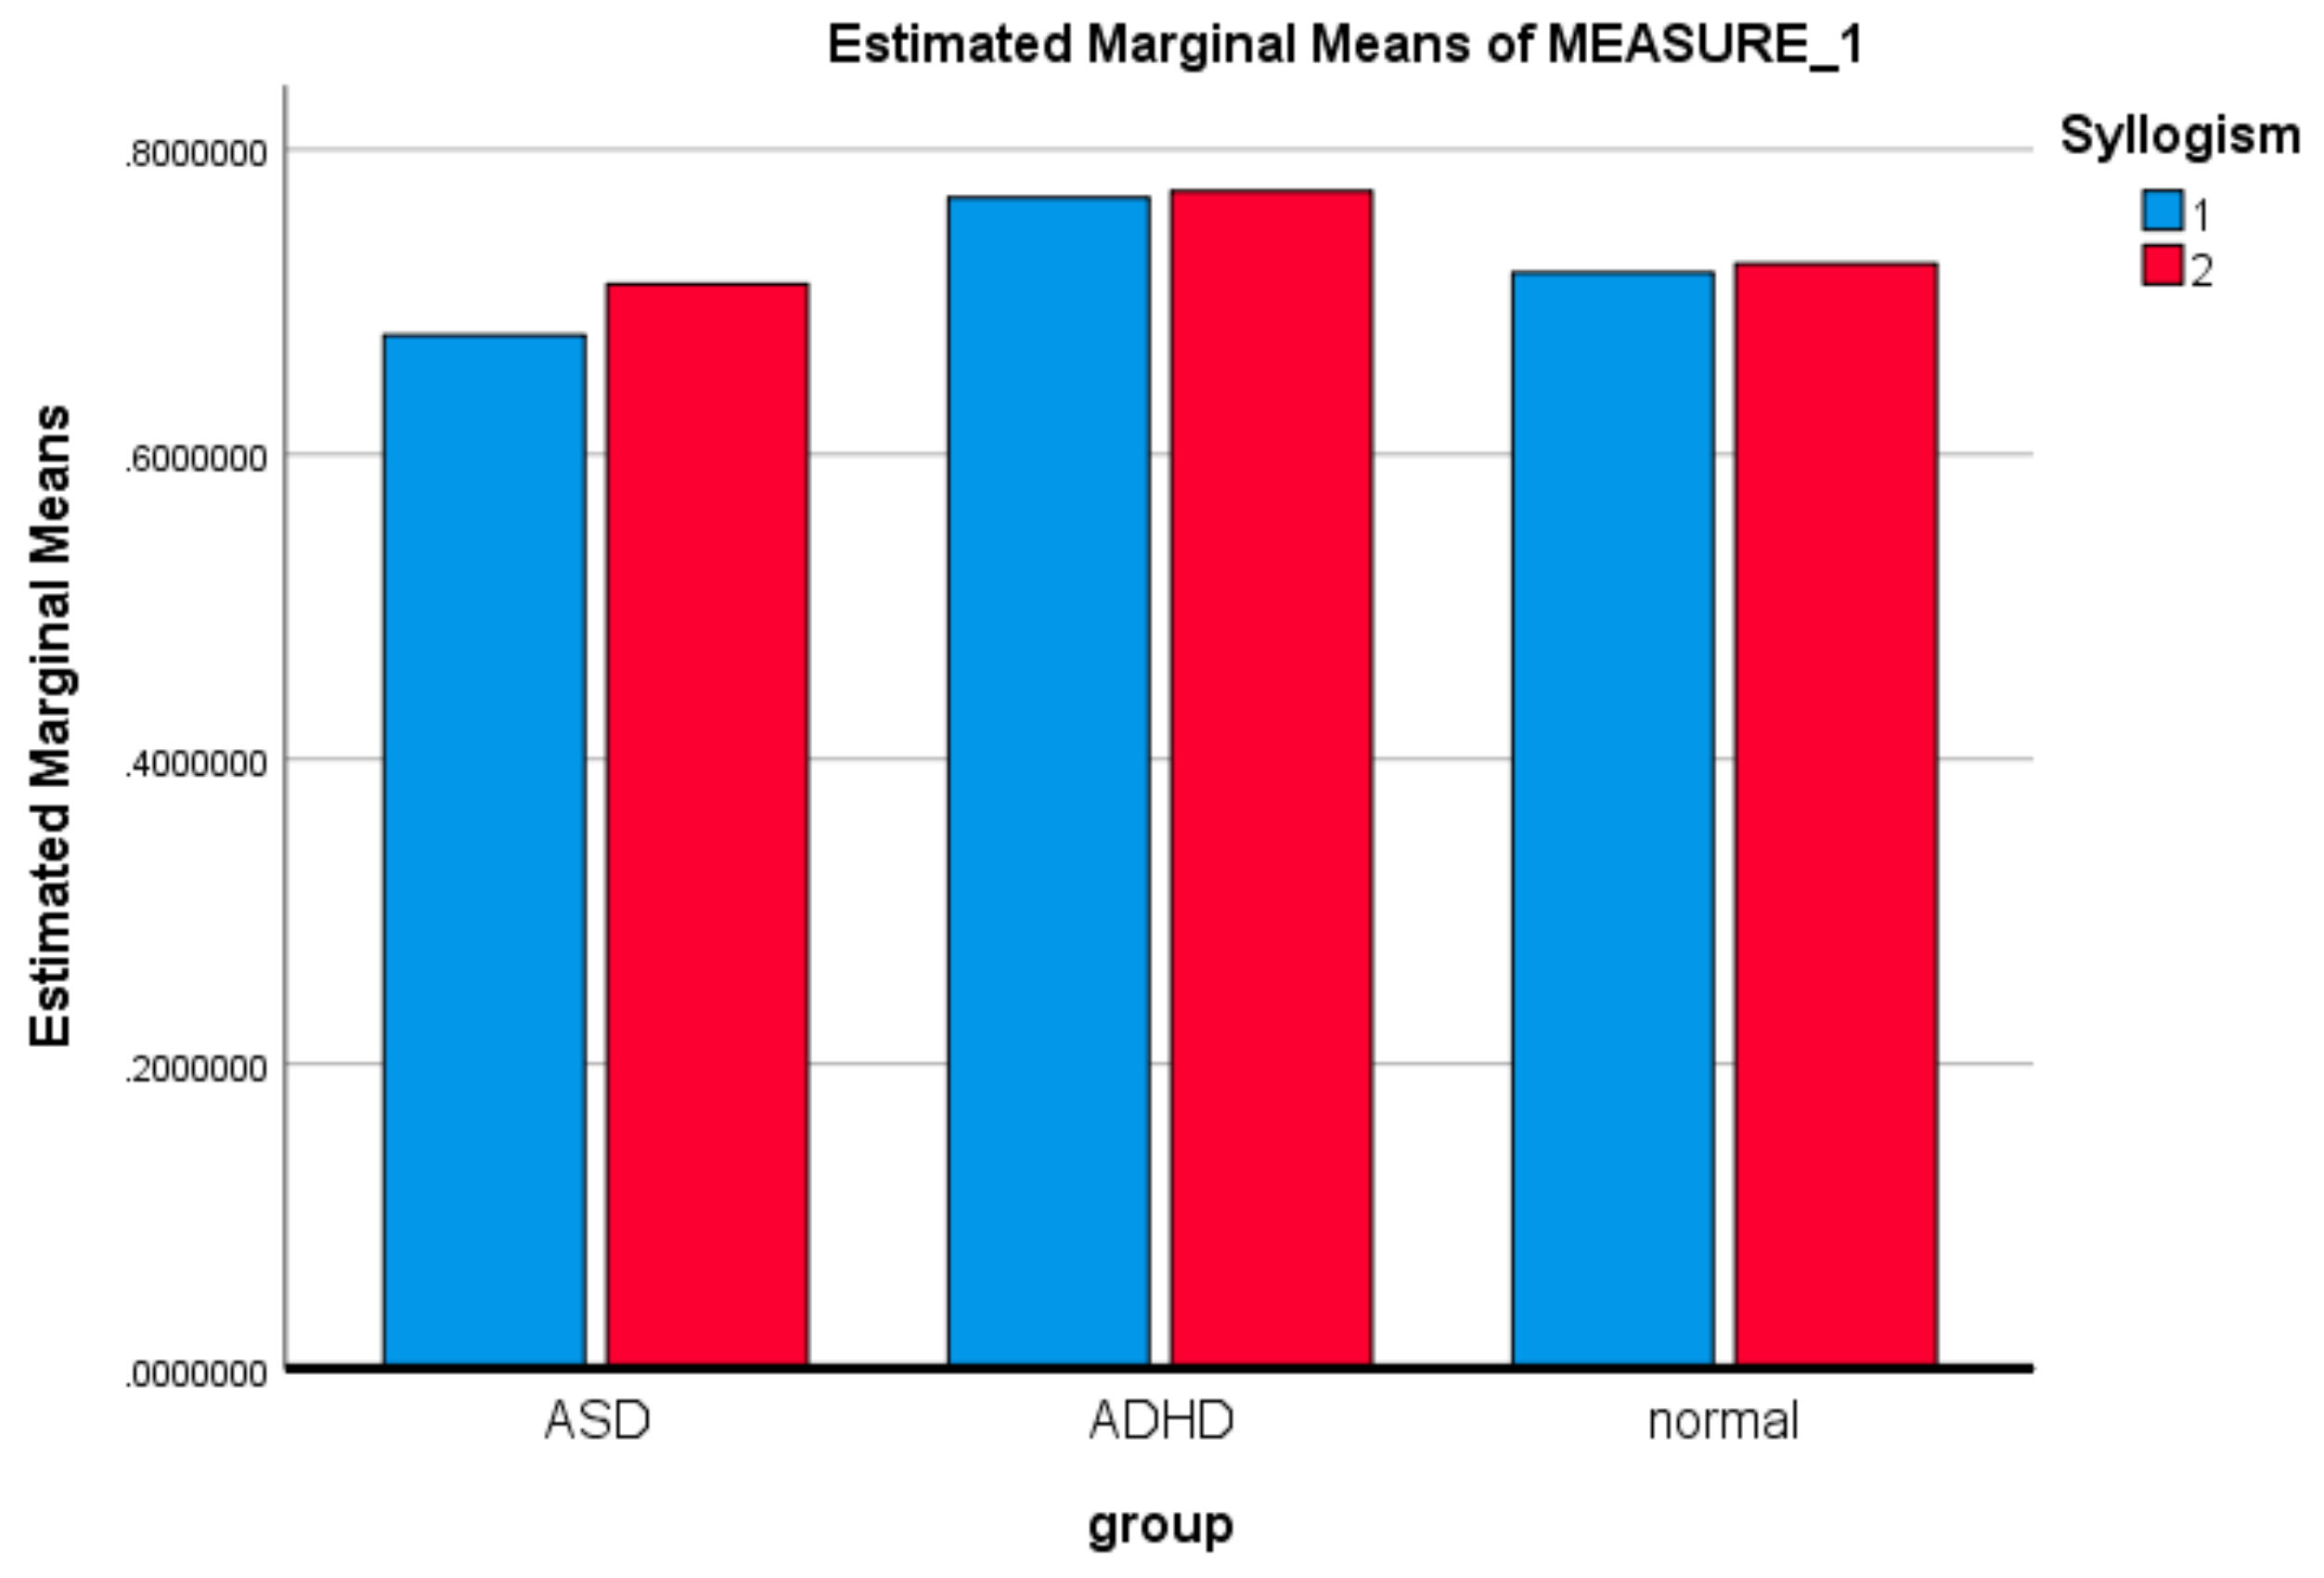
3.1. Mixed ANOVA and Multi-Dimensional Chi Square Analysis of MSE Values
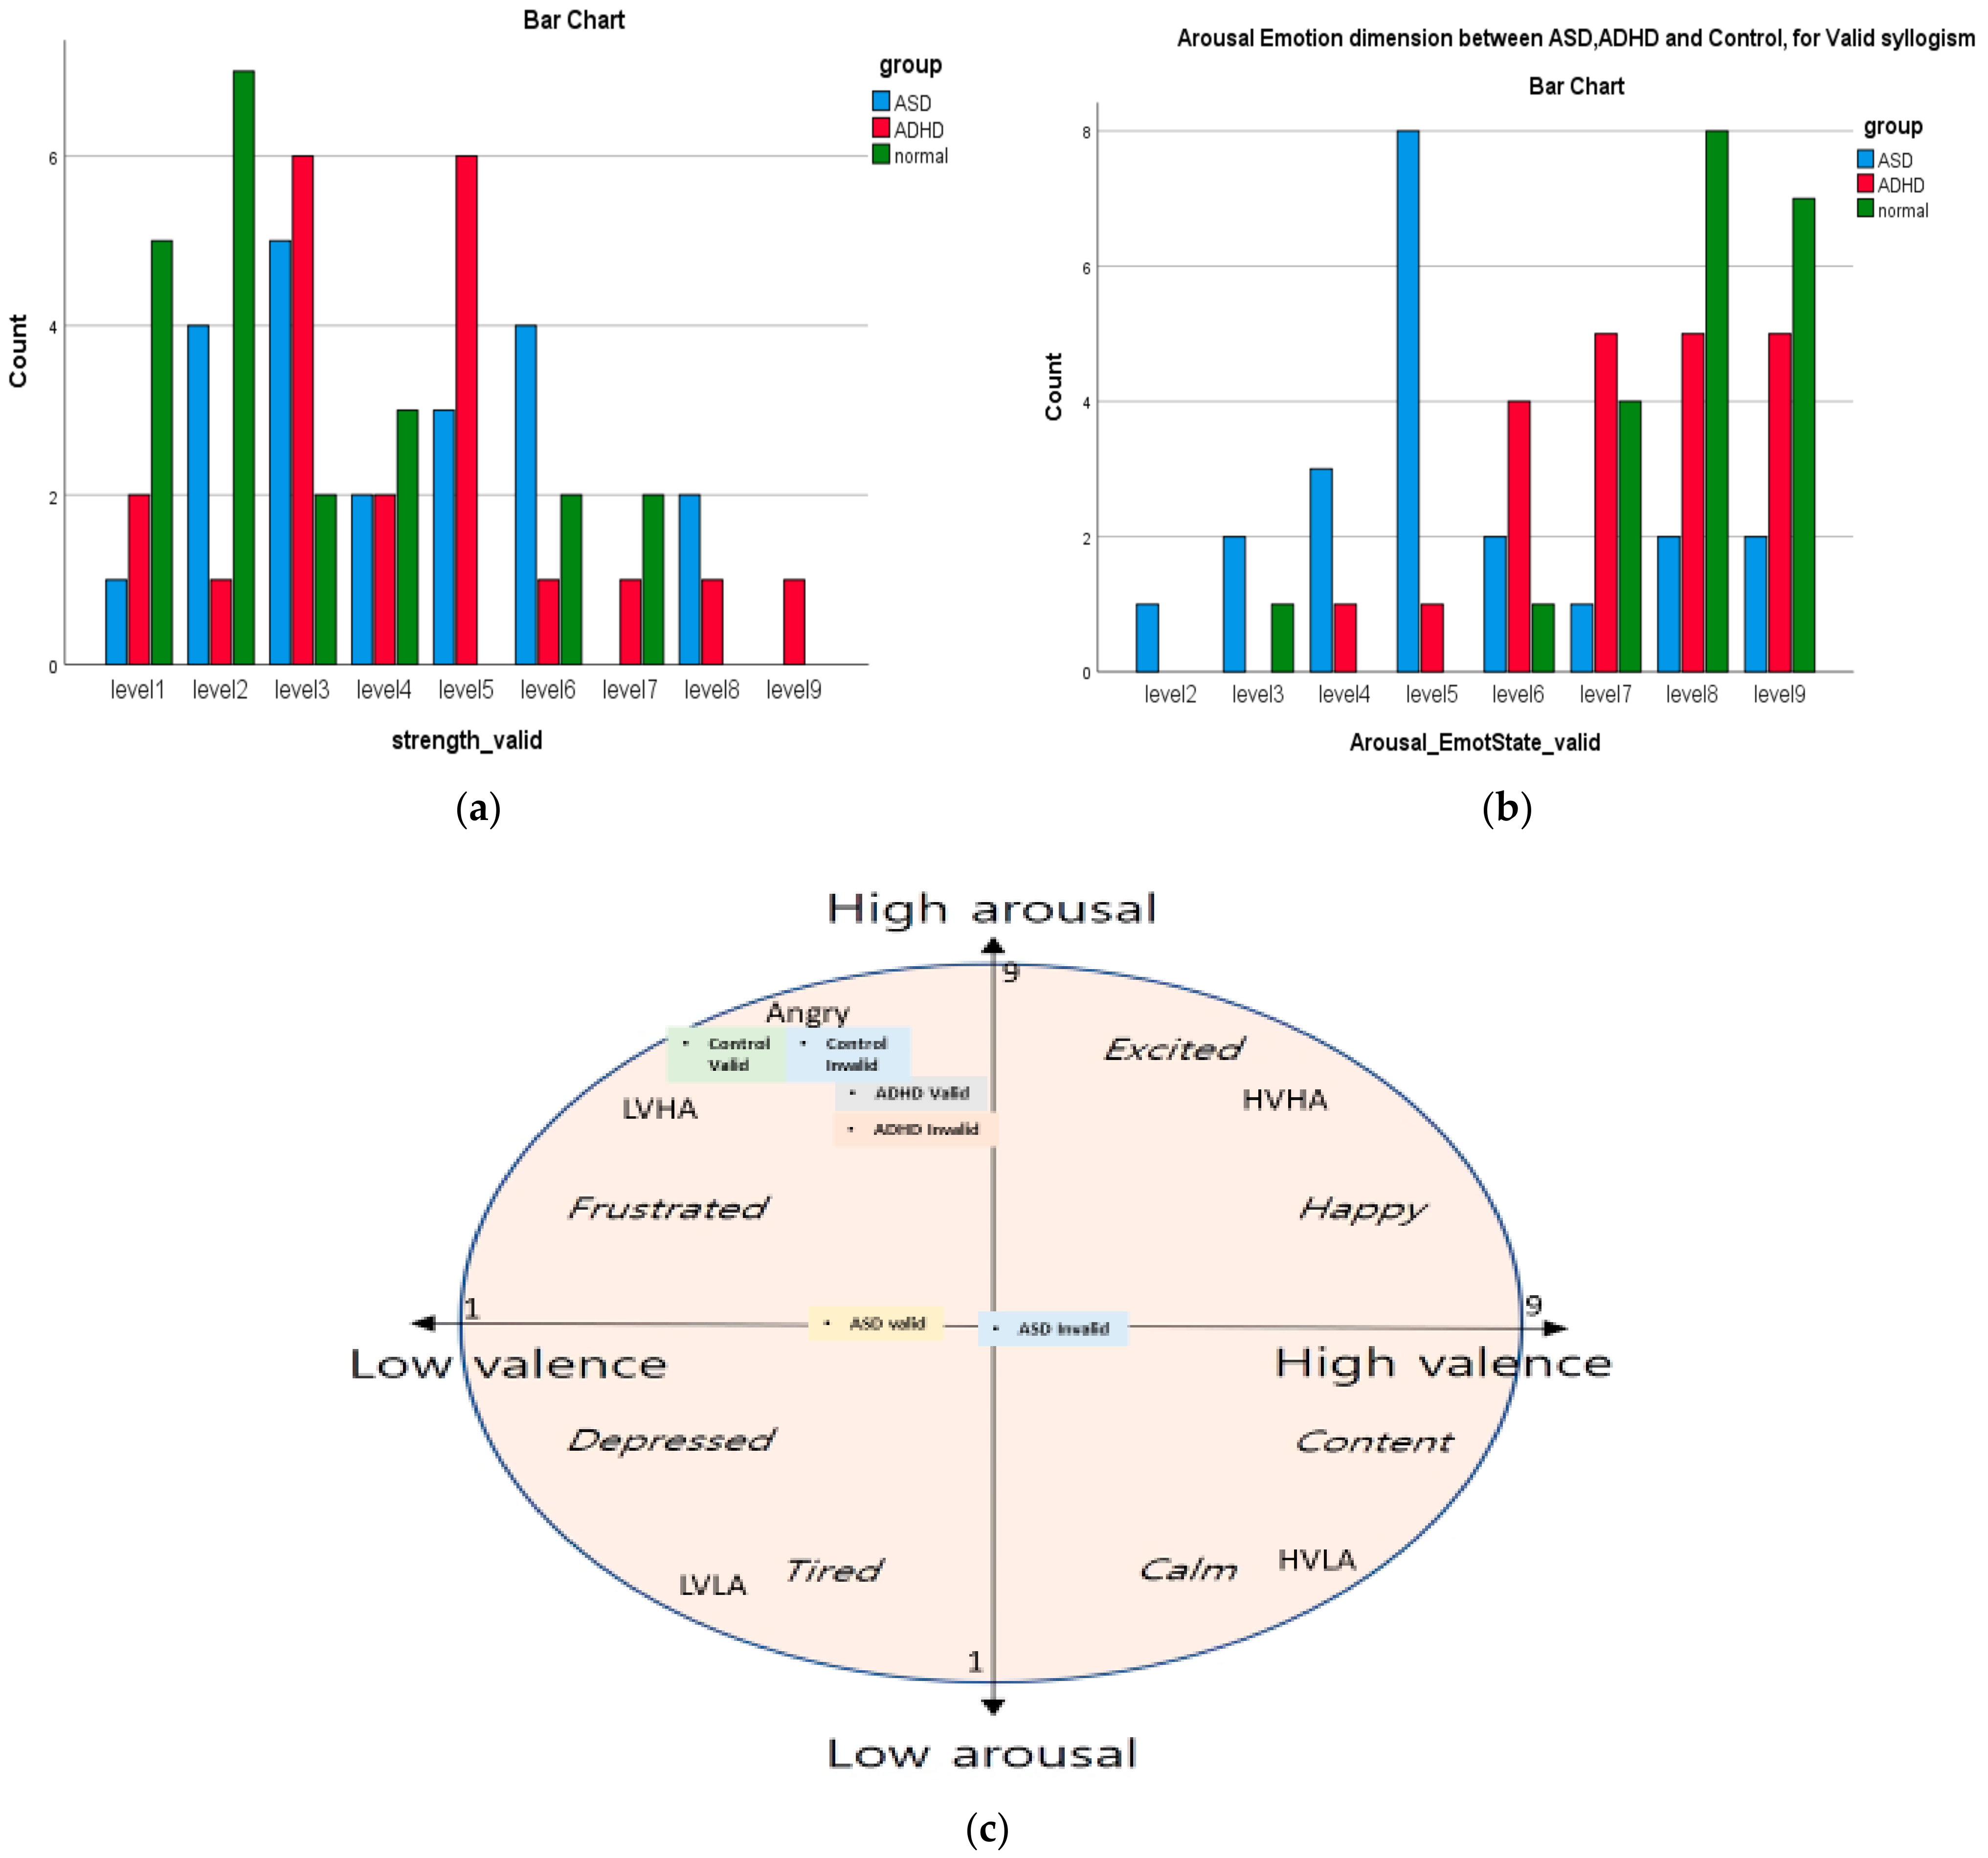
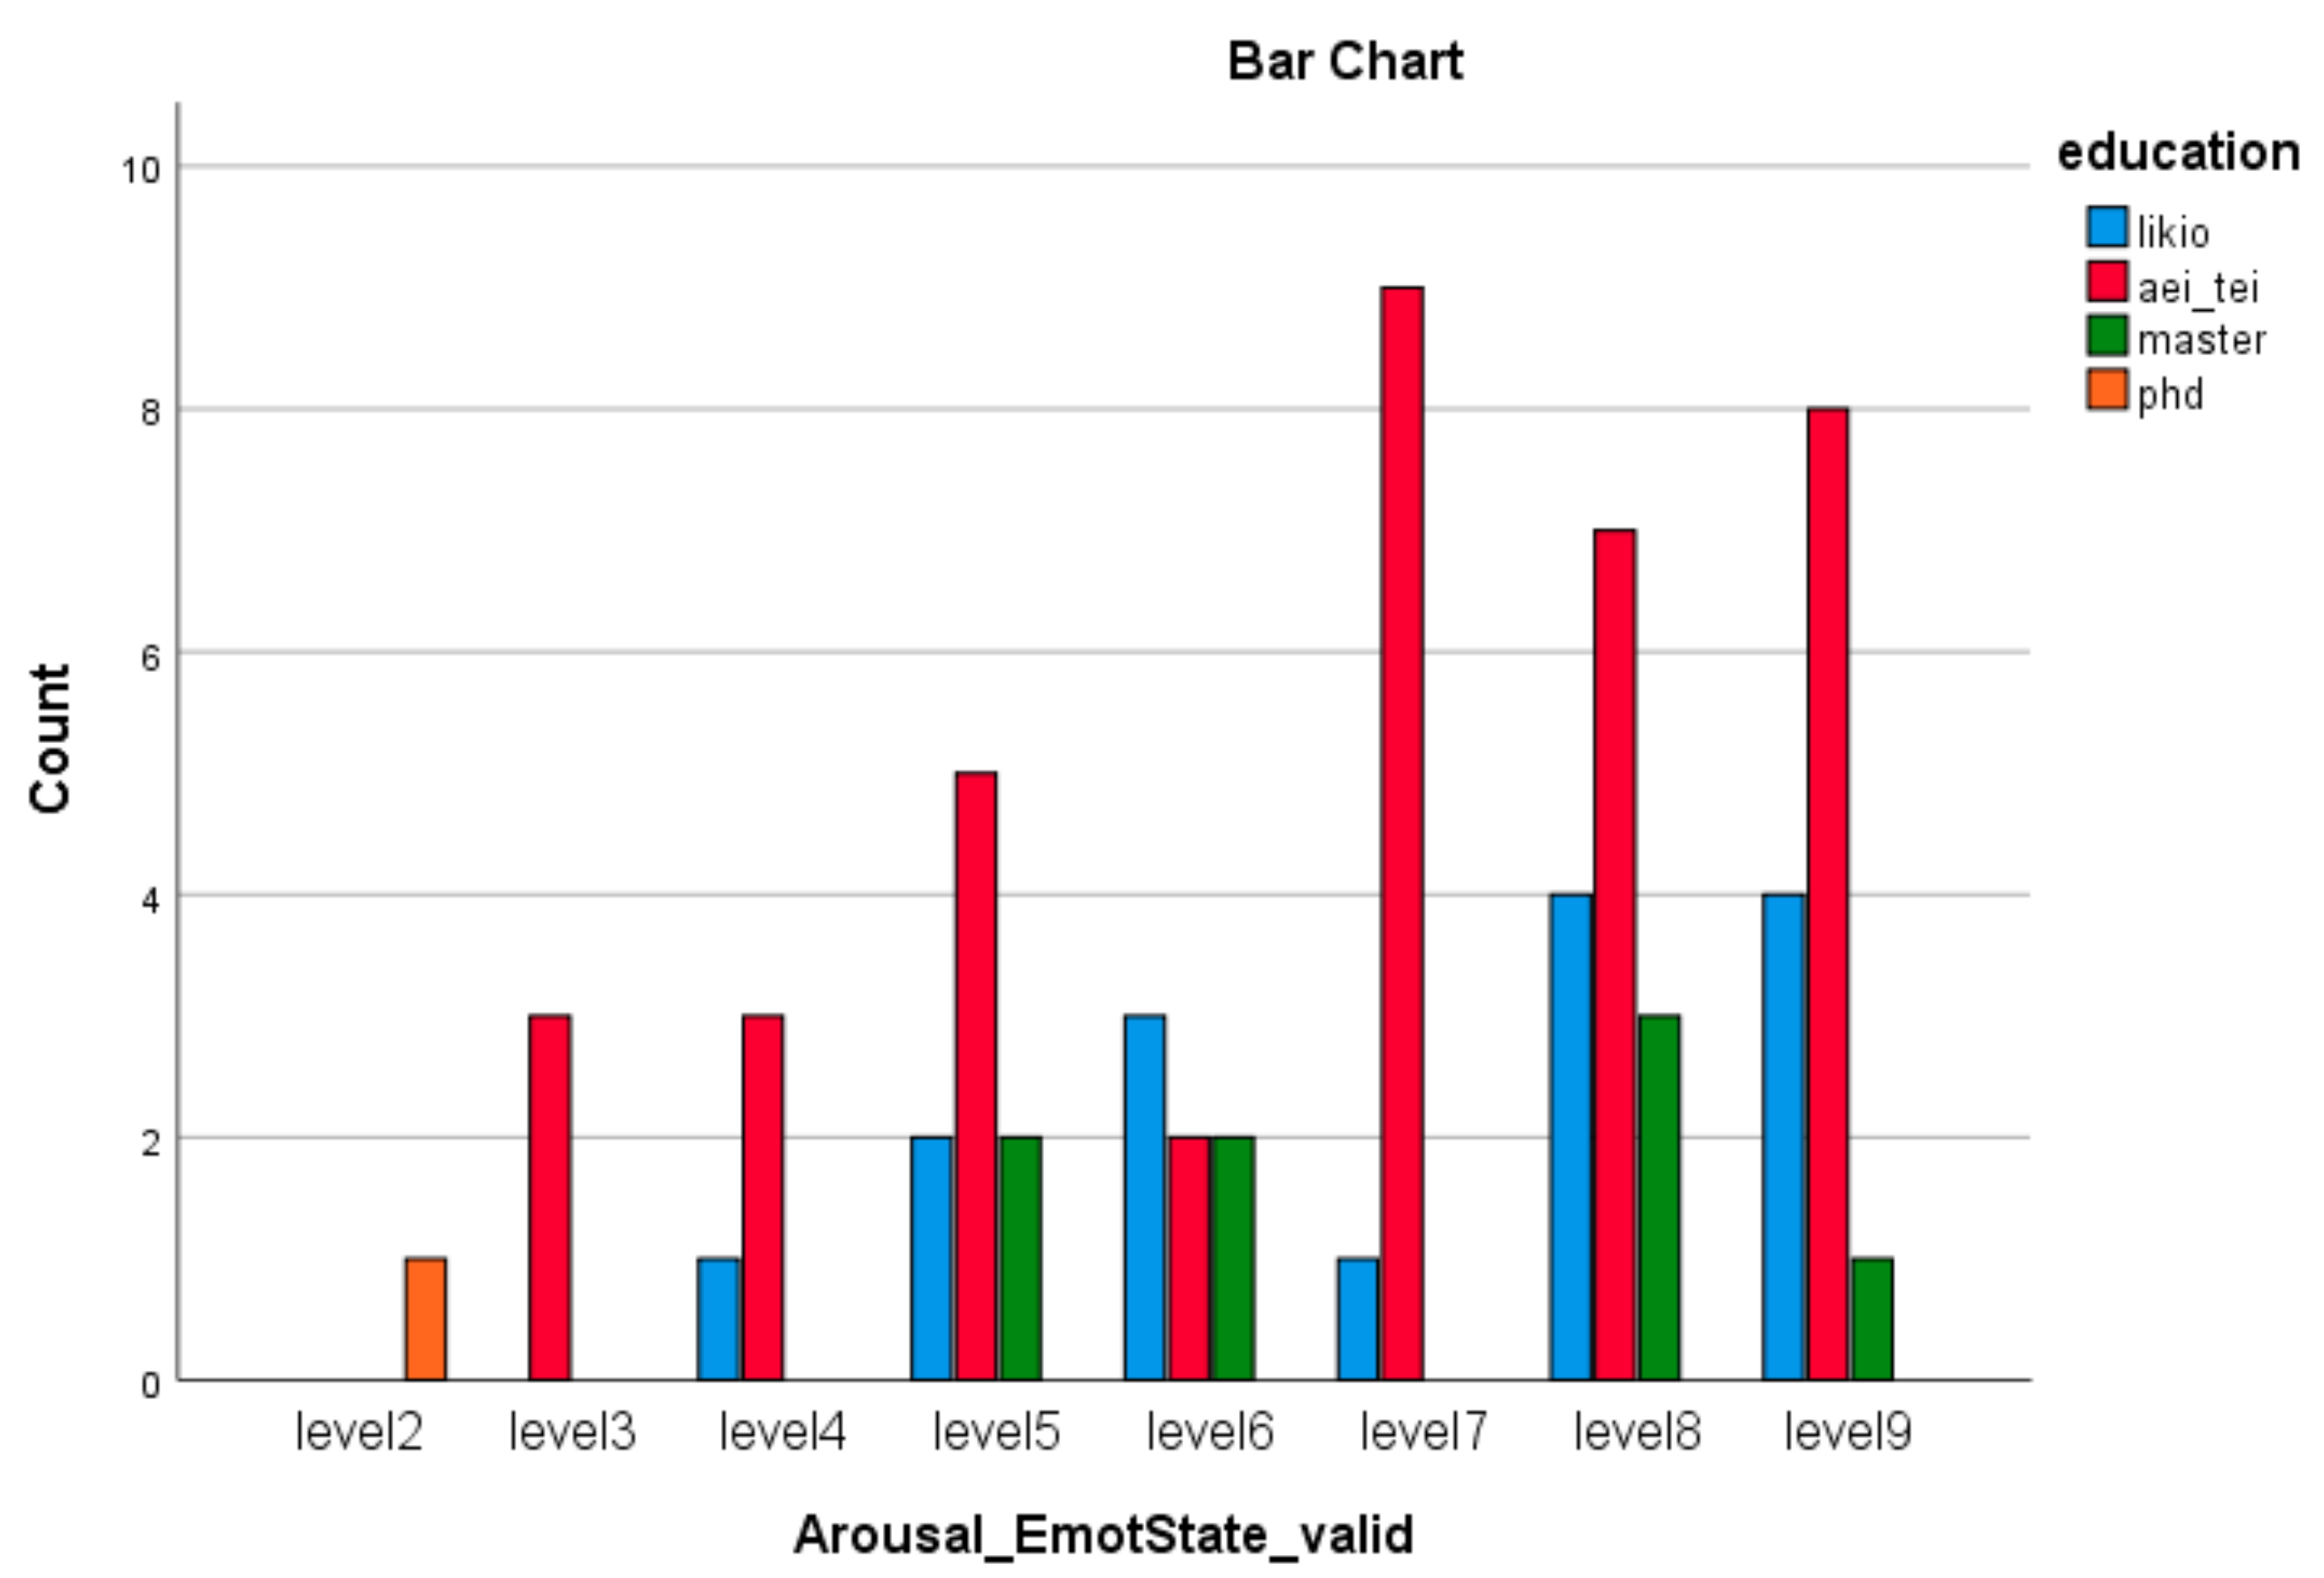
3.1.1. Behavioral Performance: X2 Multidimensional Test
3.2. Behavior-PLSC and Seed-PLS Results
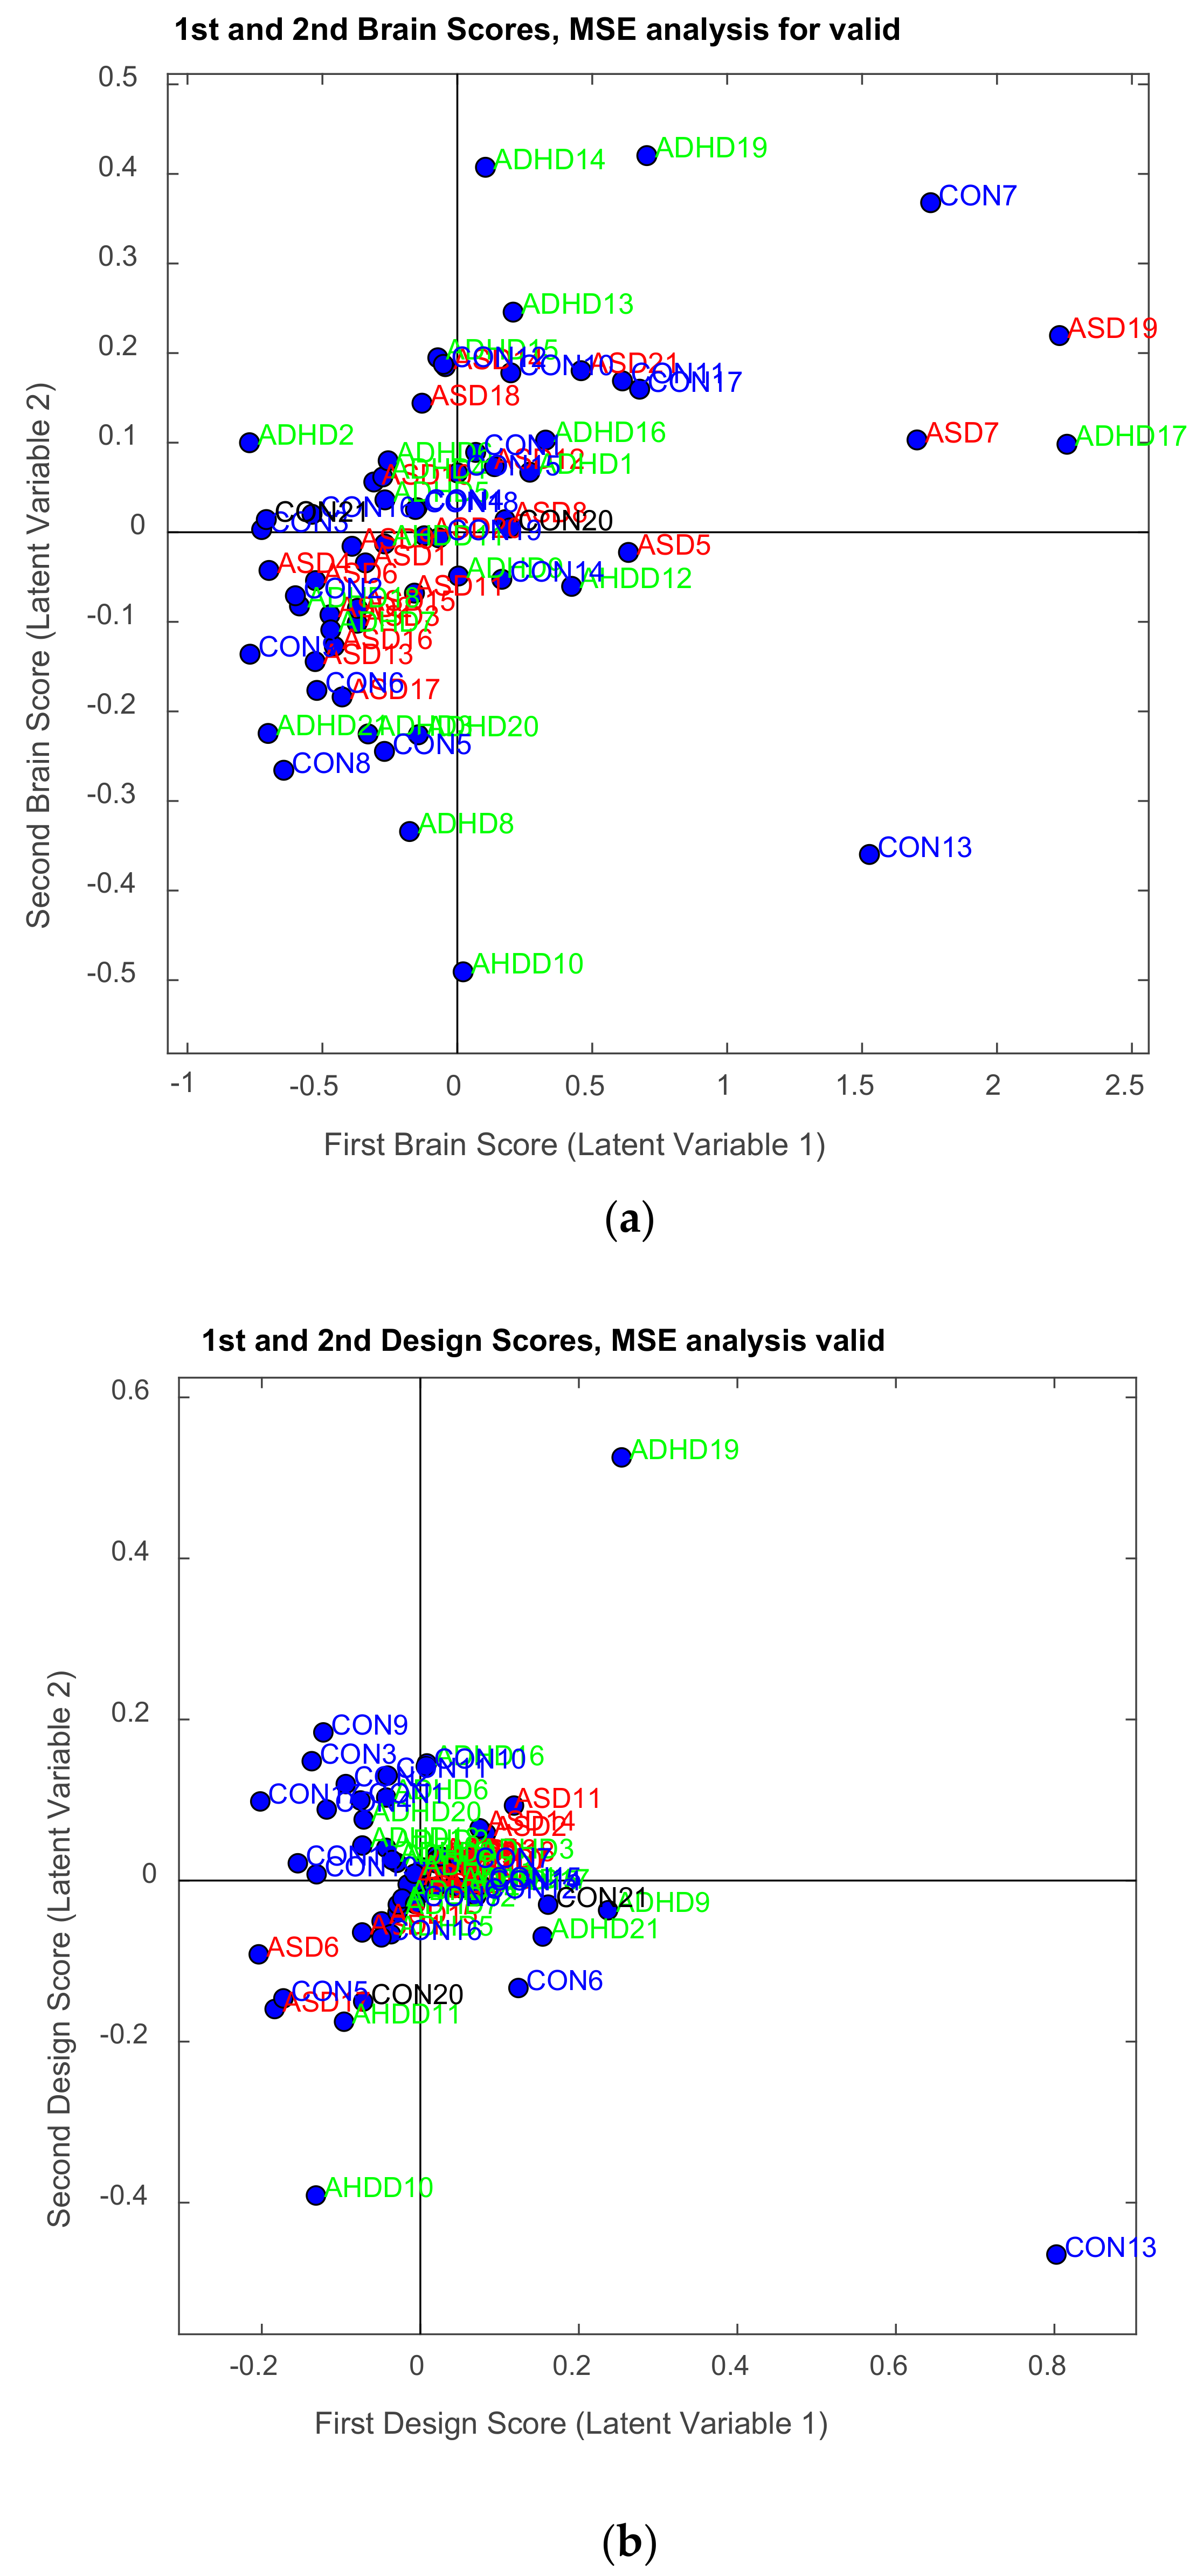
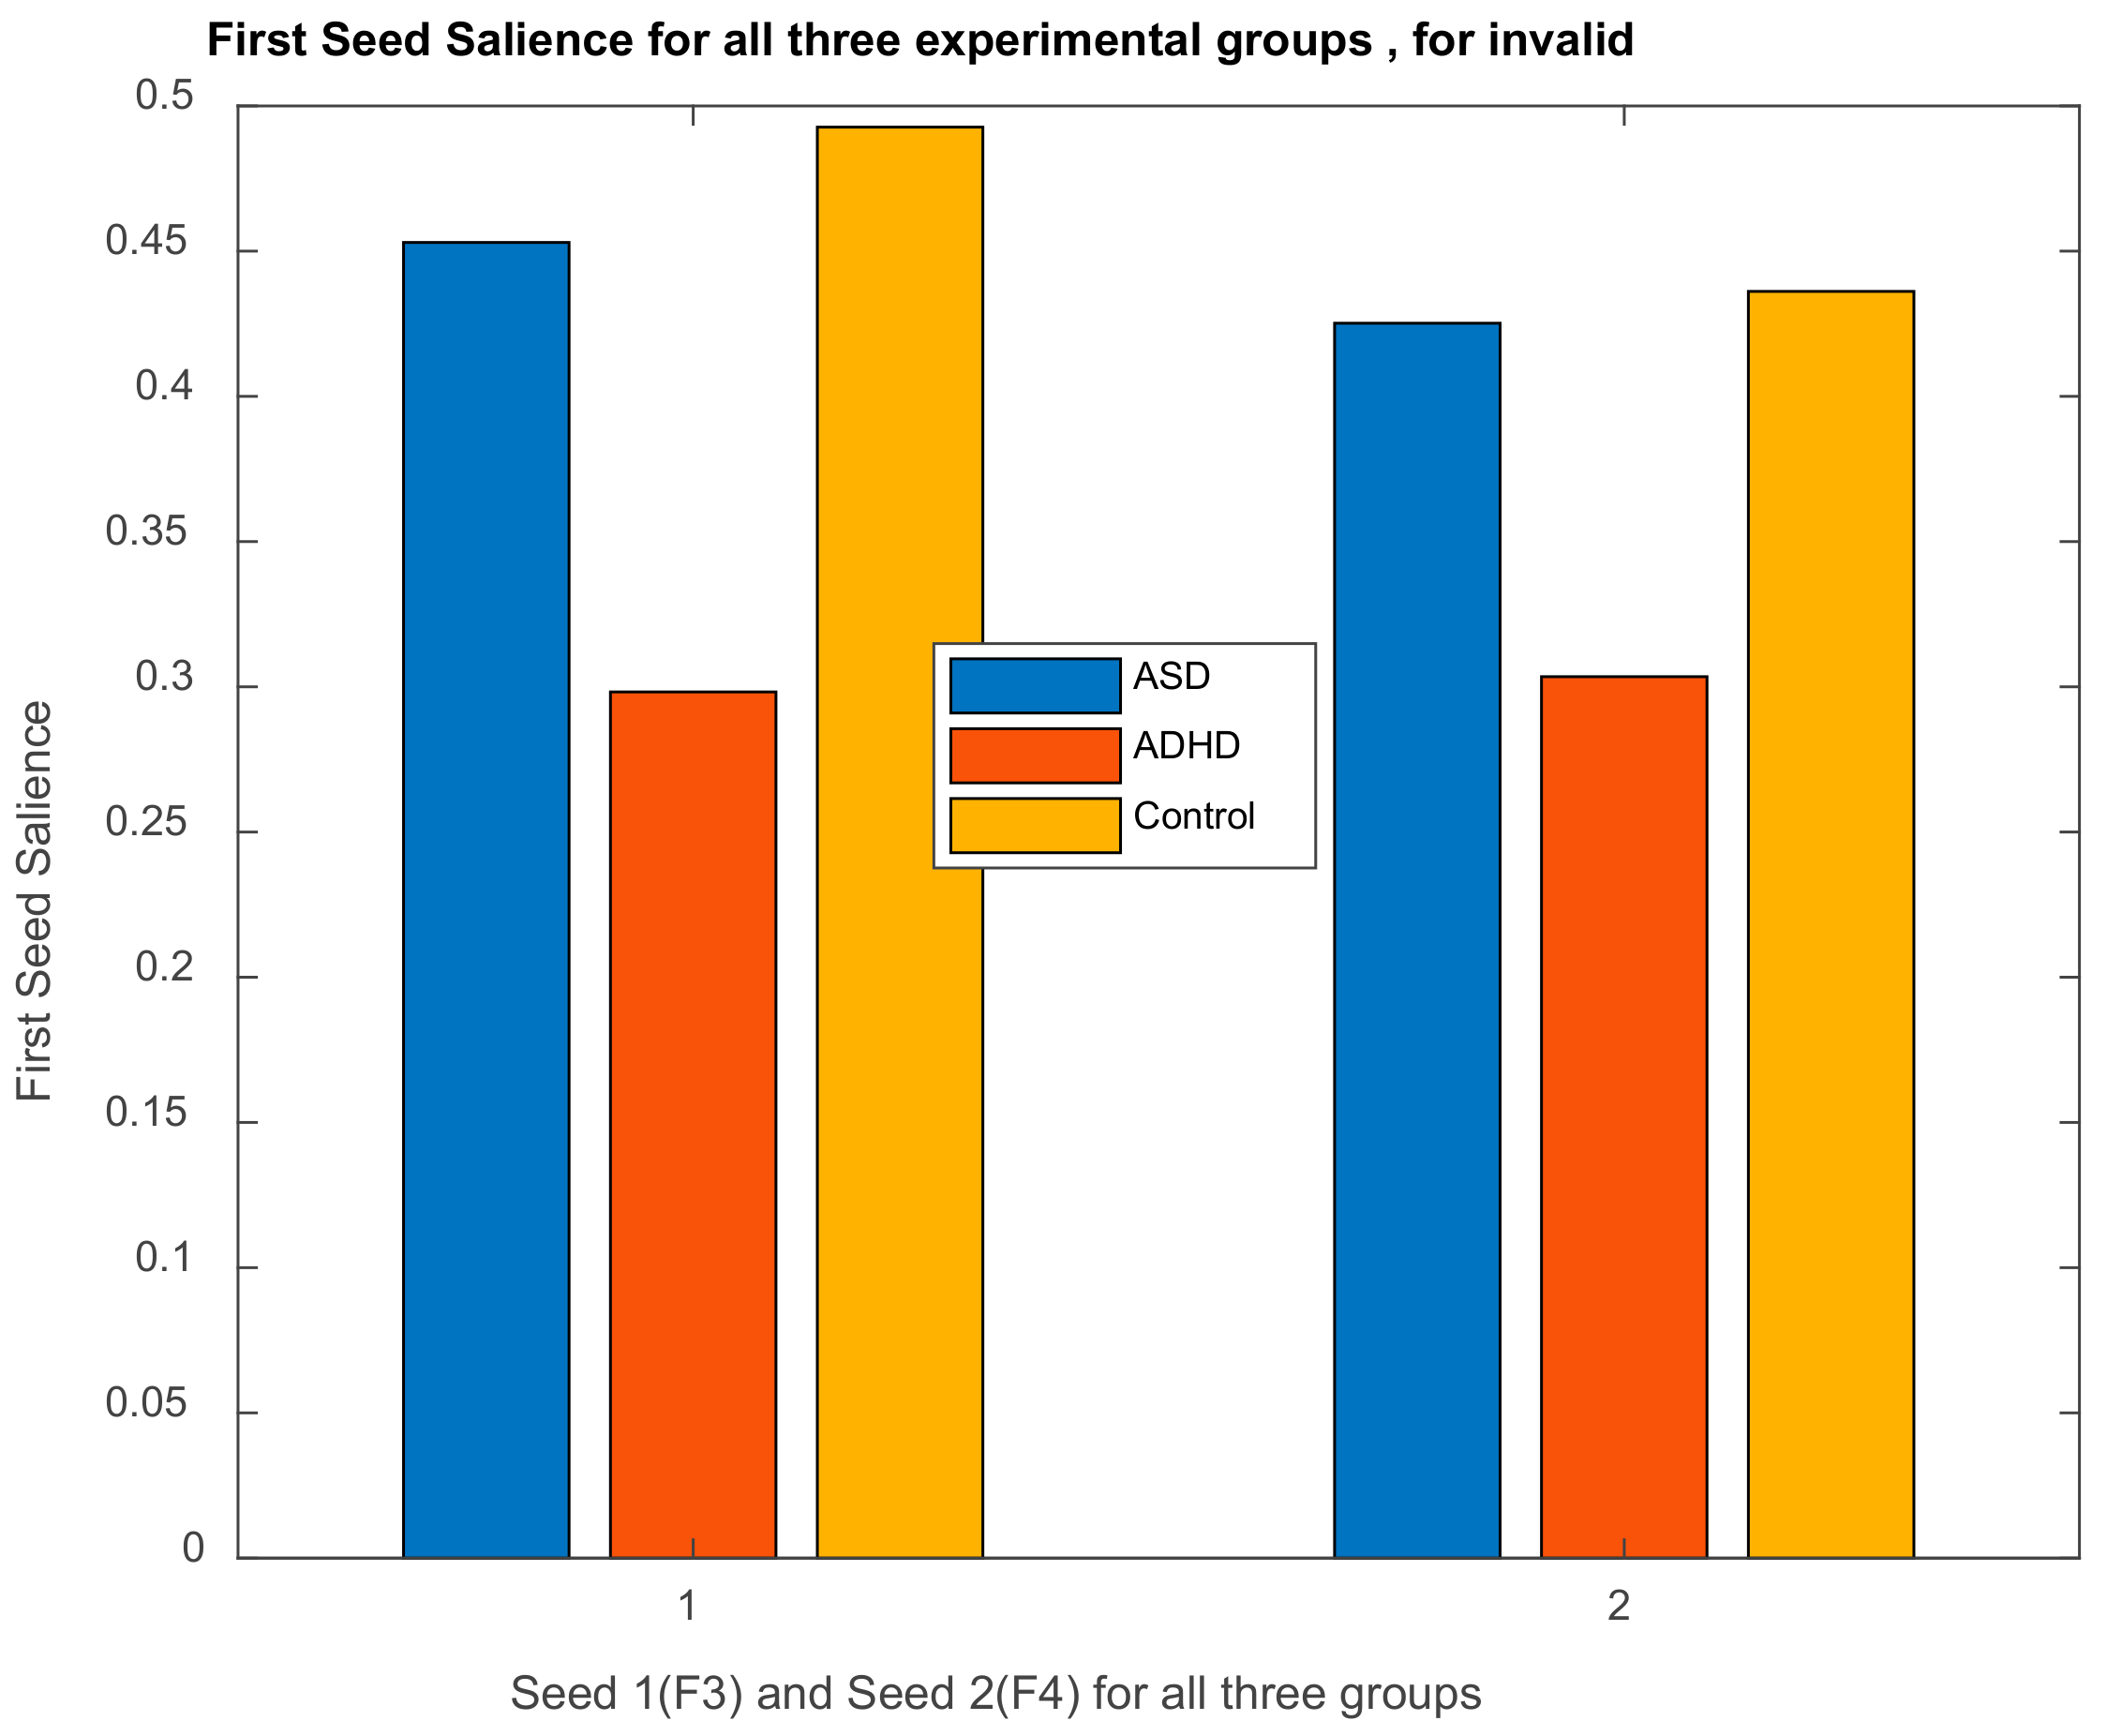
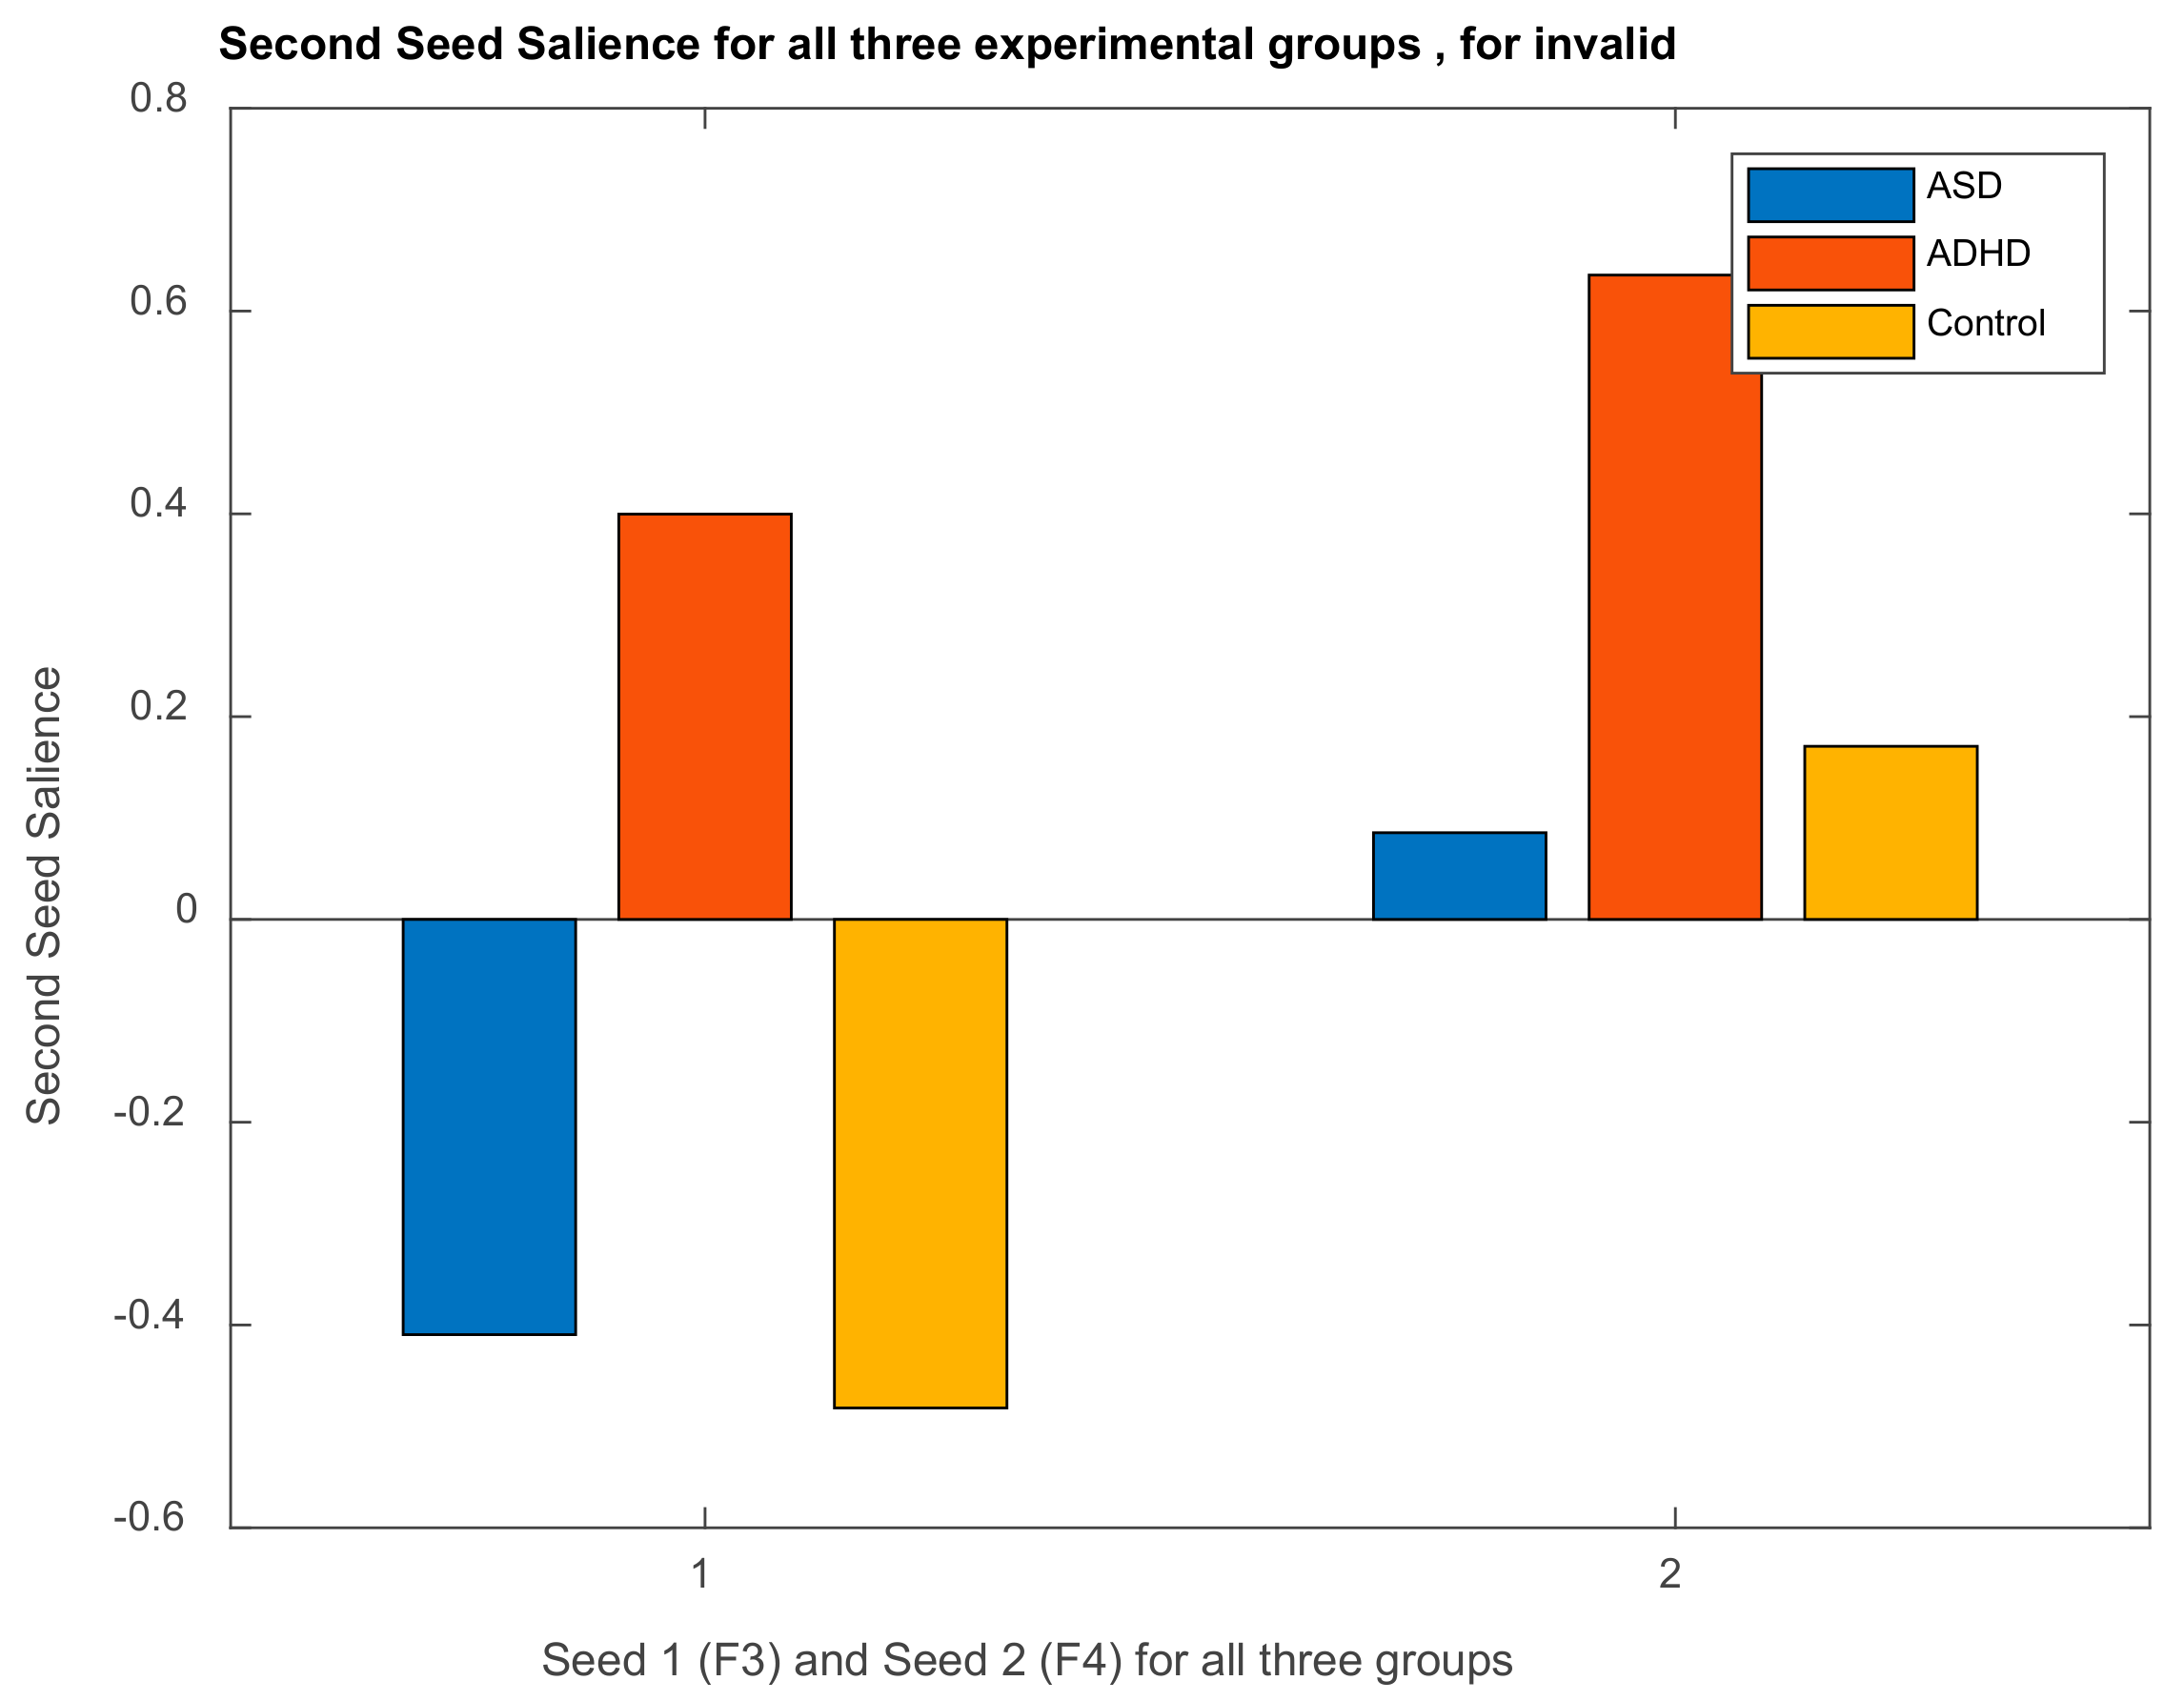
3.2.1. Brain Saliences Scores
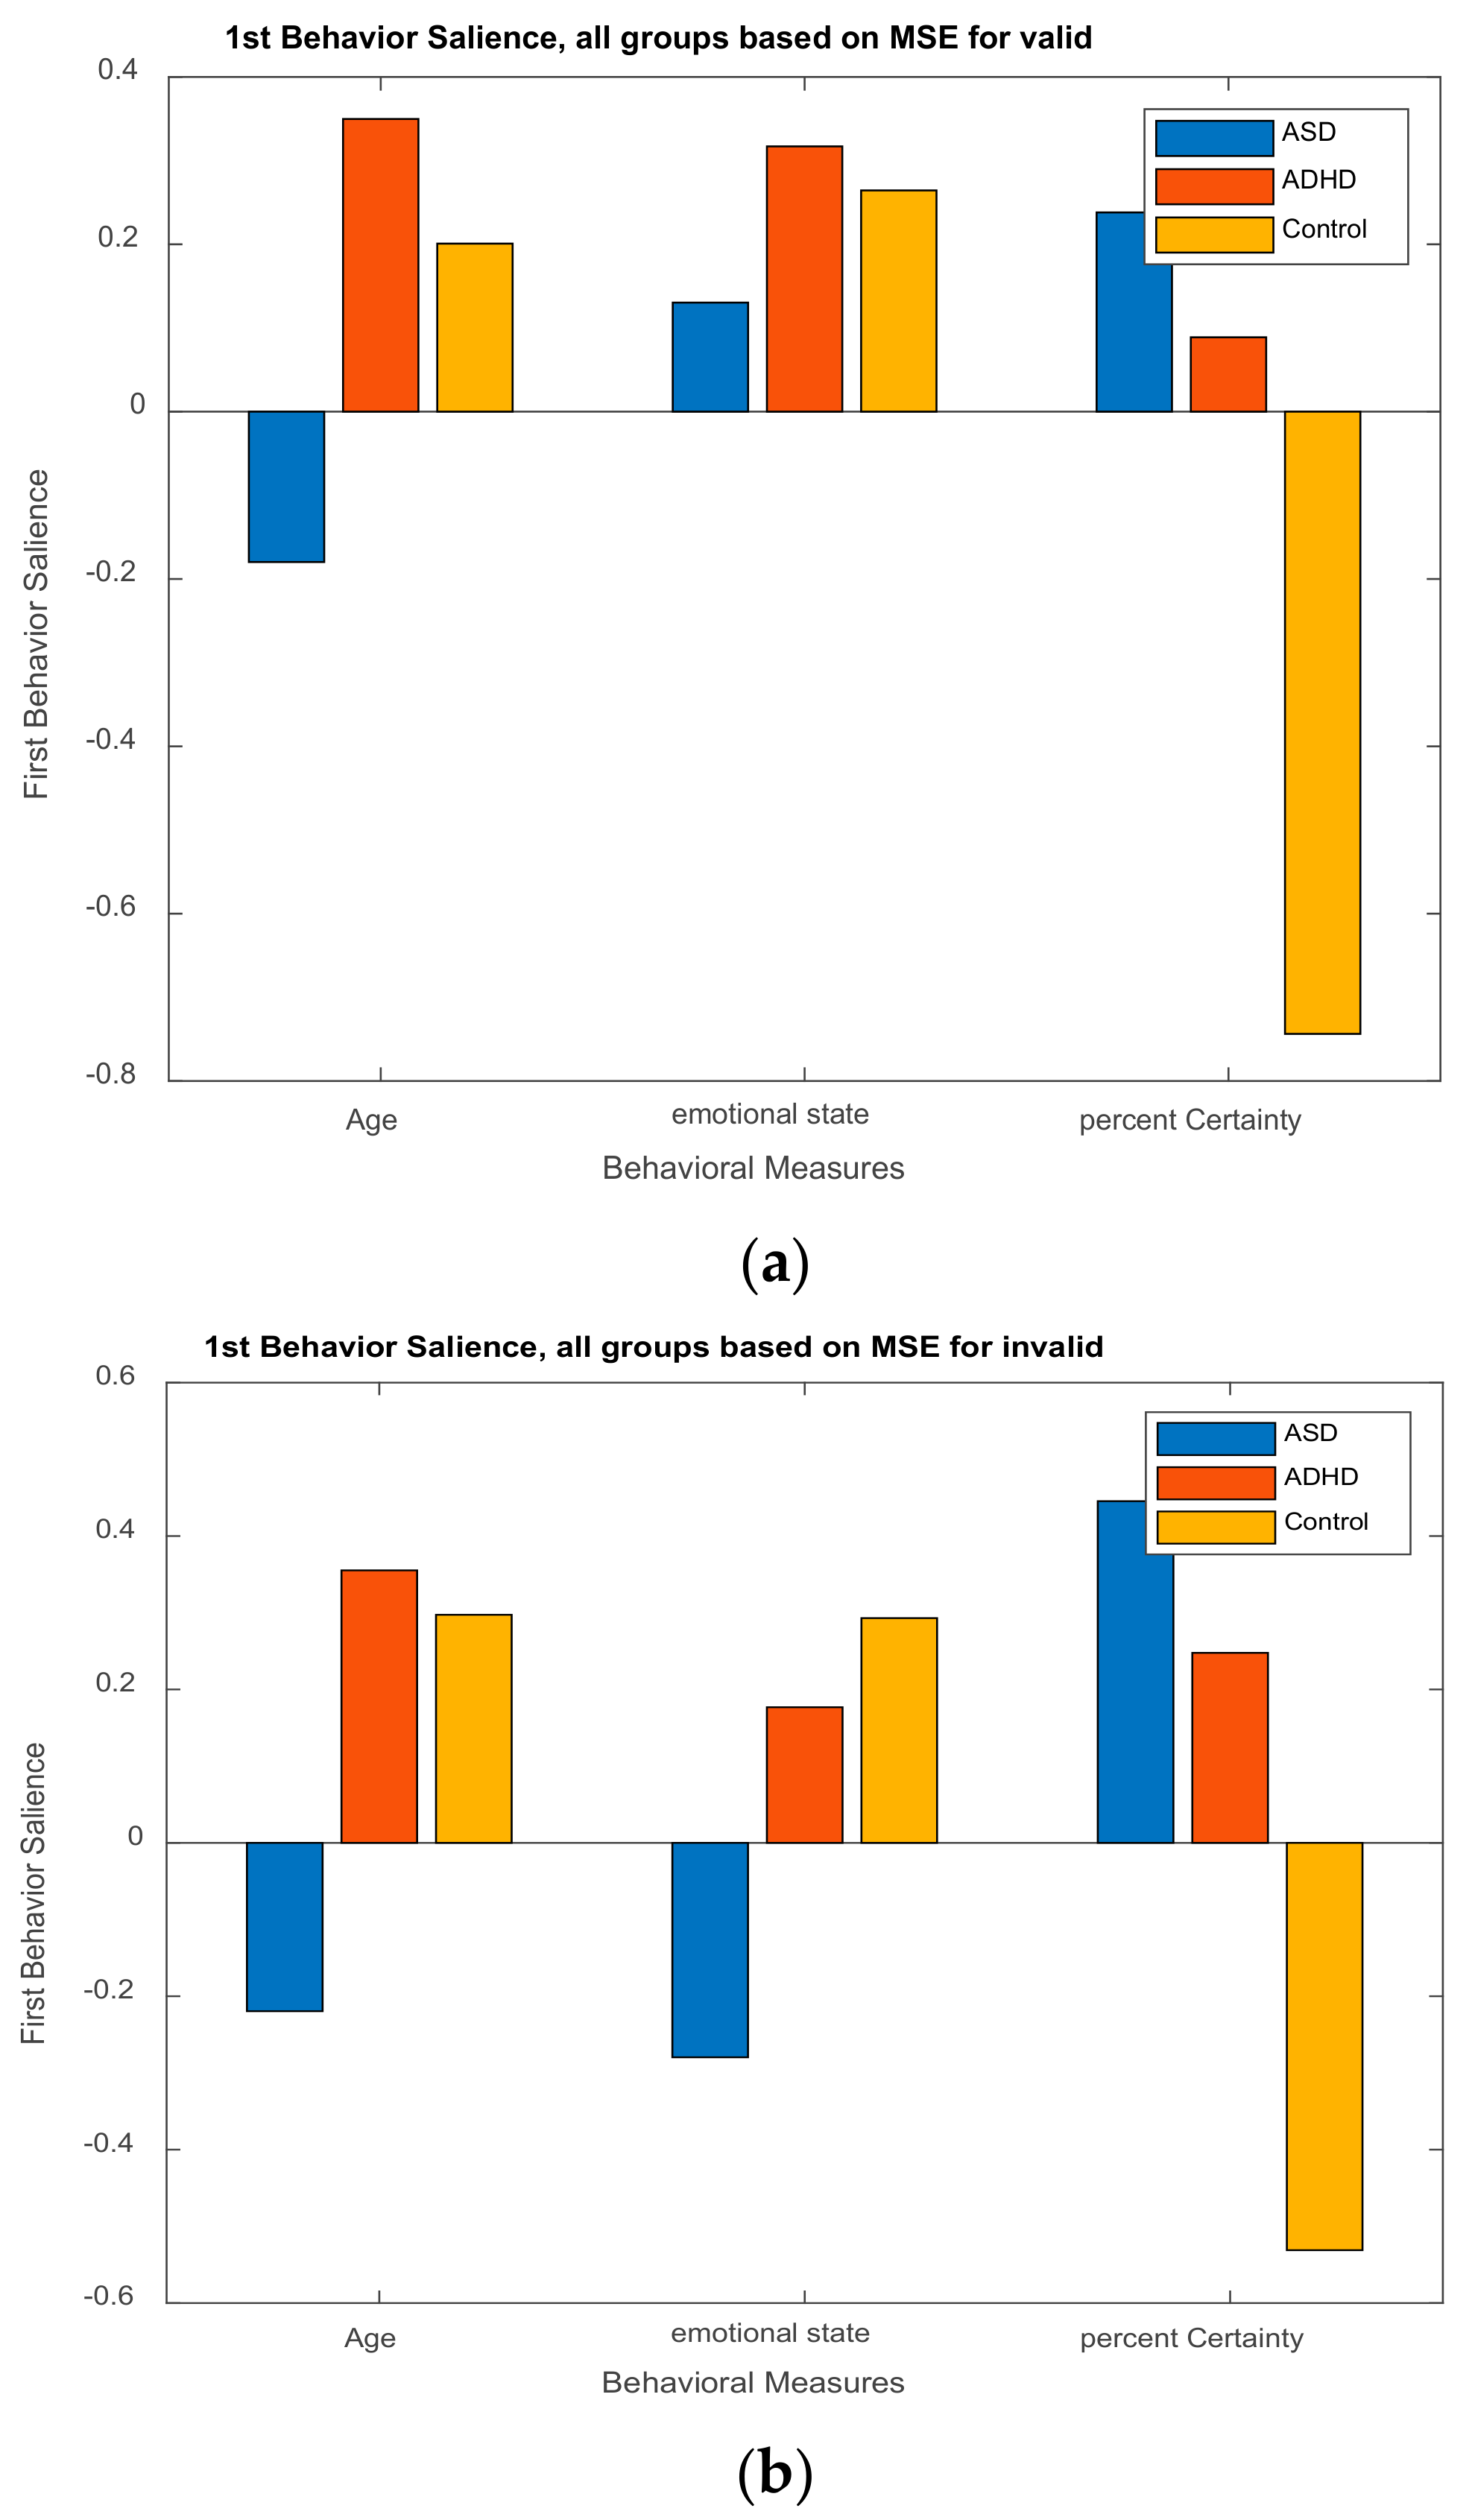
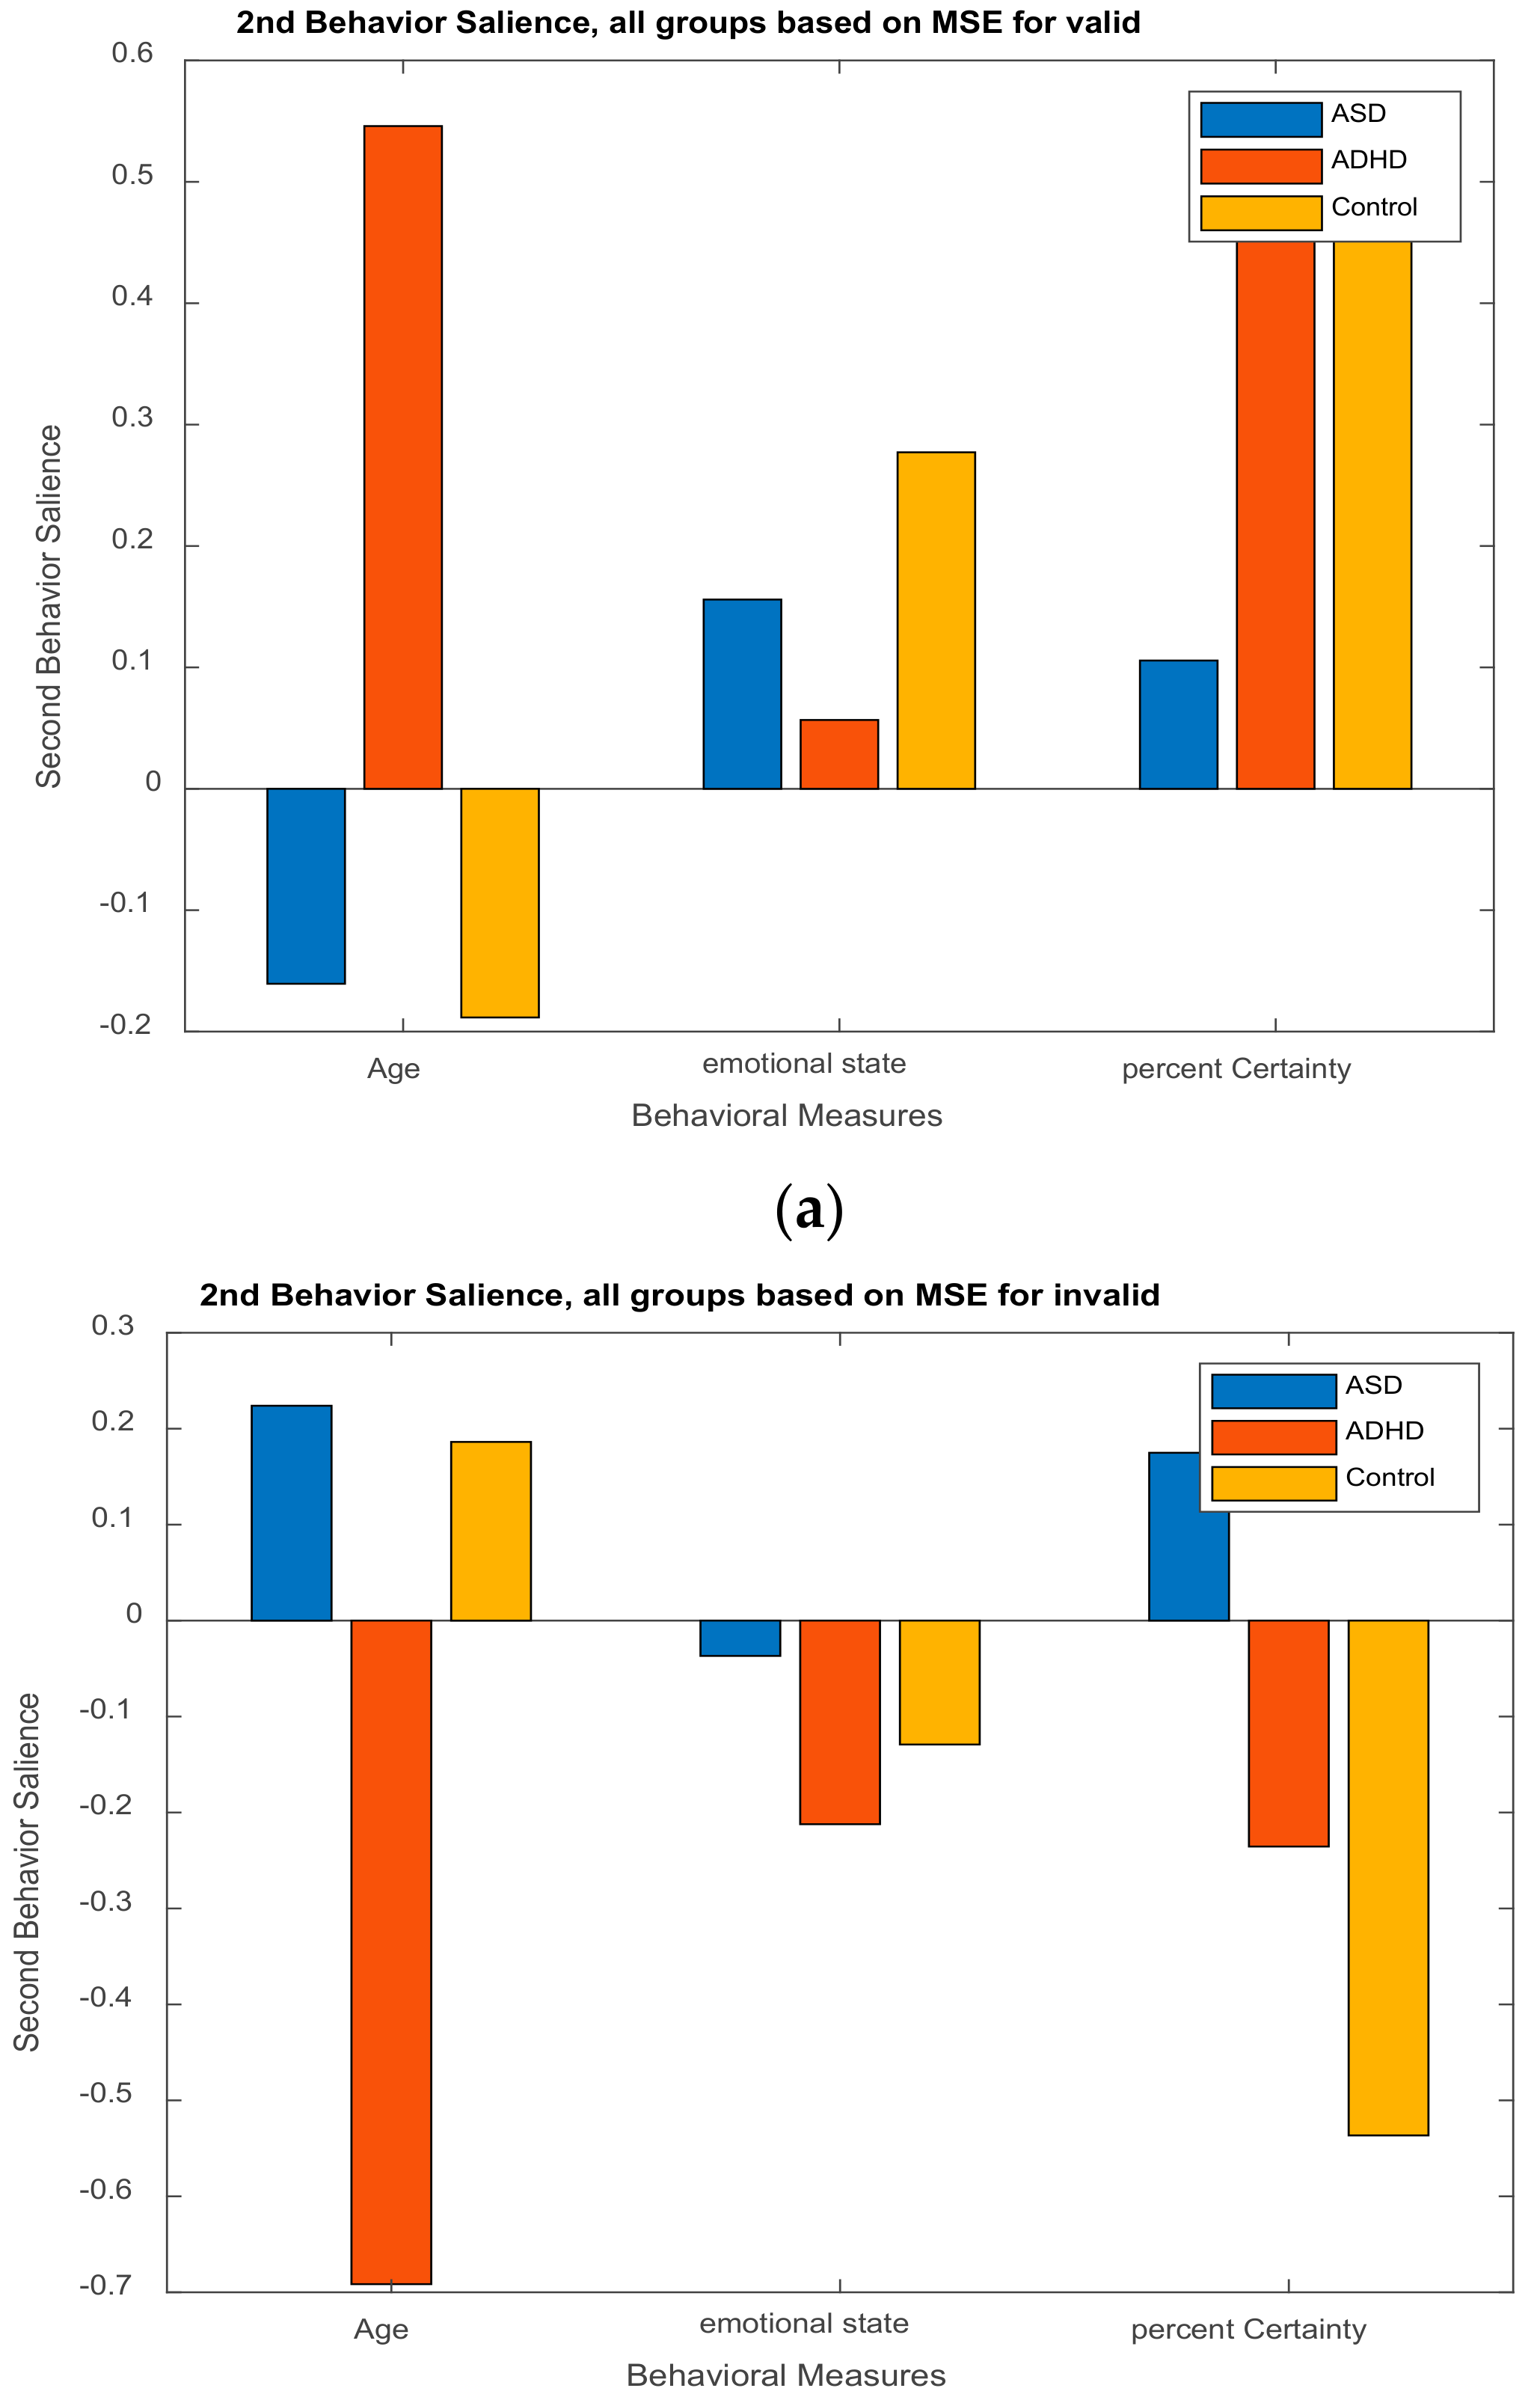
3.2.2. Behavior Saliences Scores: Age-Group, Emotion State-Group, and Level of Confidence-Group Interactions
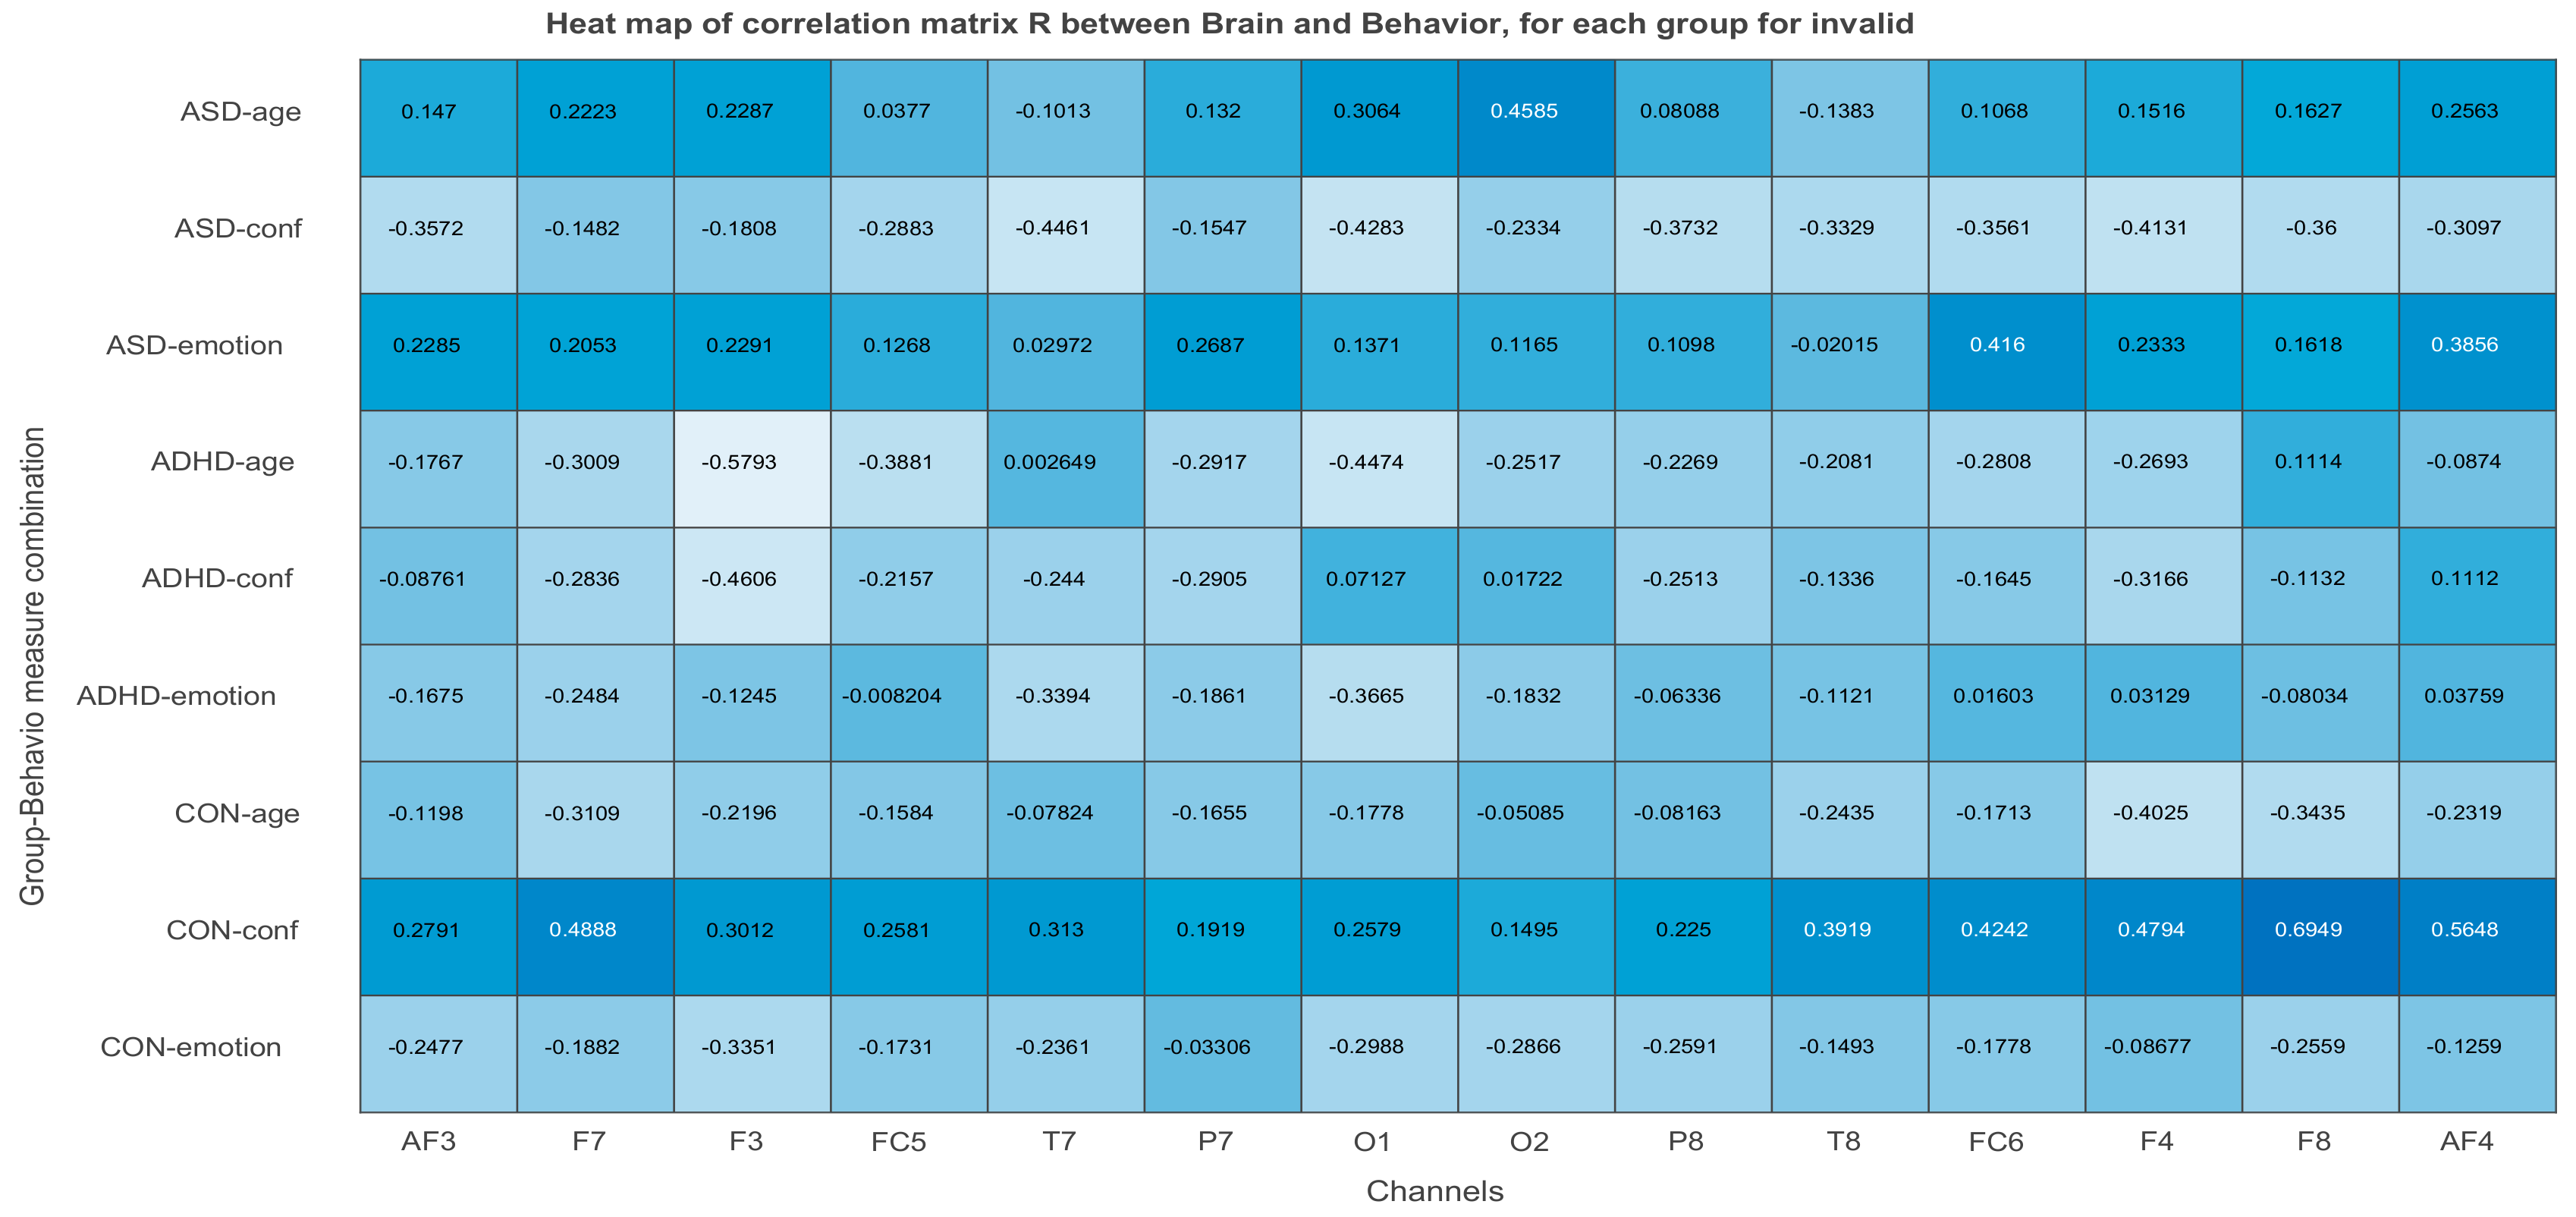
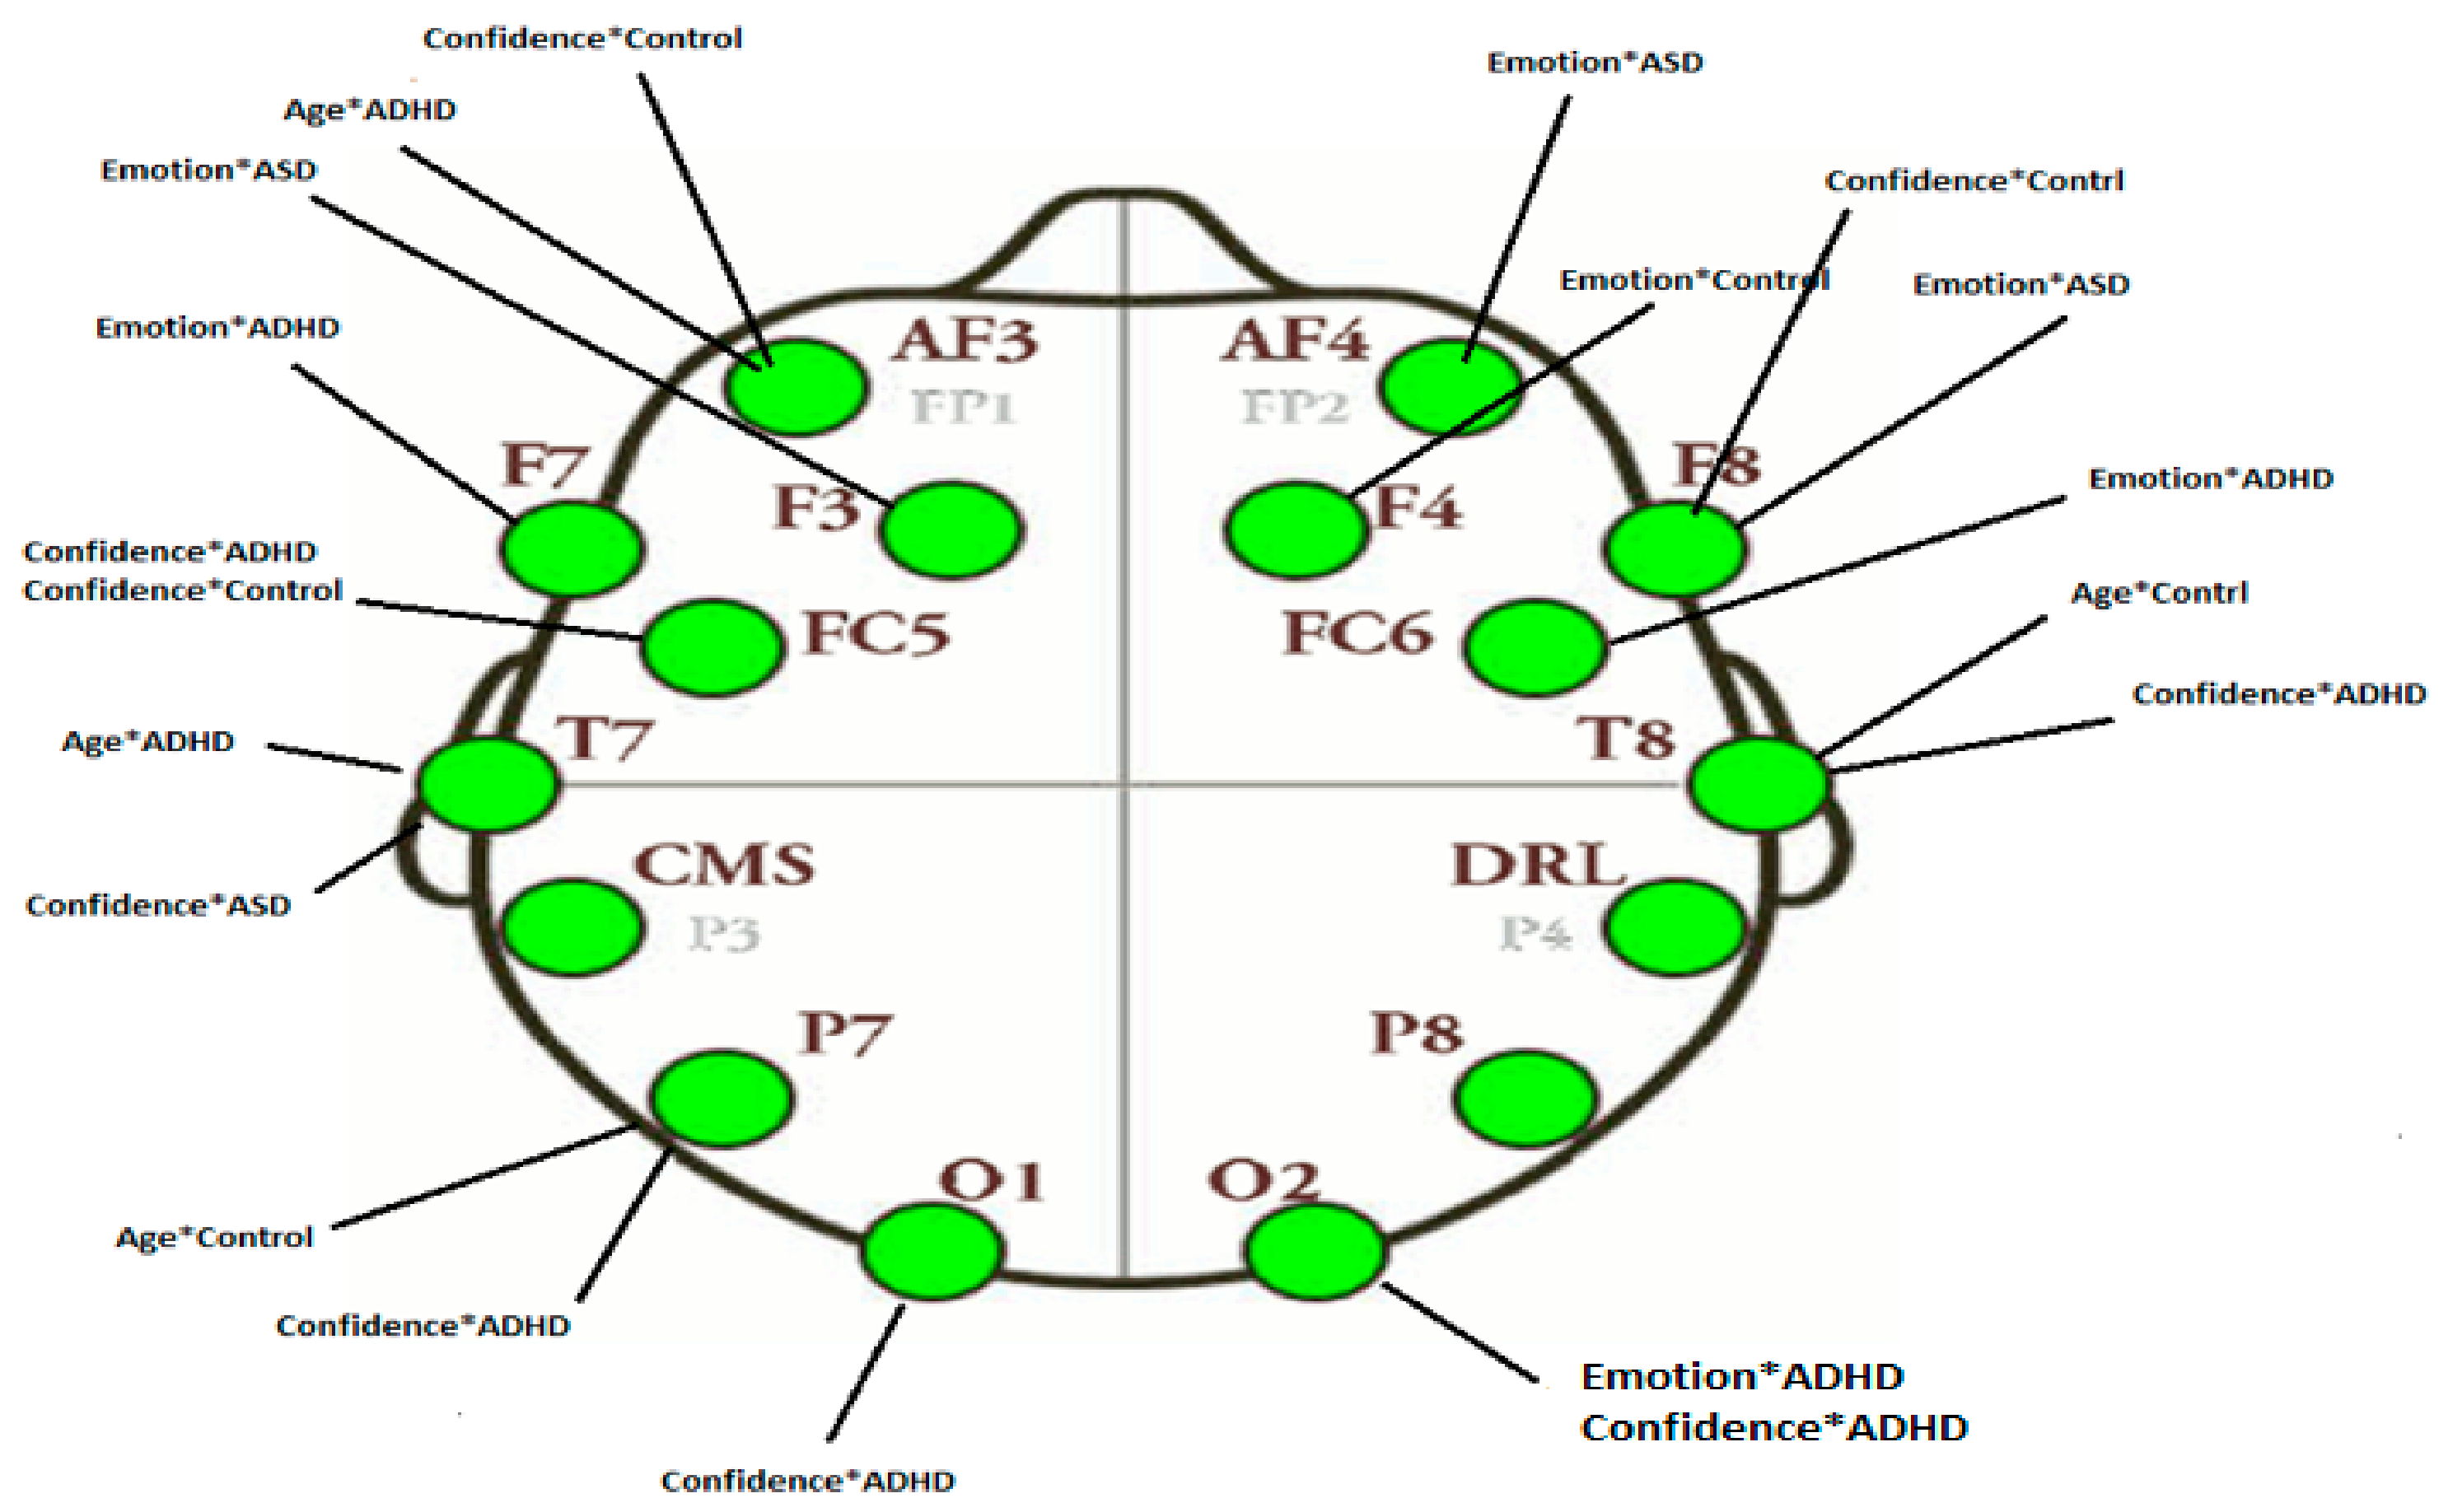
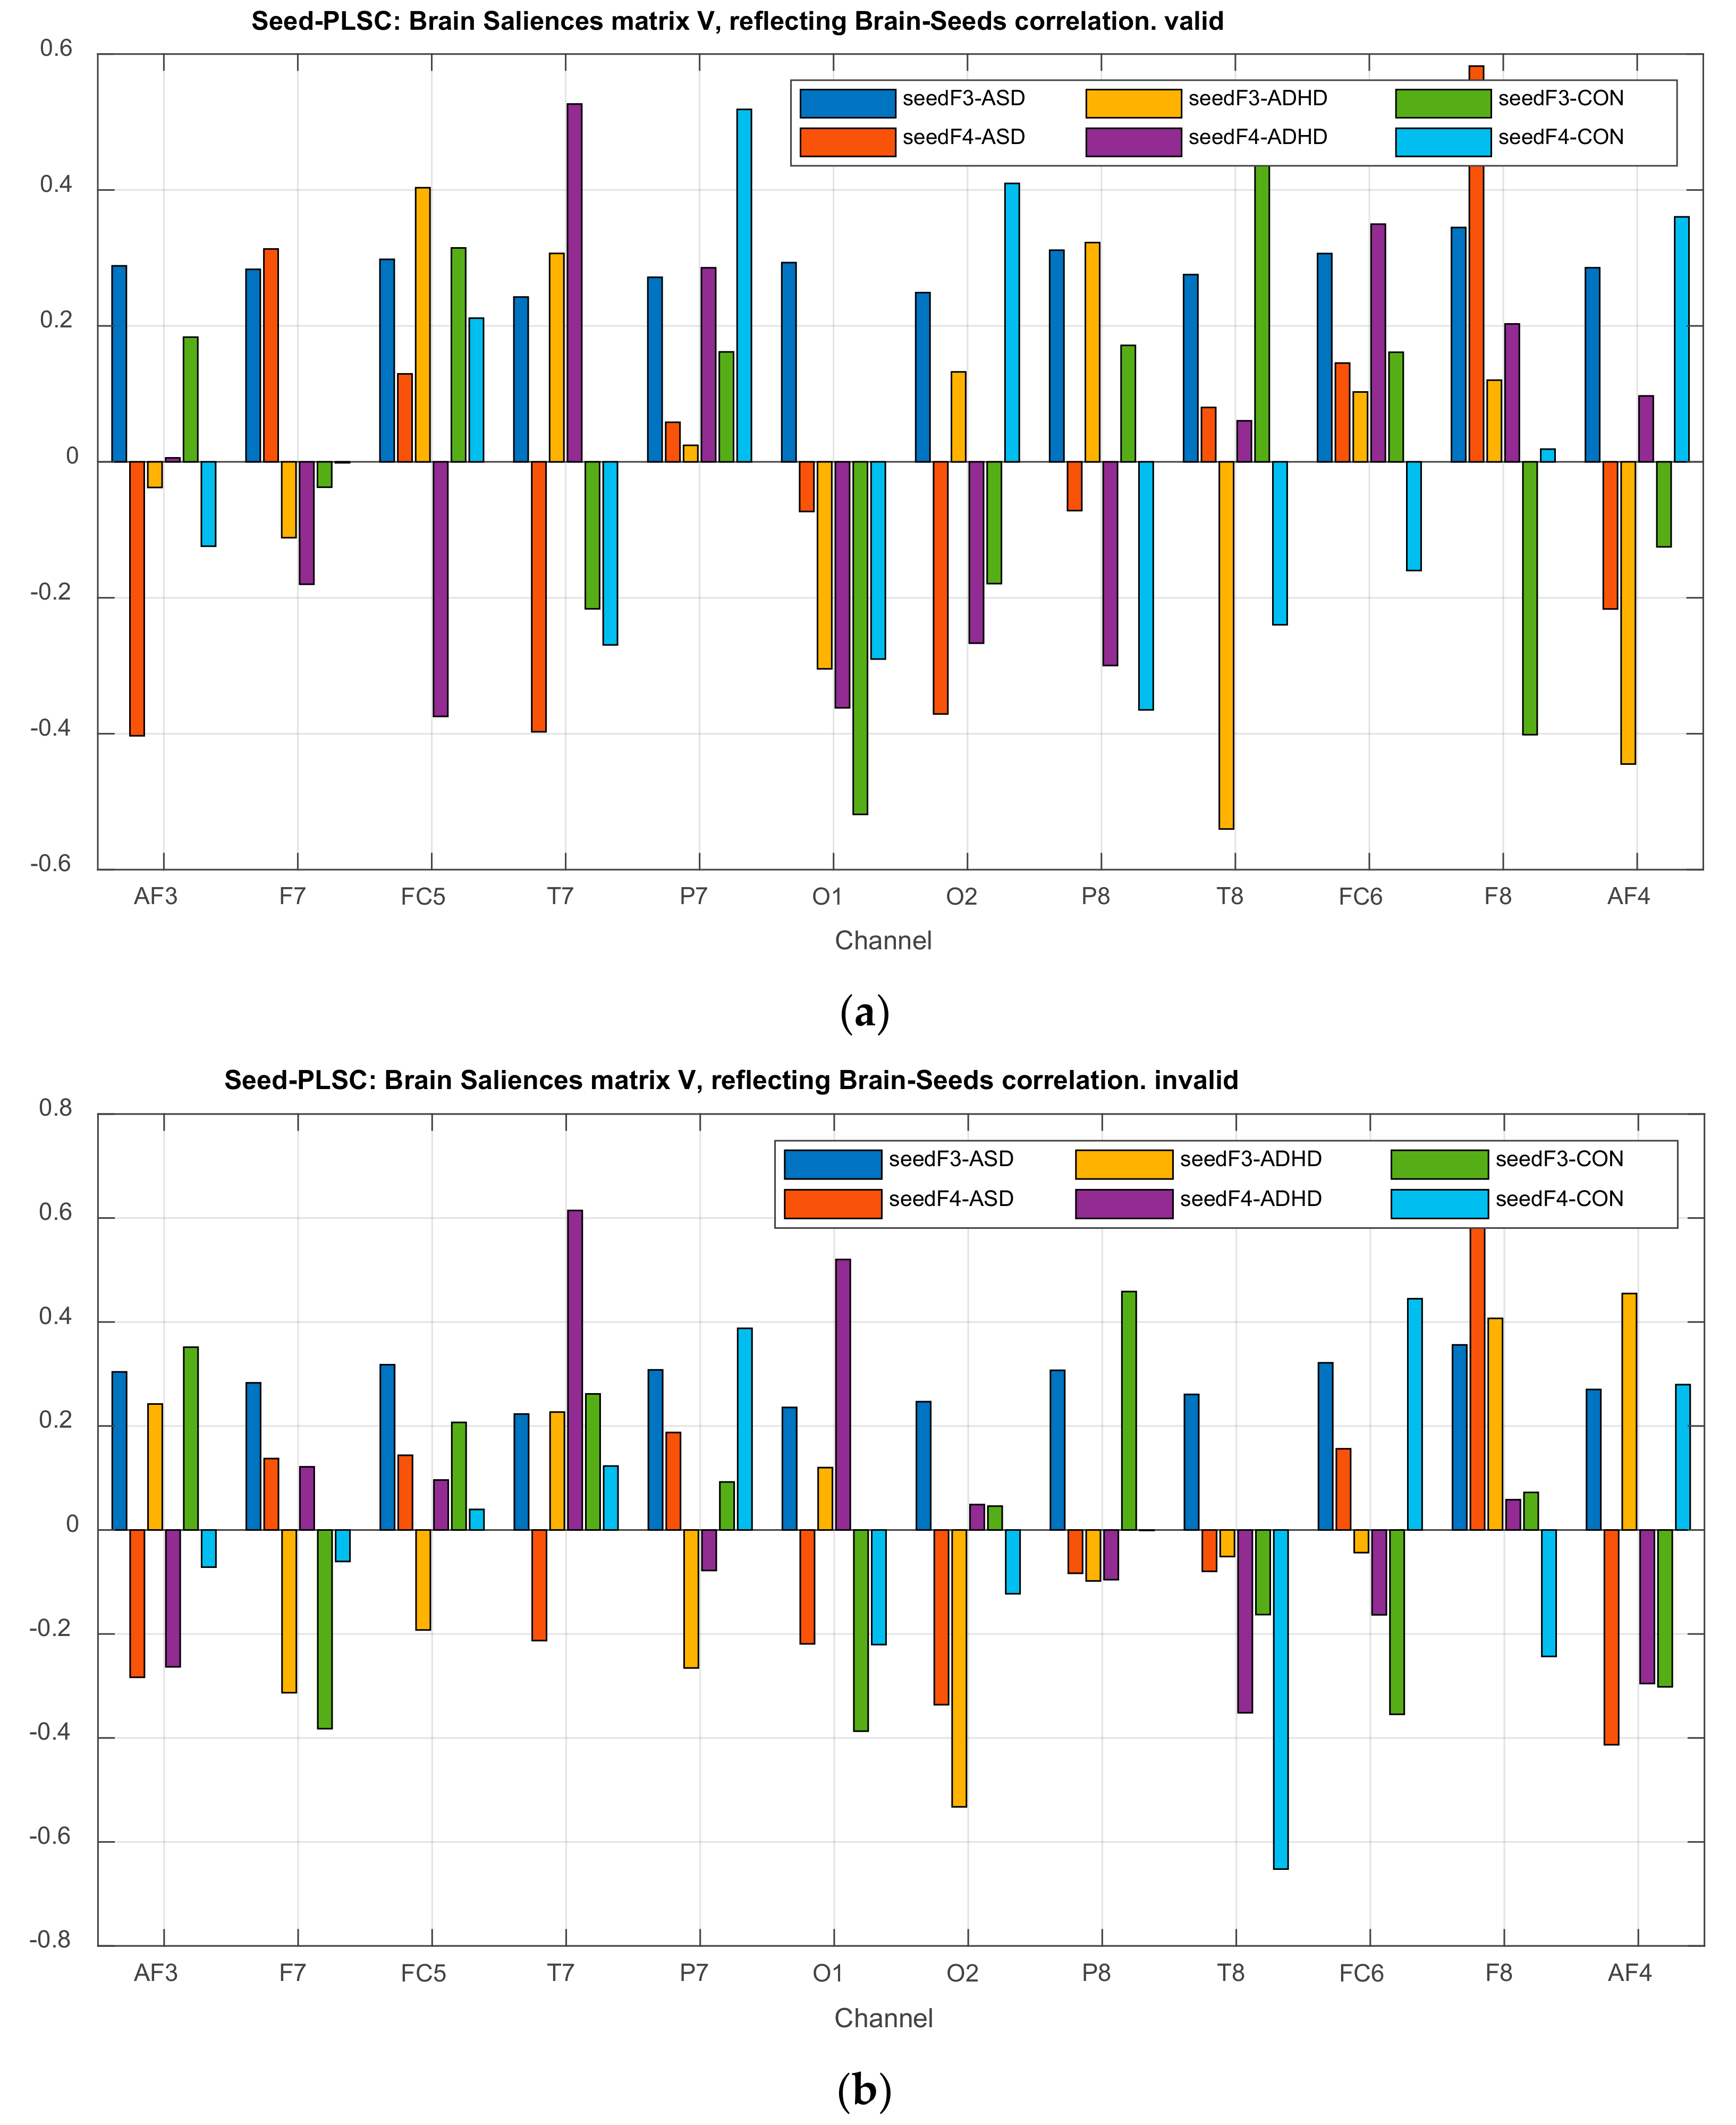
3.2.3. Projections of the Brain–behavior Correlation Matrix on Channels. The ‘Heat Map’
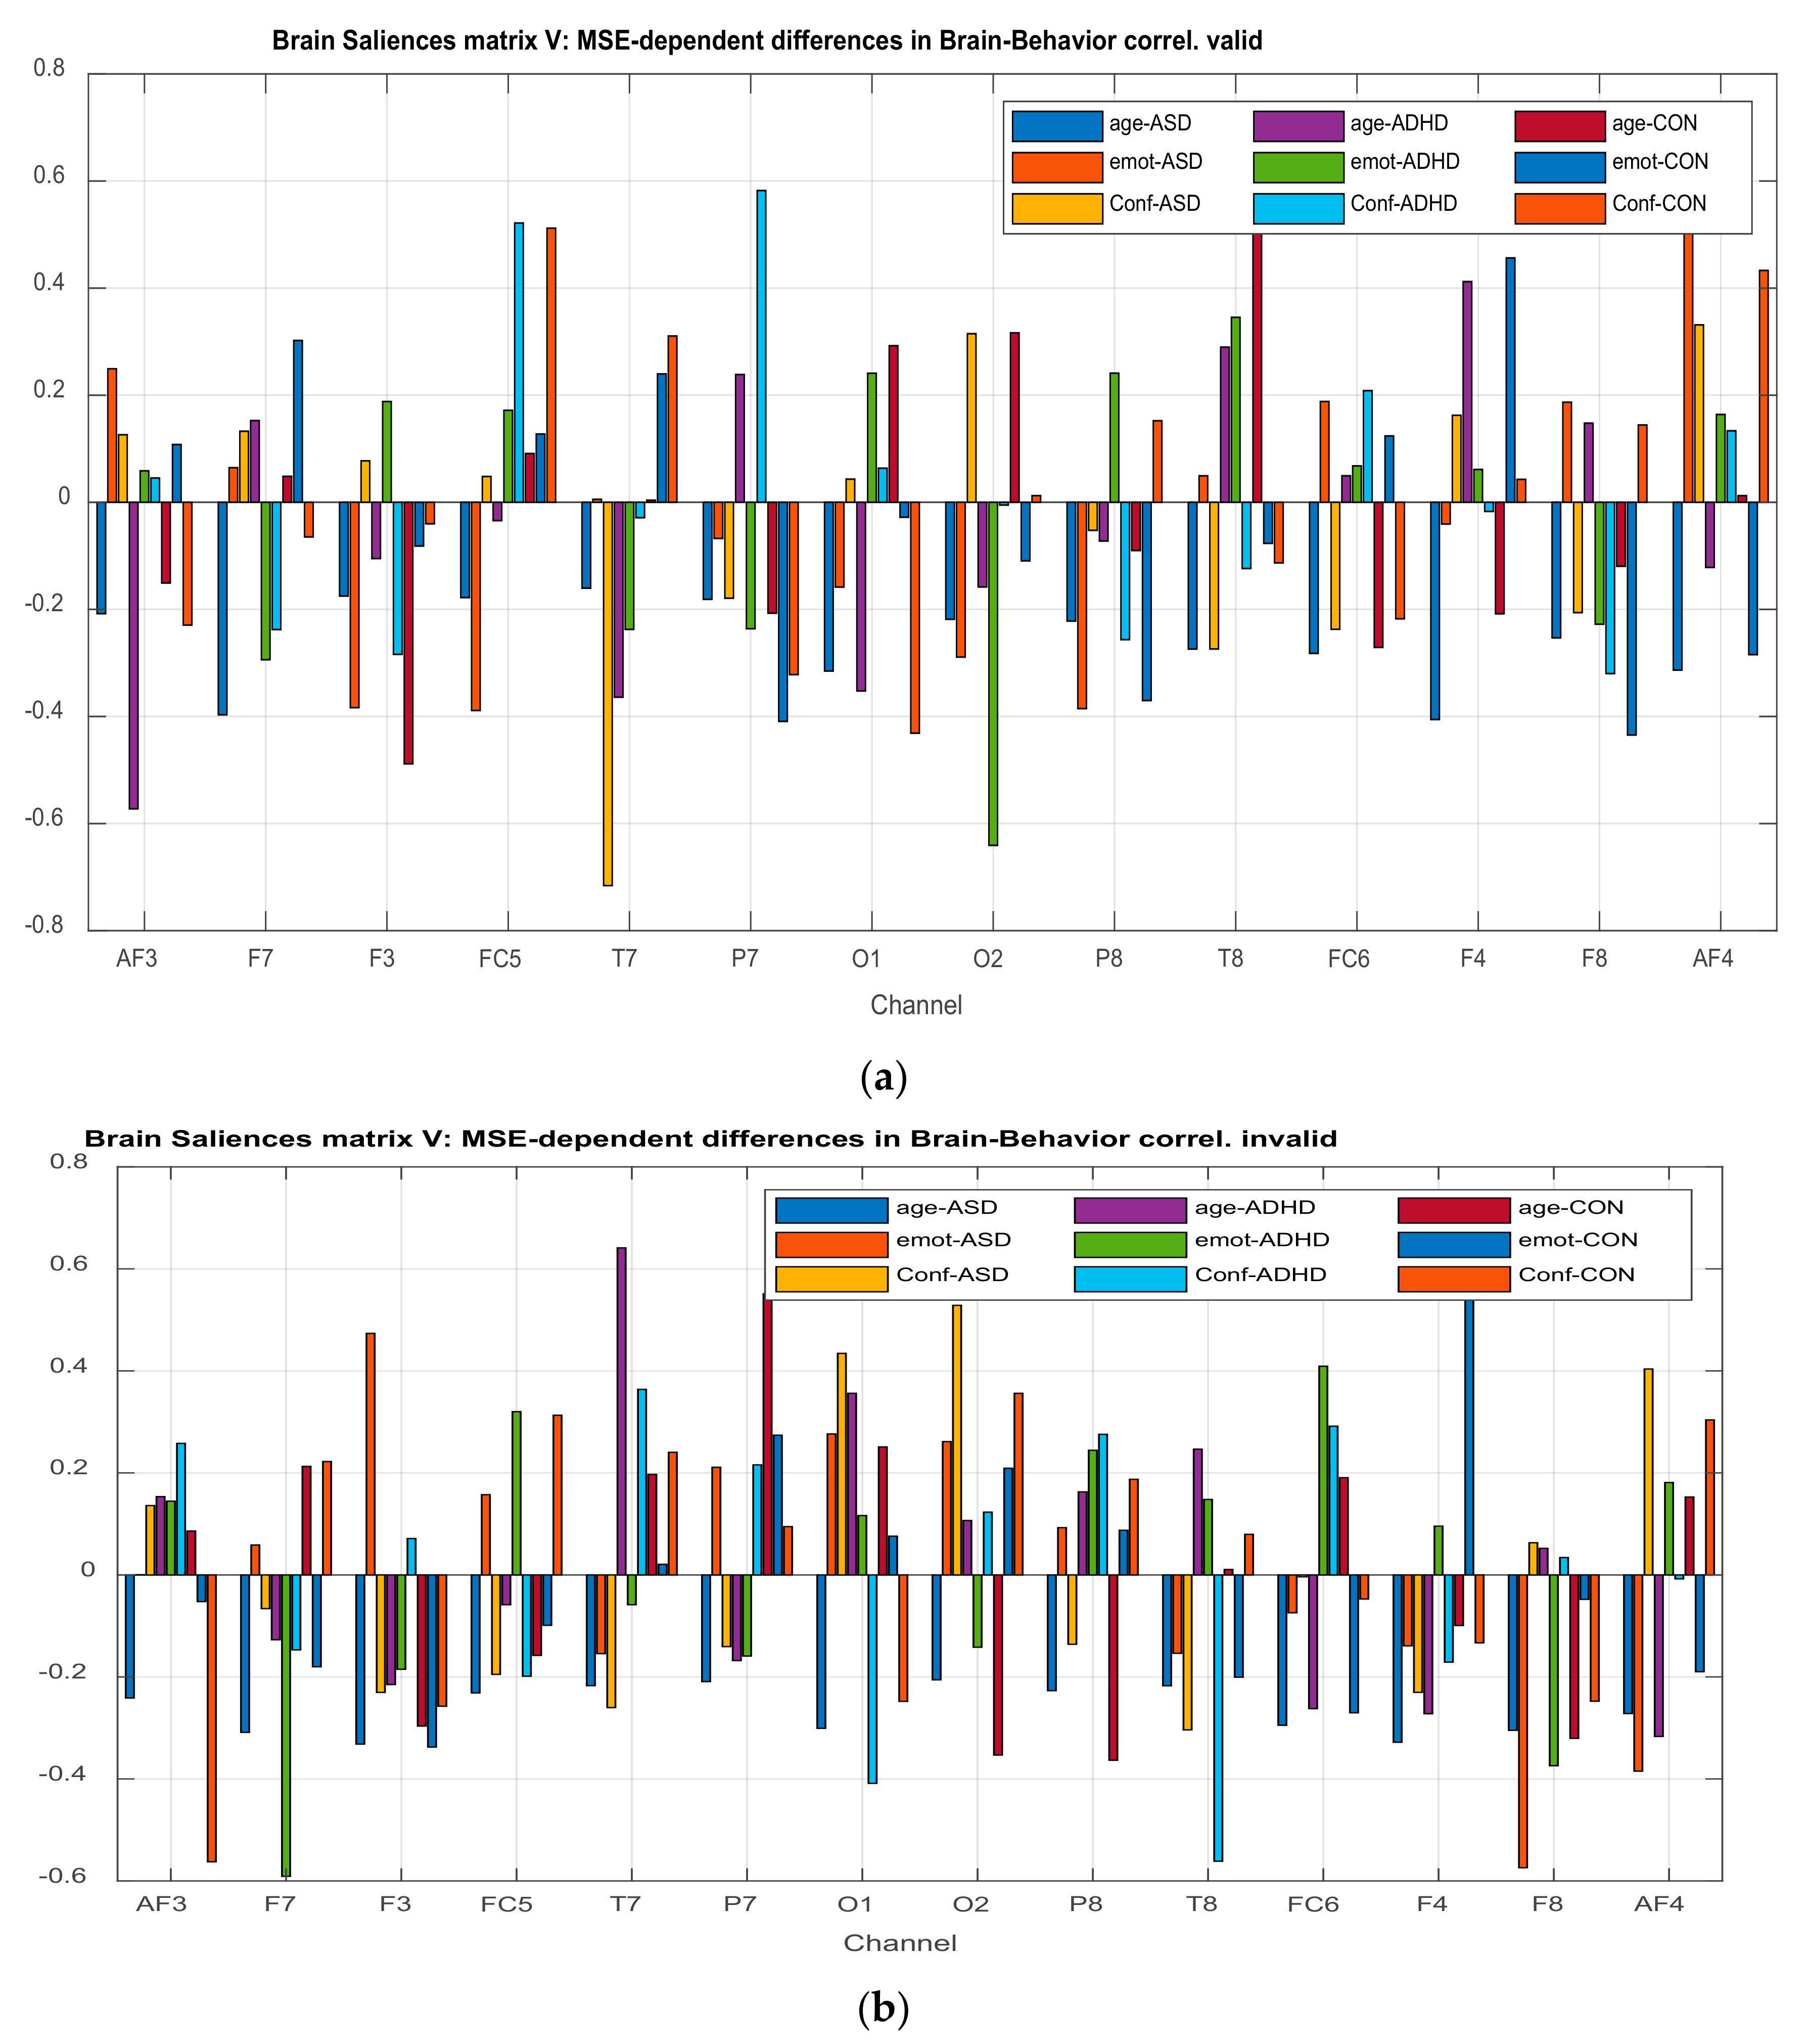
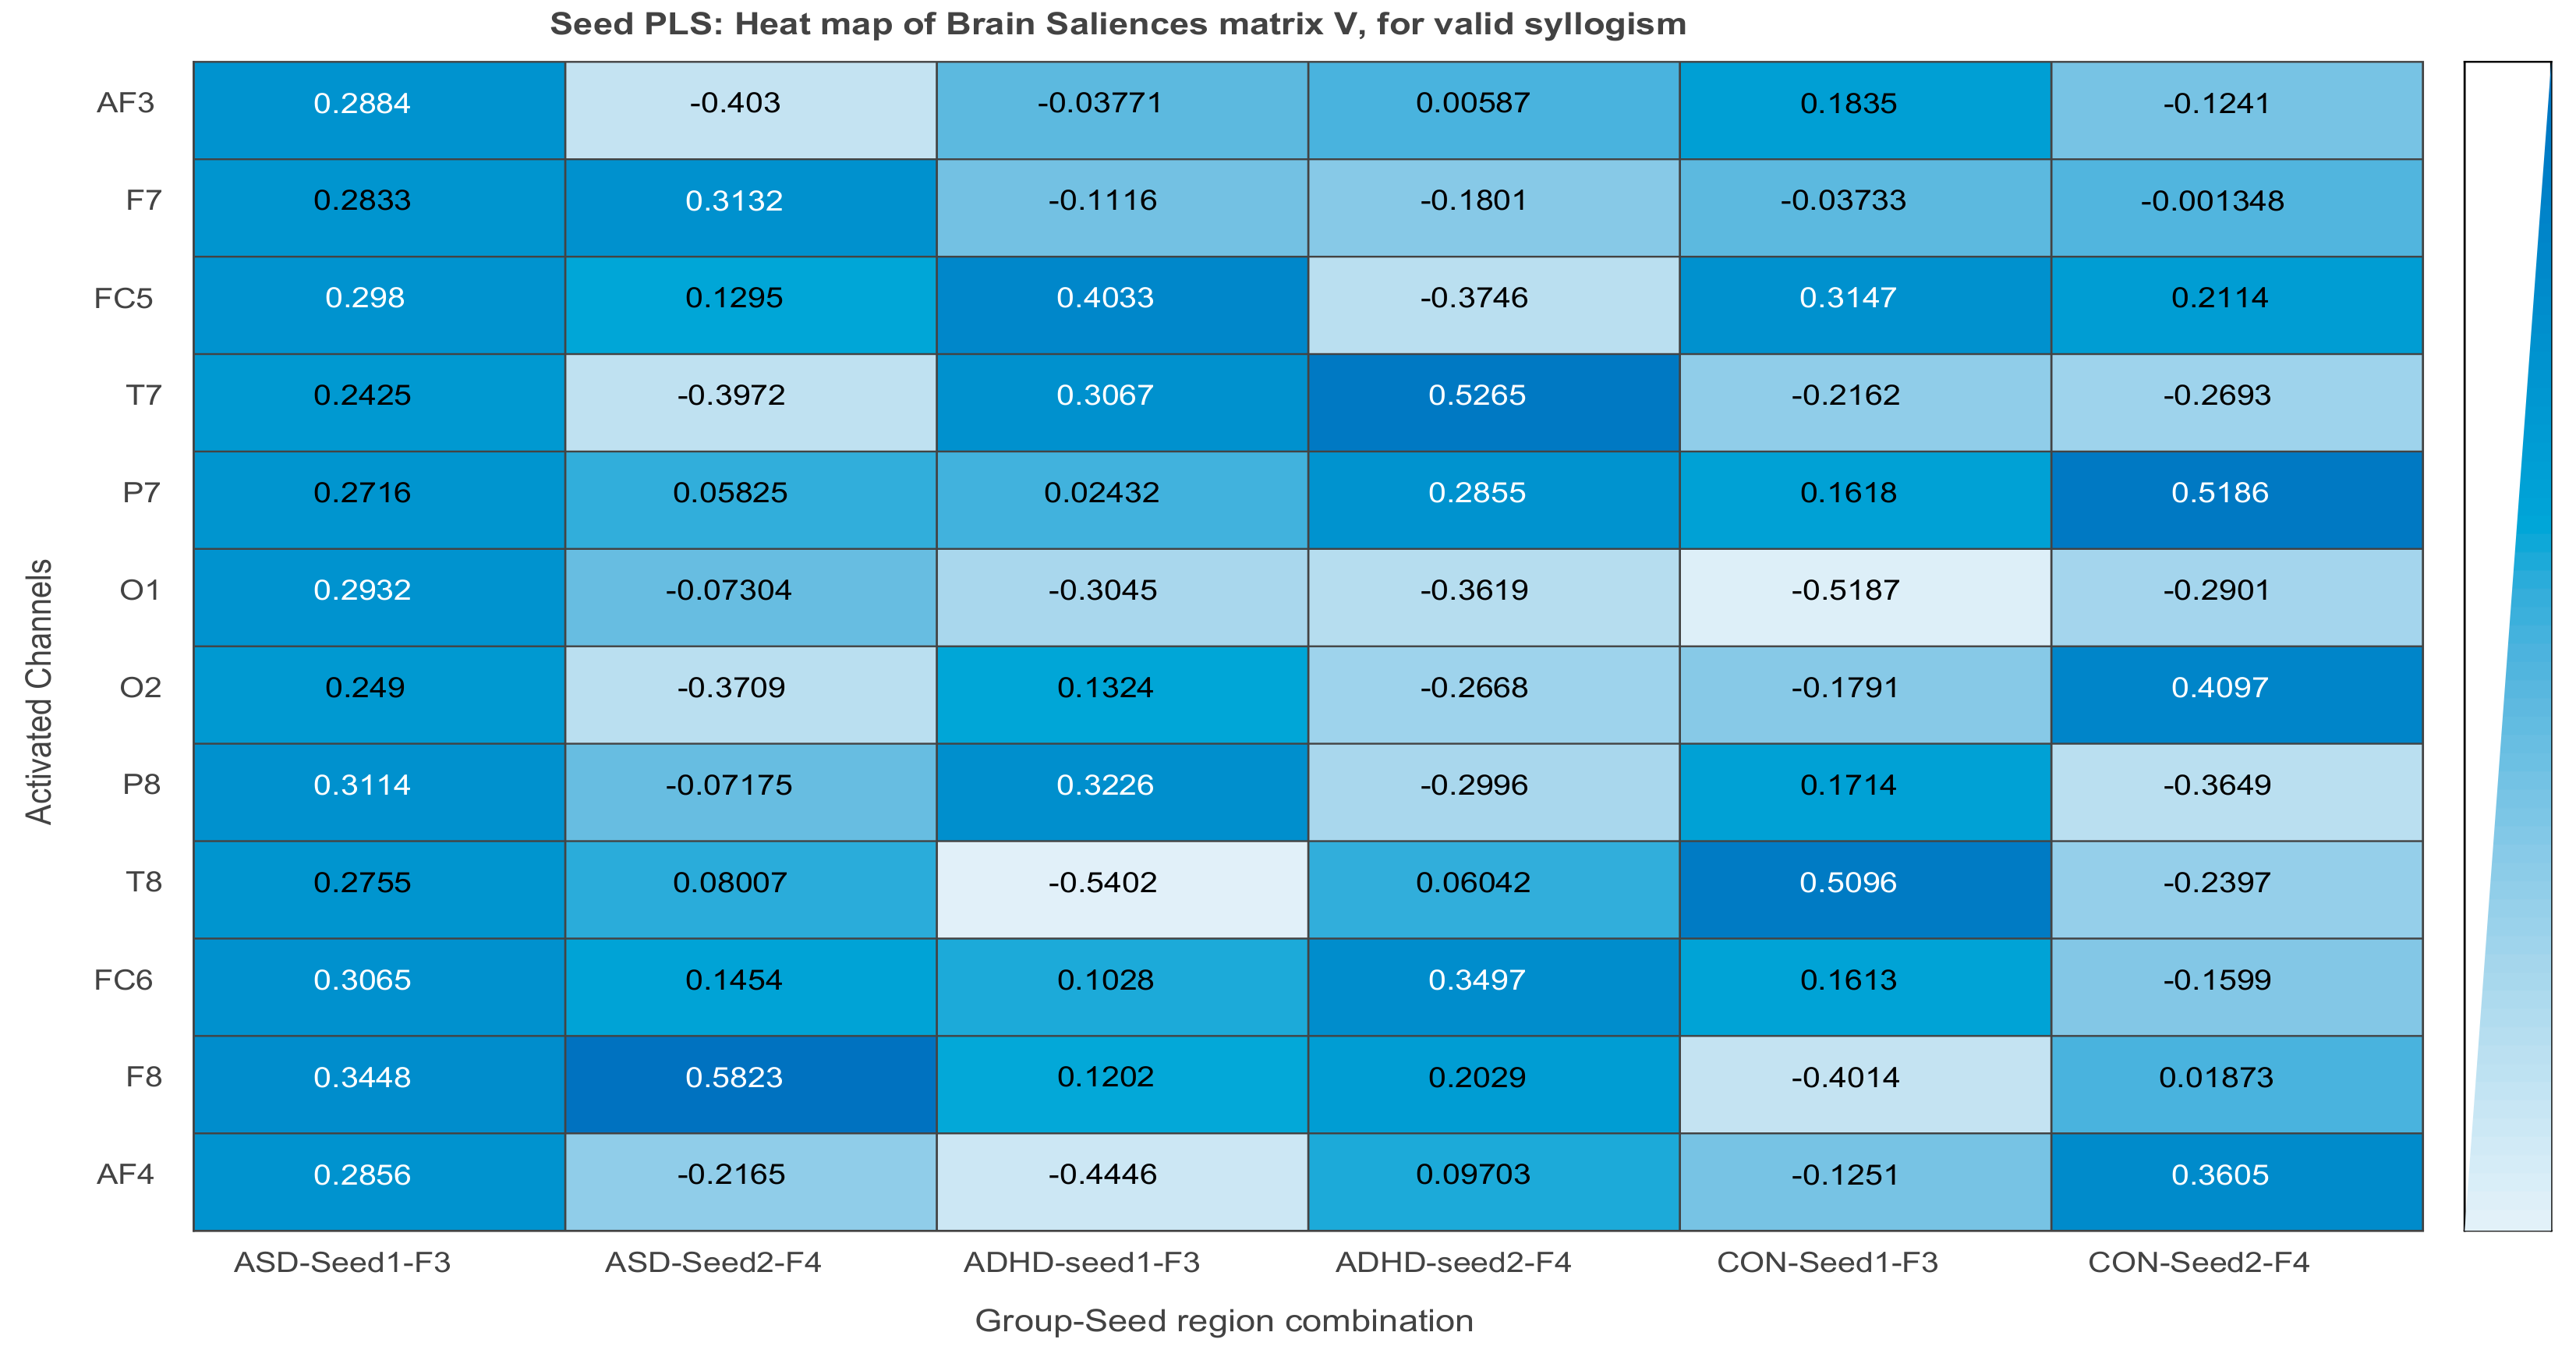
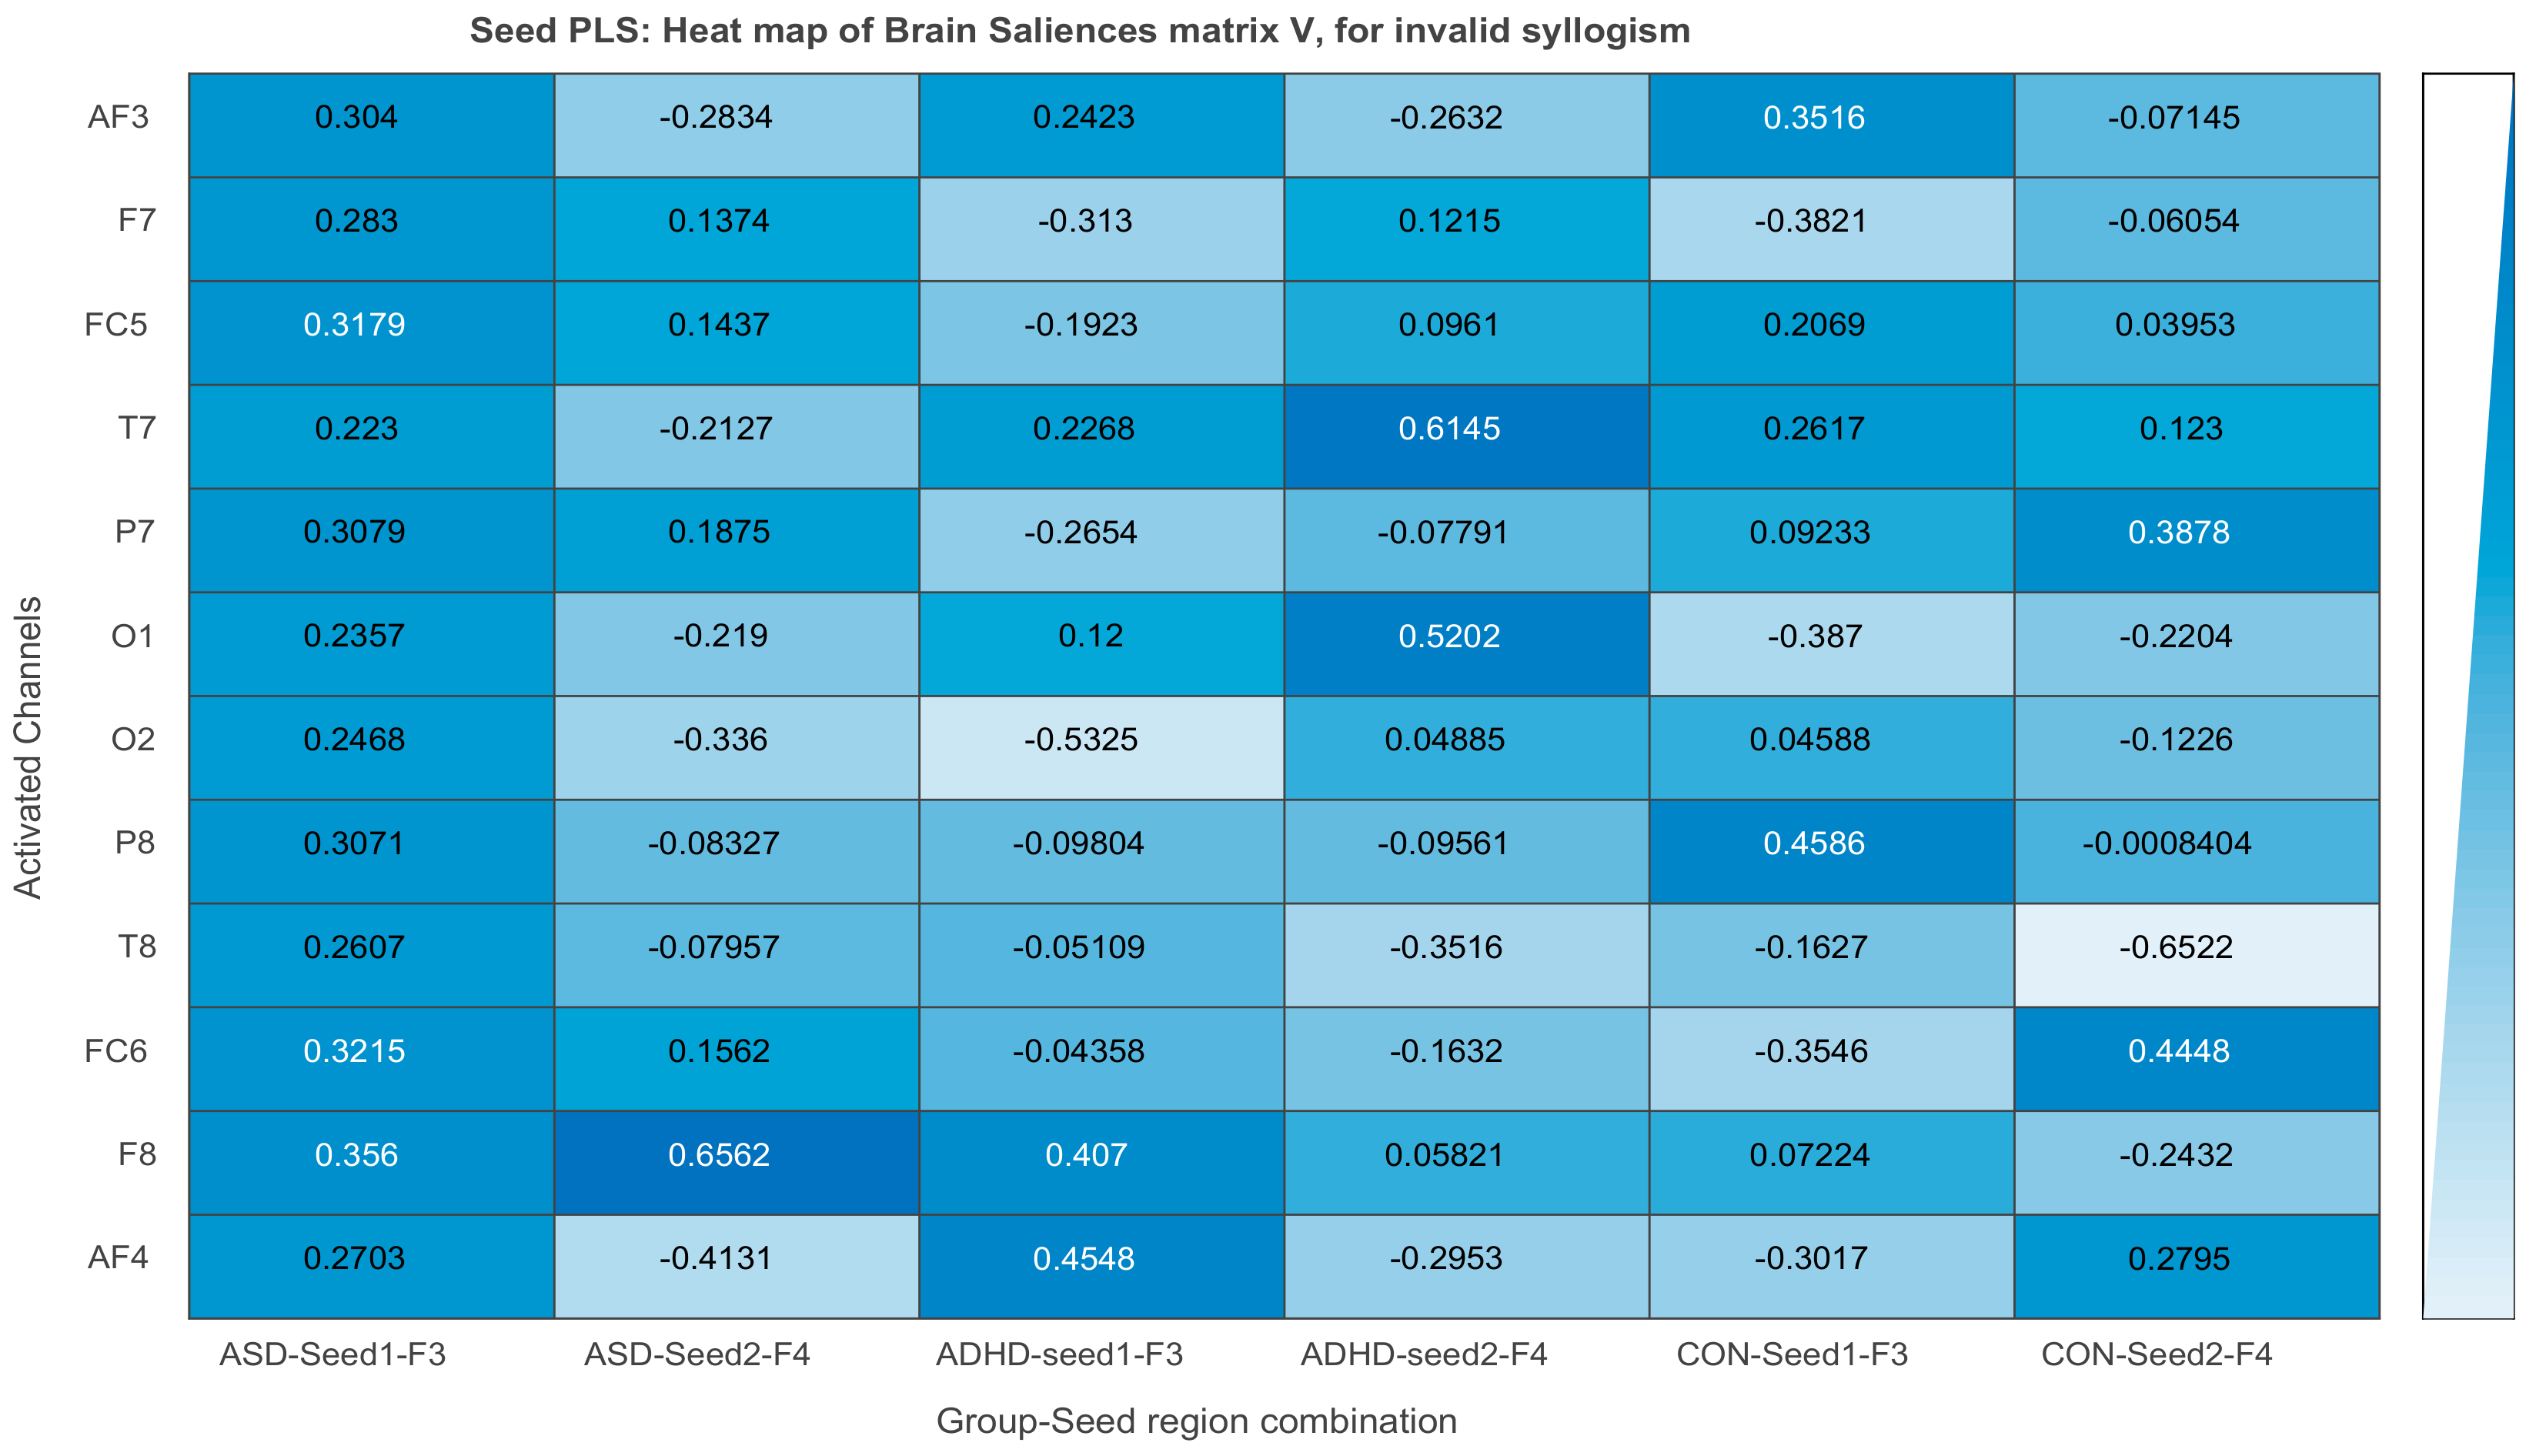
3.2.4. Projection of the Brain Saliences Matrix V on Channel (Brain) Locations
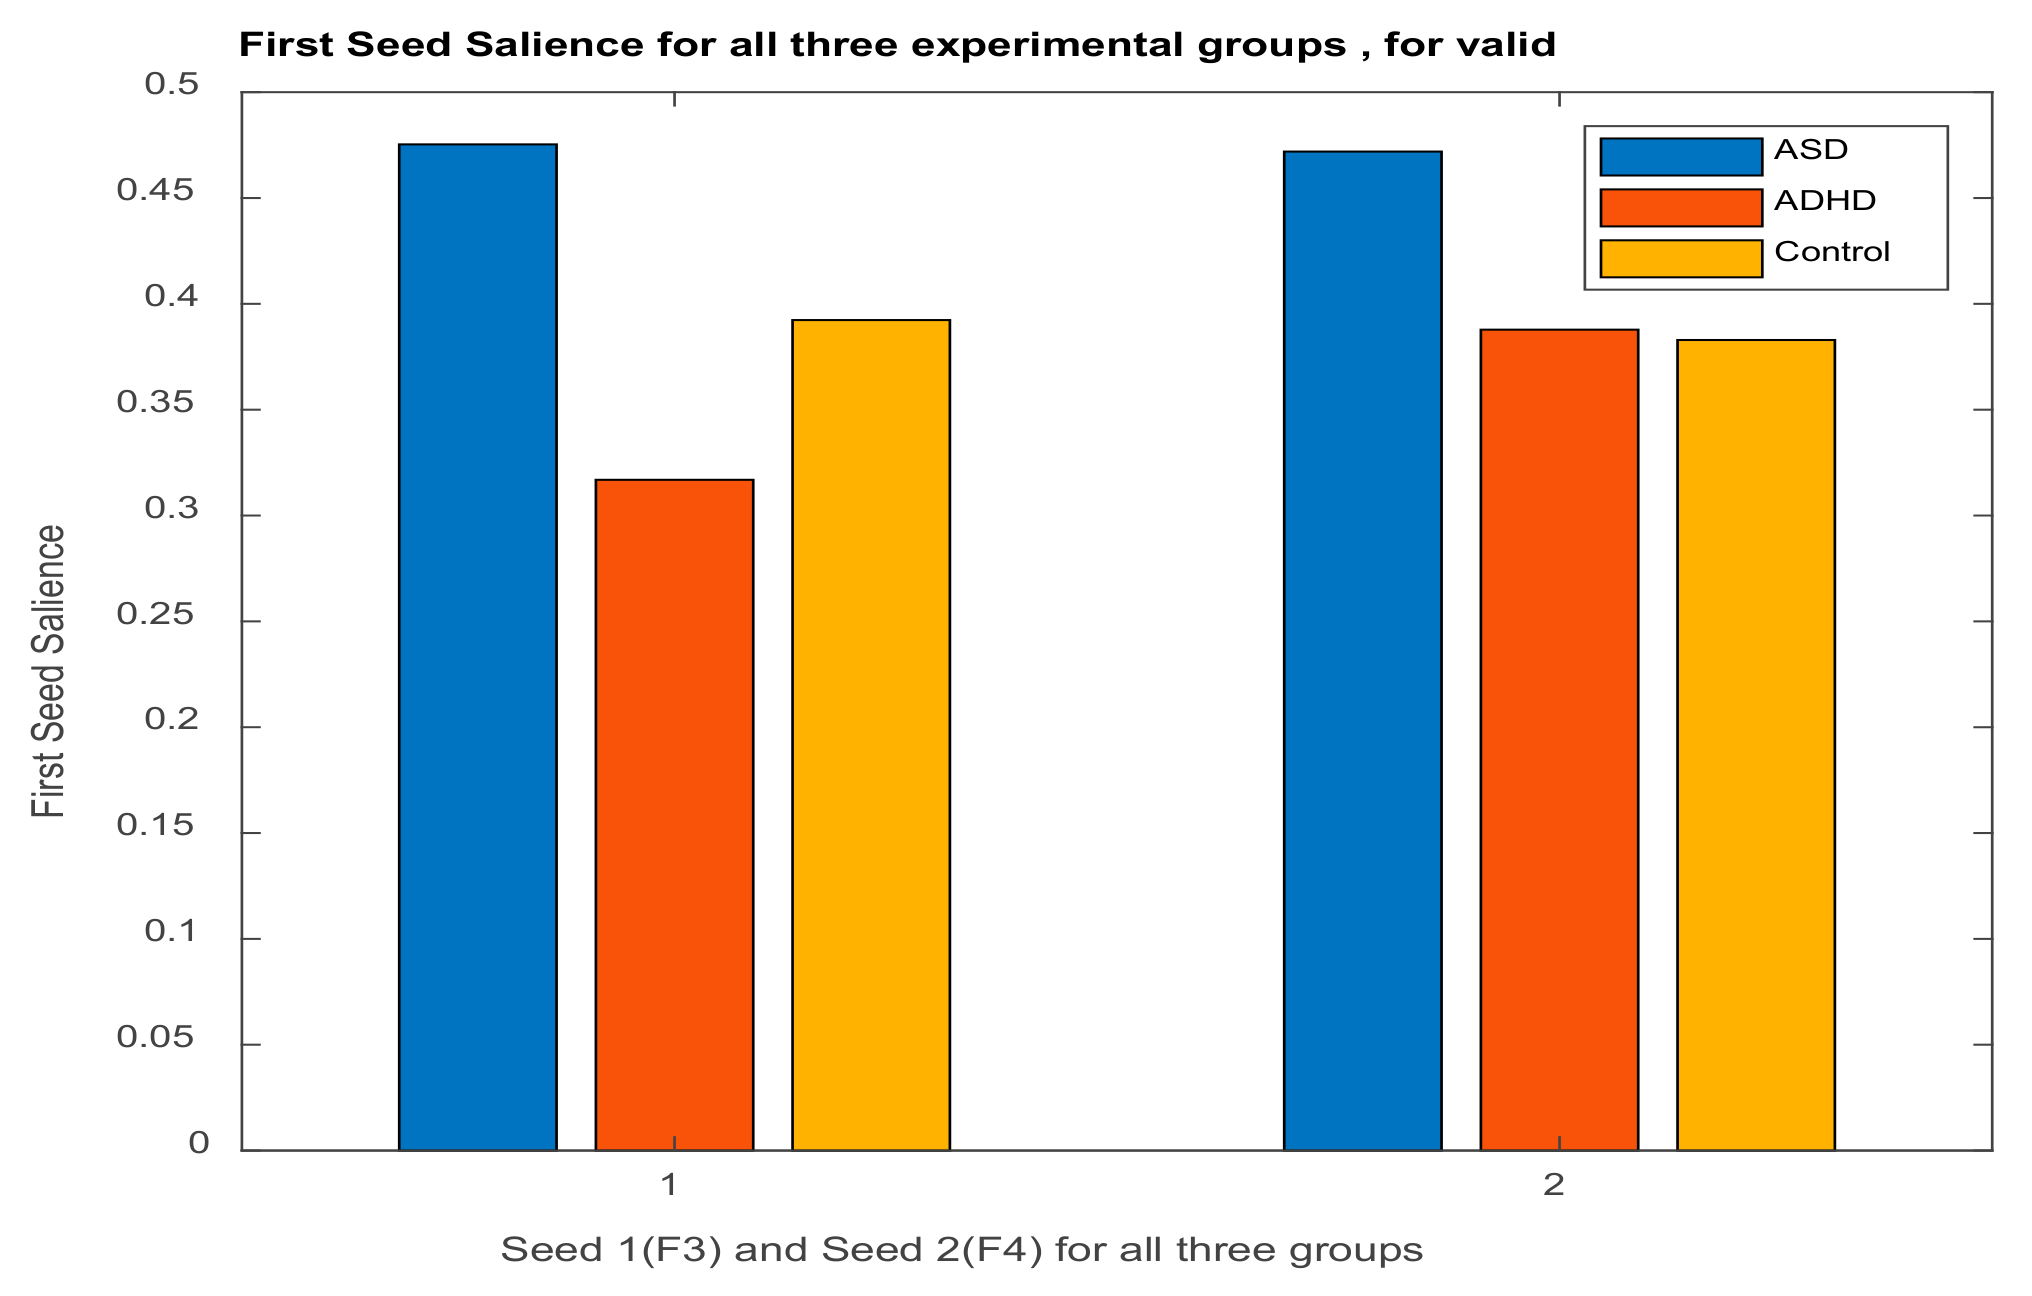
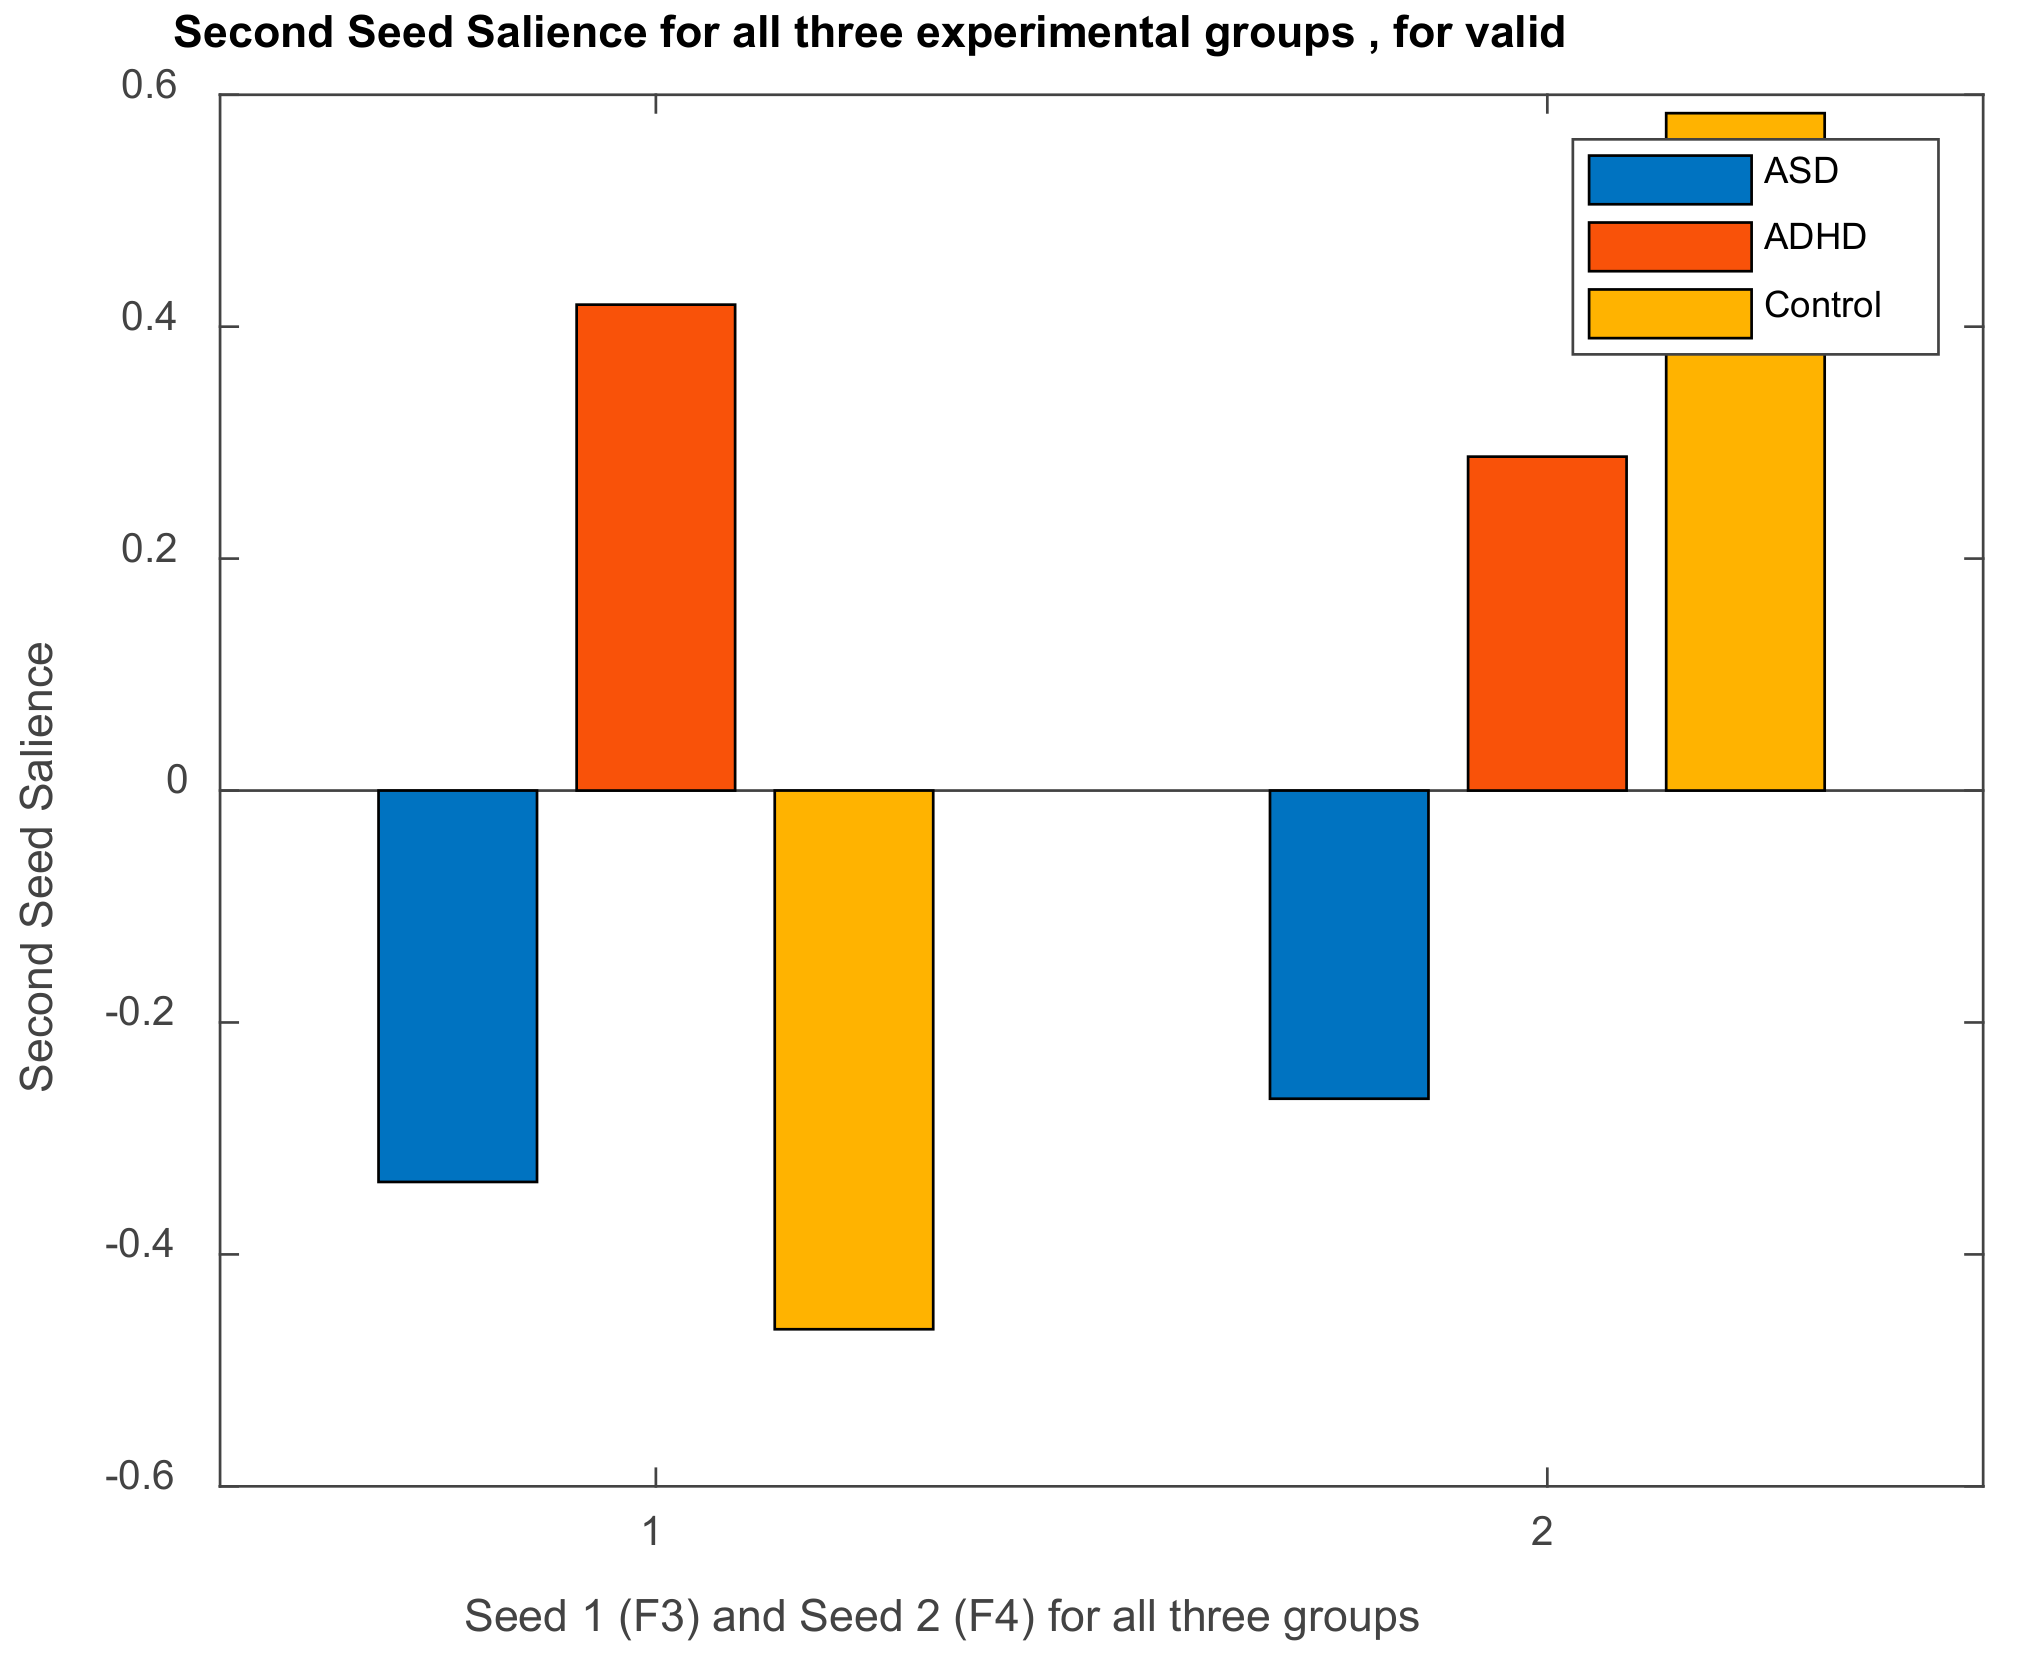
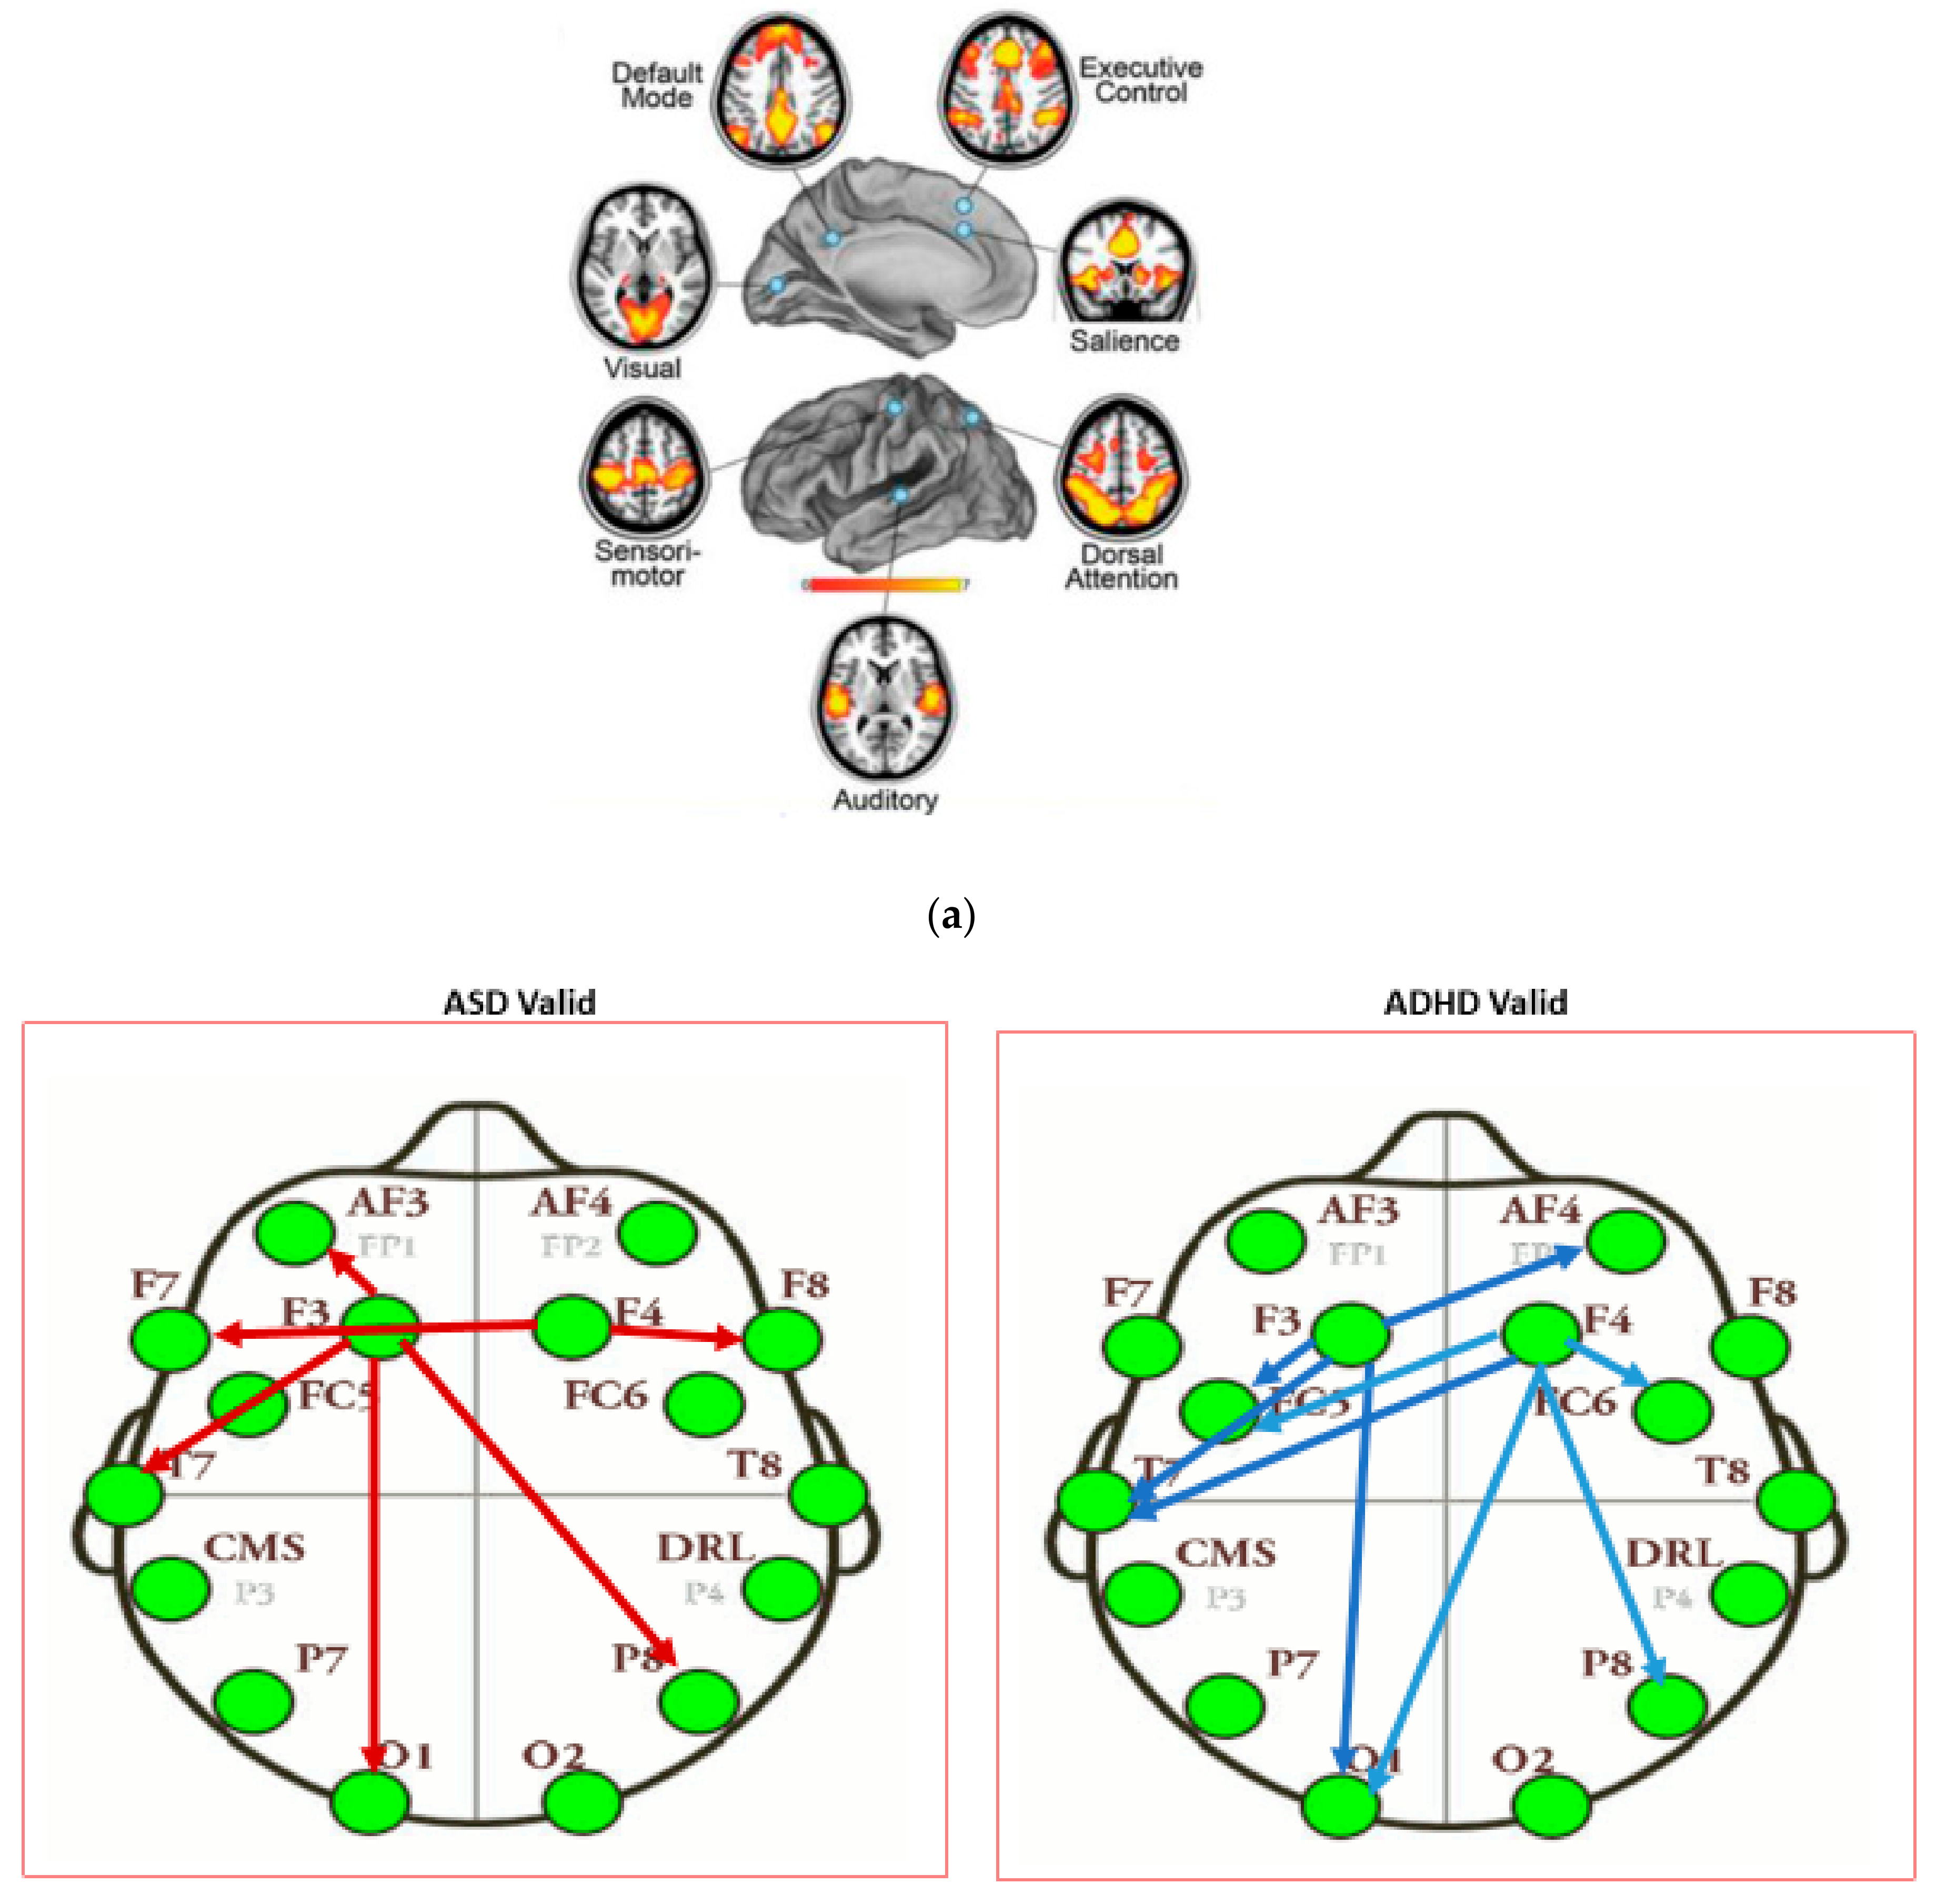
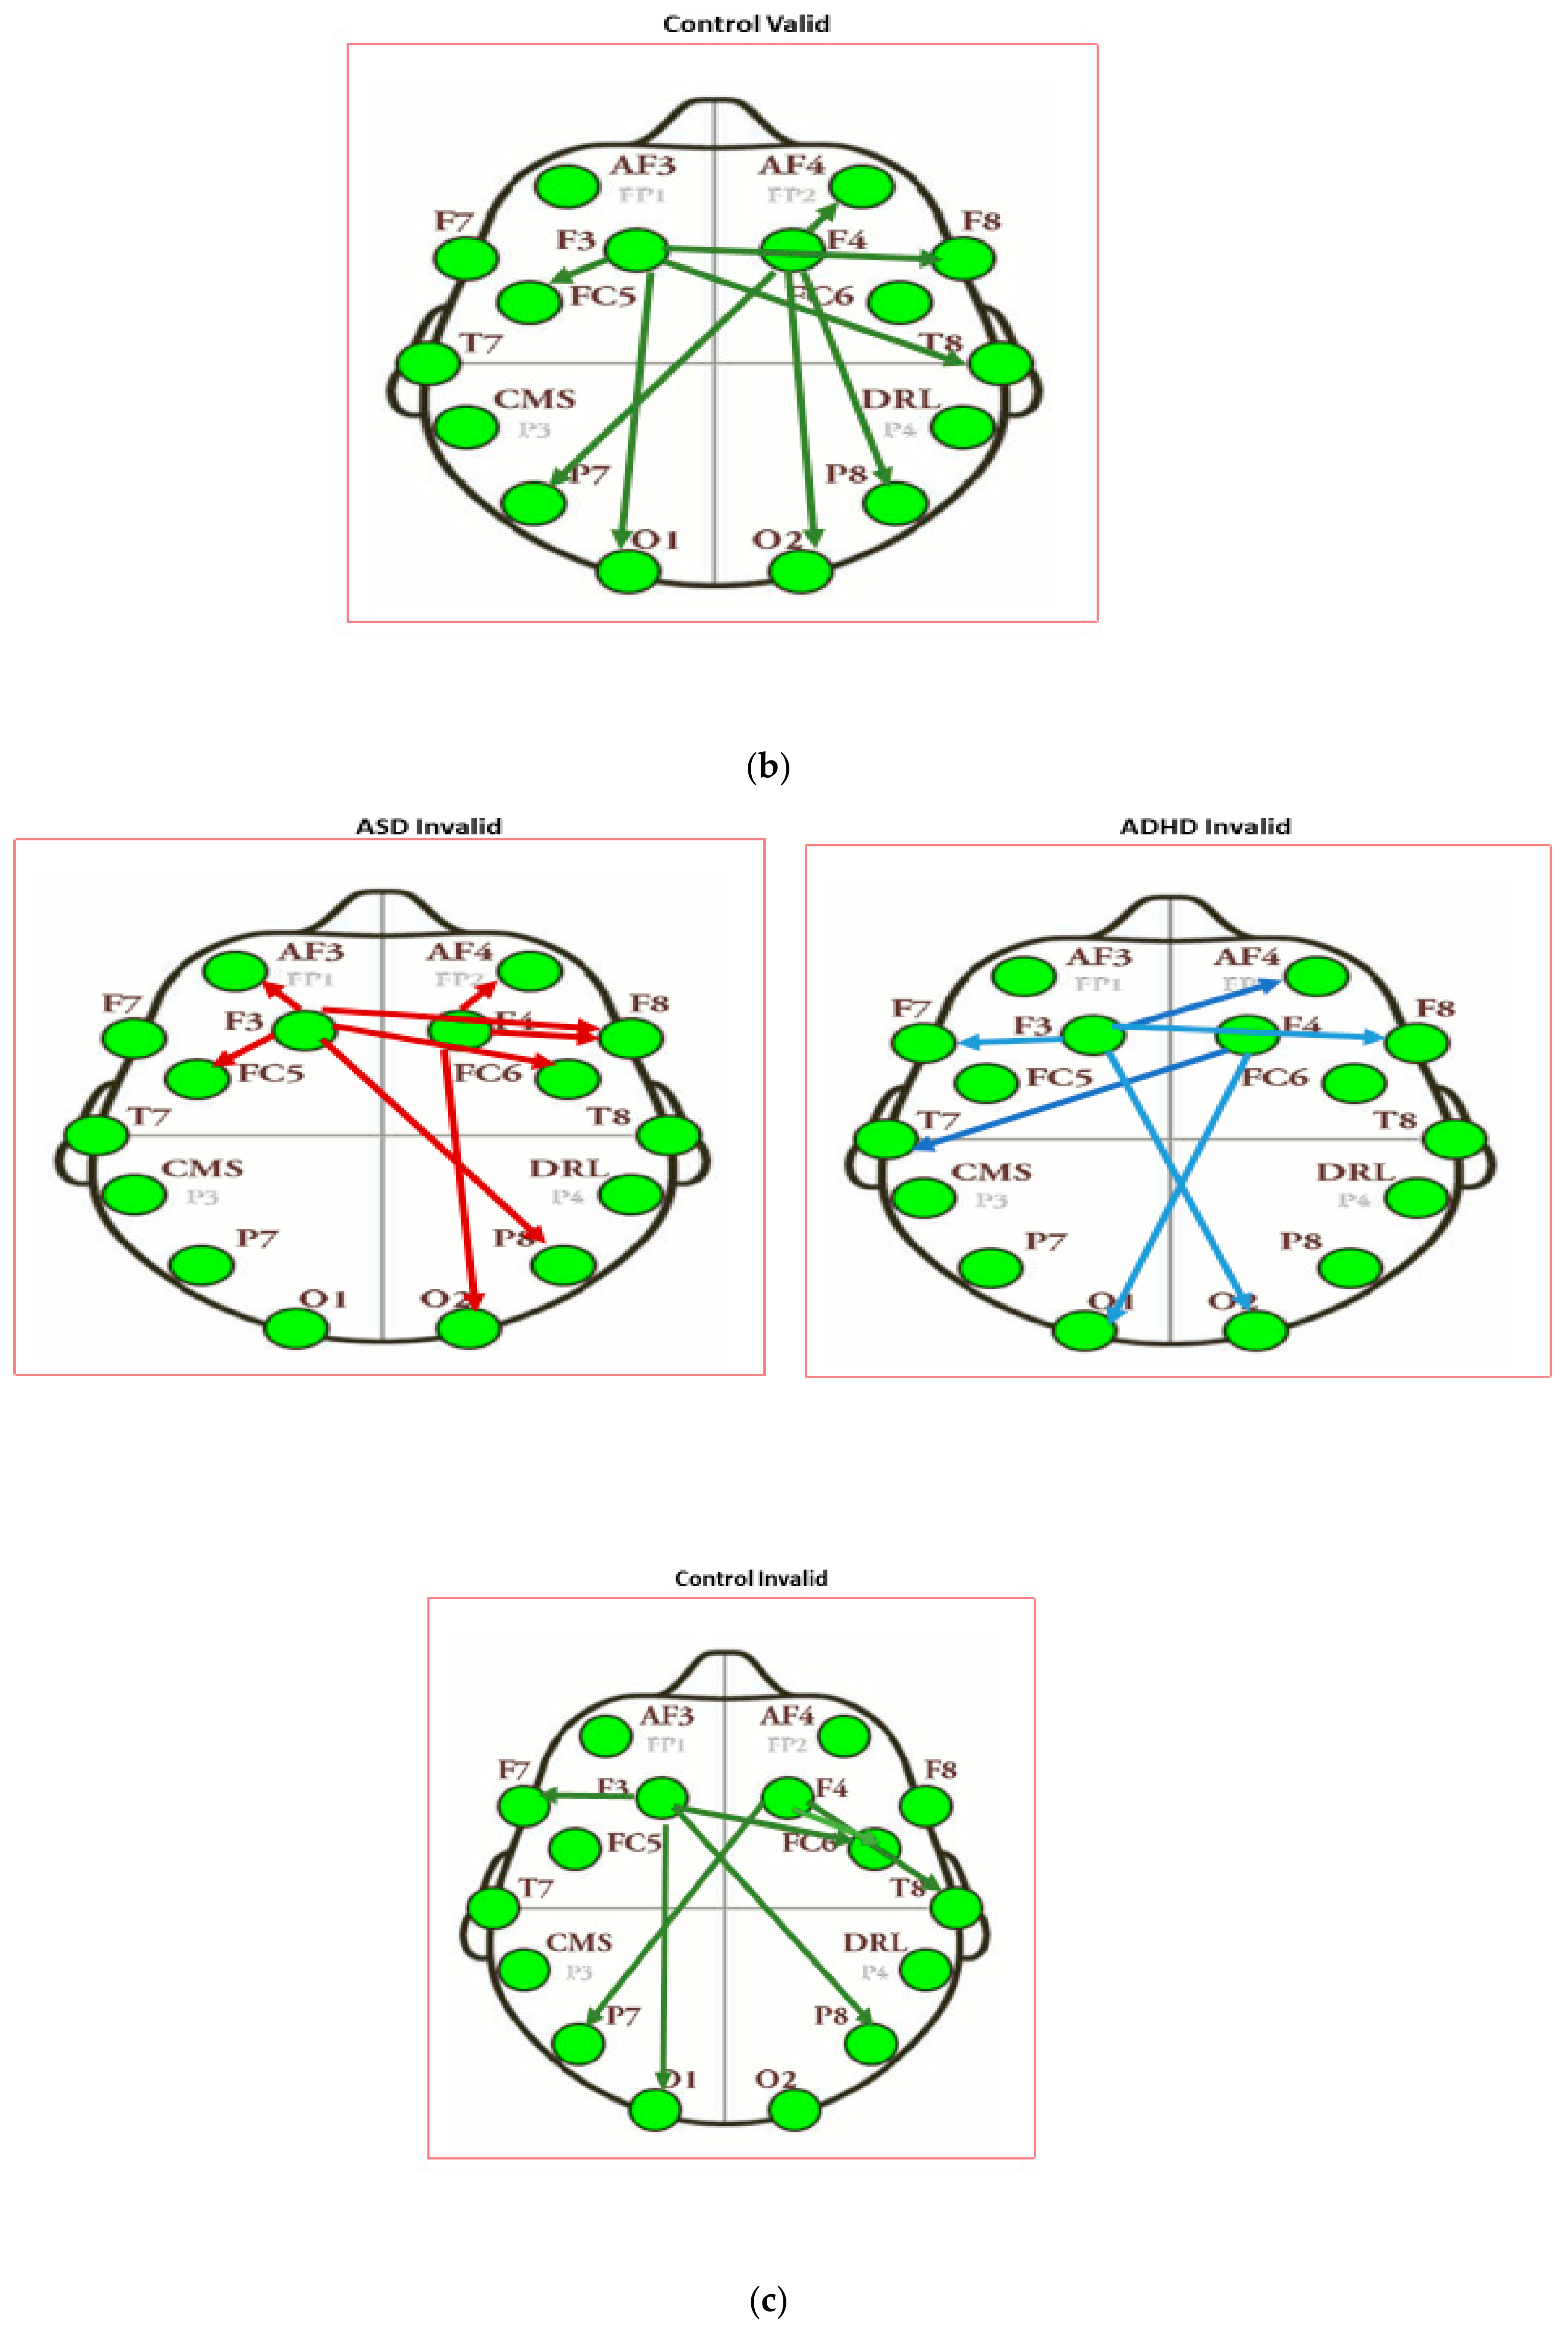
3.3. Results of Seed-PLS for Functional Connectivity
- F3: Left dorsal lateral Prefrontal Cortex (l-DLPFC)
- F4: Right dorsal lateral Prefrontal Cortex (r-DLPFC)
- Middle distance between of AF3 and AF4: medial PFC (mPFC) (a proxy)
- Middle distance between P7 and P8: Precuneus/posterior cingulate (PCC) (a proxy)
- P7: Left lateral parietal (l-LP)
- P8: Right lateral parietal (l-LP)
- T7: Left inferior Temporal (l-infT) (T7 a proxy)
- T8: Right inferior Temporal (r-infT) (T8 a proxy)
4. Discussion and Conclusions
Supplementary Materials
Author Contributions
Funding
Institutional Review Board Statement
Informed Consent Statement
Data Availability Statement
Conflicts of Interest
References
- McIntosh, A.R.; Lobaugh, N.J. Partial least squares analysis of neuroimaging data: Applications and advances. NeuroImage 2004, 23 (Suppl. 1), S250–S263. [Google Scholar] [CrossRef]
- Conway, A.R.A.; Kane, M.J.; Bunting, M.F.; Hambrick, D.Z.; Wilhelm, O.; Engle, R.W. Working memory span tasks: A methodological review and user’s guide. Psychon. Bull. Rev. 2005, 12, 769–786. [Google Scholar] [CrossRef]
- Meidenbauer, K.L.; Choe, K.W.; Cardenas-Iniquez, C.; Huppert, T.J. Load-dependent relationhips between frontal fNIRIS activity and performance: A data driven PLS approach. NeuroImage 2021, 230, 117795. [Google Scholar] [CrossRef]
- Price, J.; Ziolko, S.; Weissfeld, L.; Klunk, W.; Lu, X.; Hoge, J.; Meltzer, C.; Davis, S.; Lopresti, B.; Holt, D.; et al. Quantitative and statistical analyses of PET imaging studies of amyloid deposition in humans. In Proceedings of the IEEE Symposium Conference Record Nuclear Science, Rome, Italy, 16–22 October 2004; pp. 3161–3164. [Google Scholar]
- Folstein, M.F.; Folstein, S.E.; McHugh, P.R. “Mini-Mental State”. A practical method for grading the cognitive state of patients for the clinician. J. Psychiatr. Res. 1975, 12, 189–198. [Google Scholar] [CrossRef]
- Menzies, L.; Achard, S.; Chamberlain, S.R.; Fineberg, N.; Chen, C.-H.; del Campo, N.; Sahakian, B.J.; Robbins, T.W.; Bullmore, E. Neurocognitiveendophenotypesof obsessive–compulsive disorder. Brain 2007, 130, 3223–3236. [Google Scholar] [CrossRef] [PubMed] [Green Version]
- Nestor, P.G.; O’Donnell, B.F.; Mccarley, R.W.; Niznikeiwicz, M.; Barnard, J.; Shen, Z.J.; Bookstein, F.L.; Shenton, M.E. A new statistical method for testing hypotheses of neuropsychological/MRI relationships in schizophrenia: Partial least squares analysis. Schizophr. Res. 2002, 53, 57–66. [Google Scholar] [CrossRef] [Green Version]
- Fujiwara, E.; Schwartz, M.L.; Gao, F.; Black, S.E.; Levine, B. Ventral frontal cortex functionsandquantifiedMRIintraumaticbraininjury. Neuropsychologia 2008, 46, 461–474. [Google Scholar] [CrossRef] [Green Version]
- Evans, J.S.B.; Stanovich, K.E. Theory and metatheory in the study of dual processing: Reply to comments. Perspect. Psychol. Sci. 2013, 8, 263–271. [Google Scholar] [CrossRef] [PubMed]
- Cavanagh, J.F.; Frank, M.J. Frontal theta as a mechanism for cognitive control. Trends Cogn. Sci. 2014, 18, 414–421. [Google Scholar] [CrossRef] [PubMed] [Green Version]
- Hsieh, L.T.; Ranganath, C. Frontal midline theta oscillations during working memory maintenance and episodic encoding and retrieval. NeuroImage 2014, 85, 712–729. [Google Scholar] [CrossRef] [Green Version]
- Klimesch, W. Alpha-band oscillations, attention, and controlled access to stored information. Trends Cogn. Sci. 2012, 16, 606–617. [Google Scholar] [CrossRef] [Green Version]
- Brush, J.E.; Sherbino, J.; Norman, G.R. How expert clinicians intuitively recognize a medical diagnosis. Am. J. Med. 2017, 130, 629–634. [Google Scholar] [CrossRef]
- Barry, R.J.; Johnstone, S.J.; Clarke, A.R. A review of electrophysiology in tentiondeficit/hyperactivity disorder: II. Event-related potentials. Clin. Neurophysiol. 2003, 114, 184–198. [Google Scholar] [CrossRef]
- Tye, C.; McLoughlin, G.; Kuntsi, J.; Asherson, P. Electrophysiological markers ofgenetic risk for attention deficit hyperactivity disorder. Expert Rev. Mol. Med. 2011, 13, e9. [Google Scholar] [CrossRef]
- Lau-Zhu, A.; Fritz, A.; McLoughlin, G. Overlaps and distinctions between attention deficit/hyperactivity disorder and autism spectrum disorder in young adulthood: Systematic review and guiding framework for EEG-imaging research. Neurosci. Biobehav. Rev. 2019, 96, 93–115. [Google Scholar] [CrossRef] [PubMed]
- Newson, J.J.; Thiagarajan, T.C. EEG Frequency Bands in Psychiatric Disorders: A Review of Resting State Studies. Front Hum. Neurosci. 2019, 12, 521. [Google Scholar] [CrossRef]
- Billeci, L.; Sicca, F.; Maharatna, K.; Apicella, F.; Narzisi, A.; Campatelli, G.; Calderoni, S.; Pioggia, G.; Muratori, F. On the application of quantitative EEG for characterizingautistic brain: A systematic review. Front. Hum. Neurosci. 2013, 7, 442. [Google Scholar] [CrossRef] [Green Version]
- Smith, R., Translator; Aristotle’s Prior Analytics; Hacket Publishing Company: Indianapolis, IN, USA; Cambridge, UK, 1989.
- Owen, O.F.; Kenyon, F.G.; Peters, F.H. (Translators) Aristotle’s Organon; Complete edition; Elsevier: Amsterdam, The Netherlands, 2015. [Google Scholar]
- Hattori, M. Probabilistic representation in syllogistic reasoning: A theory to integrate mental models and heuristics. Cognition 2016, 157, 296–320. [Google Scholar] [CrossRef] [Green Version]
- Jhonson-Laird, P.N.; Bara, B.G. Syllogistic inference. Cognition 1984, 16, 1–61. [Google Scholar] [CrossRef]
- Baddeley, A. Working Memory, Thought and Action; Oxford University Press: Oxford, UK, 2007. [Google Scholar]
- Halford, G.S.; Cowan, N.; Andrews, G. Separating cognitive capacity from knowledge: A new hypothesis. Trends Cogn. Sci. 2007, 11, 236–242. [Google Scholar] [CrossRef] [PubMed] [Green Version]
- De Neys, W. Dual processing in reasoning: Two systems but one reasoned. Psychol. Sci. 2006, 17, 428–433. [Google Scholar] [CrossRef] [PubMed]
- Goel, V. Anatomy of deductive reasoning. Trends Cogn. Sci. 2007, 11, 435–441. [Google Scholar] [CrossRef]
- Williams, C.C.; Kappen, M.; Hassall, C.D.; Wright, B.; Krigolson, O.E. Thinking theta and alpha: Mechanisms of intuitive and analytical reasoning. NeuroImage 2019, 189, 574–580. [Google Scholar] [CrossRef]
- Papaodysseus, C.; Zannos, S.; Giannopoulos, F.; Arabadjis, D.; Rousopoulos, P.; Stathes, X.; Papageorgiou, C. A new approach for the classification of event related potentials for valid and paradox reasoning. Biocybern. Biomed. Enginnering 2016, 30, 292–301. [Google Scholar] [CrossRef]
- Papageorgiou, C.; Stachtea, X.; Papageorgiou, P.; Alexandridis, A.T.; Tsaltas, E.; Angelopoulos, E. Aristotle Meets Zeno: Psychophysiological Evidence. PLoS ONE 2016, 11, e0168067. [Google Scholar] [CrossRef] [Green Version]
- Papageorgiou, C.; Papageorgiou, P.; Stachtea, X.; Alexandridis, A.T.; Margariti, M.; Rizos, E.; Chrousos, G.; Tsaltas, E. Aristotelian vs. Paradoxical Reasoning Elicit Distinct N400 ERPs. Int. J. Clin. Med. Res. 2018, 5, 35–43. [Google Scholar]
- Goel, V.; Buchel, C.; Frith, C.; Dolan, R.J. Dissociation of mechanisms underlying syllogistic reasoning. NeuroImage 2000, 12, 504–514. [Google Scholar] [CrossRef] [PubMed] [Green Version]
- Knauff, M. How our brains reason logically. Topoi 2007, 26, 19–36. [Google Scholar] [CrossRef]
- Matson, J.L.; Nebel-Schwalm, M.S. Comorbid psychopathology with autism spectrum disorder in children: An overview. Res. Dev. Disabil. 2007, 28, 341–352. [Google Scholar] [CrossRef] [PubMed] [Green Version]
- Matsuura, N.; Ishitobi, M.; Arai, S.; Kawamura, K.; Asano, M.; Inohara, K.; Kosaka, H. Distinguishing between autism spectrum disorder and attention deficit hyperactivity disorder by using behavioral checklists, cognitive assessments, and neuropsychological test battery. Asian J. Psychiatry 2014, 12, 50–57. [Google Scholar] [CrossRef] [PubMed]
- Alvarez, J.A.; Emory, E. Executive function and the frontal lobes: A metaanalytic review. Neuropsychol. Rev. 2006, 16, 17–42. [Google Scholar] [CrossRef] [PubMed]
- Ozonoff, S.; Cook, I.; Coon, H.; Dawson, G.; Joseph, R.M.; Klin, A.; McMahon, W.M.; Minshew, N.; Munson, J.A.; Pennington, B.F.; et al. Performance on Cambridge Neuropsychological Test Automated Battery subtests sensitive to frontal lobe function in people with autistic disorder: Evidence from the Collaborative Programs of Excellence in Autism network. J. Autism Dev. Disord. 2004, 34, 139–150. [Google Scholar] [CrossRef] [PubMed]
- Goldberg, M.C.; Mostofsky, S.H.; Cutting, L.E.; Mahone, E.M.; Astor, B.C.; Denckla, M.B.; Landa, R.J. Subtle executive impairment in children with autism and children with ADHD. J. Autism Dev. Disord. 2005, 35, 279–293. [Google Scholar] [CrossRef] [PubMed]
- South, M.; Ozonoff, S.; McMahon, W.M. The relationship between executive functioning, central coherence, and repetitive behaviors in the high-functioning autism spectrum. Autism 2007, 11, 437–451. [Google Scholar] [CrossRef] [PubMed]
- Smith, P.F.; Ganesh, S.; Liu, P. A comparison of random forest regression and multiple linear regression for prediction in neuroscience. J. Neurosci. Methods 2013, 220, 85–91. [Google Scholar] [CrossRef] [PubMed]
- Willcutt, E.G.; Doyle, A.E.; Nigg, J.T.; Faraone, S.V.; Pennington, B.F. Validity of the executive function theory of attention-deficit/hyperactivity disorder: A meta-analytic review. Biol. Psychiatry 2005, 57, 1336–1346. [Google Scholar] [CrossRef] [PubMed]
- Sinzig, J.; Morsch, D.; Bruning, N.; Schmidt, M.H.; Lehmkuhl, G. Inhibition, flexibility, working memory and planning in autism spectrum disorders with and without comorbid ADHD-symptoms. Child Adolesc. Psychiatry Ment. Health 2008, 2, 4. [Google Scholar] [CrossRef] [Green Version]
- Gioia, G.A.; Kenworthy, L.; Isquith, P.K. Executive function in the real world: Brief lessons from Mark Ylvisaker. J. Head Trauma Rehabil. 2010, 25, 433–439. [Google Scholar] [CrossRef]
- Ziegler, G.; Dahnke, R.; Winkler, A.; Gaser, C. Partial least squares correlation of multivariate cognitive abilities and local brain structure in children and adolescents. NeuroImage 2013, 82, 284–294. [Google Scholar] [CrossRef]
- Bradley, M.M.; Lang, J.P. Measuring emotion: The Self-assessment manikin and the semantic differential. J. Behav. Ther. Exp. Psychiat. 1994, 25, 49–59. [Google Scholar] [CrossRef]
- Glass, L.; Mackey, M.C. From Clocks to Chaos: The Rhythms of Life; Princeton University Press: Princeton, NY, USA, 1992. [Google Scholar]
- Manor, B.; Costa, M.D.; Hu, K.; Newton, E.; Starobinets, O.; Kang, H.G.; Peng, C.K.; Novak, V.; Lipsitz, L.A. Physiological complexity and system adaptability: Evidence from postural control dynamics of older adults. J. Appl. Physiol. 2010, 109, 1786–1791. [Google Scholar] [CrossRef] [PubMed] [Green Version]
- Costa, M.; Goldberger, A.L.; Peng, C.-K. Multiscale entropy analysis of biological signals. Phys. Rev. E 2005, 71, 021906. [Google Scholar] [CrossRef] [PubMed] [Green Version]
- Costa, M.; Goldberger, A.L.; Peng, C.-K. Multiscale Entropy Analysis of Complex Physiologic Time Series. Phys. Rev. Lett. 2002, 89, 068102. [Google Scholar] [CrossRef] [PubMed] [Green Version]
- Fallani, F.D.V.; da Fontoura Costa, L.; Rodriguez, F.A.; Astolfi, L.; Vechiatto, G.; Toppi, J.; Borghini, G.; Cincotti, F.; Mattia, D.; Salinari, S.; et al. A graph theoretical approach in brain functional networks. Possible implications in EEG studies. Nonlinear Biomed 2010, 4 (Suppl. 1), s8. [Google Scholar] [CrossRef] [PubMed] [Green Version]
- Takahashi, T.; Cho, R.Y.; Mizuro, T.; KiKuchi, M.; Murata, T.; Takahashi, K.; Wada, Y. Antipsychotics reverse abnormal EEG complexity in drug-naïve schizophrenia: A multiscale entropy analysis. NeuroImage 2010, 51, 173–182. [Google Scholar] [CrossRef] [Green Version]
- American Psychiatric Association. Diagnostic and Statistical Manual of Mental Disorders, 5th ed.; (DSM-5); American Psychiatric Publishing: Arlington, VA, USA, 2013. [Google Scholar]
- Simmons, D.R.; Robertson, A.E.; McKay, L.S.; Total, E.; McAleer, P.; Pollick, F.E. Vision in autism spectrum disorders. Vission Res. 2009, 49, 2705–2739. [Google Scholar] [CrossRef] [Green Version]
- Kaiser, M.D.; Delmolino, L.; Tanaka, J.W.; Shiffrar, M. Comparison of visual sensitivity to human and object motion in autism spectrum disorder. Autism Res. 2010, 3, 191–195. [Google Scholar] [CrossRef]
- Hitoglou, M.; Ververi, A.; Antoniadis, A.; Zafeiriou, D.I. Childhood Autism and Auditory System Abnormalities. Pediatr. Neurol. 2010, 42, 309–314. [Google Scholar] [CrossRef]
- Russo, N.; Flanagan, T.; Iarocci, G.; Berringnger, D.; Zelazo, P.D.; Burack, J.A. Deconstructing executive deficits among persons with autism; implications for cognitive neuroscience. Brain Cognt. 2007, 65, 77–86. [Google Scholar] [CrossRef]
- Barttfeld, P.; Wicker, B.; Cukier, S.; Navarta, S.; Lew, S.; Sigman, A. A big–world network in ASD: Dynamical connectivity analysis reflects a deficit in long-range connections and an excess of short-range connections. Neuropsychologia 2011, 49, 254–263. [Google Scholar] [CrossRef] [Green Version]
- Rippon, G.; Brock, J.; Brown, C.; Boucher, J. Disordered connectivity in the autism brain: Challenges of the ‘new psychophysiology’. Int. J. Psychophysiol. 2007, 63, 164–172. [Google Scholar] [CrossRef] [PubMed]
- Sitges, C.; Bornas, X.; Llabres, J.; Noguera, M.; Montoya, P. Linear and nonlinear analyses of EEG dynamics during non-painful somatosensory processing in chronic pain patients. Int. J. Psychophysiol. 2010, 77, 176–183. [Google Scholar] [CrossRef]
- Kooij, J.; Bijlenga, D.; Salerno, L.; Jaeschke, R.; Bitter, I.; Balázs, J.; Thome, J.; Dom, G.; Kasper, S.; Filipe, C.N.; et al. Updated European Consensus Statement on diagnosis and treatment of adult ADHD. Eur. Psychiatry 2019, 56, 14–34. [Google Scholar] [CrossRef]
- Kooij, S.J.; Francken, M.H.; Bron, T.I. Diagnostic Interview for ADHD in Adults (DIVA); Greek Version; Pehlivanidis, A., Papanikolaou, K., Eds.; DIVA Foundation: The Hague, The Netherlands, 2019. [Google Scholar]
- Baron-Cohen, S.; Wheelwright, S.; Skinner, R.; Martin, J.; Clubley, E. The autism-spectrum quotient (AQ): Evidence from asperger syndrome/high-functioning autism, malesand females, scientists and mathematicians. J. Autism Dev. Disord. 2001, 31, 5–17. [Google Scholar] [CrossRef] [PubMed]
- McIntosh, A.R.; Kovacevic, N.; Itier, R.J. Increased brain signal variability accompanies lower behavioral variability in development. PLos Compt. Biol. 2008, 4, e1000106. [Google Scholar] [CrossRef] [Green Version]
- Takahashi, T.; Cho, R.Y.; Mizuno, T.; Kikuchi, M.; Mizukami, K.; Kosaka, H.; Takahashi, K.; Wada, Y. Age-related variation in EEG complexity to photic simulation: A multiscale entropy analysis. Clin. Neurophysiol. 2009, 120, 476–483. [Google Scholar] [CrossRef] [Green Version]
- Bosl, W.; Tierney, A.; Tager-Flusberg, H.; Nelson, C. EEG complexity as a biomarker for autism spectrum disorder risk. BMC Med. 2011, 9, 18. [Google Scholar] [CrossRef] [PubMed] [Green Version]
- Green, M.F. What are the functional consequences of neurocognitive deficits in schizophrenia? Am. J. Psychiatr. 1996, 153, 321–330. [Google Scholar]
- Catarino, A.; Churches, O.; Baron-Cohen, S.; Andrade, A.; Ring, H. Atypical EEG complexity in autism spectrum conditions: A multiscale entropy analysis. Clin. Neurophysiol. 2011, 122, 2375–2383. [Google Scholar] [CrossRef]
- Ponomarev, V.A.; Mueller, A.; Candrian, G.; Grin-Yatsenko, V.A.; Kropotov, J.D. Group independent component analysis (gICA) and current source density (CSD) in the study of EEG in ADHD adults. Clin. Neurophysiol. 2014, 125, 83–97. [Google Scholar] [CrossRef]
- Cai, R.Y.; Richdale, A.L.; Uljarević, M.; Dissanayake, C.; Samson, A.C. Emotion regulation in autism spectrum disorder: Where we are and where we need to go. Autism Res. 2018, 11, 962–978. [Google Scholar] [CrossRef]
- White, S.W.; Mazefsky, C.A.; Dichter, G.; Chiu, P.H.; Richey, J.A.; Ollendick, T.H. Social-cognitive, physiological, and neural mechanisms underlying emotion regulation impairments: Understanding anxiety in autism spectrum disorder. Int. J. Dev. Neurosci. 2014, 39, 22–36. [Google Scholar] [CrossRef] [PubMed] [Green Version]
- Salazar, G.; Safond, G.; Vergara, L. A new Graph Based Brain Connectivity Measure. In International Work-Conference on Artificial Neural Networks. In Proceedings of the IWANN 2019: Advances in Computational Intellogence, Gran Canaria, Spain, 12–14 June 2019; pp. 450–459. [Google Scholar]
- Simon, V.; Czobor, P.; Bálint, S.; Mészáros, Á.; Bitter, I. Prevalence and correlates of adult attention-deficit hyperactivity disorder: Meta-analysis. Br. J. Psychiatry 2009, 194, 204–211. [Google Scholar] [CrossRef] [PubMed]
- Kessler, R. The prevalence and correlates of adult ADHD in the United States: Results from the National Comorbidity Survey Replication. Am. J. Psychiatry 2006, 163, 716. [Google Scholar] [CrossRef]
- Corbisiero, S.; Stieglitz, R.-D.; Retz, W.; Rösler, M. Is emotional dysregulation part of the psychopathology of ADHD in adults? ADHD Atten. Deficit Hyperact. Disord. 2013, 5, 83–92. [Google Scholar] [CrossRef] [PubMed]
- Gross, J.J.; Jazaieri, H. Emotion, emotion regulation, and psychopathology: An affective science perspective. Clin. Psychol. Sci. 2014, 2, 387–401. [Google Scholar] [CrossRef]
- Gross, J.J. Emotion regulation: Current status and future prospects. Psychol. Inq. 2015, 26, 1–26. [Google Scholar] [CrossRef]
- Marx, I.; Domes, G.; Havenstein, C.; Berger, C.; Schulze, L.; Herpertz, S.C. Enhanced emotional interference on working memory performance in adults with ADHD. World J. Biol. Psychiatry 2011, 12 (Suppl. 1), 70–75. [Google Scholar] [CrossRef]
- Christiansen, H.; Hirsch, O.; Philipsen, A.; Oades, R.D.; Matthies, S.; Hebebrand, J.; Ueckermann, J.; Abdel-Hamid, M.; Kraemer, M.; Wiltfang, J.; et al. German Validation of the Conners Adult ADHD Rating Scale–Self-Report. J. Atten. Disord. 2013, 17, 690–698. [Google Scholar] [CrossRef]
- Langner, R.; Leiberg, S.; Hoffstaedter, F.; Eickhoff, S.B. Towards a human self-regulation system: Common and distinct neural signatures of emotional and behavioral control. Neurosci. Biobehav. Rev. 2018, 90, 400–410. [Google Scholar] [CrossRef]
- Hajcak, G.; MacNamara, A.; Olvet, D.M. Event-related potentials, emotion, and emotion regulation: An integrative review. Dev Neuropsychol. 2010, 35, 129–155. [Google Scholar] [CrossRef]
- Lackschewitz, H.; Hüther, G.; Kröner-Herwig, B. Physiological and psychological stress responses in adults with attention-deficit/hyperactivity disorder (ADHD). Psychoneuroendocrinology 2008, 33, 612–624. [Google Scholar] [CrossRef]
- Oliver, M.L.; Nigg, J.T.; Cassavaugh, N.D.; Backs, R.W. Behavioral and cardiovascular responses to frustration during simulated driving tasks in young adults with and without attention disorder symptoms. J. Atten. Disord. 2012, 16, 478–490. [Google Scholar] [CrossRef] [PubMed] [Green Version]
- Posner, J.; Rauh, V.; Gruber, A.; Gat, I.; Wang, Z.; Peterson, B.S. Dissociable attentional and affective circuits in medication-naïve children with attention-deficit/hyperactivity disorder. Psychiatry Res. Neuroimaging 2013, 213, 24–30. [Google Scholar] [CrossRef] [PubMed] [Green Version]
- Cohen, J.D.; Botvinick, M.; Carter, C.S. Anterior cingulate and prefrontal cortex: Who’s in control? Nat. Neurosci. 2000, 3, 421–423. [Google Scholar] [CrossRef] [PubMed]
- Bush, G.; Luu, P.; Posner, M.I. Cognitive and emotional influences in anterior cingulate cortex. Trends Cogn. Sci. 2000, 4, 215–222. [Google Scholar] [CrossRef]
- Sonuga-Barke, E.J.; Sergeant, J.A.; Nigg, J.; Willcutt, E. Executive Dysfunction and Delay Aversion in Attention Deficit Hyperactivity Disorder: Nosologic and Diagnostic Implications. Child Adolesc. Psychiatr. Clin. N. Am. 2008, 17, 367–384. [Google Scholar] [CrossRef] [PubMed]
- Cardinal, R.N.; Parkinson, J.A.; Hall, J.; Everitt, B.J. Emotion and motivation: The role of the amygdala, ventral striatum, and profrontal cortex. Neursci. Biobehav. Rev. 2002, 26, 321–352. [Google Scholar] [CrossRef]
- Krishnan, A.; Williams, L.J.; McIntosh, A.R.; Abdi, H. Partial least squares (PLS) methods for neuroimaging: A tutorial and review. NeuroImage 2011, 56, 455–475. [Google Scholar] [CrossRef]
- Pehlivanidis, A.; Papanikolaou, K.; Mantas, V.; Kalantzi, E.; Korobili, K.; Xenaki, L.A.; Vassiliou, G.; Papageorgiou, C. Lifetime co-occurring psychiatric disorders in newly diagnosed adults with Attention Deficit Hyperactivity Disorder (ADHD) or/and Autism Spectrum Disorder (ASD). BMC Psychiatry 2020, 20, 423. [Google Scholar] [CrossRef]
- Lord, C.; Rutter, M.; DiLavore, P.C.; Risi, S.; Gotham, K.; Bishop, S.L. Autism Diagnostic Observation Schedule, 2nd ed.; Western Psychological Services: Torrance, CA, USA, 2012. [Google Scholar]
- Papanikolaou, K.; Paliokosta, E.; Houliaras, G.; Vgenopoulou, S.; Giouroukou, E.; Pehlivanidis, A.; Tomaras, V.; Tsiantis, I. Using the Autism Diagnostic Interview-Revised and the Autism Diagnostic Observation Schedule-Generic for the Diagnosis of Autism Spectrum Disorders in a Greek Sample with a Wide Range of Intellectual Abilities. J. Autism Dev. Disord. 2008, 39, 414–420. [Google Scholar] [CrossRef] [PubMed]
- Le Couteur, A.; Lord, C.; Rutter, M. The Autism Diagnostic Interview—Revised (ADI-R); Western Psychological Services: Los Angeles, CA, USA, 2003. [Google Scholar]
- Debener, S.; Minow, F.; Emkes, R.; Gandras, K.; de Vos, M. How about taking a low-cost, small, and wireless EEG for a walk? Psychophysiology 2012, 49, 1617–1621. [Google Scholar] [CrossRef]
- Papageorgiou, C.; Manios, E.; Tsaltas, E.; Koroboki, E.; Alevizaki, M.; Angelopoulos, E.; Dimopoulos, M.; Papageorgiou, C.; Zakopoulos, N. Brain Oscillations Elicited by the Cold Pressor Test: A Putative Index of Untreated Essential Hypertension. Int. J. Hypertens. 2017, 2017, 1–17. [Google Scholar] [CrossRef]
- Ramirez, R.; Palencia-Lefler, M.; Giraldo, S.; Evamvakousis, Z. Musical neurofeedback for treating depression in elderly people. Front. Neurosci. 2015, 9, 354. [Google Scholar] [CrossRef] [Green Version]
- Papageorgiou, C.; Rabavilas, A.D.; Stachtea, X.; Giannakakis, G.A.; Kyprianou, M.; Papadimitriou, G.N.; Stefanis, C.N. The Interference of Introversion–Extraversion and Depressive Symptomatology with Reasoning Performance: A Behavioural Study. J. Psycholinguist. Res. 2012, 41, 129–139. [Google Scholar] [CrossRef]
- Morris, J.D. Observations: Sam: The self-assessment manikin; an efficient cross-cultural measurement of emotional response. J. Advert Res. 1995, 35, 63–68. [Google Scholar]
- Mert, A.; Akan, A. Emotion recognition based on time-frequency distribution of EEG signals using multivariate synchrosqueezing transform. Digit. Signal Process. 2018, 81, 106–115. [Google Scholar] [CrossRef]
- Koelstra, S.; Muhl, C.; Soleymani, M.; Lee, J.-S.; Yazdani, A.; Ebrahimi, T.; Pun, T.; Nijholt, A.; Patras, I. DEAP: A Database for Emotion Analysis ;Using Physiological Signals. IEEE Trans. Affect. Comput. 2011, 3, 18–31. [Google Scholar] [CrossRef] [Green Version]
- Russell, J.A. A circumplex model of affect. J. Personal. Soc. Psychol. 1980, 39, 1161. [Google Scholar] [CrossRef]
- Posner, J.; Russell, J.; Peterson, B.S. The circumplex model of affect: An integrative approach to affective neuroscience, cognitive development, and psychopathology. Dev. Psychopathol. 2005, 17, 715–734. [Google Scholar] [CrossRef]
- Wold, H. Soft modelling, the basic design and some extensions. In Systems Under Indirect Observation: CausalityStructure-Prediction. Part II; Wold, H., Jöreskog, K.-G., Eds.; North-Holland Publishing Company: Amsterdam, The Netherlands, 1982; pp. 1–54. [Google Scholar]
- Tenenhaus, M. La Régression PLS, Théorie et Pratique; Editions Technip: Paris, France, 1998. [Google Scholar]
- Tenenhaus, M.; Vinzi, V.E. PLS regression, PLS path modeling and generalized Procrustean analysis: A combined approach for multiblock analysis. J. Chemom. 2005, 19, 145–153. [Google Scholar] [CrossRef]
- Abdi, H.; Williams, L.J. Principal component analysis. Wiley Interdiscip. Rev. Comput. Stat. 2010, 2, 433–459. [Google Scholar] [CrossRef]
- Abdi, H. Partial least squares regression and projection on latent structure regression (PLS Regression). Wiley Comput. Stat. 2010, 2, 97–106. [Google Scholar] [CrossRef]
- Vinzi, V.E.; Trinchera, L.; Amato, S. PLS Path Modeling: From Foundations to Recent Developments and Open Issues for Model Assessment and Improvement. In Handbook of Partial Least Squares; Springer Science and Business Media LLC: Berlin/Heidelberg, Germany, 2010; pp. 47–82. [Google Scholar]
- Michaelson, J.J.; Alberts, R.; Schughart, K.; Beyer, A. Data-driven assessment of eQTL mapping methods. BMC Genom. 2010, 11, 502. [Google Scholar] [CrossRef] [Green Version]
- Le Floch, É.; Guillemot, V.; Frouin, V.; Pinel, P.; Lalanne, C.; Trinchera, L.; Tenenhaus, A.; Moreno, A.; Zilbovicius, M.; Bourgeron, T.; et al. Significant correlation between a set of genetic polymorphisms and a functional brain network revealed by feature selection and sparse Partial Least Squares. NeuroImage 2012, 63, 11–24. [Google Scholar] [CrossRef] [PubMed]
- Beaton, D.; Initiative, A.D.N.; Dunlop, J.; Abdi, H. Partial least squares correspondence analysis: A framework to simultaneously analyze behavioral and genetic data. Psychol. Methods 2016, 21, 621–651. [Google Scholar] [CrossRef]
- Grellmann, C.; Bitzer, S.; Neumann, J.; Westlye, L.T.; Andreassen, O.A.; Villringer, A.; Horstmann, A. Comparison of variants of canonical correlation analysis and partial least squares for combined analysis of MRI and genetic data. NeuroImage 2015, 107, 289–310. [Google Scholar] [CrossRef] [PubMed]
- Chen, C.; Cao, X.; Tian, L. Partial Least Squares Regression Performs Well in MRI-Based Individualized Estimations. Front. Neurosci. 2019, 13, 1282. [Google Scholar] [CrossRef] [Green Version]
- Jiang, R.; Calhoun, V.D.; Zuo, N.; Lin, D.; Li, J.; Fan, L.; Qi, S.; Sun, H.; Fu, Z.; Song, M.; et al. Connectome-based individualized prediction of temperament trait scores. NeuroImage 2018, 183, 366–374. [Google Scholar] [CrossRef]
- Finn, E.S.; Shen, X.; Scheinost, D.; Rosenberg, M.; Huang, J.; Chun, M.; Papademetris, X.; Constable, R. Functional connectome fingerprinting: Identifying individuals using patterns of brain connectivity. Nat. Neurosci. 2015, 18, 1664–1671. [Google Scholar] [CrossRef]
- Siegel, J.S.; Ramsey, L.; Snyder, A.Z.; Metcalf, N.V.; Chacko, R.V.; Weinberger, K.; Baldassarre, A.; Hacker, C.D.; Shulman, G.L.; Corbetta, M. Disruptions of network connectivity predict impairment in multiple behavioral domains after stroke. Proc. Natl. Acad. Sci. USA 2016, 113, E4367–E4376. [Google Scholar] [CrossRef] [Green Version]
- Rosenberg, M.D.; Finn, E.S.; Scheinost, D.; Papademetris, X.; Shen, X.; Constable, R.T.; Chun, M.M. A neuromarker of sustained attention from whole-brain functional connectivity. Nat. Neurosci. 2016, 19, 165–171. [Google Scholar] [CrossRef] [PubMed] [Green Version]
- Dosenbach, N.U.F.; Nardos, B.; Cohen, A.L.; Fair, D.A.; Power, J.D.; Church, J.A.; Nelson, S.M.; Wig, G.S.; Vogel, A.C.; Lessov-Schlaggar, C.N.; et al. Prediction of Individual Brain Maturity Using fMRI. Science 2010, 329, 1358–1361. [Google Scholar] [CrossRef] [Green Version]
- Zhang, C.; Dougherty, C.C.; Baum, S.A.; White, T.; Michael, A.M. Functional connectivity predicts gender: Evidence for gender differences in resting brain connectivity. Hum. Brain Mapp. 2018, 39, 1765–1776. [Google Scholar] [CrossRef] [PubMed] [Green Version]
- Alın, A.; Kurt, S.; McIntosh, A.R.; Oniz, A.M.O.; Ozgoren, M. Partial Least Squares Analysis in Electrical Brain Activity. J. Data Sci. 2009, 7, 99–110. [Google Scholar] [CrossRef]
- Abdi, H. Singular value decomposition (SVD) and generalized singular value decompositon (GSVD). In Encyclopedia of Measurement and Statistics; Salkind, N., Ed.; Sage: Thousand Oaks, CA, USA, 2007; pp. 907–912. [Google Scholar]
- Takane, Y. Relationships among various kinds of eigenvalue and singular value decomposi-tions. In New Developments in Psychometrics; Yanai, H., Okada, A., Shigemasu, K., Kano, Y., Meulman, J., Eds.; Springer Verlag: Tokyo, Japan, 2002; pp. 45–46. [Google Scholar]
- Good, P. Permutation, Parametric and Bootstrap Tests of Hypotheses; Springer: New York, NY, USA, 2005. [Google Scholar]
- Chen, A.C. EEG Default Mode Network in the Human Brain: Spectral Field Power, Coherence Topology, and Current Source Imaging. In Proceedings of the 2007 Joint Meeting of the 6th International Symposium on Noninvasive Functional Source Imaging of the Brain and Heart and the International Conference on Functional Biomedical Imaging IEEE, Hangzhou, China, 12–14 October 2007; pp. 215–218. [Google Scholar]
- Buckner, R.L.; Andrews-Hanna, J.R.; Schacter, D.L. The brain’s default network: Anatomy, function, and relevance to disease. Ann. N. Y. Acad. Sci. 2008, 1124, 1–38. [Google Scholar] [CrossRef] [PubMed] [Green Version]
- Raichle, M.E. The Brain’s Default Mode Network. Annu. Rev. Neurosci. 2015, 38, 433–447. [Google Scholar] [CrossRef] [Green Version]
- Greicius, M.D.; Krasnow, B.; Reiss, A.L.; Menon, V. Functional connectivity in the resting brain: A network analysis of the default mode hypothesis. Proc. Natl. Acad. Sci. USA 2003, 100, 253–258. [Google Scholar] [CrossRef] [Green Version]
- Hampson, M.; Driesen, N.R.; Skudlarski, P.; Gore, J.C.; Constable, R.T. Brain connectivity related to working memory performance. J. Neurosci. 2006, 26, 13338–13343. [Google Scholar] [CrossRef]
- Khan, D.M.; Kamel, N.; Muzaimi, M.; Hill, T. Effective connectivity for Default Mode Network Analysis of Alchoholism. Brain Connect. 2021, 11, 1. [Google Scholar] [CrossRef]
- Canas, A.; Juncadella, M.; Lau, R.; Gabarro’s, A.; Hernandez, M. Working memory deficits after lesions involving the supplementary motor area. Front. Psychol. 2018, 9, 765. [Google Scholar] [CrossRef] [PubMed] [Green Version]
- Knutson, K.M.; Monte, O.D.; Schintu, S.; Wassermann, E.M.; Raymont, V.; Grafman, J.; Krueger, F. Areas of Brain Damage Underlying Increased Reports of Behavioral Disinhibition. J. Neuropsychiatry Clin. Neurosci. 2015, 27, 193–198. [Google Scholar] [CrossRef] [PubMed] [Green Version]
- Mentis, M.J.; Dhawan, V.; Nakamura, T.; Ghilardi, M.F.; Feigin, A.; Edwards, C.; Ghez, C.; Eidelberg, D. Enhancement of brain activation during trial-and-error sequence learning in early PD. Neurology 2003, 60, 612–619. [Google Scholar] [CrossRef] [PubMed]
- Baron-Cohen, S.; Leslie, A.M.; Frith, U. Does the autistic child have a theory of mind. Cognition 1985, 21, 37–46. [Google Scholar] [CrossRef]
- Brambilla, P.; Hardan, A.; Di Nemi, S.U.; Perez, J.; Soares, J.C.; Barale, F. Brain anatomy and development in autism: Review of structural MRI studies. Brain Res. Bull. 2003, 61, 557–569. [Google Scholar] [CrossRef]
- Abell, F.; Krams, M.; Ashburner, J.; Passingham, R.; Friston, K.; Frackowiak, R.; Frith, U. The neuroanatomy of autism: A voxel-based whole brain analysis of structural scans. Neuroreport 1999, 10, 1647–1651. [Google Scholar] [CrossRef] [Green Version]
- Brothers, L. The social brain: A project for integrating primate behaviour and neurophysiology in a new domain. Concepts Neurosci. 1990, 1, 27–51. [Google Scholar]
- Adolphs, R. The neurobiology of social cognition. Curr. Opin. Neurobiol. 2001, 11, 231–239. [Google Scholar] [CrossRef]
- Phelps, E.A. Emotion and Cognition: Insights from Studies of the Human Amygdala. Annu. Rev. Psychol. 2006, 57, 27–53. [Google Scholar] [CrossRef] [Green Version]
- Carmichael, S.T.; Price, J.L. Limbic connections of the orbital and medial prefrontal cortex in macaque monkeys. J. Comp. Neurol. 1995, 363, 615–641. [Google Scholar] [CrossRef]
- Waiter, G.D.; Williams, J.H.; Murray, A.; Gilchrist, A.; Perrett, D.; Whiten, A. A voxel-based investigation of brain structure in male adolescents with autistic spectrum disorder. NeuroImage 2004, 22, 619–625. [Google Scholar] [CrossRef] [PubMed]
- Carper, R.A.; Courchesne, E. Localized enlargement of the frontal cortex in early autism. Biol. Psychiatry 2005, 57, 126–133. [Google Scholar] [CrossRef] [PubMed]
- Kennedy, D.P.; Redcay, E.; Courchesne, E. Failing to deactivate: Resting functional abnormalities in autism. Proc. Natl. Acad. Sci. USA 2006, 103, 8275–8280. [Google Scholar] [CrossRef] [Green Version]
- Iacoboni, M. Failure to deactivate in autism: The co-constitution of self and other. Trends Cogn. Sci. 2006, 10, 431–433. [Google Scholar] [CrossRef]
- Cherkassky, V.L.; Kana, R.K.; Keller, T.A.; Just, M.A. Functional connectivity in a baseline resting-state network in autism. NeuroReport 2006, 17, 1687–1690. [Google Scholar] [CrossRef] [PubMed]
- Anteraper, S.A.; Guell, X.; Taylor, H.P.; D’Mello, A.; Whitfield-Gabrieli, S.; Joshi, G. Intrinsic Functional Connectivity of Dentate Nuclei in Autism Spectrum Disorder. Brain Connect. 2019, 9, 692–702. [Google Scholar] [CrossRef]
- Castellanos, F.X.; Margulies, D.S.; Clare, C.; Uddin, L.Q.; Ghaffari, M.; Kirsch, A.; Shaw, D.; Shehzad, Z.; Di Martino, A.; Biswal, B.; et al. Cingulate—Precuneus Interactions: A New Locus of Dysfunction in Adult Attention-Deficit/Hyperactivity Disorder. Biol. Psychiatry 2010, 63, 332–337. [Google Scholar] [CrossRef] [PubMed] [Green Version]
- Tian, L.; Jiang, T.; Wang, Y.; He, Y.; Liang, M.; Sui, M.; Cao, Q.; Hu, S.; Peng, M.; Zhuo, Y. Altered resting-state functional connectivity patterns of anterior cingulate cortex in adolescents with attention deficit hyperactivity disorder. Neurosci. Lett. 2006, 400, 39–43. [Google Scholar] [CrossRef]
- Yu-Feng, Z.; Yong, H.; Chao-Zhe, Z.; Qing-Jiu, C.; Man-Qiu, S.; Meng, L.; Li-Xia, T.; Tian-Zi, J. Altered baseline brain activity in children with ADHD revealed by resting-state functional MRI. Brain Dev. 2007, 29, 83–91. [Google Scholar] [CrossRef]
- Raichle, M.E.; MacLeod, A.M.; Snyder, A.Z.; Powers, W.J.; Gusnard, D.A.; Shulman, G.L. A default mode of brain function. Proc. Natl. Acad. Sci. USA 2001, 98, 676–682. [Google Scholar] [CrossRef] [Green Version]
- Andrews-Hanna, J.R.; Snyder, A.Z.; Vincent, J.L.; Lustig, C.; Head, D.; Raichle, M.E.; Buckner, R.L. Disruption of large-scale brain systems in advanced aging. Neuron 2007, 56, 924–935. [Google Scholar] [CrossRef] [Green Version]
- Rubinov, M.; Sporns, O. Complex network measures of brain connectivity: Uses and interpretations. NeuroImage 2010, 52, 1059–1069. [Google Scholar] [CrossRef]
- Delbruck, E.; Yang, M.; Yassine, A.; Grossmn, E. Functional connectivity in ASD: Atypical pathways in brain networks supporting action observation and joint attention. Brain Res. 2019, 1706, 157–165. [Google Scholar] [CrossRef] [PubMed]
- Huang, D.; Ren, A.; Shang, J.; Lei, Q.; Zhang, Y.; Yin, Z.; Li, J.; Karen, M.; Huang, L. Combining Partial Directed Coherence and Graph Theory to analyze effective brain networks of different mental tasks. Front. Hum. Neurosci. 2016, 10, 235. [Google Scholar] [CrossRef]
- Keon, C.L.; Datko, M.C.; Chen, C.P.; Maximo, J.O.; Jahedi, A.; Muller, R.A. Network organization is globally atypical in Autism: A Graph theory study of intrinsic functional connectivity. Biol. Psychiatry CNNI 2017, 2, 66–75. [Google Scholar]
- Richman, J.S.; Lake, D.E.; Moorman, J.R.; Michael, L.J.; Ludwig, B. Methods in Enzymology; Sample Entropy; Academic Press: Cambridge, MA, USA, 2004; pp. 172–184. [Google Scholar]
- Papaioannou, A.; Kalantzi, E.; Papageorgiou, C.; Korombili, K.; Bokou, A.; Pehlivanidis, A.; Papageorgiou, C.; Papaioannou, G. Complexity analysis of the brain activity in ASD and ADHD due to cognitive loads/demands induced by Aristotle’s type of syllogism. A power spectral density and multiscale entropy (MSE) analysis. Heliyon 2021, 7, e07984. [Google Scholar] [CrossRef]
- Tabachnick, B.G.; Fidell, L.S. Using Multivariate Statistics, 2nd ed.; Harper Collins: New York, NY, USA, 2001. [Google Scholar]
- Takahashi, T.; Yoshimura, Y.; Hiraishi, H.; Hasegawa, C.; Munesue, T.; Higashida, H.; Minabe, Y.; Kikuchi, M. Enhanced brain signal variability in children with autism spectrum disorder during early childhood. Hum. Brain Mapp. 2016, 37, 1038–1050. [Google Scholar] [CrossRef] [PubMed]
- Guadalupe, T.; Willems, R.M.; Zwiers, M.P.; Vasquez, A.A.; Hoogman, M.; Hagoort, P.; Fernandez, G.; Buitelaar, J.; Franke, B.; Fisher, S.; et al. Differences in cerebral cortical anatomy of left- and right-handers. Front. Psychol. 2014, 5, 261. [Google Scholar] [CrossRef] [Green Version]
- Simões, E.N.; Carvalho, A.L.N.; Schmidt, S.L. What does handedness reveal about ADHD? An analysis based on CPT performance. Res. Dev. Disabil. 2017, 65, 46–56. [Google Scholar] [CrossRef] [PubMed]
- Wiberg, A.; Ng, M.; Al Omran, Y.; Alfaro-Almagro, F.; McCarthy, P.; Marchini, J.; Bennett, D.; Smith, S.; Douaud, G.; Furniss, D. Handedness, language areas and neuropsychiatric diseases: Insights from brain imaging and genetics. Brain 2019, 142, 2938–2947. [Google Scholar] [CrossRef] [Green Version]
- Hsu, C.-F.; Broyd, S.J.; Helps, S.K.; Benikos, N.; Sonuga-Barke, E.J. “Can waiting awaken the resting brain?” A comparison of waiting- and cognitive task-induced attenuation of very low frequency neural oscillations. Brain Res. 2013, 1524, 34–43. [Google Scholar] [CrossRef] [Green Version]
- Broyd, S.J.; Richards, H.J.; Helps, S.K.; Chronaki, G.; Bamford, S.; Sonuga-Barke, E.J. Electrophysiological markers of the motivational salience of delay imposition and escape. Neuropsychologia 2012, 50, 965–972. [Google Scholar] [CrossRef] [PubMed] [Green Version]
- Sokhadze, E.; Baruth, J.; Tasman, A.; Sears, L.; Mathai, G.; El-Baz, A.; Casanova, M.F. Event-related Potential Study of Novelty Processing Abnormalities in Autism. Appl. Psychophysiol. Biofeedback 2009, 34, 37–51. [Google Scholar] [CrossRef] [PubMed]
- Nowicka, A.; Cygan, H.B.; Tacikowski, P.; Ostaszewski, P.; Kuś, R. Name recognition in autism: EEG evidence of altered patterns of brain activity and connectivity. Mol. Autism 2016, 7, 1–14. [Google Scholar] [CrossRef] [PubMed] [Green Version]


| Channel Index | Channel Name | Location |
|---|---|---|
| 1 | AF3 | Anterio-frontal, left |
| 2 | F7 | Frontal-temporal, left |
| 3 | F3 | Frontal, left |
| 4 | FC5 | Frontal-central, left |
| 5 | T7 | Temporal, left |
| 6 | P7 | Parietal, left |
| 7 | 01 | Occipital, left |
| 8 | 02 | Occipital, right |
| 9 | P8 | Parietal, right |
| 10 | T8 | Temporal, right |
| 11 | FC6 | Frontal-central, right |
| 12 | F4 | Frontal, right |
| 13 | F8 | Frontal-temporal, right |
| 14 | AF4 | Anterio-frontal, right |
| A | B |
|---|---|
| Denying the Antecedent | Affirming the Consequent |
| Major Premise: If A then B Minor Premise: not Conclusion: Therefore not B | Major Premise: If A then B Minor Premise: B Conclusion: Therefore A |
| Example If George beat the game already, then he is a great gamer. George did not beat the game already Therefore, George is not a great gamer | Example If George beat the game already, then he is a great gamer. George is a great gamer Therefore, George beat the game already |
| Study | Brain Activity Data | Demographic &Behavioral Data |
|---|---|---|
| 63 participants (21 for each group, ASD, ADHD, and control) | Average MSE at 28 channel -syllogism combinations, per subject | Age, % of certainty in answers, mean of emotional state. |
| Tests of Between-Subjects Effects | ||||||
|---|---|---|---|---|---|---|
| Transformed Variable: Average | ||||||
| Source | Type III Sum of Squares | df | Mean Square | F | Sig. | Partial Eta Squared |
| Intercept | 937.863 | 1 | 937.863 | 3881.298 | 0.000 | 0.985 |
| group | 1.722 | 2 | 0.861 | 3.564 | 0.034 | 0.106 |
| Error | 14.498 | 60 | 0.242 | |||
| Tests of Within-Subjects Effects | |||||||
|---|---|---|---|---|---|---|---|
| Source | Type III Sum of Squares | df | Mean Square | F | Sig. | Partial Eta Squared | |
| Channels | Sphericity Assumed | 1.210 | 13 | 0.093 | 12.677 | 0.000 | 0.174 |
| Greenhouse-Geisser | 1.210 | 7.816 | 0.155 | 12.677 | 0.000 | 0.174 | |
| Huynh-Feldt | 1.210 | 9.397 | 0.129 | 12.677 | 0.000 | 0.174 | |
| Lower-bound | 1.210 | 1.000 | 1.210 | 12.677 | 0.001 | 0.174 | |
| Channels*group | Sphericity Assumed | 0.511 | 26 | 0.020 | 2.677 | 0.000 | 0.082 |
| Greenhouse-Geisser | 0.511 | 15.631 | 0.033 | 2.677 | 0.001 | 0.082 | |
| Huynh-Feldt | 0.511 | 18.794 | 0.027 | 2.677 | 0.000 | 0.082 | |
| Lower-bound | 0.511 | 2.000 | 0.256 | 2.677 | 0.077 | 0.082 | |
| Error (Channels) | Sphericity Assumed | 5.728 | 780 | 0.007 | |||
| Greenhouse-Geisser | 5.728 | 468.940 | 0.012 | ||||
| Huynh-Feldt | 5.728 | 563.832 | 0.010 | ||||
| Lower-bound | 5.728 | 60.000 | 0.095 | ||||
| Syllogism | Sphericity Assumed | 0.092 | 1 | 0.092 | 2.263 | 0.138 | 0.036 |
| Greenhouse-Geisser | 0.092 | 1.000 | 0.092 | 2.263 | 0.138 | 0.036 | |
| Huynh-Feldt | 0.092 | 1.000 | 0.092 | 2.263 | 0.138 | 0.036 | |
| Lower-bound | 0.092 | 1.000 | 0.092 | 2.263 | 0.138 | 0.036 | |
| Syllogism*group | Sphericity Assumed | 0.080 | 2 | 0.040 | 0.985 | 0.379 | 0.032 |
| Greenhouse-Geisser | 0.080 | 2.000 | 0.040 | 0.985 | 0.379 | 0.032 | |
| Huynh-Feldt | 0.080 | 2.000 | 0.040 | 0.985 | 0.379 | 0.032 | |
| Lower-bound | 0.080 | 2.000 | 0.040 | 0.985 | 0.379 | 0.032 | |
| Error(Syllogism) | Sphericity Assumed | 2.441 | 60 | 0.041 | |||
| Greenhouse-Geisser | 2.441 | 60.000 | 0.041 | ||||
| Huynh-Feldt | 2.441 | 60.000 | 0.041 | ||||
| Lower-bound | 2.441 | 60.000 | 0.041 | ||||
| Channels*Syllogism | Sphericity Assumed | 0.020 | 13 | 0.002 | 0.983 | 0.466 | 0.016 |
| Greenhouse-Geisser | 0.020 | 8.369 | 0.002 | 0.983 | 0.450 | 0.016 | |
| Huynh-Feldt | 0.020 | 10.173 | 0.002 | 0.983 | 0.458 | 0.016 | |
| Lower-bound | 0.020 | 1.000 | 0.020 | 0.983 | 0.325 | 0.016 | |
| Channels*Syllogism*Group | Sphericity Assumed | 0.045 | 26 | 0.002 | 1.103 | 0.329 | 0.035 |
| Greenhouse-Geisser | 0.045 | 16.737 | 0.003 | 1.103 | 0.347 | 0.035 | |
| Huynh-Feldt | 0.045 | 20.345 | 0.022 | 1.103 | 0.340 | 0.035 | |
| Lower-bound | 0.045 | 2.000 | 0.002 | 1.103 | 0.338 | 0.035 | |
| Error(Channels*Syllogism) | Sphericity Assumed | 1.214 | 780 | 0.002 | |||
| Greenhouse-Geisser | 1.214 | 502.122 | 0.002 | ||||
| Huynh-Feldt | 1.214 | 610.361 | 0.002 | ||||
| Lower-bound | 1.214 | 60.000 | 0.020 | ||||
| Multiple Comparisons | |||||||
|---|---|---|---|---|---|---|---|
| 95% Confidence Interval | |||||||
| (I)group | (J)group | Mean Difference (I−J) | Std. Error | Sig. | Lower Bound | Upper Bound | |
| LSD | ASD | ADHD | −0.075549196 * | 0.0286686642 | 0.011 | −0.132895063 | −0.018203330 |
| normal | −0.027149080 | 0.0286686642 | 0.347 | −0.084494947 | 0.0301996786 | ||
| ADHD | ASD | 0.075549196 * | 0.0286686642 | 0.011 | 0.018203330 | 0.132895063 | |
| normal | 0.048400116 | 0.0286686642 | 0.097 | −0.008945751 | 0.105745983 | ||
| normal | ASD | 0.027149080 | 0.0286686642 | 0.347 | −0.030196786 | 0.084494947 | |
| ADHD | −0.048400116 | 0.0286686642 | 0.097 | −0.105745983 | 0.008945751 | ||
| Bonferroni | ASD | ADHD | −0.075549169 * | 0.0286686642 | 0.032 | −0.146158774 | −0.004939619 |
| normal | −0.027149080 | 0.0286686642 | 1.000 | −0.097758658 | 0.043460497 | ||
| ADHD | ASD | 0.075549196 * | 0.0286686642 | 0.032 | 0.004939619 | 0.146158774 | |
| normal | 0.048400116 | 0.0286686642 | 0.290 | −0.022209462 | 0.119009694 | ||
| normal | ASD | 0.027149080 | 0.0286686642 | 1.000 | −0.043460497 | 0.097758658 | |
| ADHD | −0.048400116 | 0.0286686642 | 0.290 | −0.119009694 | 0.022209462 | ||
| Emotion Dimension (SAM) | X2 Value | df | Asympt. Sig. (2-Sided) |
|---|---|---|---|
| Arousal Emotion * group (Valid) | 31.08 | 14 | 0.005 |
| Arousal Emotion * education (Valid) | 72.76 | 21 | 0.000 |
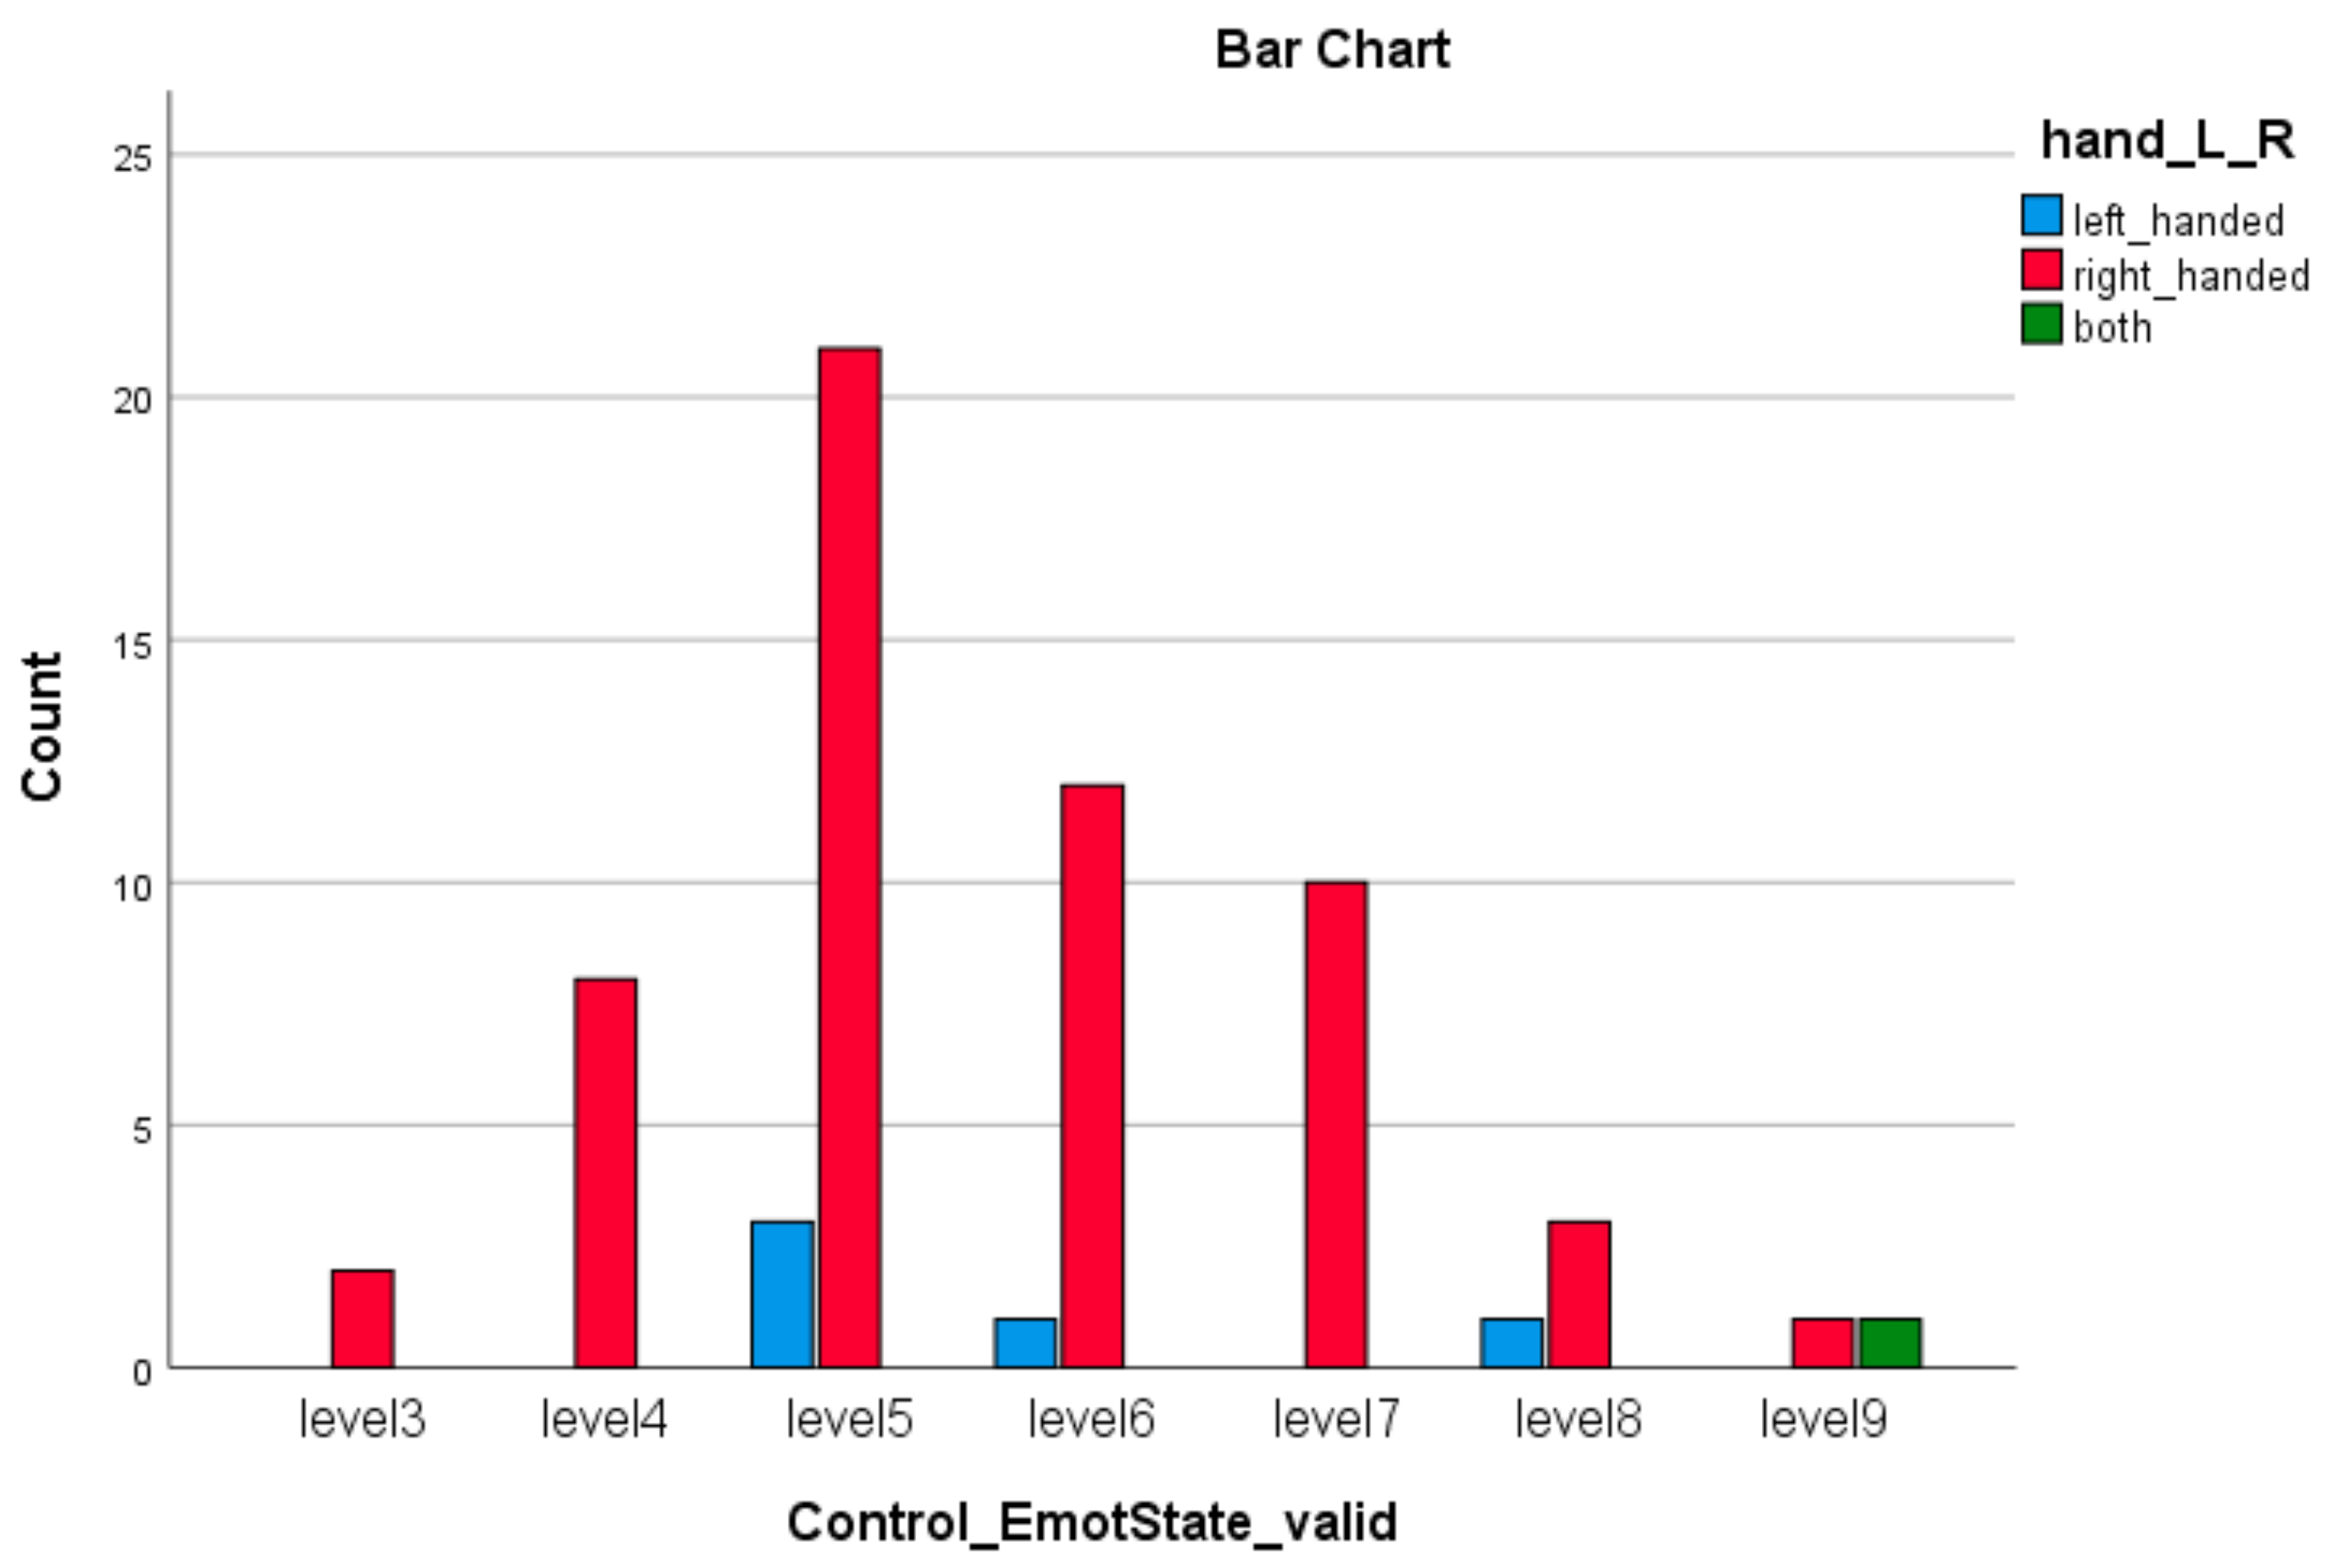
| Control Emotion * Left or Right Hand | 35.00 | 12 | 0.000 |
| Valid Syllogism | |||||
|---|---|---|---|---|---|
| Valence | Group | Mean | Median | Min | Max |
| ASD | 4.14 | 4.00 | 1 | 8 | |
| ADHD | 4.29 | 4.00 | 1 | 9 | |
| Control | 3.00 | 2.00 | 1 | 7 | |
| Arousal | ASD | 5.38 | 5.00 | 2 | 9 |
| ADHD | 7.29 | 7.00 | 4 | 9 | |
| Control | 7.81 | 8.00 | 3 | 9 | |
| Invalid Syllogism | |||||
| Valence | Group | Mean | Median | Min | Max |
| ASD | 5.10 | 5.00 | 2 | 9 | |
| ADHD | 4.29 | 4.00 | 1 | 9 | |
| Control | 4.00 | 4.00 | 1 | 8 | |
| Arousal | ASD | 5.62 | 5.00 | 2 | 9 |
| ADHD | 6.76 | 7.00 | 3 | 9 | |
| Control | 7.62 | 8.00 | 3 | 9 | |
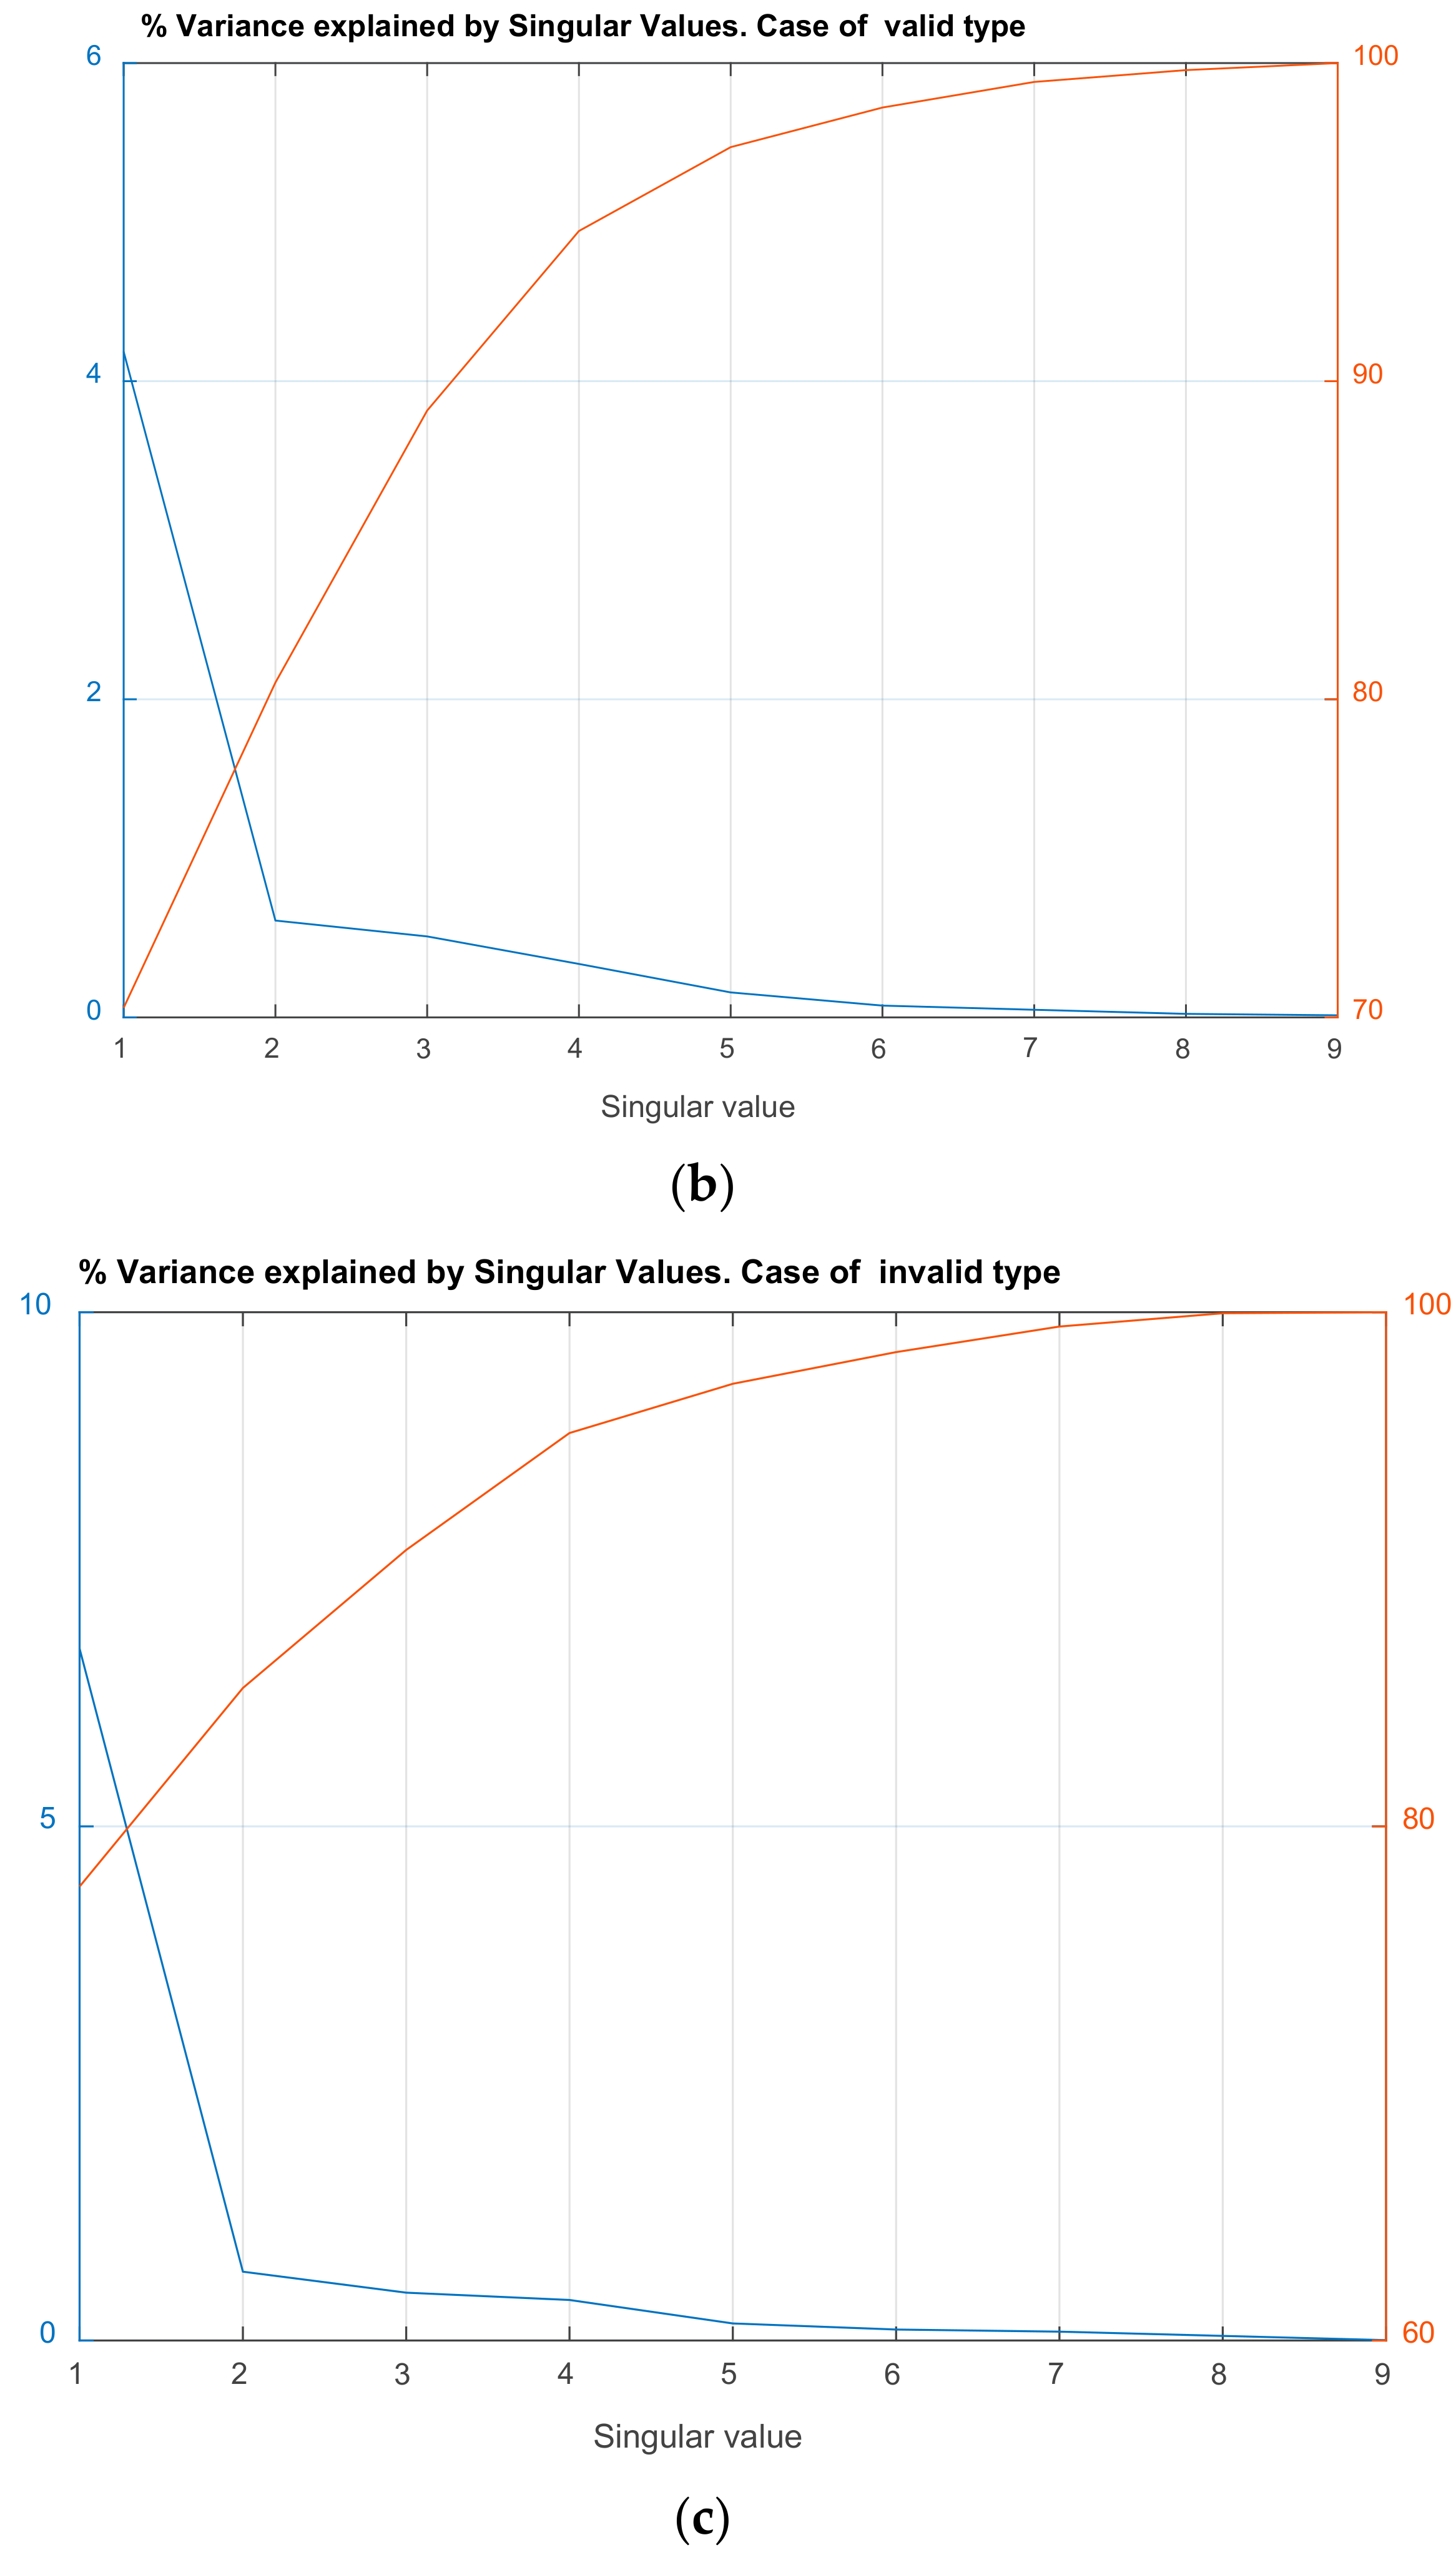
| Valid | Invalid | ||
|---|---|---|---|
| Singular Value (Squared) | Cumulative % of Variance Explained | Singular Value (Squared) | Cumulative % of Variance Explained |
| 4.185 | 70.30 | 6.73 | 77.65 |
| 0.608 | 80.52 | 0.67 | 85.38 |
| 0.509 | 89.07 | 0.46 | 90.75 |
| 0.336 | 94.72 | 0.39 | 95.30 |
| 0.157 | 97.35 | 0.16 | 97.21 |
| 0.074 | 98.60 | 0.10 | 98.44 |
| 0.047 | 99.40 | 0.08 | 99.44 |
| 0.022 | 99.77 | 0.04 | 99.96 |
| 0.013 | 100.00 | 0.00 | 100.00 |
| Valid Syllogism | Invalid Syllogism | ||||
|---|---|---|---|---|---|
| Channel | Behavior-Group Interaction | Correlation Coefficient | Channel | Behavior-Group Interaction | Correlation Coefficient |
| AF3 | Age*ADHD | −0.572 | AF3 | Confidence*Control | −0.562 |
| FC5 | Confidence*ADHDConfidence*Control | 0.521 0.519 | F7 | Emotion*ADHD | −0.590 |
| T7 | Confidence*ASD | −0.715 | F3 | Emotion*ASD | 0.473 |
| P7 | Confidence*ADHD | 0.582 | T7 | Age*ADHD | 0.641 |
| O2 | Emotion*ADHD | −0.640 | P7 | Age*Control | 0.551 |
| T8 | Age*Control | 0.600 | O1 | Confidence*ADHD | −0.408 |
| F4 | Emotion*Control | 0.456 | O2 | Confidence*ASD | 0.528 |
| F8 | Confidence*Control | −0.434 | T8 | Confidence*ADHD | −0.561 |
| AF4 | Emotion*ASD | 0.547 | FC6 | Emotion*ADHD | 0.490 |
| F4 | Emotion*Control | 0.746 | |||
| F8 | Emotion*ASD | −0.574 | |||
| (a) | |
|---|---|
| Valid Syllogism | |
| Squared Singular Values | Total Variance Explained, % |
| 41.183 | 98.43 |
| 0.330 | 99.22 |
| 0.197 | 99.69 |
| 0.105 | 99.94 |
| 0.019 | 99.99 |
| 0.002 | 100.00 |
| (b) | |
| Invalid Syllogism | |
| Squared Singular Values | Total Variance Explained, % |
| 28.476 | 94.44 |
| 0.903 | 97.43 |
| 0.370 | 98.66 |
| 0.224 | 99.41 |
| 0.100 | 99.74 |
| 0.076 | 100.00 |
| Valid Syllogism | Invalid Syllogism | |||||
|---|---|---|---|---|---|---|
| Brain Network | ASD | ADHD | Control | ASD | ADHD | Control |
| Default Mode | AF4, P8 | AF4 | P7, P8 | AF3, AF4, P8 | AF4 | P7, P8 |
| Visual | O1 | O1 | O1, O2 | O2 | O1, O2 | O1 |
| Sensorimotor | T7 | T7 | T8 | T7 | T8 | |
| Auditory | T7 | T7 | T8 | T7 | T8 | |
| Dorsal Attention | O1, P8 | O1, P8, T7 | P7, P8, O1, O2, T8 | O2, P8, FC5, FC6 | T7, O1, O2 | FC6, T7, O1, P8, T8 |
| Salience | T7 | T7 | T8 | T7 | T8 | |
| Executive Control | F7, F8 | F8 | F8 | F7 | F7, F8 | F7 |
| Intensity of Connections of Brain Regions Located in Different Hemispheres | ||
|---|---|---|
| ASD Valid | ADHD Valid | Control Valid |
| AF3 to P8: 0.311 | F3 to AF4: −0.446 | F3 to T8: 0.509 |
| F4 to F7: 0.313 | F4 to FC5: −0.374 | F3 to F8: −0.401 |
| F4 to O1: −0.361 | F4 to P7: 0.5186 | |
| Intensity of Connections of Brain Regions Located in the Same Hemispheres | ||
| F3 to AF3: 0.288 | F3 to FC5: 0.403 | F3 to FC5: 0.314 |
| F3 to F7: 0.283 | F3 to T7: 0.306 | F3 to O1: −0.518 |
| F3 to T7: 0.242 | F3 to O1: −0.304 | F4 to AF4: 0.360 |
| F3 to O1: 0.293 | F4 to FC6: 0.319 | F4 to O2: 0.409 |
| F4 to F8: 0.582 | F4 to P8: −0.299 | F4 to P8: −0.364 |
| Intensity of Connections of Brain Regions Located in Different Hemispheres | ||
|---|---|---|
| ASD Invalid | ADHD Invalid | Control Invalid |
| F3 to P8: 0.307 | F3 to O2: −0.532 | F3 to P8: 0.458 |
| F3 to FC6: 0.321 | F3 to AF4: 0.454 | F3 to FC6: −0.354 |
| F3 to F8: 0.356 | F3 to F8: 0.407 | F4 to P7: 0.387 |
| F4 to T7: 0.614 | ||
| F4 to O1: 0.520 | ||
| Intensity of Connections of Brain Regions Located in the Same Hemispheres | ||
| F3 to AF3: 0.304 | F3 to F7: 0.137 | F3 to F7: −0.382 |
| F3 to FC5: 0.317 | F4 to F8: 0.058 | F3 to O1: −0.387 |
| F4 to AF4: −0.413 | F4 to T8: −0.652 | |
| F4 to F8: 0.656 | F4 to FC6: 0.445 | |
| F4 to O2: −0.336 | ||
Publisher’s Note: MDPI stays neutral with regard to jurisdictional claims in published maps and institutional affiliations. |
© 2021 by the authors. Licensee MDPI, Basel, Switzerland. This article is an open access article distributed under the terms and conditions of the Creative Commons Attribution (CC BY) license (https://creativecommons.org/licenses/by/4.0/).
Share and Cite
Papaioannou, A.; Kalantzi, E.; Papageorgiou, C.C.; Korombili, K.; Bokou, A.; Pehlivanidis, A.; Papageorgiou, C.C.; Papaioannou, G. Differences in Performance of ASD and ADHD Subjects Facing Cognitive Loads in an Innovative Reasoning Experiment. Brain Sci. 2021, 11, 1531. https://0-doi-org.brum.beds.ac.uk/10.3390/brainsci11111531
Papaioannou A, Kalantzi E, Papageorgiou CC, Korombili K, Bokou A, Pehlivanidis A, Papageorgiou CC, Papaioannou G. Differences in Performance of ASD and ADHD Subjects Facing Cognitive Loads in an Innovative Reasoning Experiment. Brain Sciences. 2021; 11(11):1531. https://0-doi-org.brum.beds.ac.uk/10.3390/brainsci11111531
Chicago/Turabian StylePapaioannou, Anastasia, Eva Kalantzi, Christos C. Papageorgiou, Kalliopi Korombili, Anastasia Bokou, Artemios Pehlivanidis, Charalabos C. Papageorgiou, and George Papaioannou. 2021. "Differences in Performance of ASD and ADHD Subjects Facing Cognitive Loads in an Innovative Reasoning Experiment" Brain Sciences 11, no. 11: 1531. https://0-doi-org.brum.beds.ac.uk/10.3390/brainsci11111531