Article

Online Movement Correction in Response to the Unexpectedly Perturbed Initial or Final Action Goals: An ERP and sLORETA Study

1
Neurocognition and Action-Biomechanics Research Group, Faculty of Psychology and Sports Science, Bielefeld University, 33501 Bielefeld, Germany
2
Center of Excellence-Cognitive Interaction Technology (CITEC), Bielefeld University, 33619 Bielefeld, Germany
3
Sport Psychology, BSP Business School Berlin, 12247 Berlin, Germany
*
Author to whom correspondence should be addressed.
Submission received: 24 March 2021 / Revised: 27 April 2021 / Accepted: 12 May 2021 / Published: 15 May 2021
(This article belongs to the Special Issue Human Intention in Motor Cognition)

Abstract

:
In this experiment, we explored how unexpected perturbations in the initial (grip posture) and the final action goals (target position) influence movement execution and the neural mechanisms underlying the movement corrections. Participants were instructed to grasp a handle and rotate it to a target position according to a given visual cue. After participants started their movements, a secondary cue was triggered, which indicated whether the initial or final goals had changed (or not) while the electroencephalogram (EEG) was recorded. The results showed that the perturbed initial goals significantly slowed down the reaching action, compared to the perturbed final goals. In the event-related potentials (ERPs), a larger anterior P3 and a larger central-distributed late positivity (600–700 ms) time-locked to the perturbations were found for the initial than for the final goal perturbations. Source analyses found stronger left middle frontal gyrus (MFG) activations for the perturbed initial goals than for the perturbed final goals in the P3 time window. These findings suggest that perturbations in the initial goals have stronger interferences with the execution of grasp-to-rotate movements than perturbations in the final goals. The interferences seem to be derived from both inappropriate action inhibitions and new action implementations during the movement correction.

1. Introduction

In everyday life, manual actions such as grasping can be produced effortlessly even if the external environment is changed unexpectedly. Whenever an ongoing prehensile action is no longer suitable for the current situation, individuals constantly correct it to comply with new task demands. The movement correction reflects a compensatory motor control mechanism, which comprises a series of efficient cognitive processes, such as a rapid online comparison between the contextual and motoric information (incompatibility detection), a suppression of prepared but inappropriate actions (issued action inhibition), and then the initialization of appropriate actions (novel action implementation) [1,2,3,4]. These processes take place and can be completed in a concise period after the change happens, even if the movements are relatively complex [5,6,7]. With the help of these efficient processes, movement correction facilitates humans to survive potential dangers and also supports individuals to interact adaptively with the dynamic world.
It has been implicated that the frontoparietal network is recruited in movement corrections; the network involves the pre-supplementary motor area (pre-SMA), the supplementary motor area (SMA), the anterior cingulate cortex (ACC), the inferior frontal gyrus (IFG), the premotor cortex (PMC), the intraparietal sulcus (IPS), the superior parietal lobule (SPL), and the supramarginal gyrus (SMG) [1,8,9,10,11,12,13,14,15,16,17]. Among them, the prefrontal cortical areas, such as the pre-SMA, ACC, and IFG, have been associated with detecting the incompatibilities between the contextual and motoric information as well as inhibiting ongoing but inappropriate actions [9,18,19]. Previous event-related potential (ERP) studies [20,21] reported that mid-frontal N2 and P3 components were elicited when a pre-planned response was successfully corrected, and the following source analyses found that these components were mainly derived from the ACC and pre-SMA. Transcranial magnetic stimulation (TMS) studies [15,22,23] also reported that virtual lesions in the IFG or pre-SMA impaired the performance of individuals’ movement adjustments. The ventral portion of the PMC (PMv) was also involved in the inhibition of a pre-planned action during movement corrections [14]. Meanwhile, the dorsal portion of the PMC (PMd) was employed for updating a pre-planned movement, which is not merely involved in inhibiting the issued inappropriate actions, but also initiating the appropriate actions [11,16,24]. The parietal cortical areas, such as the IPS and SPL, were relevant to planning and controlling goal-directed reaching or grasping movements [13,25]. In the correction of manual actions, the anterior portion of IPS (aIPS) is responsible for updating goal-related information and implementing new actions [1,8,26], whereas the SPL is mainly engaged in the real-time adjustments of the movement [8,27].
In previous studies, researchers have often focused on the movement corrections compensating for the perturbations in the recruitment of movement effectors (such as from one finger to another finger) [11,16,20,21,28,29] or the changes in physical properties (shape, size, orientation) of the target object [1,8,30,31,32,33,34]. For example, in a reach-to-grasp task [8], participants were instructed to pincer-grasp a wooden cuboid on the narrow side (1 cm) if it was horizontally oriented, or on the wide side (5 cm) if it was vertically oriented. The cuboid was always horizontally oriented before the movement onset, but in 25% of the trials, it went to vertical orientation as soon as participants started to move. Tunik et al. [8] found that the unexpected perturbations in orientation had considerable effects on reach-to-grasp kinematics. The final metacarpophalangeal (MCP) joint angle and the peak MCP angle were significantly larger for the perturbed than the unperturbed trials. The time to peak MCP was also significantly delayed in the perturbed trials, and the adaptive responses occurred around 271 ms after the perturbation.
Individuals correct their movements not only in response to the perturbations in the movement effectors or target objects, but also to compensate for the perturbations in the anticipated action effects (action goals) [35,36]. In a grasp-to-place task [35], with a modified “S1–S2” paradigm, participants were asked to grip a horizontal cylinder (either overhand or underhand, free choice) and placed the left or right end of the cylinder into a target disk according to the visual stimulus (final action goal, S1). As soon as participants started their movements, a secondary stimulus (S2) was triggered, which indicated whether the intended action goal was perturbed (20% of the trials) or not (80% of the trials). Hughes et al. [35] found that when the intended action goals were perturbed, participants corrected their initial grasp postures during reaching to ensure a comfortable hand posture at the end of the object placing (end-state comfort), which resulted in a longer reach time and a shorter time to peak velocity during reaching. The corrections occurred either early (30% of the normalized reach time) or late (46% of the normalized reach time) in the reaching phase. Nevertheless, these studies [35,36] have been limited to the perturbations in the final action goals. Apart from the final action goal, the initial action goal (grip posture) is also crucial in planning and controlling manual actions.
Rosenbaum et al. [37] have proposed that manual actions are organized with a hierarchical motor plan in which both the initial goal (anticipated start posture) and the final goal (anticipated end posture) are located at the top level, and all the transitions between the initial and the final goals are located at the lower levels. Compared to the final goal, the initial goal acts as an immediate task demand in the execution of grasping movements, whereas the final goal acts as a remote (further) task demand. Therefore, if the unexpected perturbation in the initial goals occurs during reaching, it would have a stronger interference with motor execution than a perturbation in the final goals because the initial goal is the immediate (direct) action effect of reaching. However, it has also been argued that the final action goals are more important for planning and executing manual actions than the initial grip goals [38,39,40], and initial grip postures are selected on the basis of final task purposes in movement corrections [35,41]. Since there has been little discussion on the movement corrections with a perturbed initial goal, it is still difficult to conclude whether the perturbed initial goals have stronger interference with motor execution than the perturbed final goals or not.
In this study, we sought to investigate how unexpected perturbations in the initial or the final action goals influence the execution of grasp-to-rotate movements. To address this issue, we induced an unexpected perturbation in either the initial or the final action goals with the modified S1–S2 paradigm. Participants were cued by a visual stimulus (S1) with specified initial and final goals. When participants started their movements, a secondary stimulus (S2) was triggered, which indicated whether the anticipated initial and final goals were perturbed or not. When the goals were perturbed, participants were asked to correct their movements to comply with the corresponding perturbations. Electroencephalography (EEG) was recorded during the movement execution. The event-related potentials (ERP) and the subsequent source analyses were employed to distinguish the neural mechanisms underlying the movement corrections to adapt to the perturbations in the initial or the final goals.
On the basis of previous studies [8,20,21,35,42], we hypothesized that the perturbations in the action goals interfere with the motor execution, which can be characterized as longer reach times, stronger anterior N2s (incompatibility detection), stronger anterior P3s (issued action inhibition), and larger late slow waves (new action implementation) in the goal-perturbed conditions versus the non-perturbed condition. Moreover, we also assumed that the perturbed initial goals have a stronger interference with the motor execution than the perturbed final goals, due to the fact that the initial goal (how to grip the handle) is the immediate demand for the grasping action and an unexpected change in the immediate demand may have a stronger interference than a change in the future demand (final goal). In this regard, we further hypothesized that reach times might be longer for the movement correction to adapt to perturbed initial goals than perturbed final goals. Neurophysiologically, we expected a stronger anterior P3, as well as more positive late slow waves, for the trials with perturbed initial goals than with perturbed final goals, which may reflect (prepared) action inhibitions (P3) and (new) action implementation (slow waves) in movement re-planning.

2. Method

2.1. Participants

Twenty-four volunteers were initially recruited for this experiment. Four of them were discarded due to the EEG artifact, resulting in a final sample of 20 participants (mean age = 24.30 years; SD = 2.32; 11 females). All participants were right-handed (mean score = 90; SD = 14; Edinburgh Handedness Inventory [43]). All participants were with normal or corrected-to-normal vision and had no history of psychiatric or neurological impairments. All participants gave their written informed consent under the Declaration of Helsinki before they participated in the experiment, and the experimental protocol was approved by the ethics committee at Bielefeld University (EUB, No.2021-085).

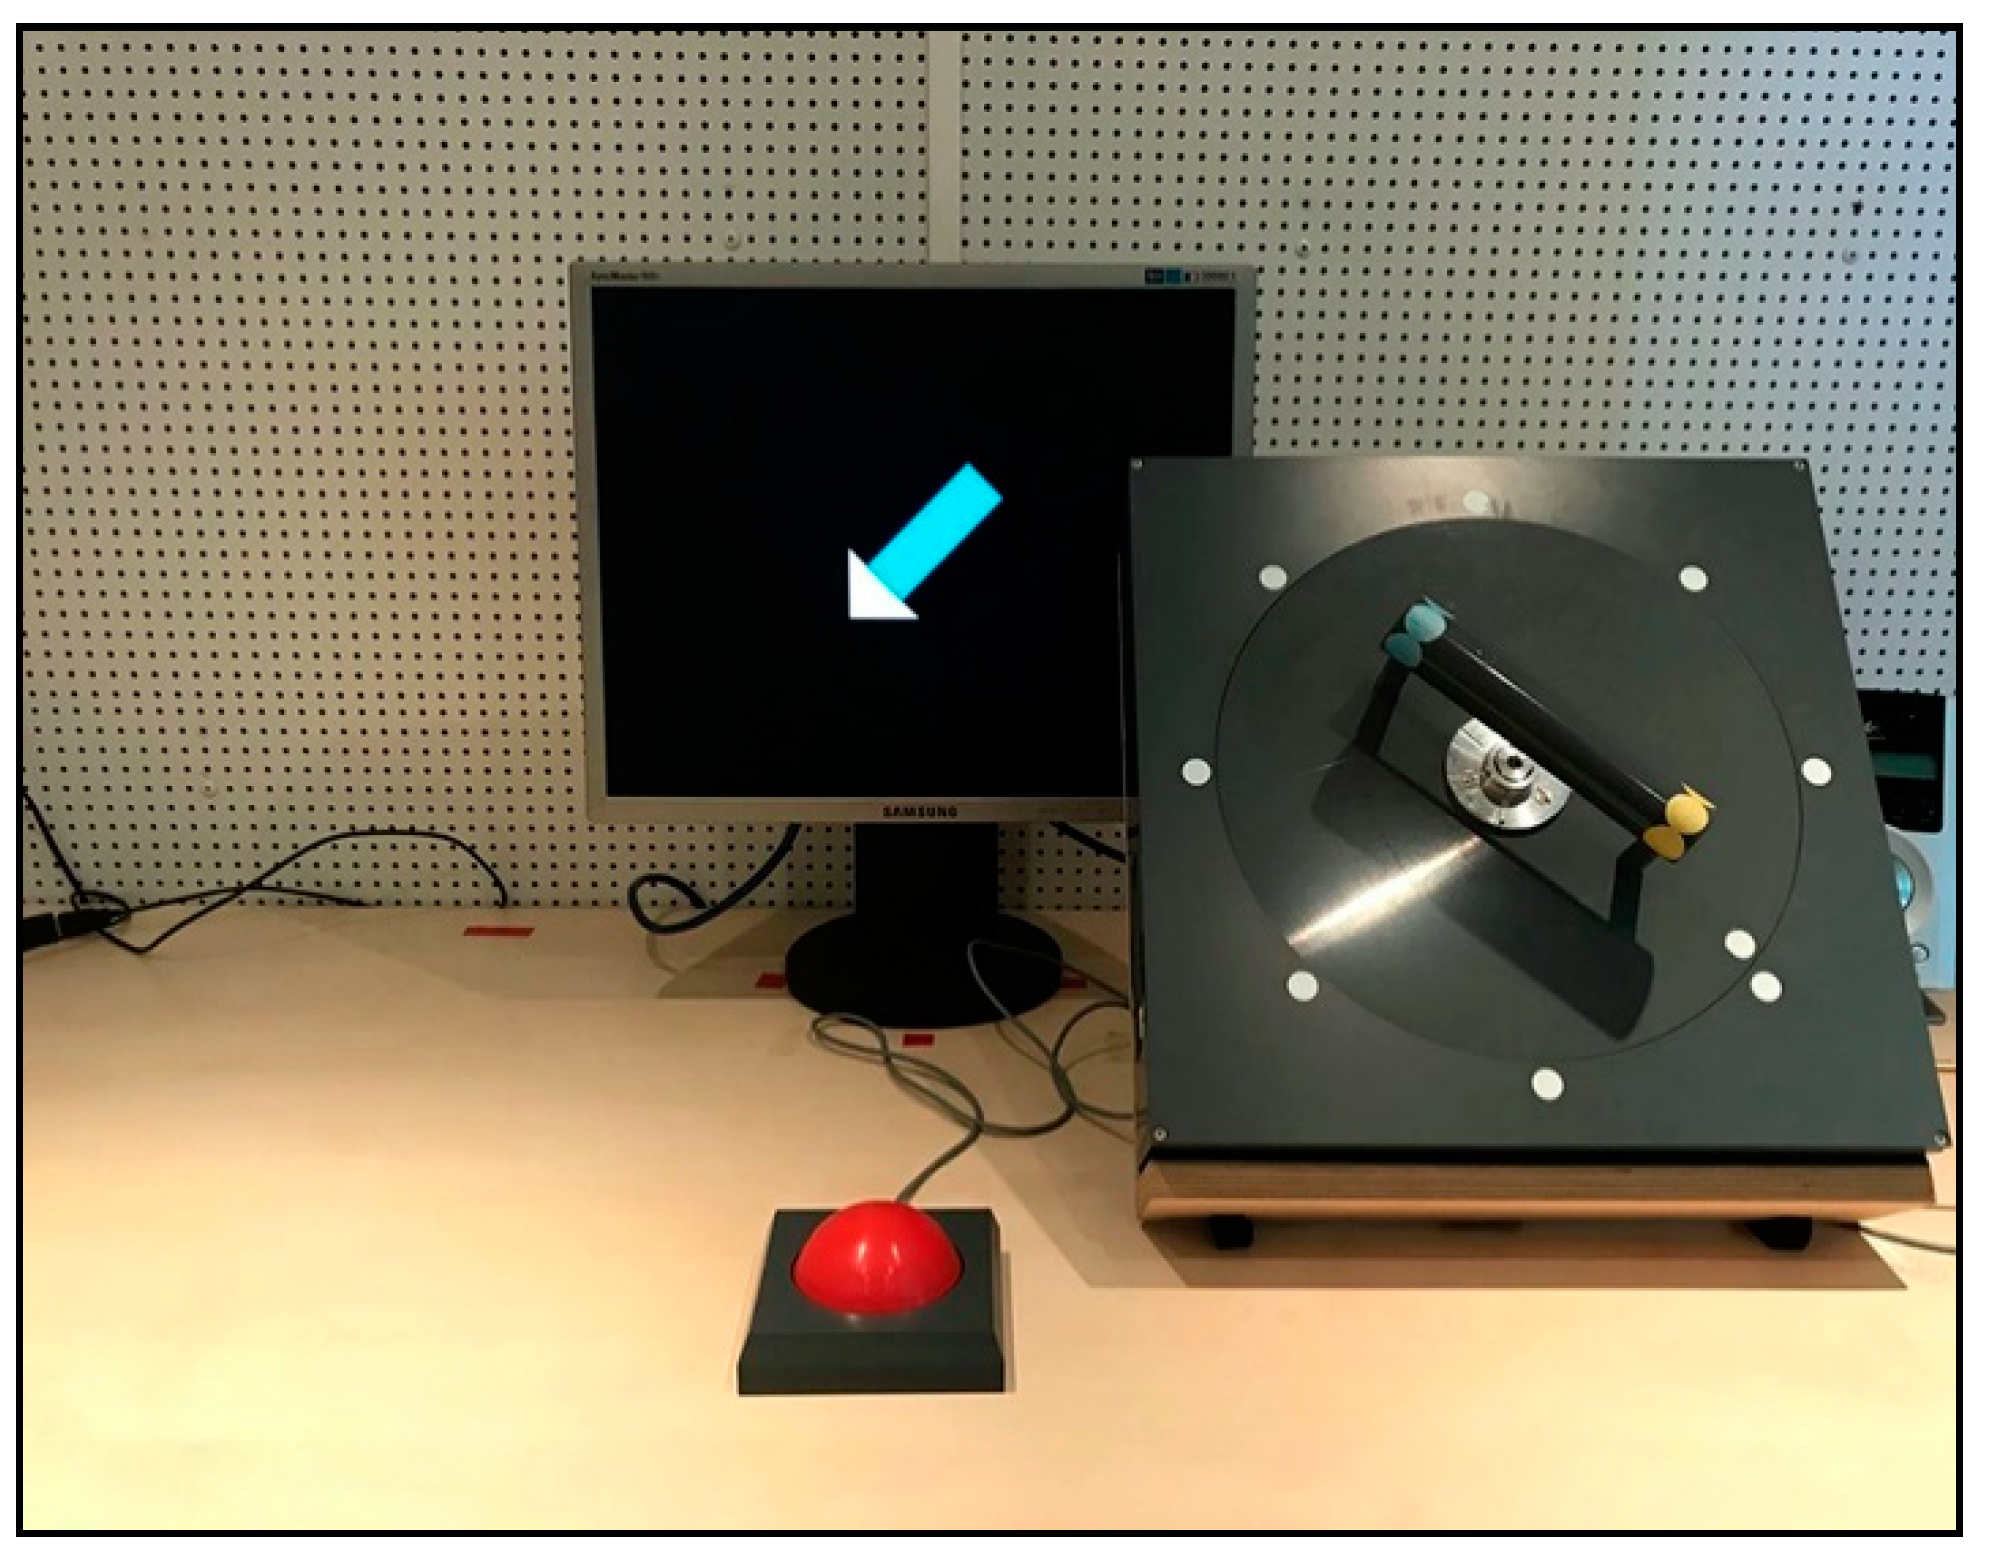
2.2. Apparatus and Stimuli

The setup of the grasp-to-rotate task is shown in Figure 1. The graspable part was a handle (cylinder, 16 cm in length, 3 cm in diameter) that had a yellow stripe at one end and a blue stripe at the other end. The handle was attached to a disk (28 cm in diameter), which could be rotated clockwise or counterclockwise. On the disk, a white pointing marker was placed next to the yellow end of the handle, and it was used to indicate the handle direction. Outside of the disk, eight target markers were fixed in the dial-display. During the experiment, the rotation apparatus was always settled where its center faced the shoulder of the participant’s grasping arm, and the distance was calibrated to each participant’s arm size for preventing expansive movements. A start button was placed in front of the participants, and the distance was also calibrated to each participant. The distance between the button and the rotation apparatus was constant for each participant (35 cm between the centers).
A 19-inch TFT monitor was placed behind the rotation apparatus, and it was about 75 cm away from the participants. Colored arrows were employed as the visual stimuli, and they were presented by Presentation (Neurobehavioral Systems, Berkeley, CA, USA). The color (yellow or blue) indicated that participants should grip the handle with their thumbs toward the corresponding stripe. The direction of the arrow (eight directions are identical with the eight target markers) indicated that participants should rotate the handle (pointing marker) to the pointed target marker. The direction was always perpendicular to the handle’s initial orientation, and participants were instructed to make 90-degree rotations.

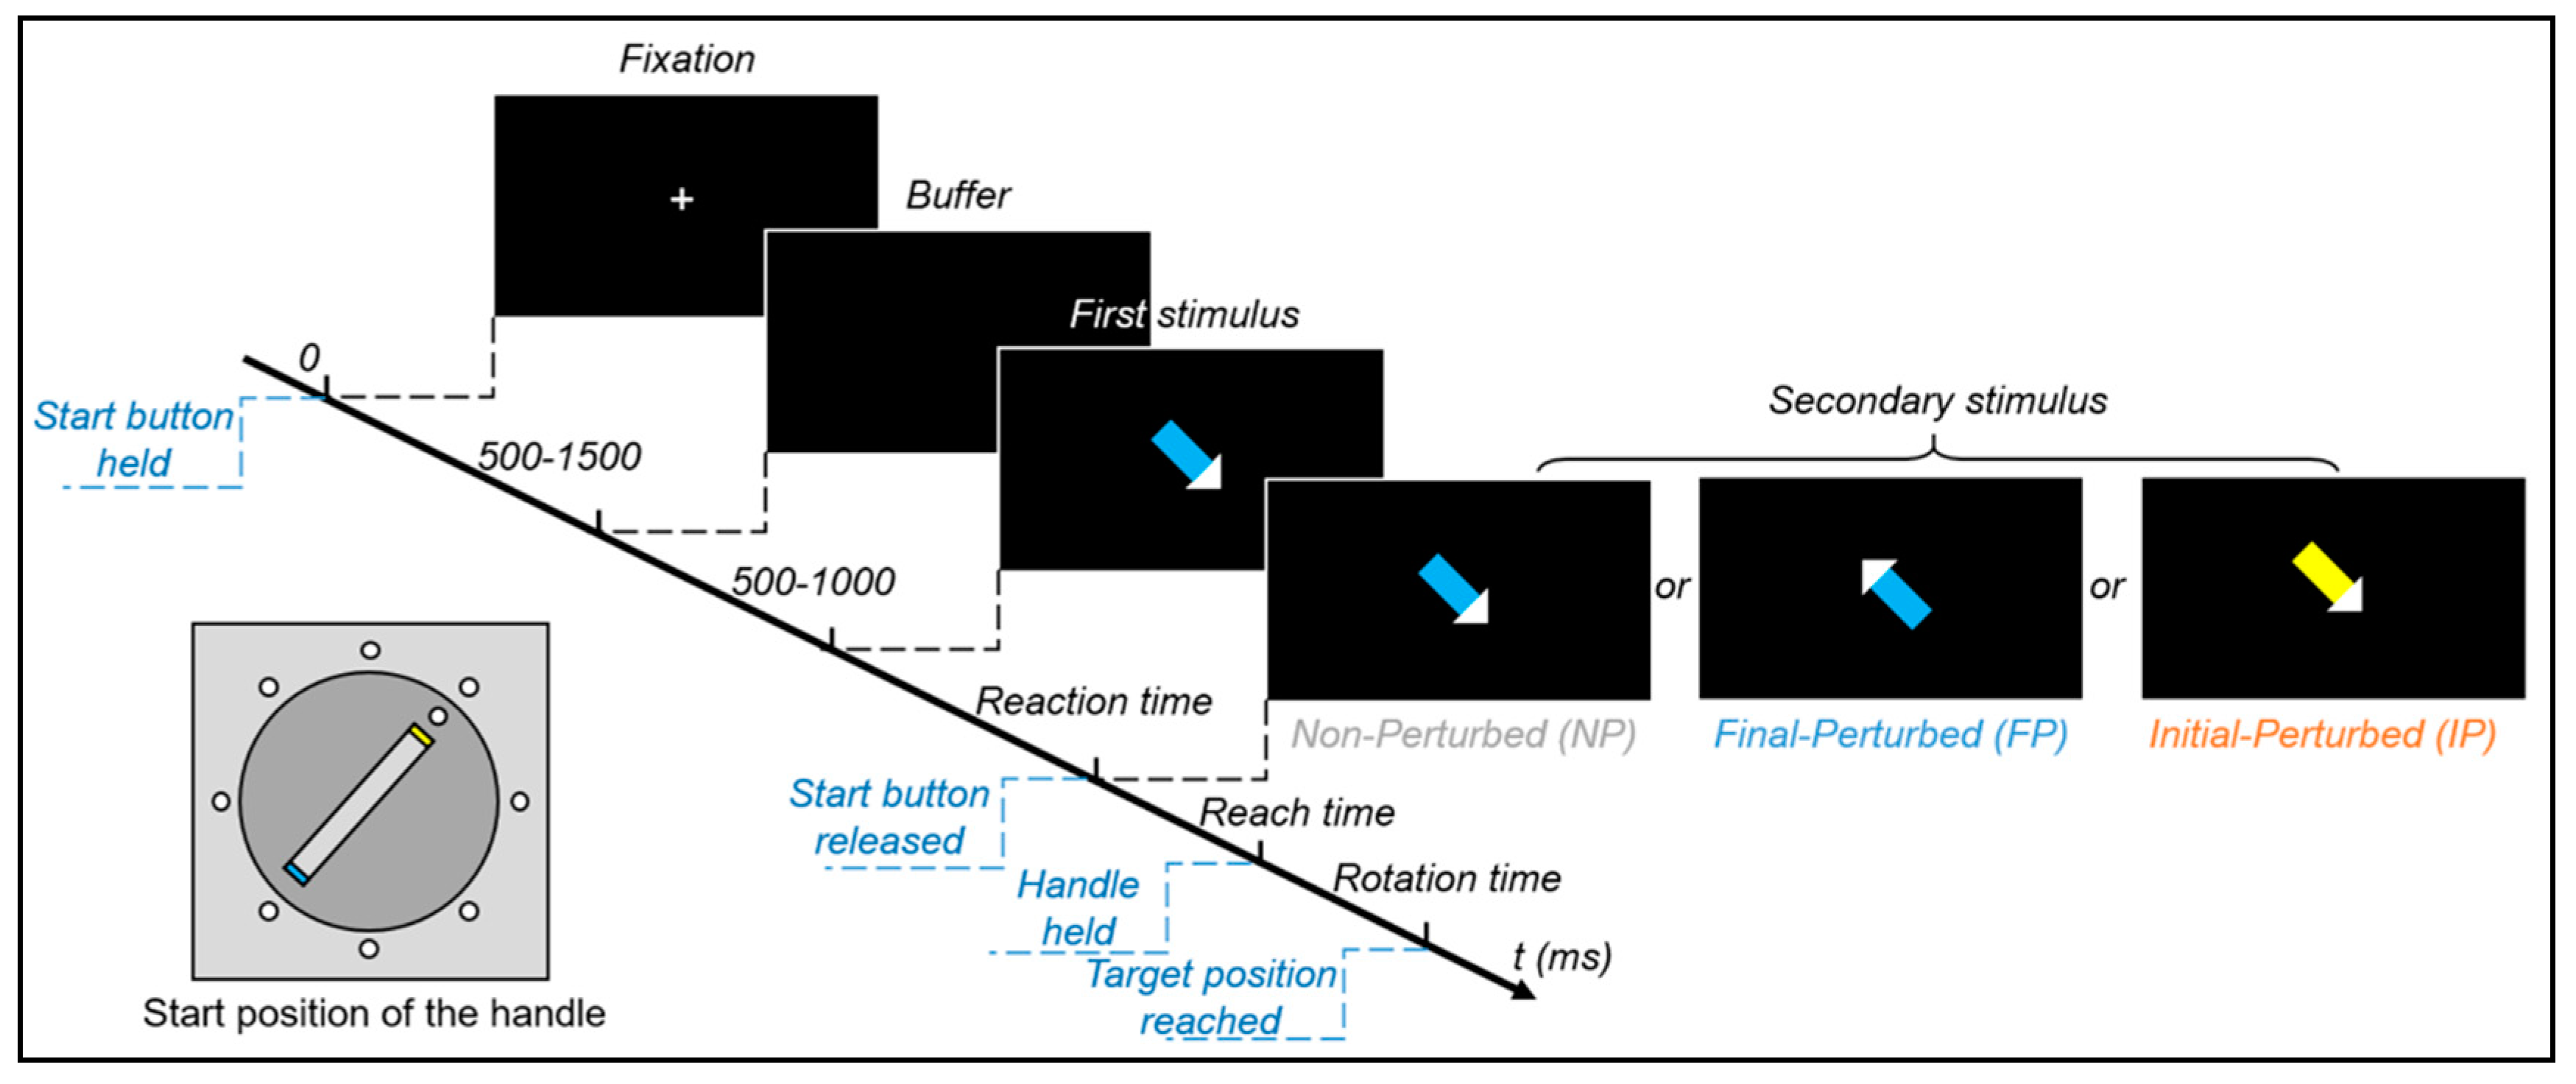
2.3. Experimental Paradigm

In this experiment, participants were instructed to grip the handle (initial goal) and rotate it to a target position (final goal). To introduce the movement correction, we used a modified S1–S2 paradigm. With the first stimulus (S1), the initial and the final goals were given by a colored arrow, and participants were instructed to respond to it. As soon as participants started their movements, another colored arrow was triggered as the secondary stimulus (S2), and it was either the same as or different from the first one. Participants were instructed to finish the movement with the new stimulus if it got perturbed. Thus, different S2s divided the experiment into three conditions (see Figure 2): (1) Final-Perturbed (FP)—the arrow direction changed to the opposite, but the color stayed; (2) Initial-Perturbed (IP)—the color changed to the opposite (yellow to blue or blue to yellow), but the direction stayed; (3) Non-Perturbed (NP)—neither color nor direction changed.

2.4. Procedure

After the EEG preparations, participants were guided to a shielded room and seated comfortably at the experimental desk. A written instruction was provided to the participants. The stimulus changes were not mentioned in the instruction for reducing the expectancy effect, and participants were only instructed to react to the stimulus, which was showing on the screen. All of the questions regarding the task were answered.
The experimental trial (see Figure 2) started with a voluntary button press. Then the handle automatically moved to the start position by the motor inside of the apparatus. The start positions were randomly assigned to each marker, and every marker had the same number of trials. After participants held the start button, a fixation cross was presented at the center of the screen with a variable duration from 500 to 1500 ms. After the fixation, a black screen was presented as a buffer for a variable duration from 500 to 1000 ms. Then the S1 was presented. Participants were asked to respond to it as soon as possible. Once the participants released the button, an S2 was presented. Participants had to correct their movements if the stimulus changed. The S2 disappeared when the handle reached the target position (precisely at the target marker). The next trial came after another button press. If the start button was released before the first stimulus, error feedback was presented for 1500 ms, and the next trial came after that. To minimize the ocular artifacts, participants were instructed to keep their gaze at the center of the screen during motor planning and execution.
The experiment began with a practice section in which all 24 trials were non-perturbed trials. After the practice, participants started eight experimental blocks and each block contained 48 trials. Two-minute breaks were given between the blocks. To avoid the laterality of the brain activations due to hand use, we asked participants to perform the tasks with both hands (one hand for the first four blocks, and then change to the other hand). The starting hand (left/right) was counterbalanced. After the first four blocks, the rotation apparatus was moved to the other side and recalibrated. Half of the trials were gripped with the thumb toward the yellow stripe, and the remaining trials were gripped with the thumb toward the blue stripe. Half of the trials were rotated clockwise, and the remaining trials were rotated counterclockwise. The grips and rotation directions were randomly assigned to the trials. Additionally, to minimize the participant’s expectancy, we set the ratio of “FP/IP/NP” to 1/1/6, that is, 48 FP trials, 48 IP trials, and 288 NP in total. After the experiment, subjective difficulty ratings (from 1 to 6, from easy to difficult) for different perturbed conditions were queried. It took around 2 h to finish the experiment.

2.5. Behavioral and Electrophysiological Recordings

The participants’ performance was recorded by a video camera. The time points of releasing the start button, gripping the handle, and reaching the target position were detected by the micro-switches in the apparatus. The reaction time (from the first stimulus onset to movement onset), reach time (from movement onset to gripping the handle), and rotation time (from gripping the handle to reaching the target position) were calculated with these time points.
The electroencephalography (EEG) signals were collected by an ANT amplifier and the acquisition software ASA (ANT Neuro, Hengelo, The Netherlands) at a sampling rate of 512 Hz. Recordings were made from 64 Ag/AgCl electrodes, which were positioned in accordance with the international 10–10 system. Electrooculography (EOG) was also recorded by two bipolar electrodes placed above and below the right eye and lateral to both eyes. The impedance of all electrodes was less than five kΩ, and the electrode AFz was selected as the recording ground. All signals were band-pass filtered (DC-138 Hz) and average-referenced during the recording.

2.6. Data Analysis

2.6.1. Behavioral Data

Based on the performance videos, trials with wrong grips, wrong rotation directions, or changing grip during the rotation were excluded from the behavioral and neurophysiological analyses. Trials with extreme (outside of mean ± three standard errors) reaction time, reach time, or rotation time were also excluded. On average, participants executed the task correctly in 85% of the FP trials, 84% of the IP trials, and 93% of the NP trials. Since we did not find any significant main or interaction effects involving “hand used” in behavioral timings, we pooled the left- and right-hand trials together in the analysis. The average numbers (and the standard deviations) of the remaining trials in different conditions are shown in Supplementary Table S1. Repeated-measures ANOVAs were performed separately on participants’ averaged reaction times, reach times, and rotation times to determine the within-subject effect for perturbation (FP/IP/NP).

2.6.2. ERPs

EEG signals were offline analyzed with the toolbox EEG lab [44] and ERP lab [45]. All signals were band-pass filtered (0.1–30 Hz) and re-referenced with the linked mastoid electrodes. Two analysis epochs were extracted from the continuous signals. Epoch time-locked to S2 (as well as movement onset) included the time interval from −1400 to 1000 ms. Epoch time-locked to grasping included the time interval from −2900 to 300 ms. Baseline correction was performed with the first 300 ms of the epochs. Gratton regression [46,47] was employed to correct the ocular artifacts. Any trials containing peak-to-peak amplitudes above 100 µV within a moving window (200 ms window; 50 ms step) were automatically removed. The remaining trials were visually double-checked for artifacts that would not have been detected by the moving window algorithm. On average, there were 34 FP trials, 35 IP trials, and 232 NP trials left for averaging the ERPs in the epoch time-locked to S2, and there were 33 FP trials, 34 IP trials, and 227 NP trials left for averaging the ERPs in the epoch time-locked to grasping (see Supplementary Table S1 for more details).
In the epoch time-locked to S2, an obvious P3 (300–600 ms) and obvious late positive slow-wave potentials (600–1000 ms) were found for the goal-perturbed conditions (FP, IP), as compared to the NP condition. For the P3 component, the amplitude was quantified as the mean amplitude from 390 to 440 ms (the average P3 peak latency was 415 ms). For the slow-wave potentials, mean amplitudes were measured and compared in 100 ms step windows. Both the P3 and slow-wave potentials were accessed among nine regions of interest (ROI) to assess the scalp distribution. The ROIs were anterior-left (AL): AF7, F7, F5, F3; anterior-middle (AM): F1, Fz, F2; anterior-right (AR): AF8, F8, F6, F4; central-left (CL): C3, C5, CP3, CP5; central-middle (CM): FCz, Cz, CPz; central-right (CR): C4, C6, CP4, CP6; posterior-left (PL): PO7, PO5, PO3, O1; posterior-middle (PM): Pz, POz, Oz; posterior-right (PR): PO8, PO6, PO4, O2. Repeated-measures ANOVAs with the factor perturbation (FP/IP/NP), left–right (left/middle/right), and front–back (anterior/central/posterior) were performed on the mean amplitudes of the electrodes (in corresponding ROIs).
In the epoch time-locked to grasping, we only focused on the slow-wave potentials before grasping. According to the previous findings [39,48,49], the analysis time window was set as −500–0 ms. Similar to the previous epoch, the mean amplitudes of the slow-wave potentials time-locked to grasping were also compared in 100 ms step windows. Mean amplitudes of the above-mentioned nine ROIs were compared by repeated-measures ANOVAs with the factor perturbation (FP/IP/NP), left–right (left/middle/right), and front–back (anterior/central/posterior) to determine the perturbation effect and its scalp distribution.
All the above-mentioned ANOVAs were conducted in R [50]. Greenhouse-Geisser correction was applied whenever the sphericity assumption was violated. The original degrees of freedom and the corrected p-values were reported. Generalized eta-squared ( η G 2 ) was used for evaluating the effect size. Post hoc multiple comparisons among means were made with Bonferroni t-tests.

2.6.3. Source Analysis

In a subsequent analysis, the three-dimensional cortical distributions of the averaged ERPs (in different conditions) were analyzed with the standardized low-resolution brain electromagnetic tomography analysis software (sLORETA) [51]. The sLORETA partitions the intracerebral volume in 6239 grey matter voxels with a spatial resolution of 5 mm, and the standardized scalp current density at each voxel is then calculated in a realistic head model [52] with the probabilistic MNI152 template [53].
In order to identify possible differences in the brain electrical activity between the goal-perturbed conditions (FP vs. IP), statistical non-parametric mapping (SnPM) [54] was employed for computing the averaged intracerebral current density distribution at the time intervals showing significant differences based on a non-parametric log-F-ratio statistic on the three-dimensional sLORETA images (number of randomizations = 5000). The SnPM corrected for multiple comparisons [54]. Voxels with significant differences (p < 0.05) between the perturbed conditions were located in specific brain regions with Brodmann areas (BA) and the MNI coordinates.

3. Results

3.1. Subjective Difficulty Ratings
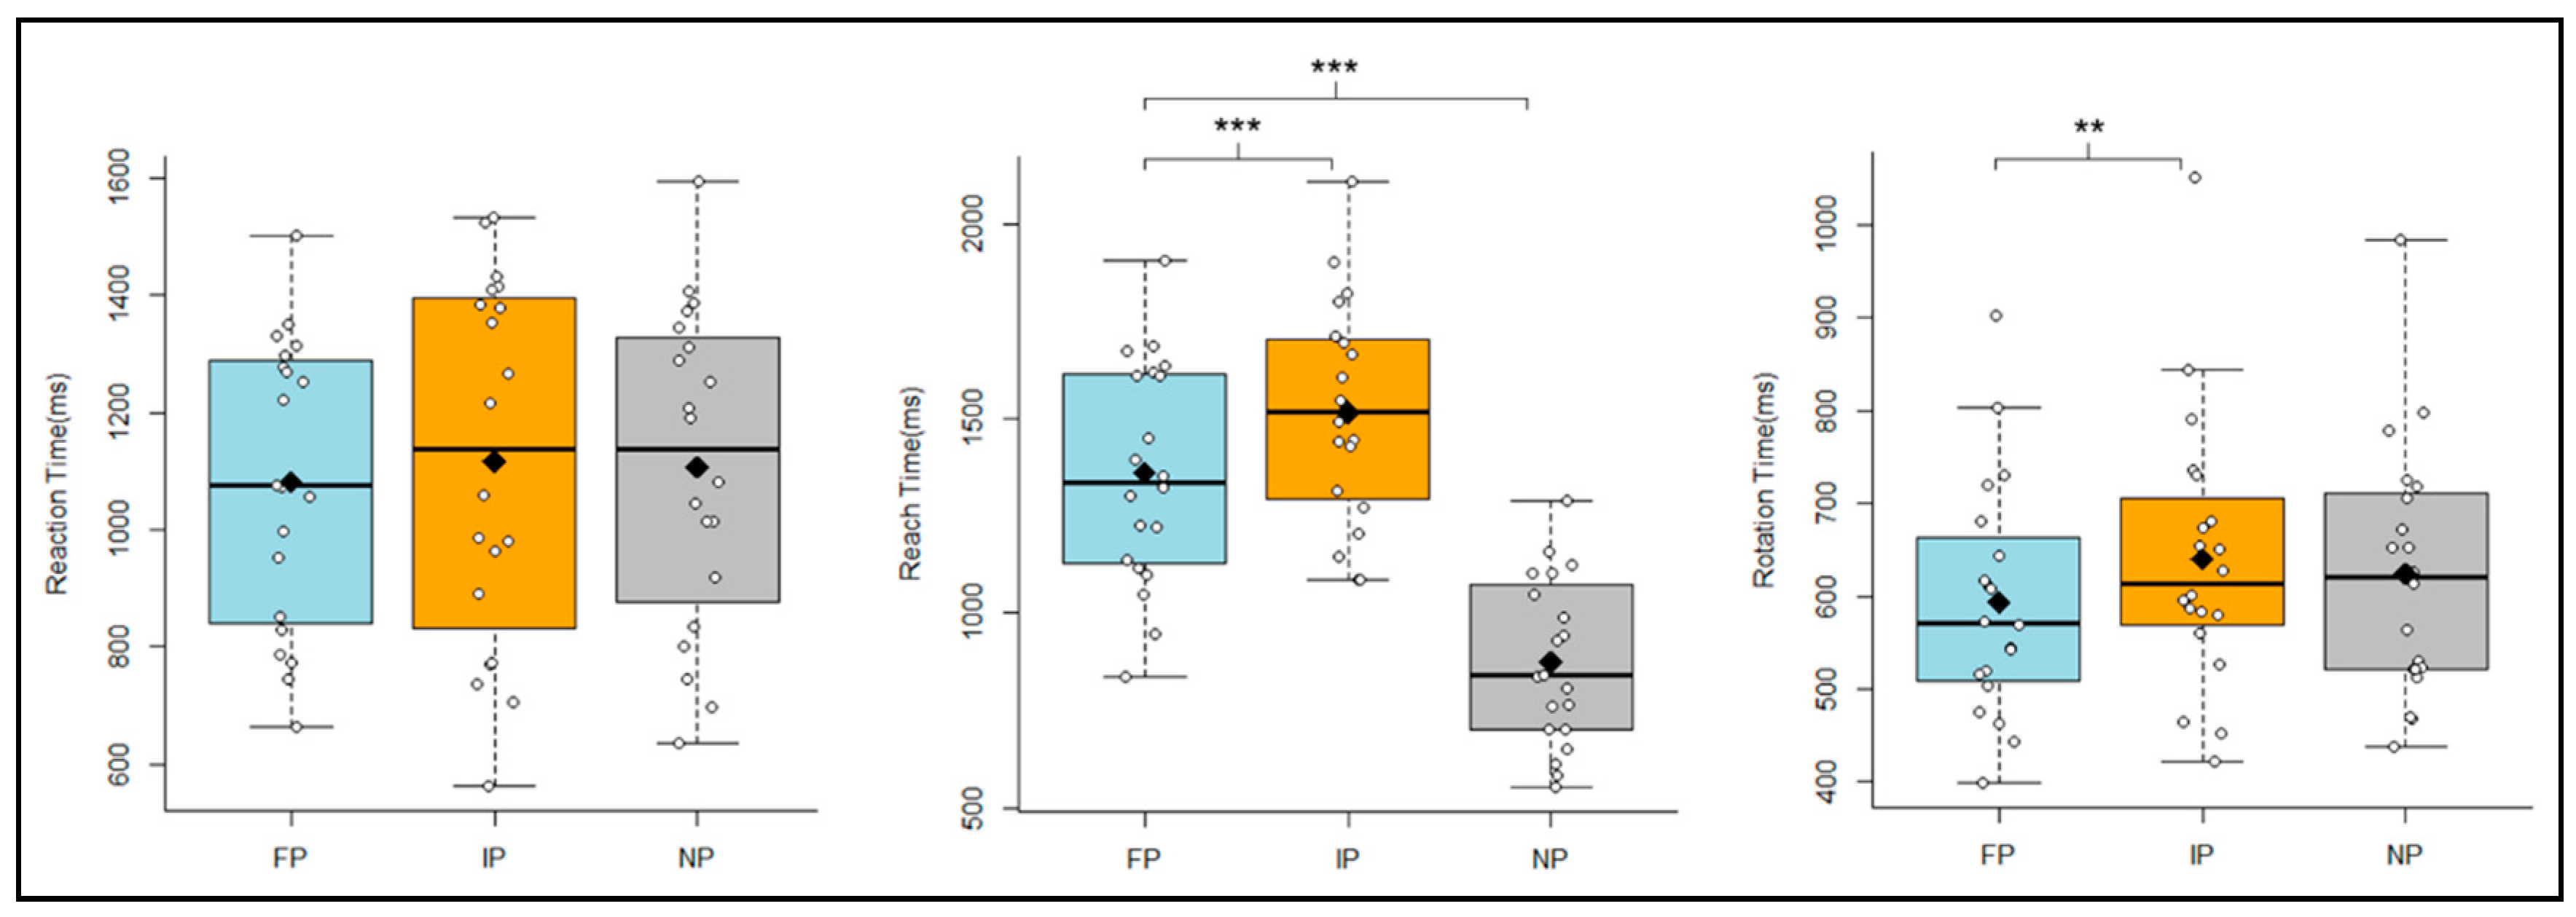
Participants rated the subjective difficulty of FP trials as 3.20 (SD = 1.36) on a scale from 1 (easy) to 6 (difficult). For the IP trials, the average difficulty was rated as 3.35 (SD = 1.18). The paired t-test yielded that the subjective difficulty was not significantly different between the goal-perturbed conditions, t(19) = 0.65; p > 0.05.

3.2. Timing

The averaged reaction, reach, and rotation times for different conditions were shown in Figure 3. For the reaction time, we did not find a significant difference among the different conditions (FP/IP/NP), F(2,38) = 2.69; p > 0.05.
For the reach time, we found a significant main effect for perturbation, F(2,38) = 132.52; p < 0.001;   η G 2 = 0.533. Post hoc analyses revealed that the reach time was longer in the IP condition (1515 ms, SD = 281) than the FP condition (1359 ms, SD = 285), t(19) = 7.59; p < 0.001, and a longer reach time was also found for the FP condition than the NP condition (875 ms, SD = 213), t(19) = 10.58; p < 0.001.
For the rotation time, we also found a significant main effect for perturbation, F(2,38) = 7.13; p < 0.01;   η G 2 = 0.021. Post hoc analyses yielded that rotation times were significantly longer for the IP condition (641 ms, SD = 145) than for the FP condition (593 ms, SD = 126), t(19) = −3.73; p < 0.01. However, the difference between the NP condition (624 ms, SD = 136) and the FP condition was not significant, t(19) = 2.26; p > 0.05, and neither was the difference between the NP condition and the IP condition, t(19) = −1.37; p > 0.05.

3.3. ERP Results

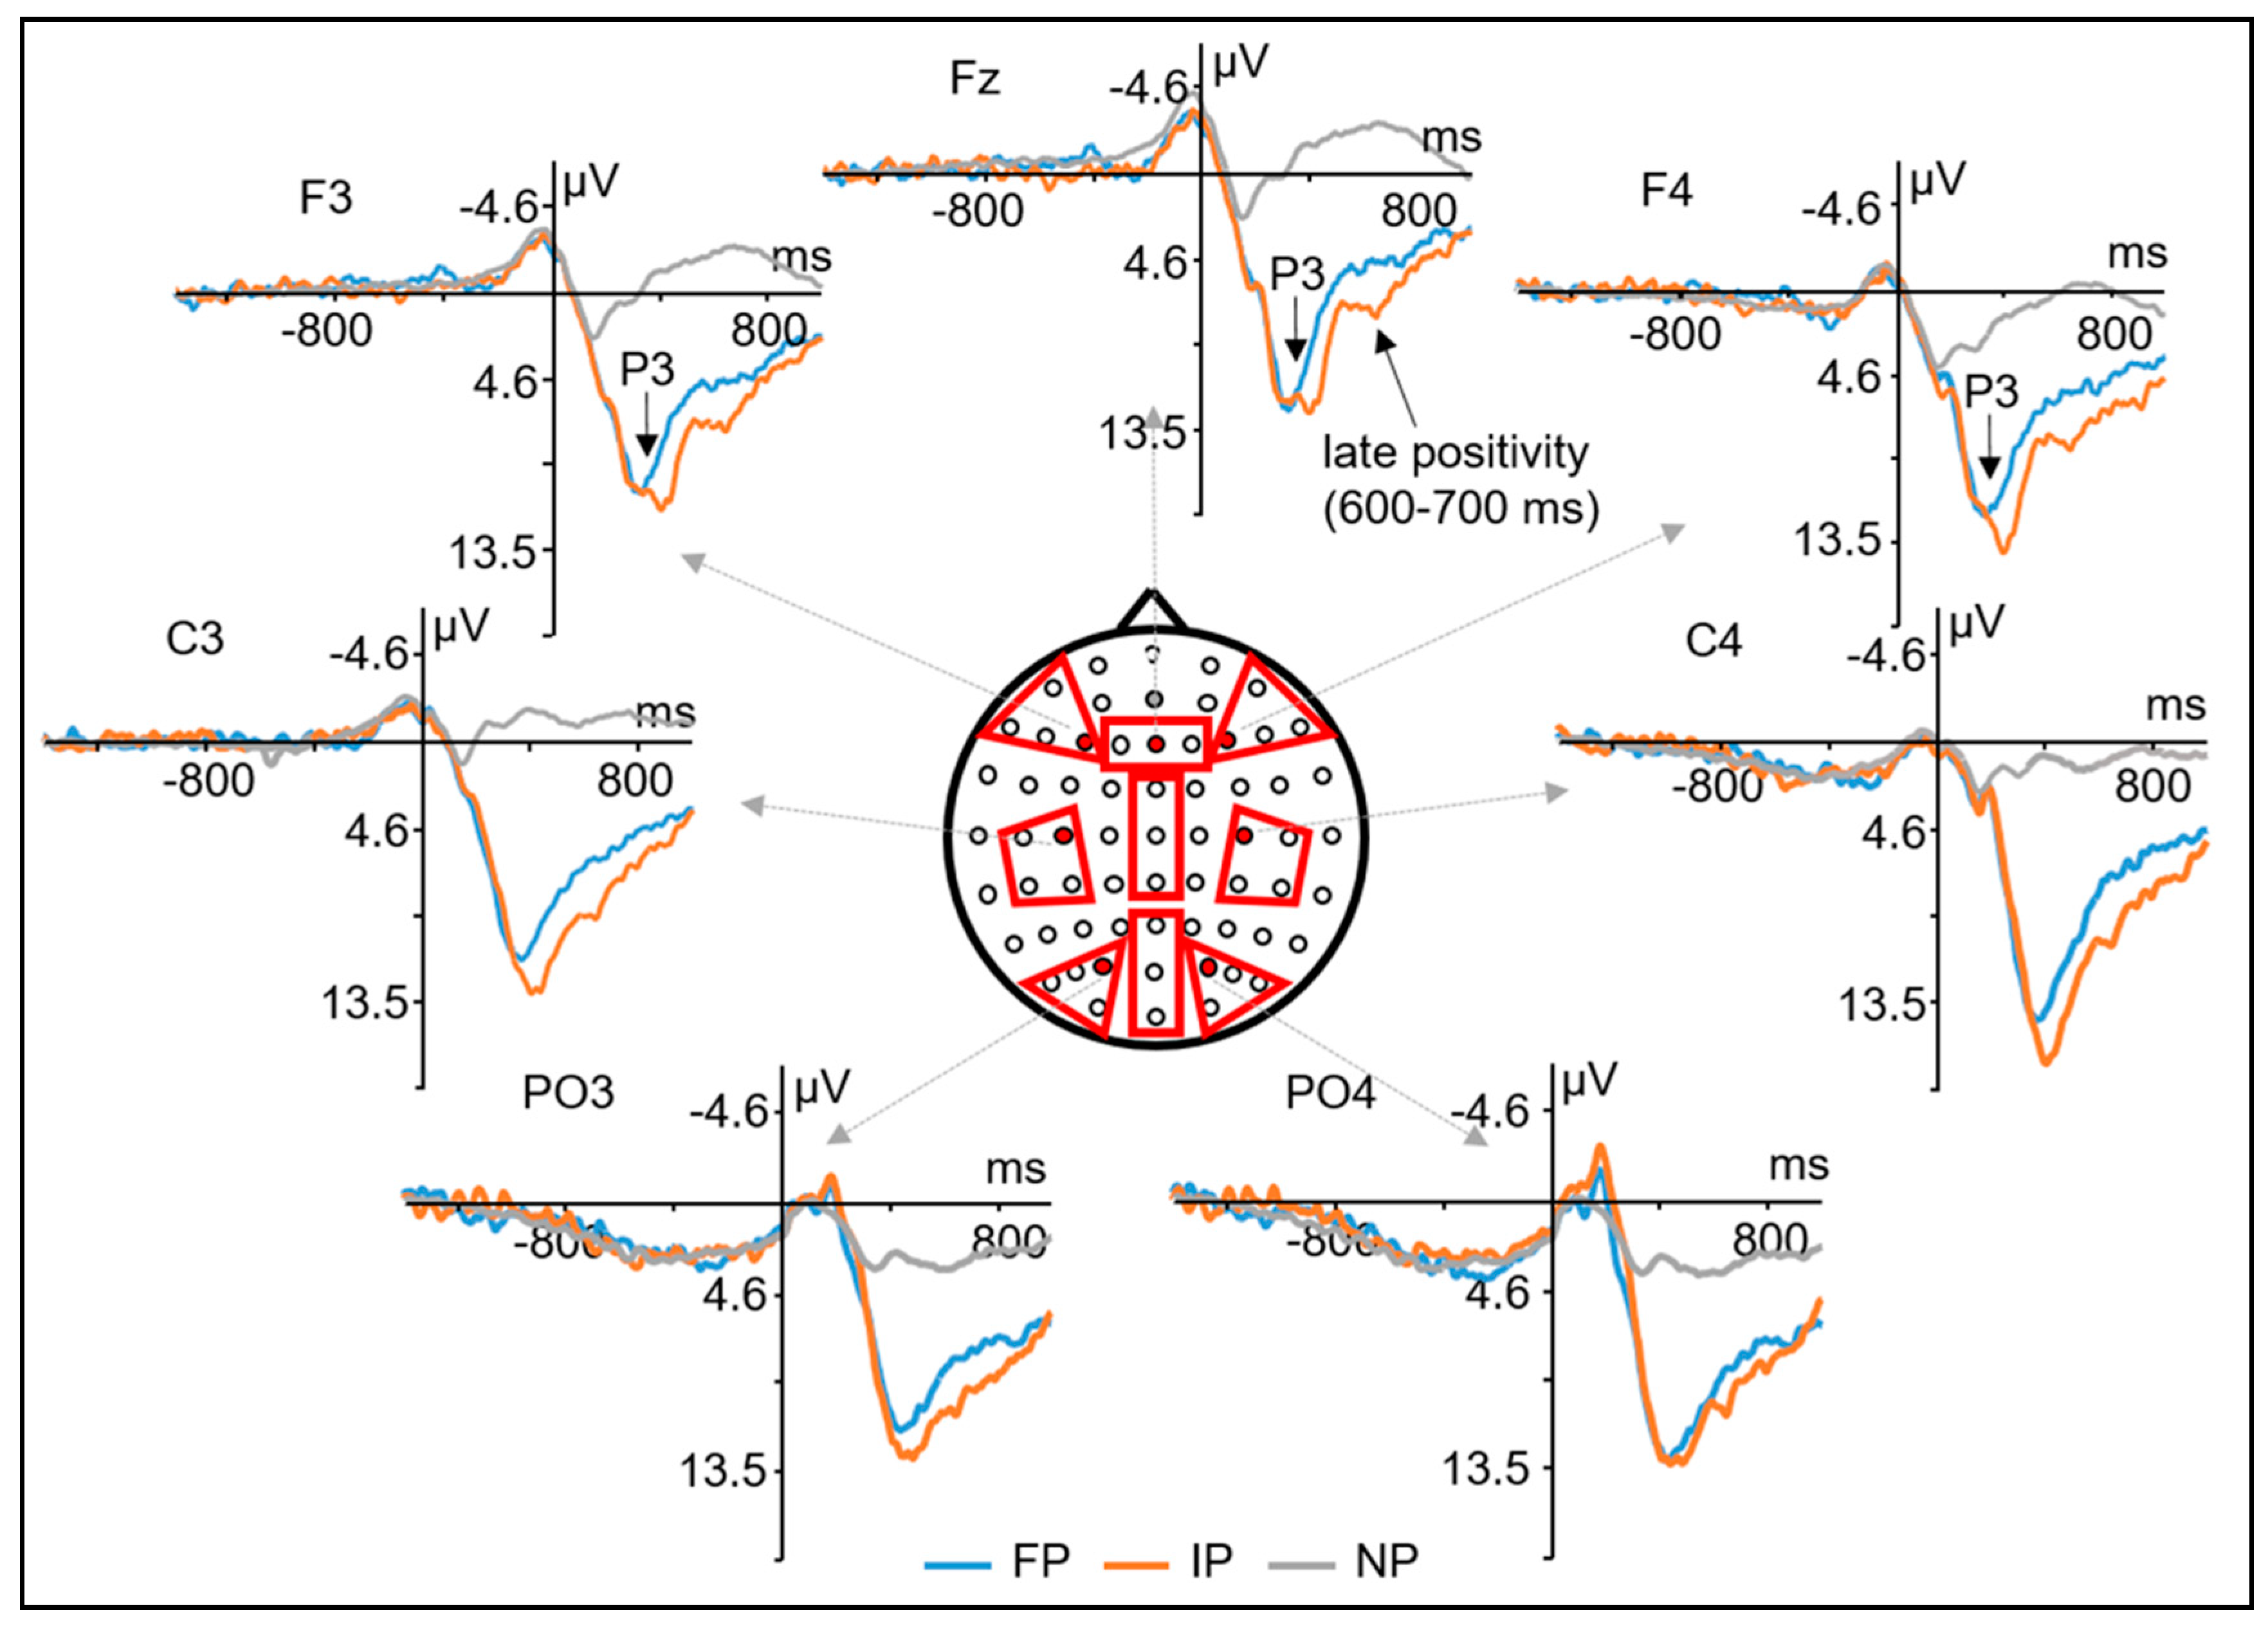
3.3.1. Epoch Time-Locked to the Secondary Stimulus

P3 (300–600 ms) With the factor perturbation (FP/IP/NP), left–right (left/middle/right), and front–back (anterior/central/posterior), the ANOVA of P3 amplitude yielded significant interaction effects for perturbation*front–back, F(4,76) = 9.83; p < 0.001; η G 2 = 0.015, perturbation*left–right, F(4,76) = 25.24; p < 0.001; η G 2 = 0.010, and left–right*front–back, F(4,76) = 9.98; p < 0.001; η G 2 = 0.007. We also found significant main effects for perturbation, F(2,38) = 39.27; p < 0.001; η G 2 = 0.268, and left–right, F(2,38) = 20.16; p < 0.001; η G 2 = 0.017. Further analyses revealed that in the anterior ROIs, P3 mean amplitude was larger in the IP condition (11.53 μV, SD = 8.16) than the FP condition (8.10 μV, SD = 6.29), t(19) = 3.22; p < 0.01, and the P3 in FP condition was also larger than the NP condition (0.80 μV, SD = 7.34), t(19) = 6.87; p < 0.001. However, in the central and posterior ROIs, the amplitude differences between the IP and FP conditions were not significant, all ts < 1.62; all ps > 0.34, but the P3 amplitudes were larger in the goal-perturbed conditions (FP, IP) than the non-perturbed condition (NP), ts > 4.72; all ps < 0.001 (see Supplementary Table S2 for more details). Moreover, the P3 amplitudes were also larger in the goal-perturbed conditions (FP, IP) than the non-perturbed condition (NP), ts > 5.94; all ps < 0.001, over the left, middle, and right ROIs. Nevertheless, the amplitude differences between the IP and FP conditions were not significant, all ts < 1.46; all ps > 0.46. No other significant effects between the FP and IP conditions were found in the further analyses. The ERP waveforms can be seen in Figure 4.
Slow-wave potentials (600–1000 ms) For the ERP slow-wave potentials from 600 to 700 ms, the ANOVA revealed a significant interaction effect for perturbation*left–right, F(4,76) = 8.71; p < 0.001; η G 2   = 0.002, and a significant interaction effect for front–back*left–right, F(4,76) = 6.16; p < 0.001; η G 2   = 0.004. The main effects for perturbation, F(2,38) = 36.12; p < 0.001; η G 2   = 0.110, front–back, F(2,38) = 11.70; p < 0.001; η G 2   = 0.018, and left–right, F(2,38) = 17.87; p < 0.001; η G 2   = 0.013, were also significant. To explain the significant interaction for perturbation*left–right, we conducted further analyses, and the results revealed that the amplitudes of the slow-wave potentials were larger for the goal-perturbed conditions (FP and IP) than the NP condition in the left, middle, and right ROIs (all ts > 4.95; all ps < 0.001) (see Supplementary Table S3 for more details). However, the amplitude difference between the IP and the FP conditions was only significant in the middle ROIs. In the middle ROIs, the mean amplitude of the slow-wave potentials was larger in the IP condition (7.85 μV, SD = 10.20) than the FP condition (5.27 μV, SD = 8.38), t(19) = 2.52; p < 0.05. The difference waves between FP and IP conditions, as well as the topographic maps of the difference waves, are shown in Figure 5.
For the slow-wave potentials in the time windows from 700 to 800 ms, from 800 to 900 ms, and from 900 to 1000 ms, all the ANOVAs revealed significant main effects for perturbation, all Fs > 6.55; all ps < 0.01. Nevertheless, the interaction effects for perturbation*front–back, perturbation*left–right, and perturbation*front–back*left–right were all not significant in these time windows (see Supplementary Table S4 for more details). Post hoc analyses revealed that the mean amplitudes of the slow-wave potentials were more positive for the goal-perturbed conditions (FP, IP) than the non-perturbed condition in all the time windows, all ts > 2.89; all ps < 0.05, whereas the mean amplitudes were not different significantly between the FP and IP conditions, all ts < −1.43; all ps > 0.48 (see Supplementary Table S5 for more details).

3.3.2. Epoch Time-Locked to Grasping

For the epoch time-locked to grasping, we compared the slow-wave potentials from −500 to 0 ms in 100 ms step windows. For the time window from −500 to −400 ms, the ANOVA yielded a significant main effect for perturbation, F(2,38) = 3.79; p < 0.05; η G 2   = 0.014, a significant main effect for front–back, F(2,38) = 3.79; p < 0.05; η G 2   = 0.014, a significant main effect for left–right, F(2,38) = 29.89; p < 0.001; η G 2   = 0.031, and a significant interaction effect for front–back* left–right, F(4,76) = 4.23; p < 0.05; η G 2   = 0.005. Post hoc analyses found that the slow-wave potentials were more positive in the FP (4.86 μV) than the NP (2.70 μV) condition, t(19) = 2.73; p < 0.05. However, the amplitude difference was not significant neither between the FP and IP conditions, t(19) = 1.05; p > 0.05, nor between the IP and NP conditions, t(19) = 1.68; p > 0.05.
For the slow-wave potentials in the time windows from −400 to −300 ms, from −300 to −200 ms, from −200 to −100 ms, and from −100 to 0 ms, the ANOVAs found no significant main effects for, all Fs < 2.09; all ps > 0.14, no significant interactions for perturbation*front–back, all Fs < 1.24; all ps > 0.30, no significant interactions for perturbation*left–right, all Fs < 1.35; all ps > 0.27, and no significant interactions for perturbation*front–back*left–right, all Fs < 1.00; all ps > 0.37 (see Supplementary Table S6 for more details). The ERPs time-locked to grasping are shown in Figure 6.

3.4. Source Analysis

For the averaged time window between 390 and 440 ms time-locked to S2 (corresponding to the P3 component), a significantly higher cortical activation for the IP in contrast to the FP conditions was found in the following cortical areas: the left middle frontal gyrus (MFG; BA9; x = −30, y = 40, z = 35, and x = −30, y = 40, z = 30), and the left superior frontal gyrus (SFG; BA9; x = −35, y = 45, z = 30). The maximum difference was located at the left MFG, log-F = 0.663, p < 0.05 (log-F threshold = 0.650; see Figure 7).
For the averaged time window between 600 and 700 ms time-locked to S2 (corresponding to the late positivity from 600 to 700 ms), we found the cortical activation difference between the goal-perturbed conditions were mainly located at the cingulate gyrus (BA24; x = −10, y = 0, z = 45), and the medial frontal gyrus (MFG; BA6; x = −5, y = −25, z = 70). However, the activation difference in neither of the areas reached the significance level: all log-Fs < 0.470, all ps > 0.05 (log-F threshold = 0.488).

4. Discussion

In this experiment, we examined how unexpected perturbations in initial or in final action goals interfere with the execution of grasp-to-rotate movements and the neural mechanisms underlying the adjustments in response to the goal perturbations. The results revealed that compared to a perturbed final goal, a perturbed initial goal significantly slowed down the movement execution. Moreover, a larger frontal P3 and larger central-distributed late positivity (600–700 ms) time-locked to the perturbations were found for the initial than for the final goals. Further source analyses suggested increased cortical activations in the left middle frontal gyrus (MFG, BA9) and left superior frontal gyrus (SFG, BA9) were found for the perturbed initial goals than the perturbed final goals in the P3 time window. Taking together, these findings suggest the influence of perturbed initial and final action goals in the execution of grasp-to-rotate movements differs, and the unexpected perturbations in initial goals seem to have stronger interference with motor execution than final action goals.
Participants rated the subjective difficulty in the FP condition with 3.20 and in the IP condition with 3.35, on a scale from 1 (easy) to 6 (difficult). Even though the participants rated the IP condition slightly harder than the FP condition, the difference was not significant. Participants perceived similar subjective difficulties for the goal perturbations. It seems to be in line with our accuracy results that participants executed the task correctly in 85% of trials in the FP condition and 84% of trials in the IP condition. These indicate that task difficulty did not differ between the perturbation conditions and, hence, task difficulty is unlikely to be related to any effects found between the FP and IP conditions.
As expected, reaction times (from fist stimulus onset to movement onset) were not different among the conditions (FP/IP/NP). Reaction times usually reflect the motor planning processes before movement onset [55,56]. In our experiment, reaction times reflect the movement preparations for the first stimuli. Since the first stimuli were not perturbed, therefore, reaction times should be similar among the conditions.
Consistent with the previous findings [35], as well as our hypothesis, reach times (from movement onset to holding the handle) in the goal-perturbed conditions (FP and IP) were significantly slower than the non-perturbed condition (NP). The prolonged reach time reflected the movement corrections compensating for the perturbations in action goals. More importantly, we found reach times were significantly slower in the IP than in the FP condition. It seems to indicate that the perturbations in the initial action goals have stronger interference with the correction of manual actions as compared to the perturbations in the final action goals, and the stronger interference slows down the reaching movements.
For the rotation time (from holding the handle to reaching the target marker), the difference between the FP and the NP conditions was not significant, nor was the difference between the IP and the NP conditions. These findings are consistent with previous studies [35,36], which revealed that object manipulation times are not influenced by the perturbation in the anticipated action goal.
Interestingly, the rotation times were significantly different between the goal-perturbed conditions. Participants moved the handle much slower in the IP than in the FP condition. A possible explanation can be that the perturbations in the initial goals may increase the participant’s awareness of potential grip errors, even if the grip has already been performed. In the IP condition, the initial goals were changed, and the perturbation made participants drive more attention toward their grip postures. So participants might always have “double-checked” their movements (grip postures) to avoid a potential error, even after the handle had been gripped.
With a bar transport task, Westerholz et al. [39] found that the transport times (durations between grasping and bar-on-target) were slower when the initial goals were emphasized (compared to when the final goals were emphasized), even though the same movements were performed in both goal-emphasized conditions. The “initial-emphasized” seems to be similar to the current IP condition in which participants may focus on the perturbed initial goals, and the “final-emphasized” seems to be similar to the current FP condition in which participants may focus on the perturbed final goals. Moreover, in another study with a similar grasp-to-rotate task (Yu et al., under review), we also found that the rotation times were slower when the initial goals were perturbed unexpectedly (during movement preparation), as compared to when the final goals were perturbed unexpectedly. Therefore, the prolonged rotation times might be attributed to participants’ increased awareness of potential grip errors.
As for the ERPs, we did not find the expected N2 effect between the goal-perturbed and the non-perturbed conditions. From the grand-averaged ERPs shown in Figure 4, we can hardly tell an obvious N2 component around 200 ms over the anterior area (except for a slight negative-going oscillation). The reduction of anterior N2 can be attributed to the overlapping of N2 and P3 components. Because the probabilities of the different S2s were unequal, large anterior P3s were evoked in the goal-perturbed trials. The large P3s may overlap and reduce the observed N2 amplitude. Moreover, Kraemer et al. [57] also reported that changing a response may not elicit an anterior N2 component as compared to stopping a prepared response.
Consistent with our hypothesis, we found that the mean amplitude of the P3 component (time-locked to S2) was significantly larger for the goal-perturbed conditions (FP and IP) than the non-perturbed condition (NP). This is consistent with previous findings that movement corrections elicited stronger P3s than the movement execution without correction [20,21,58]. The increased P3 activities in the goal-perturbed conditions reflect the inhibitory processes to stop inappropriate actions compensating for the perturbations in the action goals. Additionally, the enlarged frontal P3s in the goal-perturbed conditions can also be attributed to the stimulus novelty. Compared to the NP condition, the perturbed stimuli in the goal-perturbed conditions are infrequent. The infrequent stimuli may also elicit larger frontal P3 compared to the frequent stimuli [59,60].
More importantly, the mean amplitude of P3 was larger in the IP than in the FP condition over the anterior ROIs. From the topographic map shown in Figure 5, it can be seen that the amplitude difference maximizes over the left and the middle frontal areas. It is also further confirmed by the source analyses results that activations of the left middle frontal gyrus (MFG, BA9) and left superior frontal gyrus (SFG, BA9) were significantly higher in the IP than in the FP condition. It has been reported that in the go/no-go task [61,62,63,64,65,66,67], the stop-signal task [68,69,70,71,72,73,74], and the movement re-planning tasks [20,21,58], larger P3s were evoked over the frontal and central areas when the responses had been inhibited or corrected in comparison to those that were normally executed. Previous studies also suggest that MFG seems to be one of the neural generators for the frontal P3 component evoked by response inhibitions [75,76]. Previous neuroimaging studies have claimed that the left MFG is involved in inhibitory processing, and stronger MFG activations were found when a prepared response was stopped [77,78,79,80,81,82]. Moreover, the left dorsolateral prefrontal cortex (DLPFC), which lies in the left MFG, has been associated with inhibiting the stereotyped responses [83] or processing incongruous object–action combinations [84]. Therefore, the enlarged P3 amplitude and the stronger activations of the left MFG in the IP condition compared to the FP condition may indicate that perturbations in initial goals induce a stronger inhibition process during the movement correction in which participants are trying to stop the inappropriate actions to prevent potential errors.
It is interesting that we only found different cortical activations in the left hemisphere between the FP and IP conditions, even though both left- and right-hand movements were performed and averaged in our study. It seems to be consistent with the idea that the left hemisphere is specialized for motor planning [85,86,87,88,89]. A recent fMRI study [90] also suggested that the left hemisphere (left-SMA) plays a critical role in interhemispheric inhibition and motor planning. However, several studies [10,15,17] have reported that several right-hemisphere regions, such as the right-SMA, are associated with motor inhibitions and movement selections during motor re-programming (re-planning). It is still hard to conclude whether brain lateralization exists in motor re-planning or not. For future research, it might be of interest to focus on brain lateralization in motor re-planning.
For the late slow-wave potentials (600–1000 ms) time-locked to S2, we found that the mean amplitudes were significantly larger in the goal-perturbed conditions (FP, IP) than the non-perturbed condition (NP), which is also consistent with our hypothesis. The enlarged slow-wave potentials may reflect the increased cognitive efforts involved in the action implementations or action reorganizations during the movement corrections. Between the different goal-perturbed conditions, the mean amplitudes were significantly larger for the IP than for the FP condition only in the time window from 600 to 700 ms (time-locked to S2), and the difference was only found in the middle ROIs. From the topographic map in Figure 5, we can see the difference waves maximize over the frontocentral areas. Further source analyses also yielded higher but not significant activations around the cingulate gyrus for the IP than for the FP condition. Moreover, from the averaged ERP waveforms in Figure 4, an obvious positive component can be found in the IP condition, which peaks around 600 ms after the S2 onset. This late positivity is reminiscent of the P600 effect obtained in language studies, which reflects the processing of structured representations at the syntactic level [91,92,93,94,95,96,97]. The P600 is elicited when there is a syntactic violation in a sentence, and it is characterized for the reanalysis or repair of the sentence structure. Some studies have also reported that the P600 was evoked by the violation of action [98,99] or music structures [100,101]. Therefore, the enlarged P600-like late positivity (slow-wave potential) elicited by the perturbed initial goals may reflect the increased demands on action restructuring or reorganization in the correction of ongoing manual actions. Compared to perturbed final goals, movement corrections to adapt to perturbed initial goals seem to require more effort in the implementation of new actions.
For the slow-wave potentials before grasping (from −500 to 0 ms time-locked to grasping), we only found a significant amplitude difference between the FP and the NP conditions in the time window from −500 to −400 ms, and the slow-wave potentials were more positive in the FP than the NP condition. However, the difference between the FP and the IP was not significant, neither was the difference between the IP and the NP. Considering the temporal overlapping of the epochs (time-locked to S2 and time-locked to grasping), the enlarged slow-wave potentials for the FP condition in the time window (−500–400 ms) might be attributed to the movement correction processes (the late positivity potentials in the epoch time-locked to S2). It is worth noting that the difference in slow waves might also be attributed to eye movements. Even though we instructed participants to fix their gazes during movement and corrected the ocular artifacts by Gratton regression [46,47], the (potential) residual effects might still remain (especially) in a large analysis epoch, which could influence (partially) the slow-wave amplitude. Therefore, the slow-wave effect between FP and NP conditions might also be caused by the residual effects of eye movement. It is still an open question, which deserves further research.
In the time windows from −400 to 0 ms time-locked to grasping, no significant difference was found for the slow-wave potentials among the different conditions (FP/IP/NP). It seems to suggest that participants adjust their movements as soon as they perceive the perturbations, and the movement corrections may have been finished at least 400 ms before grasping. It is in line with the movement kinematics data in the previous study [35] that movement correction to adapt to a perturbed (final) action goal occurred in the first half of the reach time. More importantly, the similar slow-wave potentials before grasping between the FP and the IP also indicate that the (neuro-) cognitive processes before grasping are very similar for both goal-perturbed conditions, which may exclude the possibility that participants corrected their movements only after they gripped the handle in the FP condition.
Limitations of the present study should be taken into consideration. Even though none of the participants reported (in the post questionnaire) a strategy that they planned all of the four possible grasp-to-rotate movements before they release the start button, it still could be a limitation for our experimental design (the corrections of the upcoming movements are predictable) and it may affect our results (such as the reaction times). For future research, it would be interesting if unpredictable changes can be involved. To control the length of the experiment, we did not include a third “perturbed” condition in which both initial and final action goals are perturbed. Future research may consider implementing this in order to provide a more comprehensive picture of goal perturbations in manual actions.

5. Conclusions

Taking the behavioral and neurophysiological results together, we found that the re-planning times, as well as the cortical activities, differed between the corrections of manual actions with perturbed initial goals and perturbed final goals. The perturbed initial goals have a stronger interference with the execution of the grasp-to-rotate movement than the perturbed final goals, and the interference seems to arise from both motor inhibition (stopping inappropriate actions) and motor implementation (generating new actions). To our knowledge, this is one of the first studies to distinguish the online corrections of manual actions with perturbed initial and final action goals, as well as the first study to differentiate cerebral activity underlying overt goal-related manual actions executed with an unexpectedly perturbed initial and final action goal. Our findings emphasized the importance of the initial action goals (grip postures) in the execution and online correction of manual actions; the unexpected changes in the required grip postures seem to demand more efforts in both action inhibitions and implementations (compared to changes in task purposes).

Supplementary Materials

The following are available online at https://0-www-mdpi-com.brum.beds.ac.uk/article/10.3390/brainsci11050641/s1, Table S1: The average number (standard deviation) of trials for analysis in different experimental conditions; Table S2: Simple effect of perturbation for P3 amplitude in different front-back and left-right areas; Table S3: Simple effect of perturbation for the mean amplitude of the slow waves during 600–700 ms in different left–right areas; Table S4: Summary of the statistical results for the slow waves from 700 to 1000 ms (time-locked to S2); Table S5: Summary of the post hoc results for the factor perturbation from 700 to 1000 ms (time-locked to S2); Table S6: Summary of the statistical results for the ERP slow waves from −400 to 0 ms (time-locked to grasping)

Author Contributions

Conceptualization, L.Y., T.S., and D.K.; methodology, L.Y. and D.K.; software, L.Y.; formal analysis, L.Y.; investigation, L.Y.; data curation, L.Y.; writing—original draft preparation, L.Y.; writing—review and editing, L.Y., T.S. and D.K.; visualization, L.Y.; supervision, T.S. and D.K.; funding acquisition, T.S. All authors have read and agreed to the published version of the manuscript.

Funding

This research was supported in part by the Deutsche Forschungsgemeinschaft (DFG, German Research Foundation) under Germany’s Excellence Strategy-EXC277. The funders had no role in study design, data collection, and analysis, decision to publish, or preparation of the manuscript.

Institutional Review Board Statement

The study was conducted according to the guidelines of the Declaration of Helsinki, and the study was approved by the ethics committee at Bielefeld University (EUB, No.2021-085).

Informed Consent Statement

The written informed consent form was obtained from all participants involved in this study.

Data Availability Statement

Relevant data are within the manuscript and its Supplementary Materials. Additional relevant data (i.e., EEG raw data) are available at https://0-doi-org.brum.beds.ac.uk/10.4119/unibi/2952950.

Acknowledgments

The authors also acknowledge support for the publication costs by the Open Access Publication Fund of Bielefeld University. Lin Yu gratefully acknowledges the financial support from the China Scholarship Council (CSC).

Conflicts of Interest

The authors have declared that no potential or actual conflicts of interest exist.

References

  1. Tunik, E.; Frey, S.H.; Grafton, S.T. Virtual lesions of the anterior intraparietal area disrupt goal-dependent on-line adjustments of grasp. Nat. Neurosci. 2005, 8, 505–511. [Google Scholar] [CrossRef] [PubMed]
  2. Quinn, J.T.; Sherwood, D.E. Time requirements of changes in program and parameter variables in rapid ongoing movements. J. Mot. Behav. 1983, 15, 163–178. [Google Scholar] [CrossRef]
  3. Spiegel, M.A.; Koester, D.; Schack, T. The functional role of working memory in the (re-)planning and execution of grasping movements. J. Exp. Psychol. Hum. Percept. Perform. 2013, 39, 1326–1339. [Google Scholar] [CrossRef] [PubMed] [Green Version]
  4. Venkataramani, P.V.; Gopal, A.; Murthy, A. An independent race model involving an abort and re-plan strategy explains reach redirecting movements during planning and execution. Eur. J. Neurosci. 2018, 47, 460–478. [Google Scholar] [CrossRef] [PubMed]
  5. Teixeira, L.A.; Dos Santos Lima, E.; Marília Franzoni, M. The continuous nature of timing reprogramming in an interceptive task. J. Sports Sci. 2005, 23, 943–950. [Google Scholar] [CrossRef] [PubMed]
  6. Teixeira, L.A.; Chua, R.; Nagelkerke, P.; Franks, I.M. Reprogramming of interceptive actions: Time course of temporal corrections for unexpected target velocity change. J. Mot. Behav. 2006, 38, 467–477. [Google Scholar] [CrossRef]
  7. Ikudome, S.; Nakamoto, H.; Yotani, K.; Unenaka, S.; Mori, S. Potential of rapid adjustment of brief interceptive action using predicted information. Brain Cogn. 2015, 97, 51–58. [Google Scholar] [CrossRef]
  8. Tunik, E.; Ortigue, S.; Adamovich, S.V.; Grafton, S.T. Differential recruitment of anterior intraparietal sulcus and superior parietal lobule during visually guided grasping revealed by electrical neuroimaging. J. Neurosci. 2008, 28, 13615–13620. [Google Scholar] [CrossRef]
  9. Iannaccone, R.; Hauser, T.U.; Staempfli, P.; Walitza, S.; Brandeis, D.; Brem, S. Conflict monitoring and error processing: New insights from simultaneous EEG–fMRI. NeuroImage 2015, 105, 395–407. [Google Scholar] [CrossRef]
  10. Neubert, F.X.; Mars, R.B.; Buch, E.R.; Olivier, E.; Rushworth, M.F.S. Cortical and subcortical interactions during action reprogramming and their related white matter pathways. Proc. Natl. Acad. Sci. USA 2010, 107, 13240–13245. [Google Scholar] [CrossRef] [Green Version]
  11. Hartwigsen, G.; Bestmann, S.; Ward, N.S.; Woerbel, S.; Mastroeni, C.; Granert, O.; Siebner, H.R. Left dorsal premotor cortex and supramarginal gyrus complement each other during rapid action reprogramming. J. Neurosci. 2012, 32, 16162–16171. [Google Scholar] [CrossRef] [Green Version]
  12. Ullsperger, M.; Danielmeier, C.; Jocham, G. Neurophysiology of Performance Monitoring and Adaptive Behavior. Physiol. Rev. 2014, 94, 35–79. [Google Scholar] [CrossRef] [PubMed]
  13. Tunik, E.; Rice, N.J.; Hamilton, A.; Grafton, S.T. Beyond grasping: Representation of action in human anterior intraparietal sulcus. NeuroImage 2007, 36, T77–T86. [Google Scholar] [CrossRef] [PubMed] [Green Version]
  14. Buch, E.R.; Mars, R.B.; Boorman, E.D.; Rushworth, M.F.S. A network centered on ventral premotor cortex exerts both facilitatory and inhibitory control over primary motor cortex during action reprogramming. J. Neurosci. 2010, 30, 1395–1401. [Google Scholar] [CrossRef] [PubMed]
  15. Nakamoto, H.; Ikudome, S.; Yotani, K.; Maruyama, A.; Mori, S. Fast-ball sports experts depend on an inhibitory strategy to reprogram their movement timing. Exp. Brain Res. 2013, 228, 193–203. [Google Scholar] [CrossRef]
  16. Hartwigsen, G.; Siebner, H.R. Joint contribution of left dorsal premotor cortex and supramarginal gyrus to rapid action reprogramming. Brain Stimul. 2015, 8, 945–952. [Google Scholar] [CrossRef] [PubMed] [Green Version]
  17. Mars, R.B.; Piekema, C.; Coles, M.G.H.; Hulstijn, W.; Toni, I. On the programming and reprogramming of actions. Cereb. Cortex 2007, 17, 2972–2979. [Google Scholar] [CrossRef] [PubMed] [Green Version]
  18. Wang, C.; Ulbert, I.; Schomer, D.L.; Marinkovic, K.; Halgren, E. Responses of human anterior cingulate cortex microdomains to error detection, conflict monitoring, stimulus-response mapping, familiarity, and orienting. J. Neurosci. 2005, 25, 604–613. [Google Scholar] [CrossRef] [PubMed]
  19. Kropotov, J.D.; Ponomarev, V.A.; Hollup, S.; Mueller, A. Dissociating action inhibition, conflict monitoring and sensory mismatch into independent components of event related potentials in GO/NOGO task. NeuroImage 2011, 57, 565–575. [Google Scholar] [CrossRef]
  20. Leuthold, H.; Jentzsch, I. Spatiotemporal source localisation reveals involvement of medial premotor areas in movement reprogramming. Exp. Brain Res. 2002, 144, 178–188. [Google Scholar] [CrossRef] [PubMed]
  21. Vidal, F.; Bonnet, M.; Macar, F. Programming the duration of a motor sequence: Role of the primary and supplementary motor areas in man. Exp. Brain Res. 1995, 106, 339–350. [Google Scholar] [CrossRef]
  22. Lee, H.W.; Lu, M.S.; Chen, C.Y.; Muggleton, N.G.; Hsu, T.Y.; Juan, C.H. Roles of the pre-SMA and rIFG in conditional stopping revealed by transcranial magnetic stimulation. Behav. Brain Res. 2016, 296, 459–467. [Google Scholar] [CrossRef] [PubMed]
  23. Tunik, E.; Lo, O.-Y.; Adamovich, S.V. Transcranial magnetic stimulation to the frontal operculum and supramarginal gyrus disrupts planning of outcome-based hand-object interactions. J. Neurosci. 2008, 28, 14422–14427. [Google Scholar] [CrossRef] [PubMed]
  24. Ward, N.S.; Bestmann, S.; Hartwigsen, G.; Weiss, M.M.; Christensen, L.O.D.; Frackowiak, R.S.J.; Rothwell, J.C.; Siebner, H.R. Low-Frequency Transcranial Magnetic Stimulation over Left dorsal premotor cortex improves the dynamic control of visuospatially cued actions. J. Neurosci. 2010, 30, 9216–9223. [Google Scholar] [CrossRef] [PubMed] [Green Version]
  25. Culham, J.C.; Cavina-Pratesi, C.; Singhal, A. The role of parietal cortex in visuomotor control: What have we learned from neuroimaging? Neuropsychologia 2006, 44, 2668–2684. [Google Scholar] [CrossRef] [PubMed]
  26. Rice, N.J.; Tunik, E.; Grafton, S.T. The anterior intraparietal sulcus mediates grasp execution, independent of requirement to update: New insights from transcranial magnetic stimulation. J. Neurosci. 2006, 26, 8176–8182. [Google Scholar] [CrossRef] [Green Version]
  27. Striemer, C.L.; Chouinard, P.A.; Goodale, M.A. Programs for action in superior parietal cortex: A triple-pulse TMS investigation. Neuropsychologia 2011, 49, 2391–2399. [Google Scholar] [CrossRef] [PubMed]
  28. Verbruggen, F.; Aron, A.R.; Stevens, M.A.; Chambers, C.D. Theta burst stimulation dissociates attention and action updating in human inferior frontal cortex. Proc. Natl. Acad. Sci. USA 2010, 107, 13966–13971. [Google Scholar] [CrossRef] [Green Version]
  29. Pellegrino, G.; Tomasevic, L.; Herz, D.M.; Larsen, K.M.; Siebner, H.R. Theta Activity in the Left Dorsal Premotor Cortex During Action Re-Evaluation and Motor Reprogramming. Front. Hum. Neurosci. 2018, 12, 1–10. [Google Scholar] [CrossRef] [Green Version]
  30. Castiello, U.; Bennett, K.M.B.; Paulignan, Y. Does the type of prehension influence the kinematics of reaching. Behav. Brain Res. 1992, 50, 7–15. [Google Scholar] [CrossRef]
  31. Paulignan, Y.; MacKenzie, C.; Marteniuk, R.; Jeannerod, M. Selective perturbation of visual input during prehension movements—1. The effects of changing object position. Exp. Brain Res. 1991, 83, 502–512. [Google Scholar] [CrossRef]
  32. Paulignan, Y.; Jeannerod, M.; MacKenzie, C.; Marteniuk, R. Selective perturbation of visual input during prehension movements—2. The effects of changing object size. Exp. Brain Res. 1991, 87, 407–420. [Google Scholar] [CrossRef] [PubMed]
  33. Castiello, U.; Bennett, K.; Stelmach, G.E. Reach to grasp: The natural response to perturbation of object size. Exp. Brain Res. 1993, 94, 163–178. [Google Scholar] [CrossRef]
  34. Castiello, U.; Bennett, K.M.B.; Chambers, H. Reach to grasp: The response to a simultaneous perturbation of object position and size. Exp. Brain Res. 1998, 120, 31–40. [Google Scholar] [CrossRef] [PubMed]
  35. Hughes, C.M.L.; Seegelke, C.; Spiegel, M.A.; Oehmichen, C.; Hammes, J.; Schack, T. Corrections in grasp posture in response to modifications of action goals. PLoS ONE 2012, 7, e43015. [Google Scholar] [CrossRef] [Green Version]
  36. Hughes, C.M.L.; Seegelke, C. Perturbations in Action Goal Influence Bimanual Grasp Posture Planning. J. Mot. Behav. 2013, 45, 473–478. [Google Scholar] [CrossRef]
  37. Rosenbaum, D.A.; Cohen, R.G.; Jax, S.A.; Weiss, D.J.; van der Wel, R. The problem of serial order in behavior: Lashley’s legacy. Hum. Mov. Sci. 2007, 26, 525–554. [Google Scholar] [CrossRef] [PubMed]
  38. Rosenbaum, D.A.; Vaughan, J.; Barnes, H.J.; Jorgensen, M.J. Time course of movement planning: Selection of handgrips for object manipulation. J. Exp. Psychol. Learn. Mem. Cogn. 1992, 18, 1058–1073. [Google Scholar] [CrossRef]
  39. Westerholz, J.; Schack, T.; Koester, D. Event-related brain potentials for goal-related power grips. PLoS ONE 2013, 8, e68501. [Google Scholar] [CrossRef] [Green Version]
  40. Yu, L.; Schack, T.; Koester, D. Coordinating initial and final action goals in planning grasp-to-rotate movements: An ERP study. Neuroscience 2021, 459, 70–84. [Google Scholar] [CrossRef]
  41. Cohen, R.G.; Rosenbaum, D.A. Where grasps are made reveals how grasps are planned: Generation and recall of motor plans. Exp. Brain Res. 2004, 157, 486–495. [Google Scholar] [CrossRef]
  42. Golob, E.J.; Pratt, H.; Starr, A. Preparatory slow potentials and event-related potentials in an auditory cued attention task. Clin. Neurophysiol. 2002, 113, 1544–1557. [Google Scholar] [CrossRef] [Green Version]
  43. Oldfield, R.C. The assessment and analysis of handedness: The Edinburgh inventory. Neuropsychologia 1971, 9, 97–113. [Google Scholar] [CrossRef]
  44. Delorme, A.; Makeig, S. EEGLAB: An open source toolbox for analysis of single-trial EEG dynamics including independent component analysis. J. Neurosci. Methods 2004, 134, 9–21. [Google Scholar] [CrossRef] [PubMed] [Green Version]
  45. Lopez-Calderon, J.; Luck, S.J. ERPLAB: An open-source toolbox for the analysis of event-related potentials. Front. Hum. Neurosci. 2014, 8, 213. [Google Scholar] [CrossRef] [PubMed] [Green Version]
  46. Gratton, G.; Coles, M.G.H.; Donchin, E. A new method for off-line removal of ocular artifact. Electroencephalogr. Clin. Neurophysiol. 1983, 55, 468–484. [Google Scholar] [CrossRef]
  47. Miller, G.A.; Gration, G.; Yee, C.M. Generalized implementation of an eye movement correction procedure. Psychophysiology 1988, 25, 241–243. [Google Scholar] [CrossRef]
  48. Van Schie, H.T.; Bekkering, H. Neural mechanisms underlying immediate and final action goals in object use reflected by slow wave brain potentials. Brain Res. 2007, 1148, 183–197. [Google Scholar] [CrossRef]
  49. Westerholz, J.; Schack, T.; Schutz, C.; Koester, D. Habitual vs non-habitual manual actions: An ERP study on overt movement execution. PLoS ONE 2014, 9, e93116. [Google Scholar] [CrossRef]
  50. R Core Team. R: A Language and Environment for Statistical Computing; R Foundation for Statistical Computing: Vienna, Austria, 2014. [Google Scholar]
  51. Pascual-Marqui, R.D. Standardized low-resolution brain electromagnetic tomography (sLORETA): Technical details. Methods Find. Exp. Clin. Pharmacol. 2002, 24, 5–12. [Google Scholar]
  52. Fuchs, M.; Kastner, J.; Wagner, M.; Hawes, S.; Ebersole, J.S. A standardized boundary element method volume conductor model. Clin. Neurophysiol. 2002, 113, 702–712. [Google Scholar] [CrossRef] [Green Version]
  53. Mazziotta, J.C.; Toga, A.; Evans, A.; Fox, P.; Lancaster, J.; Zilles, K.; Woods, R.; Paus, T.; Simpson, G.; Pike, B.; et al. A probabilistic atlas and reference system for the human brain: International Consortium for Brain Mapping (ICBM). Philos. Trans. R. Soc. B Biol. Sci. 2001, 356, 1293–1322. [Google Scholar] [CrossRef] [PubMed]
  54. Nichols, T.; Holmes, A. Nonparametric permutation tests for functional neuroimaging. Hum. Brain Mapp. 2002, 15, 1–25. [Google Scholar] [CrossRef] [PubMed] [Green Version]
  55. Botwinick, J.; Thompson, L.W. Premotor and motor components of reaction time. J. Exp. Psychol. 1966, 71, 9–15. [Google Scholar] [CrossRef] [PubMed] [Green Version]
  56. Elliott, D.; Hansen, S.; Grierson, L.E.M.; Lyons, J.; Bennett, S.J.; Hayes, S.J. Goal-directed aiming: Two components but multiple processes. Psychol. Bull. 2010, 136, 1023–1044. [Google Scholar] [CrossRef] [PubMed]
  57. Kraemer, U.M.; Knight, R.T.; Muente, T.F. Electrophysiological evidence for different inhibitory mechanisms when stopping or changing a planned response. J. Cogn. Neurosci. 2011, 23, 2481–2493. [Google Scholar] [CrossRef] [PubMed]
  58. Recio, G.; Shmuilovich, O.; Sommer, W. Should I smile or should I frown? An ERP study on the voluntary control of emotion-related facial expressions. Psychophysiology 2014, 51, 789–799. [Google Scholar] [CrossRef]
  59. Polich, J. Updating P300: An integrative theory of P3a and P3b. Clin. Neurophysiol. 2007, 118, 2128–2148. [Google Scholar] [CrossRef] [PubMed] [Green Version]
  60. Comerchero, M.D.; Polich, J. P3a and P3b from typical auditory and visual stimuli. Clin. Neurophysiol. 1999, 110, 24–30. [Google Scholar] [CrossRef]
  61. Gajewski, P.D.; Falkenstein, M. Effects of task complexity on ERP components in Go/Nogo tasks. Int. J. Psychophysiol. 2013, 87, 273–278. [Google Scholar] [CrossRef]
  62. Benikos, N.; Johnstone, S.J.; Roodenrys, S.J. Varying task difficulty in the Go/Nogo task: The effects of inhibitory control, arousal, and perceived effort on ERP components. Int. J. Psychophysiol. 2013, 87, 262–272. [Google Scholar] [CrossRef] [Green Version]
  63. Falkenstein, M.; Hoormann, J.; Hohnsbein, J. ERP components in Go/Nogo tasks and their relation to inhibition. Acta Psychol. 1999, 101, 267–291. [Google Scholar] [CrossRef]
  64. Kok, A. Effects of degradation of visual stimuli on components of the event-related potential (ERP) in go/nogo reaction tasks. Biol. Psychol. 1986, 23, 21–38. [Google Scholar] [CrossRef]
  65. Eimer, M. Effects of attention and stimulus probability on ERPs in a Go/Nogo task. Biol. Psychol. 1993, 35, 123–138. [Google Scholar] [CrossRef]
  66. Falkenstein, M.; Koshlykova, N.A.; Kiroj, V.N.; Hoormann, J.; Hohnsbein, J. Late ERP components in visual and auditory Go/Nogo tasks. Electroencephalogr. Clin. Neurophysiol. Evoked Potentials 1995, 96, 36–43. [Google Scholar] [CrossRef]
  67. Albert, J.; López-Martín, S.; Hinojosa, J.A.; Carretié, L. Spatiotemporal characterization of response inhibition. NeuroImage 2013, 76, 272–281. [Google Scholar] [CrossRef]
  68. Boecker, M.; Gauggel, S.; Drueke, B. Stop or stop-change—Does it make any difference for the inhibition process? Int. J. Psychophysiol. 2013, 87, 234–243. [Google Scholar] [CrossRef]
  69. Smith, J.L.; Johnstone, S.J.; Barry, R.J. Movement-related potentials in the Go/NoGo task: The P3 reflects both cognitive and motor inhibition. Clin. Neurophysiol. 2008, 119, 704–714. [Google Scholar] [CrossRef]
  70. Oldenburg, J.F.E.; Roger, C.; Assecondi, S.; Verbruggen, F.; Fias, W. Repetition priming in the stop signal task: The electrophysiology of sequential effects of stopping. Neuropsychologia 2012, 50, 2860–2868. [Google Scholar] [CrossRef]
  71. Wessel, J.R.; Aron, A.R. It’s not too late: The onset of the frontocentral P3 indexes successful response inhibition in the stop-signal paradigm. Psychophysiology 2015, 52, 472–480. [Google Scholar] [CrossRef] [Green Version]
  72. Ramautar, J.R.; Kok, A.; Ridderinkhof, K.R. Effects of stop-signal modality on the N2/P3 complex elicited in the stop-signal paradigm. Biol. Psychol. 2006, 72, 96–109. [Google Scholar] [CrossRef]
  73. Dimoska, A.; Johnstone, S.J.; Barry, R.J. The auditory-evoked N2 and P3 components in the stop-signal task: Indices of inhibition, response-conflict or error-detection? Brain Cogn. 2006, 62, 98–112. [Google Scholar] [CrossRef]
  74. Ramautar, J.R.; Kok, A.; Ridderinkhof, K.R. Effects of stop-signal probability in the stop-signal paradigm: The N2/P3 complex further validated. Brain Cogn. 2004, 56, 234–252. [Google Scholar] [CrossRef]
  75. Hong, X.; Wang, Y.; Sun, J.; Li, C.; Tong, S. Segregating Top-Down Selective Attention from Response Inhibition in a Spatial Cueing Go NoGo Task: An ERP and Source Localization Study. Sci. Rep. 2017, 7, 1–14. [Google Scholar] [CrossRef] [PubMed] [Green Version]
  76. Huster, R.J.; Westerhausen, R.; Pantev, C.; Konrad, C. The role of the cingulate cortex as neural generator of the N200 and P300 in a tactile response inhibition task. Hum. Brain Mapp. 2009, 31, 1260–1271. [Google Scholar] [CrossRef]
  77. Rae, C.L.; Hughes, L.E.; Weaver, C.; Anderson, M.C.; Rowe, J.B. Selection and stopping in voluntary action: A meta-analysis and combined fMRI study. NeuroImage 2014, 86, 381–391. [Google Scholar] [CrossRef] [PubMed] [Green Version]
  78. Rubia, K.; Russell, T.; Overmeyer, S.; Brammer, M.J.; Bullmore, E.T.; Sharma, T.; Simmons, A.; Williams, S.C.R.; Giampietroa, V.; Andrew, C.M.; et al. Mapping motor inhibition: Conjunctive brain activations across different versions of Go/No-Go and stop tasks. NeuroImage 2001, 13, 250–261. [Google Scholar] [CrossRef] [PubMed] [Green Version]
  79. Blasi, G.; Goldberg, T.E.; Weickert, T.; Das, S.; Kohn, P.; Zoltick, B.; Bertolino, A.; Callicott, J.H.; Weinberger, D.R.; Mattay, V.S. Brain regions underlying response inhibition and interference monitoring and suppression. Eur. J. Neurosci. 2006, 23, 1658–1664. [Google Scholar] [CrossRef]
  80. Sebastian, A.; Pohl, M.F.; Klöppel, S.; Feige, B.; Lange, T.; Stahl, C.; Voss, A.; Klauer, K.C.; Lieb, K.; Tüscher, O. Disentangling common and specific neural subprocesses of response inhibition. NeuroImage 2013, 64, 601–615. [Google Scholar] [CrossRef] [PubMed]
  81. Brass, M.; Zysset, S.; von Cramon, D.Y. The inhibition of imitative response tendencies. NeuroImage 2001, 14, 1416–1423. [Google Scholar] [CrossRef] [PubMed]
  82. Brown, M.R.G.; Vilis, T.; Everling, S. Isolation of saccade inhibition processes: Rapid event-related fMRI of saccades and nogo trials. NeuroImage 2008, 39, 793–804. [Google Scholar] [CrossRef] [PubMed]
  83. Kadota, H.; Sekiguchi, H.; Takeuchi, S.; Miyazaki, M.; Kohno, Y.; Nakajima, Y. The role of the dorsolateral prefrontal cortex in the inhibition of stereotyped responses. Exp. Brain Res. 2010, 203, 593–600. [Google Scholar] [CrossRef]
  84. Balconi, M.; Vitaloni, S. The tDCS effect on alpha brain oscillation for correct vs. incorrect object use. The contribution of the left DLPFC. Neurosci. Lett. 2012, 517, 25–29. [Google Scholar] [CrossRef] [PubMed]
  85. Frey, S.H. Tool use, communicative gesture and cerebral asymmetries in the modern human brain. Philos. Trans. R. Soc. B Biol. Sci. 2008, 363, 1951–1957. [Google Scholar] [CrossRef] [PubMed]
  86. Haaland, K.Y.; Harrington, D.L.; Knight, R.T. Neural representations of skilled movement. Brain 2000, 123, 2306–2313. [Google Scholar] [CrossRef] [Green Version]
  87. Martin, K.; Jacobs, S.; Frey, S.H. Handedness-dependent and -independent cerebral asymmetries in the anterior intraparietal sulcus and ventral premotor cortex during grasp planning. NeuroImage 2011, 57, 502–512. [Google Scholar] [CrossRef] [Green Version]
  88. Janssen, L.; Beuting, M.; Meulenbroek, R.G.J.; Steenbergen, B. Combined effects of planning and execution constraints on bimanual task performance. Exp. Brain Res. 2009, 192, 61–73. [Google Scholar] [CrossRef] [Green Version]
  89. Janssen, L.; Meulenbroek, R.G.J.; Steenbergen, B. Behavioral evidence for left-hemisphere specialization of motor planning. Exp. Brain Res. 2011, 209, 65–72. [Google Scholar] [CrossRef] [Green Version]
  90. Mayer, A.R.; Hanlon, F.M.; Shaff, N.A.; Stephenson, D.D.; Ling, J.M.; Dodd, A.B.; Hogeveen, J.; Quinn, D.K.; Ryman, S.G.; Pirio-Richardson, S. Evidence for asymmetric inhibitory activity during motor planning phases of sensorimotor synchronization. Cortex 2020, 129, 314–328. [Google Scholar] [CrossRef] [PubMed]
  91. Kaan, E.; Harris, A.; Gibson, E.; Holcomb, P. The P600 as an index of syntactic integration difficulty. Lang. Cogn. Process. 2000, 15, 159–201. [Google Scholar] [CrossRef]
  92. Hagoort, P.; Brown, C.M. ERP effects of listening to speech compared to reading: The P600/SPS to syntactic violations in spoken sentences and rapid serial visual presentation. Neuropsychologia 2000, 38, 1531–1549. [Google Scholar] [CrossRef] [Green Version]
  93. Frisch, S.; Kotz, S.A.; Von Cramon, D.Y.; Friederici, A.D. Why the P600 is not just a P300: The role of the basal ganglia. Clin. Neurophysiol. 2003, 114, 336–340. [Google Scholar] [CrossRef] [Green Version]
  94. van Herten, M.; Kolk, H.H.J.; Chwilla, D.J. An ERP study of P600 effects elicited by semantic anomalies. Cogn. Brain Res. 2005, 22, 241–255. [Google Scholar] [CrossRef] [PubMed]
  95. Bach, P.; Gunter, T.C.; Knoblich, G.; Prinz, W.; Friederici, A.D. N400-like negativities in action perception reflect the activation of two components of an action representation. Soc. Neurosci. 2009, 4, 212–232. [Google Scholar] [CrossRef]
  96. Gouvea, A.C.; Phillips, C.; Kazanina, N.; Poeppel, D. The linguistic processes underlying the P600. Lang. Cogn. Process. 2010, 25, 149–188. [Google Scholar] [CrossRef]
  97. Osterhout, L.; Holcomb, P.J. Event-related brain potentials elicited by syntactic anomaly. J. Mem. Lang. 1992, 31, 785–806. [Google Scholar] [CrossRef]
  98. Maffongelli, L.; Bartoli, E.; Sammler, D.; Kölsch, S.; Campus, C.; Olivier, E.; Fadiga, L.; D’Ausilio, A. Distinct brain signatures of content and structure violation during action observation. Neuropsychologia 2015, 75, 30–39. [Google Scholar] [CrossRef] [PubMed]
  99. Kuperberg, G.R. Neural mechanisms of language comprehension: Challenges to syntax. Brain Res. 2007, 1146, 23–49. [Google Scholar] [CrossRef]
  100. Koelsch, S.; Gunter, T.C.; Wittfoth, M.; Sammler, D. Interaction between syntax processing in language and in music: An ERP study. J. Cogn. Neurosci. 2005, 17, 1565–1577. [Google Scholar] [CrossRef]
  101. Patel, A.D.; Gibson, E.; Ratner, J.; Besson, M.; Holcomb, P.J. Processing syntactic relations in language and music: An event-related potential study. J. Cogn. Neurosci. 1998, 10, 717–733. [Google Scholar] [CrossRef]
Figure 1. Front view of the experimental setup.
Brainsci 11 00641 g001
Figure 2. Time course of the task events. The time course of events during the experimental task with the example of a trial in which the handle starts at the northeast position. The trial started with a fixation cross with a variable time interval, followed by a buffer. After that, the first stimulus (S1) appeared, and it indicated the initial goal (blue) and final goal (the southeast direction) of the coming movement. A secondary stimulus (S2) was triggered as soon as participants started their movement. In the NP condition (left), the S2 was as same as the first. In the FP condition (middle), the final goal was perturbed (from the southeast to the northwest), but the initial goal stayed. In the IP condition (right), the initial goal was perturbed (from blue to yellow), but the final goal stayed. The S2 stayed on the screen until the handle reached the target position.
Brainsci 11 00641 g002
Figure 3. Timing of behavior. Box plots representing reaction times (left), reach times (middle), and rotation times (right) of the 20 participants. Light blue boxes show the data for the Final-Perturbed (FP) condition. Orange boxes show the data for the Initial-Perturbed (IP) condition. Grey boxes show the data for the Non-Perturbed (NP) condition. The black rhombuses represent the means. The “***” stands for p <0.001, and the “**” stands for p < 0.01.
Brainsci 11 00641 g003
Figure 4. Grand-averaged ERP waveforms time-locked to S2. Grand-averaged ERP waveforms (N = 20) recorded time-locked to S2 onset, for the Final-Perturbed condition (blue), Initial-Perturbed condition (orange), and Non-Perturbed condition (grey) are showed at one anterior-left electrode (F3), one anterior-middle electrode (Fz), one anterior-right electrode (F4), one central-left electrode (C3), one central-right electrode (C4), one posterior-left electrode (PO3), and one posterior-right electrode (PO4). The nine regions of interest (ROIs) for ERP analysis are marked with red color in the middle head plot.
Brainsci 11 00641 g004
Figure 5. The ERP difference waves time-locked to S2. ERP difference waves (“Initial-Perturbed” –“Final-Perturbed”) time-locked to the onset on S2 at the central-middle electrode (Cz). Topographical maps of the difference waves in the P3 (300–600 ms) and late positivity (600–700 ms) time intervals are also showed.
Brainsci 11 00641 g005
Figure 6. Grand-averaged ERP waveforms time-locked to grasping at electrode POz. Grand-averaged ERP waveforms (N = 20) recorded at electrode POz, time-locked to grasping, for the Final-Perturbed condition (blue), Initial-Perturbed condition (orange), and Non-Perturbed condition (grey). Average time points (dash lines) for the first stimulus presentation (S1), the secondary stimulus (S2) presentation/movement onset are marked (shaded areas beside the dash lines indicate the standard deviations).
Brainsci 11 00641 g006
Figure 7. Results of the sLORETA source analysis (contrast: “Initial-Perturbed” > “Final-Perturbed”) in the time window of the P3 component (300–600 ms). The images have been obtained after statistical non-parametric mapping (SnPM), and they represent the voxels in which the “Initial-Perturbed” > “Final-Perturbed” contrast was significant (p < 0.05; log-F threshold = 0.650) in the time window of the P3 component. The significantly activated voxels are indicated by yellowish colors.
Brainsci 11 00641 g007
Publisher’s Note: MDPI stays neutral with regard to jurisdictional claims in published maps and institutional affiliations.

