
Mapping of Motor Function with Neuronavigated Transcranial Magnetic Stimulation: A Review on Clinical Application in Brain Tumors and Methods for Ensuring Feasible Accuracy


Abstract
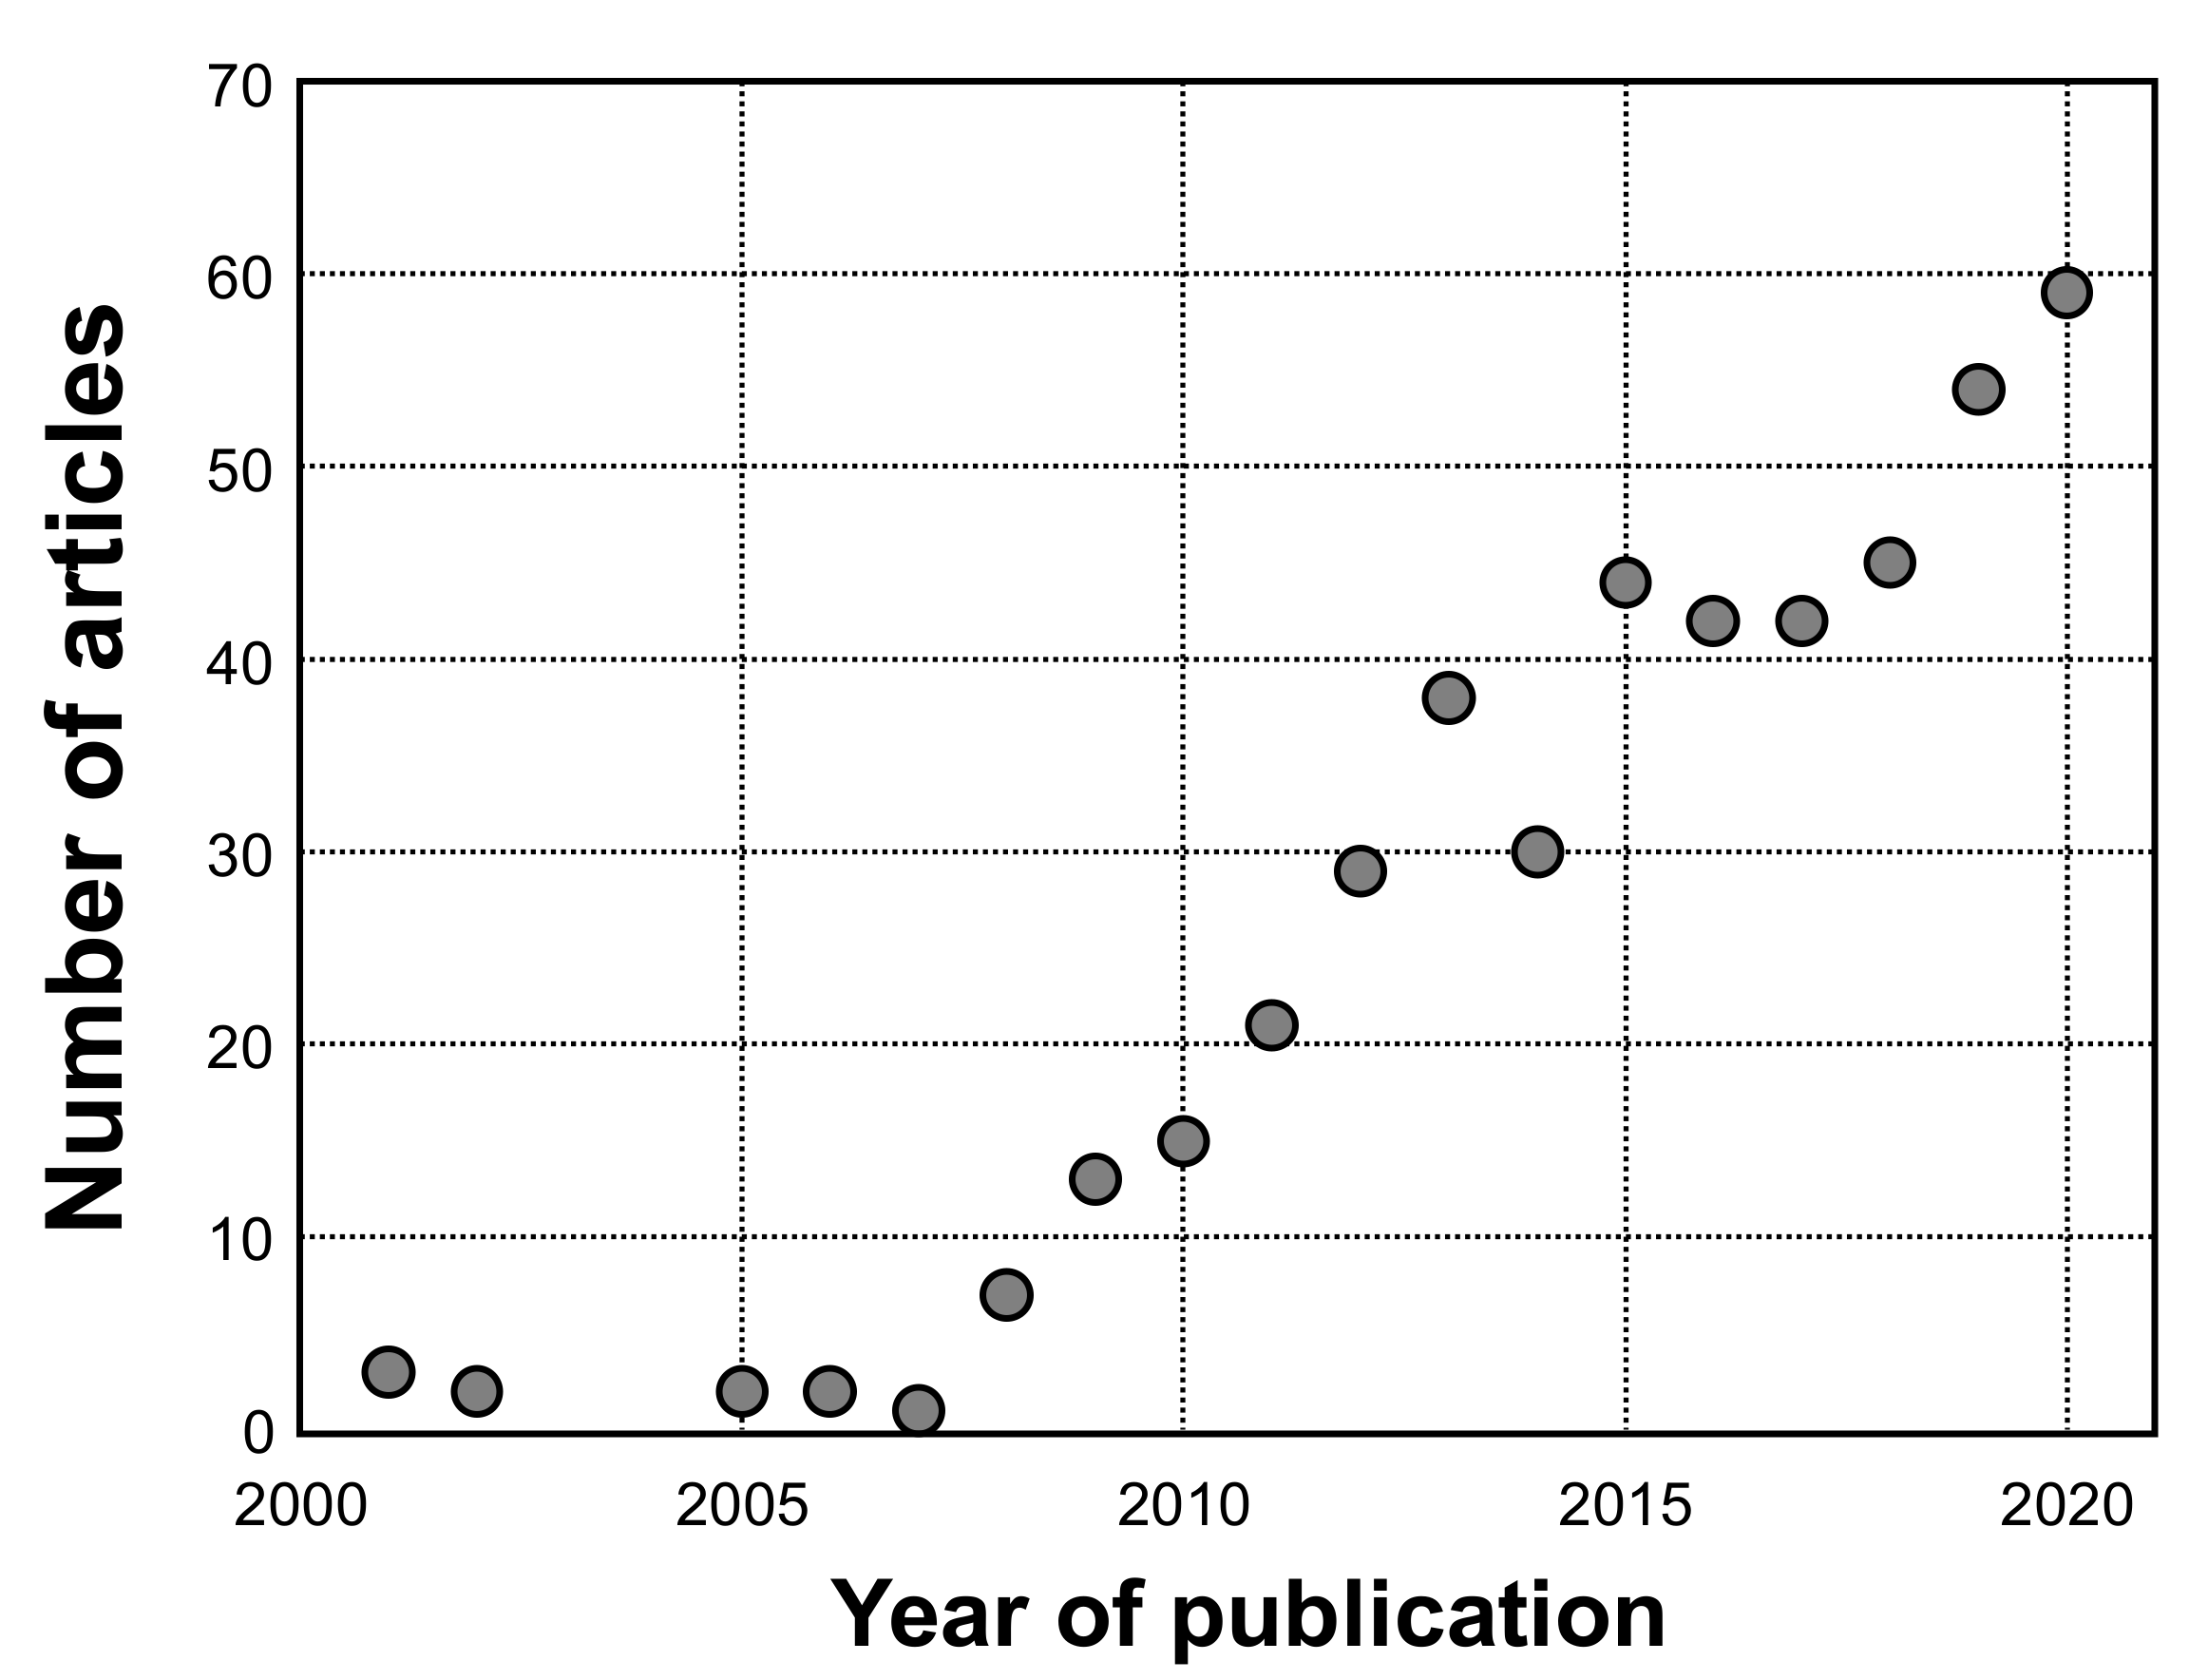
:1. Introduction
2. Clinical Application of nTMS for Mapping Motor Function
2.1. Feasibility, Reliability, and Comparison with Other Methods
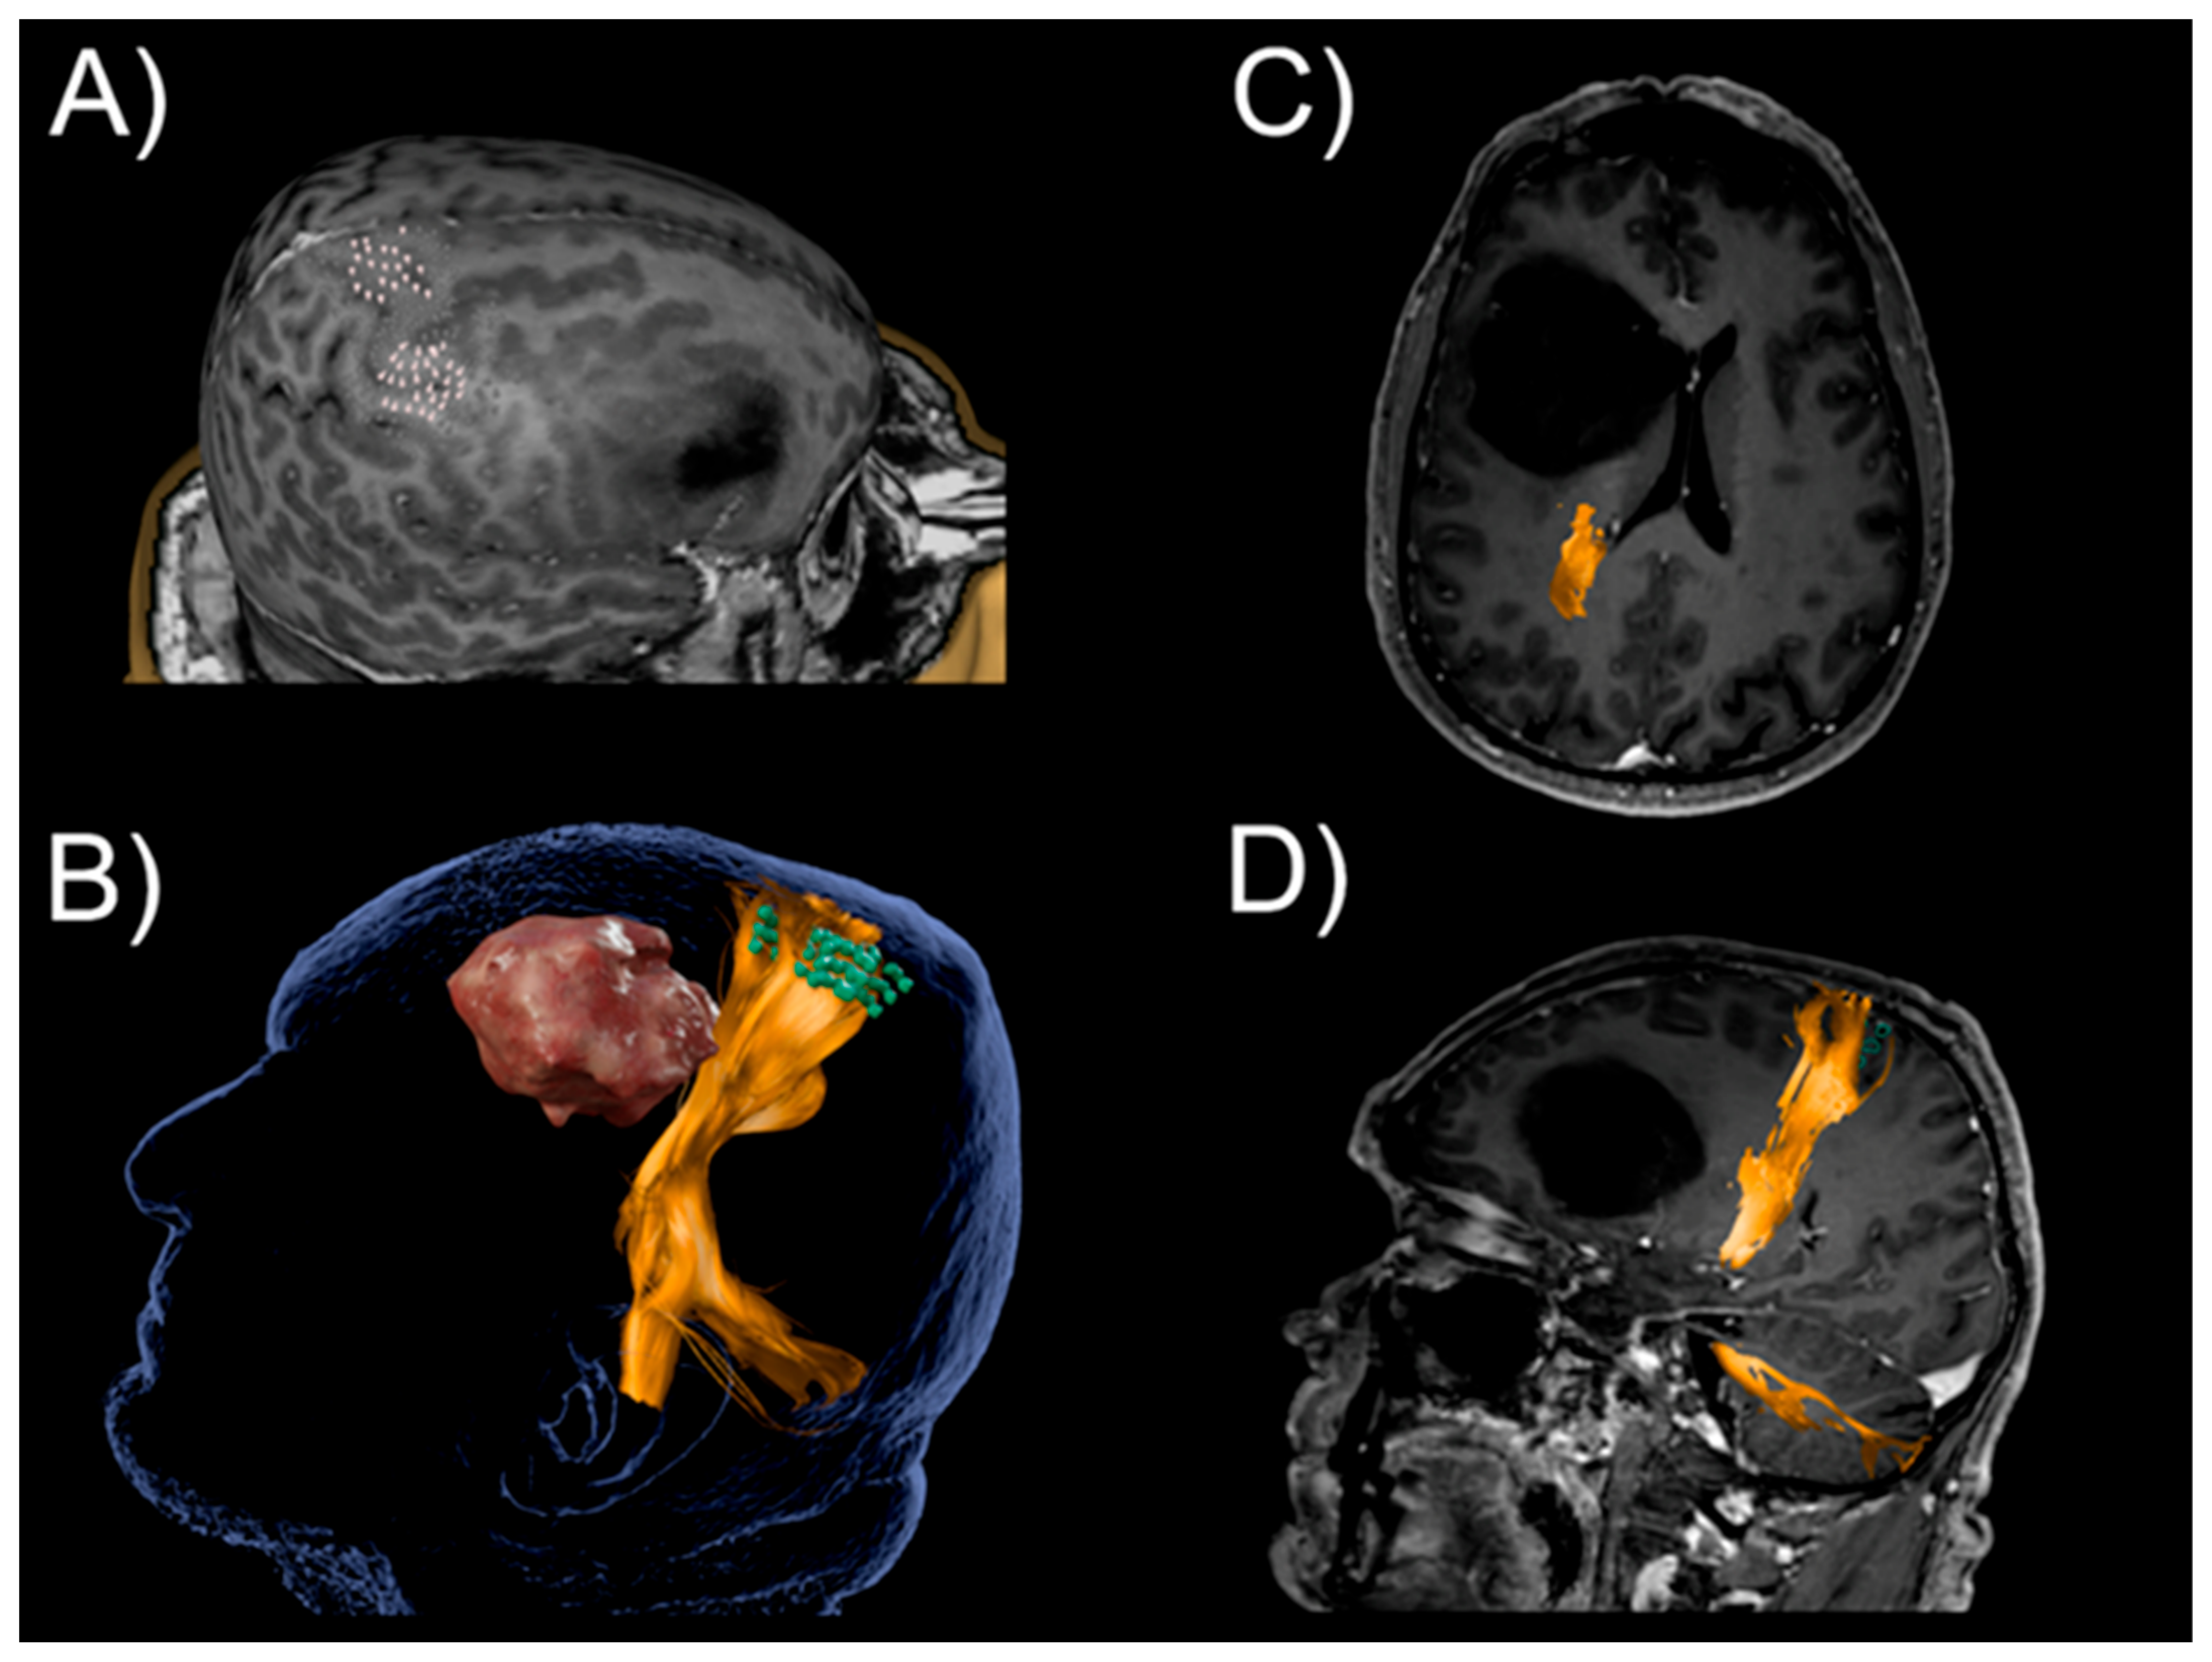
2.2. Fiber Tractography
2.3. Improvement of Clinical Outcome
2.4. Risk Stratification and Prediction
2.5. Plasticity and Reallocation of Motor Function
2.6. Integration into the Clinical Environment
3. Methodological Considerations on Application of nTMS Motor Mapping
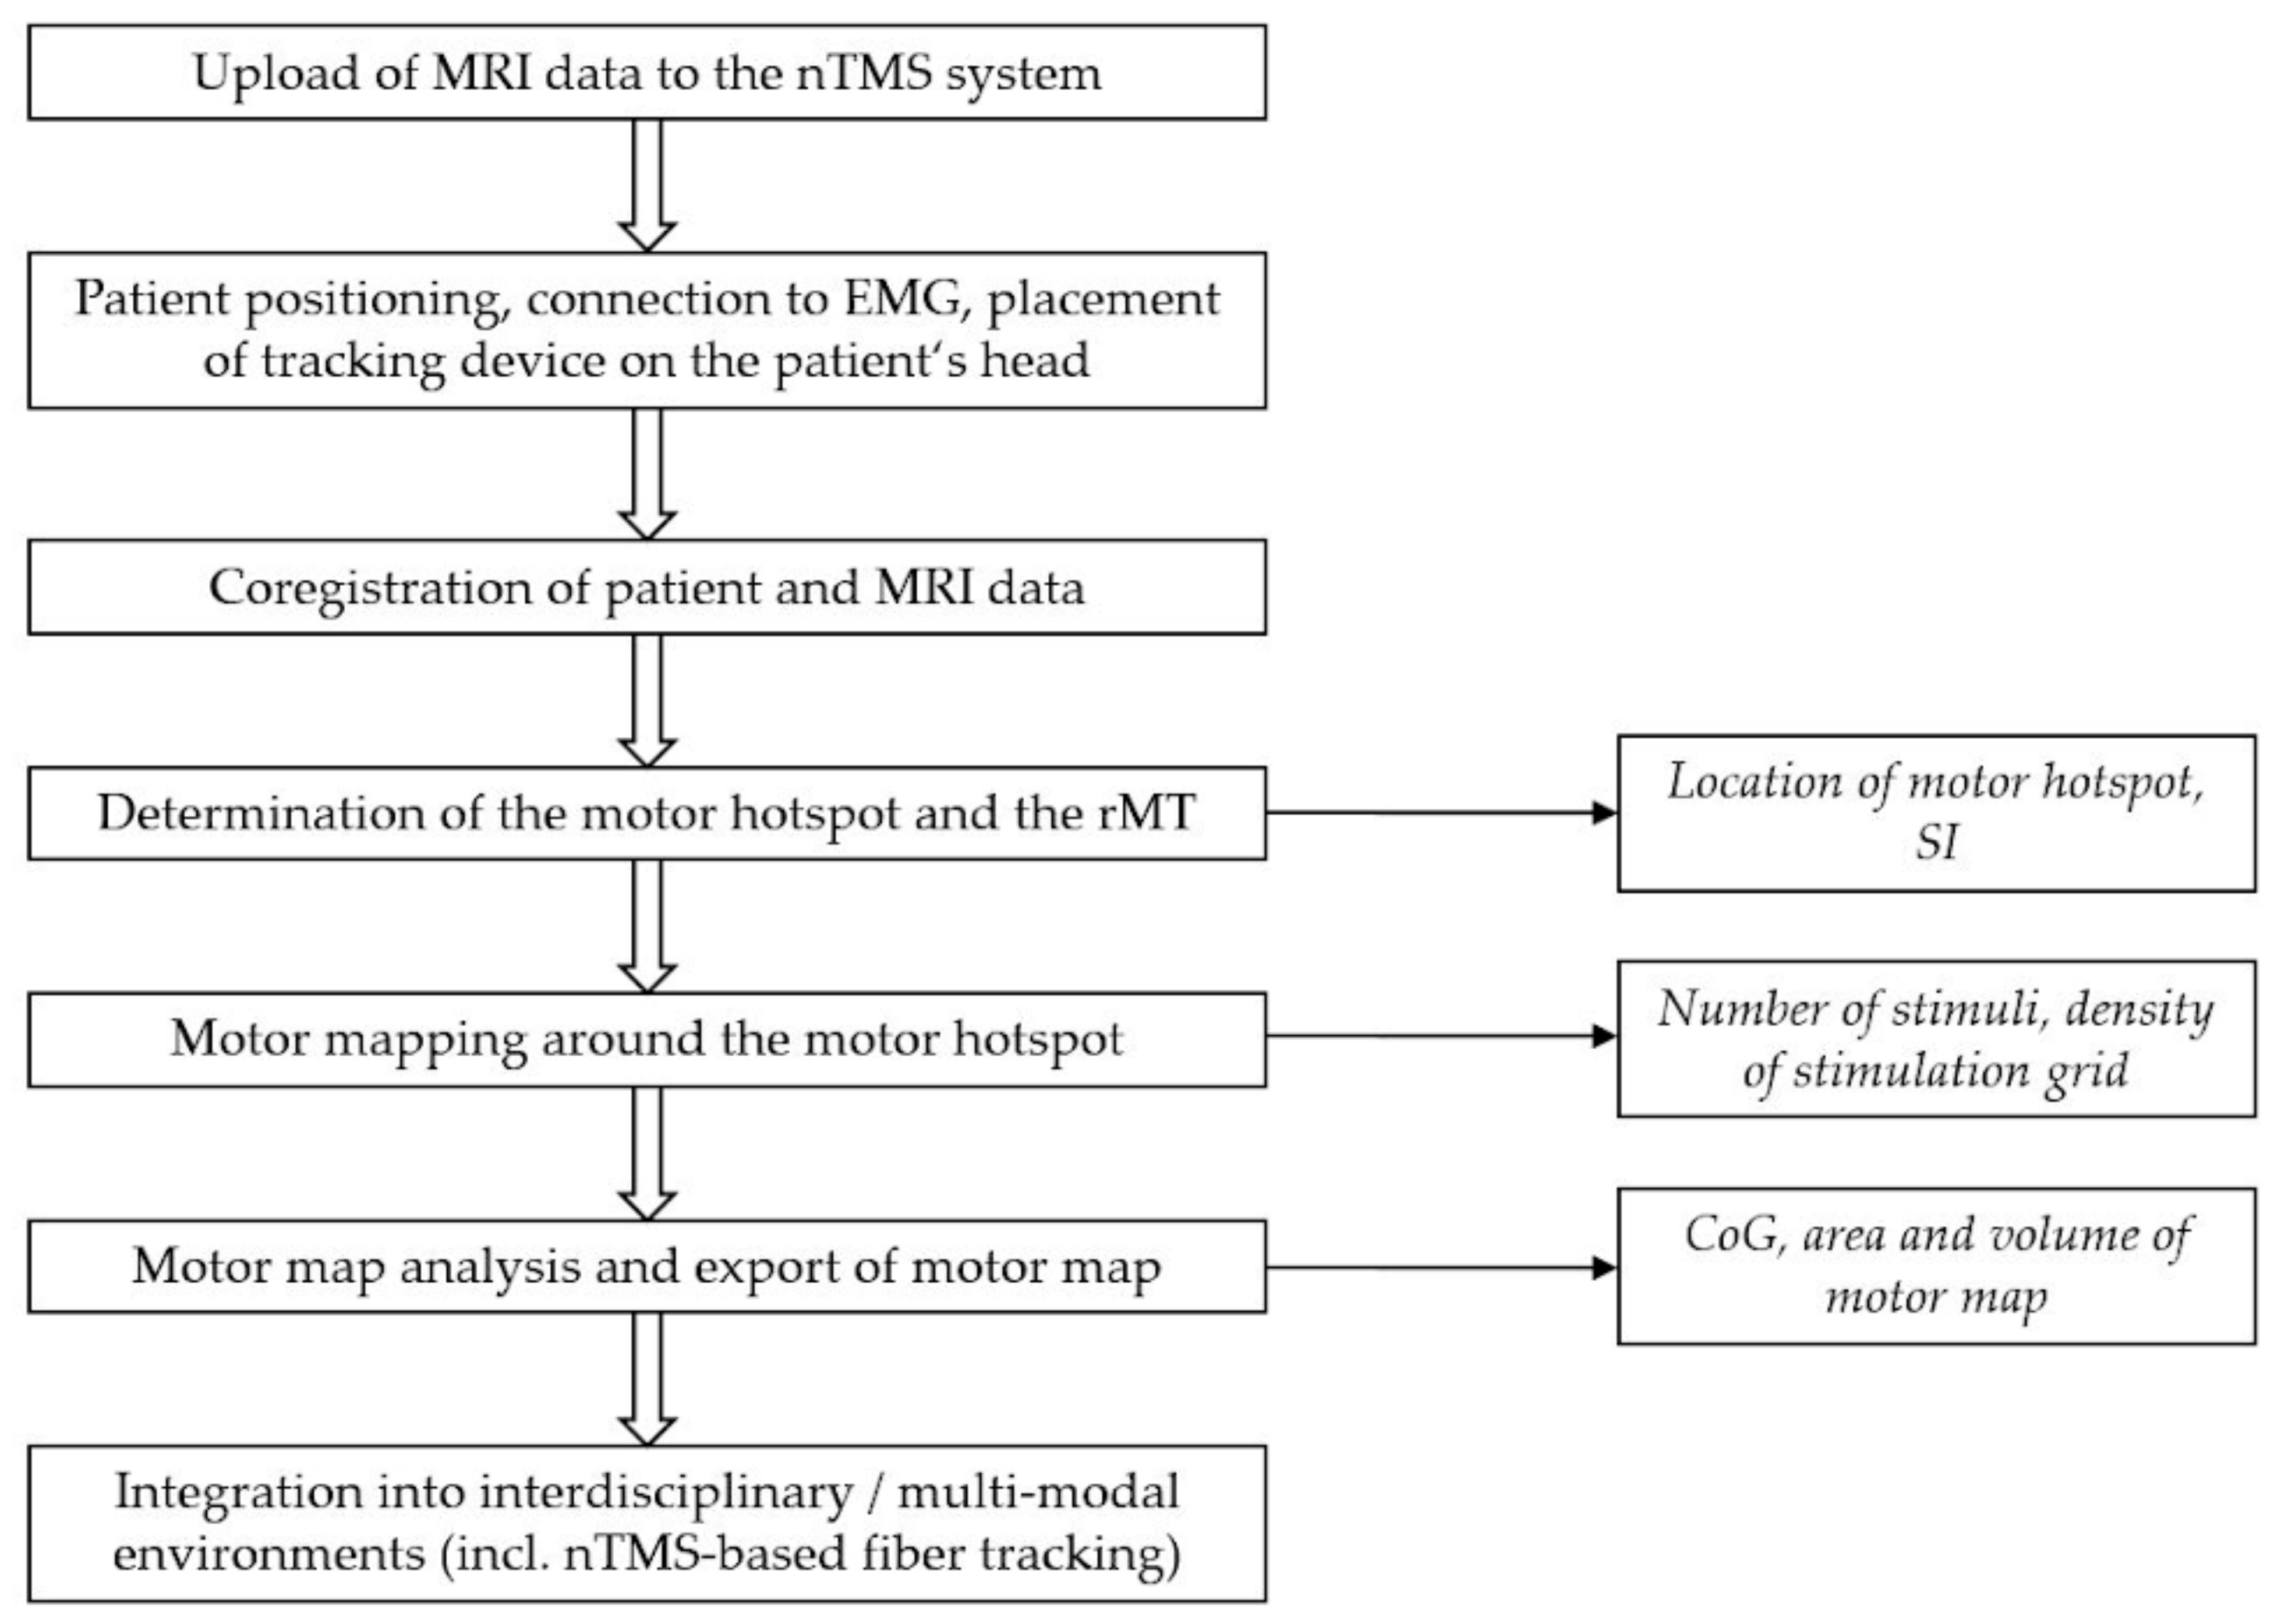
3.1. Current Practices and Protocols
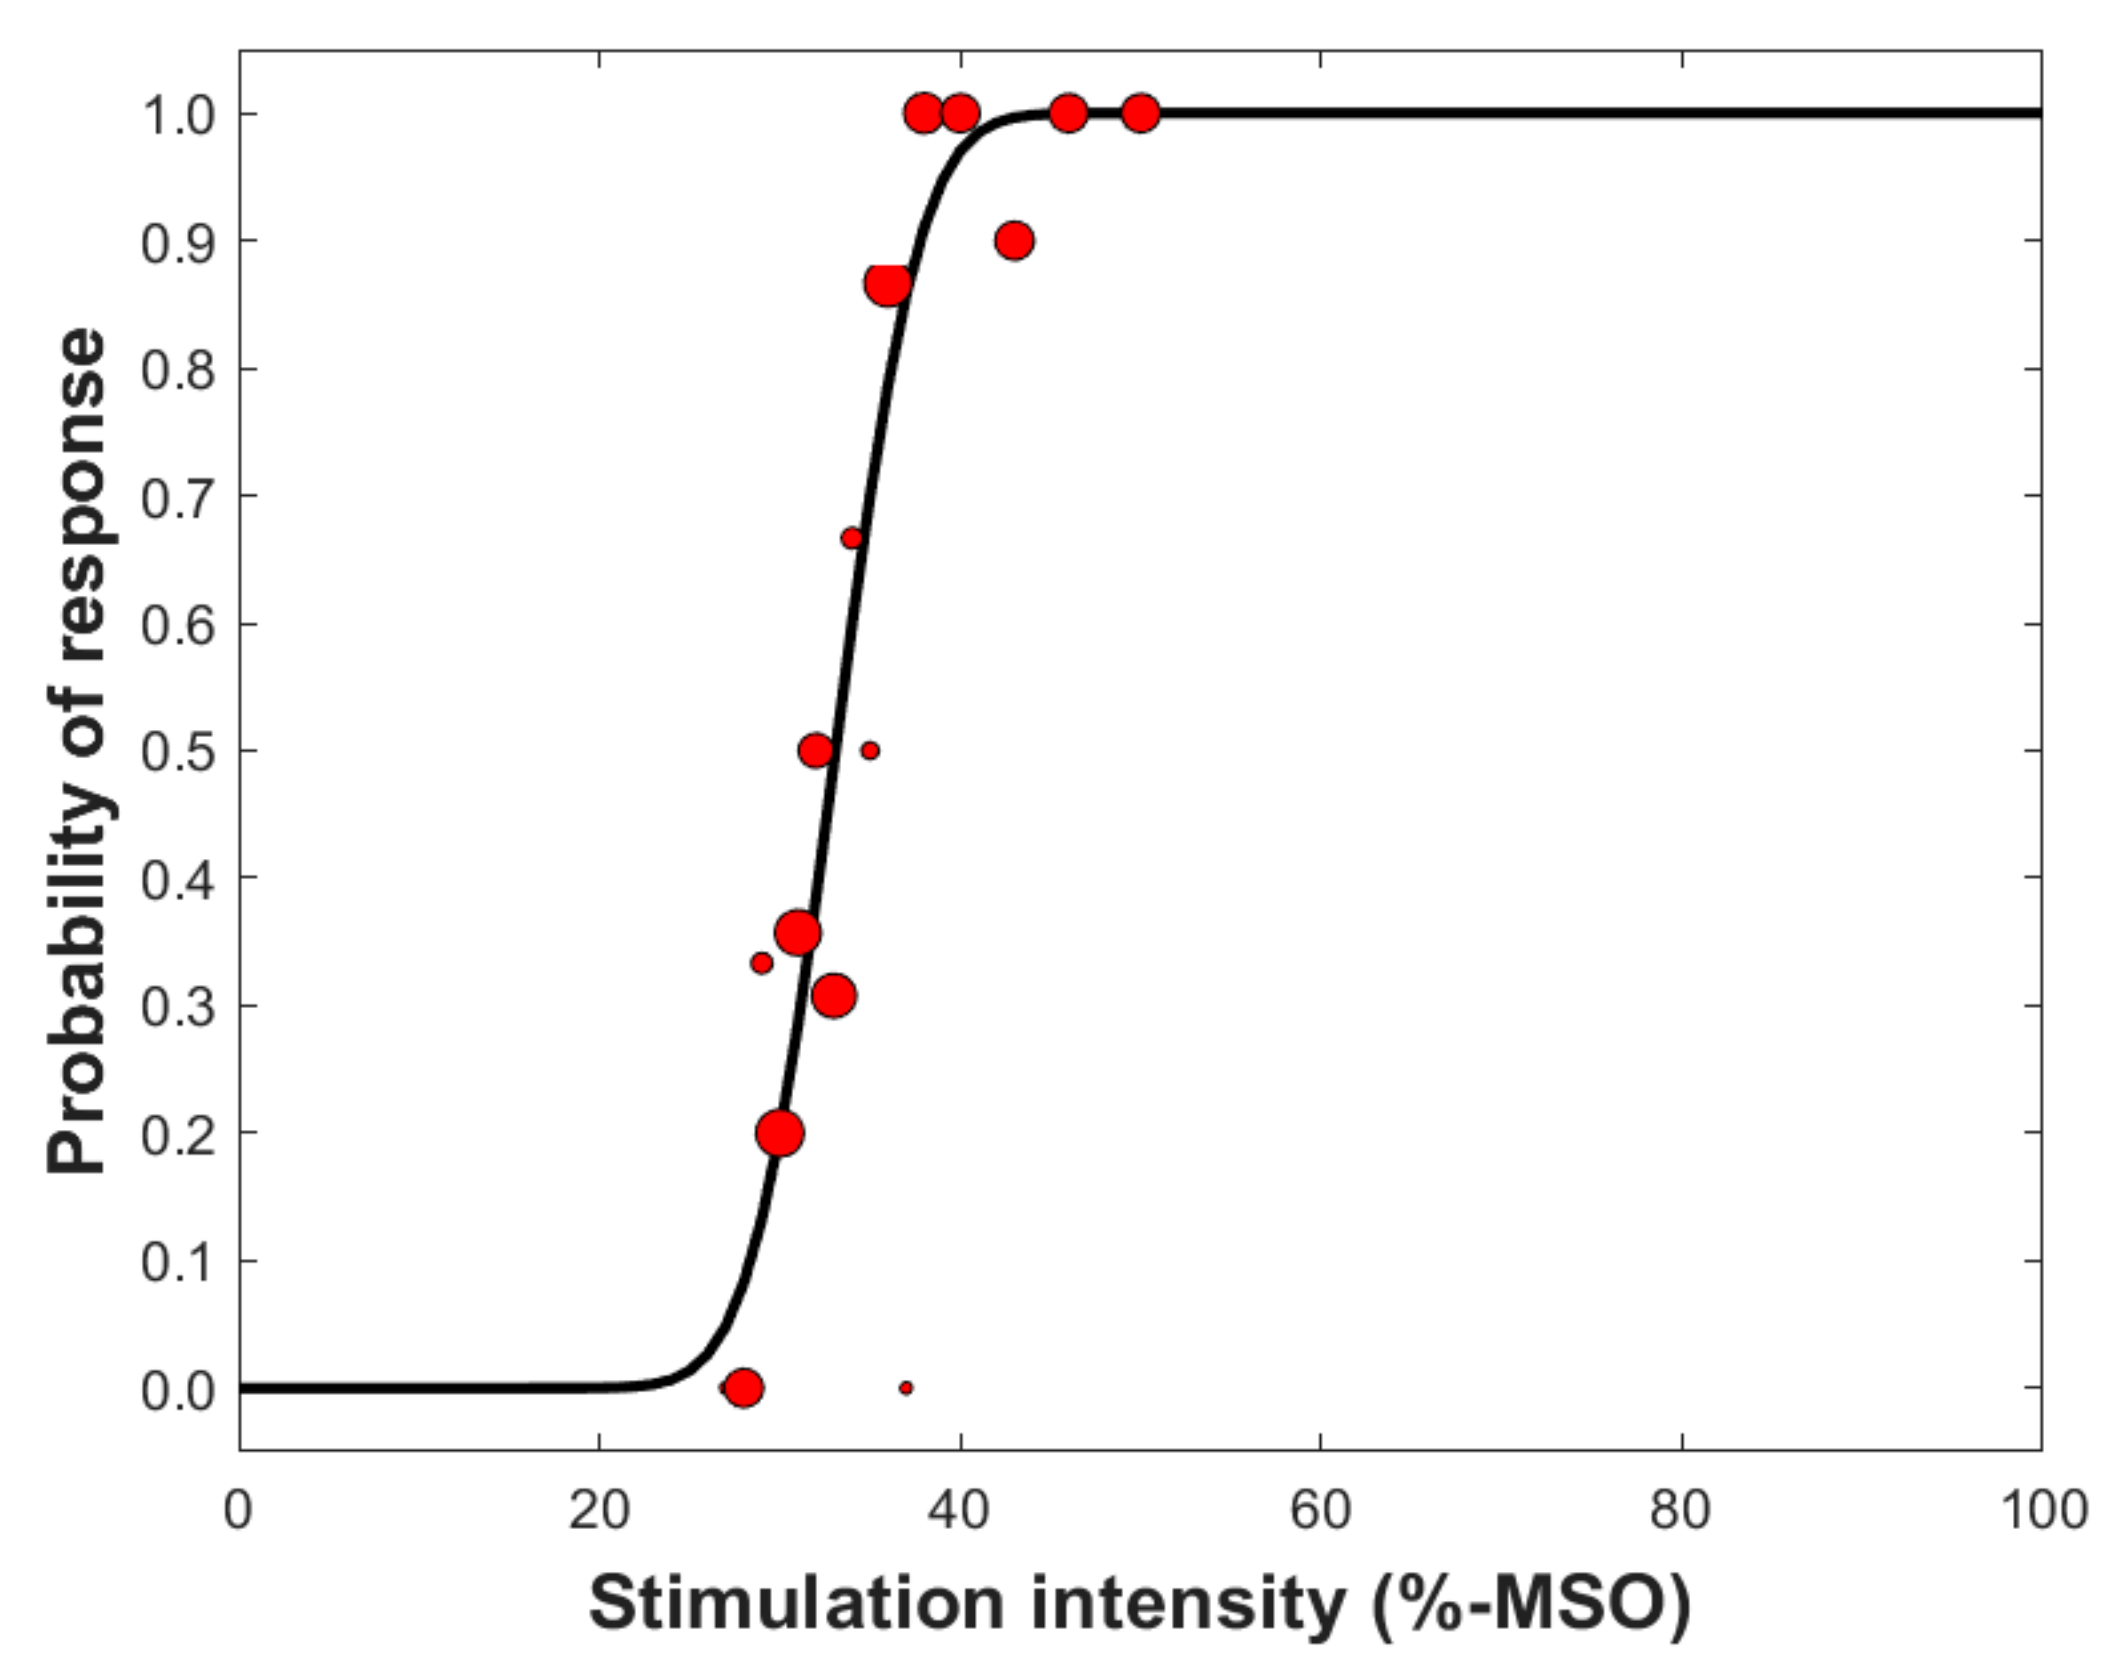
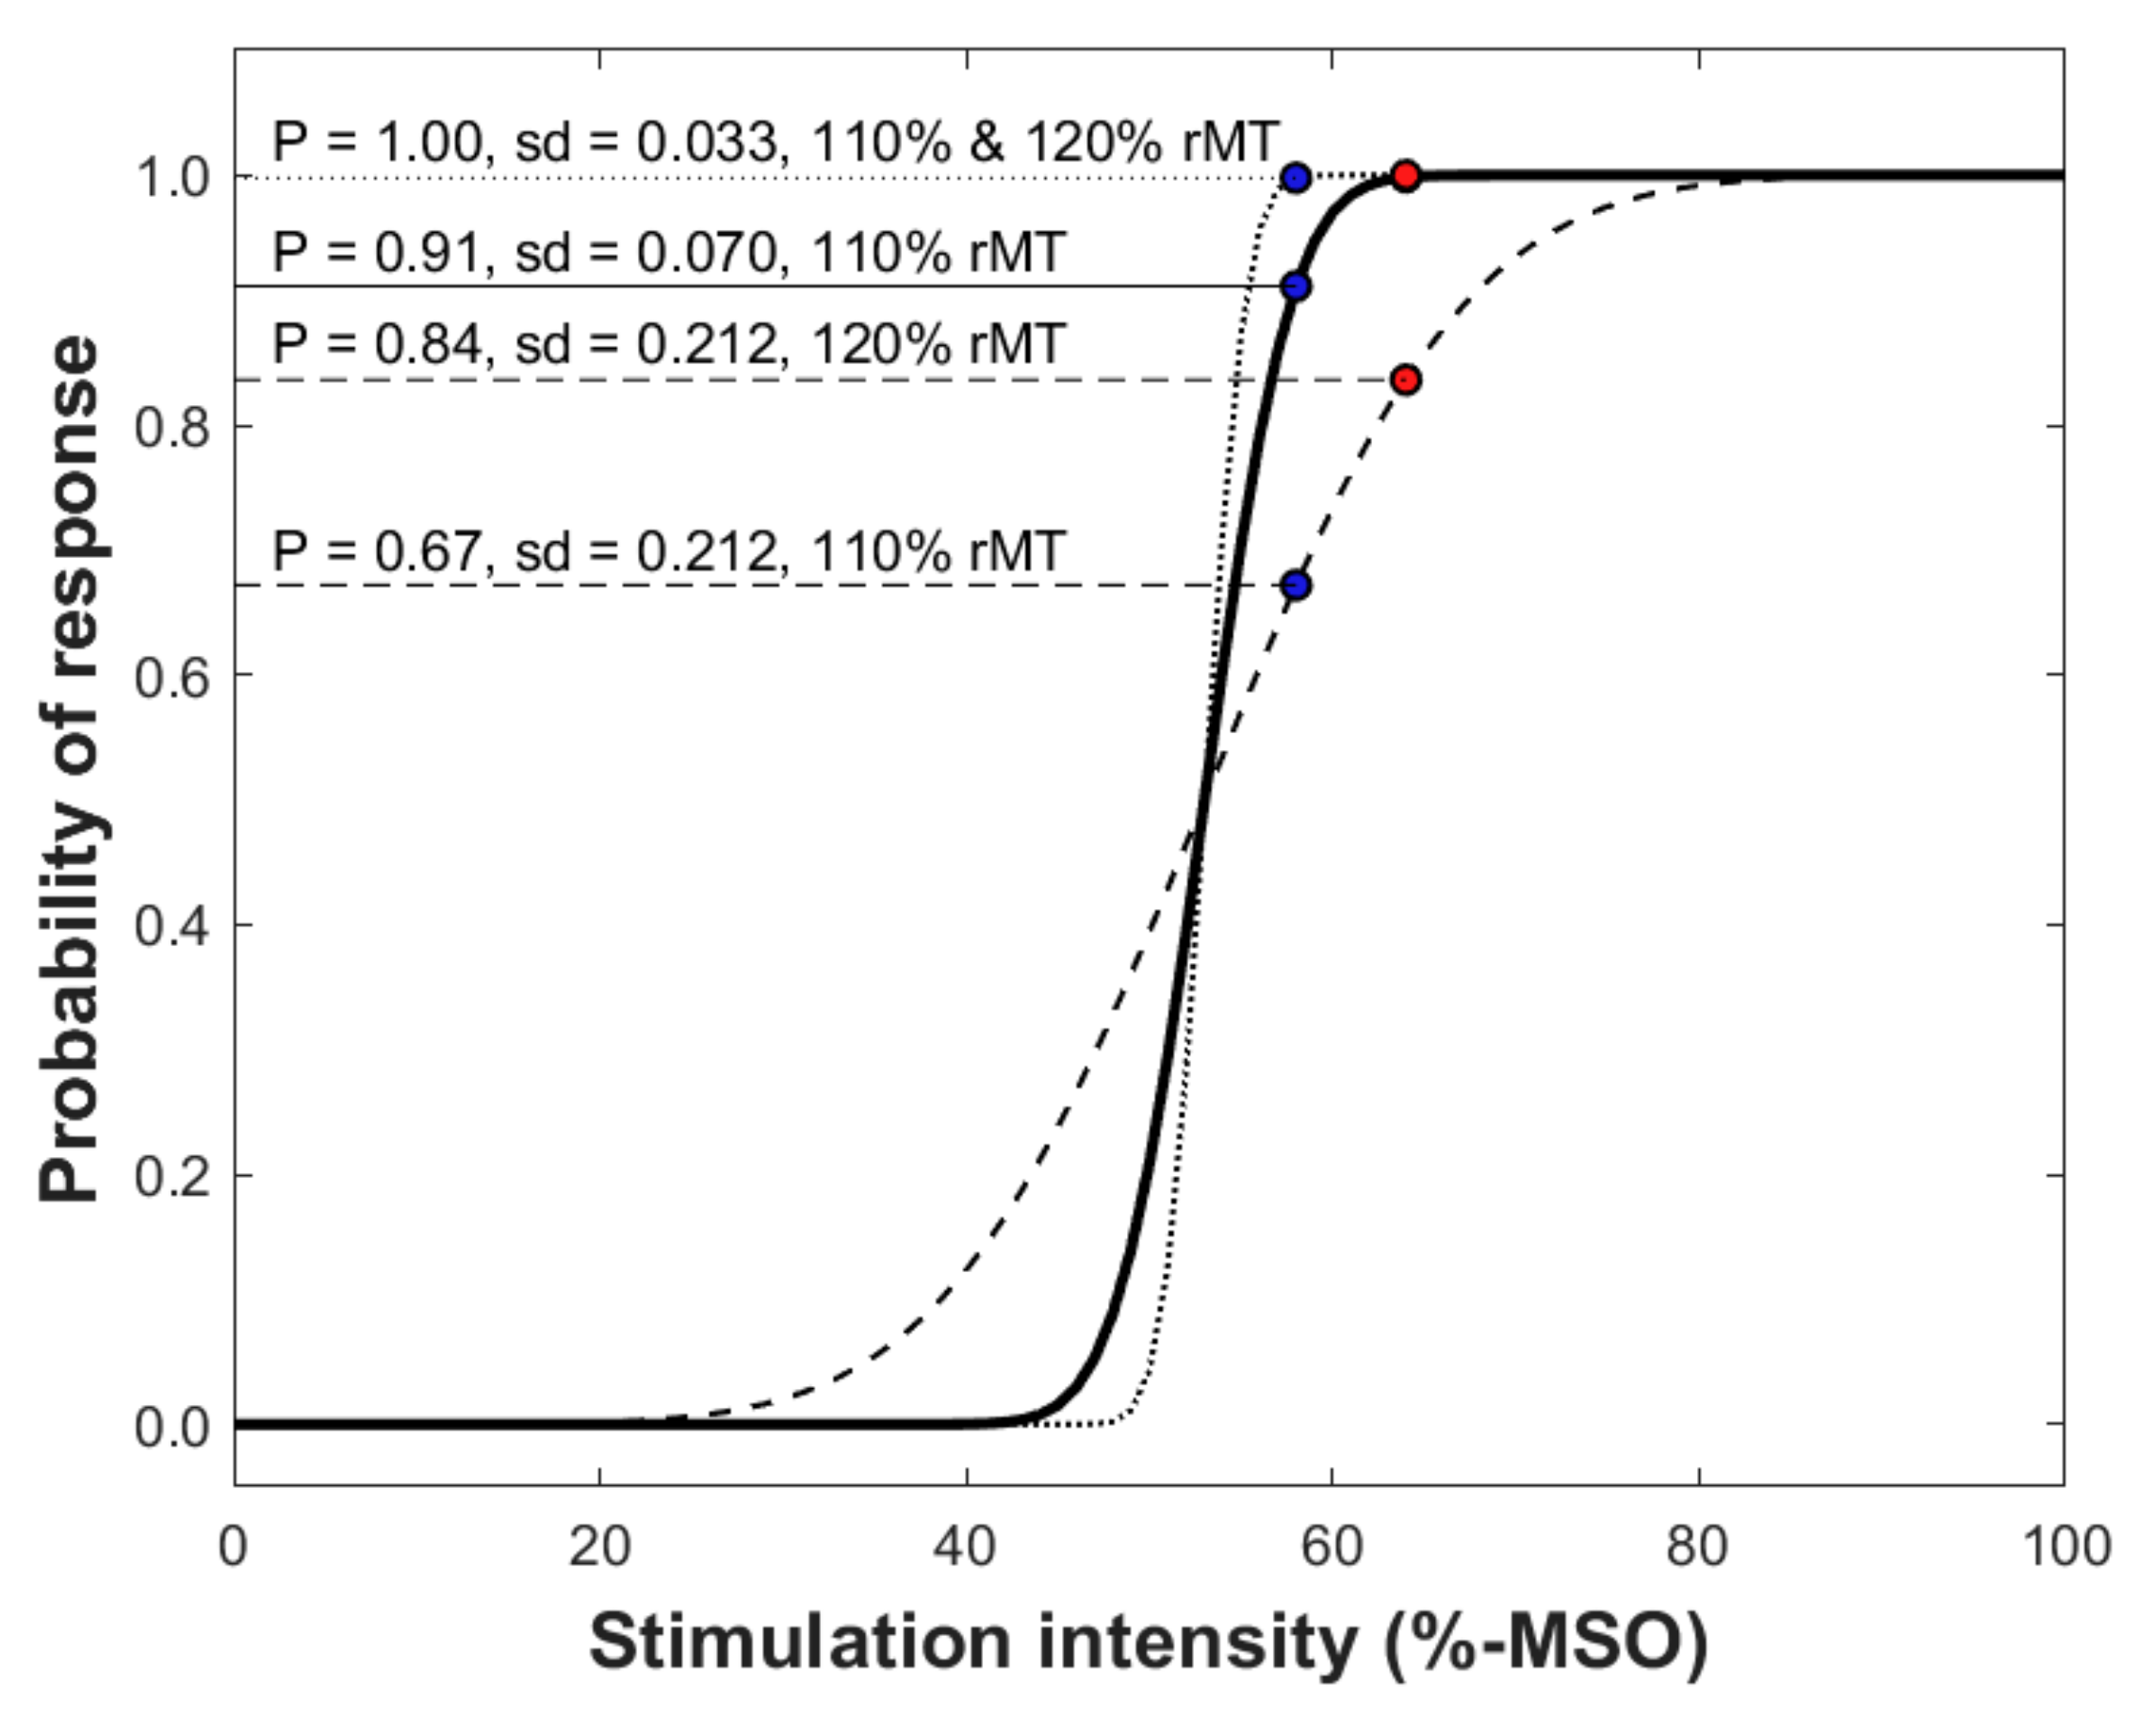
3.2. Selecting Stimulation Intensity
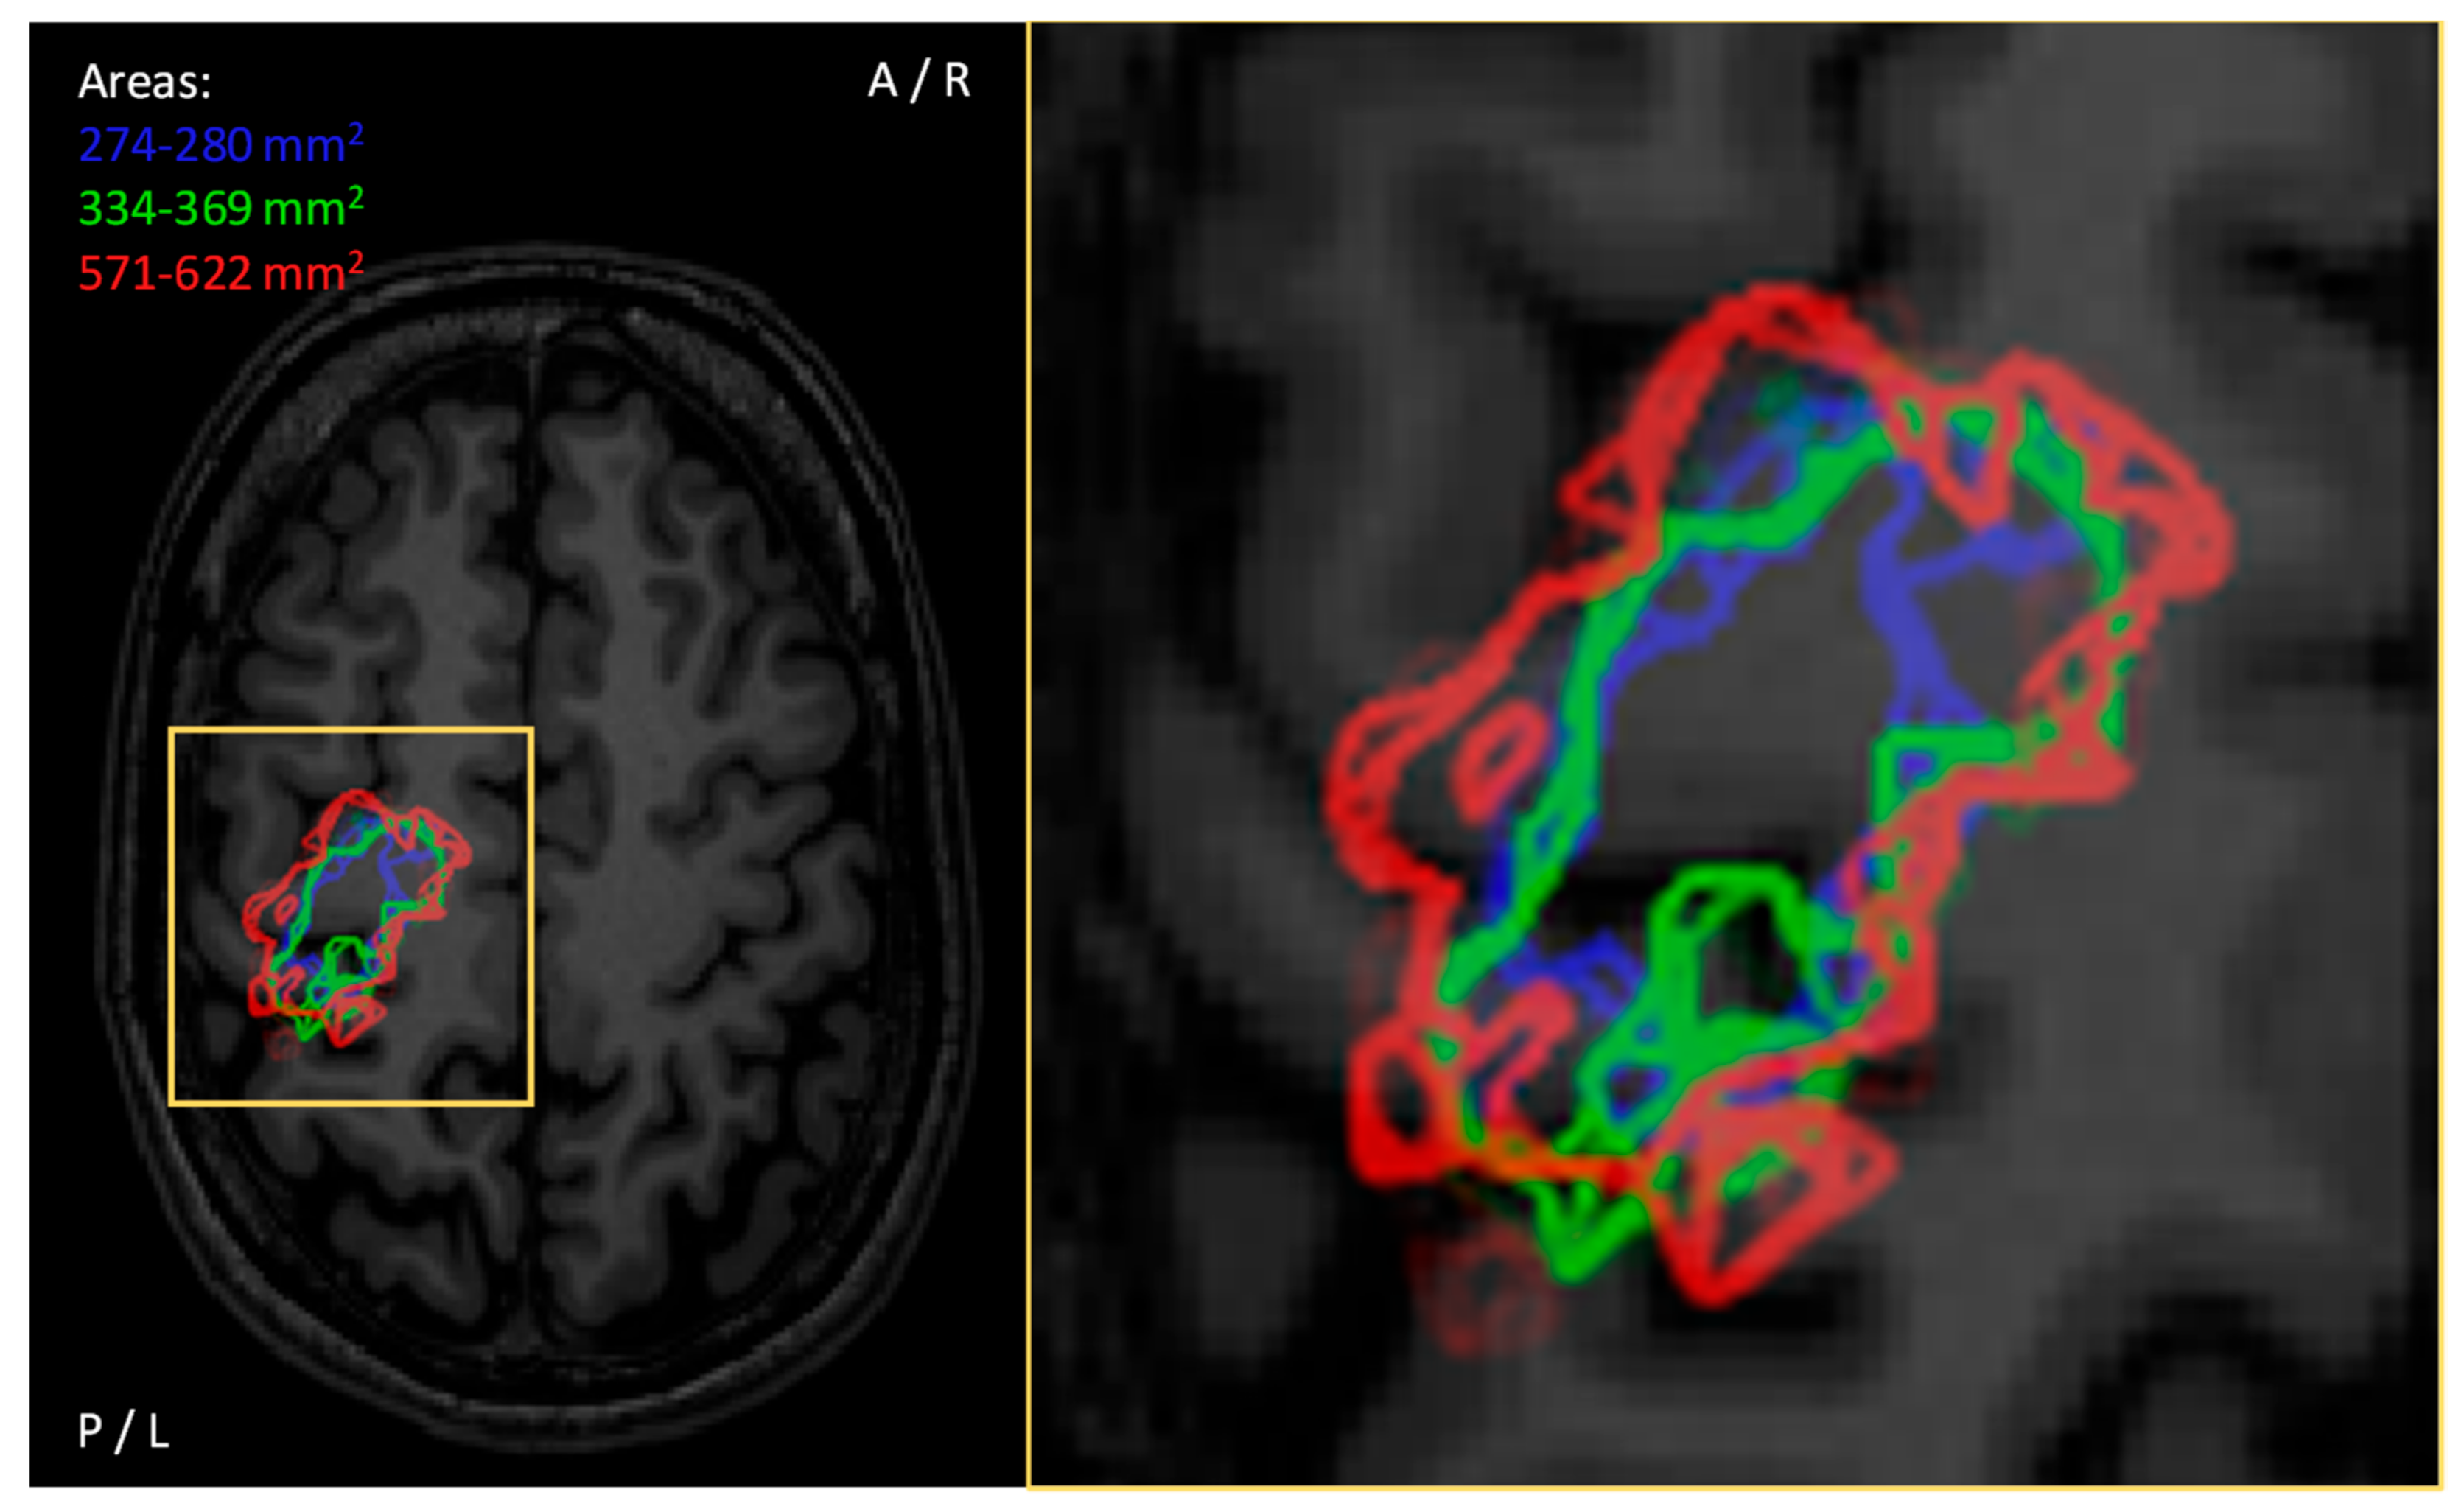
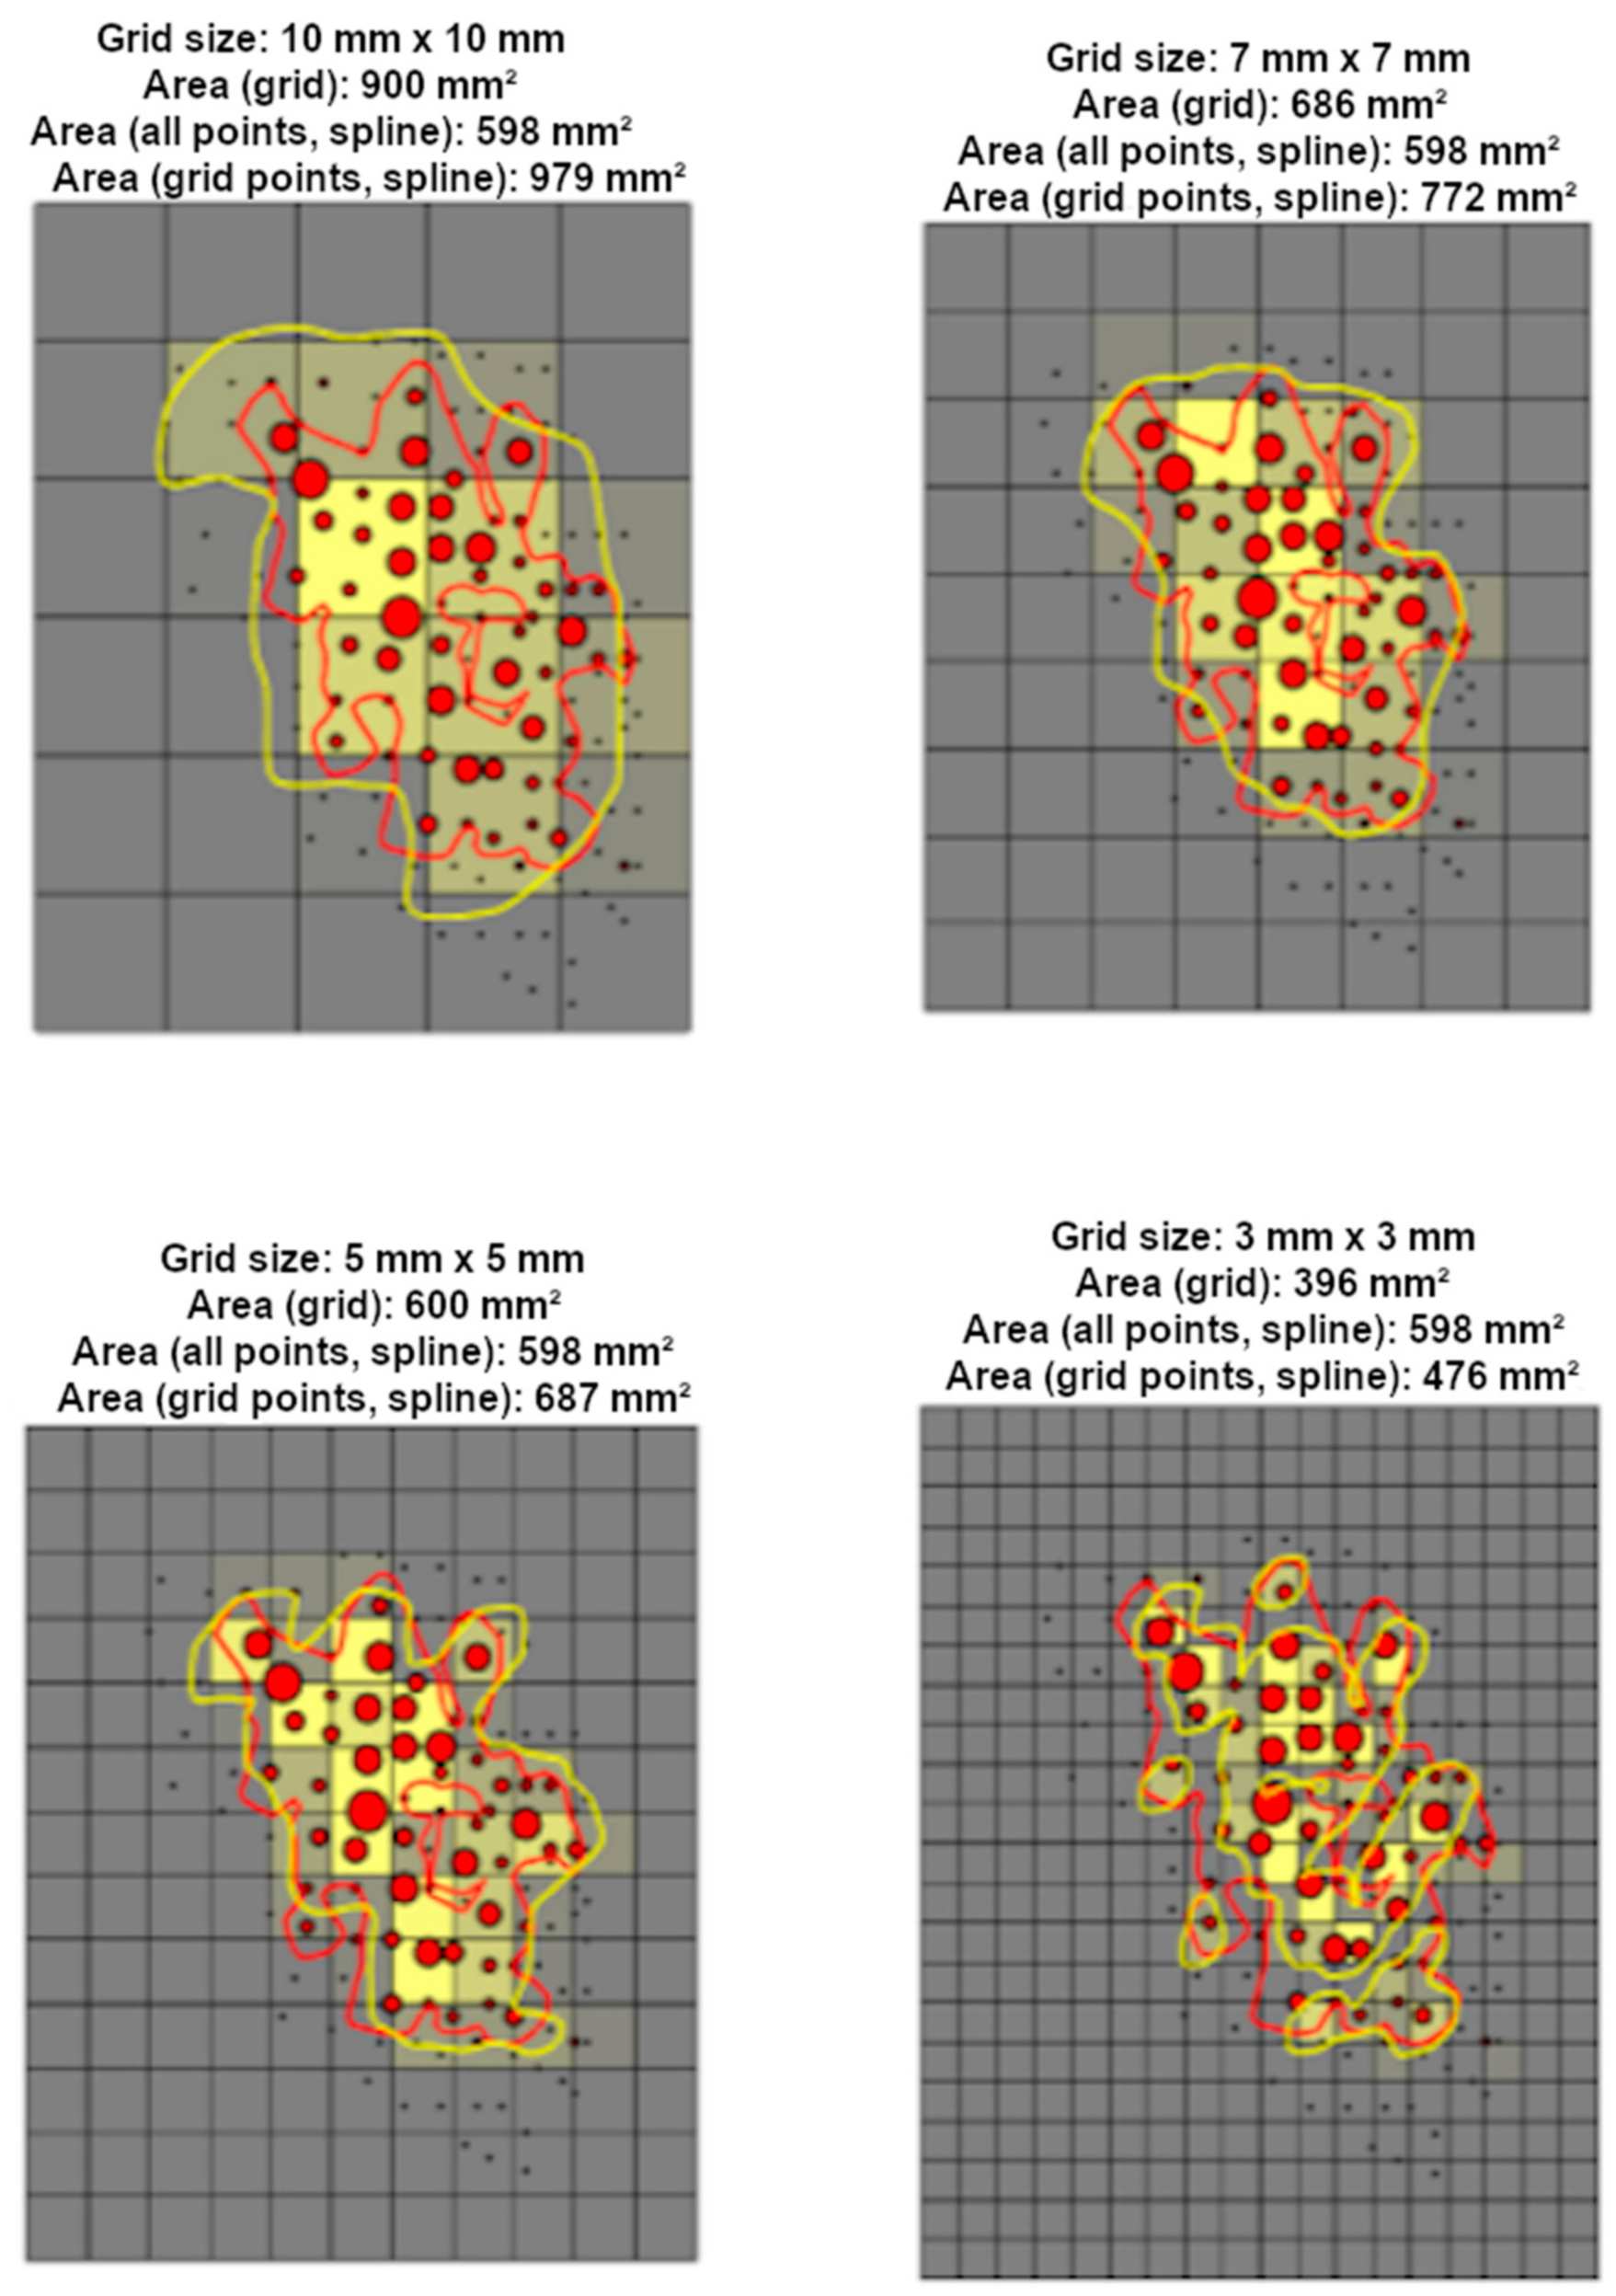
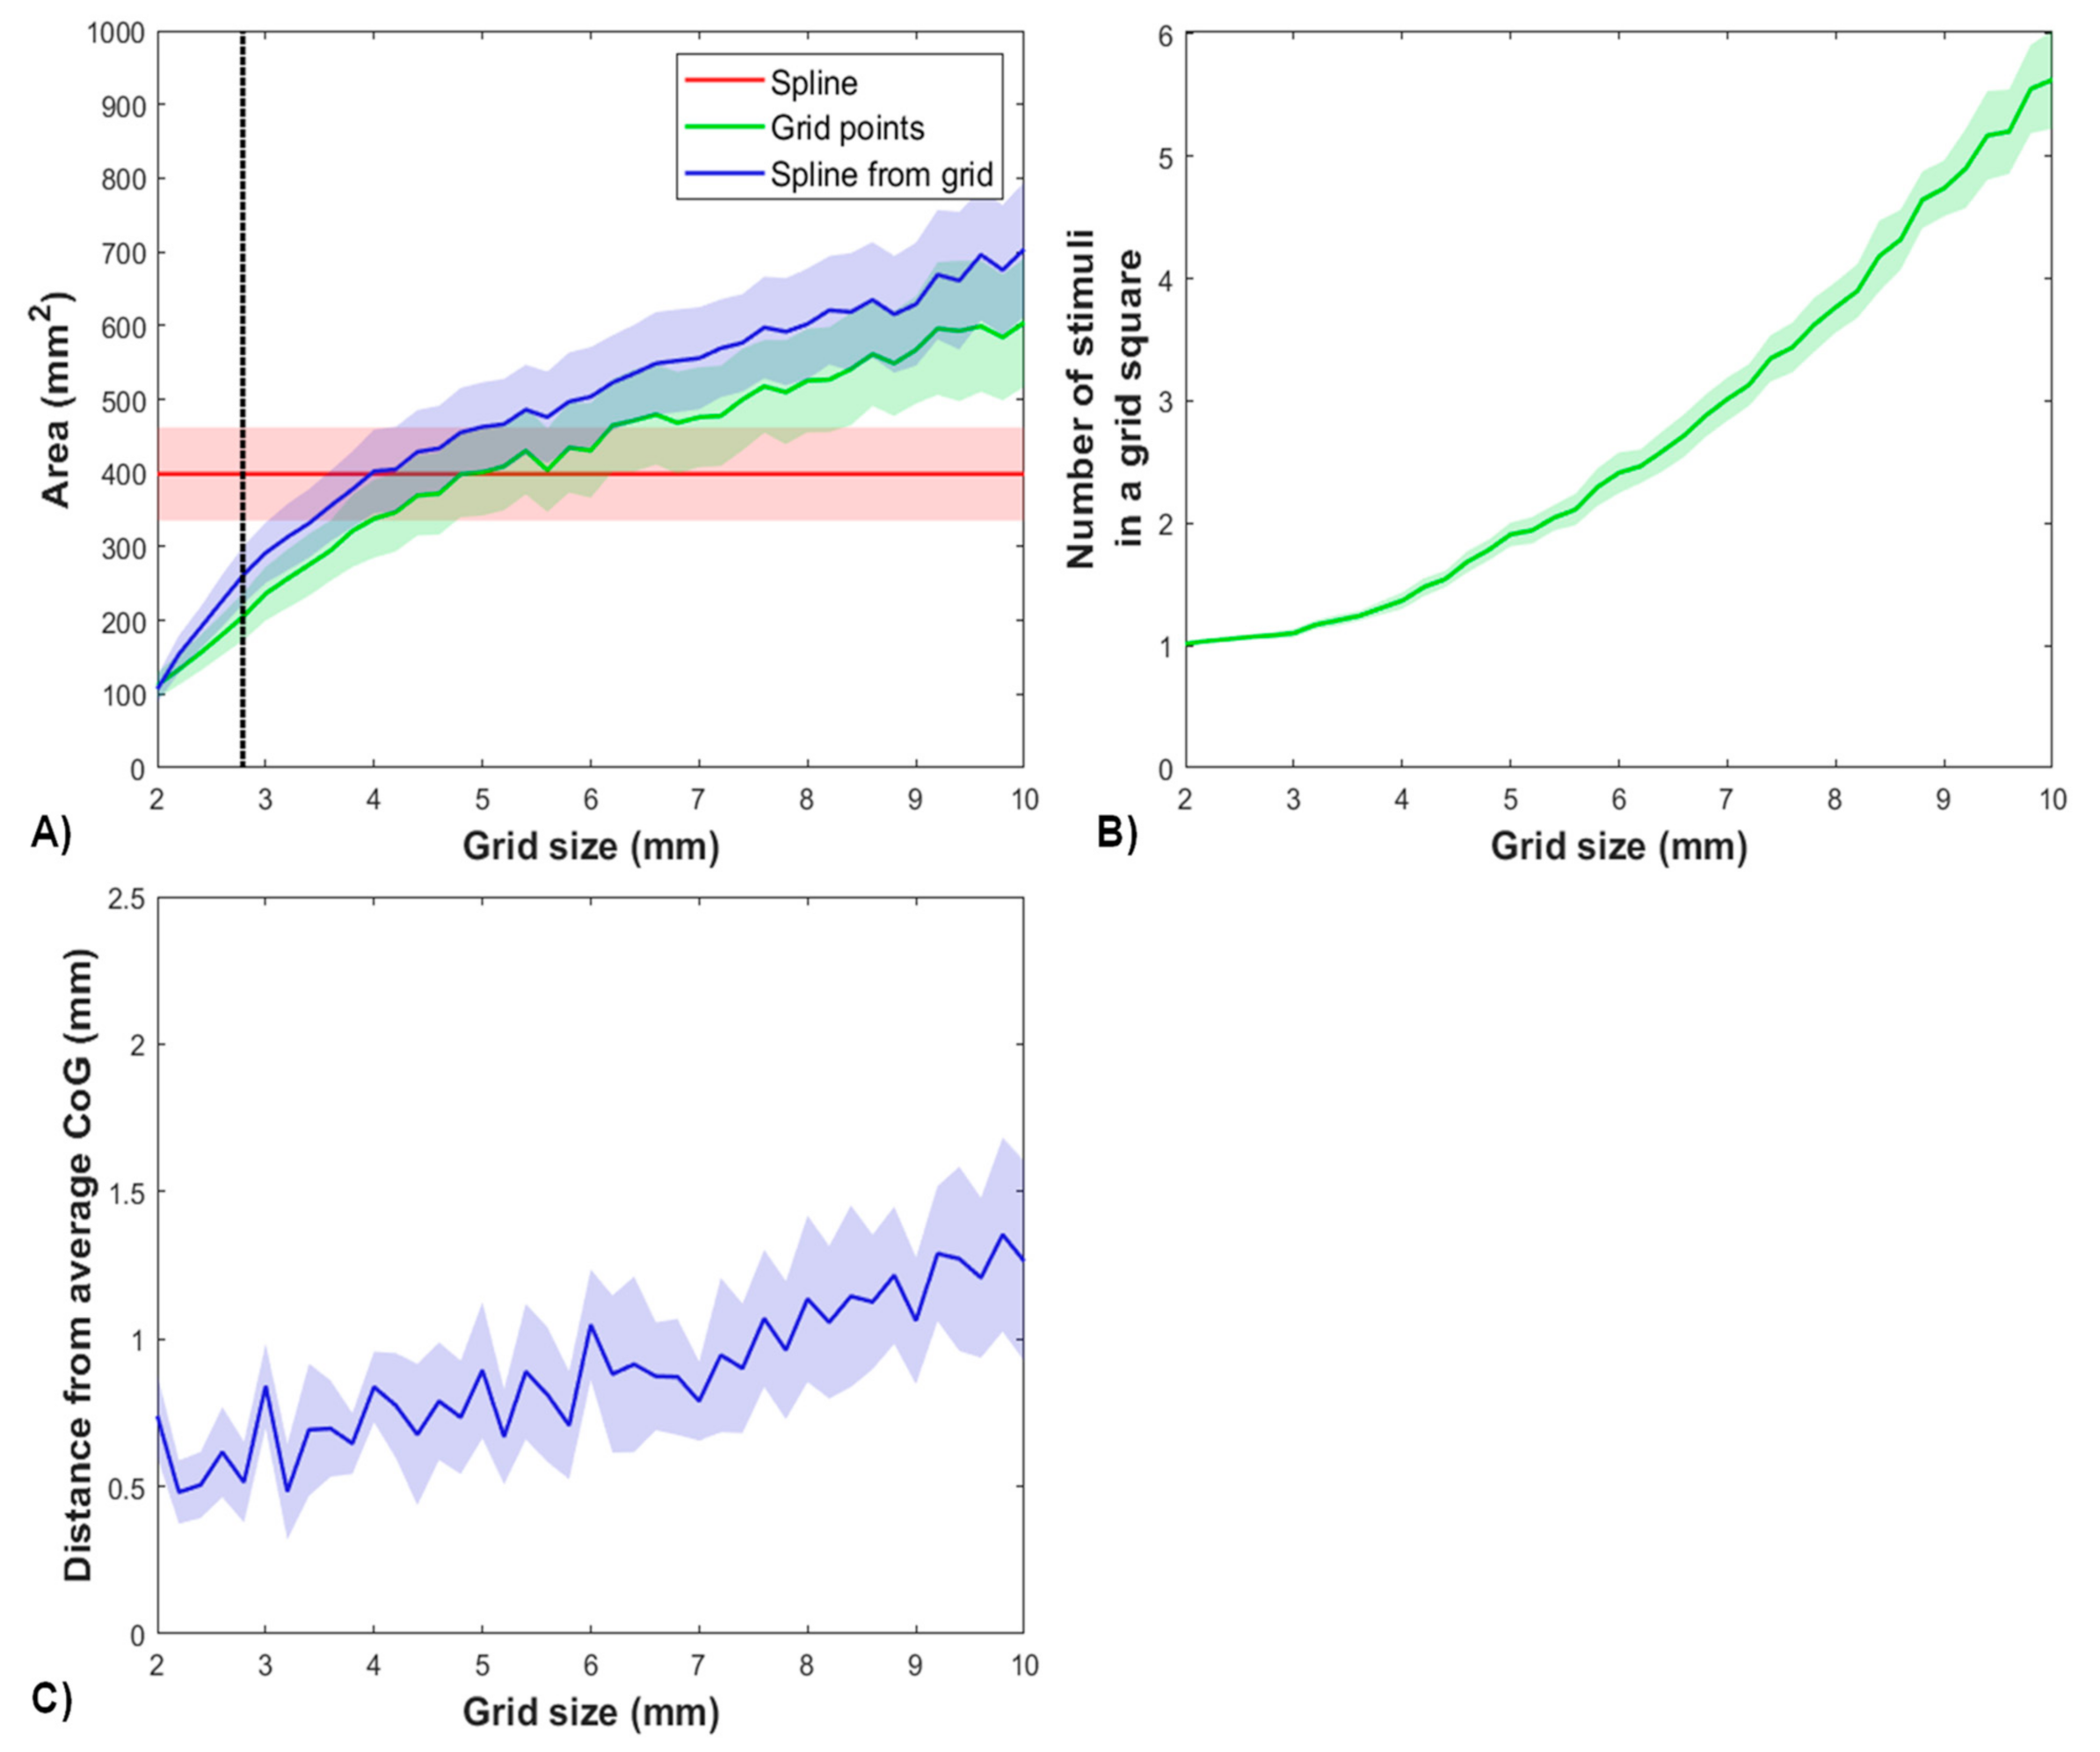
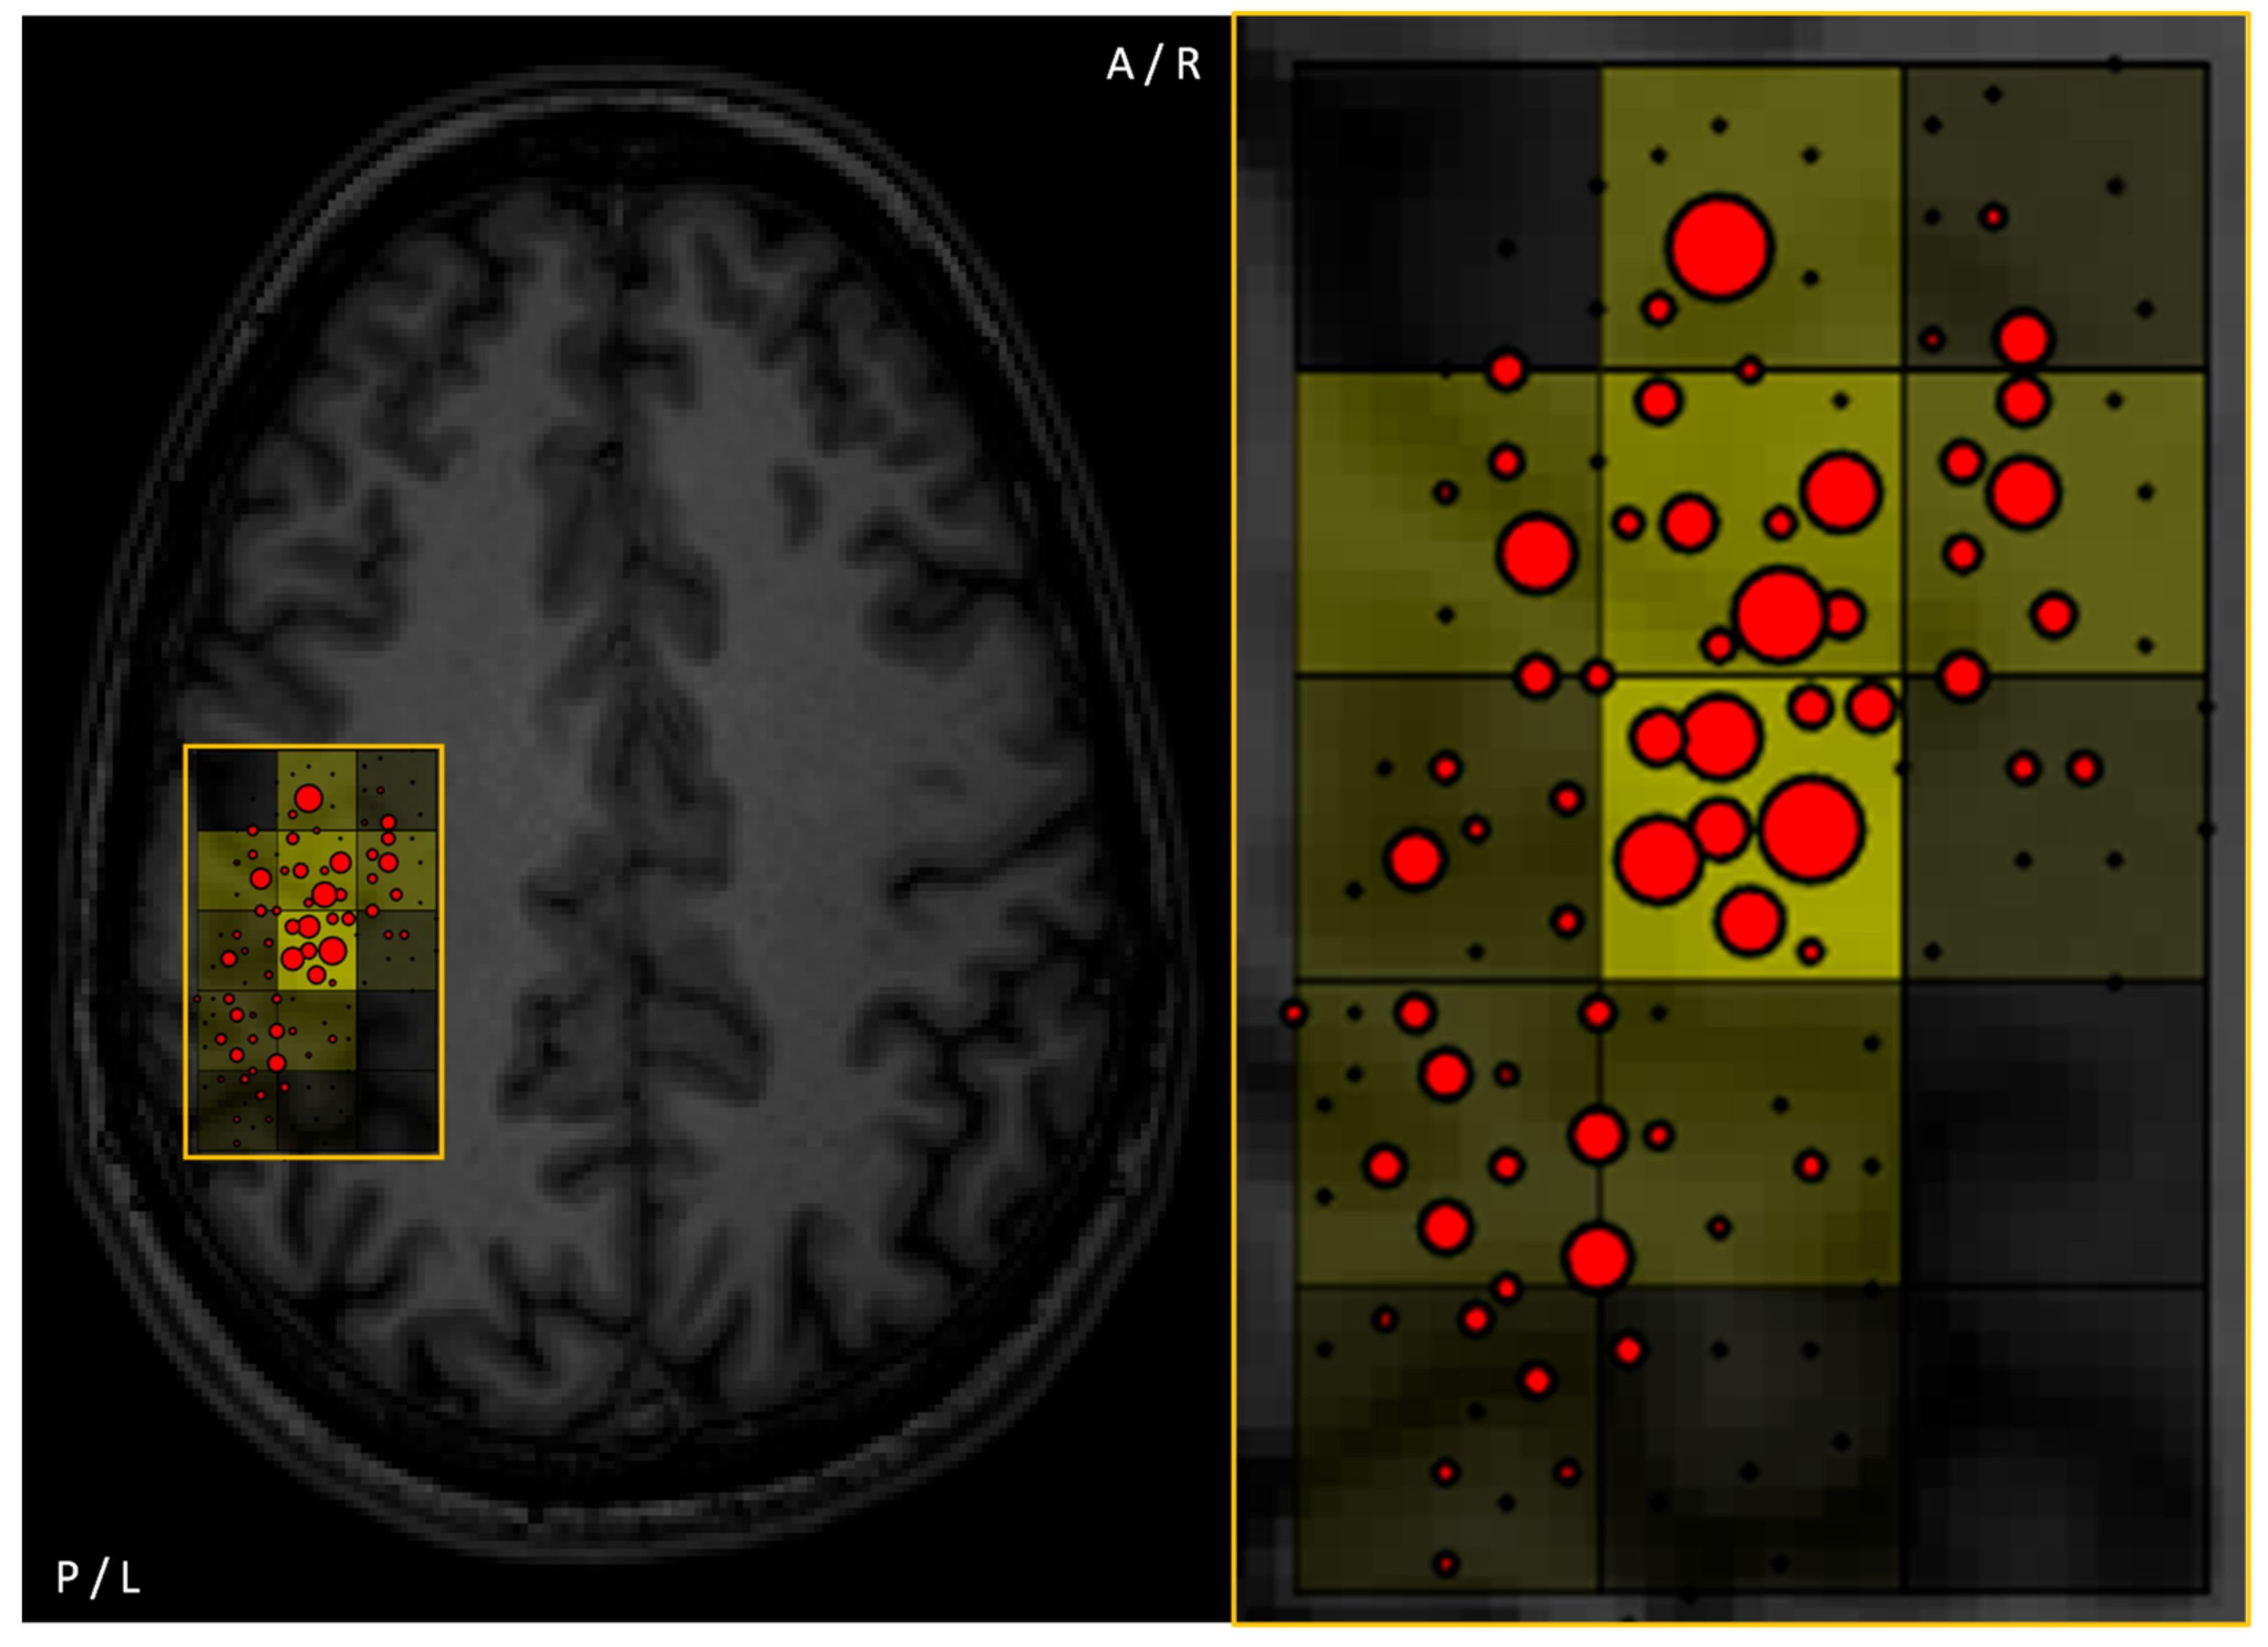
3.3. Stimulation Grid
3.4. Number of Stimuli Required (per Target Location)
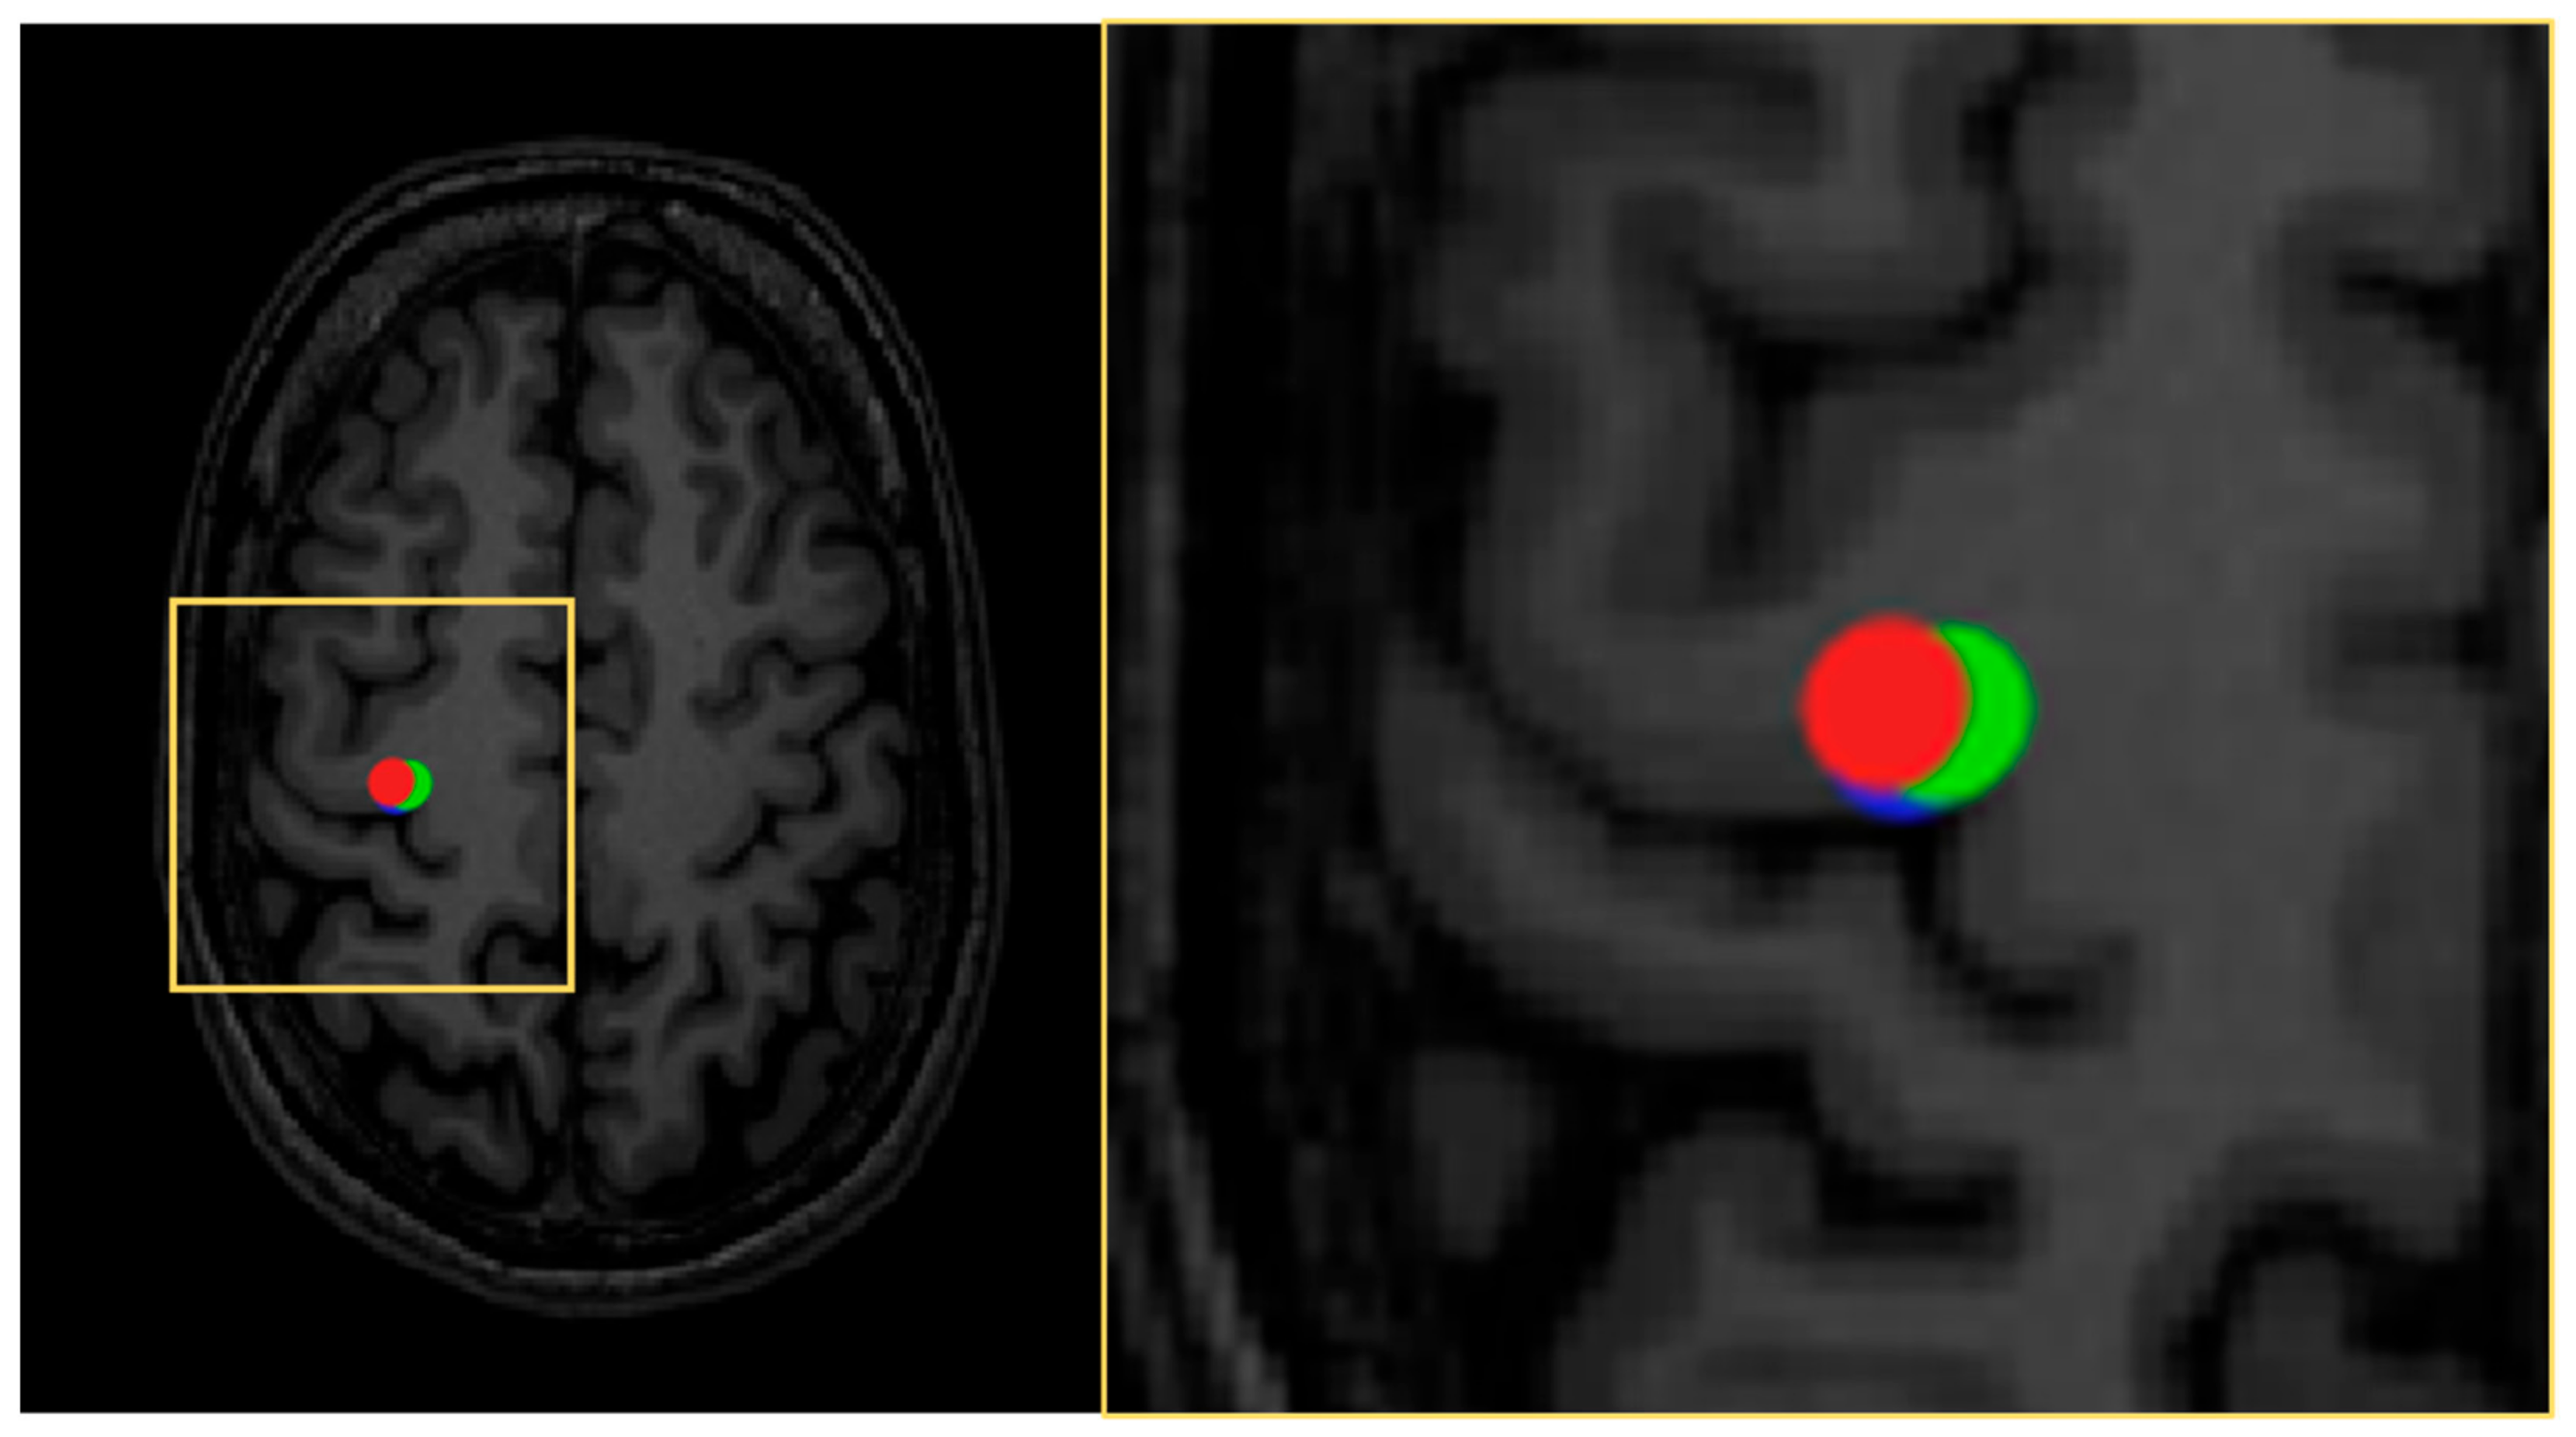
3.5. Coil Orientation with Respect to Anatomy
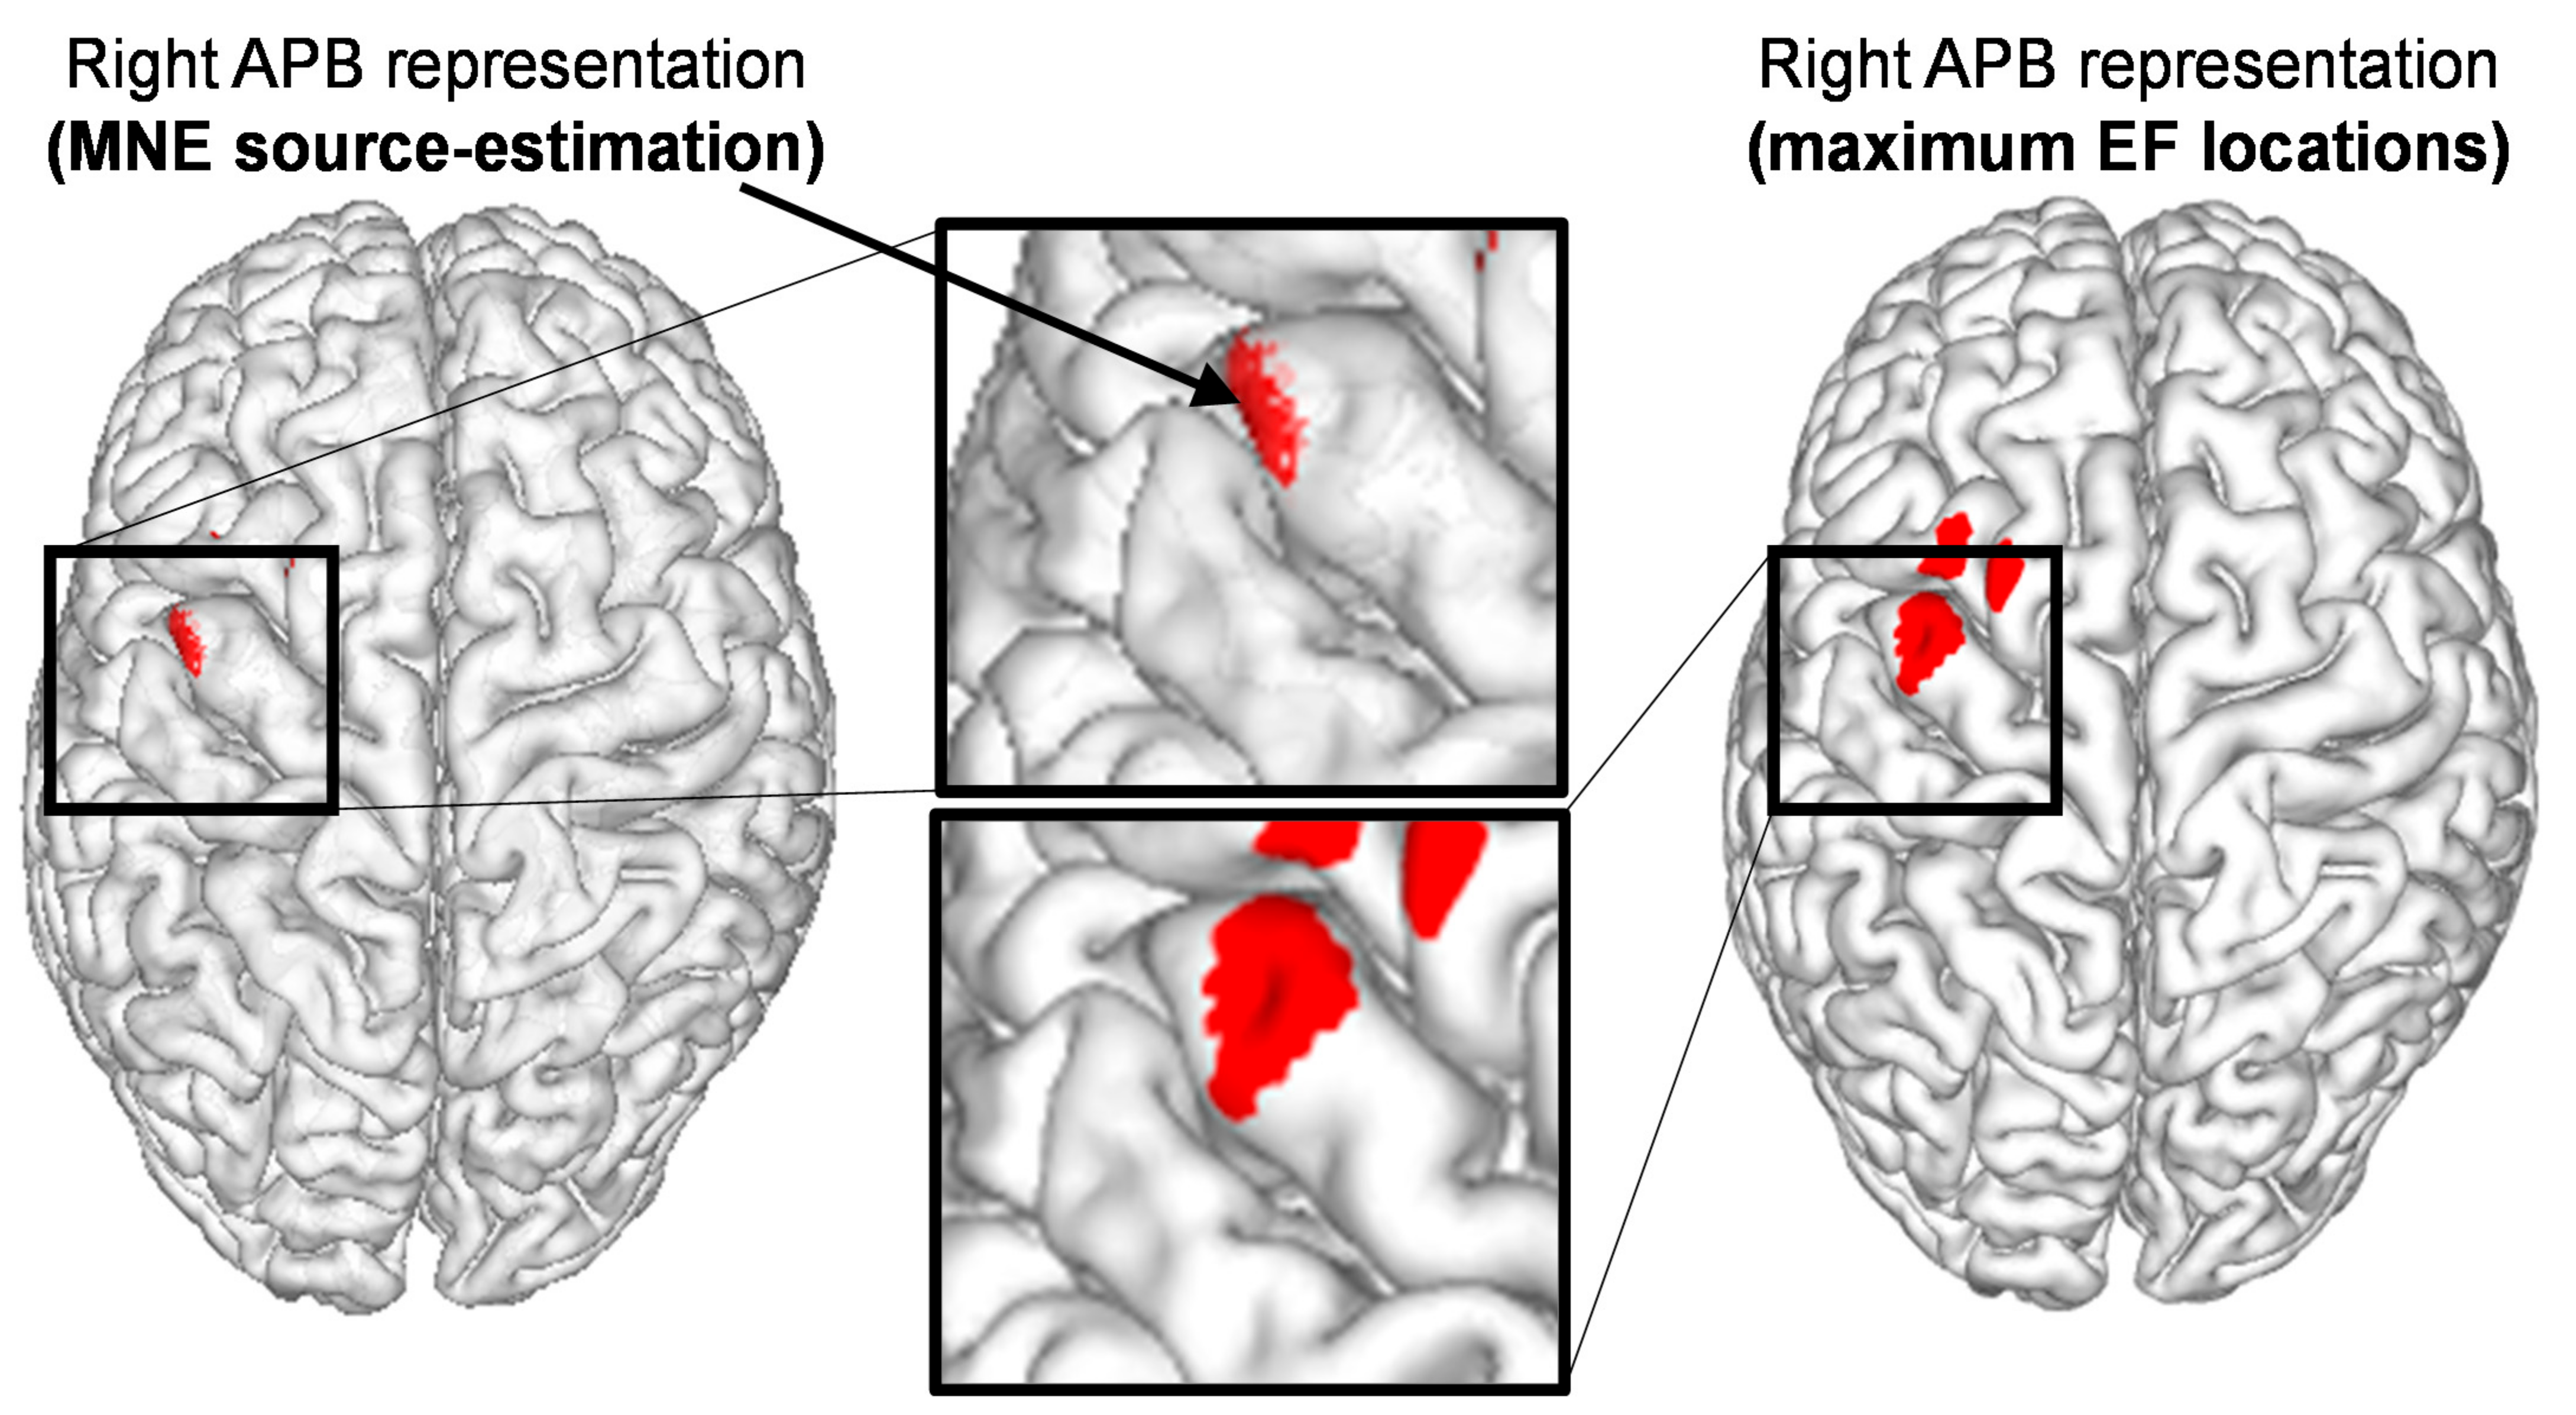
3.6. Other Quantitative Parameters in Motor Maps
4. Perspectives and Future Directions
5. Conclusions
Author Contributions
Funding
Institutional Review Board Statement
Informed Consent Statement
Acknowledgments
Conflicts of Interest
Abbreviations
| ADC | Apparent diffusion coefficient |
| ADM | Abductor digiti minimi |
| AED | Antiepileptic drug |
| aMT | Active motor threshold |
| APB | Abductor pollicis brevis |
| ATH | Adaptive threshold hunting |
| BMRC | British Medical Research Council |
| CoG | Center of gravity |
| CST | Corticospinal tract |
| CT | Computed tomography |
| DES | Direct electrical stimulation |
| DOF | Degrees of freedom |
| dMRI | Diffusion magnetic resonance imaging |
| EF | Electric field |
| EOR | Extent of resection |
| FA | Fractional anisotropy |
| FACT | Fiber assignment by continuous tracking |
| FAT | Fractional anisotropy threshold |
| FCR | Flexor carpi radialis |
| FDI | First dorsal interosseous |
| FGR | Fluorescein-guided resection |
| FL | Fiber length |
| fMRI | Functional MRI |
| GBM | Glioblastoma multiforme |
| GTR | Gross total resection |
| HGG | High-grade glioma |
| IONM | Intraoperative neuromonitoring |
| IR | Infrared |
| KPS | Karnofsky performance status |
| lE | Lower extremity |
| LGG | Low-grade glioma |
| MD | Mean diffusivity |
| MEG | Magnetoencephalography |
| MEN | Meningioma |
| MEP | Motor-evoked potential |
| MET | Metastasis |
| MNE | Minimum norm estimation |
| MSO | Maximum stimulator output |
| nTMS | Navigated transcranial magnetic stimulation |
| PACS | Picture archiving and communication system |
| PET | Positron emission tomography |
| PFS | Progression-free survival |
| pp-nTMS | Paired-pulse navigated transcranial magnetic stimulation |
| PTV | Planning target volume |
| rMT | Resting motor threshold |
| ROI | Region of interest |
| SI | Stimulation intensity |
| TA | Tibialis anterior |
| uE | Upper extremity |
| UT | Upper threshold |
| WHO | World Health Organization |
References
- Ruohonen, J.; Karhu, J. Navigated transcranial magnetic stimulation. Clin. Neurophysiol. 2010, 40, 7–17. [Google Scholar] [CrossRef]
- Krings, T.; Buchbinder, B.R.; Butler, W.E.; Chiappa, K.H.; Jiang, H.J.; Rosen, B.R.; Cosgrove, G.R. Stereotactic transcranial magnetic stimulation: Correlation with direct electrical cortical stimulation. Neurosurgery 1997, 41, 1319–1326. [Google Scholar] [CrossRef]
- Krings, T.; Naujokat, C.; von Keyserlingk, D.G. Representation of cortical motor function as revealed by stereotactic transcranial magnetic stimulation. Electroencephalogr. Clin. Neurophysiol. 1998, 109, 85–93. [Google Scholar] [CrossRef]
- Krings, T.; Chiappa, K.H.; Foltys, H.; Reinges, M.H.; Cosgrove, G.R.; Thron, A. Introducing navigated transcranial magnetic stimulation as a refined brain mapping methodology. Neurosurg. Rev. 2001, 24, 171–179. [Google Scholar] [CrossRef]
- Ruohonen, J.; Ilmoniemi, R.J. Modeling of the stimulating field generation in TMS. Electroencephalogr. Clin. Neurophysiol. Suppl. 1999, 51, 30–40. [Google Scholar]
- Sollmann, N.; Goblirsch-Kolb, M.F.; Ille, S.; Butenschoen, V.M.; Boeckh-Behrens, T.; Meyer, B.; Ringel, F.; Krieg, S.M. Comparison between electric-field-navigated and line-navigated TMS for cortical motor mapping in patients with brain tumors. Acta Neurochir. 2016, 158, 2277–2289. [Google Scholar] [CrossRef]
- Bijsterbosch, J.D.; Barker, A.T.; Lee, K.H.; Woodruff, P.W. Where does transcranial magnetic stimulation (TMS) stimulate? Modelling of induced field maps for some common cortical and cerebellar targets. Med. Biol. Eng. Comput. 2012, 50, 671–681. [Google Scholar] [CrossRef]
- Lefaucheur, J.P.; Picht, T. The value of preoperative functional cortical mapping using navigated TMS. Clin. Neurophysiol. 2016, 46, 125–133. [Google Scholar] [CrossRef]
- Haddad, A.F.; Young, J.S.; Berger, M.S.; Tarapore, P.E. Preoperative applications of navigated transcranial magnetic stimulation. Front. Neurol. 2020, 11, 628903. [Google Scholar] [CrossRef]
- Raffa, G.; Scibilia, A.; Conti, A.; Ricciardo, G.; Rizzo, V.; Morelli, A.; Angileri, F.F.; Cardali, S.M.; Germano, A. The role of navigated transcranial magnetic stimulation for surgery of motor-eloquent brain tumors: A systematic review and meta-analysis. Clin. Neurol. Neurosurg. 2019, 180, 7–17. [Google Scholar] [CrossRef]
- Picht, T. Current and potential utility of transcranial magnetic stimulation in the diagnostics before brain tumor surgery. CNS Oncol. 2014, 3, 299–310. [Google Scholar] [CrossRef]
- Duffau, H.; Mandonnet, E. The “onco-functional balance” in surgery for diffuse low-grade glioma: Integrating the extent of resection with quality of life. Acta Neurochir. 2013, 155, 951–957. [Google Scholar] [CrossRef]
- Pope, W.B.; Sayre, J.; Perlina, A.; Villablanca, J.P.; Mischel, P.S.; Cloughesy, T.F. MR imaging correlates of survival in patients with high-grade gliomas. AJNR Am. J. Neuroradiol. 2005, 26, 2466–2474. [Google Scholar]
- Molinaro, A.M.; Hervey-Jumper, S.; Morshed, R.A.; Young, J.; Han, S.J.; Chunduru, P.; Zhang, Y.; Phillips, J.J.; Shai, A.; Lafontaine, M.; et al. Association of maximal extent of resection of contrast-enhanced and non-contrast-enhanced tumor with survival within molecular subgroups of patients with newly diagnosed glioblastoma. JAMA Oncol. 2020. [Google Scholar] [CrossRef]
- Brown, P.D.; Maurer, M.J.; Rummans, T.A.; Pollock, B.E.; Ballman, K.V.; Sloan, J.A.; Boeve, B.F.; Arusell, R.M.; Clark, M.M.; Buckner, J.C. A prospective study of quality of life in adults with newly diagnosed high-grade gliomas: The impact of the extent of resection on quality of life and survival. Neurosurgery 2005, 57, 495–504. [Google Scholar] [CrossRef]
- Haj, A.; Doenitz, C.; Schebesch, K.M.; Ehrensberger, D.; Hau, P.; Putnik, K.; Riemenschneider, M.J.; Wendl, C.; Gerken, M.; Pukrop, T.; et al. Extent of resection in newly diagnosed glioblastoma: Impact of a specialized neuro-oncology care center. Brain Sci. 2017, 8, 5. [Google Scholar] [CrossRef] [Green Version]
- Ammirati, M.; Vick, N.; Liao, Y.L.; Ciric, I.; Mikhael, M. Effect of the extent of surgical resection on survival and quality of life in patients with supratentorial glioblastomas and anaplastic astrocytomas. Neurosurgery 1987, 21, 201–206. [Google Scholar] [CrossRef]
- Hervey-Jumper, S.L.; Berger, M.S. Evidence for Improving Outcome Through Extent of Resection. Neurosurg. Clin. N. Am. 2019, 30, 85–93. [Google Scholar] [CrossRef]
- Szelenyi, A.; Bello, L.; Duffau, H.; Fava, E.; Feigl, G.C.; Galanda, M.; Neuloh, G.; Signorelli, F.; Sala, F.; Workgroup for intraoperative management in low-grade glioma surgery within the european low-grade glioma. Intraoperative electrical stimulation in awake craniotomy: Methodological aspects of current practice. Neurosurg. Focus 2010, 28, E7. [Google Scholar] [CrossRef]
- Duffau, H. Lessons from brain mapping in surgery for low-grade glioma: Insights into associations between tumour and brain plasticity. Lancet. Neurol. 2005, 4, 476–486. [Google Scholar] [CrossRef]
- De Witt Hamer, P.C.; Robles, S.G.; Zwinderman, A.H.; Duffau, H.; Berger, M.S. Impact of intraoperative stimulation brain mapping on glioma surgery outcome: A meta-analysis. J. Clin. Oncol. 2012, 30, 2559–2565. [Google Scholar] [CrossRef] [Green Version]
- Mandonnet, E.; Winkler, P.A.; Duffau, H. Direct electrical stimulation as an input gate into brain functional networks: Principles, advantages and limitations. Acta Neurochir. 2010, 152, 185–193. [Google Scholar] [CrossRef]
- Hervey-Jumper, S.L.; Berger, M.S. Maximizing safe resection of low- and high-grade glioma. J. Neurooncol. 2016, 130, 269–282. [Google Scholar] [CrossRef]
- Van de Ruit, M.; Grey, M.J. The TMS map scales with increased stimulation intensity and muscle activation. Brain Topogr. 2016, 29, 56–66. [Google Scholar] [CrossRef] [Green Version]
- Kallioniemi, E.; Julkunen, P. Alternative stimulation intensities for mapping cortical motor area with navigated TMS. Brain Topogr. 2016, 29, 395–404. [Google Scholar] [CrossRef]
- Sinitsyn, D.O.; Chernyavskiy, A.Y.; Poydasheva, A.G.; Bakulin, I.S.; Suponeva, N.A.; Piradov, M.A. Optimization of the navigated TMS mapping algorithm for accurate estimation of cortical muscle representation characteristics. Brain Sci. 2019, 9, 88. [Google Scholar] [CrossRef] [Green Version]
- Julkunen, P. Methods for estimating cortical motor representation size and location in navigated transcranial magnetic stimulation. J. Neurosci. Methods 2014, 232, 125–133. [Google Scholar] [CrossRef]
- Wolf, S.L.; Butler, A.J.; Campana, G.I.; Parris, T.A.; Struys, D.M.; Weinstein, S.R.; Weiss, P. Intra-subject reliability of parameters contributing to maps generated by transcranial magnetic stimulation in able-bodied adults. Clin. Neurophysiol. 2004, 115, 1740–1747. [Google Scholar] [CrossRef]
- Reijonen, J.; Pitkanen, M.; Kallioniemi, E.; Mohammadi, A.; Ilmoniemi, R.J.; Julkunen, P. Spatial extent of cortical motor hotspot in navigated transcranial magnetic stimulation. J. Neurosci. Methods 2020, 346, 108893. [Google Scholar] [CrossRef]
- Ngomo, S.; Leonard, G.; Moffet, H.; Mercier, C. Comparison of transcranial magnetic stimulation measures obtained at rest and under active conditions and their reliability. J. Neurosci. Methods 2012, 205, 65–71. [Google Scholar] [CrossRef] [Green Version]
- Kraus, D.; Gharabaghi, A. Neuromuscular plasticity: Disentangling stable and variable motor maps in the human sensorimotor cortex. Neural. Plast. 2016, 2016, 7365609. [Google Scholar] [CrossRef] [PubMed]
- Coburger, J.; Musahl, C.; Weissbach, C.; Bittl, M. Navigated transcranial magnetic stimulation-guided resection of a left parietal tumor: Case report. Minim. Invasive Neurosurg. 2011, 54, 38–40. [Google Scholar] [CrossRef] [PubMed]
- Picht, T.; Schmidt, S.; Woitzik, J.; Suess, O. Navigated brain stimulation for preoperative cortical mapping in paretic patients: Case report of a hemiplegic patient. Neurosurgery 2011, 68, E1475–E1480. [Google Scholar] [CrossRef] [PubMed]
- Coburger, J.; Karhu, J.; Bittl, M.; Hopf, N.J. First preoperative functional mapping via navigated transcranial magnetic stimulation in a 3-year-old boy. J. Neurosurg. Pediatrics 2012, 9, 660–664. [Google Scholar] [CrossRef]
- Picht, T.; Schmidt, S.; Brandt, S.; Frey, D.; Hannula, H.; Neuvonen, T.; Karhu, J.; Vajkoczy, P.; Suess, O. Preoperative functional mapping for rolandic brain tumor surgery: Comparison of navigated transcranial magnetic stimulation to direct cortical stimulation. Neurosurgery 2011, 69, 581–588. [Google Scholar] [CrossRef]
- Coburger, J.; Musahl, C.; Henkes, H.; Horvath-Rizea, D.; Bittl, M.; Weissbach, C.; Hopf, N. Comparison of navigated transcranial magnetic stimulation and functional magnetic resonance imaging for preoperative mapping in rolandic tumor surgery. Neurosurg. Rev. 2013, 36, 65–76. [Google Scholar] [CrossRef]
- Forster, M.T.; Hattingen, E.; Senft, C.; Gasser, T.; Seifert, V.; Szelenyi, A. Navigated transcranial magnetic stimulation and functional magnetic resonance imaging: Advanced adjuncts in preoperative planning for central region tumors. Neurosurgery 2011, 68, 1317–1325. [Google Scholar] [CrossRef] [Green Version]
- Krieg, S.M.; Shiban, E.; Buchmann, N.; Gempt, J.; Foerschler, A.; Meyer, B.; Ringel, F. Utility of presurgical navigated transcranial magnetic brain stimulation for the resection of tumors in eloquent motor areas. J. Neurosurg. 2012, 116, 994–1001. [Google Scholar] [CrossRef]
- Krieg, S.M.; Shiban, E.; Buchmann, N.; Meyer, B.; Ringel, F. Presurgical navigated transcranial magnetic brain stimulation for recurrent gliomas in motor eloquent areas. Clin. Neurophysiol. 2013, 124, 522–527. [Google Scholar] [CrossRef]
- Mangraviti, A.; Casali, C.; Cordella, R.; Legnani, F.G.; Mattei, L.; Prada, F.; Saladino, A.; Contarino, V.E.; Perin, A.; DiMeco, F. Practical assessment of preoperative functional mapping techniques: Navigated transcranial magnetic stimulation and functional magnetic resonance imaging. Neurol. Sci. 2013, 34, 1551–1557. [Google Scholar] [CrossRef]
- Weiss Lucas, C.; Nettekoven, C.; Neuschmelting, V.; Oros-Peusquens, A.M.; Stoffels, G.; Viswanathan, S.; Rehme, A.K.; Faymonville, A.M.; Shah, N.J.; Langen, K.J.; et al. Invasive versus non-invasive mapping of the motor cortex. Hum. Brain Mapp. 2020, 41, 3970–3983. [Google Scholar] [CrossRef]
- Tarapore, P.E.; Tate, M.C.; Findlay, A.M.; Honma, S.M.; Mizuiri, D.; Berger, M.S.; Nagarajan, S.S. Preoperative multimodal motor mapping: A comparison of magnetoencephalography imaging, navigated transcranial magnetic stimulation, and direct cortical stimulation. J. Neurosurg. 2012, 117, 354–362. [Google Scholar] [CrossRef] [Green Version]
- Picht, T.; Schulz, J.; Hanna, M.; Schmidt, S.; Suess, O.; Vajkoczy, P. Assessment of the influence of navigated transcranial magnetic stimulation on surgical planning for tumors in or near the motor cortex. Neurosurgery 2012, 70, 1248–1257. [Google Scholar] [CrossRef] [Green Version]
- Rizzo, V.; Terranova, C.; Conti, A.; Germano, A.; Alafaci, C.; Raffa, G.; Girlanda, P.; Tomasello, F.; Quartarone, A. Preoperative functional mapping for rolandic brain tumor surgery. Neurosci. Lett. 2014, 583, 136–141. [Google Scholar] [CrossRef]
- Zdunczyk, A.; Fleischmann, R.; Schulz, J.; Vajkoczy, P.; Picht, T. The reliability of topographic measurements from navigated transcranial magnetic stimulation in healthy volunteers and tumor patients. Acta Neurochir. 2013, 155, 1309–1317. [Google Scholar] [CrossRef] [PubMed]
- Sollmann, N.; Bulubas, L.; Tanigawa, N.; Zimmer, C.; Meyer, B.; Krieg, S.M. The variability of motor evoked potential latencies in neurosurgical motor mapping by preoperative navigated transcranial magnetic stimulation. BMC Neurosci. 2017, 18, 5. [Google Scholar] [CrossRef] [PubMed] [Green Version]
- Sollmann, N.; Tanigawa, N.; Bulubas, L.; Sabih, J.; Zimmer, C.; Ringel, F.; Meyer, B.; Krieg, S.M. Clinical factors underlying the inter-individual variability of the resting motor threshold in navigated transcranial magnetic stimulation motor mapping. Brain Topogr. 2017, 30, 98–121. [Google Scholar] [CrossRef]
- Lavrador, J.P.; Gioti, I.; Hoppe, S.; Jung, J.; Patel, S.; Gullan, R.; Ashkan, K.; Bhangoo, R.; Vergani, F. Altered motor excitability in patients with diffuse gliomas involving motor eloquent areas: The impact of tumor grading. Neurosurgery 2020, 88, 183–192. [Google Scholar] [CrossRef] [PubMed]
- Lam, S.; Lucente, G.; Schneider, H.; Picht, T. TMS motor mapping in brain tumor patients: More robust maps with an increased resting motor threshold. Acta Neurochir. 2019, 161, 995–1002. [Google Scholar] [CrossRef]
- Mirbagheri, A.; Schneider, H.; Zdunczyk, A.; Vajkoczy, P.; Picht, T. NTMS mapping of non-primary motor areas in brain tumour patients and healthy volunteers. Acta Neurochir. 2020, 162, 407–416. [Google Scholar] [CrossRef]
- Krieg, S.M.; Buchmann, N.H.; Gempt, J.; Shiban, E.; Meyer, B.; Ringel, F. Diffusion tensor imaging fiber tracking using navigated brain stimulation—A feasibility study. Acta Neurochir. 2012, 154, 555–563. [Google Scholar] [CrossRef] [PubMed]
- Frey, D.; Strack, V.; Wiener, E.; Jussen, D.; Vajkoczy, P.; Picht, T. A new approach for corticospinal tract reconstruction based on navigated transcranial stimulation and standardized fractional anisotropy values. NeuroImage 2012, 62, 1600–1609. [Google Scholar] [CrossRef] [PubMed]
- Conti, A.; Raffa, G.; Granata, F.; Rizzo, V.; Germano, A.; Tomasello, F. Navigated transcranial magnetic stimulation for “somatotopic” tractography of the corticospinal tract. Neurosurgery 2014, 10 (Suppl. 4), 542–554. [Google Scholar] [CrossRef] [PubMed]
- Weiss, C.; Tursunova, I.; Neuschmelting, V.; Lockau, H.; Nettekoven, C.; Oros-Peusquens, A.M.; Stoffels, G.; Rehme, A.K.; Faymonville, A.M.; Shah, N.J.; et al. Improved nTMS- and DTI-derived CST tractography through anatomical ROI seeding on anterior pontine level compared to internal capsule. NeuroImage. Clin. 2015, 7, 424–437. [Google Scholar] [CrossRef] [Green Version]
- Weiss Lucas, C.; Tursunova, I.; Neuschmelting, V.; Nettekoven, C.; Oros-Peusquens, A.M.; Stoffels, G.; Faymonville, A.M.; Jon, S.N.; Langen, K.J.; Lockau, H.; et al. Functional MRI vs. navigated TMS to optimize M1 seed volume delineation for DTI tractography. A prospective study in patients with brain tumours adjacent to the corticospinal tract. NeuroImage. Clin. 2017, 13, 297–309. [Google Scholar] [CrossRef] [PubMed] [Green Version]
- Munnich, T.; Klein, J.; Hattingen, E.; Noack, A.; Herrmann, E.; Seifert, V.; Senft, C.; Forster, M.T. Tractography verified by intraoperative magnetic resonance imaging and subcortical stimulation during tumor resection near the corticospinal tract. Oper. Neurosurg. (Hagerstown) 2019, 16, 197–210. [Google Scholar] [CrossRef] [PubMed]
- Picht, T.; Schulz, J.; Vajkoczy, P. The preoperative use of navigated transcranial magnetic stimulation facilitates early resection of suspected low-grade gliomas in the motor cortex. Acta Neurochir. 2013, 155, 1813–1821. [Google Scholar] [CrossRef]
- Frey, D.; Schilt, S.; Strack, V.; Zdunczyk, A.; Rosler, J.; Niraula, B.; Vajkoczy, P.; Picht, T. Navigated transcranial magnetic stimulation improves the treatment outcome in patients with brain tumors in motor eloquent locations. Neuro-oncol. 2014, 16, 1365–1372. [Google Scholar] [CrossRef] [Green Version]
- Krieg, S.M.; Sabih, J.; Bulubasova, L.; Obermueller, T.; Negwer, C.; Janssen, I.; Shiban, E.; Meyer, B.; Ringel, F. Preoperative motor mapping by navigated transcranial magnetic brain stimulation improves outcome for motor eloquent lesions. Neuro-oncol. 2014, 16, 1274–1282. [Google Scholar] [CrossRef] [Green Version]
- Raffa, G.; Conti, A.; Scibilia, A.; Cardali, S.M.; Esposito, F.; Angileri, F.F.; La Torre, D.; Sindorio, C.; Abbritti, R.V.; Germano, A.; et al. The impact of diffusion tensor imaging fiber tracking of the corticospinal tract based on navigated transcranial magnetic stimulation on surgery of motor-eloquent brain lesions. Neurosurgery 2018, 83, 768–782. [Google Scholar] [CrossRef]
- Krieg, S.M.; Sollmann, N.; Obermueller, T.; Sabih, J.; Bulubas, L.; Negwer, C.; Moser, T.; Droese, D.; Boeckh-Behrens, T.; Ringel, F.; et al. Changing the clinical course of glioma patients by preoperative motor mapping with navigated transcranial magnetic brain stimulation. BMC Cancer 2015, 15, 231. [Google Scholar] [CrossRef] [Green Version]
- Picht, T.; Frey, D.; Thieme, S.; Kliesch, S.; Vajkoczy, P. Presurgical navigated TMS motor cortex mapping improves outcome in glioblastoma surgery: A controlled observational study. J. Neurooncol. 2016, 126, 535–543. [Google Scholar] [CrossRef] [PubMed]
- Hendrix, P.; Senger, S.; Griessenauer, C.J.; Simgen, A.; Schwerdtfeger, K.; Oertel, J. Preoperative navigated transcranial magnetic stimulation in patients with motor eloquent lesions with emphasis on metastasis. Clin. Anat. 2016, 29, 925–931. [Google Scholar] [CrossRef] [PubMed]
- Krieg, S.M.; Picht, T.; Sollmann, N.; Bahrend, I.; Ringel, F.; Nagarajan, S.S.; Meyer, B.; Tarapore, P.E. Resection of motor eloquent metastases aided by preoperative nTMS-based motor maps-comparison of two observational cohorts. Front. Oncol. 2016, 6, 261. [Google Scholar] [CrossRef] [PubMed] [Green Version]
- Raffa, G.; Picht, T.; Scibilia, A.; Rosler, J.; Rein, J.; Conti, A.; Ricciardo, G.; Cardali, S.M.; Vajkoczy, P.; Germano, A. Surgical treatment of meningiomas located in the rolandic area: The role of navigated transcranial magnetic stimulation for preoperative planning, surgical strategy, and prediction of arachnoidal cleavage and motor outcome. J. Neurosurg. 2019, 1–12. [Google Scholar] [CrossRef]
- Raffa, G.; Picht, T.; Angileri, F.F.; Youssef, M.; Conti, A.; Esposito, F.; Cardali, S.M.; Vajkoczy, P.; Germano, A. Surgery of malignant motor-eloquent gliomas guided by sodium-fluorescein and navigated transcranial magnetic stimulation: A novel technique to increase the maximal safe resection. J. Neurosurg. Sci. 2019, 63, 670–678. [Google Scholar] [CrossRef]
- Raffa, G.; Scibilia, A.; Conti, A.; Cardali, S.M.; Rizzo, V.; Terranova, C.; Quattropani, M.C.; Marzano, G.; Ricciardo, G.; Vinci, S.L.; et al. Multimodal Surgical Treatment of High-Grade Gliomas in the Motor Area: The impact of the combination of navigated transcranial magnetic stimulation and fluorescein-guided resection. World Neurosurg. 2019, 128, e378–e390. [Google Scholar] [CrossRef]
- Moser, T.; Bulubas, L.; Sabih, J.; Conway, N.; Wildschutz, N.; Sollmann, N.; Meyer, B.; Ringel, F.; Krieg, S.M. Resection of navigated transcranial magnetic stimulation-positive prerolandic motor areas causes permanent impairment of motor function. Neurosurgery 2017, 81, 99–110. [Google Scholar] [CrossRef]
- Picht, T.; Strack, V.; Schulz, J.; Zdunczyk, A.; Frey, D.; Schmidt, S.; Vajkoczy, P. Assessing the functional status of the motor system in brain tumor patients using transcranial magnetic stimulation. Acta Neurochirur. 2012, 154, 2075–2081. [Google Scholar] [CrossRef]
- Rosenstock, T.; Grittner, U.; Acker, G.; Schwarzer, V.; Kulchytska, N.; Vajkoczy, P.; Picht, T. Risk stratification in motor area-related glioma surgery based on navigated transcranial magnetic stimulation data. J. Neurosurg. 2017, 126, 1227–1237. [Google Scholar] [CrossRef] [Green Version]
- Sollmann, N.; Wildschuetz, N.; Kelm, A.; Conway, N.; Moser, T.; Bulubas, L.; Kirschke, J.S.; Meyer, B.; Krieg, S.M. Associations between clinical outcome and navigated transcranial magnetic stimulation characteristics in patients with motor-eloquent brain lesions: A combined navigated transcranial magnetic stimulation-diffusion tensor imaging fiber tracking approach. J. Neurosurg. 2018, 128, 800–810. [Google Scholar] [CrossRef] [PubMed]
- Rosenstock, T.; Giampiccolo, D.; Schneider, H.; Runge, S.J.; Bahrend, I.; Vajkoczy, P.; Picht, T. Specific DTI seeding and diffusivity-analysis improve the quality and prognostic value of TMS-based deterministic DTI of the pyramidal tract. NeuroImage. Clin. 2017, 16, 276–285. [Google Scholar] [CrossRef] [PubMed]
- Seidel, K.; Hani, L.; Lutz, K.; Zbinden, C.; Redmann, A.; Consuegra, A.; Raabe, A.; Schucht, P. Postoperative navigated transcranial magnetic stimulation to predict motor recovery after surgery of tumors in motor eloquent areas. Clin. Neurophysiol. 2019, 130, 952–959. [Google Scholar] [CrossRef]
- Neuschmelting, V.; Weiss Lucas, C.; Stoffels, G.; Oros-Peusquens, A.M.; Lockau, H.; Shah, N.J.; Langen, K.J.; Goldbrunner, R.; Grefkes, C. Multimodal imaging in malignant brain tumors: Enhancing the preoperative risk evaluation for motor deficits with a combined hybrid MRI-PET and navigated transcranial magnetic stimulation approach. AJNR Am. J. Neuroradiol. 2016, 37, 266–273. [Google Scholar] [CrossRef] [PubMed] [Green Version]
- Forster, M.T.; Senft, C.; Hattingen, E.; Lorei, M.; Seifert, V.; Szelenyi, A. Motor cortex evaluation by nTMS after surgery of central region tumors: A feasibility study. Acta Neurochir. 2012, 154, 1351–1359. [Google Scholar] [CrossRef] [PubMed]
- Takahashi, S.; Vajkoczy, P.; Picht, T. Navigated transcranial magnetic stimulation for mapping the motor cortex in patients with rolandic brain tumors. Neurosur. Focus 2013, 34, E3. [Google Scholar] [CrossRef] [PubMed]
- Bulubas, L.; Sabih, J.; Wohlschlaeger, A.; Sollmann, N.; Hauck, T.; Ille, S.; Ringel, F.; Meyer, B.; Krieg, S.M. Motor areas of the frontal cortex in patients with motor eloquent brain lesions. J. Neurosurg. 2016, 1–12. [Google Scholar] [CrossRef] [Green Version]
- Bulubas, L.; Sollmann, N.; Tanigawa, N.; Zimmer, C.; Meyer, B.; Krieg, S.M. Reorganization of motor representations in patients with brain lesions: A navigated transcranial magnetic stimulation study. Brain Topogr. 2018, 31, 288–299. [Google Scholar] [CrossRef] [PubMed]
- Barz, A.; Noack, A.; Baumgarten, P.; Seifert, V.; Forster, M.T. Motor cortex reorganization in patients with glioma assessed by repeated navigated transcranial magnetic stimulation- A longitudinal study. World Neurosurg. 2018, 112, e442–e453. [Google Scholar] [CrossRef] [PubMed]
- Conway, N.; Wildschuetz, N.; Moser, T.; Bulubas, L.; Sollmann, N.; Tanigawa, N.; Meyer, B.; Krieg, S.M. Cortical plasticity of motor-eloquent areas measured by navigated transcranial magnetic stimulation in patients with glioma. J. Neurosurg. 2017, 1–11. [Google Scholar] [CrossRef]
- Sollmann, N.; Laub, T.; Kelm, A.; Albers, L.; Kirschke, J.S.; Combs, S.E.; Meyer, B.; Krieg, S.M. Predicting brain tumor regrowth in relation to motor areas by functional brain mapping. Neurooncol. Pract. 2018, 5, 82–95. [Google Scholar] [CrossRef] [PubMed]
- Sollmann, N.; Meyer, B.; Krieg, S.M. Implementing functional preoperative mapping in the clinical routine of a neurosurgical department: Technical note. World Neurosurg. 2017, 103, 94–105. [Google Scholar] [CrossRef]
- Conti, A.; Pontoriero, A.; Ricciardi, G.K.; Granata, F.; Vinci, S.; Angileri, F.F.; Pergolizzi, S.; Alafaci, C.; Rizzo, V.; Quartarone, A.; et al. Integration of functional neuroimaging in CyberKnife radiosurgery: Feasibility and dosimetric results. Neurosur. Focus 2013, 34, E5. [Google Scholar] [CrossRef] [PubMed] [Green Version]
- Diehl, C.D.; Schwendner, M.J.; Sollmann, N.; Oechsner, M.; Meyer, B.; Combs, S.E.; Krieg, S.M. Application of presurgical navigated transcranial magnetic stimulation motor mapping for adjuvant radiotherapy planning in patients with high-grade gliomas. Radiother. Oncol. 2019, 138, 30–37. [Google Scholar] [CrossRef]
- Schwendner, M.J.; Sollmann, N.; Diehl, C.D.; Oechsner, M.; Meyer, B.; Krieg, S.M.; Combs, S.E. The role of navigated transcranial magnetic stimulation motor mapping in adjuvant radiotherapy planning in patients with supratentorial brain metastases. Front. Oncol. 2018, 8, 424. [Google Scholar] [CrossRef]
- Picht, T.; Schilt, S.; Frey, D.; Vajkoczy, P.; Kufeld, M. Integration of navigated brain stimulation data into radiosurgical planning: Potential benefits and dangers. Acta Neurochir. 2014, 156, 1125–1133. [Google Scholar] [CrossRef]
- Tokarev, A.S.; Rak, V.A.; Sinkin, M.V.; Evdokimova, O.L.; Stepanov, V.N.; Koynash, G.V.; Krieg, S.M.; Krylov, V.V. Appliance of navigated transcranial magnetic stimulation in radiosurgery for brain metastases. J. Clin. Neurophysiol. 2020, 37, 50–55. [Google Scholar] [CrossRef]
- Hendrix, P.; Senger, S.; Griessenauer, C.J.; Simgen, A.; Linsler, S.; Oertel, J. Preoperative navigated transcranial magnetic stimulation and tractography in transparietal approach to the trigone of the lateral ventricle. J. Clin. Neurosci. 2017, 41, 154–161. [Google Scholar] [CrossRef] [PubMed]
- Hendrix, P.; Senger, S.; Griessenauer, C.J.; Simgen, A.; Linsler, S.; Oertel, J. Preoperative navigated transcranial magnetic stimulation and tractography to guide endoscopic cystoventriculostomy: A technical note and case report. World Neurosurg. 2018, 109, 209–217. [Google Scholar] [CrossRef] [PubMed]
- Bartek, J., Jr.; Cooray, G.; Islam, M.; Jensdottir, M. Stereotactic brain biopsy in eloquent areas assisted by navigated transcranial magnetic stimulation: A technical case report. Oper. Neurosurg. 2019, 17, E124–E129. [Google Scholar] [CrossRef]
- Schramm, S.; Haddad, A.F.; Chyall, L.; Krieg, S.M.; Sollmann, N.; Tarapore, P.E. Navigated TMS in the ICU: Introducing motor mapping to the critical care setting. Brain Sci. 2020, 10, 1005. [Google Scholar] [CrossRef] [PubMed]
- Ferreira Pinto, P.; Nigri, F.; Caparelli-Daquer, E.M.; Viana, J.D.S. Computed tomography-guided navigated transcranial magnetic stimulation for preoperative brain motor mapping in brain lesion resection: A case report. Surg. Neurol. Int. 2019, 10, 134. [Google Scholar] [CrossRef]
- Krieg, S.M.; Lioumis, P.; Makela, J.P.; Wilenius, J.; Karhu, J.; Hannula, H.; Savolainen, P.; Lucas, C.W.; Seidel, K.; Laakso, A.; et al. Protocol for motor and language mapping by navigated TMS in patients and healthy volunteers; workshop report. Acta Neurochir. 2017, 159, 1187–1195. [Google Scholar] [CrossRef] [PubMed] [Green Version]
- Te, M.; Baptista, A.F.; Chipchase, L.S.; Schabrun, S.M. Primary motor cortex organization is altered in persistent patellofemoral pain. Pain Med. 2017, 18, 2224–2234. [Google Scholar] [CrossRef]
- Saisanen, L.; Kononen, M.; Niskanen, E.; Lakka, T.; Lintu, N.; Vanninen, R.; Julkunen, P.; Maatta, S. Primary hand motor representation areas in healthy children, preadolescents, adolescents, and adults. Neuroimage 2021, 228. [Google Scholar] [CrossRef] [PubMed]
- Novikov, P.A.; Nazarova, M.A.; Nikulin, V.V. TMSmap—Software for quantitative analysis of TMS mapping results. Front. Hum. Neurosci. 2018, 12, 239. [Google Scholar] [CrossRef] [PubMed]
- Melgari, J.M.; Pasqualetti, P.; Pauri, F.; Rossini, P.M. Muscles in “concert”: Study of primary motor cortex upper limb functional topography. PLoS ONE 2008, 3, e3069. [Google Scholar] [CrossRef] [PubMed]
- Nazarova, M.; Novikov, P.; Ivanina, E.; Kozlova, K.; Dobrynina, L.; Nikulin, V.V. Mapping of multiple muscles with transcranial magnetic stimulation: Absolute and relative test-retest reliability. Hum. Brain Mapp. 2021, 42, 2508–2528. [Google Scholar] [CrossRef] [PubMed]
- Davies, J.L. Using transcranial magnetic stimulation to map the cortical representation of lower-limb muscles. Clin. Neurophysiol. Pract. 2020, 5, 87–99. [Google Scholar] [CrossRef]
- Castrillon, G.; Sollmann, N.; Kurcyus, K.; Razi, A.; Krieg, S.M.; Riedl, V. The physiological effects of noninvasive brain stimulation fundamentally differ across the human cortex. Sci. Adv. 2020, 6, eaay2739. [Google Scholar] [CrossRef] [Green Version]
- Zhang, H.; Sollmann, N.; Castrillon, G.; Kurcyus, K.; Meyer, B.; Zimmer, C.; Krieg, S.M. Intranetwork and internetwork effects of navigated transcranial magnetic stimulation using low- and high-frequency pulse application to the dorsolateral prefrontal cortex: A combined rTMS-fMRI approach. J. Clin. Neurophysiol. 2020, 37, 131–139. [Google Scholar] [CrossRef] [PubMed]
- Tsao, H.; Galea, M.P.; Hodges, P.W. Reorganization of the motor cortex is associated with postural control deficits in recurrent low back pain. Brain 2008, 131, 2161–2171. [Google Scholar] [CrossRef] [PubMed] [Green Version]
- Groppa, S.; Oliviero, A.; Eisen, A.; Quartarone, A.; Cohen, L.G.; Mall, V.; Kaelin-Lang, A.; Mima, T.; Rossi, S.; Thickbroom, G.W.; et al. A practical guide to diagnostic transcranial magnetic stimulation: Report of an IFCN committee. Clin. Neurophysiol. 2012, 123, 858–882. [Google Scholar] [CrossRef] [PubMed] [Green Version]
- Richter, L.; Neumann, G.; Oung, S.; Schweikard, A.; Trillenberg, P. Optimal coil orientation for transcranial magnetic stimulation. PLoS ONE 2013, 8, e60358. [Google Scholar] [CrossRef] [PubMed] [Green Version]
- Reijonen, J.; Saisanen, L.; Kononen, M.; Mohammadi, A.; Julkunen, P. The effect of coil placement and orientation on the assessment of focal excitability in motor mapping with navigated transcranial magnetic stimulation. J. Neurosci. Methods 2020, 331, 108521. [Google Scholar] [CrossRef]
- Saisanen, L.; Julkunen, P.; Kemppainen, S.; Danner, N.; Immonen, A.; Mervaala, E.; Maatta, S.; Muraja-Murro, A.; Kononen, M. Locating and outlining the cortical motor representation areas of facial muscles with navigated transcranial magnetic stimulation. Neurosurgery 2015, 77, 394–405. [Google Scholar] [CrossRef]
- Thordstein, M.; Saar, K.; Pegenius, G.; Elam, M. Individual effects of varying stimulation intensity and response criteria on area of activation for different muscles in humans. A study using navigated transcranial magnetic stimulation. Brain Stimul. 2013, 6, 49–53. [Google Scholar] [CrossRef]
- Mills, K.R.; Nithi, K.A. Corticomotor threshold to magnetic stimulation: Normal values and repeatability. Muscle Nerve 1997, 20, 570–576. [Google Scholar] [CrossRef]
- Awiszus, F. TMS and threshold hunting. Suppl. Clin. Neurophysiol. 2003, 56, 13–23. [Google Scholar]
- Julkunen, P. Mobile application for adaptive threshold hunting in transcranial magnetic stimulation. IEEE Trans. Neural. Syst. Rehabil. Eng. 2019, 27, 1504–1510. [Google Scholar] [CrossRef]
- Engelhardt, M.; Schneider, H.; Gast, T.; Picht, T. Estimation of the resting motor threshold (RMT) in transcranial magnetic stimulation using relative-frequency and threshold-hunting methods in brain tumor patients. Acta Neurochir. 2019, 161, 1845–1851. [Google Scholar] [CrossRef]
- Tranulis, C.; Gueguen, B.; Pham-Scottez, A.; Vacheron, M.N.; Cabelguen, G.; Costantini, A.; Valero, G.; Galinovski, A. Motor threshold in transcranial magnetic stimulation: Comparison of three estimation methods. Neurophysiol. Clin. 2006, 36, 1–7. [Google Scholar] [CrossRef]
- Dissanayaka, T.; Zoghi, M.; Farrell, M.; Egan, G.; Jaberzadeh, S. Comparison of Rossini-Rothwell and adaptive threshold-hunting methods on the stability of TMS induced motor evoked potentials amplitudes. J. Neurosci. Res. 2018, 96, 1758–1765. [Google Scholar] [CrossRef] [PubMed]
- Ah Sen, C.B.; Fassett, H.J.; El-Sayes, J.; Turco, C.V.; Hameer, M.M.; Nelson, A.J. Active and resting motor threshold are efficiently obtained with adaptive threshold hunting. PLoS ONE 2017, 12, e0186007. [Google Scholar] [CrossRef] [PubMed] [Green Version]
- Silbert, B.I.; Patterson, H.I.; Pevcic, D.D.; Windnagel, K.A.; Thickbroom, G.W. A comparison of relative-frequency and threshold-hunting methods to determine stimulus intensity in transcranial magnetic stimulation. Clin. Neurophysiol. 2013, 124, 708–712. [Google Scholar] [CrossRef] [PubMed]
- Saisanen, L.; Julkunen, P.; Lakka, T.; Lindi, V.; Kononen, M.; Maatta, S. Development of corticospinal motor excitability and cortical silent period from mid-childhood to adulthood—A navigated TMS study. Neurophysiol. Clin. 2018, 48, 65–75. [Google Scholar] [CrossRef] [PubMed] [Green Version]
- Pitcher, J.B.; Doeltgen, S.H.; Goldsworthy, M.R.; Schneider, L.A.; Vallence, A.M.; Smith, A.E.; Semmler, J.G.; McDonnell, M.N.; Ridding, M.C. A comparison of two methods for estimating 50% of the maximal motor evoked potential. Clin. Neurophysiol. 2015, 126, 2337–2341. [Google Scholar] [CrossRef]
- Malcolm, M.P.; Triggs, W.J.; Light, K.E.; Shechtman, O.; Khandekar, G.; Gonzalez Rothi, L.J. Reliability of motor cortex transcranial magnetic stimulation in four muscle representations. Clin. Neurophysiol. 2006, 117, 1037–1046. [Google Scholar] [CrossRef]
- Saisanen, L.; Kononen, M.; Julkunen, P.; Maatta, S.; Vanninen, R.; Immonen, A.; Jutila, L.; Kalviainen, R.; Jaaskelainen, J.E.; Mervaala, E. Non-invasive preoperative localization of primary motor cortex in epilepsy surgery by navigated transcranial magnetic stimulation. Epilepsy Res. 2010, 92, 134–144. [Google Scholar] [CrossRef]
- Schieber, M.H. Constraints on somatotopic organization in the primary motor cortex. J. Neurophysiol. 2001, 86, 2125–2143. [Google Scholar] [CrossRef]
- Thickbroom, G.W.; Sammut, R.; Mastaglia, F.L. Magnetic stimulation mapping of motor cortex: Factors contributing to map area. Electroencephalogr. Clin. Neurophysiol. 1998, 109, 79–84. [Google Scholar] [CrossRef]
- Thielscher, A.; Kammer, T. Electric field properties of two commercial figure-8 coils in TMS: Calculation of focality and efficiency. Clin. Neurophysiol. 2004, 115, 1697–1708. [Google Scholar] [CrossRef] [PubMed]
- Sommer, M.; Alfaro, A.; Rummel, M.; Speck, S.; Lang, N.; Tings, T.; Paulus, W. Half sine, monophasic and biphasic transcranial magnetic stimulation of the human motor cortex. Clin. Neurophysiol. 2006, 117, 838–844. [Google Scholar] [CrossRef]
- Hannah, R.; Rothwell, J.C. Pulse duration as well as current direction determines the specificity of transcranial magnetic stimulation of motor cortex during contraction. Brain Stimul. 2017, 10, 106–115. [Google Scholar] [CrossRef] [Green Version]
- Saisanen, L.; Julkunen, P.; Niskanen, E.; Danner, N.; Hukkanen, T.; Lohioja, T.; Nurkkala, J.; Mervaala, E.; Karhu, J.; Kononen, M. Motor potentials evoked by navigated transcranial magnetic stimulation in healthy subjects. J. Clin. Neurophysiol. 2008, 25, 367–372. [Google Scholar] [CrossRef] [PubMed]
- Danner, N.; Julkunen, P.; Kononen, M.; Saisanen, L.; Nurkkala, J.; Karhu, J. Navigated transcranial magnetic stimulation and computed electric field strength reduce stimulator-dependent differences in the motor threshold. J. Neurosci. Methods 2008, 174, 116–122. [Google Scholar] [CrossRef]
- Nieminen, J.O.; Koponen, L.M.; Ilmoniemi, R.J. Experimental characterization of the electric field distribution induced by TMS devices. Brain Stimul. 2015, 8, 582–589. [Google Scholar] [CrossRef]
- Zacharias, L.R.; Peres, A.S.C.; Souza, V.H.; Conforto, A.B.; Baffa, O. Method to assess the mismatch between the measured and nominal parameters of transcranial magnetic stimulation devices. J. Neurosci. Methods 2019, 322, 83–87. [Google Scholar] [CrossRef] [PubMed]
- McConnell, K.A.; Nahas, Z.; Shastri, A.; Lorberbaum, J.P.; Kozel, F.A.; Bohning, D.E.; George, M.S. The transcranial magnetic stimulation motor threshold depends on the distance from coil to underlying cortex: A replication in healthy adults comparing two methods of assessing the distance to cortex. Biol. Psychiatry 2001, 49, 454–459. [Google Scholar] [CrossRef]
- Stokes, M.G.; Chambers, C.D.; Gould, I.C.; Henderson, T.R.; Janko, N.E.; Allen, N.B.; Mattingley, J.B. Simple metric for scaling motor threshold based on scalp-cortex distance: Application to studies using transcranial magnetic stimulation. J. Neurophysiol. 2005, 94, 4520–4527. [Google Scholar] [CrossRef] [PubMed] [Green Version]
- Stokes, M.G.; Chambers, C.D.; Gould, I.C.; English, T.; McNaught, E.; McDonald, O.; Mattingley, J.B. Distance-adjusted motor threshold for transcranial magnetic stimulation. Clin. Neurophysiol. 2007, 118, 1617–1625. [Google Scholar] [CrossRef]
- Cai, W.; George, J.S.; Chambers, C.D.; Stokes, M.G.; Verbruggen, F.; Aron, A.R. Stimulating deep cortical structures with the batwing coil: How to determine the intensity for transcranial magnetic stimulation using coil-cortex distance. J. Neurosci. Methods 2012, 204, 238–241. [Google Scholar] [CrossRef] [PubMed] [Green Version]
- Herbsman, T.; Forster, L.; Molnar, C.; Dougherty, R.; Christie, D.; Koola, J.; Ramsey, D.; Morgan, P.S.; Bohning, D.E.; George, M.S.; et al. Motor threshold in transcranial magnetic stimulation: The impact of white matter fiber orientation and skull-to-cortex distance. Hum. Brain Mapp. 2009, 30, 2044–2055. [Google Scholar] [CrossRef] [PubMed] [Green Version]
- Rosanova, M.; Casali, A.; Bellina, V.; Resta, F.; Mariotti, M.; Massimini, M. Natural frequencies of human corticothalamic circuits. J. Neurosci. 2009, 29, 7679–7685. [Google Scholar] [CrossRef] [PubMed]
- Janssen, A.M.; Oostendorp, T.F.; Stegeman, D.F. The effect of local anatomy on the electric field induced by TMS: Evaluation at 14 different target sites. Med. Biol. Eng. Comput. 2014, 52, 873–883. [Google Scholar] [CrossRef]
- Julkunen, P.; Saisanen, L.; Danner, N.; Awiszus, F.; Kononen, M. Within-subject effect of coil-to-cortex distance on cortical electric field threshold and motor evoked potentials in transcranial magnetic stimulation. J. Neurosci. Methods 2012, 206, 158–164. [Google Scholar] [CrossRef]
- Danner, N.; Kononen, M.; Saisanen, L.; Laitinen, R.; Mervaala, E.; Julkunen, P. Effect of individual anatomy on resting motor threshold-computed electric field as a measure of cortical excitability. J. Neurosci. Methods 2012, 203, 298–304. [Google Scholar] [CrossRef] [PubMed]
- Laakso, I.; Hirata, A.; Ugawa, Y. Effects of coil orientation on the electric field induced by TMS over the hand motor area. Phys. Med. Biol. 2014, 59, 203–218. [Google Scholar] [CrossRef]
- Nazarova, M.; Kulikova, S.; Piradov, M.A.; Limonova, A.S.; Dobrynina, L.A.; Konovalov, R.N.; Novikov, P.A.; Sehm, B.; Villringer, A.; Saltykova, A.; et al. Multimodal assessment of the motor system in patients with chronic ischemic stroke. Stroke 2021, 52, 241–249. [Google Scholar] [CrossRef]
- Schabrun, S.M.; Ridding, M.C. The influence of correlated afferent input on motor cortical representations in humans. Exp. Brain Res. 2007, 183, 41–49. [Google Scholar] [CrossRef]
- Ziemann, U.; Ilic, T.V.; Alle, H.; Meintzschel, F. Cortico-motoneuronal excitation of three hand muscles determined by a novel penta-stimulation technique. Brain 2004, 127, 1887–1898. [Google Scholar] [CrossRef]
- Knecht, S.; Sommer, J.; Deppe, M.; Steinstrater, O. Scalp position and efficacy of transcranial magnetic stimulation. Clin. Neurophysiol 2005, 116, 1988–1993. [Google Scholar] [CrossRef] [PubMed]
- Davis, N.J. Variance in cortical depth across the brain surface: Implications for transcranial stimulation of the brain. Eur. J. Neurosci. 2021, 53, 996–1007. [Google Scholar] [CrossRef] [PubMed]
- Trillenberg, P.; Bremer, S.; Oung, S.; Erdmann, C.; Schweikard, A.; Richter, L. Variation of stimulation intensity in transcranial magnetic stimulation with depth. J. Neurosci. Methods 2012, 211, 185–190. [Google Scholar] [CrossRef]
- Foltys, H.; Krings, T.; Meister, I.G.; Sparing, R.; Boroojerdi, B.; Thron, A.; Topper, R. Motor representation in patients rapidly recovering after stroke: A functional magnetic resonance imaging and transcranial magnetic stimulation study. Clin. Neurophysiol. 2003, 114, 2404–2415. [Google Scholar] [CrossRef]
- Schabrun, S.M.; Hodges, P.W.; Vicenzino, B.; Jones, E.; Chipchase, L.S. Novel adaptations in motor cortical maps: The relation to persistent elbow pain. Med. Sci. Sports Exerc. 2015, 47, 681–690. [Google Scholar] [CrossRef]
- Nicolini, C.; Harasym, D.; Turco, C.V.; Nelson, A.J. Human motor cortical organization is influenced by handedness. Cortex 2019, 115, 172–183. [Google Scholar] [CrossRef]
- Pitkanen, M.; Kallioniemi, E.; Julkunen, P. Extent and Location of the excitatory and inhibitory cortical hand representation maps: A navigated transcranial magnetic stimulation study. Brain Topogr. 2015, 28, 657–665. [Google Scholar] [CrossRef]
- Uy, J.; Ridding, M.C.; Miles, T.S. Stability of maps of human motor cortex made with transcranial magnetic stimulation. Brain Topogr. 2002, 14, 293–297. [Google Scholar] [CrossRef] [PubMed]
- Marconi, B.; Pecchioli, C.; Koch, G.; Caltagirone, C. Functional overlap between hand and forearm motor cortical representations during motor cognitive tasks. Clin. Neurophysiol. 2007, 118, 1767–1775. [Google Scholar] [CrossRef]
- Kleim, J.A.; Kleim, E.D.; Cramer, S.C. Systematic assessment of training-induced changes in corticospinal output to hand using frameless stereotaxic transcranial magnetic stimulation. Nat. Protoc. 2007, 2, 1675–1684. [Google Scholar] [CrossRef] [Green Version]
- Schabrun, S.M.; Stinear, C.M.; Byblow, W.D.; Ridding, M.C. Normalizing motor cortex representations in focal hand dystonia. Cereb. Cortex 2009, 19, 1968–1977. [Google Scholar] [CrossRef] [PubMed] [Green Version]
- Borghetti, D.; Sartucci, F.; Petacchi, E.; Guzzetta, A.; Piras, M.F.; Murri, L.; Cioni, G. Transcranial magnetic stimulation mapping: A model based on spline interpolation. Brain Res. Bull. 2008, 77, 143–148. [Google Scholar] [CrossRef]
- Cavaleri, R.; Schabrun, S.M.; Chipchase, L.S. Determining the optimal number of stimuli per cranial site during transcranial magnetic stimulation mapping. Neurosci. J. 2017, 2017, 6328569. [Google Scholar] [CrossRef]
- Chernyavskiy, A.Y.; Sinitsyn, D.O.; Poydasheva, A.G.; Bakulin, I.S.; Suponeva, N.A.; Piradov, M.A. Accuracy of Estimating the Area of Cortical Muscle Representations from TMS Mapping Data Using Voronoi Diagrams. Brain Topogr. 2019, 32, 859–872. [Google Scholar] [CrossRef]
- Goldsworthy, M.R.; Hordacre, B.; Ridding, M.C. Minimum number of trials required for within- and between-session reliability of TMS measures of corticospinal excitability. Neuroscience 2016, 320, 205–209. [Google Scholar] [CrossRef]
- Chang, W.H.; Fried, P.J.; Saxena, S.; Jannati, A.; Gomes-Osman, J.; Kim, Y.H.; Pascual-Leone, A. Optimal number of pulses as outcome measures of neuronavigated transcranial magnetic stimulation. Clin. Neurophysiol. 2016, 127, 2892–2897. [Google Scholar] [CrossRef] [Green Version]
- Schmidt, S.; Bathe-Peters, R.; Fleischmann, R.; Ronnefarth, M.; Scholz, M.; Brandt, S.A. Nonphysiological factors in navigated TMS studies; confounding covariates and valid intracortical estimates. Hum. Brain Mapp. 2015, 36, 40–49. [Google Scholar] [CrossRef] [PubMed]
- De Santo, G.; Tanner, P.; Witt, T.N.; Gebrecht, V.; Bötzel, K. Investigation of coil tilt by transcranial magnetic stimulation (TMS) of the motor cortex using a navigation system. Klin. Neurophysiol. 2006, 37, A38. [Google Scholar] [CrossRef]
- Raffin, E.; Pellegrino, G.; Di Lazzaro, V.; Thielscher, A.; Siebner, H.R. Bringing transcranial mapping into shape: Sulcus-aligned mapping captures motor somatotopy in human primary motor hand area. Neuroimage 2015, 120, 164–175. [Google Scholar] [CrossRef] [PubMed]
- Kallioniemi, E.; Kononen, M.; Julkunen, P. Repeatability of functional anisotropy in navigated transcranial magnetic stimulation--coil-orientation versus response. Neuroreport 2015, 26, 515–521. [Google Scholar] [CrossRef]
- Kallioniemi, E.; Kononen, M.; Saisanen, L.; Grohn, H.; Julkunen, P. Functional neuronal anisotropy assessed with neuronavigated transcranial magnetic stimulation. J. Neurosci. Methods 2015, 256, 82–90. [Google Scholar] [CrossRef] [PubMed]
- Balslev, D.; Braet, W.; McAllister, C.; Miall, R.C. Inter-individual variability in optimal current direction for transcranial magnetic stimulation of the motor cortex. J. Neurosci. Methods 2007, 162, 309–313. [Google Scholar] [CrossRef] [PubMed] [Green Version]
- Gomez-Tames, J.; Hamasaka, A.; Laakso, I.; Hirata, A.; Ugawa, Y. Atlas of optimal coil orientation and position for TMS: A computational study. Brain Stimul. 2018, 11, 839–848. [Google Scholar] [CrossRef]
- Opitz, A.; Windhoff, M.; Heidemann, R.M.; Turner, R.; Thielscher, A. How the brain tissue shapes the electric field induced by transcranial magnetic stimulation. Neuroimage 2011, 58, 849–859. [Google Scholar] [CrossRef]
- Niskanen, E.; Julkunen, P.; Saisanen, L.; Vanninen, R.; Karjalainen, P.; Kononen, M. Group-level variations in motor representation areas of thenar and anterior tibial muscles: Navigated Transcranial Magnetic Stimulation Study. Hum. Brain Mapp. 2010, 31, 1272–1280. [Google Scholar] [CrossRef] [PubMed]
- Ahdab, R.; Ayache, S.S.; Brugieres, P.; Farhat, W.H.; Lefaucheur, J.P. The hand motor hotspot is not always located in the hand knob: A neuronavigated transcranial magnetic stimulation study. Brain Topogr. 2016, 29, 590–597. [Google Scholar] [CrossRef] [PubMed]
- Julkunen, P.; Saisanen, L.; Danner, N.; Niskanen, E.; Hukkanen, T.; Mervaala, E.; Kononen, M. Comparison of navigated and non-navigated transcranial magnetic stimulation for motor cortex mapping, motor threshold and motor evoked potentials. Neuroimage 2009, 44, 790–795. [Google Scholar] [CrossRef]
- Rossini, P.M.; Burke, D.; Chen, R.; Cohen, L.G.; Daskalakis, Z.; Di Iorio, R.; Di Lazzaro, V.; Ferreri, F.; Fitzgerald, P.B.; George, M.S.; et al. Non-invasive electrical and magnetic stimulation of the brain, spinal cord, roots and peripheral nerves: Basic principles and procedures for routine clinical and research application. An updated report from an I.F.C.N. Committee. Clin. Neurophysiol. 2015, 126, 1071–1107. [Google Scholar] [CrossRef]
- Sollmann, N.; Hauck, T.; Obermuller, T.; Hapfelmeier, A.; Meyer, B.; Ringel, F.; Krieg, S.M. Inter- and intraobserver variability in motor mapping of the hotspot for the abductor policis brevis muscle. BMC Neurosci. 2013, 14, 1–7. [Google Scholar] [CrossRef] [Green Version]
- Wassermann, E.M.; McShane, L.M.; Hallett, M.; Cohen, L.G. Noninvasive mapping of muscle representations in human motor cortex. Electroencephalogr. Clin. Neurophysiol. 1992, 85, 1–8. [Google Scholar] [CrossRef]
- Saisanen, L.; Maatta, S.; Julkunen, P.; Niskanen, E.; Kallioniemi, E.; Grohn, H.; Kemppainen, S.; Lakka, T.A.; Lintu, N.; Eloranta, A.M.; et al. Functional and structural asymmetry in primary motor cortex in Asperger syndrome: A navigated TMS and imaging study. Brain Topogr. 2019, 32, 504–518. [Google Scholar] [CrossRef] [Green Version]
- Jonker, Z.D.; van der Vliet, R.; Hauwert, C.M.; Gaiser, C.; Tulen, J.H.M.; van der Geest, J.N.; Donchin, O.; Ribbers, G.M.; Frens, M.A.; Selles, R.W. TMS motor mapping: Comparing the absolute reliability of digital reconstruction methods to the golden standard. Brain Stimul. 2019, 12, 309–313. [Google Scholar] [CrossRef] [Green Version]
- Sollmann, N.; Zhang, H.; Kelm, A.; Schroder, A.; Meyer, B.; Pitkanen, M.; Julkunen, P.; Krieg, S.M. Paired-pulse navigated TMS is more effective than single-pulse navigated TMS for mapping upper extremity muscles in brain tumor patients. Clinical Neuropsychol. 2020, 131, 2887–2898. [Google Scholar] [CrossRef]
- Zhang, H.; Julkunen, P.; Schroder, A.; Kelm, A.; Ille, S.; Zimmer, C.; Pitkanen, M.; Meyer, B.; Krieg, S.M.; Sollmann, N. Short-interval intracortical facilitation improves efficacy in nTMS motor mapping of lower extremity muscle representations in patients with supra-tentorial brain tumors. Cancers 2020, 12, 3233. [Google Scholar] [CrossRef] [PubMed]
- Jussen, D.; Zdunczyk, A.; Schmidt, S.; Rosler, J.; Buchert, R.; Julkunen, P.; Karhu, J.; Brandt, S.; Picht, T.; Vajkoczy, P. Motor plasticity after extra-intracranial bypass surgery in occlusive cerebrovascular disease. Neurology 2016, 87, 27–35. [Google Scholar] [CrossRef] [PubMed]
- Ille, S.; Kelm, A.; Schroeder, A.; Albers, L.E.; Negwer, C.; Butenschoen, V.M.; Sollmann, N.; Picht, T.; Vajkoczy, P.; Meyer, B.; et al. Navigated repetitive transcranial magnetic stimulation improves the outcome of postsurgical paresis in glioma patients—A randomized, double-blinded trial. Brain Stimul. 2021. [Google Scholar] [CrossRef]
- Sollmann, N.; Zhang, H.; Fratini, A.; Wildschuetz, N.; Ille, S.; Schroder, A.; Zimmer, C.; Meyer, B.; Krieg, S.M. Risk assessment by presurgical tractography using navigated TMS maps in patients with highly motor- or language-eloquent brain tumors. Cancers 2020, 12, 1264. [Google Scholar] [CrossRef]
- Sollmann, N.; Giglhuber, K.; Tussis, L.; Meyer, B.; Ringel, F.; Krieg, S.M. nTMS-based DTI fiber tracking for language pathways correlates with language function and aphasia—A case report. Clin. Neurol. Neurosurg. 2015, 136, 25–28. [Google Scholar] [CrossRef] [PubMed]
- Holodny, A.I.; Schulder, M.; Liu, W.C.; Maldjian, J.A.; Kalnin, A.J. Decreased BOLD functional MR activation of the motor and sensory cortices adjacent to a glioblastoma multiforme: Implications for image-guided neurosurgery. AJNR Am. J. Neuroradiol. 1999, 20, 609–612. [Google Scholar]
- Holodny, A.I.; Schulder, M.; Liu, W.C.; Wolko, J.; Maldjian, J.A.; Kalnin, A.J. The effect of brain tumors on BOLD functional MR imaging activation in the adjacent motor cortex: Implications for image-guided neurosurgery. AJNR Am. J. Neuroradiol. 2000, 21, 1415–1422. [Google Scholar] [PubMed]
- Gerhardt, J.; Sollmann, N.; Hiepe, P.; Kirschke, J.S.; Meyer, B.; Krieg, S.M.; Ringel, F. Retrospective distortion correction of diffusion tensor imaging data by semi-elastic image fusion—Evaluation by means of anatomical landmarks. Clin. Neurol. Neurosurg. 2019, 183, 105387. [Google Scholar] [CrossRef]
- Ille, S.; Schwendner, M.; Zhang, W.; Schroeder, A.; Meyer, B.; Krieg, S.M. Tractography for Subcortical Resection of Gliomas Is Highly Accurate for Motor and Language Function: ioMRI-Based Elastic Fusion Disproves the Severity of Brain Shift. Cancers 2021, 13, 1787. [Google Scholar] [CrossRef] [PubMed]
- Ille, S.; Schroeder, A.; Wagner, A.; Negwer, C.; Kreiser, K.; Meyer, B.; Krieg, S.M. Intraoperative MRI-based elastic fusion for anatomically accurate tractography of the corticospinal tract: Correlation with intraoperative neuromonitoring and clinical status. Neurosurg. Focus 2021, 50, E9. [Google Scholar] [CrossRef] [PubMed]
- Mori, S.; Crain, B.J.; Chacko, V.P.; van Zijl, P.C. Three-dimensional tracking of axonal projections in the brain by magnetic resonance imaging. Ann. Neurol. 1999, 45, 265–269. [Google Scholar] [CrossRef]
- Mori, S.; van Zijl, P.C. Fiber tracking: Principles and strategies—A technical review. NMR Biomed. 2002, 15, 468–480. [Google Scholar] [CrossRef]
- Lazar, M.; Alexander, A.L. An error analysis of white matter tractography methods: Synthetic diffusion tensor field simulations. Neuroimage 2003, 20, 1140–1153. [Google Scholar] [CrossRef]
- Anderson, A.W. Theoretical analysis of the effects of noise on diffusion tensor imaging. Magn. Reson. Med. Off. J. Soc. Magn. Reson. Med. 2001, 46, 1174–1188. [Google Scholar] [CrossRef] [PubMed]
- Mukherjee, P.; Berman, J.I.; Chung, S.W.; Hess, C.P.; Henry, R.G. Diffusion tensor MR imaging and fiber tractography: Theoretic underpinnings. AJNR Am. J. Neuroradiol. 2008, 29, 632–641. [Google Scholar] [CrossRef] [Green Version]
- Beaulieu, C. The basis of anisotropic water diffusion in the nervous system—A technical review. NMR Biomed. 2002, 15, 435–455. [Google Scholar] [CrossRef]
- Michailovich, O.; Rathi, Y.; Dolui, S. Spatially regularized compressed sensing for high angular resolution diffusion imaging. IEEE Trans. Med. Imaging 2011, 30, 1100–1115. [Google Scholar] [CrossRef] [Green Version]
- Rathi, Y.; Michailovich, O.; Setsompop, K.; Bouix, S.; Shenton, M.E.; Westin, C.F. Sparse multi-shell diffusion imaging. Med. Image Comput. Comput. Assist. Interv. 2011, 14, 58–65. [Google Scholar]
- Zhang, H.; Schneider, T.; Wheeler-Kingshott, C.A.; Alexander, D.C. NODDI: Practical in vivo neurite orientation dispersion and density imaging of the human brain. Neuroimage 2012, 61, 1000–1016. [Google Scholar] [CrossRef] [PubMed]
- Julkunen, P.; Jarnefelt, G.; Savolainen, P.; Laine, J.; Karhu, J. Facilitatory effect of paired-pulse stimulation by transcranial magnetic stimulation with biphasic wave-form. Med. Eng. Phys. 2016, 38, 813–817. [Google Scholar] [CrossRef] [PubMed]
- Pitkanen, M.; Kallioniemi, E.; Jarnefelt, G.; Karhu, J.; Julkunen, P. Efficient mapping of the motor cortex with navigated biphasic paired-pulse transcranial magnetic stimulation. Brain Topogr. 2018, 31, 963–971. [Google Scholar] [CrossRef]
- Mohammadi, A.; Ebrahimi, M.; Kaartinen, S.; Jarnefelt, G.; Karhu, J.; Julkunen, P. Individual characterization of fast intracortical facilitation with paired biphasic-wave transcranial magnetic stimulation. IEEE Trans. Neural Syst. Rehabil. Eng. 2018. [Google Scholar] [CrossRef] [PubMed]
- Picht, T.; Krieg, S.M.; Sollmann, N.; Rosler, J.; Niraula, B.; Neuvonen, T.; Savolainen, P.; Lioumis, P.; Makela, J.P.; Deletis, V.; et al. A comparison of language mapping by preoperative navigated transcranial magnetic stimulation and direct cortical stimulation during awake surgery. Neurosurgery 2013, 72, 808–819. [Google Scholar] [CrossRef] [PubMed] [Green Version]
- Tarapore, P.E.; Findlay, A.M.; Honma, S.M.; Mizuiri, D.; Houde, J.F.; Berger, M.S.; Nagarajan, S.S. Language mapping with navigated repetitive TMS: Proof of technique and validation. Neuroimage 2013, 82, 260–272. [Google Scholar] [CrossRef] [PubMed] [Green Version]
- Sollmann, N.; Ille, S.; Hauck, T.; Maurer, S.; Negwer, C.; Zimmer, C.; Ringel, F.; Meyer, B.; Krieg, S.M. The impact of preoperative language mapping by repetitive navigated transcranial magnetic stimulation on the clinical course of brain tumor patients. BMC Cancer 2015, 15, 1–8. [Google Scholar] [CrossRef] [Green Version]
- Sollmann, N.; Kubitscheck, A.; Maurer, S.; Ille, S.; Hauck, T.; Kirschke, J.S.; Ringel, F.; Meyer, B.; Krieg, S.M. Preoperative language mapping by repetitive navigated transcranial magnetic stimulation and diffusion tensor imaging fiber tracking and their comparison to intraoperative stimulation. Neuroradiology 2016, 58, 807–818. [Google Scholar] [CrossRef]
- Babajani-Feremi, A.; Narayana, S.; Rezaie, R.; Choudhri, A.F.; Fulton, S.P.; Boop, F.A.; Wheless, J.W.; Papanicolaou, A.C. Language mapping using high gamma electrocorticography, fMRI, and TMS versus electrocortical stimulation. Clin. Neurophysiol. 2016, 127, 1822–1836. [Google Scholar] [CrossRef] [PubMed]
- Laakso, I.; Murakami, T.; Hirata, A.; Ugawa, Y. Where and what TMS activates: Experiments and modeling. Brain Stimul. 2018, 11, 166–174. [Google Scholar] [CrossRef]
- Weise, K.; Numssen, O.; Thielscher, A.; Hartwigsen, G.; Knosche, T.R. A novel approach to localize cortical TMS effects. Neuroimage 2020, 209, 116486. [Google Scholar] [CrossRef] [PubMed]
- Pitkanen, M.; Kallioniemi, E.; Julkunen, P.; Nazarova, M.; Nieminen, J.O.; Ilmoniemi, R.J. Minimum-norm estimation of motor representations in navigated TMS mappings. Brain Topogr. 2017, 30, 711–722. [Google Scholar] [CrossRef] [PubMed]
- Thielscher, A.; Antunes, A.; Saturnino, G.B. Field modeling for transcranial magnetic stimulation: A useful tool to understand the physiological effects of TMS? In Proceedings of the 2015 37th Annual International Conference of the IEEE Engineering in Medicine and Biology Society, Milan, Italy, 25–29 August 2015; pp. 222–225. [Google Scholar]
- Saturnino, G.B.; Madsen, K.H.; Thielscher, A. Electric field simulations for transcranial brain stimulation using FEM: An efficient implementation and error analysis. J. Neural. Eng. 2019, 16, 066032. [Google Scholar] [CrossRef]


| Author | Year | Cohort | Tumor Entities | nTMS Method | Techniques for Comparison | Main Objective | Main Findings |
|---|---|---|---|---|---|---|---|
| Coburger et al. [32] | 2011 | 75-year-old woman | MEN | Preoperative motor mapping (60–80 V/m) | Intraoperative DES | To correlate nTMS with DES |
|
| Picht et al. [33] | 2011 | 63-year-old woman | MET | Preoperative and postoperative (4th postoperative day) motor mapping (110% rMT) | Intraoperative DES | To test nTMS in a patient with severe preoperative motor impairment and to correlate with DES |
|
| Picht et al. [35] | 2011 | 20 adult patients | HGG, MET, MEN, Other | Preoperative motor mapping (110% rMT) | Intraoperative DES | To compare the accuracy of nTMS with DES |
|
| Forster et al. [37] | 2011 | 11 adult patients | LGG, HGG, MET, Other | Preoperative motor mapping (110% rMT) | Preoperative fMRI Intraoperative DES | To compare the accuracy of nTMS with fMRI and DES |
|
| Picht et al. [43] | 2012 | 73 adult patients | LGG, HGG, MET, MEN, Other | Preoperative motor mapping (110% rMT) and nTMS-based tractography (but not considered) | Intraoperative DES | To evaluate the influence, benefit, and impact of nTMS on surgery |
|
| Krieg et al. [38] | 2012 | 26 adult patients | LGG, HGG, MET, Other | Preoperative motor mapping (110% rMT for uE and 130% for lE muscles) | Preoperative fMRI Intraoperative DES | To compare the accuracy of nTMS with fMRI and DES |
|
| Coburger et al. [34] | 2012 | 3-year-old boy | LGG | Preoperative motor mapping (130 V/m for uE and 220 V/m for lE muscles) | Intraoperative DES | To test nTMS in a child and to correlate with DES |
|
| Tarapore et al. [42] | 2012 | 24 adult patients | LGG, HGG, Other | Preoperative motor mapping (110% rMT) | Preoperative MEG Intraoperative DES | To compare the accuracy of nTMS with MEG and DES |
|
| Coburger et al. [36] | 2013 | 28 adult patients and 2 patients <18 years | LGG, HGG, MET, MEN, Other | Preoperative motor mapping (110% rMT in adult patients and aMT in patients <18 years) | Preoperative fMRI Intraoperative DES | To compare the accuracy of nTMS with fMRI and DES |
|
| Krieg et al. [39] | 2013 | 31 adult patients | LGG, HGG, MET, MEN, Other | Preoperative motor mapping (110% rMT for uE and 130% for lE muscles) | Preoperative fMRI Intraoperative DES | To compare the accuracy of nTMS with fMRI and DES in recurrent gliomas vs. initially operated tumors |
|
| Mangraviti et al. [40] | 2013 | 8 adul tpatients | LGG, HGG, MET, Other | Preoperative motor mapping (110% rMT for uE and 130% for lE muscles) | Preoperative fMRI Intraoperative DES | To compare the accuracy of nTMS with fMRI and DES |
|
| Zdunczyk et al. [45] | 2013 | 10 adult patients (and 10 healthy volunteers) | LGG, HGG, MET, MEN, Other | Preoperative motor mapping (110% rMT) (and two motor mappings per subject in the healthy volunteers) | - | To assess the intra- and inter-examiner reliability of nTMS mapping |
|
| Rizzo et al. [44] | 2014 | 17 adult patients | LGG, HGG, MET, MEN, Other | Preoperative motor mapping (110–115% rMT for uE and 130% for lE muscles) | Intraoperative DES | To evaluate the influence, benefit, and impact of nTMS on surgery |
|
| Sollmann et al. [46] | 2017 | 100 adult patients | LGG, HGG, MET, Other | Preoperative motor mapping (110% rMT for uE and 130% for lE muscles) | - | To investigate factors that have impact on MEP latencies |
|
| Sollmann et al. [47] | 2017 | 100 adult patients | LGG, HGG, MET, Other | Preoperative motor mapping (110% rMT for uE and 130% for lE muscles) | - | To investigate factors that influence the determination of the rMT |
|
| Lam et al. [49] | 2019 | 20 adult patients | n/a | Preoperative motor mapping (105% rMT) | - | To investigate the feasibility of increasing the MEP threshold (50 μV vs. 500 μV) to improve the robustness of motor mapping |
|
| Weiss-Lucas et al. [41] | 2020 | 36 adult patients | LGG, HGG, MET, MEN, Others | Preoperative motor mapping (110% rMT) | Preoperative fMRI Intraoperative DES | To compare the accuracy of nTMS with fMRI and DES |
|
| Mirbagheri et al. [50] | 2020 | 12 adult patients (and six healthy volunteers) | n/a | Preoperative motor mapping (105% rMT for primary motor areas, 120%/150% for non-primary motor areas) | - | To investigate whether nTMS reliably elicits MEPs outside of the primary motor cortex |
|
| Lavrador et al. [48] | 2020 | 45 adult patients | LGG, HGG | Preoperative motor mapping (105% rMT) | - | To assess the excitability of the motor system in relation to tumor grading |
|
| Author | Year | Cohort | Tumor Entities | dMRI Acquisition | Tractography Specifics | Main Objective | Main Findings |
|---|---|---|---|---|---|---|---|
| Krieg et al. [51] | 2012 | 30 adult patients | LGG, HGG, MET, MEN, Other | 6 diffusion directions, b-values: 0–800 s/mm2 (3 Tesla) |
| To assess the feasibility of nTMS-based tractography in relation to conventional seeding without nTMS data |
|
| Frey et al. [52] | 2012 | 50 adult patients | LGG, HGG, MET, MEN | 23 diffusion directions, b-values: 0–1000 s/mm2 (3 Tesla) |
| To assess the feasibility and impact on surgery of nTMS-based tractography in relation to conventional seeding without nTMS data and to provide a new algorithm for FA determination |
|
| Conti et al. [53] | 2014 | 20 adult patients | LGG, HGG, MET, Other | 32 diffusion directions (3 Tesla) |
| To assess somatotopic organization by nTMS-based tractography in relation to conventional seeding without nTMS data and to verify nTMS-based tractography by intraoperative DES |
|
| Weiss et al. [54] | 2015 | 32 adult patients | LGG, HGG, MET, MEN, Other | 30 diffusion directions, b-values: 0–800 s/mm2 (3 Tesla) |
| To assess the impact of subcortical seed regions and of somatotopic location of cortical seed regions on plausibility of tractography in relation to clinical factors |
|
| Weiss et al. [55] | 2017 | 18 adult patients | LGG, HGG, MET, MEN, Other | 30 diffusion directions, b-values: 0–800 s/mm2 (3 Tesla) |
| To assess the impact of the modality used for somatotopic location of cortical seed regions on plausibility of tractography |
|
| Münnich et al. [56] | 2019 | 11 adolescent or adult patients | HGG, MET, Other | 20 diffusion directions, b-values: 0–700 s/mm2 (3 Tesla) |
| To compare different seeding setups and tracking algorithms, and to correlate tractography with intraoperative DES and MRI findings |
|
| Author | Year | Cohort | Group for Comparison | Tumor Entities | nTMS Method | Outcome Parameters | Main Objective | Main Findings |
|---|---|---|---|---|---|---|---|---|
| Picht et al. [57] | 2013 | 11 adult patients | 11 historical controls | (suspected) LGG, HGG | Preoperative motor mapping |
| To assess the impact of nTMS on the treatment strategy and clinical outcome |
|
| Frey et al. [58] | 2014 | 250 adult patients | 115 historical controls | LGG, HGG, MET, Other | Preoperative motor mapping and nTMS-based tractography |
| To assess the impact of nTMS on the treatment strategy, clinical outcome, and survival |
|
| Krieg et al. [59] | 2014 | 100 adult patients | 100 historical controls (matching criteria: tumor location, preoperative paresis, and histology) | LGG, HGG, MET, Other | Preoperative motor mapping (110% rMT for uE and 130% for lE muscles) and nTMS-based tractography |
| To assess the impact of nTMS on the treatment strategy, clinical outcome, and survival |
|
| Krieg et al. [61] | 2015 | 70 adult patients | 70 historical controls (matching criteria: tumor location, preoperative paresis, and histology) | HGG | Preoperative motor mapping (110% rMT for uE and 130% for lE muscles) and nTMS-based tractography |
| To assess the impact of nTMS on the treatment strategy, clinical outcome including direct perioperative complications, and survival |
|
| Picht et al. [62] | 2016 | 93 adult patients | 34 controls (with nTMS mapping not available) | HGG (only GBMs) | Preoperative motor mapping and nTMS-based tractography |
| To assess the impact of nTMS on the treatment strategy and clinical outcome including direct perioperative complications (at two campuses) |
|
| Hendrix et al. [63] | 2016 | 61 adult patients | - | LGG, HGG, MET, MEN, Other | Preoperative motor mapping (110% rMT) |
| To assess the impact of nTMS on the treatment strategy and clinical outcome |
|
| Krieg et al. [64] | 2016 | 120 adult patients | 130 historical controls | MET | Preoperative motor mapping (110% rMT for uE and 130% for lE muscles) and nTMS-based tractography |
| To assess the impact of nTMS on the treatment strategy and clinical outcome (multi-centric with three sites) |
|
| Moser et al. [68] | 2017 | 43 adult patients | - | LGG, HGG | Preoperative motor mapping (110% rMT for uE and 130% for lE muscles) |
| To assess the impact of resection of motor-positive prerolandic nTMS points on clinical outcome |
|
| Raffa et al. [60] | 2018 | 70 adult patients (50% also having nTMS-based fiber tracking) | 35 historical controls | LGG, HGG, MET, Other | Preoperative motor mapping (120% rMT) and nTMS-based tractography |
| To assess the impact of nTMS with or without nTMS-based tractography on the treatment strategy and clinical outcome |
|
| Raffa et al. [66] | 2019 | 79 adult patients | 55 historical controls | HGG | Preoperative motor mapping (120% rMT) and nTMS-based tractography |
| To assess the impact of nTMS and nTMS-based tractography with sodium-fluorescein guidance on the treatment strategy and clinical outcome |
|
| Raffa et al. [67] | 2019 | 41 adult patients | 41 historical controls | HGG | Preoperative motor mapping (120% rMT) and nTMS-based tractography |
| To assess the impact of nTMS and nTMS-based tractography with sodium-fluorescein guidance on the treatment strategy and clinical outcome |
|
| Raffa et al. [65] | 2019 | 47 adult patients | - | MEN | Preoperative motor mapping and nTMS-based tractography |
| To analyze the role of nTMS motor mapping for planning resection of rolandic meningiomas and predicting arachnoidal cleavage plane. |
|
| Author | Year | Cohort | Tumor Entities | nTMS Method | Tractography Specifics | Main Objective | Main Findings |
|---|---|---|---|---|---|---|---|
| Picht et al. [69] | 2012 | 100 adult patients | LGG, HGG, MET, MEN, Other | Preoperative motor mapping (110% rMT) | - | To provide reference values for parameters of the functional status and neurophysiological measurements |
|
| Neuschmelting et al. [74] | 2016 | 30 adult patients | HGG, MET, Other | Preoperative motor mapping (110% rMT) and nTMS-based tractography |
| To better understand motor deficits in patients with brain tumors using structural, functional, and metabolic neuroimaging and to determine the predictive value of this approach |
|
| Rosenstock et al. [70] | 2017 | 113 adult patients | LGG, HGG | Preoperative motor mapping (105% rMT for uE and ~130% for lE muscles) and nTMS-based tractography |
| To establish risk stratification by examining whether the results of nTMS motor mapping and its neurophysiological data predict postoperative motor function outcome |
|
| Rosenstock et al. [72] | 2017 | 30 adult patients | HGG | Preoperative motor mapping (105% rMT for uE and 130–150% for lE muscles) and nTMS-based tractography |
| To analyze FA and ADC within the CST in different locations and their usefulness for predicting motor function outcome |
|
| Sollmann et al. [71] | 2018 | 86 adult patients | LGG, HGG, MET | Preoperative motor mapping (110% rMT for uE and 130% for lE muscles) and nTMS-based tractography |
| To explore whether nTMS-based tractography can be used for individual preoperative risk evaluation for surgery-related motor impairment |
|
| Seidel et al. [73] | 2019 | 13 adult patients | LGG, HGG, MET | Postoperative motor mapping (within 14 days after surgery; “MEP loss” if not 5/10 stimulations could be elicited with 70–100% of the MSO) | - | To investigate the value of postoperative nTMS motor mapping compared with intraoperative MEP monitoring for predicting recovery of motor function |
|
| Author | Year | Cohort | Tumor Entities | nTMS Method | Main Objective | Main Findings |
|---|---|---|---|---|---|---|
| Forster et al. [75] | 2012 | 5 adult patients (and 5 healthy volunteers) | LGG, HGG | Preoperative and follow-up motor mapping (110% rMT for uE and lE muscles; interval between mappings: 18 months on average) (two motor mappings in healthy volunteers) | To investigate cortical motor representation after resection of perirolandic WHO grade II and III gliomas |
|
| Takahashi et al. [76] | 2013 | 20-year-old man | LGG | Preoperative and follow-up motor mapping (110% for uE muscles; interval between mappings: 18 months) | To confirm induced brain plasticity by nTMS motor mapping |
|
| Bulubas et al. [77] | 2016 | 100 adult patients | LGG, HGG, MET, Other | Preoperative motor mapping (110% rMT for uE and 130% for lE muscles) | To investigate whether brain lesions induce a change in motor cortex representation depending on tumor localization |
|
| Conway et al. [80] | 2017 | 22 adult patients | LGG, HGG | Preoperative and follow-up motor mapping (110% rMT for uE and ≥130% for lE muscles; interval between mappings: 3–42 months) | To demonstrate the frequency of plastic reshaping and reveal clues to the patterns of reorganization |
|
| Bulubas et al. [78] | 2018 | 100 adult patients | LGG, HGG, MET, Other | Preoperative motor mapping (110% rMT for uE and 130% for lE muscles) | To investigate the spatial distributions of motor sites to reveal tumor-induced brain plasticity in patients with brain tumors |
|
| Barz et al. [79] | 2018 | 20 adolescent to adult patients (and 12 healthy volunteers) | LGG, HGG, Other | Preoperative and follow-up motor mapping (110% rMT for uE and lE muscles; interval between mappings: 26.1 ± 24.8 months and 46.3 ± 25.4 months) (two motor mappings in healthy volunteers) | To evaluate motor cortex reorganization in patients after perirolandic glioma surgery |
|
| Sollmann et al. [81] | 2018 | 60 adult patients | HGG | Preoperative motor mapping (110% rMT for uE and ≥130% for lE muscles) and nTMS-based tractography (and fMRI for a subsample of the cohort) | To evaluate whether brain tumor relapse has a preference to grow towards motor-eloquent brain structures |
|
Publisher’s Note: MDPI stays neutral with regard to jurisdictional claims in published maps and institutional affiliations. |
© 2021 by the authors. Licensee MDPI, Basel, Switzerland. This article is an open access article distributed under the terms and conditions of the Creative Commons Attribution (CC BY) license (https://creativecommons.org/licenses/by/4.0/).
Share and Cite
Sollmann, N.; Krieg, S.M.; Säisänen, L.; Julkunen, P. Mapping of Motor Function with Neuronavigated Transcranial Magnetic Stimulation: A Review on Clinical Application in Brain Tumors and Methods for Ensuring Feasible Accuracy. Brain Sci. 2021, 11, 897. https://0-doi-org.brum.beds.ac.uk/10.3390/brainsci11070897
Sollmann N, Krieg SM, Säisänen L, Julkunen P. Mapping of Motor Function with Neuronavigated Transcranial Magnetic Stimulation: A Review on Clinical Application in Brain Tumors and Methods for Ensuring Feasible Accuracy. Brain Sciences. 2021; 11(7):897. https://0-doi-org.brum.beds.ac.uk/10.3390/brainsci11070897
Chicago/Turabian StyleSollmann, Nico, Sandro M. Krieg, Laura Säisänen, and Petro Julkunen. 2021. "Mapping of Motor Function with Neuronavigated Transcranial Magnetic Stimulation: A Review on Clinical Application in Brain Tumors and Methods for Ensuring Feasible Accuracy" Brain Sciences 11, no. 7: 897. https://0-doi-org.brum.beds.ac.uk/10.3390/brainsci11070897