
Andrographolide Attenuates Gut-Brain-Axis Associated Pathology in Gulf War Illness by Modulating Bacteriome-Virome Associated Inflammation and Microglia-Neuron Proinflammatory Crosstalk

 , , , ,
  , and
, and 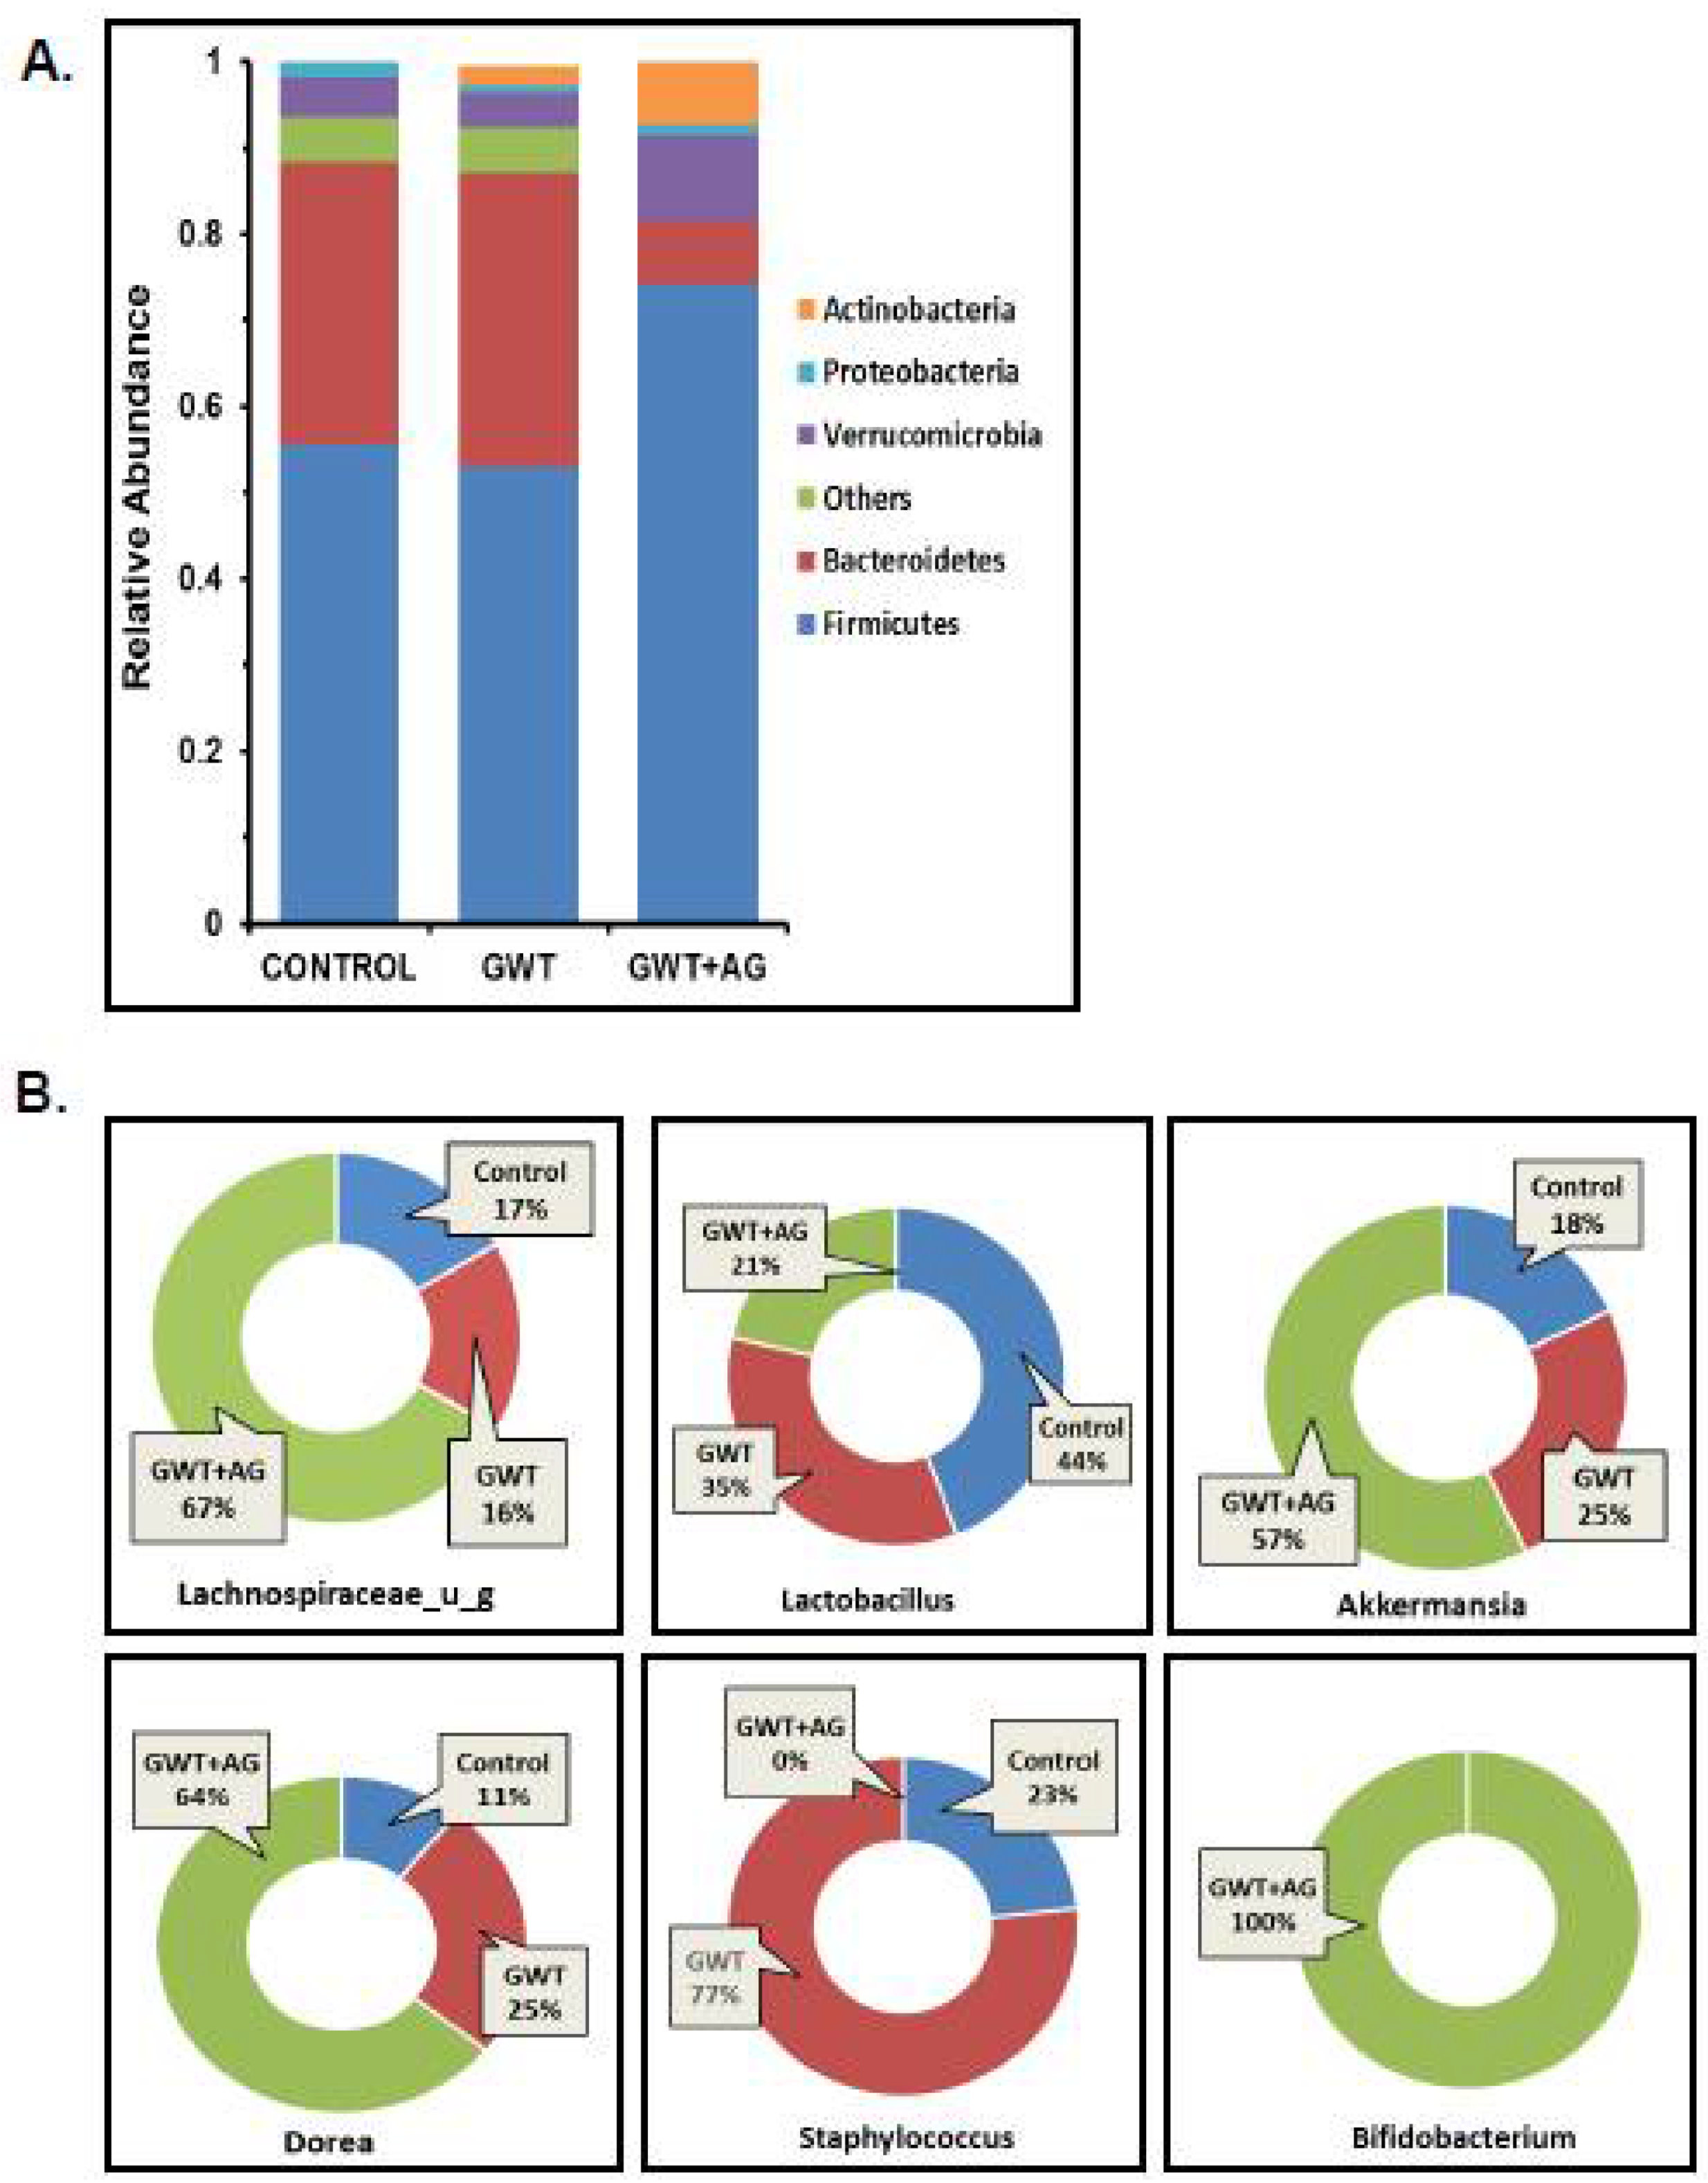
Abstract
:1. Introduction
2. Materials and Methods
2.1. Materials
2.2. Animals
2.3. Mouse Model of Gulf War Illness
2.4. Cell Culture
2.4.1. Mouse Microglial Cell Culture and Treatment
2.4.2. Mouse Neuronal Cell Culture and Treatment
2.5. Microbiome Analysis
2.5.1. Bacteriome Analysis
2.5.2. Virus-Like Particle (VLP) Enrichment and Total Nucleic Acid Extraction
2.5.3. Availability of Data and Materials
2.6. Laboratory Methods
2.6.1. Immunohistochemistry
2.6.2. Immunofluorescence Staining
2.6.3. Western Blot
2.6.4. Enzyme-Linked Immunosorbent Assay (ELISA)
2.7. Statistical Analyses
3. Results
3.1. Andrographolide Treatment Restores GW Chemical-Associated Bacteriome Alteration in Mice
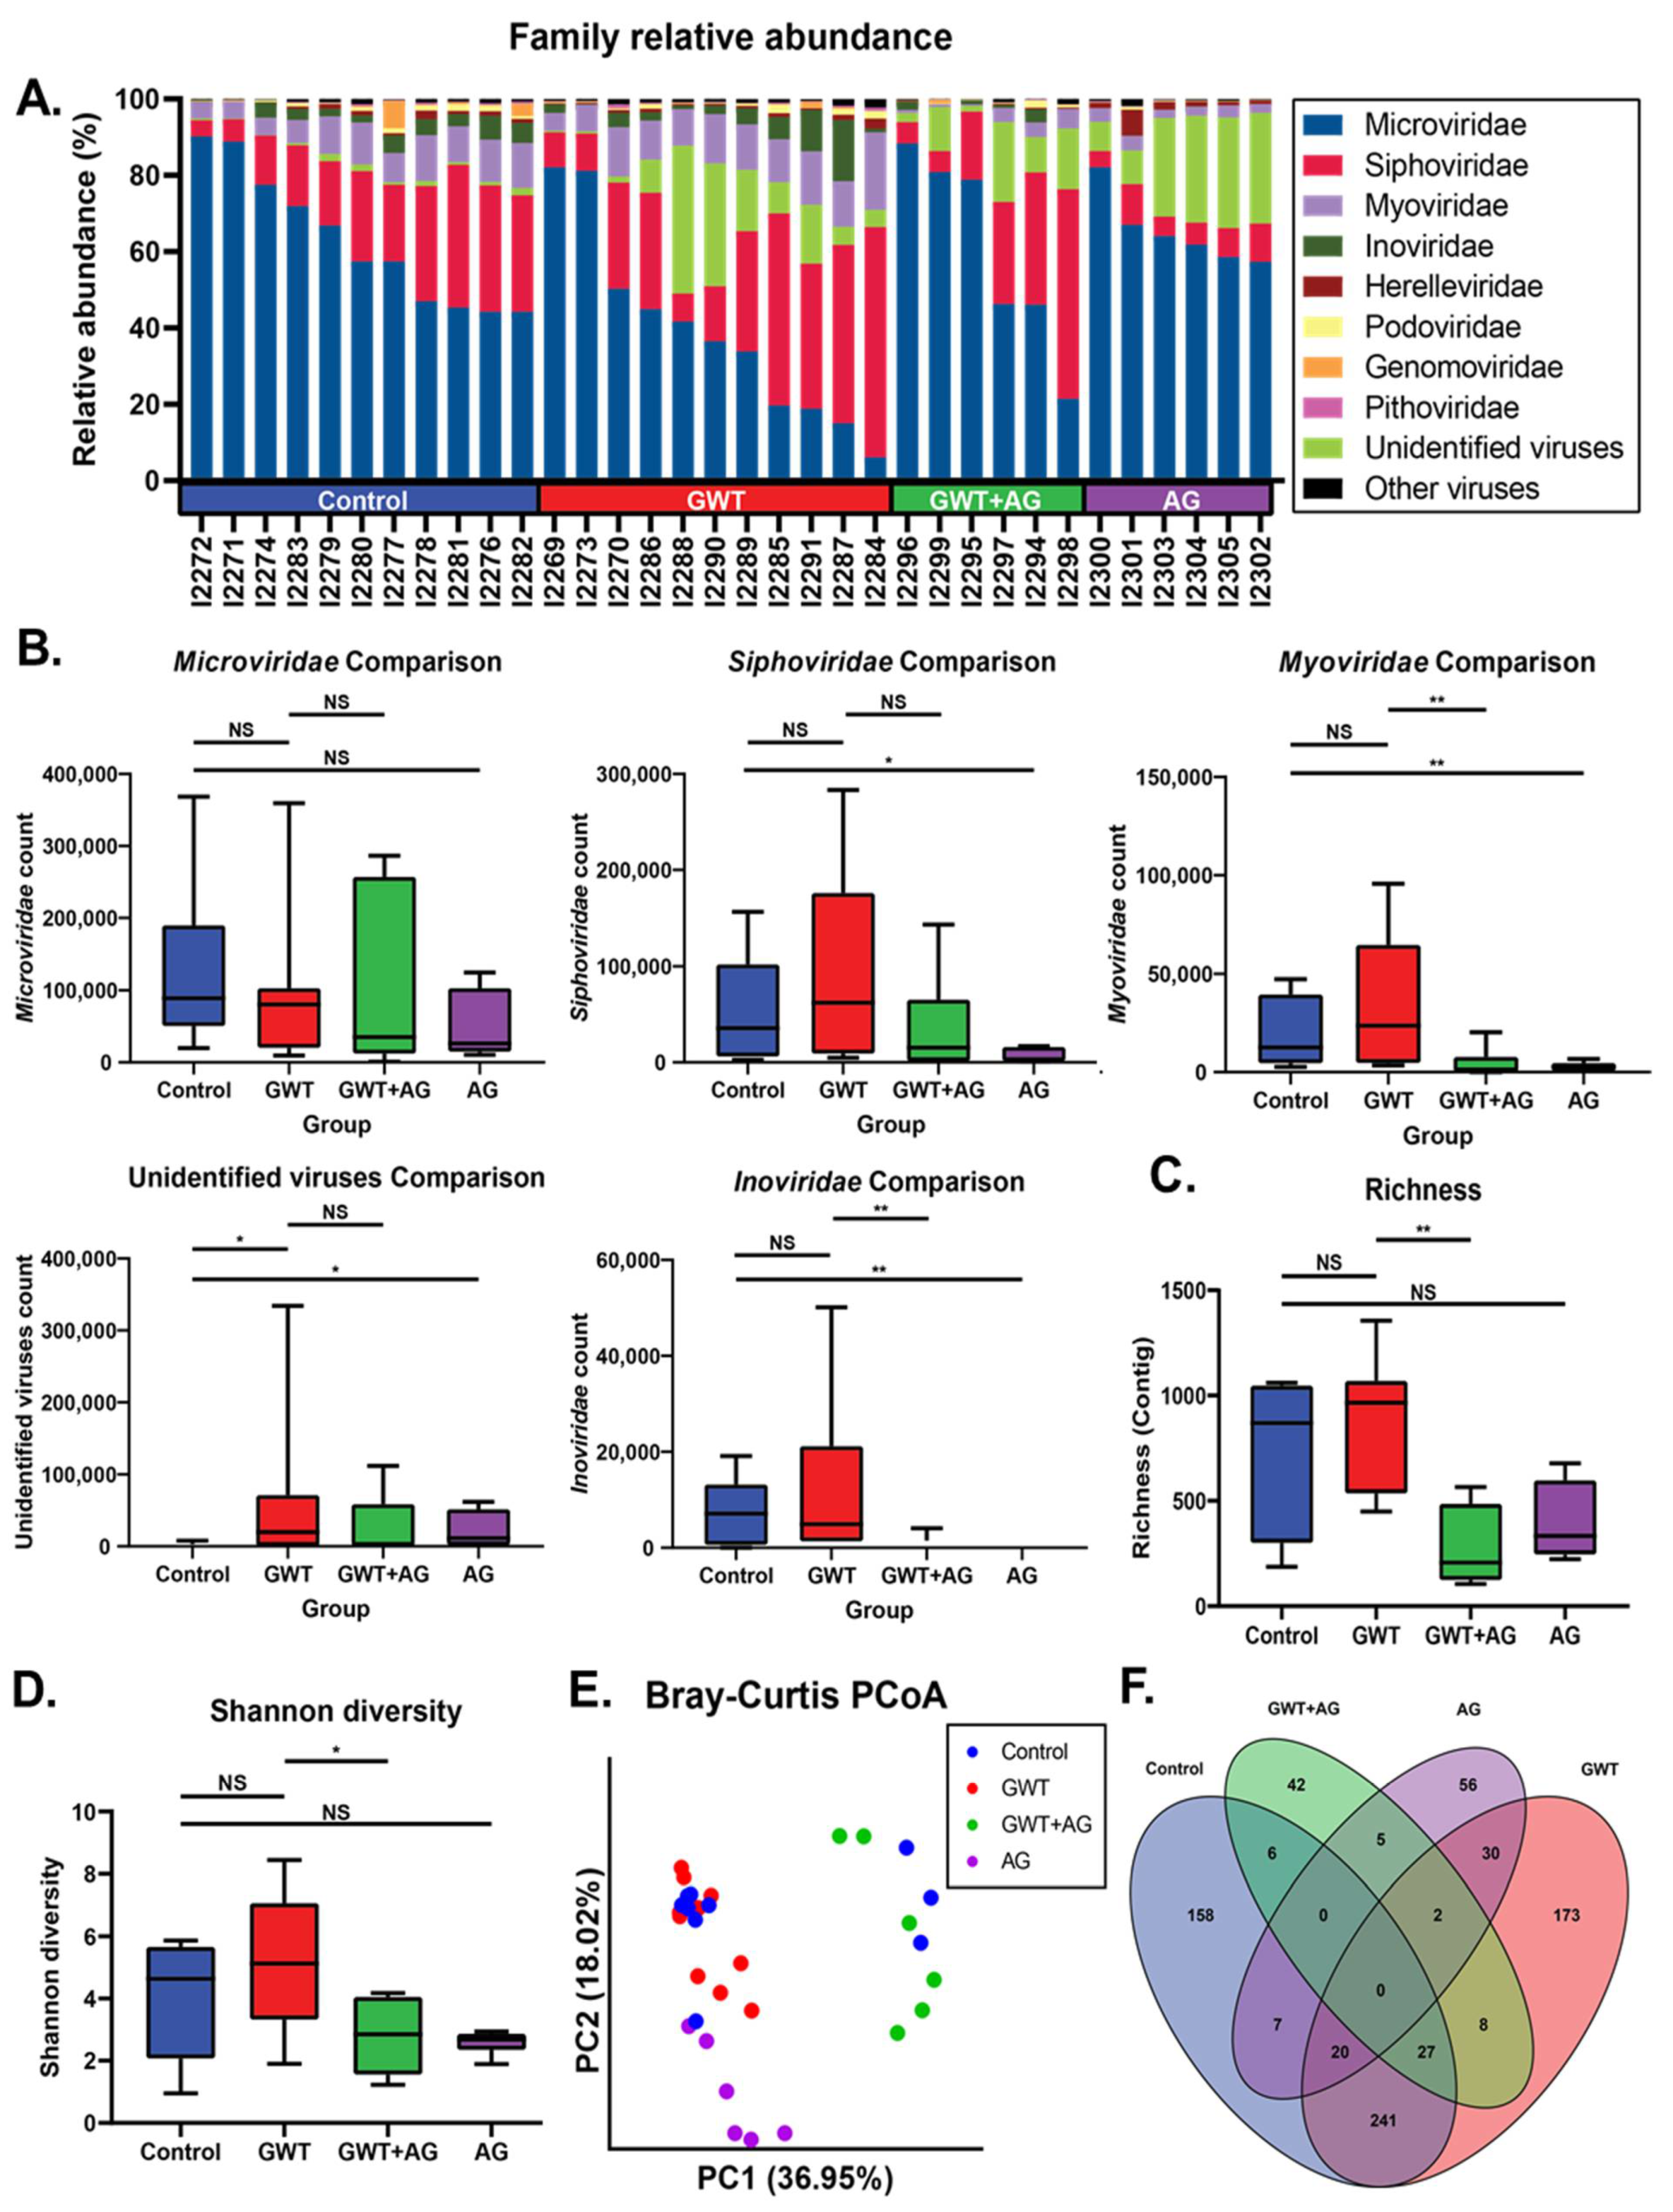
3.2. Virome Alteration Associated with Andrographolide Administration in a Mouse Model of GWI
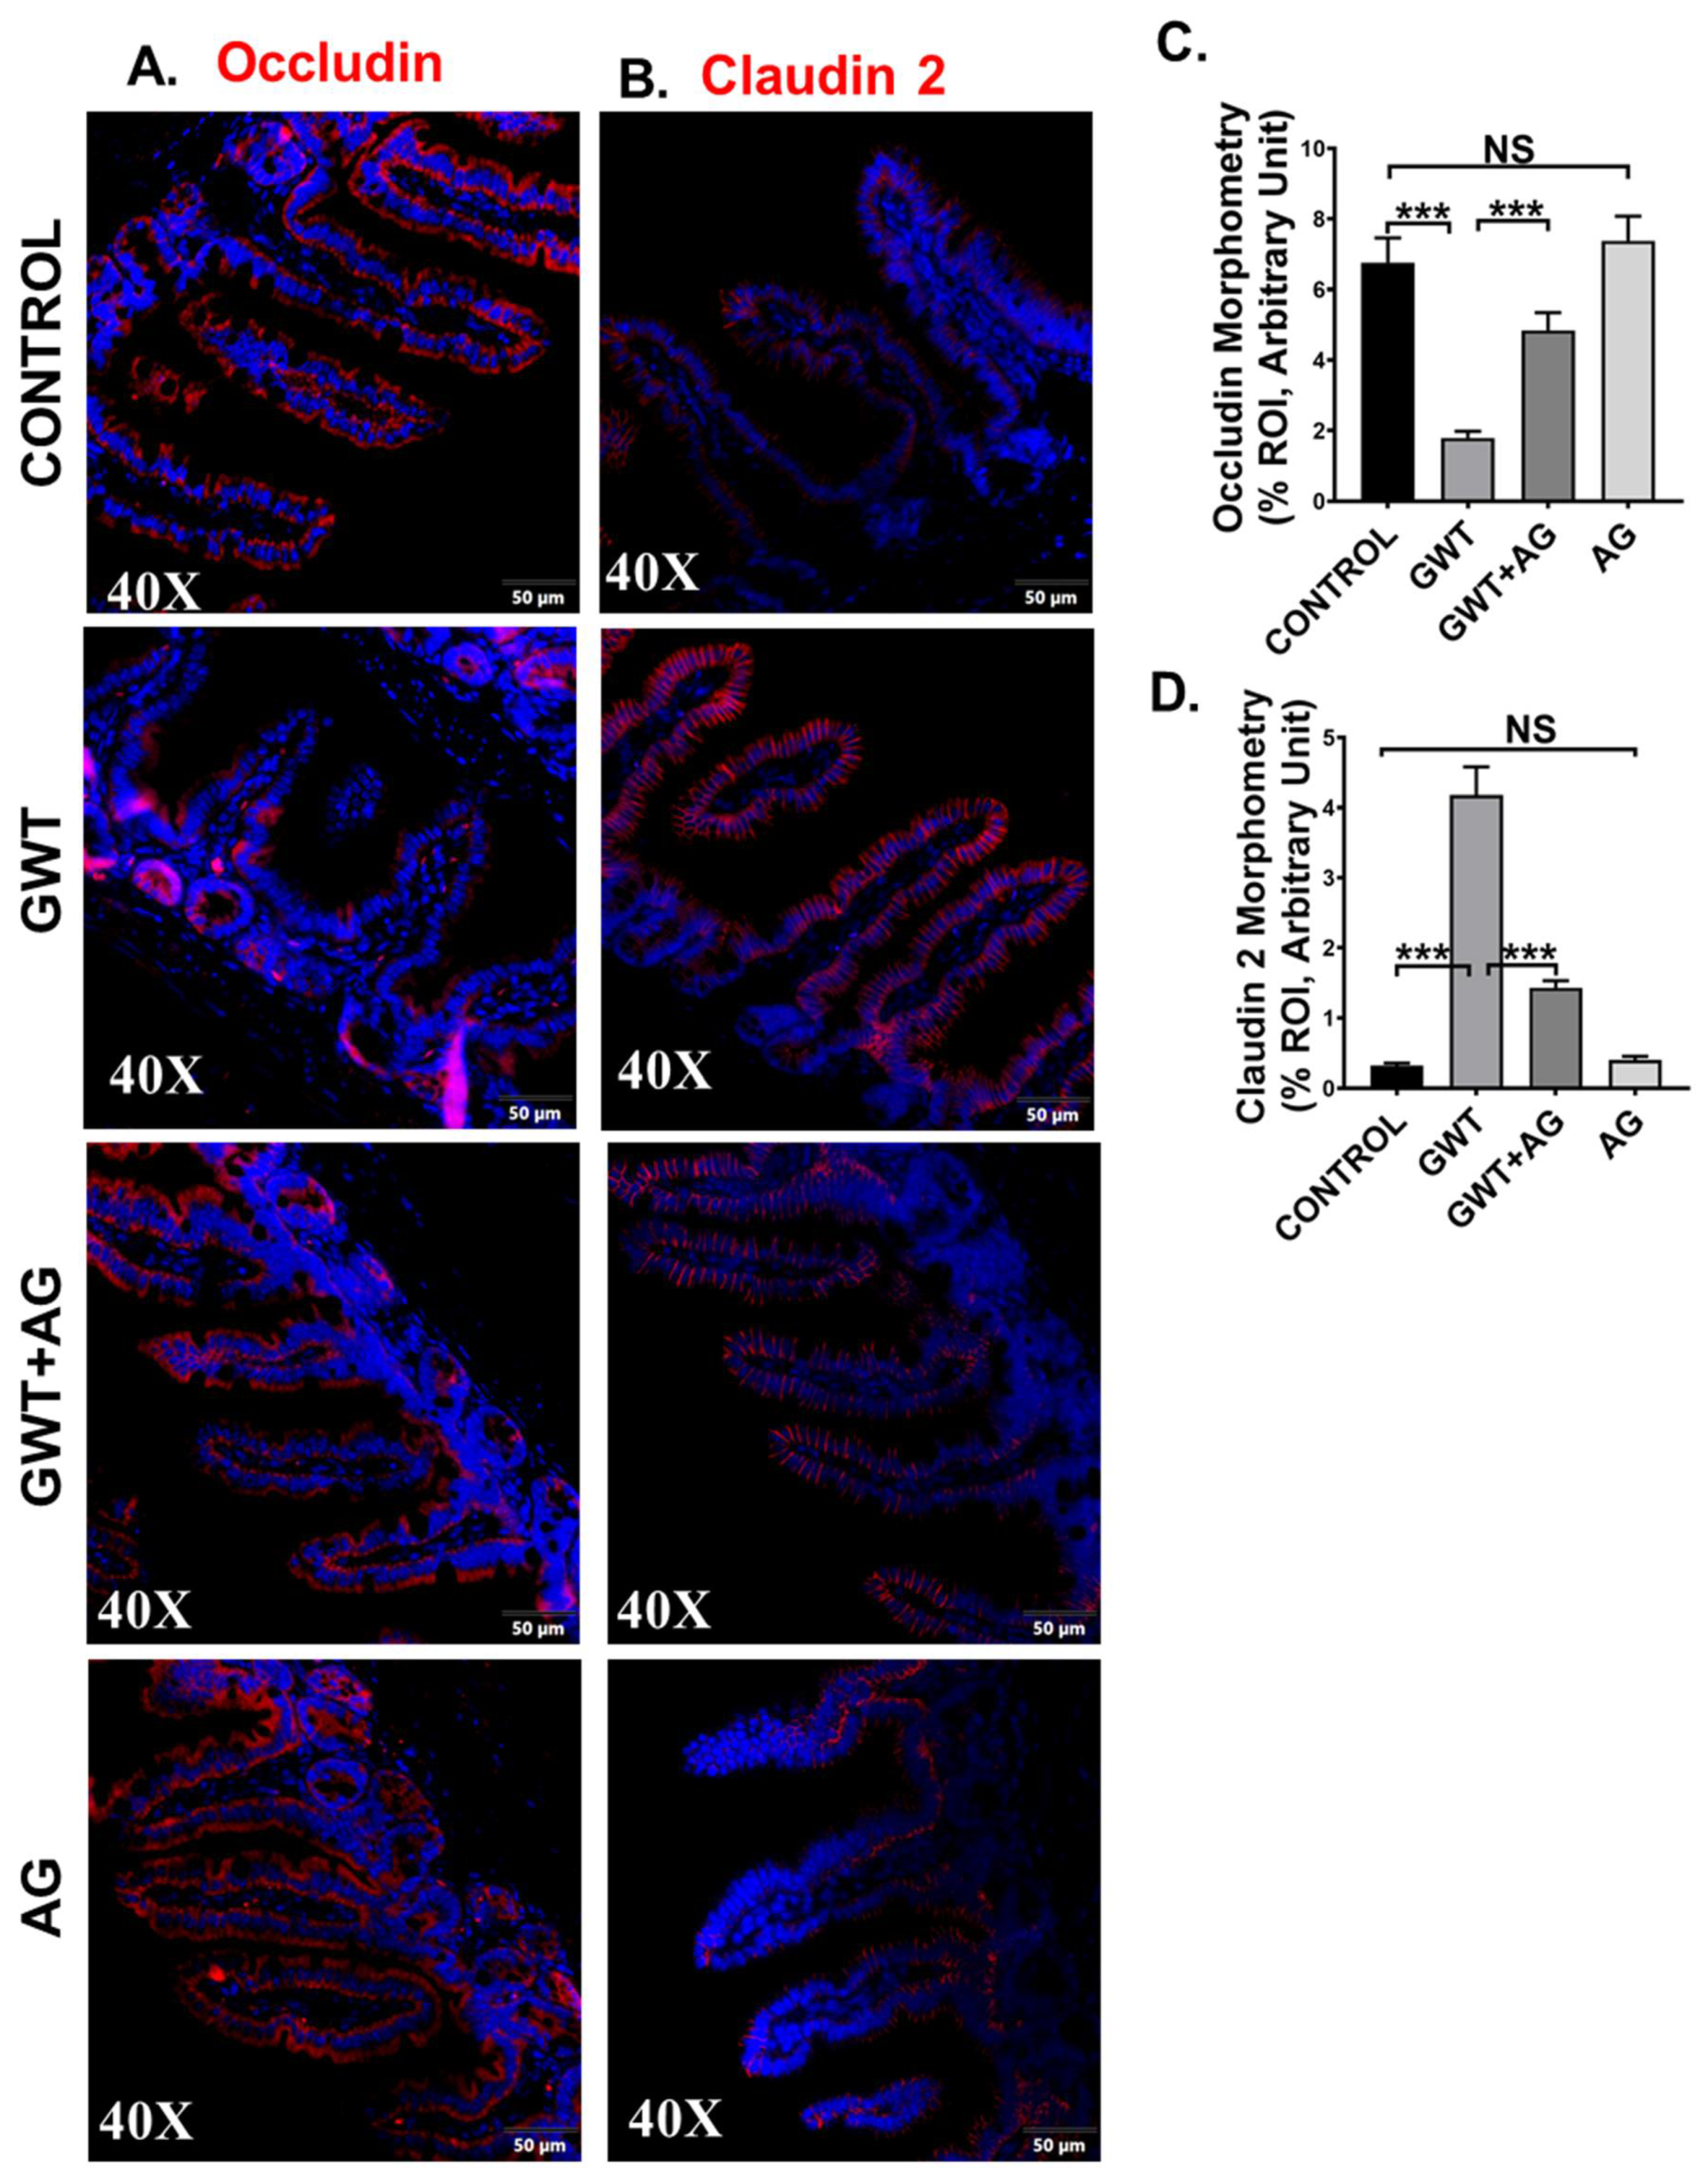
3.3. AG Treatment Improves the Integrity of Intestinal Tight Junction Proteins and Decreases GW Chemical-Induced Gut Leaching
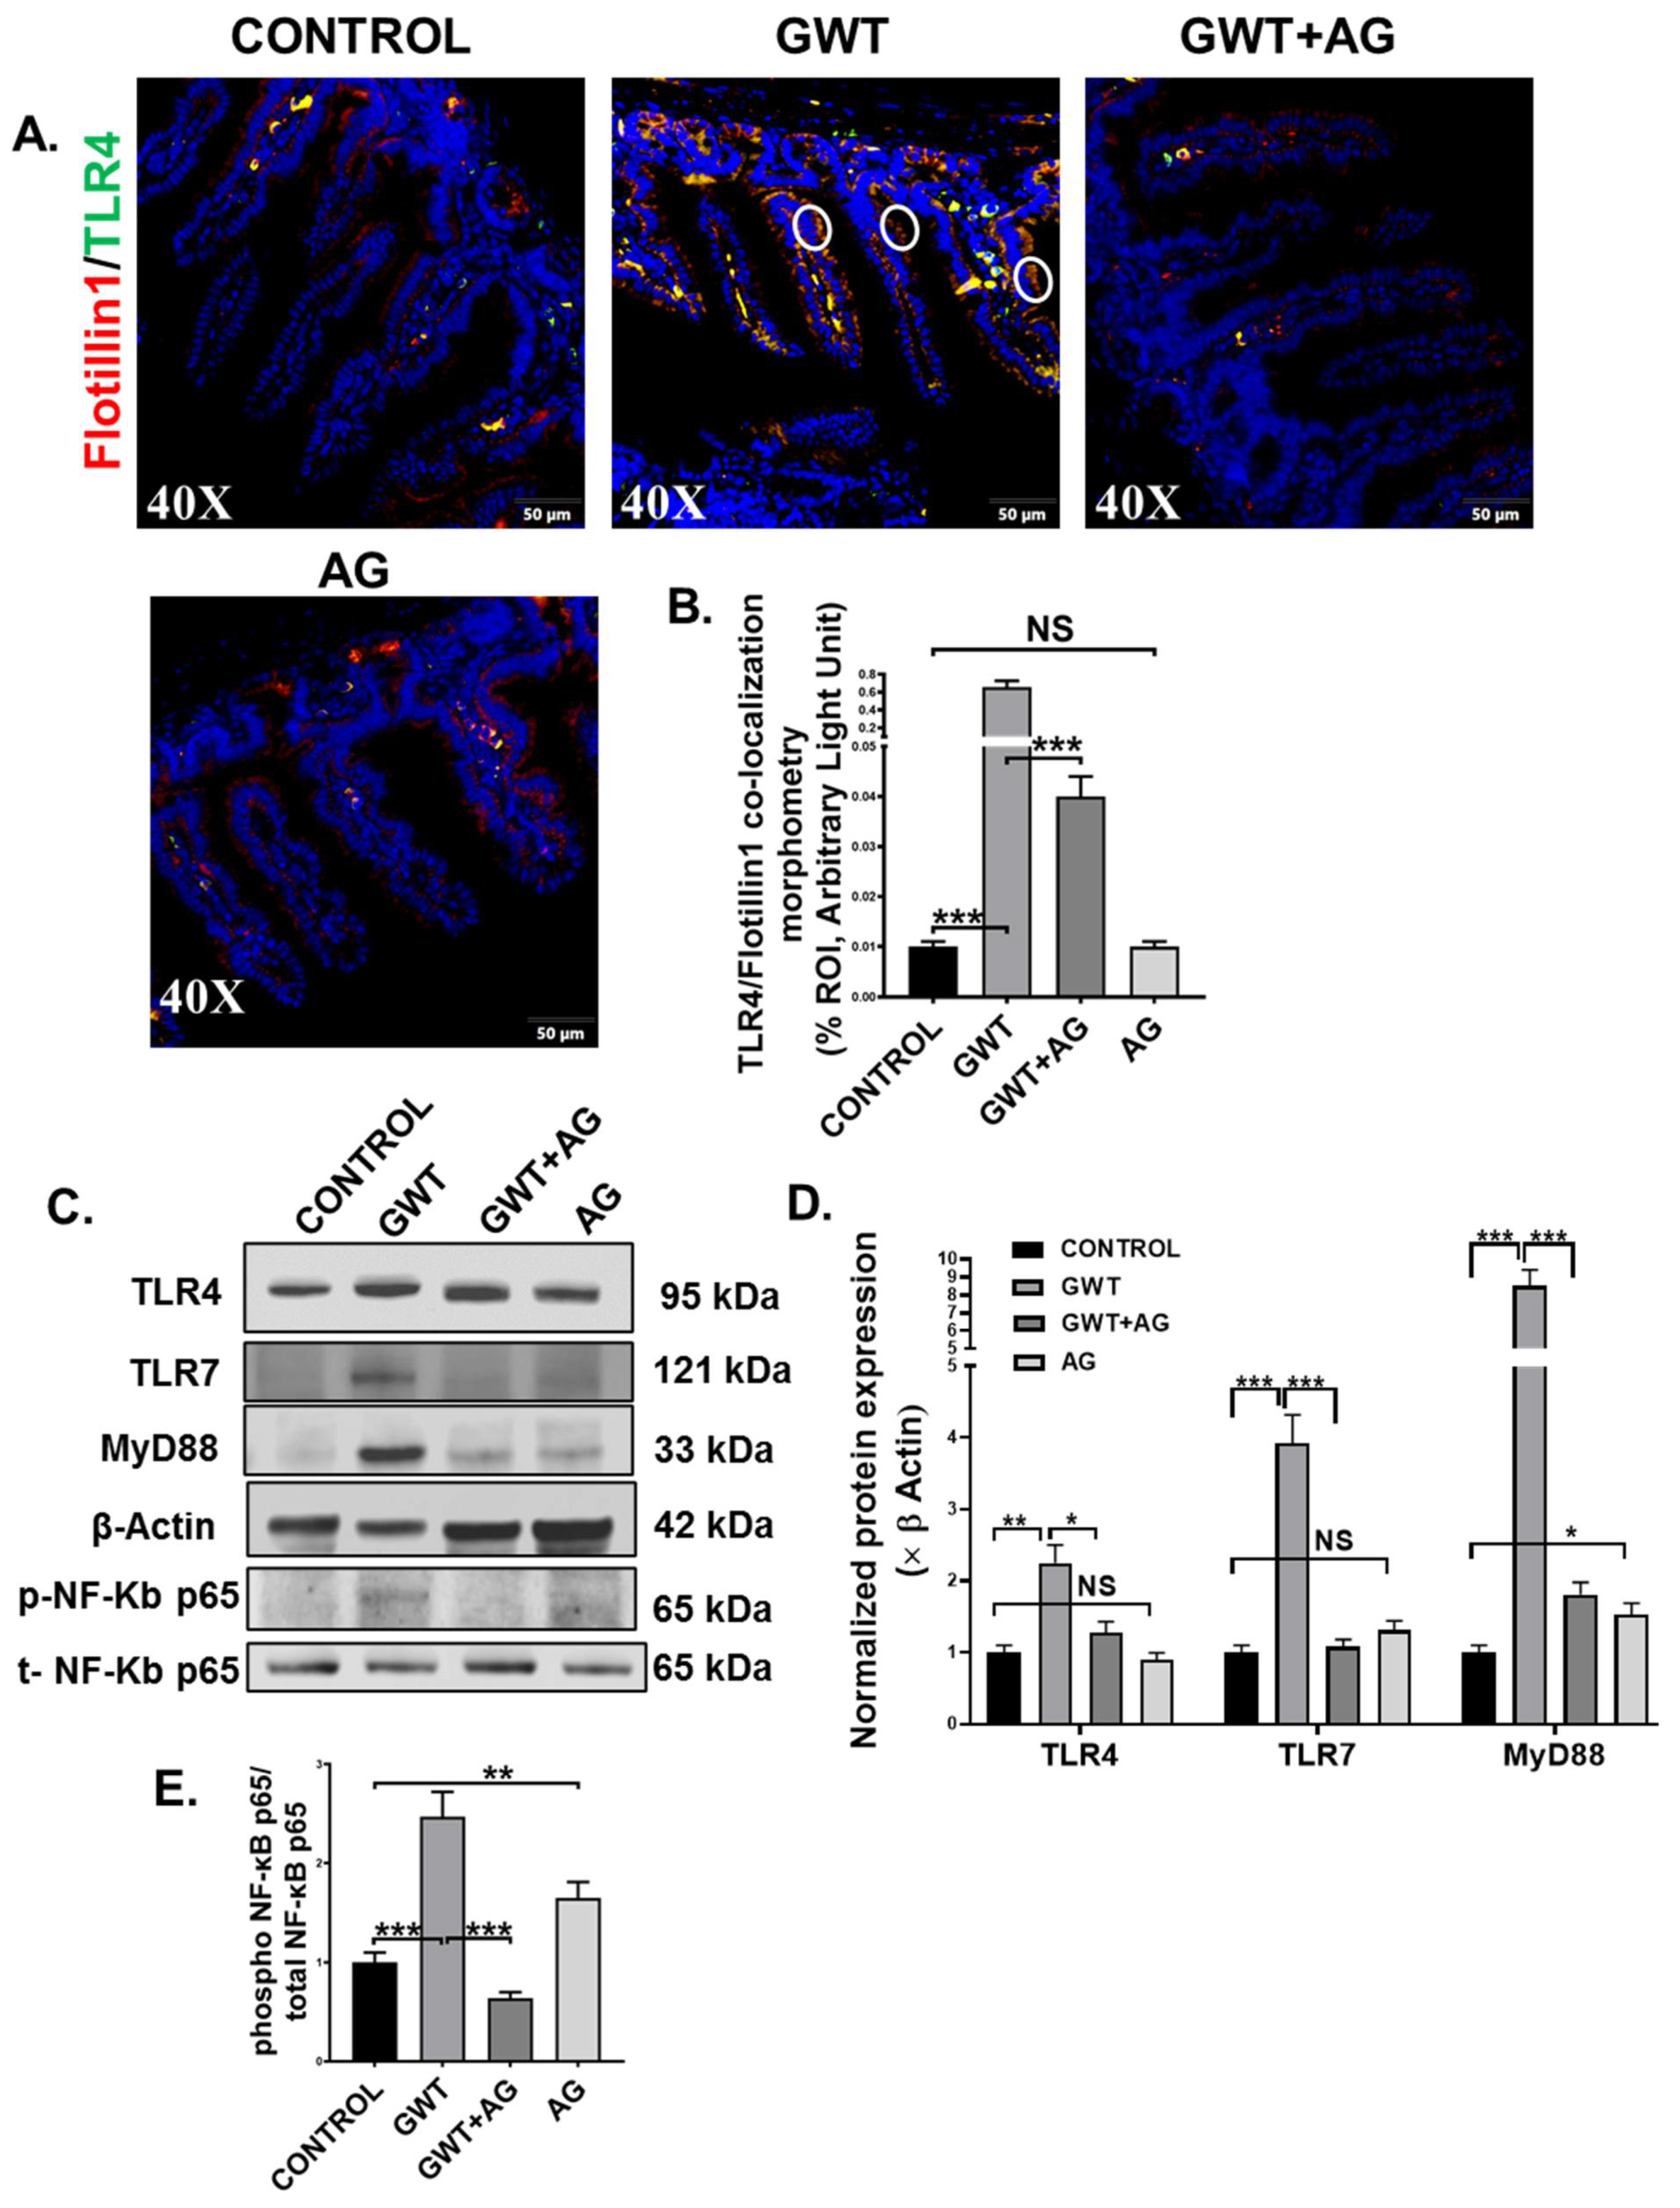
3.4. AG Attenuated Toll-Like Receptor-Mediated Downstream Proinflammatory NF-κB Signaling Pathway Following Altered Gut Bacteriome-Virome
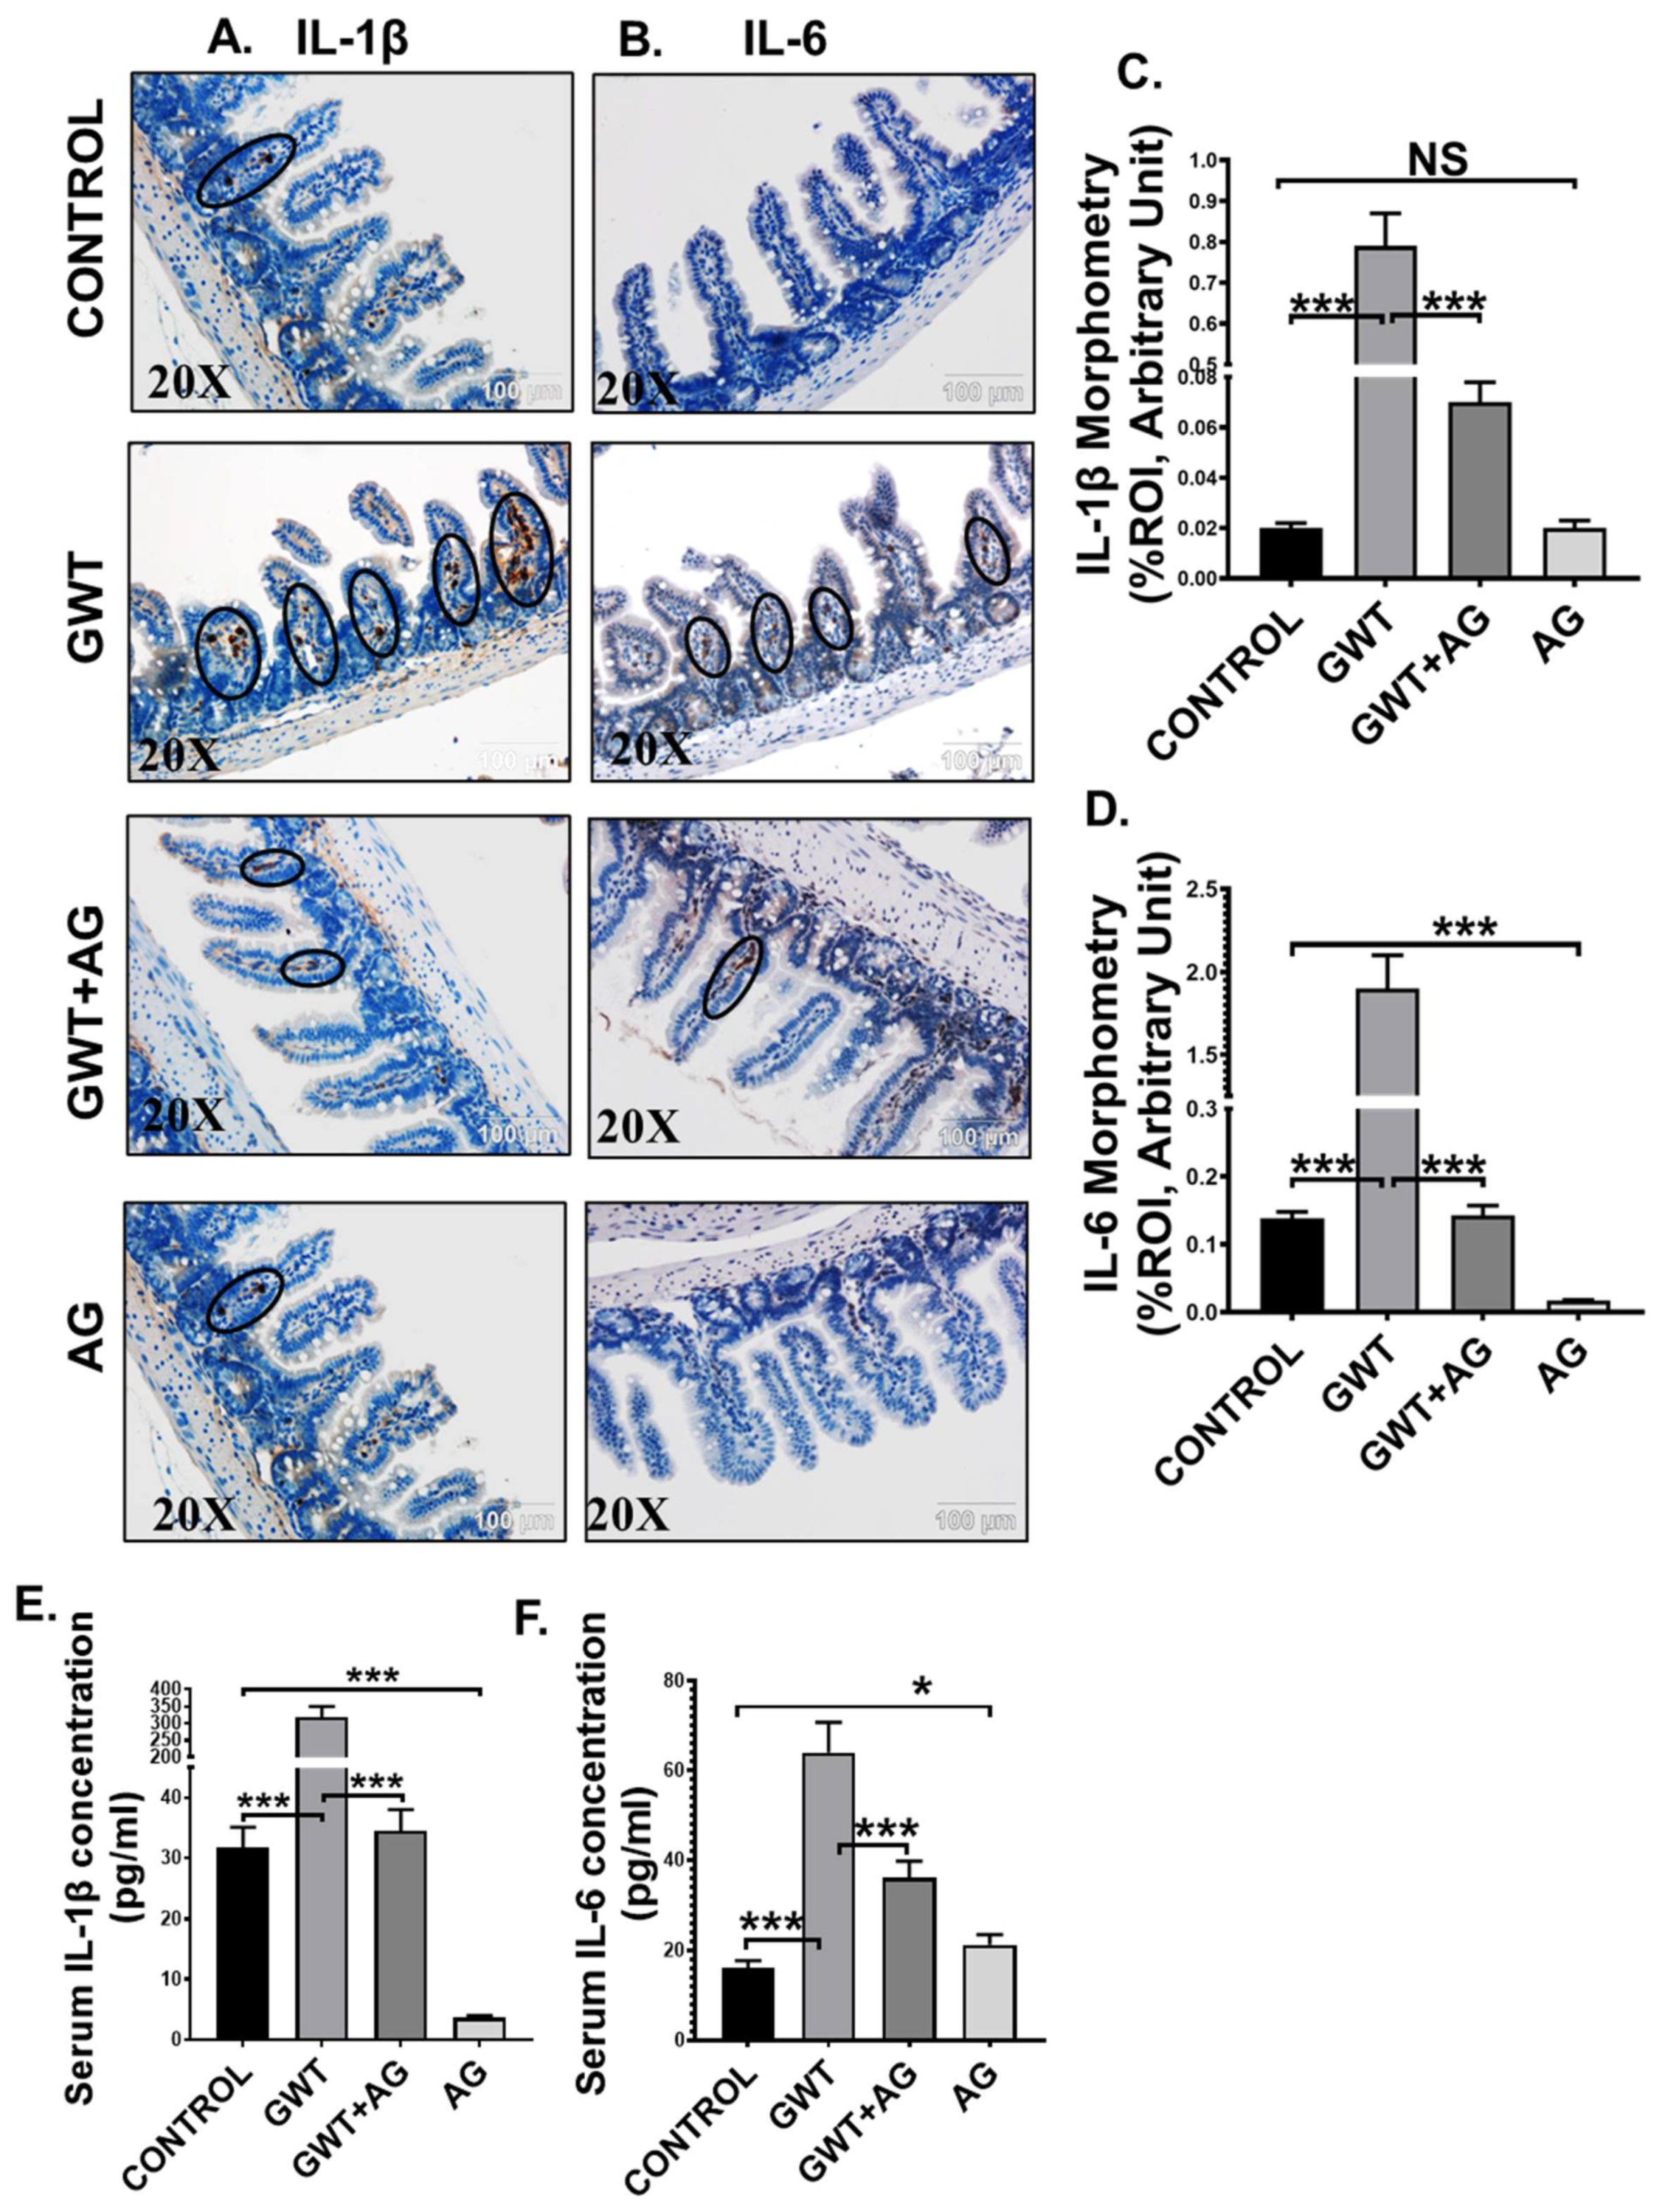
3.5. AG Treatment Diminishes Both Intestinal and Systemic Inflammation in a Mouse Model of GWI
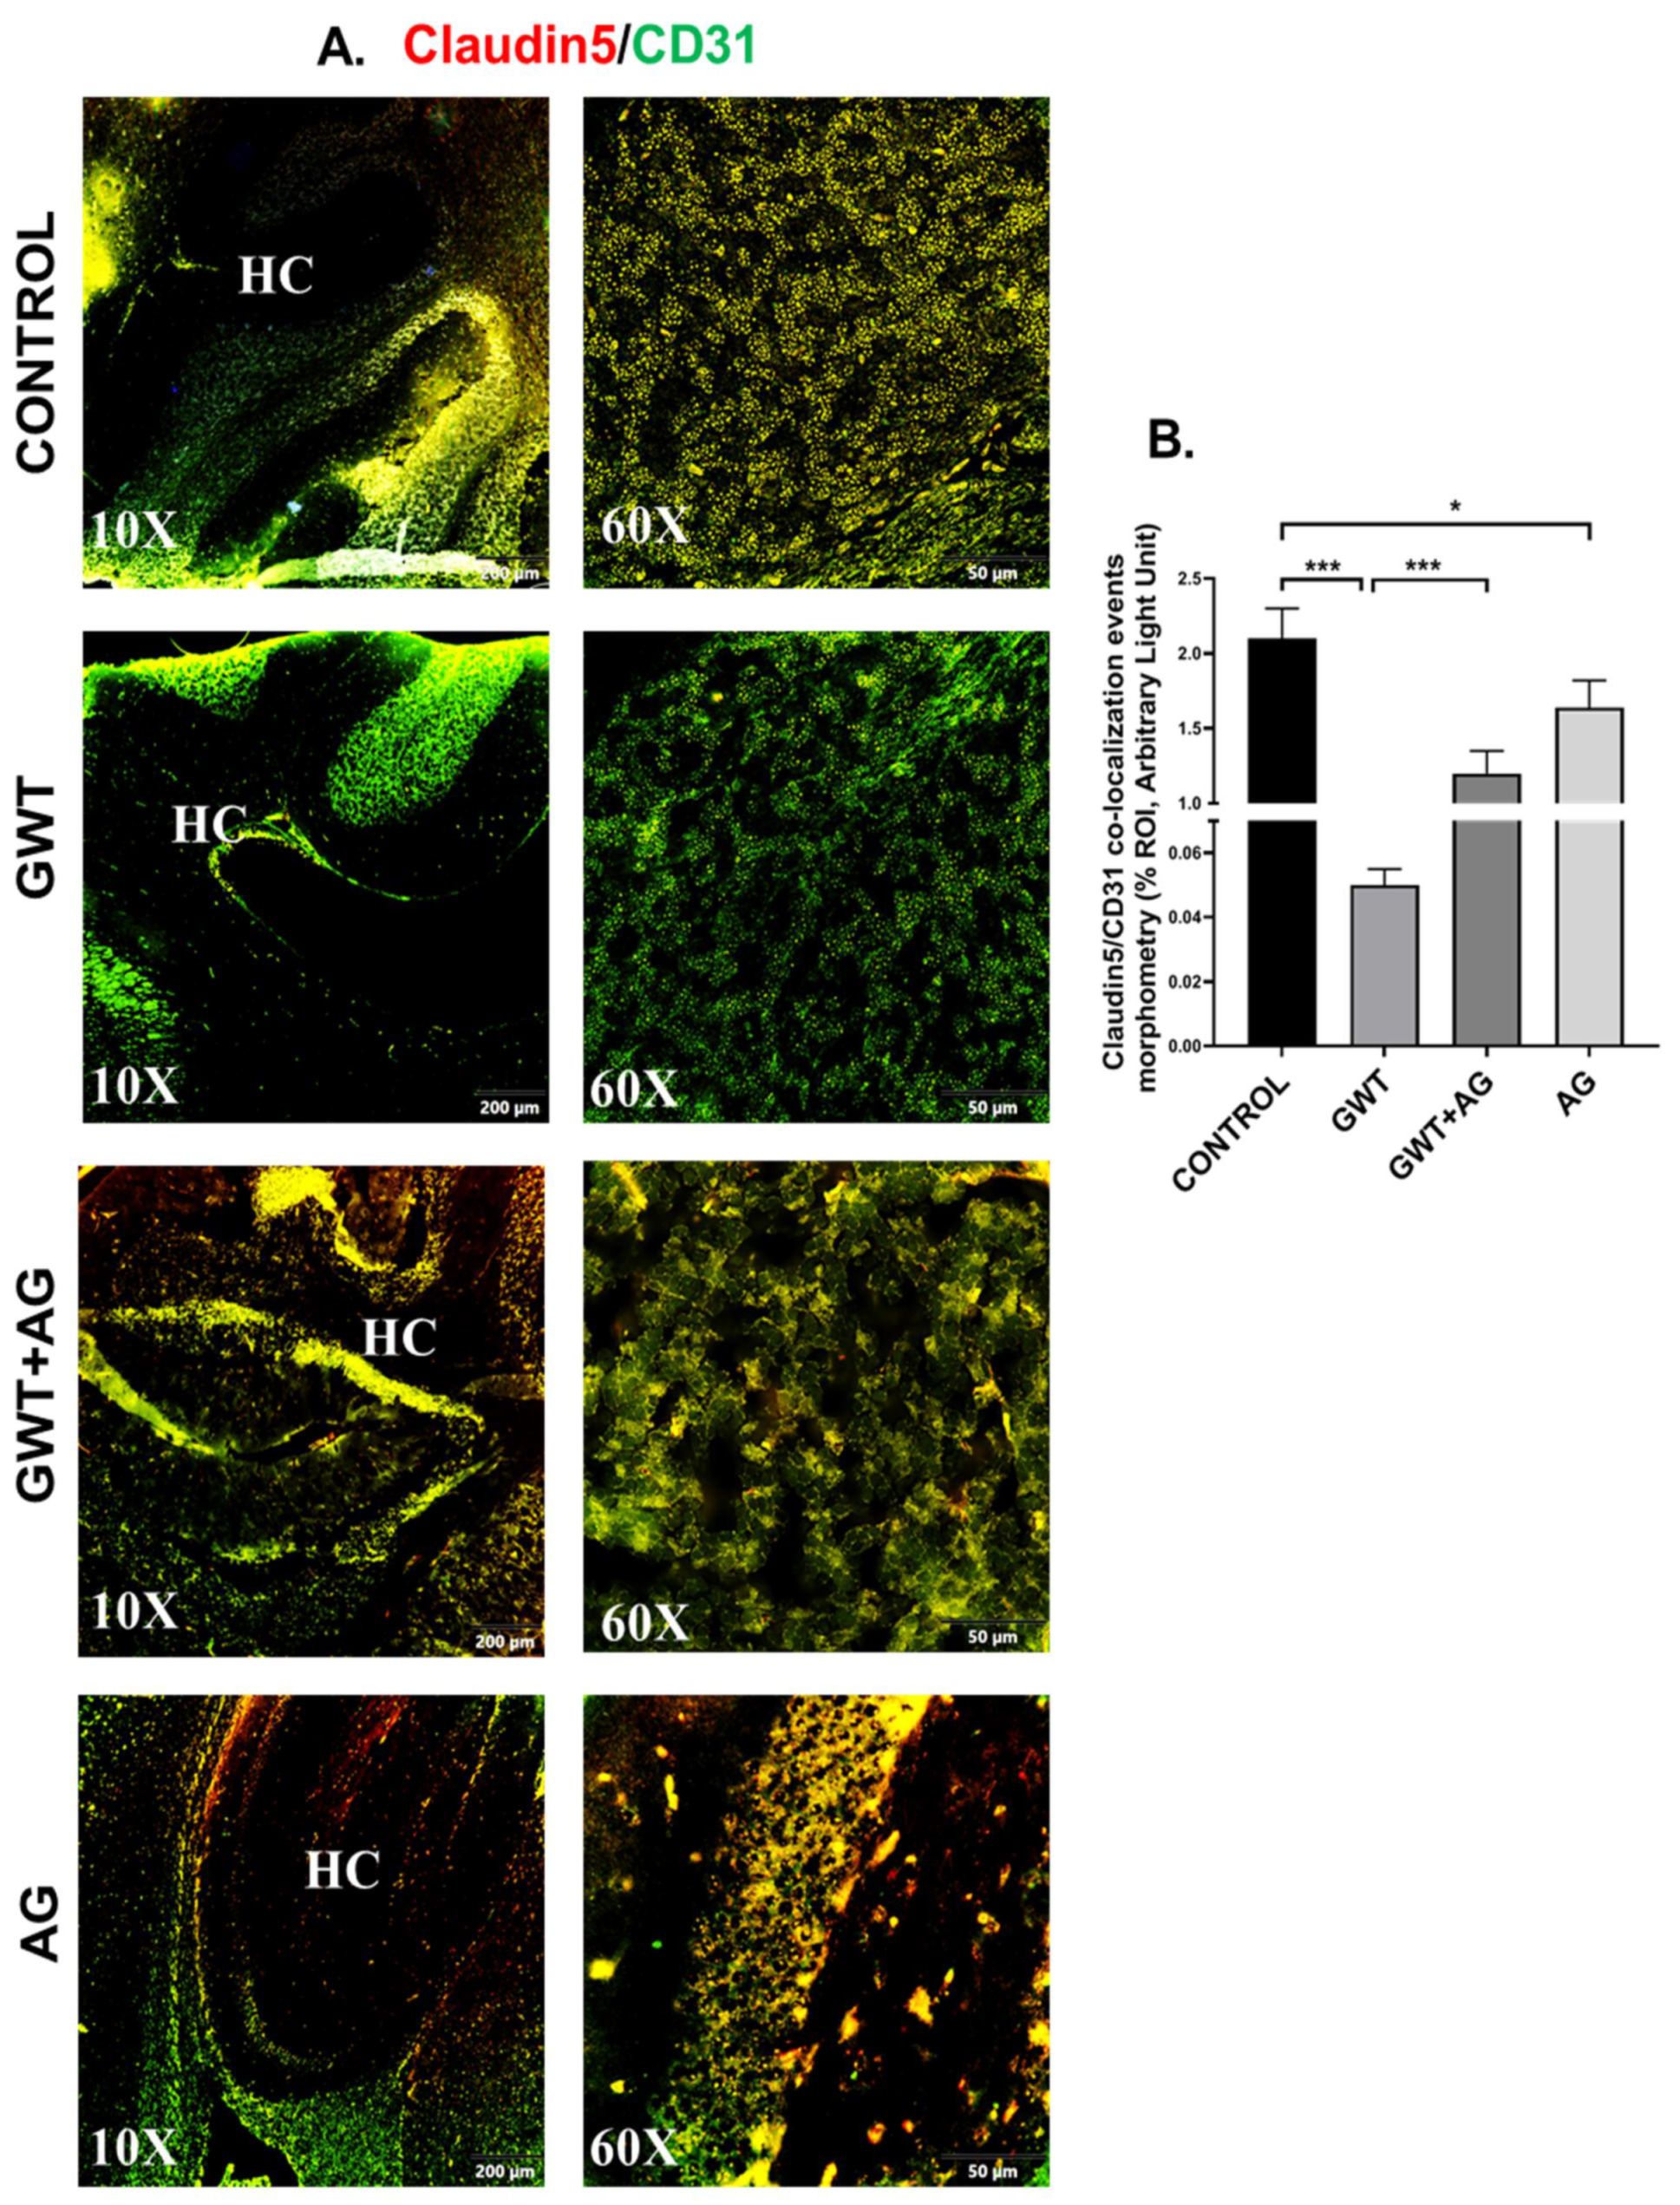
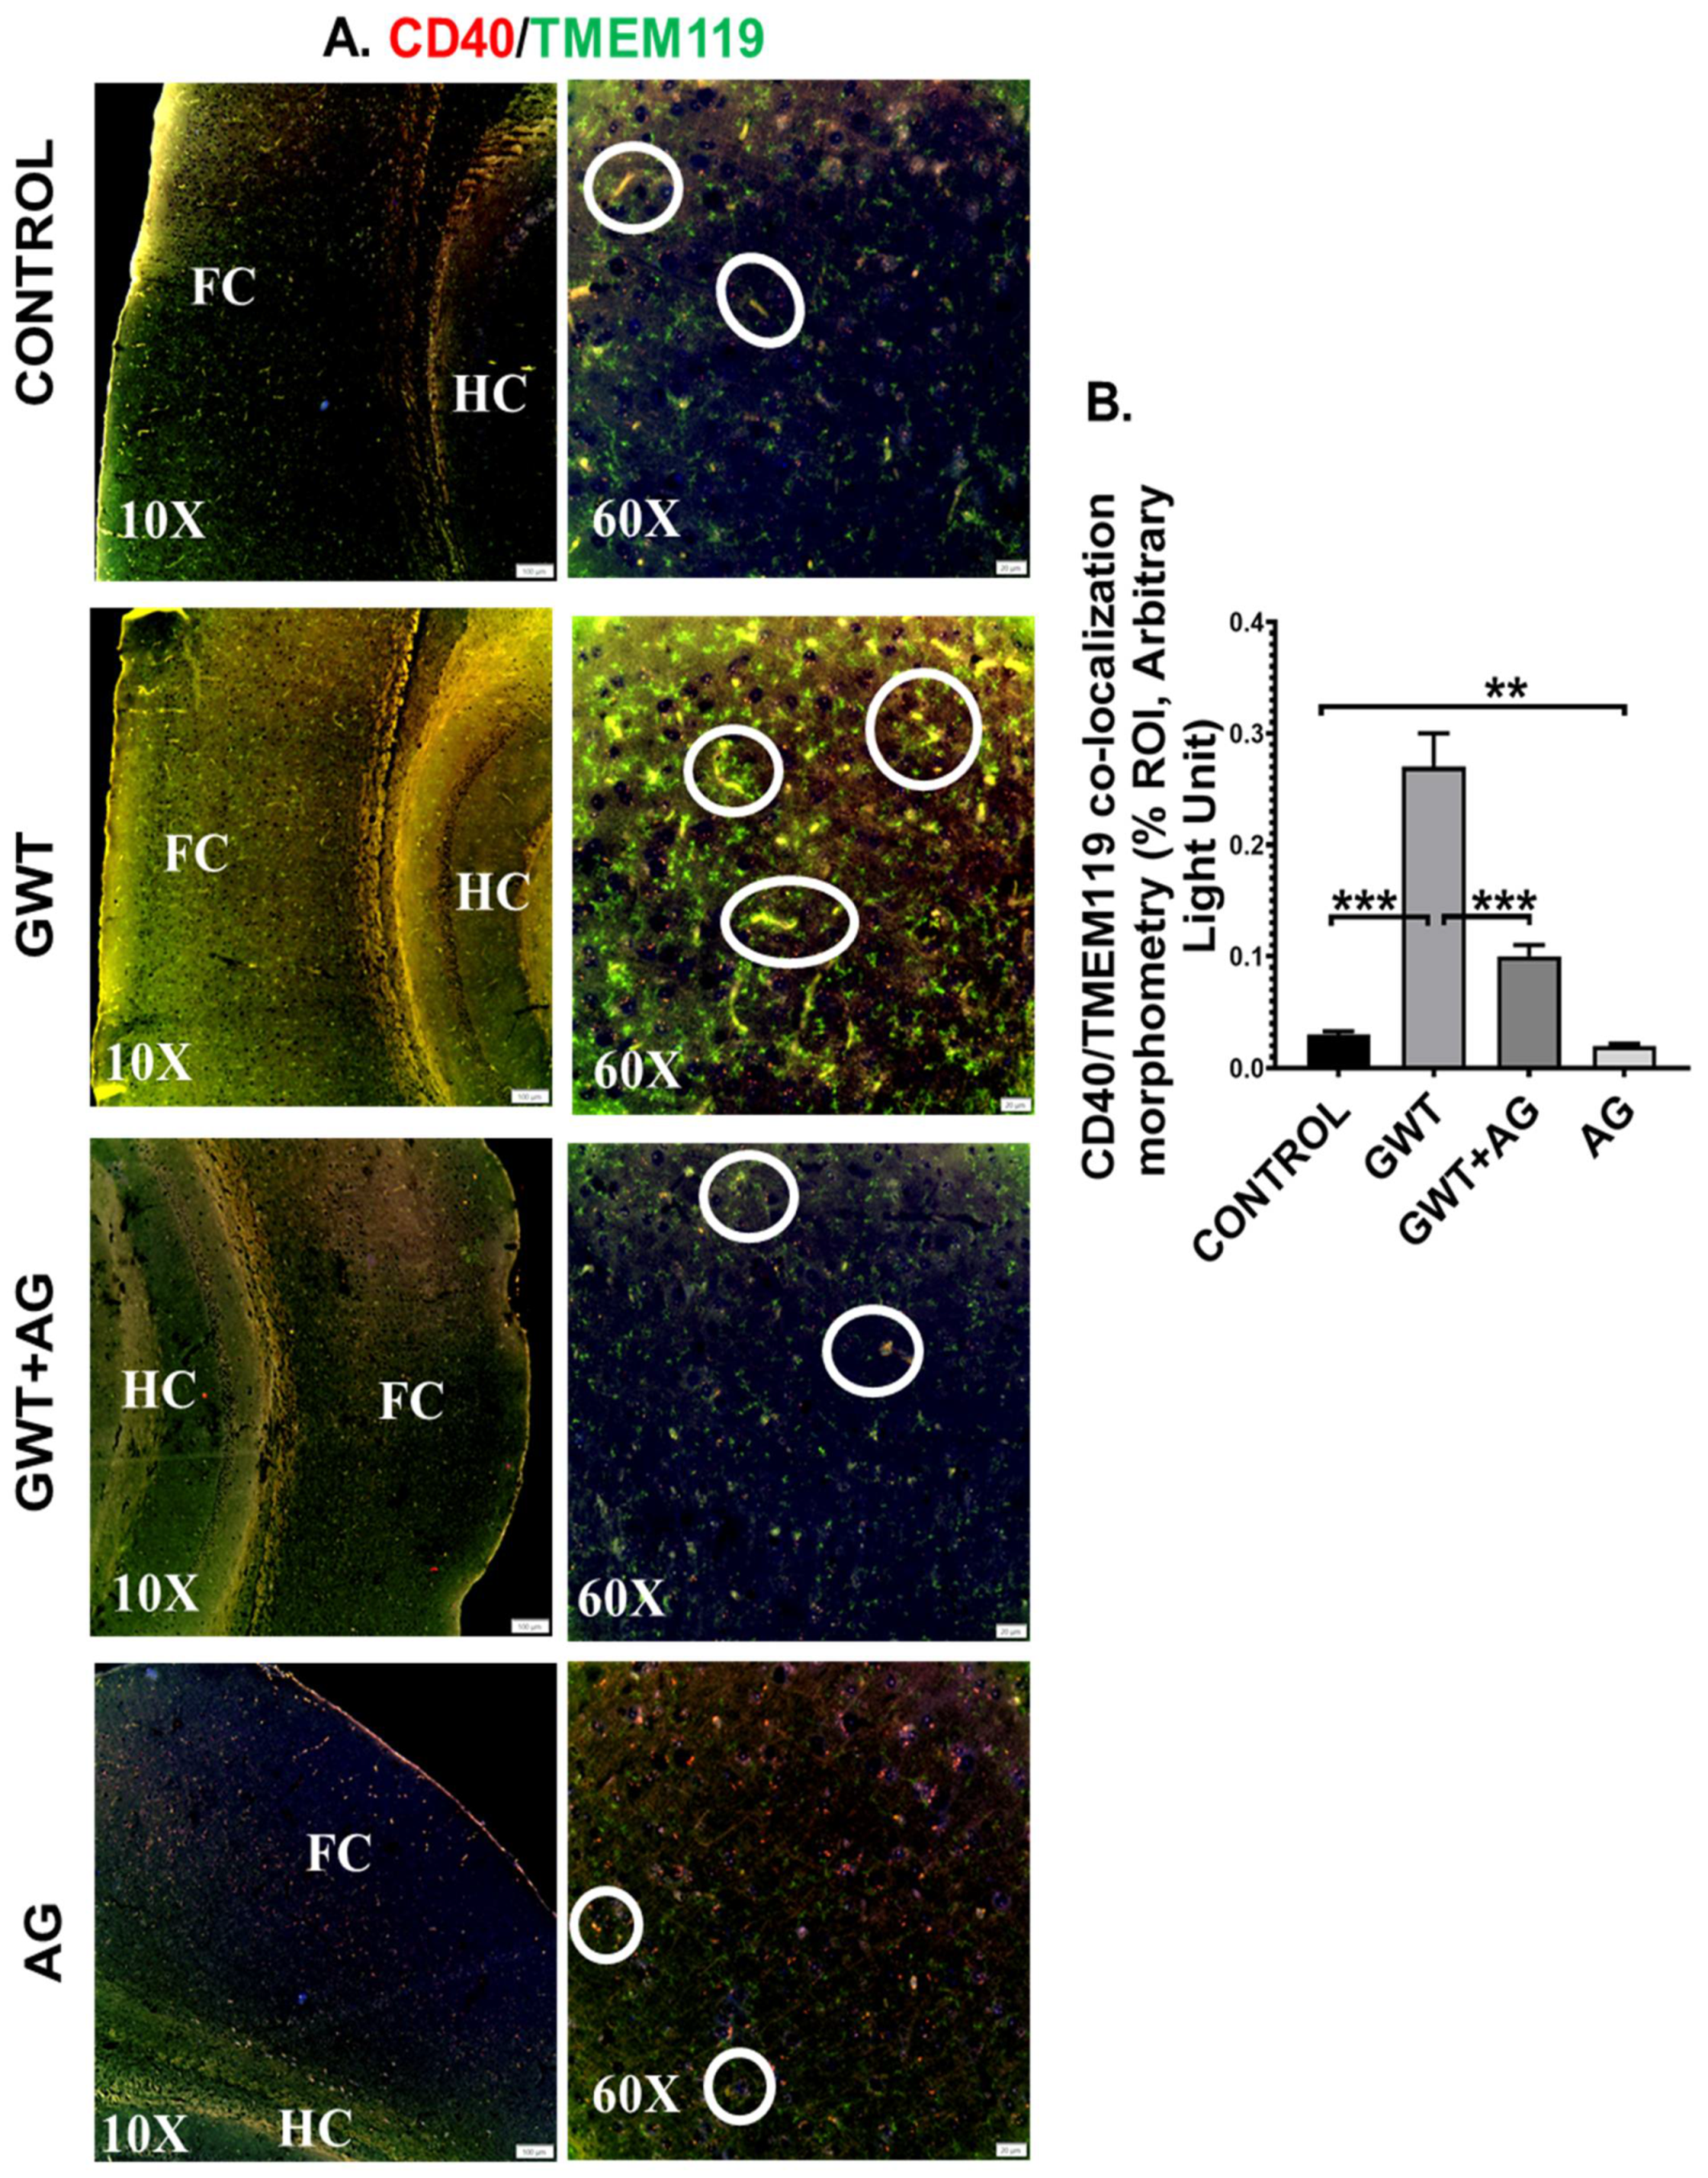
3.6. AG Reverses GWI-Associated Altered Expression of Blood–Brain Barrier (BBB) Claudin-5 Protein and Microglial Activation
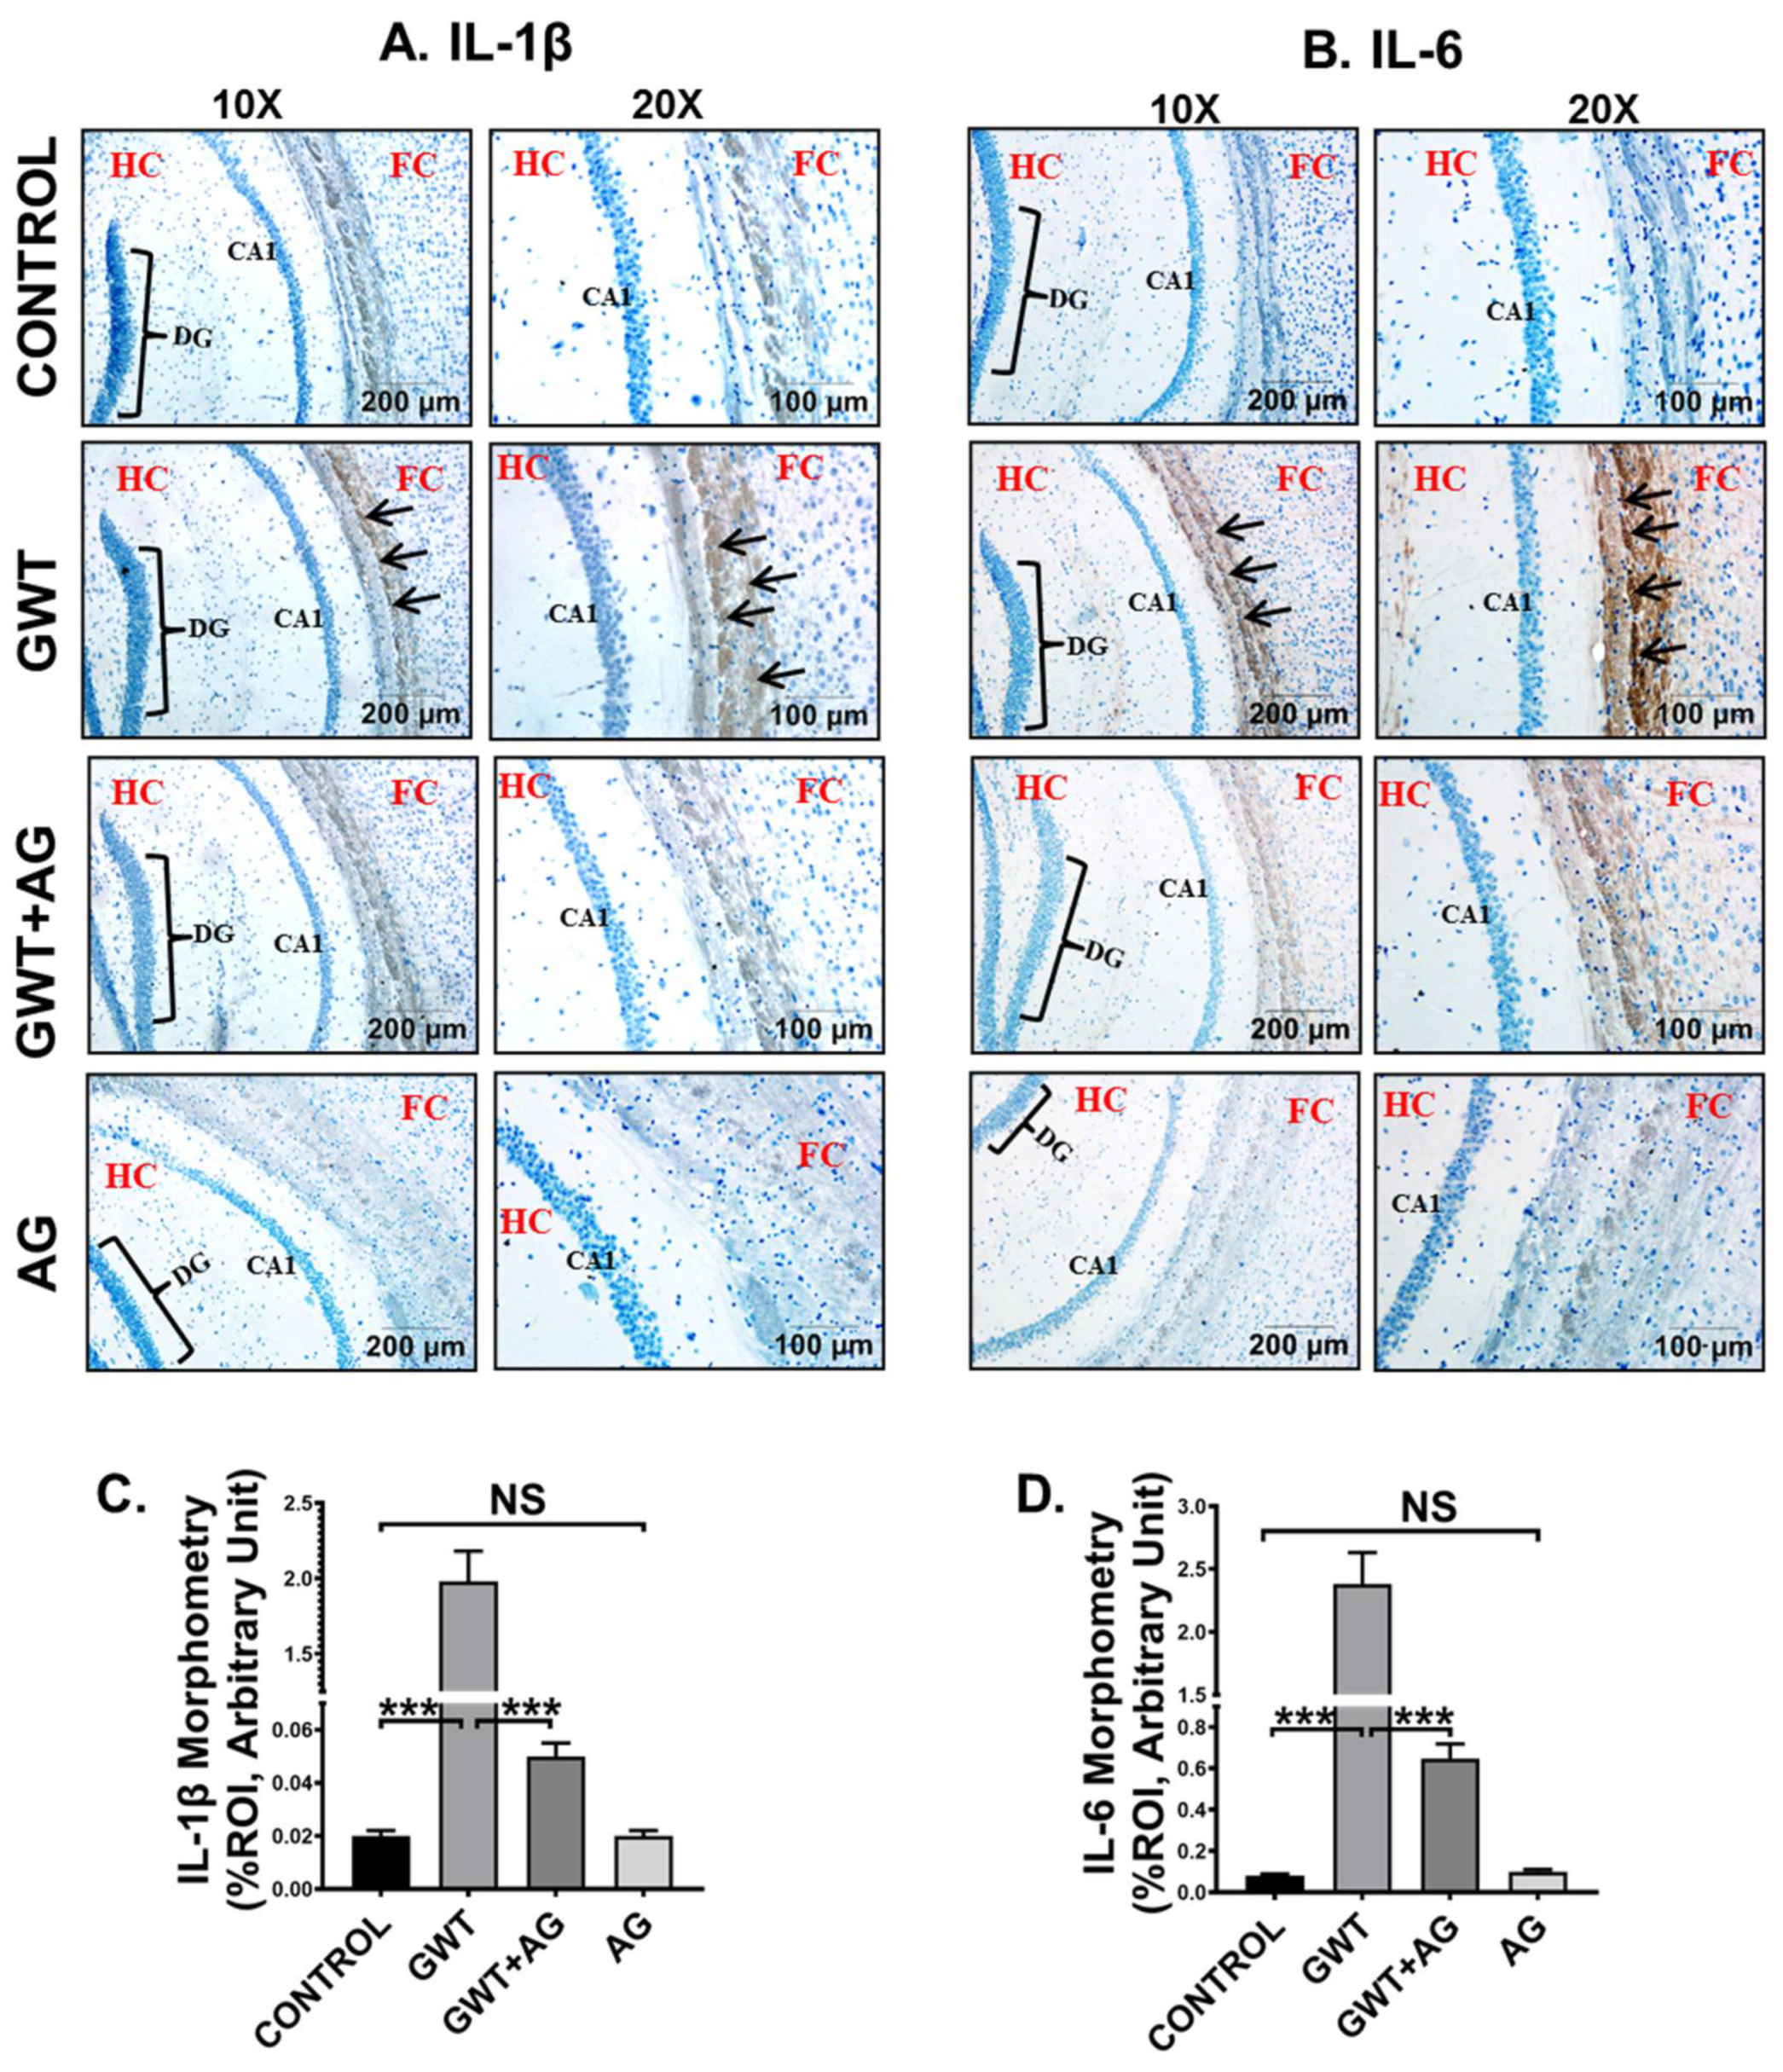
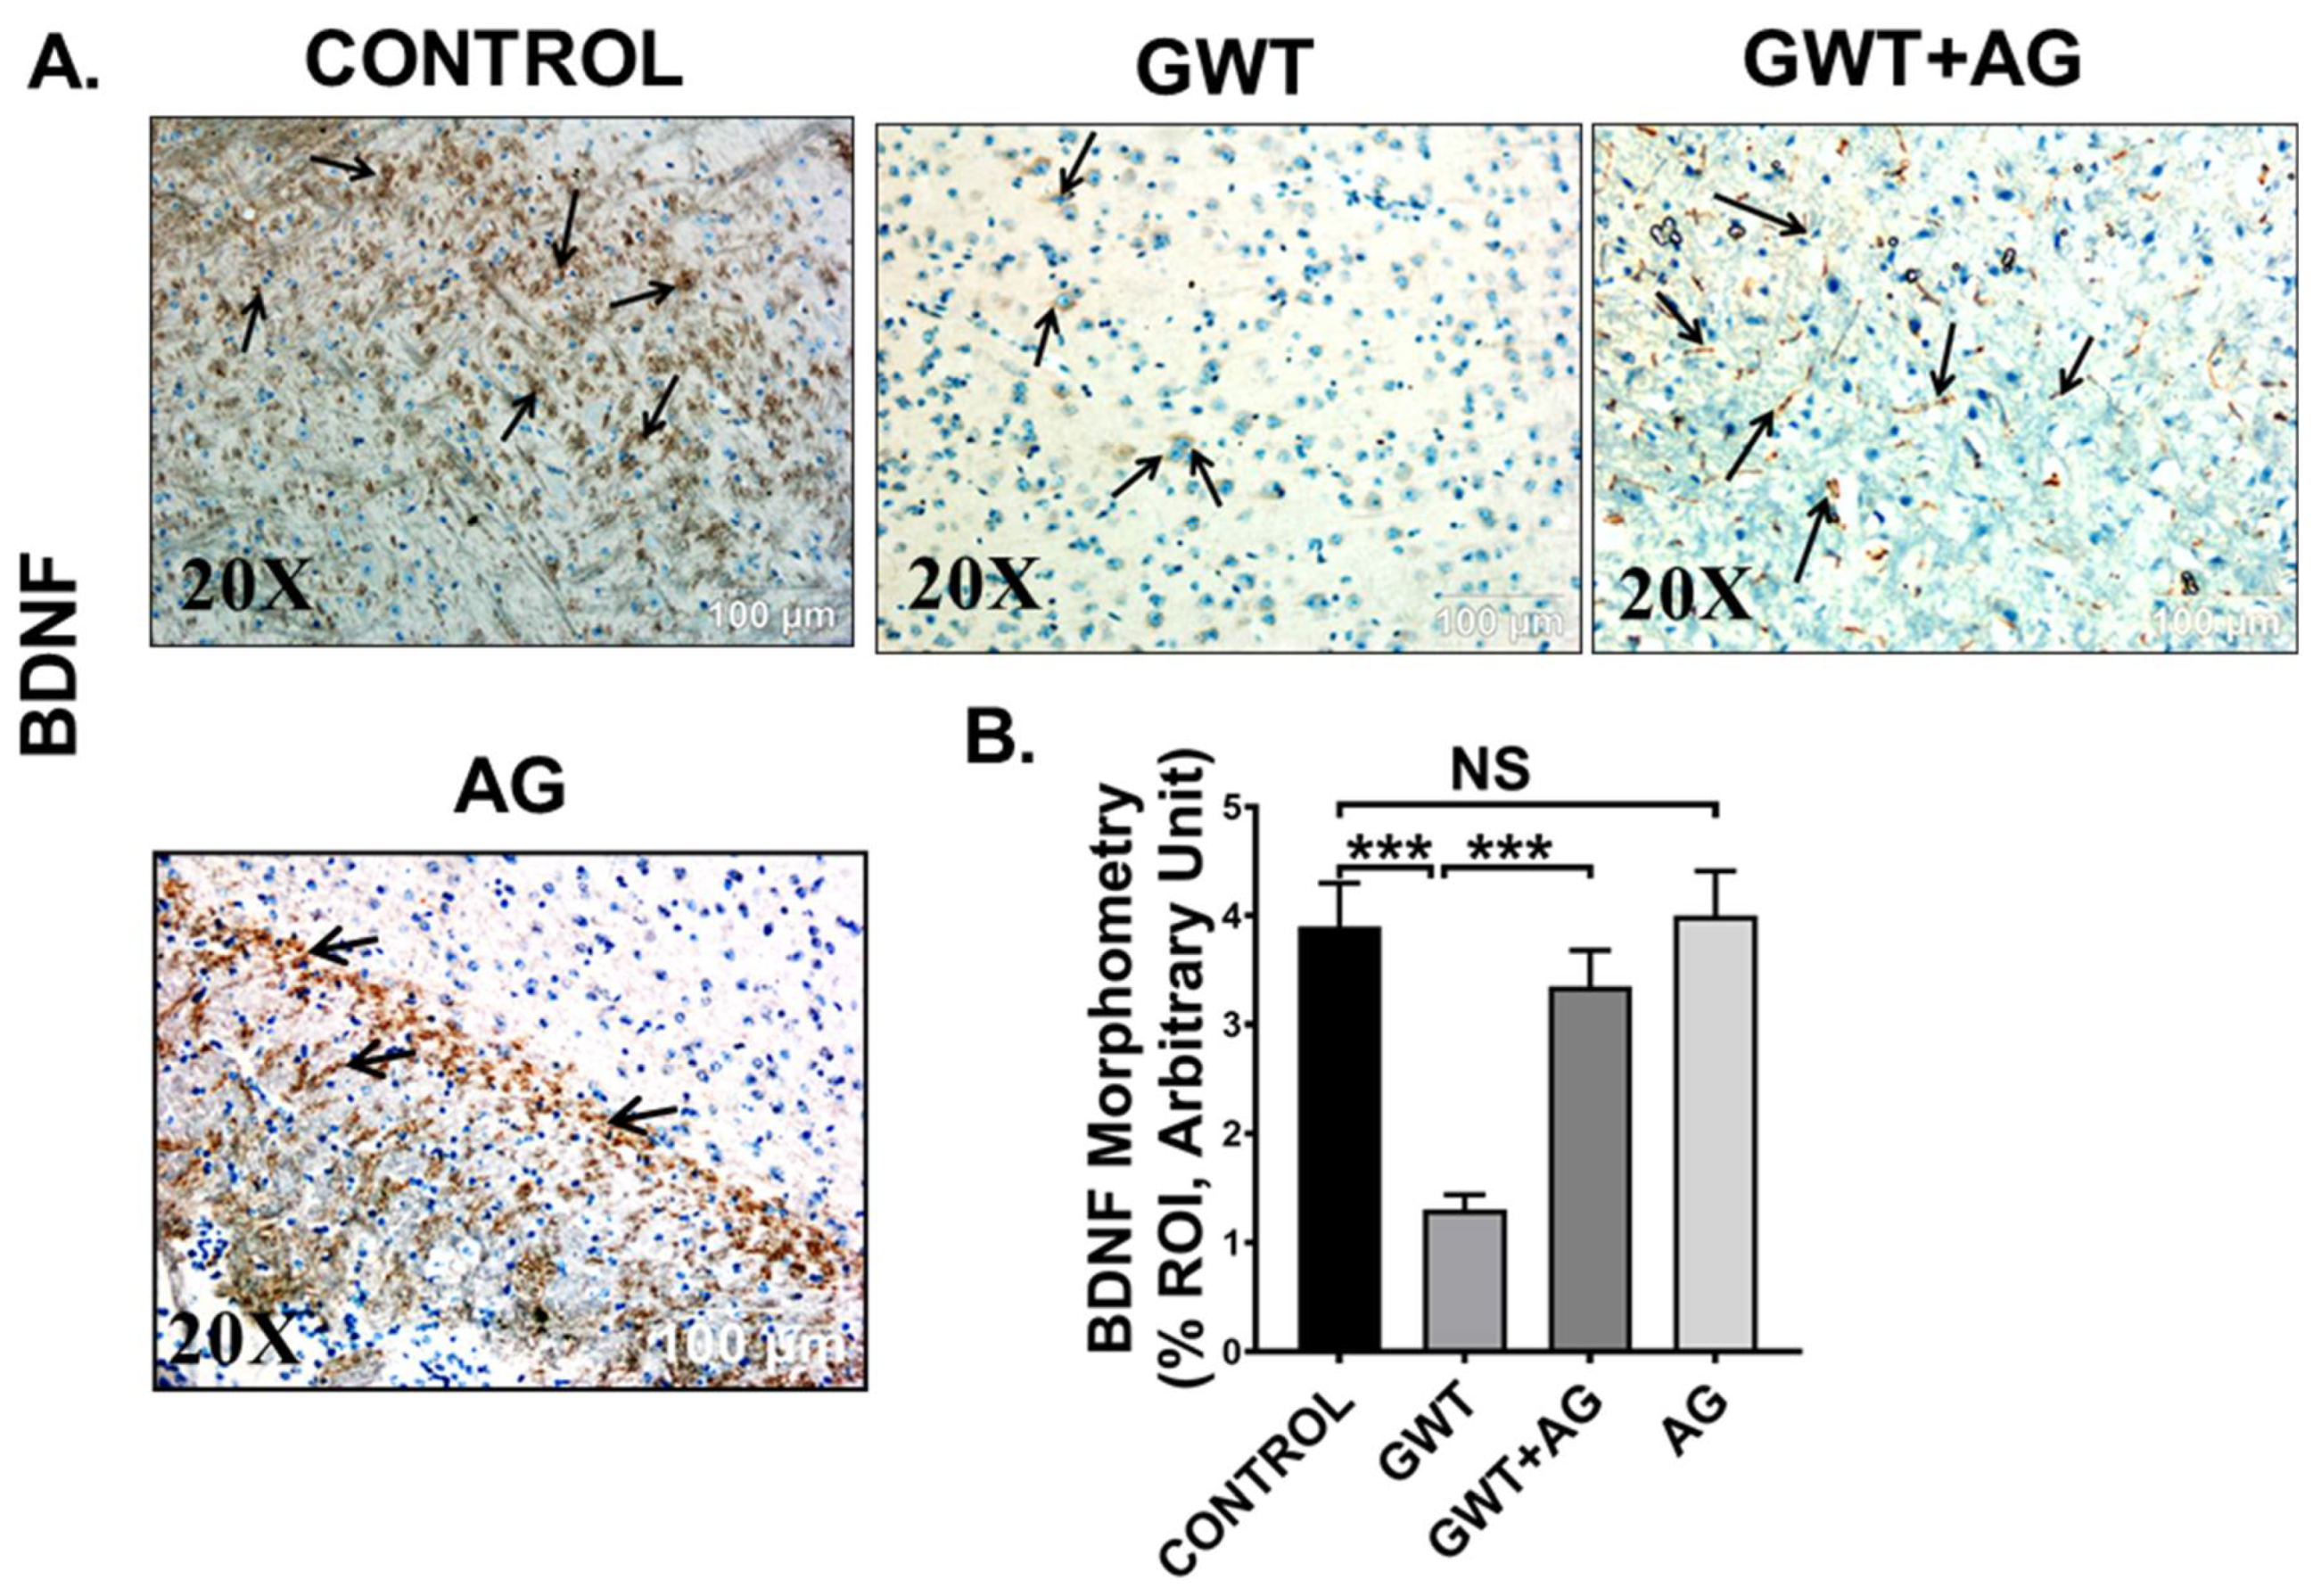
3.7. AG Attenuates Neuroinflammation and Enhanced BDNF Expression in a Mouse Model of GWI
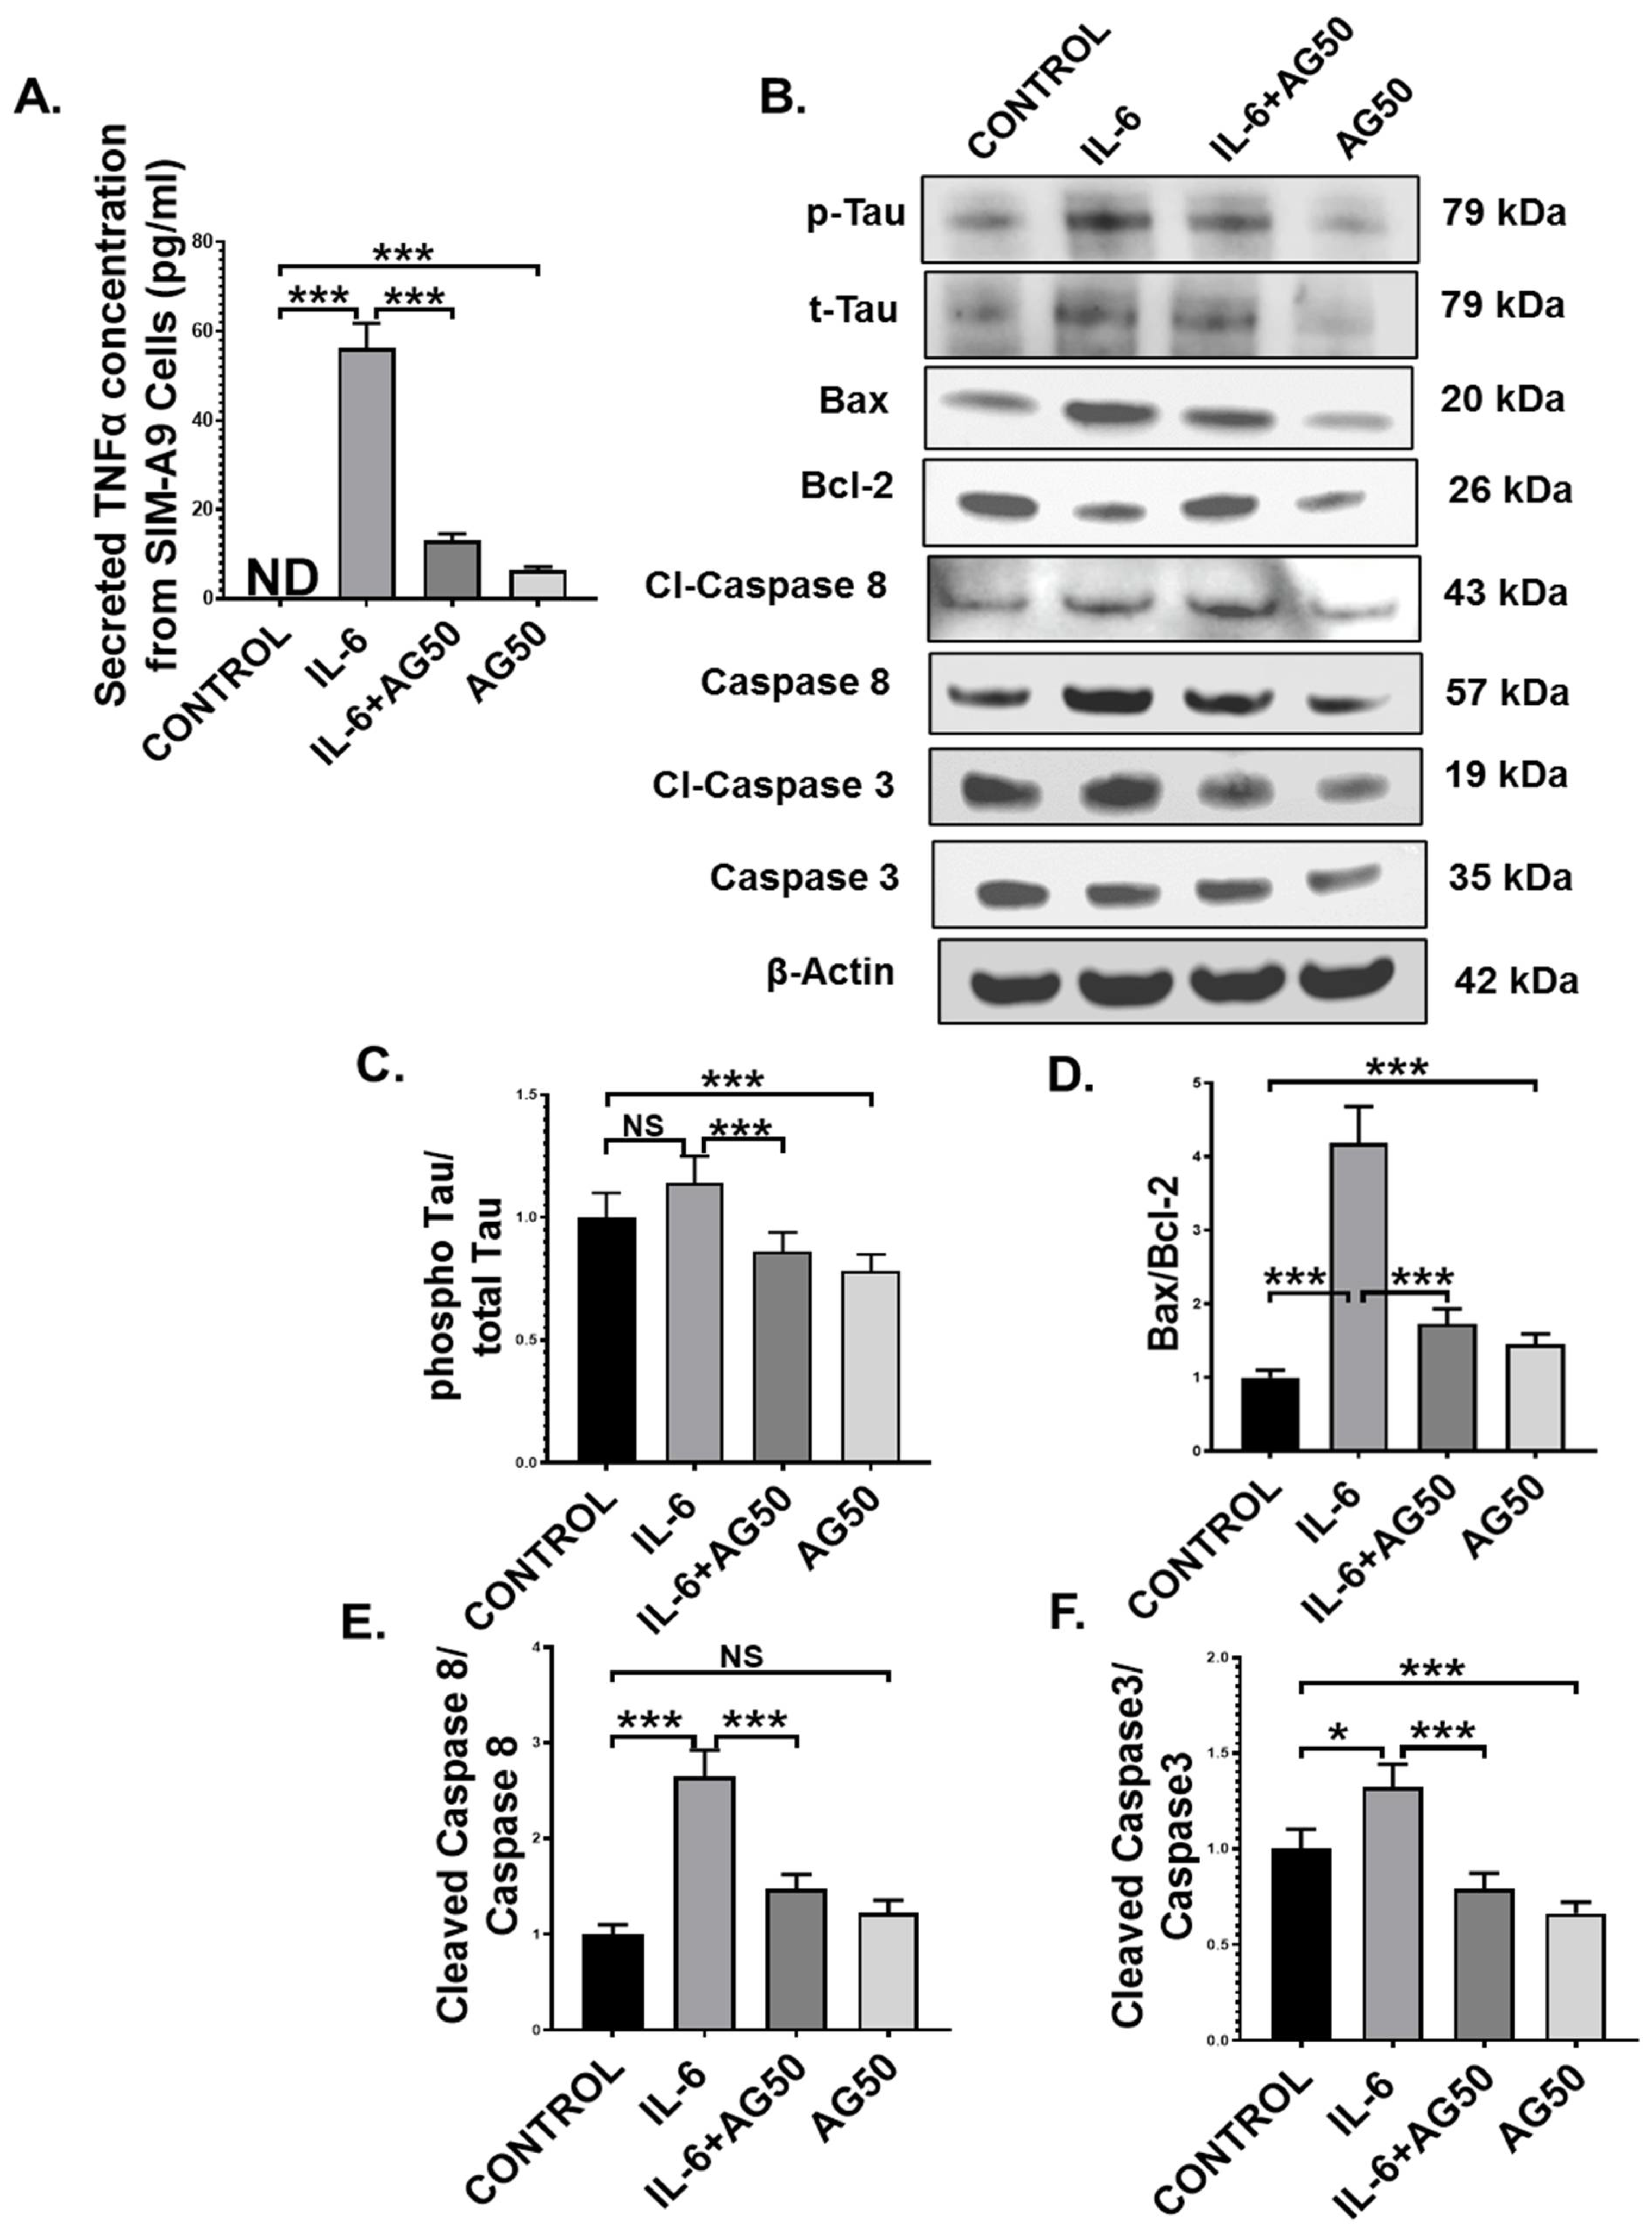
3.8. AG Lessens TNFα Production from Reactive Mouse Microglial Cells, Concomitantly Protects Mouse Neuronal Cells from Extrinsic Apoptosis and Tau Hyperphosphorylation
4. Discussion
5. Conclusions
Supplementary Materials
Author Contributions
Funding
Institutional Review Board Statement
Data Availability Statement
Acknowledgments
Conflicts of Interest
Disclaimer
References
- Proctor, S.P.; Heeren, T.; White, R.; Wolfe, J.; Borgos, M.S.; Davis, J.D.; Pepper, L.; Clapp, R.; Sutker, P.B.; Vasterling, J.J.; et al. Health status of Persian Gulf War veterans: Self-reported symptoms, environmental exposures and the effect of stress. Int. J. Epidemiol. 1998, 27, 1000–1010. [Google Scholar] [CrossRef] [PubMed]
- Blanchard, M.S.; Eisen, S.A.; Alpern, R.; Karlinsky, J.; Toomey, R.; Reda, D.J.; Murphy, F.M.; Jackson, L.W.; Kang, H.K. Chronic Multisymptom Illness Complex in Gulf War I Veterans 10 Years Later. Am. J. Epidemiol. 2005, 163, 66–75. [Google Scholar] [CrossRef] [PubMed] [Green Version]
- Steele, L. Prevalence and Patterns of Gulf War Illness in Kansas Veterans: Association of Symptoms with Characteristics of Person, Place, and Time of Military Service. Am. J. Epidemiol. 2000, 152, 992–1002. [Google Scholar] [CrossRef] [PubMed]
- White, R.F.; Steele, L.; O’Callaghan, J.P.; Sullivan, K.; Binns, J.H.; Golomb, B.A.; Bloom, F.E.; Bunker, J.A.; Crawford, F.; Graves, J.C.; et al. Recent research on Gulf War illness and other health problems in veterans of the 1991 Gulf War: Effects of toxicant exposures during deployment. Cortex 2016, 74, 449–475. [Google Scholar] [CrossRef] [PubMed] [Green Version]
- Janulewicz, P.; Krengel, M.; Quinn, E.; Heeren, T.; Toomey, R.; Killiany, R.; Zundel, C.; Ajama, J.; O’Callaghan, J.; Steele, L.; et al. The Multiple Hit Hypothesis for Gulf War Illness: Self-Reported Chemical/Biological Weapons Exposure and Mild Traumatic Brain Injury. Brain Sci. 2018, 8, 198. [Google Scholar] [CrossRef] [PubMed] [Green Version]
- Alhasson, F.; Das, S.; Seth, R.; Dattaroy, D.; Chandrashekaran, V.; Ryan, C.N.; Chan, L.S.; Testerman, T.; Burch, J.; Hofseth, L.J.; et al. Altered gut microbiome in a mouse model of Gulf War Illness causes neuroinflammation and intestinal injury via leaky gut and TLR4 activation. PLoS ONE 2017, 12, e0172914. [Google Scholar] [CrossRef]
- Bose, D.; Mondal, A.; Saha, P.; Kimono, D.; Sarkar, S.; Seth, R.K.; Janulewicz, P.; Sullivan, K.; Horner, R.; Klimas, N.; et al. TLR Antagonism by Sparstolonin B Alters Microbial Signature and Modulates Gastrointestinal and Neuronal Inflammation in Gulf War Illness Preclinical Model. Brain Sci. 2020, 10, 532. [Google Scholar] [CrossRef]
- Seth, R.K.; Kimono, D.; Alhasson, F.; Sarkar, S.; Albadrani, M.; Lasley, S.K.; Horner, R.; Janulewicz, P.; Nagarkatti, M.; Nagarkatti, P.; et al. Increased butyrate priming in the gut stalls microbiome associated-gastrointestinal inflammation and hepatic metabolic reprogramming in a mouse model of Gulf War Illness. Toxicol. Appl. Pharmacol. 2018, 350, 64–77. [Google Scholar] [CrossRef]
- Kimono, D.; Bose, D.; Seth, R.K.; Mondal, A.; Saha, P.; Janulewicz, P.; Sullivan, K.; Lasley, S.; Horner, R.; Klimas, N.; et al. Host Akkermansia muciniphila Abundance Correlates with Gulf War Illness Symptom Persistence via NLRP3-Mediated Neuroinflammation and Decreased Brain-Derived Neurotrophic Factor. Neurosci. Insights 2020, 15. [Google Scholar] [CrossRef]
- Seth, R.K.; Maqsood, R.; Mondal, A.; Bose, D.; Kimono, D.; Holland, L.A.; Lloyd, P.J.; Klimas, N.; Horner, R.D.; Sullivan, K.; et al. Gut DNA Virome Diversity and Its Association with Host Bacteria Regulate Inflammatory Phenotype and Neuronal Immunotoxicity in Experimental Gulf War Illness. Viruses 2019, 11, 968. [Google Scholar] [CrossRef] [Green Version]
- Bose, D.; Saha, P.; Mondal, A.; Fanelli, B.; Seth, R.K.; Janulewicz, P.; Sullivan, K.; Lasley, S.; Horner, R.; Colwell, R.R.; et al. Obesity Worsens Gulf War Illness Symptom Persistence Pathology by Linking Altered Gut Microbiome Species to Long-Term Gastrointestinal, Hepatic, and Neuronal Inflammation in a Mouse Model. Nutrients 2020, 12, 2764. [Google Scholar] [CrossRef] [PubMed]
- Kimono, D.; Sarkar, S.; Albadrani, M.; Seth, R.; Bose, D.; Mondal, A.; Li, Y.; Kar, A.N.; Nagarkatti, M.; Nagarkatti, P.; et al. Dysbiosis-Associated Enteric Glial Cell Immune-Activation and Redox Imbalance Modulate Tight Junction Protein Expression in Gulf War Illness Pathology. Front. Physiol. 2019, 10, 1229. [Google Scholar] [CrossRef] [PubMed] [Green Version]
- Bao, Z.; Guan, S.; Cheng, C.; Wu, S.; Wong, S.H.; Kemeny, D.M.; Leung, B.P.; Wong, W.S.F. A Novel Antiinflammatory Role for Andrographolide in Asthma via Inhibition of the Nuclear Factor-κB Pathway. Am. J. Respir. Crit. Care Med. 2009, 179, 657–665. [Google Scholar] [CrossRef] [PubMed]
- Li, Y.; He, S.; Tang, J.; Ding, N.; Chu, X.; Cheng, L.; Ding, X.; Liang, T.; Feng, S.; Rahman, S.U.; et al. Andrographolide Inhibits Inflammatory Cytokines Secretion in LPS-Stimulated RAW264.7 Cells through Suppression of NF-κB/MAPK Signaling Pathway. Evid.-Based Complement. Altern. Med. 2017, 2017, 1–9. [Google Scholar] [CrossRef] [Green Version]
- Mussard, E.; Cesaro, A.; Lespessailles, E.; Legrain, B.; Berteina-Raboin, S.; Toumi, H. Andrographolide, A Natural Antioxidant: An Update. Antioxidants 2019, 8, 571. [Google Scholar] [CrossRef] [Green Version]
- Varma, A.; Padh, H.; Shrivastava, N. Andrographolide: A New Plant-Derived Antineoplastic Entity on Horizon. Evid.-Based Complement. Altern. Med. 2011, 2011, 1–9. [Google Scholar] [CrossRef] [Green Version]
- Handa, S.S.; Sharma, A. Hepatoprotective activity of andrographolide against galactosamine & paracetamol intoxi-cation in rats. Indian J. Med. Res. 1990, 92, 284–292. [Google Scholar]
- Trivedi, N.P.; Rawal, U.M.; Patel, B.P. Hepatoprotective Effect of Andrographolide Against Hexachlorocyclohexane-Induced Oxidative Injury. Integr. Cancer Ther. 2007, 6, 271–280. [Google Scholar] [CrossRef]
- Cabrera, D.; Wree, A.; Povero, D.; Solís, N.; Hernandez, A.; Pizarro, M.; Moshage, H.; Torres, J.; Feldstein, A.E.; Cabello-Verrugio, C.; et al. Andrographolide Ameliorates Inflammation and Fibrogenesis and Attenuates Inflammasome Activation in Experimental Non-Alcoholic Steatohepatitis. Sci. Rep. 2017, 7, 1–12. [Google Scholar] [CrossRef]
- Zhu, T.; Zhang, W.; Xiao, M.; Chen, H.; Jin, H. Protective Role of Andrographolide in Bleomycin-Induced Pulmonary Fibrosis in Mice. Int. J. Mol. Sci. 2013, 14, 23581–23596. [Google Scholar] [CrossRef]
- Chan, S.J.; Wong, W.S.F.; Wong, P.T.H.; Bian, J.-S. Neuroprotective effects of andrographolide in a rat model of permanent cerebral ischaemia. Br. J. Pharmacol. 2010, 161, 668–679. [Google Scholar] [CrossRef] [Green Version]
- Varela-Nallar, L.; Arredondo, S.B.; Rojas, C.T.; Hancke, J.; Inestrosa, N.C. Andrographolide Stimulates Neurogenesis in the Adult Hippocampus. Neural Plast. 2015, 2015, 1–13. [Google Scholar] [CrossRef] [Green Version]
- Lu, J.; Ma, Y.; Wu, J.; Huang, H.; Wang, X.; Chen, Z.; Chen, J.; He, H.; Huang, C. A review for the neuroprotective effects of andrographolide in the central nervous system. Biomed. Pharmacother. 2019, 117, 109078. [Google Scholar] [CrossRef] [PubMed]
- Xia, Y.-F.; Ye, B.-Q.; Li, Y.-D.; Wang, J.-G.; He, X.-J.; Lin, X.; Yao, X.; Ma, D.; Slungaard, A.; Hebbel, R.P.; et al. Andrographolide Attenuates Inflammation by Inhibition of NF-κB Activation through Covalent Modification of Reduced Cysteine 62 of p50. J. Immunol. 2004, 173, 4207–4217. [Google Scholar] [CrossRef] [PubMed] [Green Version]
- Farooqi, A.; Attar, R.; Sabitaliyevich, U.Y.; Alaaeddine, N.; De Sousa, D.P.; Xu, B.; Cho, W.C. The Prowess of Andrographolide as a Natural Weapon in the War against Cancer. Cancers 2020, 12, 2159. [Google Scholar] [CrossRef] [PubMed]
- Bera, R.; Ahmed, S.K.M.; Sarkar, L.; Sen, T.; Karmakar, S. Pharmacokinetic analysis and tissue distribution of andrographolide in rat by a validated LC-MS/MS method. Pharm. Biol. 2013, 52, 321–329. [Google Scholar] [CrossRef] [PubMed] [Green Version]
- Lipinski, C.A.; Lombardo, F.; Dominy, B.W.; Feeney, P.J. Experimental and computational approaches to estimate solubil-ity and permeability in drug discovery and development settings. Adv. Drug. Deliv. Rev. 2001, 46, 3–26. [Google Scholar] [CrossRef]
- Li, W.; Godzik, A. Cd-hit: A fast program for clustering and comparing large sets of protein or nucleotide sequences. Bioinformatics 2006, 22, 1658–1659. [Google Scholar] [CrossRef] [Green Version]
- Fu, L.; Niu, B.; Zhu, Z.; Wu, S.; Li, W. CD-HIT: Accelerated for clustering the next-generation sequencing data. Bioinformatics 2012, 28, 3150–3152. [Google Scholar] [CrossRef]
- Roux, S.; Enault, F.; Hurwitz, B.L.; Sullivan, M.B. VirSorter: Mining viral signal from microbial genomic data. PeerJ 2015, 3, e985. [Google Scholar] [CrossRef]
- Davis, N.M.; Proctor, D.M.; Holmes, S.; Relman, D.A.; Callahan, B.J. Simple statistical identification and removal of contaminant sequences in marker-gene and metagenomics data. Microbiome 2018, 6, 1–14. [Google Scholar] [CrossRef] [PubMed] [Green Version]
- Bolyen, E.; Rideout, J.R.; Dillon, M.R.; Bokulich, N.A.; Abnet, C.C.; Al-Ghalith, G.A.; Alexander, H.; Alm, E.J.; Arumugam, M.; Asnicar, F.; et al. Reproducible, interactive, scalable and extensible microbiome data science using QIIME 2. Nat. Biotechnol. 2019, 37, 852–857. [Google Scholar] [CrossRef] [PubMed]
- Segata, N.; Izard, J.; Waldron, L.; Gevers, D.; Miropolsky, L.; Garrett, W.S.; Huttenhower, C. Metagenomic biomarker discovery and explanation. Genome Biol. 2011, 12, R60. [Google Scholar] [CrossRef] [PubMed] [Green Version]
- Lobionda, S.; Sittipo, P.; Kwon, H.Y.; Lee, Y.K. The Role of Gut Microbiota in Intestinal Inflammation with Respect to Diet and Extrinsic Stressors. Microorganisms 2019, 7, 271. [Google Scholar] [CrossRef] [Green Version]
- Zhai, R.; Xue, X.; Zhang, L.; Yang, X.; Zhao, L.; Zhang, C. Strain-Specific Anti-inflammatory Properties of Two Akkermansia muciniphila Strains on Chronic Colitis in Mice. Front. Cell. Infect. Microbiol. 2019, 9, 239. [Google Scholar] [CrossRef] [PubMed]
- O’Callaghan, A.; Van Sinderen, D. Bifidobacteria and Their Role as Members of the Human Gut Microbiota. Front. Microbiol. 2016, 7, 925. [Google Scholar] [CrossRef] [Green Version]
- Otto, M. Staphylococcus epidermidis—The ‘accidental’ pathogen. Nat. Rev. Genet. 2009, 7, 555–567. [Google Scholar] [CrossRef] [Green Version]
- Chelakkot, C.; Ghim, J.; Ryu, S.H. Mechanisms regulating intestinal barrier integrity and its pathological implications. Exp. Mol. Med. 2018, 50, 1–9. [Google Scholar] [CrossRef] [Green Version]
- Lee, B.; Moon, K.M.; Kim, C.Y. Tight Junction in the Intestinal Epithelium: Its Association with Diseases and Regulation by Phytochemicals. J. Immunol. Res. 2018, 2018, 1–11. [Google Scholar] [CrossRef] [Green Version]
- Medzhitov, R.; Preston-Hurlburt, P.; Kopp, E.; Stadlen, A.; Chen, C.; Ghosh, S.; A Janeway, C. MyD88 Is an Adaptor Protein in the hToll/IL-1 Receptor Family Signaling Pathways. Mol. Cell 1998, 2, 253–258. [Google Scholar] [CrossRef]
- Warner, N.; Núñez, G. MyD88: A Critical Adaptor Protein in Innate Immunity Signal Transduction. J. Immunol. 2012, 190, 3–4. [Google Scholar] [CrossRef] [Green Version]
- Liu, T.; Zhang, L.; Joo, D.; Sun, S.-C. NF-κB signaling in inflammation. Signal Transduct. Target. Ther. 2017, 2. [Google Scholar] [CrossRef] [Green Version]
- Rose, M.R.; Brix, K.A. Neurological disorders in Gulf War veterans. Philos. Trans. R. Soc. B Biol. Sci. 2006, 361, 605–618. [Google Scholar] [CrossRef]
- Engdahl, B.E.; James, L.M.; Miller, R.D.; Leuthold, A.C.; Lewis, S.M.; Carpenter, A.F.; Georgopoulos, A.P. Brain Function in Gulf War Illness (GWI) and Associated Mental Health Comorbidities. J. Neurol. Neuromed. 2018, 3, 24–34. [Google Scholar]
- Daneman, R.; Prat, A. The Blood–Brain Barrier. Cold Spring Harb. Perspect. Biol. 2015, 7, a020412. [Google Scholar] [CrossRef] [Green Version]
- Sweeney, M.; Zhao, Z.; Montagne, A.; Nelson, A.R.; Zlokovic, B.V. Blood-Brain Barrier: From Physiology to Disease and Back. Physiol. Rev. 2019, 99, 21–78. [Google Scholar] [CrossRef]
- Ju, F.; Ran, Y.; Zhu, L.; Cheng, X.; Gao, H.; Xi, X.; Yang, Z.; Zhang, S. Increased BBB Permeability Enhances Activation of Microglia and Exacerbates Loss of Dendritic Spines After Transient Global Cerebral Ischemia. Front. Cell. Neurosci. 2018, 12, 236. [Google Scholar] [CrossRef] [PubMed]
- da Fonseca, A.C.C.; Matias, D.; Garcia, C.; Amaral, R.; Geraldo, L.H.; Freitas, C.; Lima, F.R.S. The impact of microglial activation on blood-brain barrier in brain diseases. Front. Cell. Neurosci. 2014, 8, 362. [Google Scholar] [CrossRef] [PubMed] [Green Version]
- Madhu, L.N.; Attaluri, S.; Kodali, M.; Shuai, B.; Upadhya, R.; Gitaí, D.; Shetty, A.K. Neuroinflammation in Gulf War Illness is linked with HMGB1 and complement activation, which can be discerned from brain-derived extracellular vesicles in the blood. Brain Behav. Immun. 2019, 81, 430–443. [Google Scholar] [CrossRef] [PubMed]
- Miranda, M.; Morici, J.F.; Zanoni, M.B.; Bekinschtein, P. Brain-Derived Neurotrophic Factor: A Key Molecule for Memory in the Healthy and the Pathological Brain. Front. Cell. Neurosci. 2019, 13, 363. [Google Scholar] [CrossRef]
- Kreutzberg, G.W. Microglia: A sensor for pathological events in the CNS. Trends Neurosci. 1996, 19, 312–318. [Google Scholar] [CrossRef]
- Mawson, A.R.; Croft, A.M. Gulf War Illness: Unifying Hypothesis for a Continuing Health Problem. Int. J. Environ. Res. Public Health 2019, 16, 111. [Google Scholar] [CrossRef] [PubMed] [Green Version]
- Stavropoulou, E.; Bezirtzoglou, E. Probiotics in Medicine: A Long Debate. Front. Immunol. 2020, 11. [Google Scholar] [CrossRef] [PubMed]
- Gracie, D.J.; Hamlin, P.J.; Ford, A.C. The influence of the brain–gut axis in inflammatory bowel disease and possible implications for treatment. Lancet Gastroenterol. Hepatol. 2019, 4, 632–642. [Google Scholar] [CrossRef]
- Roshanravan, N.; Bastani, S.; TuTunchi, H.; Kafil, B.; Nikpayam, O.; Alamdari, N.M.; Hadi, A.; Sotoudeh, S.; Ghaffari, S.; Ostadrahimi, A. A comprehensive systematic review of the effectiveness of Akkermansia muciniphila, a member of the gut microbiome, for the management of obesity and associated metabolic disorders. Arch. Physiol. Biochem. 2021, 1–11. [Google Scholar] [CrossRef] [PubMed]
- Aron, R.C.; Abid, A.; Vesa, C.; Nechifor, A.; Behl, T.; Ghitea, T.; Munteanu, M.; Fratila, O.; Andronie-Cioara, F.; Toma, M.; et al. Recognizing the Benefits of Pre-/Probiotics in Metabolic Syndrome and Type 2 Diabetes Mellitus Considering the Influence of Akkermansia muciniphila as a Key Gut Bacterium. Microorganisms 2021, 9, 618. [Google Scholar] [CrossRef]
- Vacca, M.; Celano, G.; Calabrese, F.M.; Portincasa, P.; Gobbetti, M.; De Angelis, M. The Controversial Role of Human Gut Lachnospiraceae. Microorganisms 2020, 8, 573. [Google Scholar] [CrossRef] [PubMed]
- Singh, N.; Gurav, A.; Sivaprakasam, S.; Brady, E.; Padia, R.; Shi, H.; Thangaraju, M.; Prasad, P.D.; Manicassamy, S.; Munn, D.H.; et al. Activation of Gpr109a, receptor for niacin and the commensal metabolite butyrate, suppresses colonic inflammation and carcinogenesis. Immunity 2014, 40, 128–139. [Google Scholar] [CrossRef] [Green Version]
- Beesetti, S.L.; Jayadev, M.; Subhashini, G.V.; Mansour, L.; Alwasel, S.; Harrath, A.H. Andrographolide as a therapeutic agent against breast and ovarian cancers. Open Life Sci. 2019, 14, 462–469. [Google Scholar] [CrossRef]
- Scarpellini, E.; Ianiro, G.; Attili, F.; Bassanelli, C.; De Santis, A.; Gasbarrini, A. The human gut microbiota and virome: Potential therapeutic implications. Dig. Liver Dis. 2015, 47, 1007–1012. [Google Scholar] [CrossRef] [Green Version]
- Lang, S.; Demir, M.; Martin, A.; Jiang, L.; Zhang, X.; Duan, Y.; Gao, B.; Wisplinghoff, H.; Kasper, P.; Roderburg, C.; et al. Intestinal Virome Signature Associated With Severity of Nonalcoholic Fatty Liver Disease. Gastroenterology 2020, 159, 1839–1852. [Google Scholar] [CrossRef]
- Zuo, T.; Lu, X.-J.; Zhang, Y.; Cheung, C.P.; Lam, S.; Zhang, F.; Tang, W.; Ching, J.Y.L.; Zhao, R.; Chan, P.K.S.; et al. Gut mucosal virome alterations in ulcerative colitis. Gut 2019, 68, 1169–1179. [Google Scholar] [CrossRef] [PubMed] [Green Version]
- Gupta, S.; Mishra, K.P.; Ganju, L. Broad-spectrum antiviral properties of andrographolide. Arch. Virol. 2017, 162, 611–623. [Google Scholar] [CrossRef] [PubMed]
- Plaza-Díaz, J.; Solís-Urra, P.; Rodríguez-Rodríguez, F.; Olivares-Arancibia, J.; Navarro-Oliveros, M.; Abadía-Molina, F.; Álvarez-Mercado, A. The Gut Barrier, Intestinal Microbiota, and Liver Disease: Molecular Mechanisms and Strategies to Manage. Int. J. Mol. Sci. 2020, 21, 8351. [Google Scholar] [CrossRef]
- Tripathi, A.; Debelius, J.; Brenner, D.A.; Karin, M.; Loomba, R.; Schnabl, B.; Knight, R. The gut–liver axis and the intersection with the microbiome. Nat. Rev. Gastroenterol. Hepatol. 2018, 15, 397–411. [Google Scholar] [CrossRef] [PubMed]
- Domazetovic, V.; Iantomasi, T.; Bonanomi, A.G.; Stio, M. Vitamin D regulates claudin-2 and claudin-4 expression in active ulcerative colitis by p-Stat-6 and Smad-7 signaling. Int. J. Color. Dis. 2020, 35, 1231–1242. [Google Scholar] [CrossRef]
- Werth, M.; Walentin, K.; Aue, A.; Schönheit, J.; Wuebken, A.; Pode-Shakked, N.; Vilianovitch, L.; Erdmann, B.; Dekel, B.; Bader, M.; et al. The transcription factor grainyhead-like 2 regulates the molecular composition of the epithelial apical junctional complex. Development 2010, 137, 3835–3845. [Google Scholar] [CrossRef] [Green Version]
- Swain, S.D.; Grifka-Walk, H.N.; Gripentrog, J.; Lehmann, M.; Deuling, B.; Jenkins, B.R.; Liss, H.; Blaseg, N.; Bimczok, D.; Kominsky, U.J. Slug and Snail have differential effects in directing colonic epithelial wound healing and partially mediate the restitutive effects of butyrate. Am. J. Physiol. Liver Physiol. 2019, 317, G531–G544. [Google Scholar] [CrossRef]
- Metzger, R.N.; Krug, A.B.; Eisenächer, K. Enteric Virome Sensing—Its Role in Intestinal Homeostasis and Immunity. Viruses 2018, 10, 146. [Google Scholar] [CrossRef] [Green Version]
- Weiss, U.; Möller, M.; Husseini, S.A.; Manderscheid, C.; Häusler, J.; Geisslinger, G.; Niederberger, E. Inhibition of HDAC Enzymes Contributes to Differential Expression of Pro-Inflammatory Proteins in the TLR-4 Signaling Cascade. Int. J. Mol. Sci. 2020, 21, 8943. [Google Scholar] [CrossRef]
- Fukui, H. Leaky Gut and Gut-Liver Axis in Liver Cirrhosis: Clinical Studies Update. Gut Liver 2020. [Google Scholar] [CrossRef]
- Bamias, G.; Cominelli, F. Cytokines and intestinal inflammation. Curr. Opin. Gastroenterol. 2016, 32, 437–442. [Google Scholar] [CrossRef] [PubMed]
- Tajes, M.; Ramos-Fernández, E.; Weng-Jiang, X.; Bosch-Morató, M.; Guivernau, B.; Eraso-Pichot, A.; Salvador, B.; Fernàndez-Busquets, X.; Roquer, J.; Muñoz, F.J. The blood-brain barrier: Structure, function and therapeutic approaches to cross it. Mol. Membr. Biol. 2014, 31, 152–167. [Google Scholar] [CrossRef] [PubMed] [Green Version]
- Öberg, M.; Fabrik, I.; Fabrikova, D.; Zehetner, N.; Härtlova, A. The role of innate immunity and inflammation in Parkinson´s disease. Scand. J. Immunol. 2021, 93, e13022. [Google Scholar] [CrossRef] [PubMed]
- Fleeman, R.M.; Proctor, E.A. Astrocytic Propagation of Tau in the Context of Alzheimer’s Disease. Front. Cell. Neurosci. 2021, 15, 63. [Google Scholar] [CrossRef]
- Bachiller, S.; Ferrer, I.J.; Paulus, A.; Yang, Y.; Swanberg, M.; Deierborg, T.; Boza-Serrano, A. Microglia in Neurological Diseases: A Road Map to Brain-Disease Dependent-Inflammatory Response. Front. Cell. Neurosci. 2018, 12, 488. [Google Scholar] [CrossRef] [Green Version]
- Zhai, X.; Liu, J.; Ni, A.; Ye, J. MiR-497 promotes microglia activation and proinflammatory cytokines production in chronic unpredictable stress-induced depression via targeting FGF2. J. Chem. Neuroanat. 2020, 110, 101872. [Google Scholar] [CrossRef]
- Abou-Donia, M.B.; Lapadula, E.S.; Krengel, M.H.; Quinn, E.; LeClair, J.; Massaro, J.; Conboy, L.A.; Kokkotou, E.; Abreu, M.; Klimas, N.G.; et al. Using Plasma Autoantibodies of Central Nervous System Proteins to Distinguish Veterans with Gulf War Illness from Healthy and Symptomatic Controls. Brain Sci. 2020, 10, 610. [Google Scholar] [CrossRef]
- Tanemura, K.; Murayama, M.; Akagi, T.; Hashikawa, T.; Tominaga, T.; Ichikawa, M.; Yamaguchi, H.; Takashima, A. Neurodegeneration with tau accumulation in a transgenic mouse expressing V337M human tau. J. Nseurosci. 2002, 22, 133–141. [Google Scholar] [CrossRef] [Green Version]
- Lee, V.M.-Y.; Trojanowski, J.Q. Neurodegenerative Tauopathies: Human Disease and Transgenic Mouse Models. Neuron 1999, 24, 507–510. [Google Scholar] [CrossRef] [Green Version]
- Insel, P.S.; Mattsson, N.; Mackin, R.S.; Kornak, J.; Nosheny, R.; Tosun-Turgut, D.; Donohue, M.C.; Aisen, P.S.; Weiner, M.W.; Initiative, A.D.N. Biomarkers and cognitive endpoints to optimize trials in Alzheimer’s disease. Ann. Clin. Transl. Neurol. 2015, 2, 534–547. [Google Scholar] [CrossRef] [PubMed]


Publisher’s Note: MDPI stays neutral with regard to jurisdictional claims in published maps and institutional affiliations. |
© 2021 by the authors. Licensee MDPI, Basel, Switzerland. This article is an open access article distributed under the terms and conditions of the Creative Commons Attribution (CC BY) license (https://creativecommons.org/licenses/by/4.0/).
Share and Cite
Saha, P.; Skidmore, P.T.; Holland, L.A.; Mondal, A.; Bose, D.; Seth, R.K.; Sullivan, K.; Janulewicz, P.A.; Horner, R.; Klimas, N.; et al. Andrographolide Attenuates Gut-Brain-Axis Associated Pathology in Gulf War Illness by Modulating Bacteriome-Virome Associated Inflammation and Microglia-Neuron Proinflammatory Crosstalk. Brain Sci. 2021, 11, 905. https://0-doi-org.brum.beds.ac.uk/10.3390/brainsci11070905
Saha P, Skidmore PT, Holland LA, Mondal A, Bose D, Seth RK, Sullivan K, Janulewicz PA, Horner R, Klimas N, et al. Andrographolide Attenuates Gut-Brain-Axis Associated Pathology in Gulf War Illness by Modulating Bacteriome-Virome Associated Inflammation and Microglia-Neuron Proinflammatory Crosstalk. Brain Sciences. 2021; 11(7):905. https://0-doi-org.brum.beds.ac.uk/10.3390/brainsci11070905
Chicago/Turabian StyleSaha, Punnag, Peter T. Skidmore, LaRinda A. Holland, Ayan Mondal, Dipro Bose, Ratanesh K. Seth, Kimberly Sullivan, Patricia A. Janulewicz, Ronnie Horner, Nancy Klimas, and et al. 2021. "Andrographolide Attenuates Gut-Brain-Axis Associated Pathology in Gulf War Illness by Modulating Bacteriome-Virome Associated Inflammation and Microglia-Neuron Proinflammatory Crosstalk" Brain Sciences 11, no. 7: 905. https://0-doi-org.brum.beds.ac.uk/10.3390/brainsci11070905