Article

Thioredoxin h2 and o1 Show Different Subcellular Localizations and Redox-Active Functions, and Are Extrachloroplastic Factors Influencing Photosynthetic Performance in Fluctuating Light

Department Biology I, Ludwig-Maximilians-University Munich, 82152 Planegg-Martinsried, Germany
*
Author to whom correspondence should be addressed.
Submission received: 25 March 2021 / Revised: 26 April 2021 / Accepted: 27 April 2021 / Published: 29 April 2021
(This article belongs to the Special Issue Redox in Plants)

Abstract

:
Arabidopsis contains eight different h-type thioredoxins (Trx) being distributed in different cell organelles. Although Trx h2 is deemed to be confined to mitochondria, its subcellular localization and function are discussed controversially. Here, cell fractionation studies were used to clarify this question, showing Trx h2 protein to be exclusively localized in microsomes rather than mitochondria. Furthermore, Arabidopsis trxo1, trxh2 and trxo1h2 mutants were analyzed to compare the role of Trx h2 with mitochondrial Trx o1. Under medium light, trxo1 and trxo1h2 showed impaired growth, while trxh2 was similar to wild type. In line with this, trxo1 and trxo1h2 clustered differently from wild type with respect to nocturnal metabolite profiles, revealing a decrease in ascorbate and glutathione redox states. Under fluctuating light, these genotypic differences were attenuated. Instead, the trxo1h2 double mutant showed an improved NADPH redox balance, compared to wild type, accompanied by increased photosynthetic efficiency, specifically in the high-light phases. Conclusively, Trx h2 and Trx o1 are differentially localized in microsomes and mitochondria, respectively, which is associated with different redox-active functions and effects on plant growth in constant light, while there is a joint role of both Trxs in regulating NADPH redox balance and photosynthetic performance in fluctuating light.

1. Introduction

Reduction-oxidation reactions serve as fundamental components for the processes of bioenergetics and signal pathways. Proper operation of biosynthetic processes and signal transduction relies on the optimization of redox potential spans. This appears to be of importance for plants since plants often encounter diverse environmental challenges. For example, light intensity in the field changes very rapidly. Such fluctuation of light intensity leads to short-term imbalances in the redox state of NADPH/NADP+ and the energy state of adenylated nucleotides and eventually results in the over-production of reactive oxygen species, which dramatically change the cellular redox poise [1,2]. Thus, plants develop several mechanisms to deal with such challenges.
Ascorbate (AsA) and glutathione (GSH) redox systems are known as powerful buffering mechanisms to balance cellular redox states [3]. Both AsA and GSH are able to metabolize hydrogen peroxide (H2O2). While both systems can work independently, they have also shown to function in an integrated manner [4]. In the AsA-GSH cycle, AsA serves as an electron donor for ascorbate peroxidase (APX) to detoxify H2O2. Then, AsA is converted into monodehydroascorbate (MDHA), which can be regenerated as AsA with the help of monodehydroascorbate reductase (MDHAR). Part of MDHA is subsequently converted into dehydroascorbate (DHA), which can also be reduced to AsA via the activity of dehydroascorbate reductase (DHAR) using glutathione as electron donors. This would generate oxidized glutathione disulfide (GSSG), which can be regenerated to GSH via the activity of glutathione reductase (GR) using NADPH as an electron donor. The reduced glutathione can then be used for the regeneration of AsA again or the detoxification of H2O2 [5]. The disruption of the AsA-GSH cycle greatly compromises plant stress tolerance as well as plant development [6,7,8]. Furthermore, there are growing reports indicating an interaction of AsA, GSH and thioredoxin (Trx) systems to maintain the cellular redox balance [9,10,11,12,13]. In this context, plastidial MDHAR was found to be redox-regulated by thioredoxins (Trxs) [14].
Thioredoxins are ubiquitous proteins in various organisms. Plants have the most elaborate Trx system, with respect to different reduction pathways and isoforms being involved in the redox regulation of widespread metabolic processes in different subcellular compartments [4]. In Arabidopsis, the 20 Trx isoforms are categorized into seven types: Trx f, h, m, o, x, y and z [15,16]. The f, m, x, y and z-type Trxs are plastidial proteins and responsible for regulating redox balance and metabolic processes in chloroplasts, e.g., enzyme activation of Calvin-Benson cycle, carbon metabolism [17,18], the regulation of malate valve [19], meristem development, cyclic electron transport [20,21,22], the regulation of antioxidation systems [23,24,25,26], and plastidial gene expression [27].
The o-type Trxs comprise two isoforms, Trx o1 and o2. The Trx o1 protein is specifically localized in mitochondria, with the exception of pea (Pisum sativum), where this protein was found in both mitochondria and nuclei [28,29]. Work with Arabidopsis knock-out mutants and biochemical studies indicate diverse functions of Trx o1, including the regulation of stress responses and cell cycle progression, as well as the activation of tricarboxylic-acid-cycle (TCA) enzymes and alternative oxidase (AOX) in respiratory processes of mitochondria [30,31,32,33,34], even though it is still under debate whether Trx o1 is involved in the redox regulation of AOX [35]. Furthermore, the Trx o1 protein has been suggested to be involved in the regulation of NAD(P)(H) redox state and the inhibition of mitochondrial glycine decarboxylase (GDC) L-protein and thus, be able to fine-tune photorespiratory processes in Arabidopsis [36].
The h-type Trxs are the largest Trx family, which contains eight isoforms in Arabidopsis. Many of h-type Trxs, including Trx h1, h3, h4, and h5, were found to be localized in cytosol, while Trx h7 and h8 were reported to be associated with ER-Golgi membrane compartments and Trx h9 was found to be localized at the plasma membrane [28,37,38,39]. As the largest Trx family, the h-type Trxs were found to have diverse functions. In barley and wheat, Trx h is involved in the seed developmental processes [40,41]. In Brassica, there is a role of Trx h in the self-incompatibility response [42,43]. In Arabidopsis, it has been reported that Trx h3 functions as a molecular chaperone to help plants overcome heat stress [44], while Trx h5 is strongly induced in response to pathogen infection and oxidative stresses to regulate these responses [45,46]. Furthermore, Trx h9 plays a role in intercellular communication [37]. In contrast to the other h-type Trxs, Trx h2 was found to harbor regulatory functions in several metabolic pathways of mitochondria. The first report from Daloso et al. indicated Trx h2 to cooperate with Trx o1 to regulate TCA cycle enzyme activities [33]. With the analyses on trxh2 Arabidopsis mutants, Trx h2 was found to be involved in photorespiratory processes via redox-regulating the activity of the mitochondrial GDC L-protein [47]. However, the subcellular localization of Trx h2 remained unclear. Using the transient expression of GFP-fused Trx h2 protein in onion epidermal cells, Meng et al. suggested that the Trx h2 is localized in both cytosol and mitochondria [37], while Traverso et al. used the same approach to propose that this protein is associated with the ER-Golgi membrane system [38].
The studies mentioned above suggest that Trx h2 is likely to share redundant functions with Trx o1 in mitochondria, while it remains unclear whether Trx h2 is indeed localized within this organelle. In the present work, we used cell fractionation studies as an additional technique to clarify the subcellular localization of the Trx h2 protein and confirmed its exclusive localization to the microsomal fraction rather than to mitochondria. To further understand the role of Trx h2 in comparison to mitochondrial Trx o1, we selected two Arabidopsis T-DNA insertion mutants (trxo1 and trxh2), showing deficiencies of Trx o1 and Trx h2, respectively. Both lines have been comprehensively characterized in previous studies [33,45] and therefore serve as representative T-DNA insertion mutants for the following analyses. Both lines were further crossed to generate a double mutant (trxo1h2) showing joint deficiencies of both Trxs. In experiments to directly compare these lines, single deficiencies of Trx o1 and Trx h2 led to different effects in maintaining the redox states of AsA and GSH as well as growth in medium light, while joint deficiencies of Trx o1 and Trx h2 led to additive effects in balancing NADP(H) redox state and photosynthetic efficiency in fluctuating light. This indicates different roles of Trx o1 and h2 depending on the light conditions.

2. Materials and Methods

2.1. Plant Material

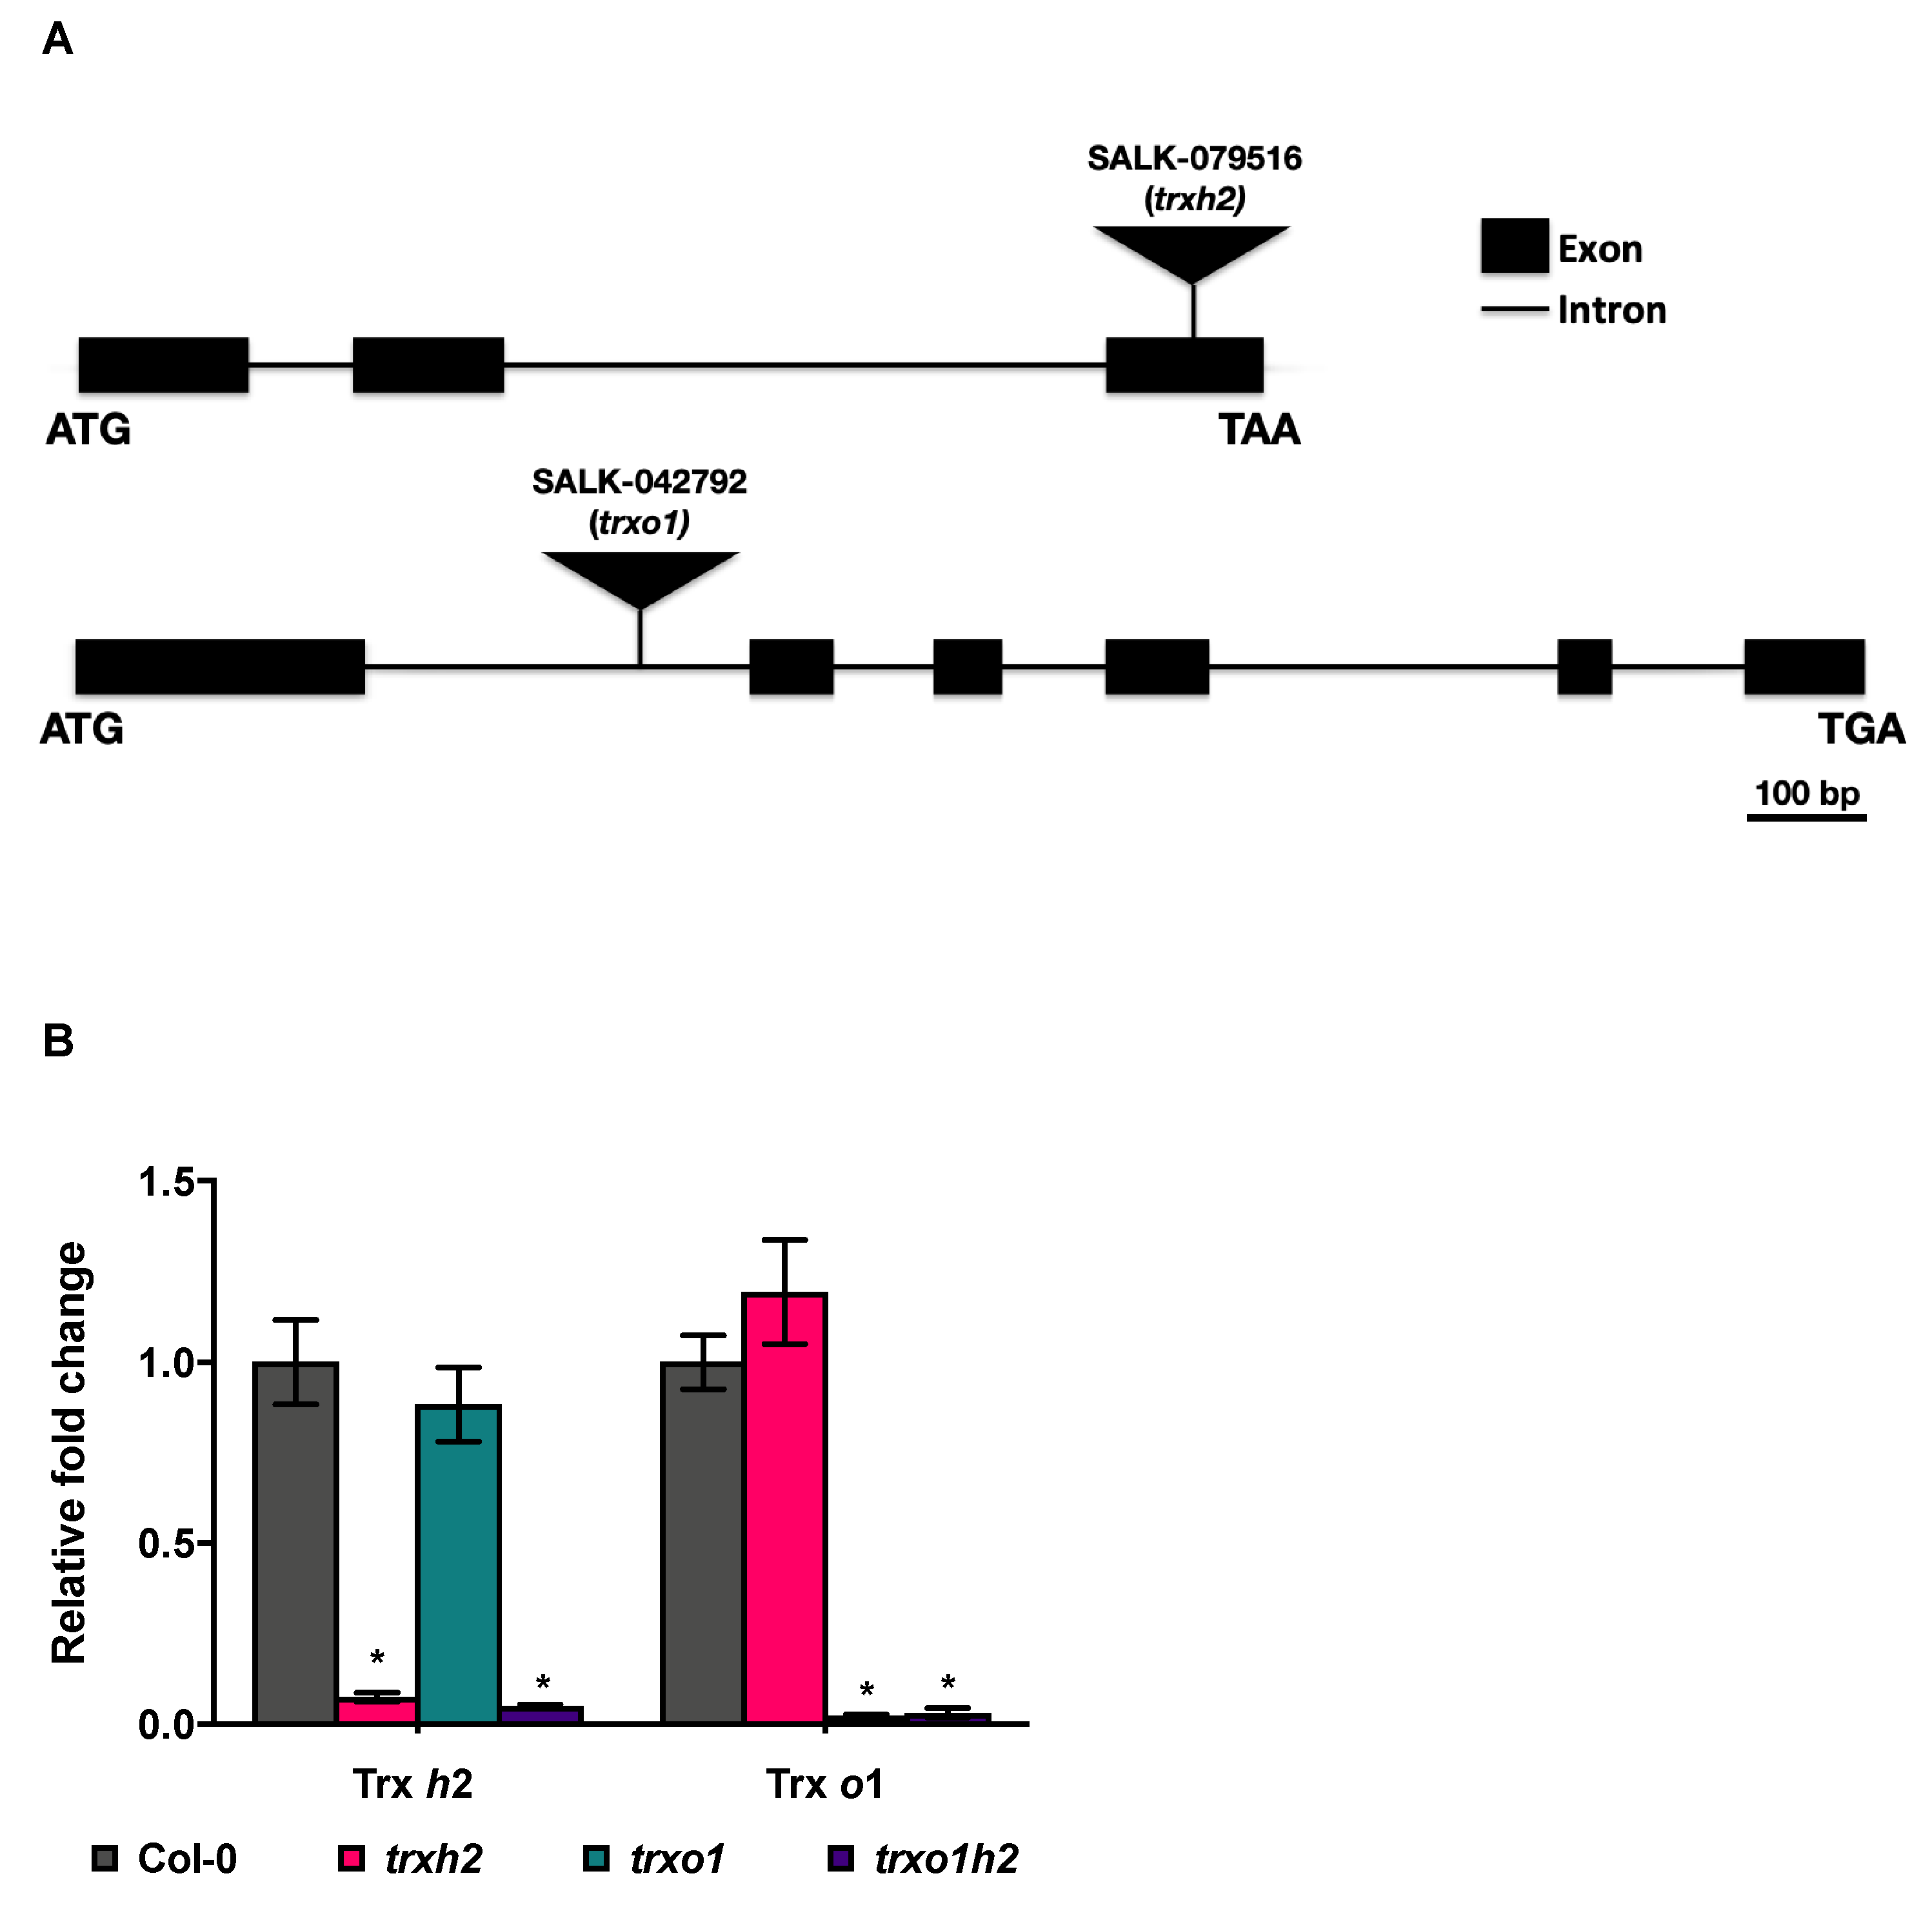
2.1.1. Arabidopsis T-DNA Insertion Mutant Lines

The Arabidopsis wild type, Columbia-0 (Col-0), two representative T-DNA insertion mutants, trxh2 (SALK-079516) [45] and trxo1 (SALK-042792) [33], and one crossed double mutant, trxo1h2, were used for this study. Both trxh2 (SALK-079516) and trxo1 (SALK-042792) have been comprehensively characterized in previous studies [33,45] and therefore serve as representative T-DNA insertion mutants. Both lines were crossed to generate a double mutant (trxo1h2) showing joint deficiencies of both Trxs.

2.1.2. Establishment of Trx h2 Overexpression Line

The coding region of Trx h2 gene was amplified using the primers, TRXH2-F_GW (5′-aaaaagcaggctttatgggaggagctttatcaactgtg-3′), TRXH2-R_GW (5′-agaaagctgggtttgctctgagtttgctaactttcttc-3′), attB1 adapter (5′-ggggacaagtttgtacaaaaaagcaggct-3′) and attB2 adapter (5′-ggggaccactttgtacaagaaagctgggt-3′). The DNA fragment was first subcloned into pDONR221 (Invitrogen, ThermoFisher Scientific, Waltham, MA, USA) and then transferred into pJCV52 (VIB, Ghent, Belgium) using a GATEWAY cloning kit (Invitrogen, ThermoFisher Scientific, Waltham, MA, USA). Arabidopsis plants were transformed by following the floral dip method [48]. The transformed plants were grown on the medium containing 50 mM of kanamycin. The survived plants were used to propagate seeds for the selection of homozygous transgenic lines.

2.1.3. Growth Conditions

All plants were grown under constant medium light (ML) or fluctuating light (FL). The light intensity of ML was set as 150 μmoL m−2 s−1 with a 16-h-light/8-h-dark regime. Plants were grown under ML for three weeks, and the entire rosette leaves were harvested at the end of the night (EN) and the end of the day (ED). The setup of FL contained loops of 5 min low light (LL, 50 μmoL m−2 s−1) and 1 min high light (HL, 500 μmoL m−2 s−1) with a 12-h-light/12-h-dark regime. Plants were grown under FL for four weeks, and the entire rosette leaves were harvested during the LL and HL phases in the middle of the day. The growth temperature was maintained at 22 °C for both conditions.

2.2. Cell Fractionation

2.2.1. Microsome Isolation

The microsome isolation was performed by using the kit (MinuteTM Plant Microsomal Membrane Extraction Kit; Invent Biotechnologies, Plymouth, MA, USA). In brief, 200 mg of fresh plant leaves were homogenized in 300 μL of cold buffer A and then transferred into a filter cartridge followed by centrifugation for 20 min at 14,000× g in 4 °C. The supernatant was kept on ice for later cytosolic fraction isolation, and the pellet was re-suspended in 300 μL of cold buffer B followed by centrifugation for 10 min at 11,000× g in 4 °C. The supernatant was then transferred into a 2 mL microtube with the supplement of 1 mL of one-time strength PBS. The mixture was centrifuged for 30 min at 14,000× g in 4 °C. The supernatant was removed, and the pellet was kept on ice for later use.

2.2.2. Cytosolic Fraction Isolation

The cytosolic fraction isolation was performed via ultracentrifugation, as described before [49]. In brief, the supernatant mentioned above was first diluted in 2.5 mL of PBS buffer, and the whole extract was centrifuged for 30 min at 100,000× g in 4 °C. Afterward, the pellet was discarded, and the supernatant was also kept on ice for later use.

2.2.3. Mitochondrion Isolation

The mitochondrion isolation was performed as described before [50] with modifications. In brief, 30 g of 2-week-old seedlings was homogenized in 250 mL of extraction medium (300 mM sucrose 1.5 mM EDTA; 15 mM MOPS; 0.4% (w/v) fatty acid-free BSA; 0.6% (w/v) PVP-K30; 100 mM AsA; 10 mM DTT; pH 7.4) on ice. The leaf debris was removed using miracloth followed by centrifugation for 5 min at 1500× g in 4 °C. The supernatant was transferred into a new tube and centrifuged for 20 min at 16,000× g in 4 °C. The pellet was carefully re-suspended in 1 mL of washing medium I (300 mM sucrose; 10 mM TES; 0.1% (w/v) fatty acid-free BSA; pH 7.5) and mixed with 250 mL of washing buffer I, followed by centrifugation for 5 min at 1500× g in 4 °C. The supernatant was transferred into another tube and centrifuged for 20 min at 16,000× g in 4 °C. The pellet was carefully re-suspended in 1 mL of washing medium I and kept on ice in the dark for later use. The separation buffer was made of heavy gradient solution (7 mL of 2-times strength washing medium I; 3.9 mL of Percoll; 3.1 mL of 20% (w/v) PVP-K30) and light gradient solution (7 mL of 2-times strength washing medium I; 3.9 mL of Percoll; 3.1 mL of double-distilled water) using a gradient maker. Re-suspended pellet was carefully transferred onto the top of the separation buffer followed by centrifugation with slow acceleration and disengaged brake for 40 min at 27,000× g in 4 °C. The purified mitochondria were transferred into a new tube and washed with 40 mL of washing medium II (300 mM sucrose; 10 mM TES; pH 7.5) followed by centrifugation for 15 min at 16,000× g in 4 °C. The mitochondrial pellet was kept on ice for later use.

2.2.4. Protein Extraction and Immunoblotting Analyses

Above samples were first re-suspended in the protein extraction buffer (20 mM Tris-HCl, pH 7.0, 5 mM EDTA, 100 mM NaCl, 0.5% (v/v) Triton X-100, 1% (w/v) SDS, 6 M urea, 2 M thiourea) and then mixed with Laemmli buffer [51]. The protein extract was incubated at 85 °C for 10 min, followed by centrifugation for 5 min at 20,000× g at 25 °C. Ten microliters of supernatant was applied into a 4–20% SDS acrylamide gradient gel for electrophoresis, then transferred onto a 0.45 μm PVDF membrane for immunoblotting analyses. The antibody dilution factors are listed below: thioredoxin h2 (Trx h2), 1:250; alternative oxidase (AOX), 1:1000; cytosolic fructose 1,6-bisphosphatase (cyt-FBPase), 1:2500; calnexin (CNX): 1:5000. The Trx h2 antibody was produced by ThermoFisher Scientifc (Waltham, MA, USA), and the others were purchased from Agrisera.

2.3. Molecular Characterization

2.3.1. Total RNA Extraction

Fifty milligrams of ground leaf sample was suspended in 500 μL of RNAzol reagent (Sigma-Aldrich, St. Louis, MO, USA) and then mixed with 100 μL of ice-cold chloroform followed by the centrifugation for 10 min at 20,000× g in 4 °C. The upper aqueous phase was transferred into a new tube followed by the addition of 300 μL of isopropanol and centrifugation for 10 min at 20,000× g in 4 °C. The precipitated RNA pellet was suspended in 200 μL of nuclease-free water followed by the addition of 200 μL of PCI reagent (phenol/chloroform/isoamylalcohol, 25:24:1 (v/v/v)). The mixture was centrifuged for 10 min at 20,000× g in 4 °C, and the upper phase was transferred into a new tube followed by the addition of 20 μL of 3 M sodium acetate (pH 5.2) and 500 μL of absolute ethanol. The whole mixture was centrifuged for 10 min at 20,000× g in 4 °C. The precipitated RNA pellet was washed with 70% (v/v) ethanol and dehydrated in the hood. Afterward, the pellet was dissolved in 50 μL of nuclease-free water. The concentration was determined by a spectrophotometer (NanoDropTM 2000; ThermoFisher Scientific, Waltham, MA, USA).

2.3.2. Reverse Transcription Reaction

Five hundred nanograms of total RNA was incubated with the mixture containing 2 μL of 5-times reaction buffer and 0.5 μL of iScript reverse transcriptase (Biorad, Hercules, CA, USA) and supplied with sufficient nuclease-free water to make up 10 μL in total volume. The reactions were performed in the thermocycler (C1000 TouchTM Thermal Cycler; Biorad, Hercules, CA, USA) with the program: 25 °C for 10 min, 42 °C for 30 min and 85 °C for 5 min. The cDNA sample was diluted 10 times with nuclease-free water prior to the real-time quantitative PCR.

2.3.3. Real-Time Quantitative PCR

Five microliters of the cDNA sample was mixed with the reaction mixture containing 10 μL of 2-times SYBG reagent (Biorad, Hercules, CA, USA), 0.5 μL of 10 μM forward primer, 0.5 μL of 10 μM reverse primer and 4 μL of nuclease-free water. The reaction was carried out in the thermo cycler (iQ5 Multicolor Real-Time PCR Detection System; Biorad, Hercules, CA, USA) with the program: 95 °C for 1 min, and 40 cycles, each containing 95 °C for 30 s, 60 °C for 30 s, and 72 °C for 30 s. For building up the melting curve of primers, the temperature started at 55 °C and gradually elevated to 95 °C in 0.5 °C increments. The gene expression was quantified followed the 2−ΔΔCt method [52,53]. The primer sequences were listed in the following: TRXh2-F (5′-catgccatggctgataagttcaatg-3′), TRXh2-R (5′-tcaagttcgtcctttttggcacc-3′), TRXo1-F (5′-gcctggtgtggaccatgcag-3′), TRXo1-R (5′-cagtgttggcacagccgtgat-3′), EF1α-F (5′-tgagcacgctcttcttgctttca-3′) and EF1α-R (5′-ggtggtggcatccatcttgttaca-3′).

2.4. Metabolite Profiling

2.4.1. Total Metabolite Extraction

Fifty milligrams of ground leaf material was suspended in the extraction buffer containing 340 μL of ice-cold methanol, 10 μL of ribitol solution (0.2 mg mL−1) and 10 μL of 13C-sorbitol (0.2 mg mL−1), followed by the incubation on ice for 30 min. The extract was further mixed with 200 μL of chloroform and 400 μL of water followed by the centrifugation for 15 min at 25,000× g in 4 °C. Fifty microliters of upper aqueous phase was transferred into a glass vial and dehydrated using a vacuum at ambient temperature.

2.4.2. Gas Chromatography Coupled Time-of-Flight Mass Spectrometry

The detection of metabolite followed the method published before [54,55,56]. The details of sample preparation and condition were also described in the previous publication [57]. The results were analyzed using ChromaTOF 4.5 and TagFinder 4.1 software [58].

2.5. Measurement of Metabolites

2.5.1. Ascorbate and Dehydroascorbate

The assay followed the protocol described before [59]. In brief, 20 mg of pulverized leaf material was suspended in 200 μL of HCl solution (0.2 M) with vortex for 4 min followed by centrifugation for 10 min at 16,000× g in 4 °C. Two hundred microliter of supernatant was transferred to a new microtube followed by the addition of 20 μL of NaH2PO4 solution (0.2 M, pH 5.6) and a sufficient amount of NaOH solution (0.2 M) to make the pH value stay between five and six. The extract was kept on ice until further use. For the measurement of AsA, 20 μL of the extract was mixed with 100 μL of NaH2PO4 solution (0.2 M, pH 5.6) as well as 75 μL of double-distilled water, and the optical density at 265 nm was recorded every minute using the spectrophotometer (FilterMax F5; Molecular Device, San José, CA, USA). When the reaction was stable, 2 μL of AsA oxidase (50 U mL−1) was applied into the mixture to initiate the reaction. The decrease of optical density at 265 nm represents the AsA amount. For the measurement of total ascorbate, 30 μL of the extract was pre-incubated with 3 μL of DTT (25 mM) and 42 μL of NaH2PO4 solution (0.12 M) for 30 min in 25 °C. Twenty microliters of this mixture was used for the measurement as above. Subtracting the reduced AsA amount from total ascorbate yields the amount of DHA. The pure AsA and DHA were used to prepare the standard solution for generating the calibration curve.

2.5.2. Glutathione and Glutathione Disulfide

The extraction followed the same approach mentioned above. For the measurement of total GSH, 10 μL of the extract was mixed with 130 μL of reaction buffer (154 mM NaH2PO4, pH 7.5; 15.4 mM EDTA; 0.77 mM NADPH; 0.92 mM DTNB; 0.2 U GSH reductase) and 60 μL of double-distilled water. The optical density at 412 nm was recorded every 30 s using the spectrophotometer (FilterMax F5; Molecular Device, San José, CA, USA). The reaction slope was used for the following calculation. For the measurement of GSSG, 120 μL of the extract was pre-incubated with 2 μL of 2-vinylpyridine for 30 min in 25 °C to complex free GSH followed by centrifugation for 5 min at 20,000× g in 25 °C. Ten microliters of the supernatant was used for the measurement as above. Subtracting double amounts of GSSG from total glutathione yields the amount of reduced GSH. The pure GSH and GSSG were used to prepare the standard solution for generating the calibration curve.

2.5.3. Pyridine Nucleotides

The assay followed the protocol described before [60]. The details of sample preparation and detection were performed as described in the previous publication [57].

2.6. Pulse-Amplitude-Modulation Measurement

2.6.1. Constant Medium Light Treatment

Three-week-old plants grown under medium light were placed in the dark for 30 min prior to the measurement and shifted into the image PAM instrument (MAXI version; WALZ, Effeltrich, Germany). The program was set as below: 20 min for constant medium light (150 μmoL m−2 s−1), followed by 10 min for the dark. The florescence signals were recorded every 30 s.

2.6.2. Fluctuating Light Treatment

Four-week-old plants grown under fluctuating light were placed in the dark for 30 min prior to the measurement and shifted into the image PAM instrument. The program was set as below: 4 cycles of fluctuating light containing loops of 5 min low light (50 μmoL m−2 s−1) and 1 min high light (500 μmoL m−2 s−1), and 5 min for the dark. The florescence signals were recorded every 30 s.

2.6.3. Calculation

The yield of photosystem II, Y(II), was calculated via the formula listed below: Y(II) = (Fm’ − F)/Fm’. F, fluorescence yield measured briefly before application of a saturation pulse; Fm’, maximal fluorescence yield of illuminated sample with all PSII centers closed.

2.7. Statistical Analysis

The Graphpad Prism 8.0 software was used to generate figures and carry out statistical analyses. The differences between genotypes were assayed via ANOVA followed by Dunnett’s post hoc test unless otherwise described. The R program was used to generate a heatmap of metabolite profile and perform principal component analysis.

2.8. Accession Numbers

Sequence data of this article is available from GeneBank/EMBL database. Arabidopsis thaliana Trx h2: At5g39950, Trx o1: At2g35010.

3. Results

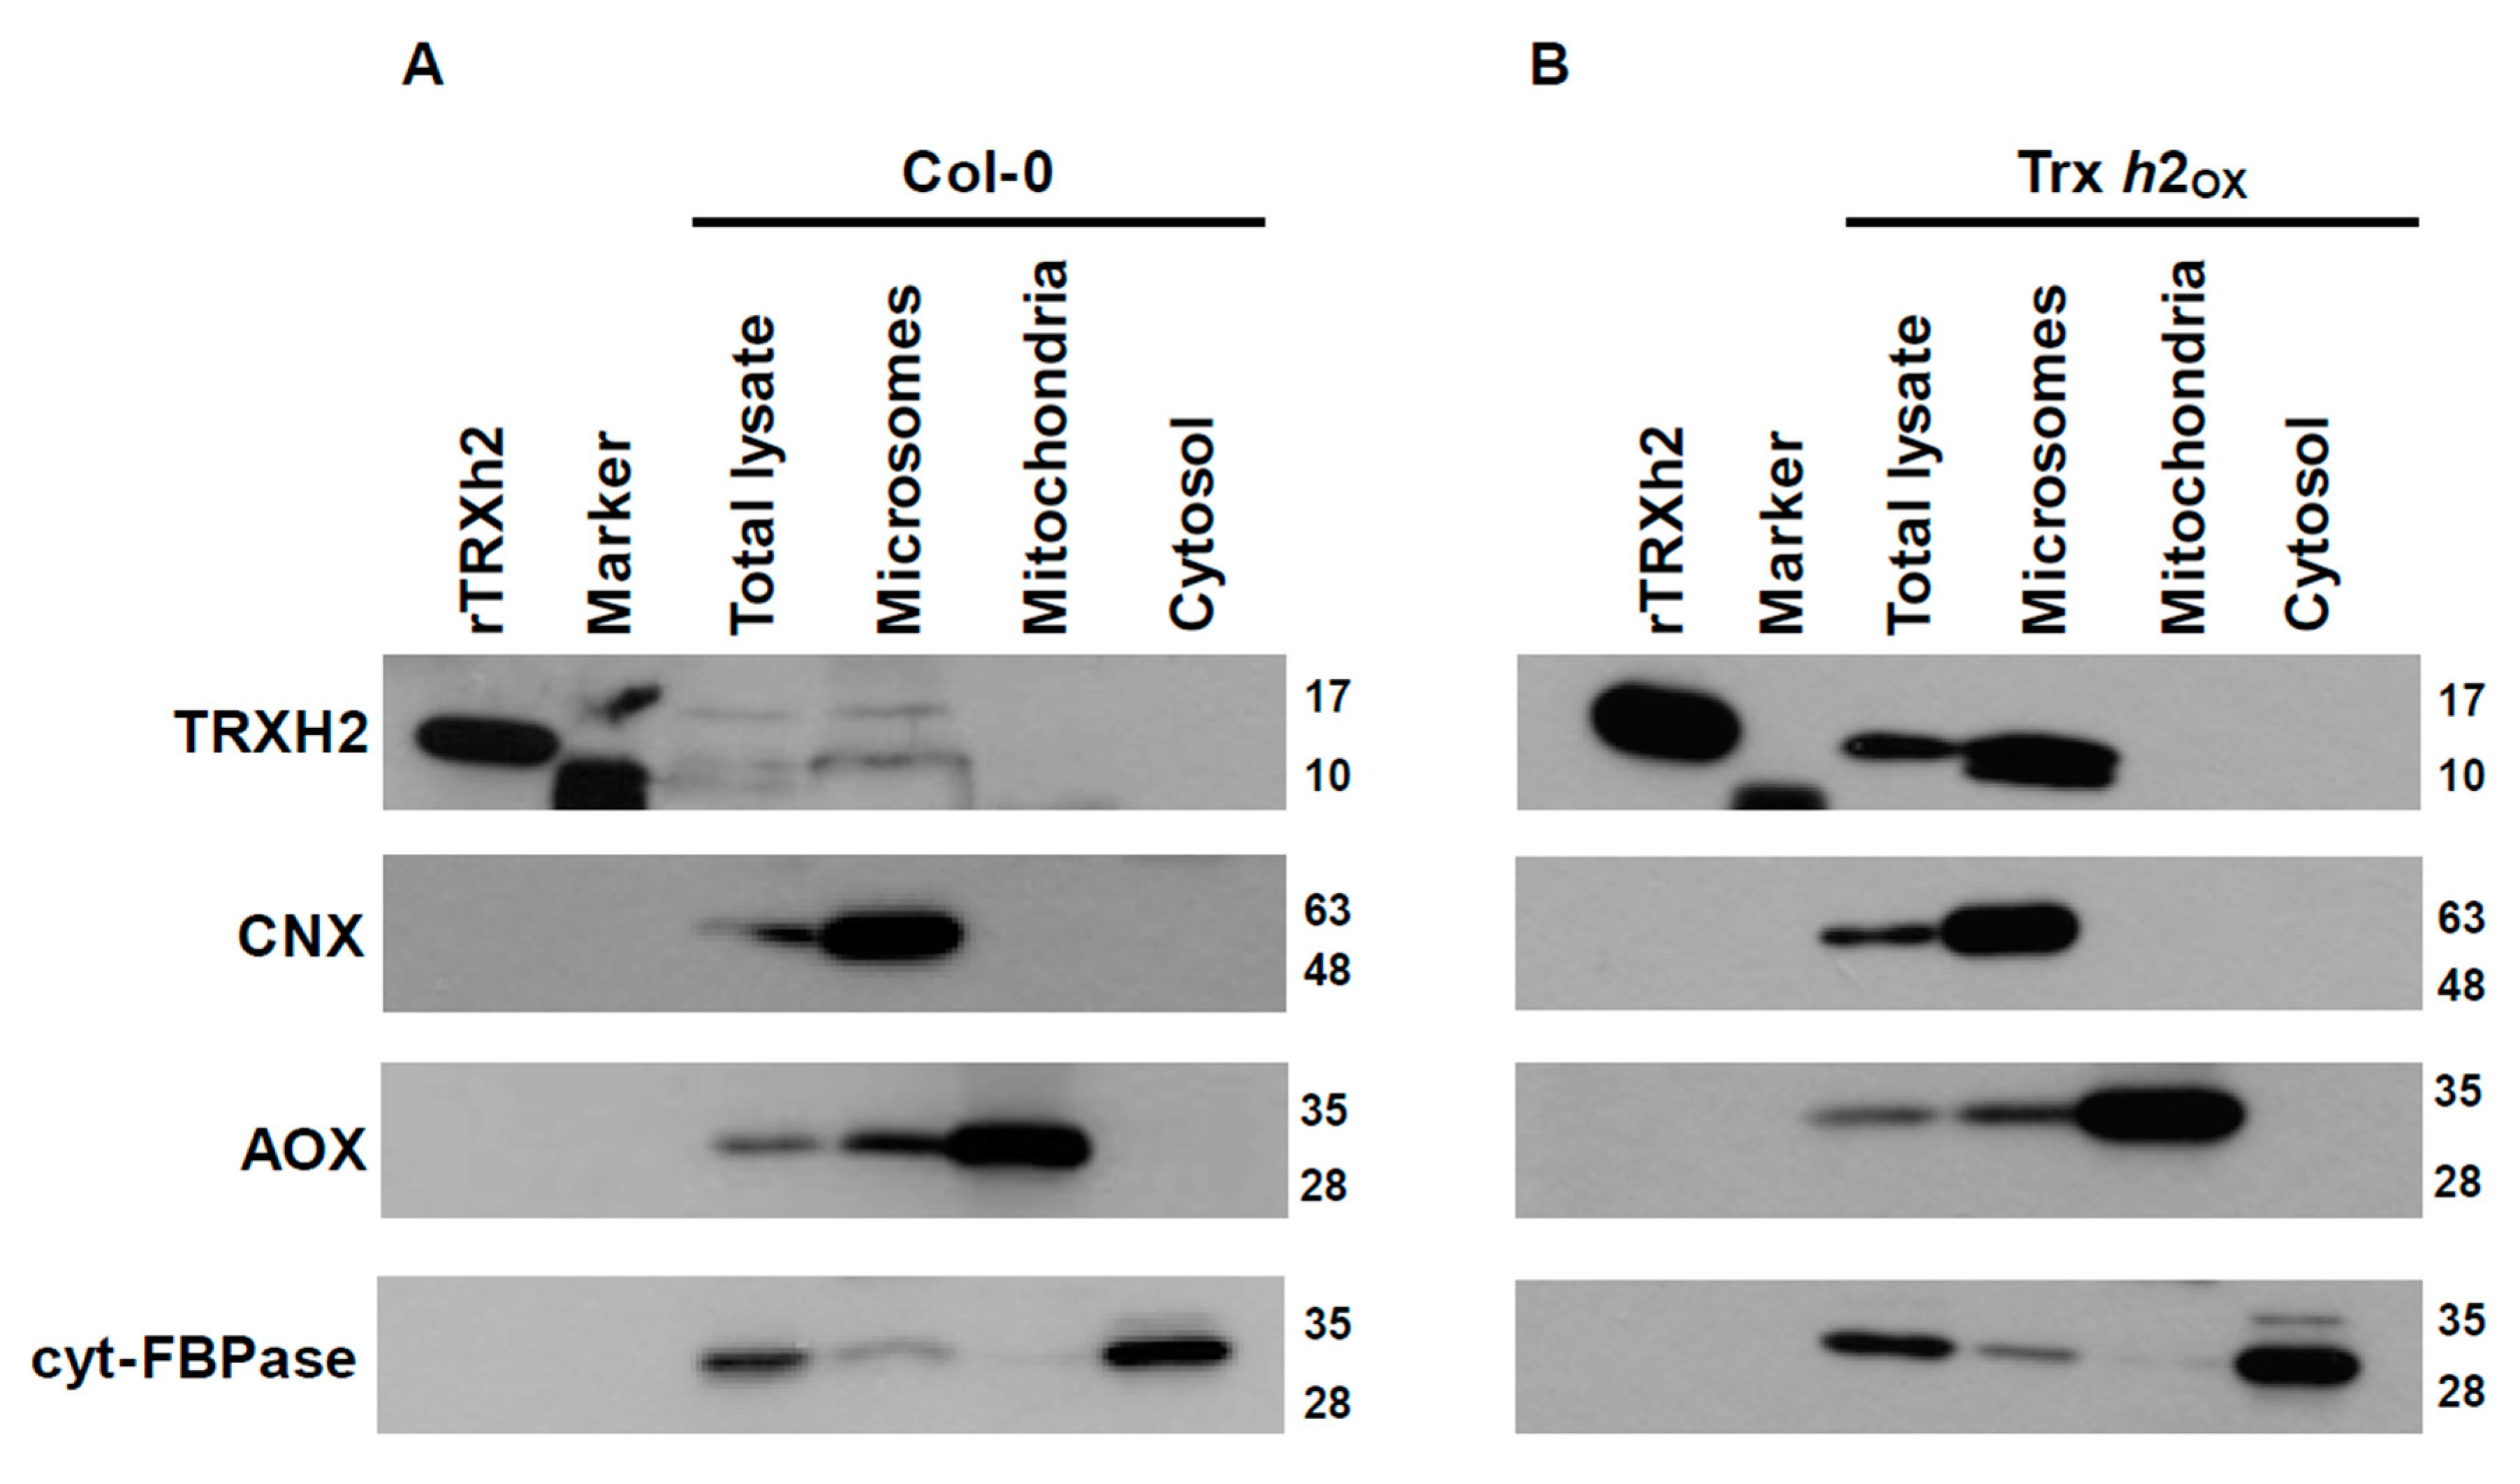
3.1. The Trx h2 Protein Is Localized in the Microsomal Fraction

Unlike the mitochondrial Trx o1, the subcellular localization of Trx h2 remains controversial. While previous studies used transient expression systems and reporter genes, here, a cell fractionation approach was alternatively adopted to clarify this debating issue.
Figure 1 shows the Trx h2 protein level in different subcellular fractions enriched in microsomes, mitochondria and cytosol, documented by immunoblots using calnexin (CNX), alternative oxidase (AOX) and cytosolic fructose-1,6-bisphosphatase (cyt-FBPase) as marker proteins, respectively. The fractionation assays were performed using plant material from the wild type and a Trx h2 overexpression line (Trx h2ox), showing increased Trx h2 expression by 100 times of wild-type level (Figure S1A,B). The Trx h2 protein was clearly present in the purified microsomal fractions of wild-type (Figure 1A) and Trx h2ox plants (Figure 1B), which were enriched in CNX, while no Trx h2 signals were detectable in purified mitochondria (enriched in AOX) and purified cytosolic fractions (enriched in cyt-FBPase). These results clearly and unequivocally demonstrate that the Trx h2 protein is confined to microsomes rather than to mitochondria or cytosol.

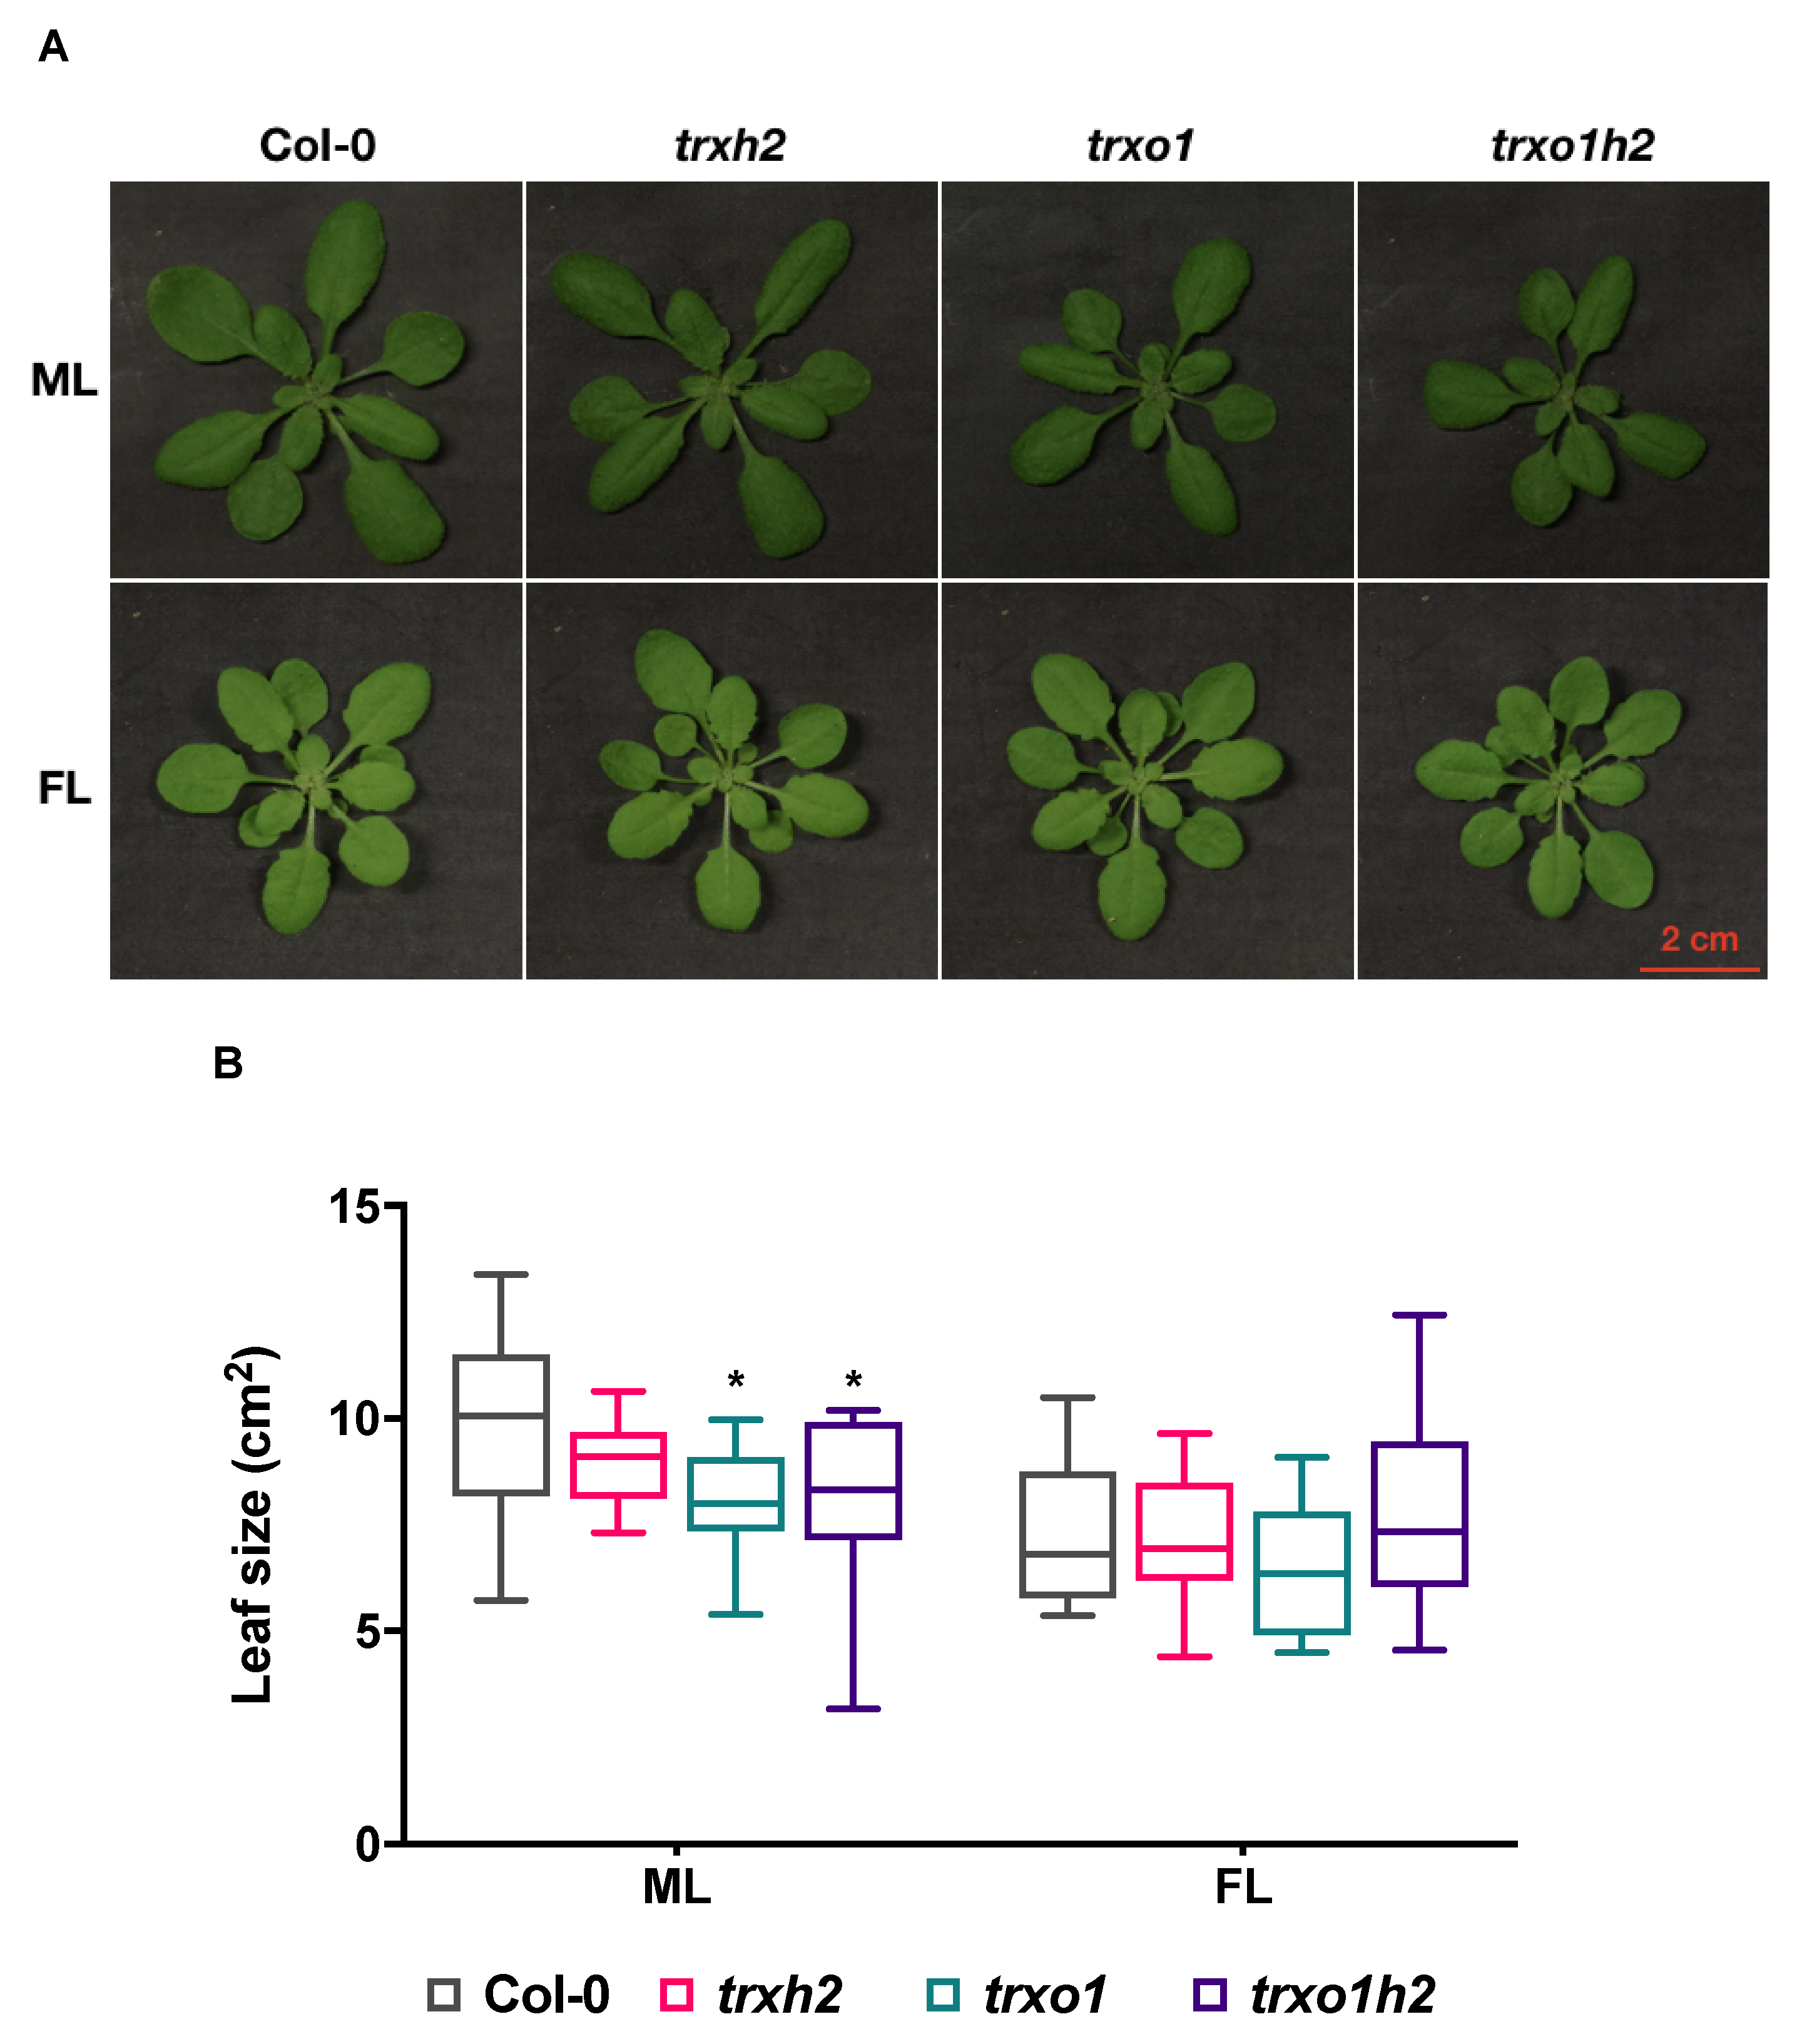
3.2. The Trxh2 and Trxo1 Mutants Show Differential Growth Phenotypes When Grown in Different Light Conditions

Since Trx h2 showed a different subcellular localization in comparison to Trx o1, we next investigated whether both proteins show differential functions. To do this, we analyzed trxo1 [33] and trxh2 [47] T-DNA insertion lines, which were shown to be representative lines in previous studies, together with a double mutant (trxo1h2) generated by crossing of these lines. In confirmation to previous studies on the trxo1 [33] and trxh2 [47] T-DNA insertion lines, the T-DNA inserted at the third exon of the Trx h2 gene in trxh2, while the T-DNA inserted at the first intron of the Trx o1 gene in trxo1 (Figure 2A). Furthermore, the expression of the Trx h2 gene in trxh2 significantly decreased by 95% compared to the wild type, and the expression of the Trx o1 gene in trxo1 significantly decreased by 98% compared to the wild type. In the double mutant (trxo1h2), the expression of both Trx h2 and o1 was significantly decreased in comparison to the wild type (Figure 2B). This documents that these three different T-DNA insertion lines are null mutants and appropriate for the following applications.
To understand whether the deficiency of Trx h2 and o1 affects plant growth, the growth phenotype of the mutant lines was analyzed. In addition to a standard growth condition with medium-light intensity (ML), plants were also grown under fluctuating light intensity (FL), consisting of a loop of five-minute low-light phase and one-minute high-light phase, to mimic natural light conditions in the field. Under constant ML conditions, the growth of the trxh2 mutant was comparable to the wild type, while trxo1 single and trxo1h2 double mutants showed retarded growth (Figure 3A). Surprisingly, this growth phenotype was lost under FL conditions, in which all mutants grew like the wild type (Figure 3B). There is a general decrease in plant growth when FL is compared with constant ML conditions (Figure 3A,B), with the decrease being less strongly expressed in trxo1 and trxo1h2 mutants. These data show that deficiency of Trx o1 leads to impaired plant growth under normal light conditions but not in fluctuating light, while deficiency of Trx h2 has no effect on growth in any of the conditions.

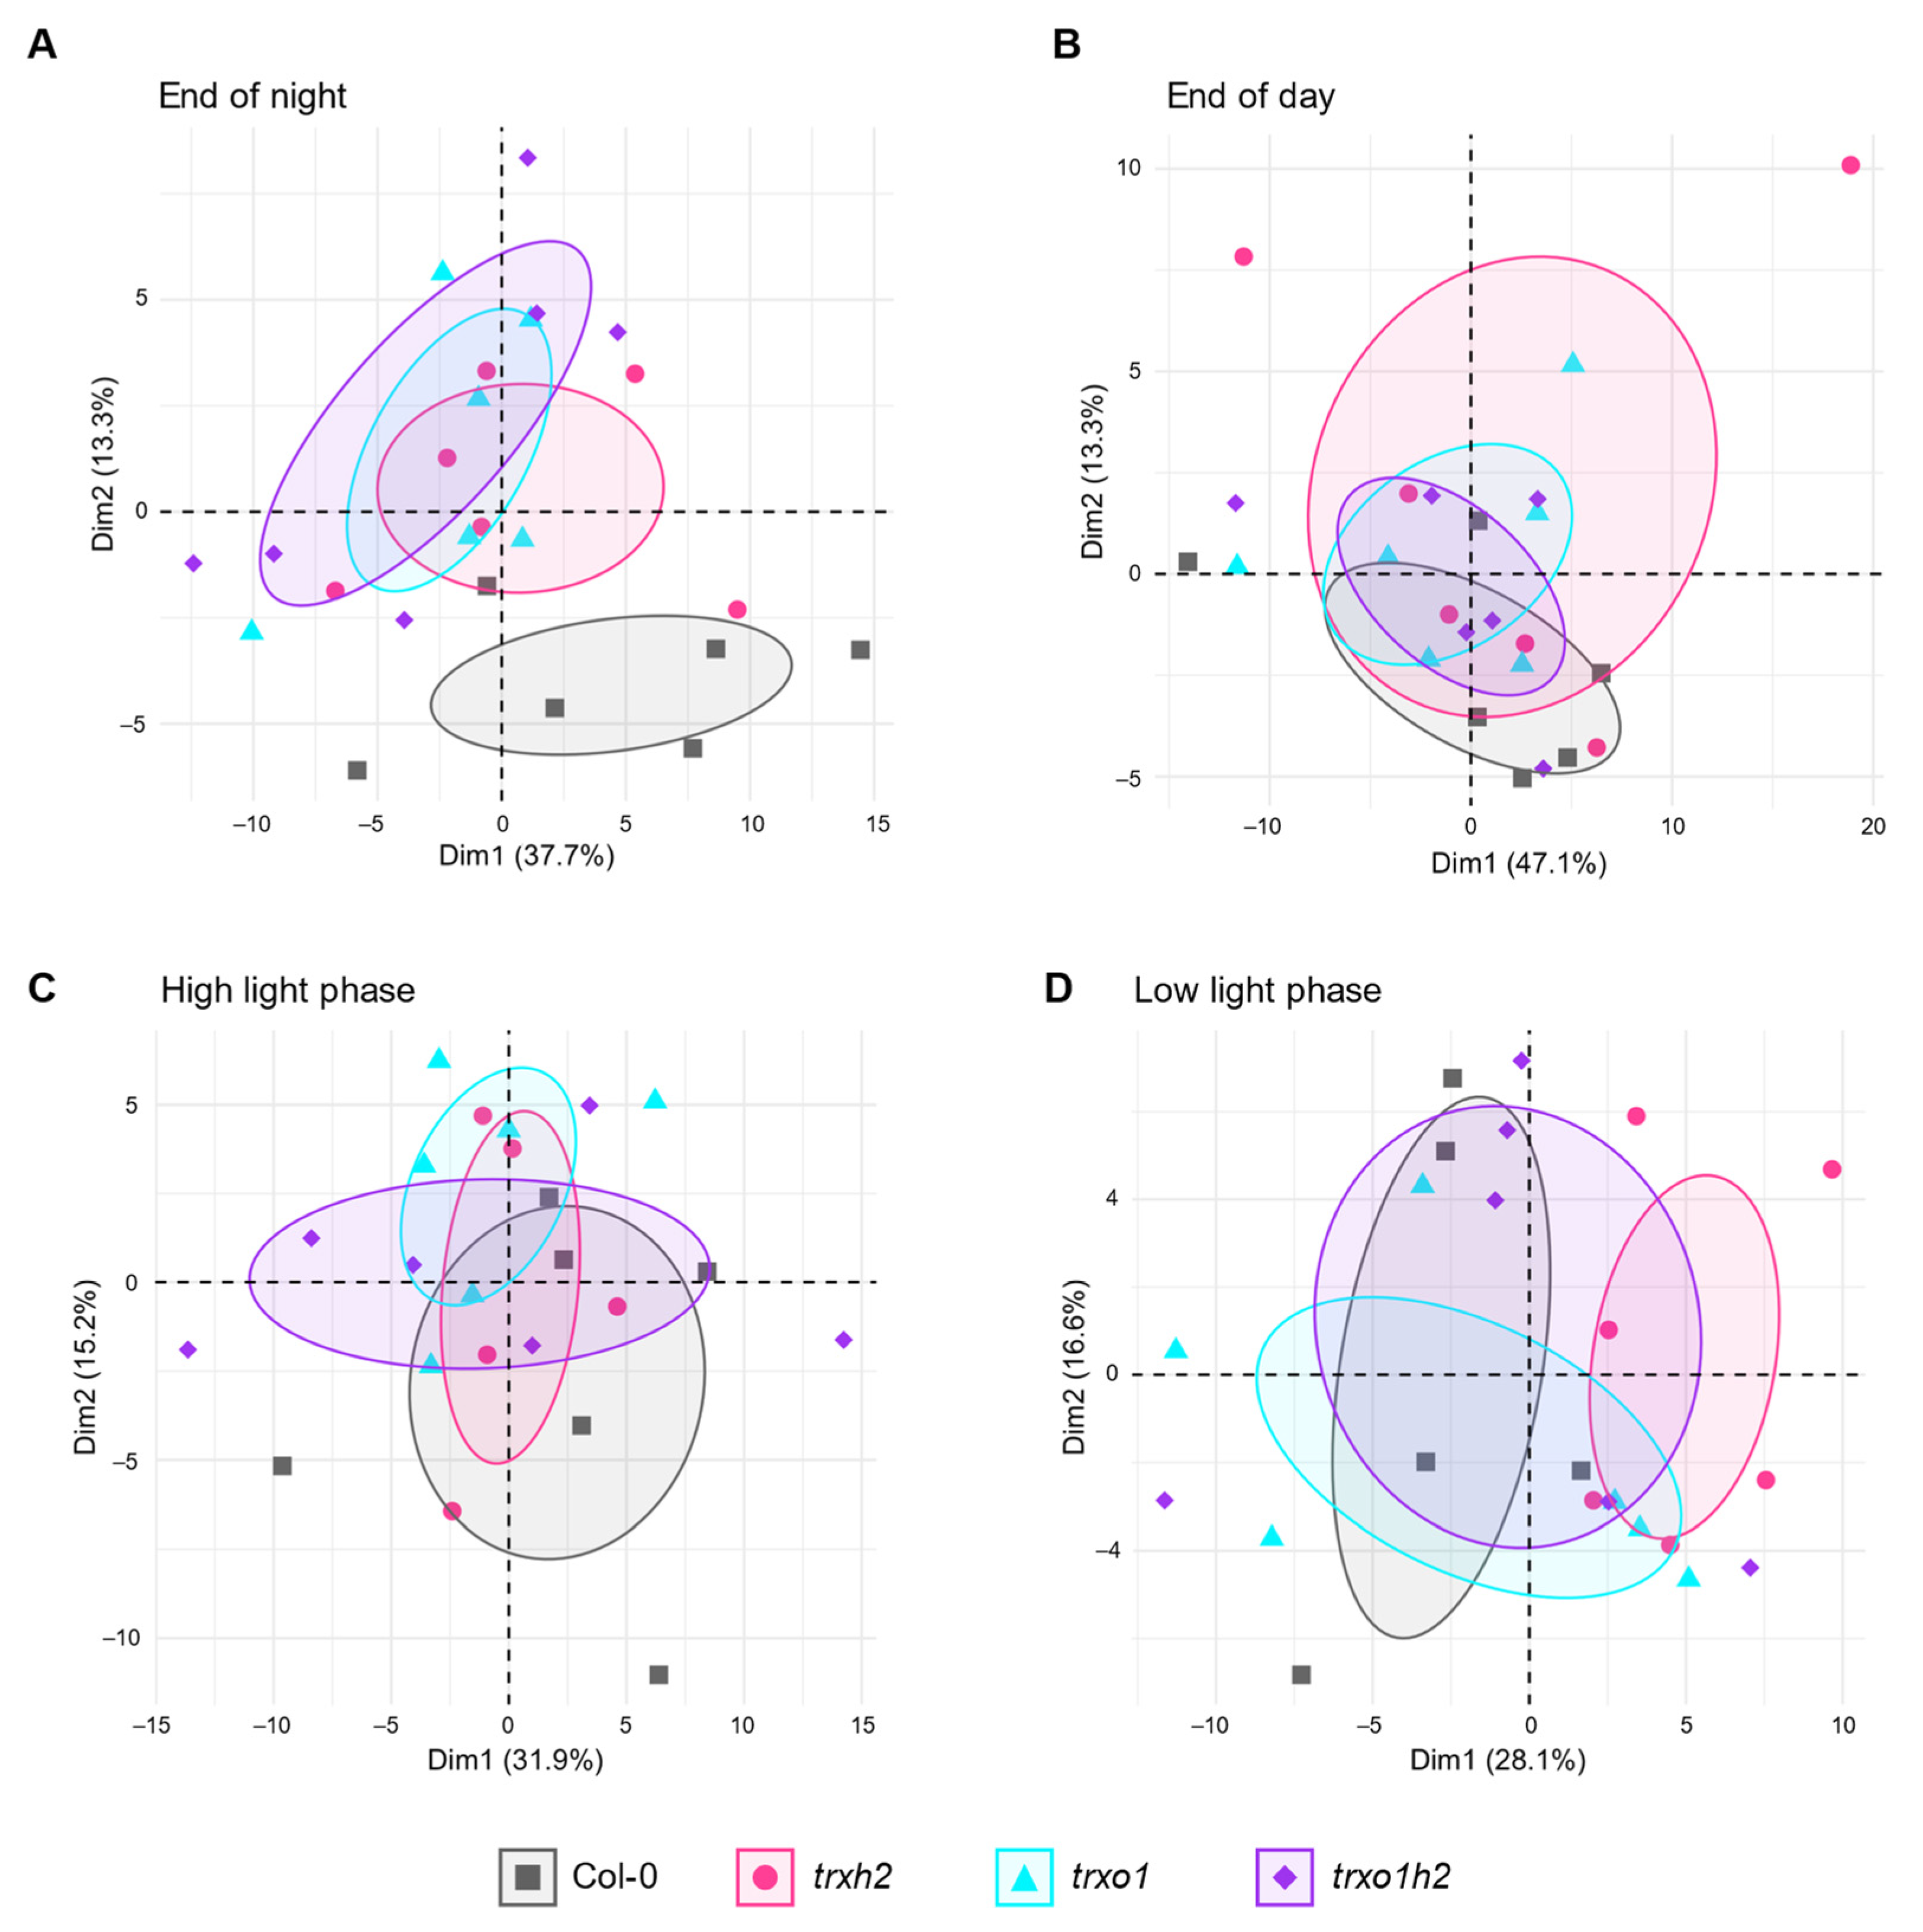
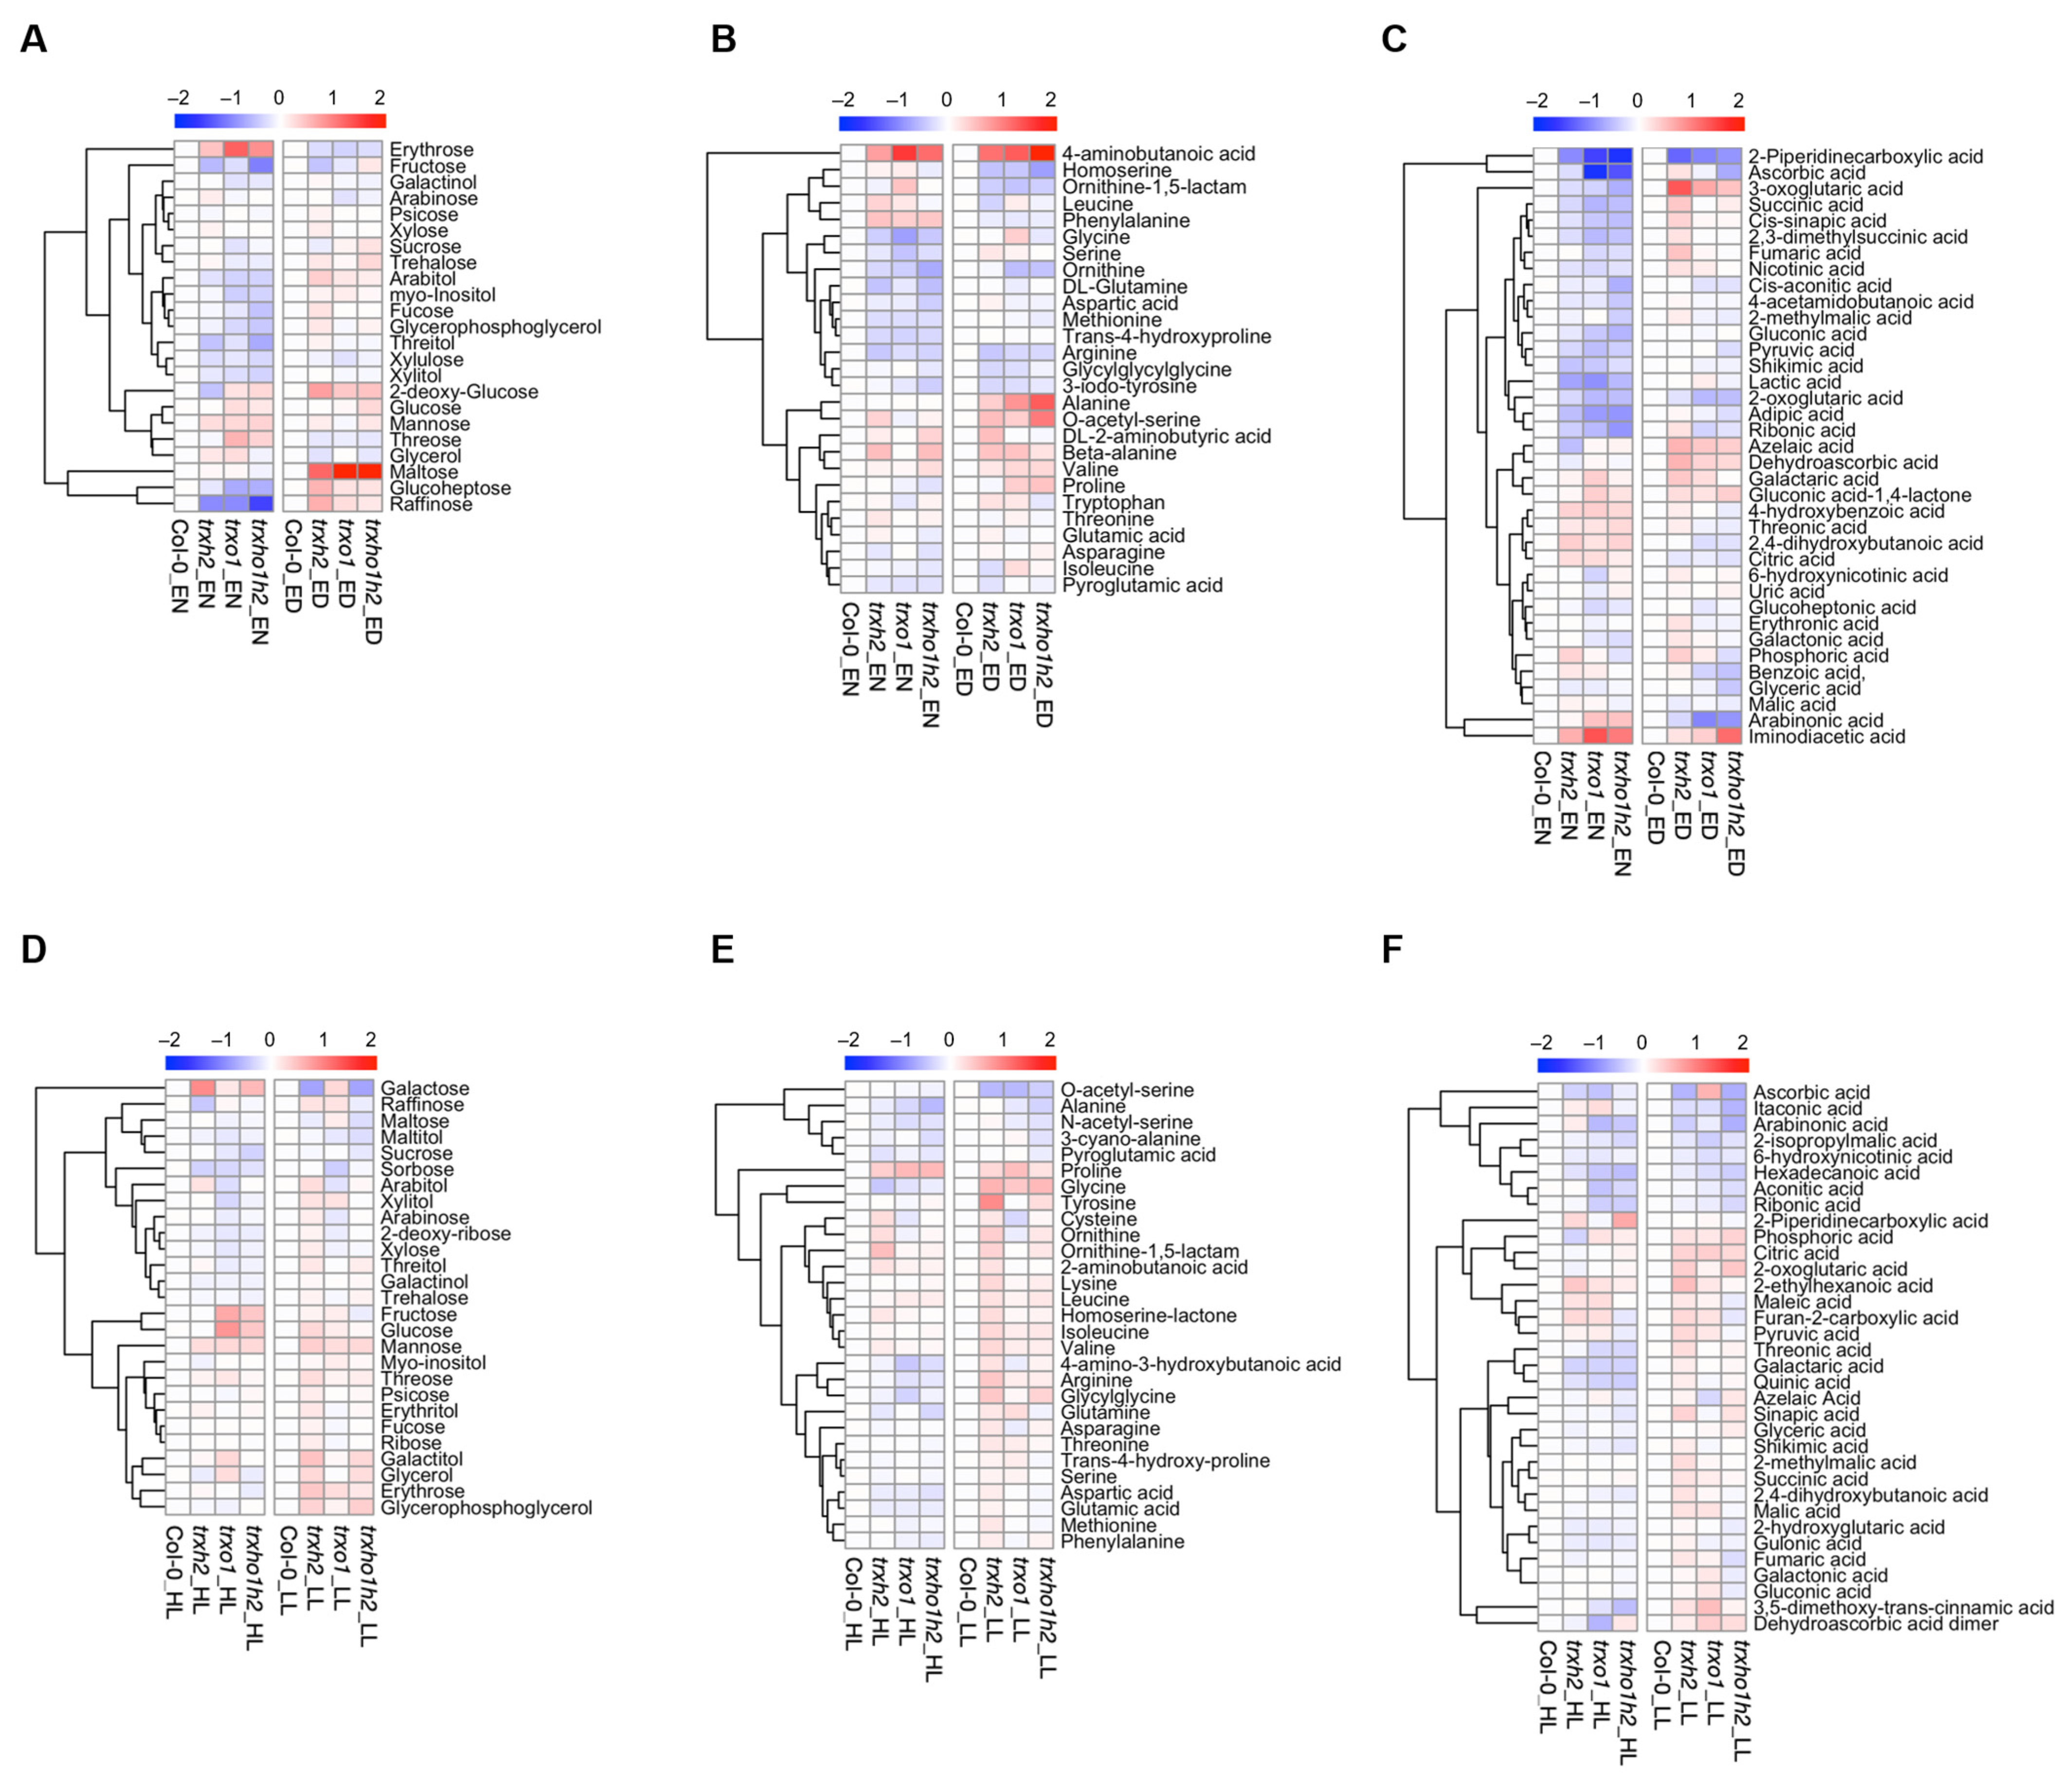
3.3. Nocturnal Metabolite Levels of Trxh2, Trxo1 and Trxo1h2 Mutants Cluster Differently to the Wild Type

To further understand the differential effects of Trx h2 and o1 on plant growth, a GC-TOF-MS approach was performed to analyze metabolite profiles in the mutants under different light conditions. We first analyzed the data set using principal component analysis (PCA) to get a global pattern of metabolite changes. When nocturnal metabolism was investigated, the three mutants clustered differently to the wild type. The trxo1 and trxo1h2 mutants showed a similar cluster, while the trxh2 single mutant was only overlapping partly with the trxo1 mutant (Figure 4A). Interestingly, when metabolism was analyzed in the light, the PCA shows a similar cluster for the wild type and mutants. This holds true for the day phase of constant ML conditions (Figure 4B), as well as for the high-light (HL) and low-light (LL) phases of FL conditions (Figure 4C,D). This indicates that Trx h2 and Trx o1 are both important for nocturnal metabolism, with partially overlapping functions.
Indeed, at the end of the night, the trxh2 and trxo1 single mutants and the trxo1h2 double mutants showed a mild decrease in the levels of several soluble sugars, which were the cases for fructose (51–84% of wild-type level), glucoheptose (64–88% of wild-type level), raffinose (37–54% of wild-type level) and xylulose (81–88% of wild-type level), and amino acids, which were the case for arginine (76–84% of wild-type level), glutamine (71–88% of wild-type level), glycine (61–78% of wild-type level), methionine (85% of wild-type level), ornithine (63–80% of wild-type level) and serine (73–89% of wild-type level). Notably, in the mutant lines, the levels of 4-aminobutanoic acid (GABA) and phenylalanine were significantly increased when compared to the wild type (Figure 5A,B, left panel; Table S1). In the mutant lines, there was also a clear decreasing pattern in the levels of many organic acids, including 2-piperidinecarboxylic acid (30–54% of wild-type level), adipic acid (56–71% of wild-type level), gluconic acid (68–88% of wild-type level), lactic acid (55–69% of wild-type level), ribonic acid (57–76% of wild-type level), pyruvic acid (71–82% of wild-type level), 2-oxoglutaric acid (69–82% of wild-type level) and succinic acid (67–81% of wild-type level; Figure 5C, left panel; Table S1). Surprisingly, joint deficiencies in Trx h2 and o1 had no additive effects on metabolite accumulation. However, these metabolite changes in the mutants versus wild type were not sustainable when metabolism in the light was analyzed (Figure 5A–C, right panel; Table S1).
Under FL conditions, deficiency of Trx h2 and o1 had minor effects on the accumulations of most sugars and sugar alcohols (Figure 5D). In the HL phases, the changes of most amino acids in the mutant lines were also very subtle, except for alanine (69–92% of wild-type level), glycine (75–91% of wild-type level) and proline (1.3–1.5 times wild-type level; Figure 5E, left panel, Table S2). However, in the LL phases, several amino acids showed significant changes in either the single or double mutants. This included glycine (1.3–1.5 times wild-type level), proline (1.2–1.4 times wild-type level) and O-acetyl-serine (68–76% of wild-type level; Figure 5E, right panel, Table S2). In the HL phases, some organic acids showed a decreasing tendency in the trxo1 and trxo1h2 mutants, which were the cases for galataric acid (80% of wild-type level), hexadecanoic acid (71–85% of wild-type level), ribonic acid (77% of wild-type level) and threonic acid (80% of wild-type level), while, in the LL phases, the changes were not sustainable (Figure 5F; Table S2). Taken together, the results indicate the significance of Trx h2 and o1 in nocturnal metabolism, while there were only minor effects in FL conditions.

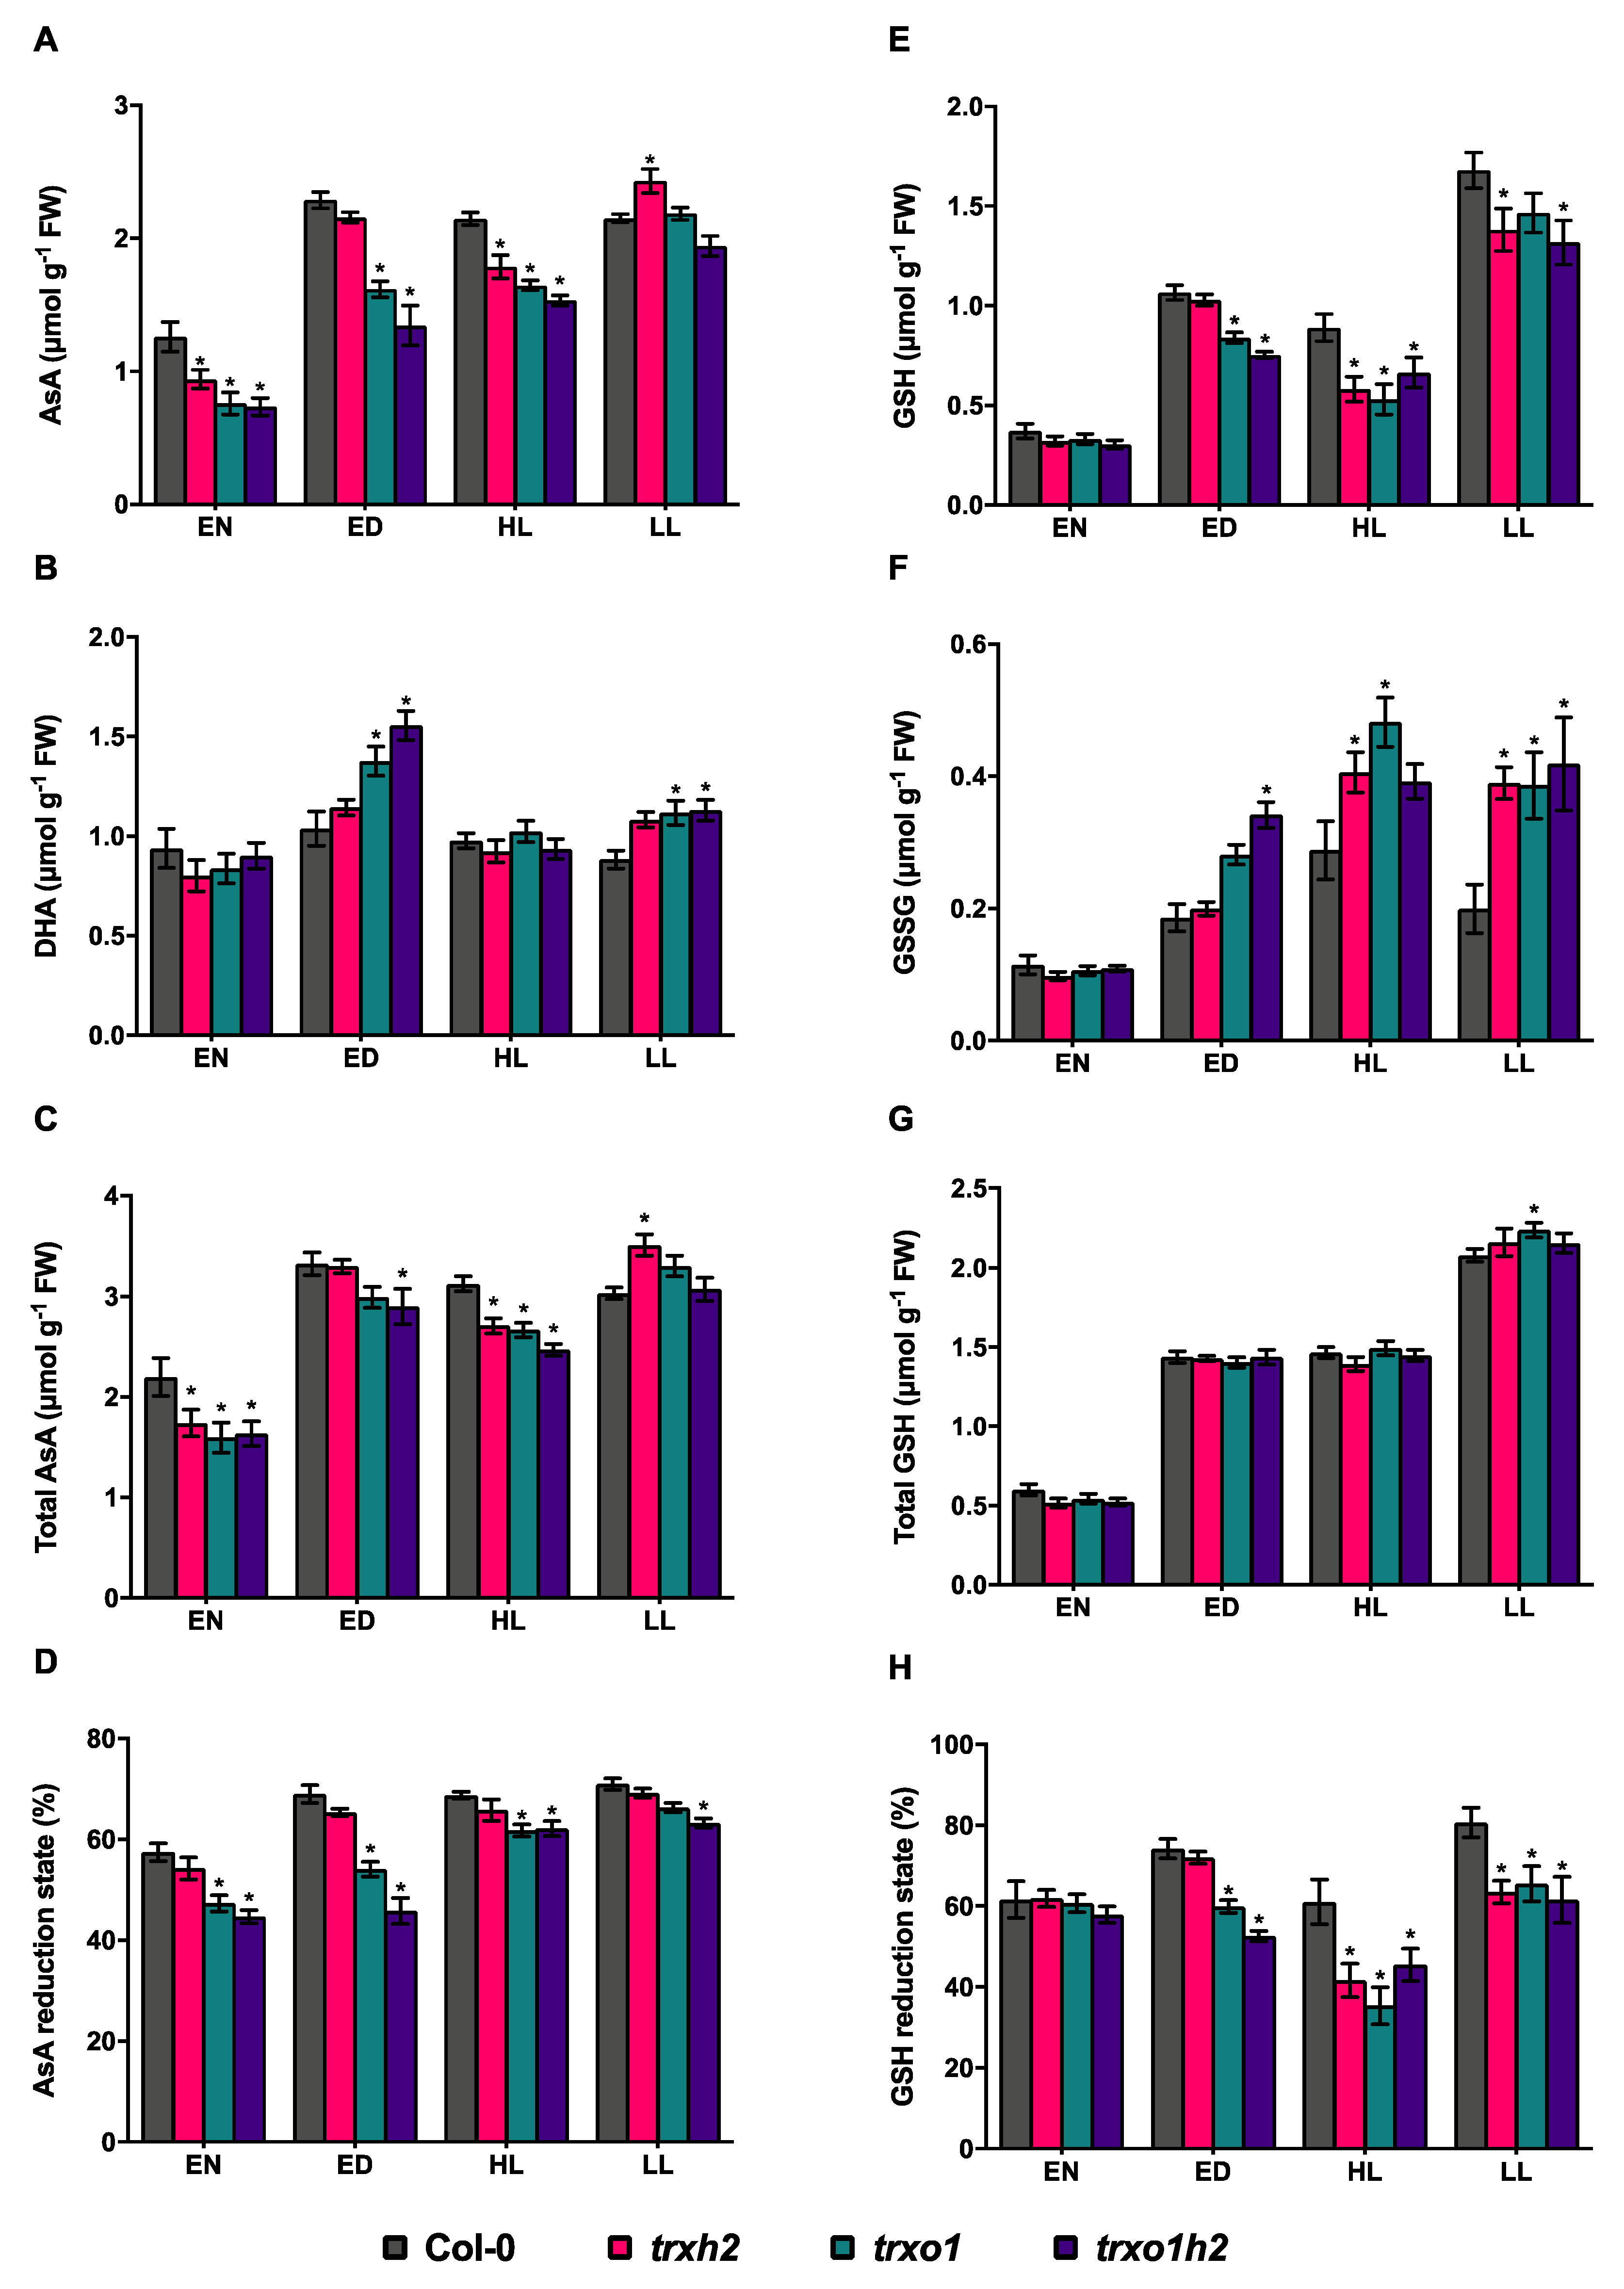
3.4. Deficiencies in Trx h2 and o1 Differentially Affect the Reduction States of Ascorbate and Glutathione

To understand whether Trx h2 and o1 are involved in the maintenance of cellular redox status, the reductive states of ascorbate (AsA)/dehydroascorbate (DHA) and reduced glutathione (GSH)/oxidized glutathione (GSSG) redox couples were analyzed. In the wild type, the total levels of AsA, DHA (Figure 6A–C), GSH and GSSG (Figure 6E–G), as well as the AsA and GSH reductive states (Figure 6D,H) were higher in the different light conditions, compared to dark. When focusing on AsA system first, all three mutants showed a decrease in total AsA levels in the dark and HL phases, while trxo1 single and trxo1h2 double mutants also showed a decrease in ML conditions, compared to the wild type (Figure 6A,C). In addition to this change, the AsA reduction state (calculated as the AsA/(AsA + DHA) ratio in %) in mutant lines except the trxh2 single mutant was lower than the wild type under all analyzed conditions (Figure 6D). The decrease in AsA reduction state due to knockout of Trx o1 was more strongly expressed in the dark and ML than in FL conditions. The joint deficiencies of Trx o1 and h2 did not lead to stronger effects compared to Trx o1 single deficiency.
Looking at the GSH system, all three mutants showed similar decreases in GSH levels (Figure 6E) and GSH redox states (Figure 6H; calculated as the GSH/[GSH+GSSG] ratio in %) and an increase in GSSG level (Figure 6F) under FL conditions (HL and LL) compared to the wild type, and similar patterns of the three parameters in ML were observed in the trxo1 single and trxo1h2 double mutants, but not in the trxh2 single mutant. In contrast to this change, GSH levels and GSH redox states were similar in all genotypes in the dark. The levels of total GSH pool in all three mutant lines were comparable to the wild type under all analyzed conditions (Figure 6G). These results indicate that both Trx h2 and o1 serve as positive regulators in maintaining the reductive state of the GSH system specifically in FL conditions; however, Trx o1, but not Trx h2, regulates the reductive state of the AsA system under all analyzed conditions. This shows that Trxs h2 and o1 regulate the AsA and GSH redox systems in a different manner.

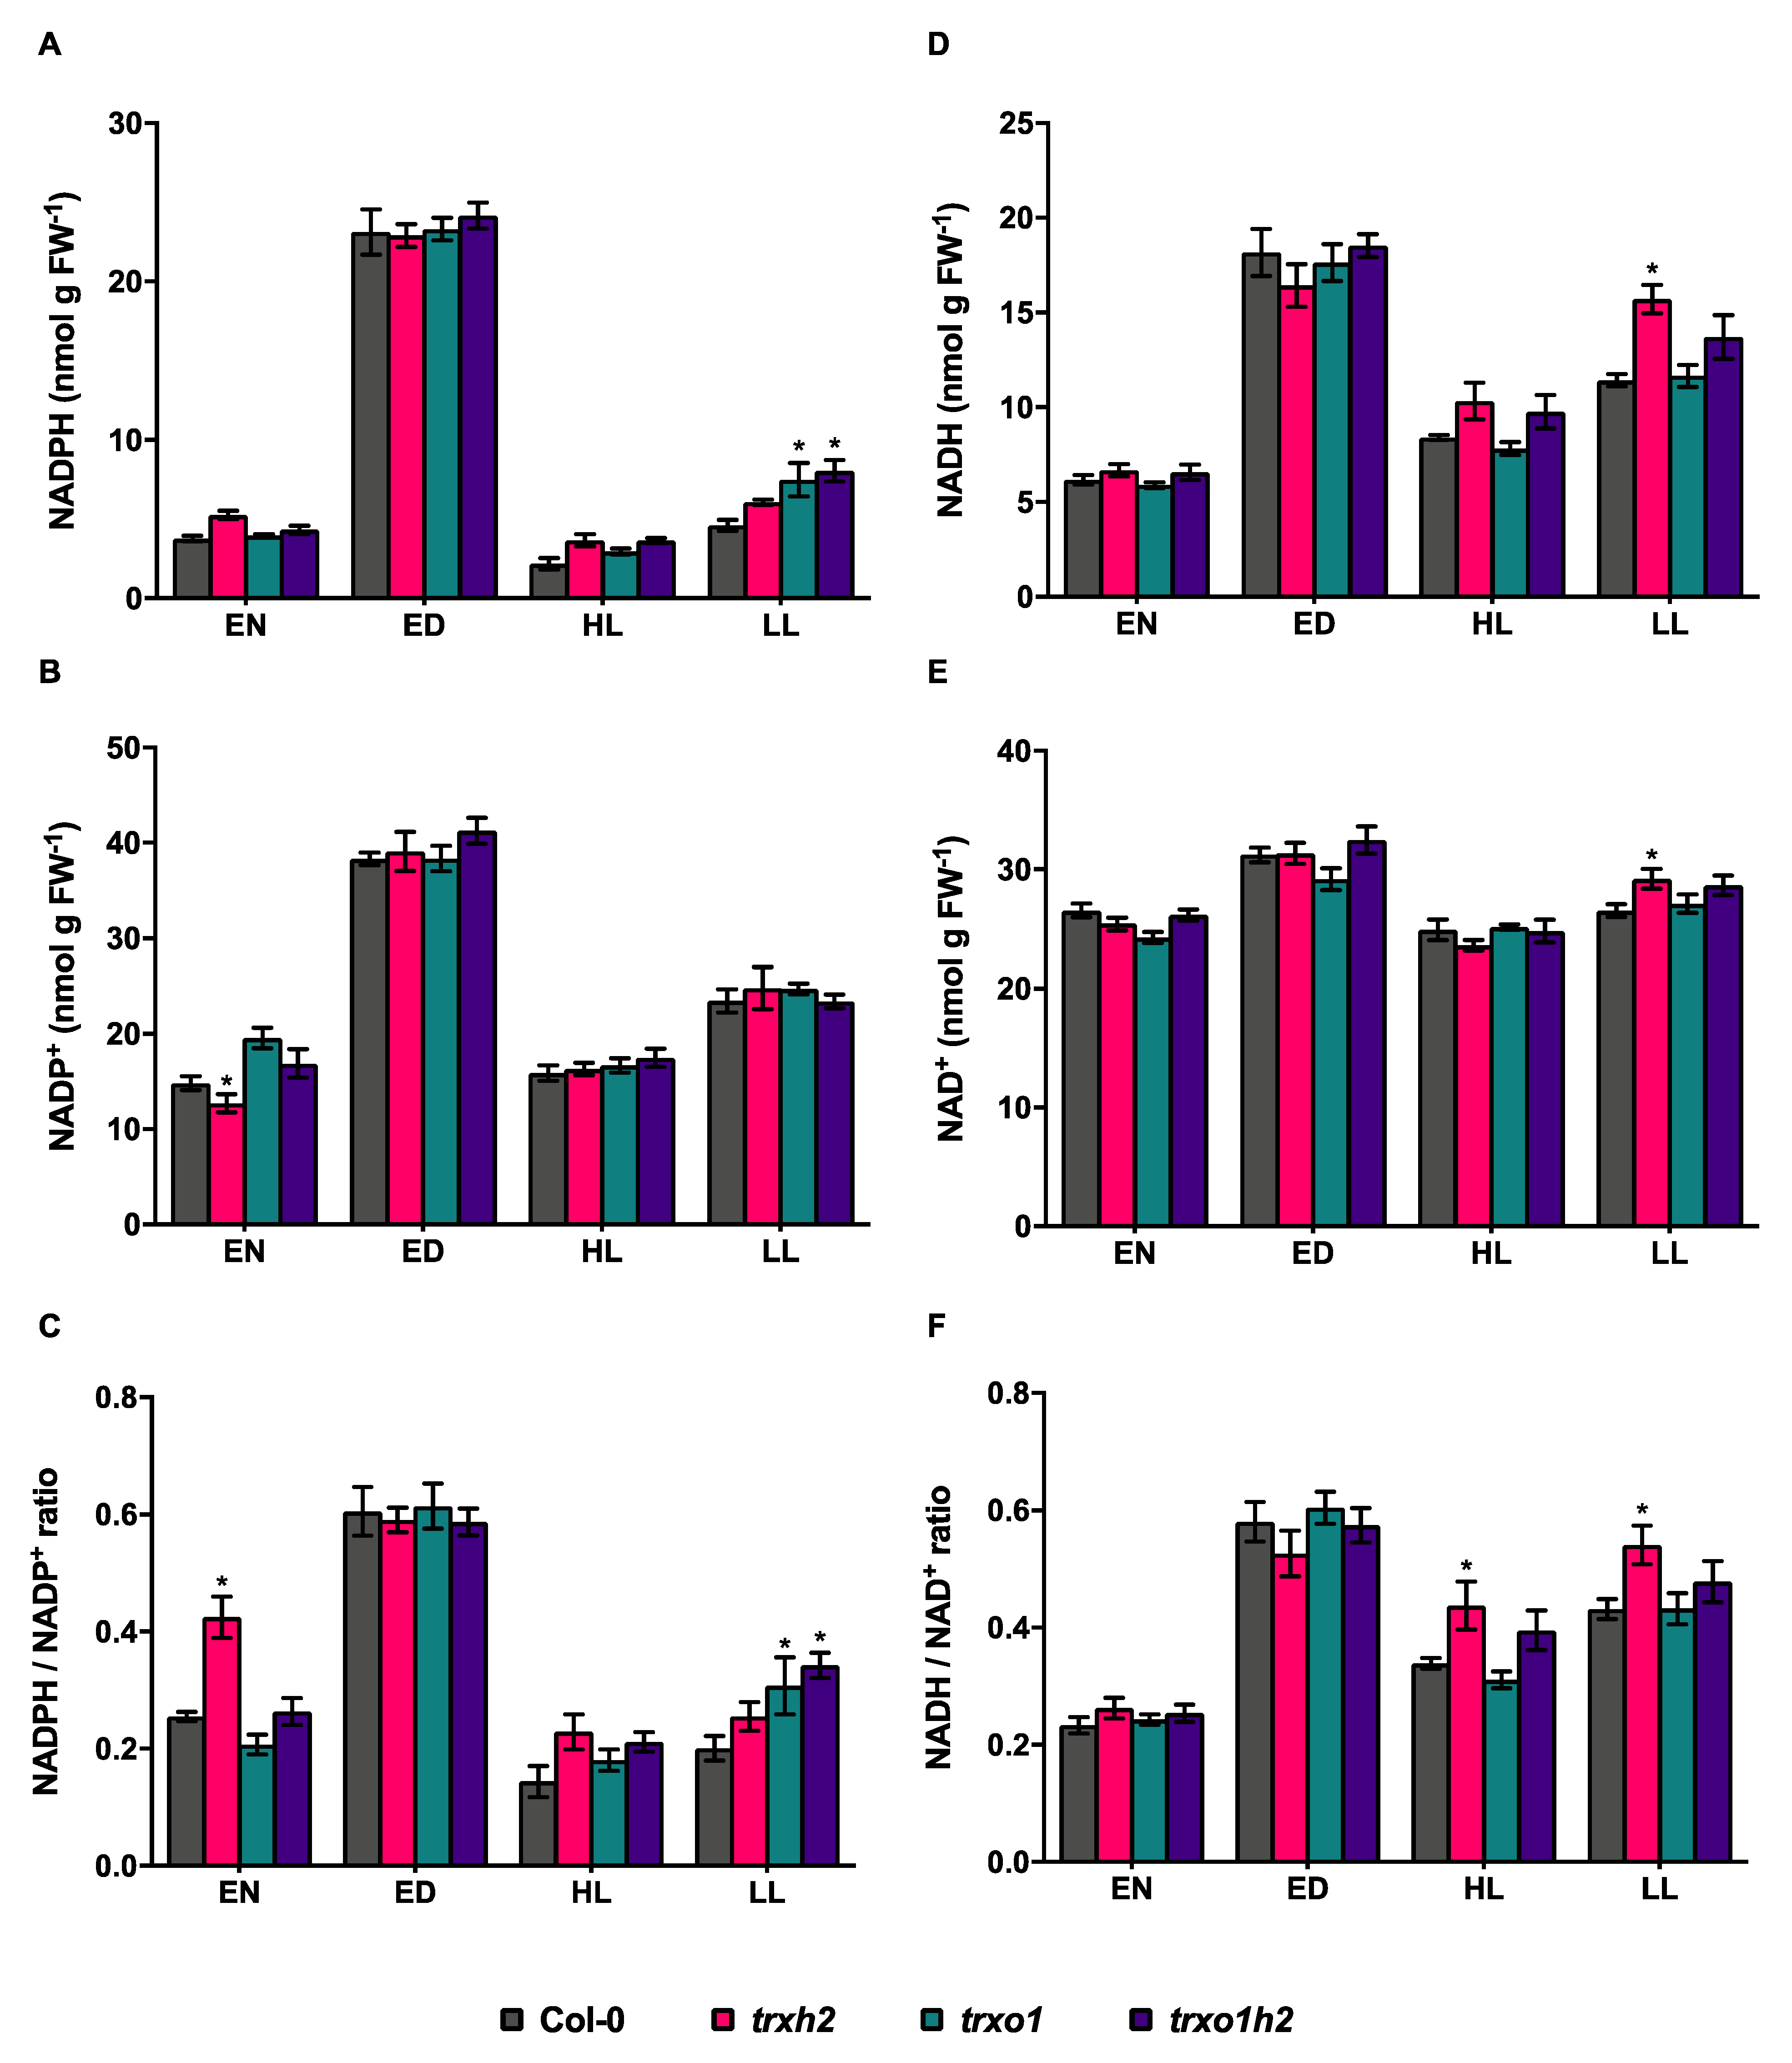
3.5. Deficiencies in Trx h2 and o1 Affect the NADPH Redox State in Fluctuating Light

The redox couples, NADPH/NADP+ and NADH/NAD+, are also important components for maintaining the cellular redox balance. They also serve as substrates for Trx reductases to regulate the redox state of Trxs. To understand whether deficiencies of Trxs h2 and o1 affect the redox balance of NAD(P)(H), the levels of NADPH, NADP+, NADH and NAD+ were analyzed (Figure 7). In the wild type, the levels of NADPH (Figure 7A) and NADH (Figure 7D), as well as the NADPH/NADP+ (Figure 7C) and the NADH/NAD+ ratios (Figure 7F), were much higher in the light than in the dark, when plants were analyzed under constant ML conditions. This confirms previous studies showing a strong increase in the reduction states of the NADPH and NADH systems upon illumination under normal growth conditions [19,61]. Interestingly, the light-induced increase in the NADPH/NADP+ ratio was wiped out under FL intensities, yielding NADPH and NADP+ levels in HL and LL phases that were below those reached in the night (Figure 7C). Additionally, the light-induced increase in the NADH/NAD+ ratio was strongly attenuated in FL, compared to ML (Figure 7F).
In all three mutants, the levels of NADPH, NADP+, NADH and NAD+, as well as the NADPH/NADP+ and NADH/NAD+ ratios, were similar to wild-type levels when plants were analyzed under ML conditions. However, one exception is the increase in the NADPH/NADP+ ratio in the trxh2 single mutant (Figure 7C), which was not reflected by a corresponding increase in the NADPH level (Figure 7A). Since the NADPH/NADP+ ratio remained at the wild-type level in the trxo1h2 double mutant, we do not think that this effect is related to a more specific function of Trx h2.
Interestingly, there were increases in NADPH level (Figure 7A) and NADPH/NADP+ reduction state (Figure 7C) in mutants relative to the wild type when plants were analyzed in FL intensities. The increase in these parameters was more markedly in LL compared to HL phases of FL and was more strongly expressed in the trxo1 single and trxo1h2 double mutants than in the trxh2 single mutant. In the LL phases of FL, the trxo1h2 double mutant with joint deficiencies of Trx o1 and h2 reached higher NADPH level and NADPH/NADP+ ratios compared to the other genotypes.
Taken together, while illumination with constant ML intensity led to increased reduction states of the NADP(H) and NAD(H) systems, these redox couples remained in a more oxidized state upon illumination with FL intensities. Interestingly, the FL-induced oxidation of the NADP(H) system was attenuated by the joint deficiencies in Trx h2 and o1, specifically in the LL phases of FL. These results indicate that both Trxs have negative effects on the levels and reduction states of NADPH in FL environments.

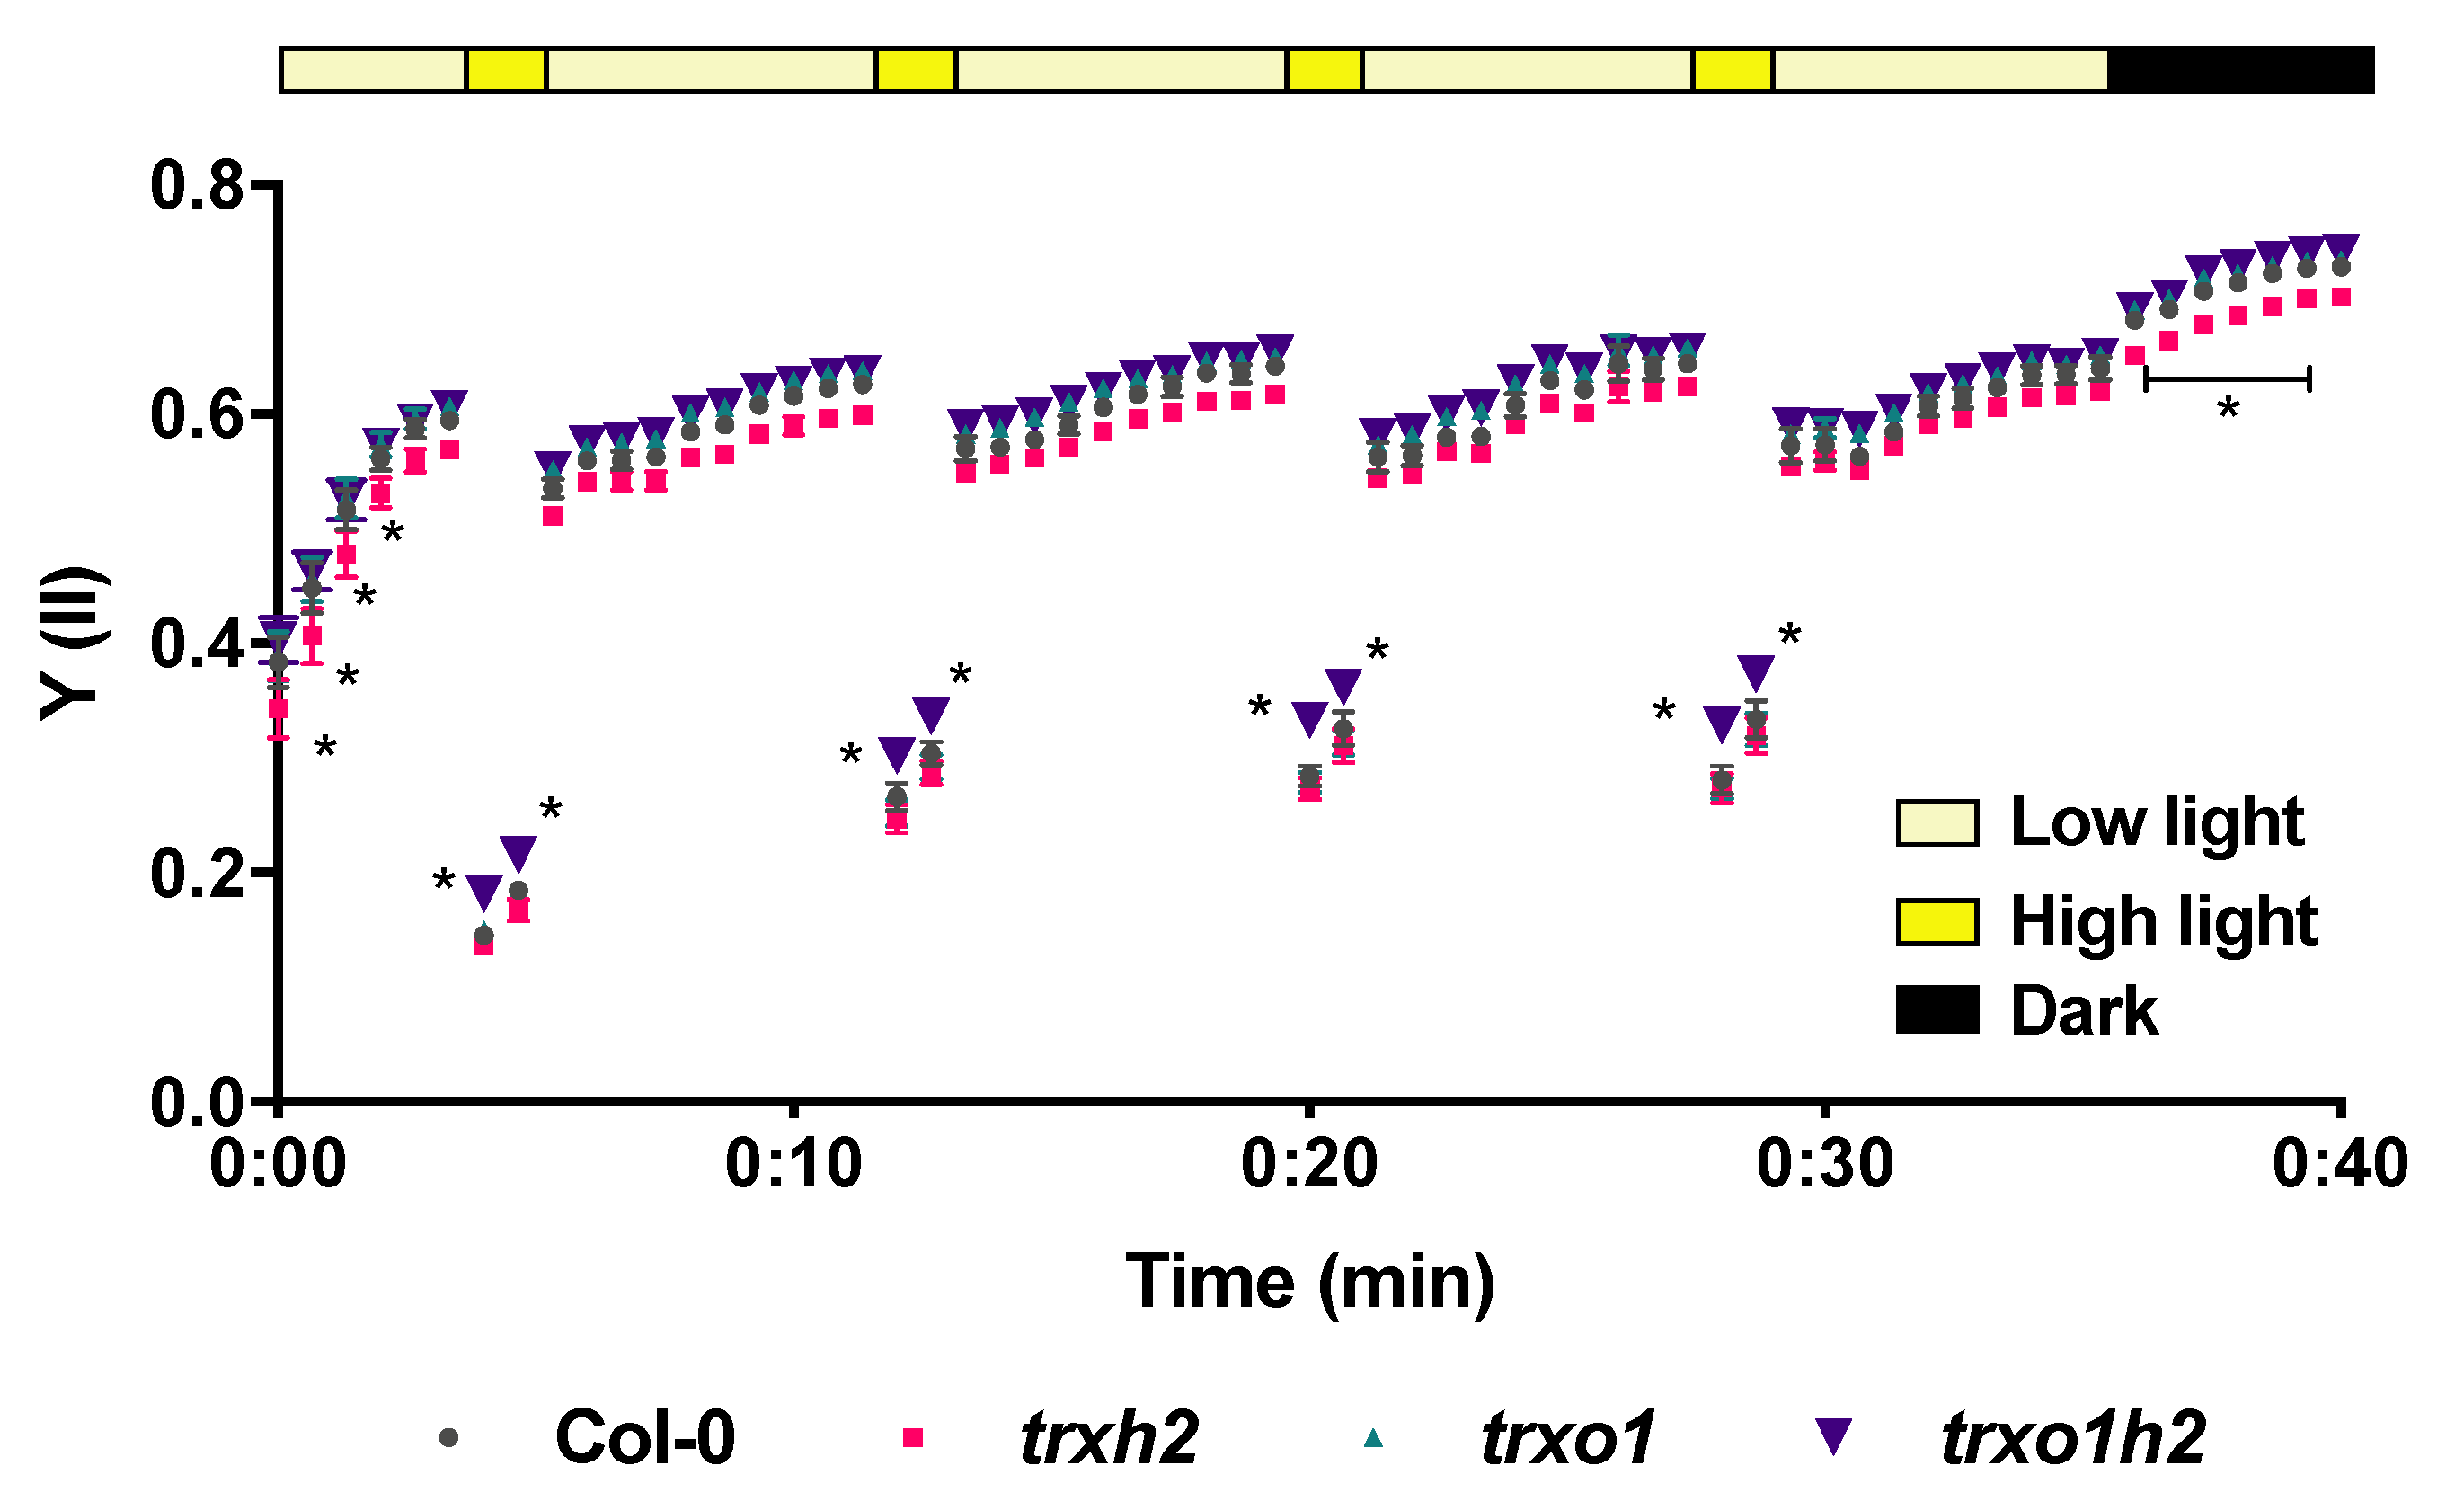
3.6. Joint Deficiencies in Trx h2 and o1 Lead to Enhanced Photosynthetic Efficiency in Fluctuating Light

The effects of Trxs h2 and o1 on the NADPH reduction state in FL might be associated with changes in photosynthesis. Therefore, a pulse-amplitude-modulation (PAM) approach was used to analyze the photosynthetic performance of the mutants relative to the wild type. When plants grown in FL were analyzed, the quantum yield of photosystem II (Y(II)) decreased dramatically in HL versus LL phases of FL. This decrease in Y(II) was attenuated in the trxo1h2 double mutant, showing a significantly higher Y(II) in the HL phases of FL, compared to the wild type or single mutants (Figure 8). In contrast to these changes in FL, the trxo1h2 double mutant revealed only minor effects on Y(II) when plants were grown under constant ML conditions (Figure S2). Under steady-state conditions of constant ML and dark, Y(II) levels of all mutants were similar to the wild-type level. However, during dark–light transitions, the trxo1h2 double mutant showed a faster increase in Y(II) kinetics (Figure S2) compared to the wild type or single mutants. These results indicate that Trxs h2 and o1 are jointly involved in the control of photosynthetic performance, both in FL environments and during rapid dark-light transitions, but have no sustainable effects on photosynthesis under steady-state conditions in constant ML.

4. Discussion

Arabidopsis contains eight different h-type Trxs, which are distributed to different cell organelles. Although Trx h2 has been proposed to be localized specifically to mitochondria and to fulfill similar roles as mitochondrial Trx o1, its subcellular localization and function are still a matter of debate. In this work, we used a cell fractionation approach to clarify the localization of Trx h2. To further understand the functions of Trx h2 and o1, we performed a series of physiological and biochemical analyses to directly compare representative trxh2 and trxo1 single mutants as well as their crossed double mutant in different light conditions. Our results show that Trx h2 is exclusively localized to the microsomes rather than to mitochondria. In constant light, Trx h2 and o1 harbor differential functions on plant growth, nocturnal metabolism and redox states of AsA and GSH, while in fluctuating light, both types of Trxs jointly influence NADP(H) redox states and photosynthetic efficiency.

4.1. Thioredoxin h2 Is Associated to ER/Golgi Showing a Different Subcellular Localization in Comparison to Trx o1

The plant Trx h family consists of various isoforms, with Arabidopsis containing eight different h-type Trxs. Since the encoded proteins were found to have no obvious transit peptides, they were initially anticipated to be confined to the cytosol [39]. Interestingly, in further studies using transient expression systems and reporter genes, Trx h2 was proposed to localize to subcellular compartments other than the cytosol, but the results were not consistent. Studies by Gelhaye et al. and Meng et al. in poplar (Populus trichocarpa) and Arabidopsis proposed Trx h2 to reside in mitochondria [37,62], while Traverso et al. used similar studies in Arabidopsis to document that this protein is associated with the endoplasmic reticulum (ER)-Golgi membrane system [38]. To clarify the subcellular localization of Trx h2, we used a cell-fractionation study combined with immunoblot analyses in Arabidopsis. By analyzing both wild-type and Trx h2ox plants, we found that the Trx h2 protein is clearly enriched in microsomal fractions, while it is not detectable in purified mitochondria or cytosolic fractions. This provides unequivocal and direct biochemical evidence that Trx h2 is confined to the endomembrane system rather than to mitochondria or cytosol (Figure 1). Our cell fractionation studies further confirm the GFP reporter studies published by Traverso et al. [38] and are in line with Trx h2 being absent in Arabidopsis mitochondrial proteome databases [63]. Moreover, the Trx h2 protein was found to contain an N-terminal extension that harbors a myristoylated residue, which is known to target cytosolic proteins to ER/Golgi membranes [38]. When the myristoylable Gly at the N-terminal extension of Trx h2 was substituted by Ser, the modified Trx h2 was found to be relocated to the cytosol, providing evidence that the N-myristoylation motif is responsible for inducing the ER/Golgi localization of Trx h2 [38]. As a myristoylated protein, Trx h2 is probably anchored to the cytoplasmic face of the Golgi/ER, indicating metabolic functions in the cytosol rather than characteristic ER functions, like protein synthesis and folding. More studies will be necessary to confirm this interpretation.

4.2. Thioredoxins h2 and o1 Have Different Roles in Regulating Growth, ASA-GSH Redox States and Metabolite Profiles in Non-Stressed Conditions

To investigate whether the different subcellular localization relates to different functions of Trxs h2 and o1, we analyzed trxh2 and trxo1 single mutants together with a trxo1h2 double mutant to allow a direct comparison of the different genotypes with respect to plant growth, cellular redox states, metabolite profiles and photosynthetic parameters under non-stressed ML conditions. Under these conditions, deficiency of Trx o1 led to a decrease in plant growth, while Trx h2 deficiency had no such effect (Figure 2). Interestingly, a joint deficiency of both Trxs did not lead to additive effects, indicating Trx o1 and h2 to have different roles in growth regulation. The retardation of plant growth was not due to a decrease in photosynthetic efficiency since the quantum yield of PS II was similar in all genotypes in ML (Figure S2).
The cellular redox status, which includes different redox systems, is important for metabolic regulation, antioxidant function and signaling, and ultimately determines plant growth and development. In non-stressed conditions, deficiencies in Trx h2 and o1 differentially affected the reduction states of the AsA/DHA and GSH/GSSG redox couples. Trx o1, but not Trx h2, deficiency led to a decrease in both AsA (Figure 6D) and GSH reduction states (Figure 6H). The trxo1h2 double mutant showed similar changes as the trxo1 single mutant with no substantial additive effects. In contrast to this, the NADPH/NADP+ and NADH/NAD+ redox couples in all mutant lines were similar to the wild type, with the exception of a nocturnal increase in NADPH/NADP+ redox state in the trxh2 mutant. These results indicate that, unlike Trx h2, Trx o1 is important to maintain the GSH and AsA redox states of the cell in non-stressed conditions. Since the AsA-GSH cycle mainly operates in mitochondria but has not been documented in ER [64], results are in line with the differential subcellular localization of Trxs h2 and o1, in Golgi/ER and mitochondria, respectively. This suggests that the different subcellular localization of both proteins is associated with different redox-active functions. It may also explain the differential effect of the two Trx proteins on plant growth.
From the in silico prediction, enzymes of the AsA-GSH cycle harbor at least one putative redox-reactive Cys (Table S3). In recent proteomic studies, several enzymes of the AsA-GSH cycle and NAD(P)H metabolism were found to be redox reactive, and some of them were confirmed to be Trx targets [14,65,66,67,68,69]. Interestingly, Yoshida et al. identified stromal/mitochondrial ascorbate peroxidase (At4g08390), glutathione peroxidase 6 (At4g11600), malate dehydrogenase 1 (At1g53240) and NAD+-dependent malic enzyme (At2g13560/At4g00570) as putative target proteins of Trx o1 [69]. Therefore, these proteins are the most likely candidates to be involved in the regulation of the AsA-GSH cycle and NAD(P)H metabolism by Trx o1. The in vivo relevance of this notion still requires further investigations.
Joint and single deficiencies of Trxs h2 and o1 also led to marked changes in nocturnal metabolite profiles, while there were no substantial changes in the profiles monitored in the light phase (Figure 4; Figure 5). The PCA of nocturnal metabolite profiles showed that all three mutant lines clustered differently from the wild type (Figure 4A). However, trxh2 was only partly overlapping with these mutants and clusters more closely to the wild type, even though trxo1 and trxo1h2 clustered together. Thus, Trxs h2 and o1 partially affect global metabolite profiles in different manners, but it will not lead to additive effects when both Trxs are deficient. This further indicates that Trx h2 and o1 only share partially overlapping functions. The metabolic pathways where deficiencies of Trxs h2 and o1 led to similar patterns in metabolite profiles are as follows.
First, the levels of the TCA cycle intermediates were generally decreased in the mutants (Figure 5; Table S1). The results are in line with previous studies that proposed that Trx o1 and h2 are involved in the enzyme activation of the TCA cycle [33]. Secondly, in addition to the changes in the TCA cycle metabolites, there was an extremely strong increase of GABA in all mutant lines (Figure 5B; Table S1). Because the level of GABA precursor, Glu, was not changed in the mutants, it is likely that the accumulation of GABA is due to the degradation of polyamine, such as putrescine and spermidine [70,71]. The level of putrescine was actually decreased in all mutants (Table S1). Moreover, the over-accumulation of GABA indicates that the carbon flow of the TCA cycle in the mutants was compromised, so plants were alternatively elevating carbon flux through the GABA shunt to bypass the compromised activity of the TCA cycle enzymes [72]. Thirdly, down-regulating the metabolism of organic acids is very likely to compromise the metabolism of amino acids since organic acids serve as the major source of carbon skeleton for the biosynthesis of amino acids. As expected, the levels of many amino acids, including Gly, Ser, Gln, Met, Orn and Arg, were decreased in the mutants (Figure 5B; Table S1). Notably, the concomitant decreases of Orn and Arg indicate a possible perturbation of the Arg biosynthesis pathway [73]. In comparison to other amino acids, Arg harbors a high N:C ratio and acts as an important nitrogen storage compound. It is also a precursor for the biosynthesis of polyamines and other nitrogen-containing compounds [74,75]. Thus, perturbation in Arg biosynthesis might subsequently lead to negative effects on nitrogen metabolism. However, it is unlikely that Trx h2 and o1 are able to regulate the enzymes of the Arg biosynthesis pathway directly [73] since most of them reside in plastids. Thus, the down-regulation in Arg synthesis might be due to the shortage of organic acids. Fourthly, during the day, the levels of photorespiratory intermediates, such as Gly, Ser and glycerate, in the mutant lines were comparable to the wild type (Figure 5B; Table S1). However, it should be noted that plants were grown in normal air where the contributions of Trx h2 and o1 to photorespiration are expected to be of minor importance. Indeed, the trxh2 and trxo1 single mutants showed comparable carbon assimilation rates to the wild type when grown under normal air conditions [36,47].
Interestingly, joint deficiencies of Trx h2 and o1 had no substantial additive effects on the accumulation of most metabolites, which makes it difficult to assess how both proteins cooperate in metabolic regulation. Since Trxs h2 and o1 are located in ER/Golgi and mitochondria, respectively, interorganellar communication will be required. However, the underlying mechanisms are unresolved. While Trx h2 is probably anchored to the cytoplasmic face of ER/Golgi by myristoylation [38], it may affect cytosolic processes that are linked to mitochondria. Physiological connections between ER and mitochondria have also been reported in other studies where knock-out of an ATP antiporter in the ER was found to be associated with changes in ROS levels and perturbation of mitochondrial steps of photorespiration [76]. In addition to this, interorganellar communication will be facilitated by physical membrane contact between ER and mitochondria, which has been documented recently by genetically encoded reporters [77]. More work will be required to elucidate ER-mitochondria interactions in the regulation of plant metabolism.

4.3. Thioredoxin h2 and o1 Jointly Affect Photosynthetic Efficiency in Fluctuating Light

Plants have to manage strong light fluctuations in the field. Rapid alterations in light intensity strongly affect the availability of light energy for photosynthetic electron transport and carbon fixation and require efficient acclimation mechanisms to maintain photosynthetic efficiency and plant growth [1,2]. It has been found that light-dependent chloroplast Trxs play a crucial role in the dynamic acclimation of photosynthesis in fluctuating light [19]. Our results show that this extends also to NADPH-dependent extra-plastidial Trxs. Intriguingly, the trxo1h2 double mutant revealed a higher photosynthetic efficiency than the wild type and single mutants under fluctuating light, especially in the HL phases (Figure 8). This indicates that the extra-chloroplastidial Trxs h2 and o1 act cooperatively to dampen acclimation processes in fluctuating light.
Acclimation processes in fluctuating light were proposed to be important to avoid imbalances in NADPH/NADP+ redox states. However, studies are largely lacking to test this notion. Our results confirm the vulnerability of the NADPH/NADP+ redox state in fluctuating light conditions. In the wild type, there is a strong decline in the NADPH/NADP+ redox state in fluctuating light, compared to constant ML, which is quite dramatic since it drops down below nocturnal levels (Figure 7C). Interestingly, in the trxo1h2 double mutant, the FL-dependent decrease in the NADPH/NADP+ ratio was attenuated, specifically in the LL phase of FL (Figure 7C), which is in line with its improved photosynthetic efficiency under these conditions. This indicates that the cooperative effect of extra-plastidial Trxs h2 and o1 on FL-dependent acclimation processes is linked to NADPH redox homeostasis. The underlying mechanisms, however, remain unresolved. At the moment, it is unclear how Trxs h2 and o1, which are associated with Golgi/ER and mitochondria, respectively, can affect FL-acclimation processes that are known to reside in the chloroplast [78]. The cellular NADPH homeostasis is known to be mediated by inter-organellar malate/oxaloacetate shuttles involving the activities of different malate dehydrogenase (MDH) proteins distributed to chloroplasts, mitochondria, peroxisomes and cytoplasm [79]. Proteomics studies suggested that MDH proteins might act as targets of h-type Trxs [66,67]. Specifically, the activity of mitochondrial NAD+-dependent MDH is proposed to be regulated by Trx o1 [33]. Since Trx h2 is probably anchored to the cytoplasmic face of ER/Golgi by myristoylation [38], it may regulate cytoplasmic MDH activity [80]. Taken together, it is likely that Trx h2 and o1 might cooperatively modulate the activities of MDH isoforms and, thus, affect the cellular redox balance of NADPH and finally photosynthetic efficiency in FL.
Acclimation in fluctuating light has also been proposed to involve stimulation of photorespiratory processes [81,82,83], providing an alternative explanation for the cooperative role of Trxs h2 and o1 in this context. Deficiencies of Trx h2 and o1 have been found to enhance the activity of glycine decarboxylation (GDC) in mitochondria. This would produce high amounts of NADH and further facilitate the operation of mitochondrial electron transport chain and photorespiratory carbon flow [36,47]. Enhancing photorespiratory carbon flow is proposed to promote photosynthesis [84,85]. It is quite likely that this mechanism is specifically important in FL conditions, which require elevated photorespiratory capacities [81,82,83]. Indeed, single and joint deficiencies of Trx h2 and o1 affected Gly level in FL conditions, leading to an increase in the LL phase, while there was a decrease in the HL phase of FL (Figure 5E). This suggests that Trxs h2 and o1 proteins are operating as negative effectors of FL acclimation since they negatively regulate photorespiratory capacity under these conditions. Nevertheless, it must be noted that over accumulation of NADH in mitochondria strongly suppresses GDC activity and decreases the photorespiratory flow [86]. This might eventually compromise the performance of photosynthesis. Thus, the operation described above might only occur when plants undergo a short-term fluctuation of different light intensities.
Further investigations are required to confirm the two hypotheses mentioned above and to decipher the underlying regulatory mechanisms. The physiological connections between ER, mitochondria and chloroplasts may also be facilitated by direct membrane contact sites [77].

5. Conclusions

This study finally clarifies the subcellular localization of Trx h2, providing direct biochemical evidence that Trx h2 proteins are associated to microsomes rather than to mitochondria, documenting a different localization in comparison to Trx o1. The different subcellular localization of both proteins is associated with different redox-active functions, with Trx o1, but not Trx h2, being important for maintaining the AsA and GSH redox states and plant growth in non-stressed conditions. In contrast to this, there might be a cooperative role of both Trxs o1 and h2 in regulating NADPH redox balance and photosynthetic performance in fluctuating light environments. This suggests a possible physiological interaction of both proteins between ER/Golgi and mitochondria, which extends to photosynthetic acclimation in the chloroplast.

Supplementary Materials

The following are available online at https://0-www-mdpi-com.brum.beds.ac.uk/article/10.3390/antiox10050705/s1, Figure S1: Molecular characterization of Trx h2 knock-out mutant (trxh2) and over expression line (Trx h2ox). Figure S2: The quantum yield of photosystem II (Y(II)) in the wild type (Col-0) and the mutant lines (trxh2, trxo1 and trxo1h2) in medium light. Table S1: Fold changes in metabolite profiles in Arabidopsis leaves of the wild type (Col-0) and thioredoxin mutant lines (trxh2, trxo1 and trxo1h2) grown in non-stressed medium-light conditions. Table S2: Fold changes in metabolite profiles in Arabidopsis leaves of the wild type (Col-0) and thioredoxin mutant lines (trxh2, trxo1 and trxo1h2) grown in fluctuating light conditions. Table S3: Prediction of conserved cysteine in enzymes of AsA-GSH cycle.

Author Contributions

P.G. conceived the project; L.-Y.H. and P.G. designed the research; L.-Y.H. performed most of the experiments; M.L. performed GC-MS measurements; L.-Y.H. and P.G. analyzed the data; P.G. supervised the experiments; L.-Y.H. and P.G. wrote the article. All authors have read and agreed to the published version of the manuscript.

Funding

This work was supported by the Deutsche Forschungsgemeinschaft (TRR 175, B02).

Institutional Review Board Statement

Not applicable.

Informed Consent Statement

Not applicable.

Data Availability Statement

Data is contained within the article or Supplementary Materials.

Acknowledgments

We thank Dario Leister (LMU Munich) for providing PAM facilities, Anne Bierling (LMU Munich) for the help in generating the double knock out mutant, and Stefan Timm (Uni. Rostock) for providing valuable comments on the manuscript. We are also grateful to all green house staff in LMU Munich Biocenter for taking care of Arabidopsis plants.

Conflicts of Interest

The authors declare that they have no competing interests with others.

Material Distribution Statement

The author responsible for distribution of materials integral to the findings presented in this article in accordance with the policy described in the Instructions for Authors is: Peter Geigenberger ([email protected]).

References

  1. Allahverdiyeva, Y.; Suorsa, M.; Tikkanen, M.; Aro, E.M. Photoprotection of photosystems in fluctuating light intensities. J. Exp. Bot. 2015, 66, 2427–2436. [Google Scholar] [CrossRef]
  2. Armbruster, U.; Carrillo, L.R.; Venema, K.; Pavlovic, L.; Schmidtmann, E.; Kornfeld, A.; Jahns, P.; Berry, J.A.; Kramer, D.M.; Jonikas, M.C. Ion antiport accelerates photosynthetic acclimation in fluctuating light environments. Nat. Commun. 2014, 5, 5439. [Google Scholar] [CrossRef] [PubMed] [Green Version]
  3. Foyer, C.H.; Noctor, G. Ascorbate and glutathione: The heart of the redox hub. Plant Physiol. 2011, 155, 2–18. [Google Scholar] [CrossRef] [Green Version]
  4. Geigenberger, P.; Fernie, A.R. Metabolic control of redox and redox control of metabolism in plants. Antioxid. Redox Signal. 2014, 21, 1389–1421. [Google Scholar] [CrossRef] [Green Version]
  5. Hasanuzzaman, M.; Borhannuddin Bhuyan, M.H.M.; Anee, T.I.; Parvin, K.; Nahar, K.; Al Mahmud, J.; Fujita, M. Regulation of ascorbate-glutathione pathway in mitigating oxidative damage in plants under abiotic stress. Antioxidants 2019, 8, 384. [Google Scholar] [CrossRef] [Green Version]
  6. Noctor, G.; Mhamdi, A.; Chaouch, S.; Han, Y.; Neukermans, J.; Marquez-Garcia, B.; Queval, G.; Foyer, C.H. Glutathione in plants: An integrated overview. Plant Cell Environ. 2012, 35, 454–484. [Google Scholar] [CrossRef] [PubMed]
  7. Smirnoff, N.; Wheeler, G.L. Ascorbic acid in plants: Biosynthesis and function. Crit. Rev. Biochem. Mol. Biol. 2000, 35, 291–314. [Google Scholar] [CrossRef] [PubMed]
  8. Anjum, N.A.; Umar, S.; Chan, M.T. Ascorbate-Glutathione Pathway and Stress Tolerance in Plants; Anjum, N.A., Chan, M.-T., Umar, S., Eds.; Springer: Dordrecht, The Netherlands, 2010; ISBN 978-90-481-9403-2. [Google Scholar]
  9. Reichheld, J.-P.; Khafif, M.; Riondet, C.; Droux, M.; Bonnard, G.; Meyer, Y. Inactivation of thioredoxin reductases reveals a complex interplay between thioredoxin and glutathione pathways in Arabidopsis development. Plant Cell 2007, 19, 1851–1865. [Google Scholar] [CrossRef] [PubMed] [Green Version]
  10. Michelet, L.; Zaffagnini, M.; Marchand, C.; Collin, V.; Decottignies, P.; Tsan, P.; Lancelin, J.M.; Trost, P.; Miginiac-Maslow, M.; Noctor, G.; et al. Glutathionylation of chloroplast thioredoxin f is a redox signaling mechanism in plants. Proc. Natl. Acad. Sci. USA 2005, 102, 16478–16483. [Google Scholar] [CrossRef] [PubMed] [Green Version]
  11. Zaffagnini, M.; Michelet, L.; Marchand, C.; Sparla, F.; Decottignies, P.; Le Maréchal, P.; Miginiac-Maslow, M.; Noctor, G.; Trost, P.; Lemaire, S.D. The thioredoxin-independent isoform of chloroplastic glyceraldehyde-3- phosphate dehydrogenase is selectively regulated by glutathionylation. FEBS J. 2007, 274, 212–226. [Google Scholar] [CrossRef]
  12. Bashandy, T.; Guilleminot, J.; Vernoux, T.; Caparros-Ruiz, D.; Ljung, K.; Meyer, Y.; Reichheld, J.P. Interplay between the NADP-linked thioredoxin and glutathione systems in Arabidopsis auxin signaling. Plant Cell 2010, 22, 376–391. [Google Scholar] [CrossRef] [Green Version]
  13. Gelhaye, E.; Navrot, N.; Macdonald, I.K.; Rouhier, N.; Raven, E.L.; Jacquot, J.P. Ascorbate peroxidase-thioredoxin interaction. Photosynth. Res. 2006, 89, 193–200. [Google Scholar] [CrossRef]
  14. Vanacker, H.; Guichard, M.; Bohrer, A.-S.; Issakidis-Bourguet, E. Redox regulation of monodehydroascorbate reductase by thioredoxin y in plastids revealed in the context of water stress. Antioxidants 2018, 7, 183. [Google Scholar] [CrossRef] [Green Version]
  15. Meyer, Y.; Reichheld, J.P.; Vignols, F. Thioredoxins in Arabidopsis and other plants. Photosynth. Res. 2005, 86, 419–433. [Google Scholar] [CrossRef] [PubMed]
  16. Meyer, Y.; Siala, W.; Bashandy, T.; Riondet, C.; Vignols, F.; Reichheld, J.P. Glutaredoxins and thioredoxins in plants. Biochim. Biophys. Acta Mol. Cell Res. 2008, 1783, 589–600. [Google Scholar] [CrossRef] [PubMed]
  17. Thormählen, I.; Ruber, J.; Von Roepenack-Lahaye, E.; Ehrlich, S.M.; Massot, V.; Hümmer, C.; Tezycka, J.; Issakidis-Bourguet, E.; Geigenberger, P. Inactivation of thioredoxin f1 leads to decreased light activation of ADP-glucose pyrophosphorylase and altered diurnal starch turnover in leaves of Arabidopsis plants. Plant Cell Environ. 2013, 36, 16–29. [Google Scholar] [CrossRef] [PubMed]
  18. Yoshida, K.; Hara, S.; Hisabori, T. Thioredoxin selectivity for thiol-based redox regulation of target proteins in chloroplasts. J. Biol. Chem. 2015, 290, 14278–14288. [Google Scholar] [CrossRef] [PubMed] [Green Version]
  19. Thormählen, I.; Zupok, A.; Rescher, J.; Leger, J.; Weissenberger, S.; Groysman, J.; Orwat, A.; Chatel-Innocenti, G.; Issakidis-Bourguet, E.; Armbruster, U.; et al. Thioredoxins play a crucial role in dynamic acclimation of photosynthesis in fluctuating light. Mol. Plant 2017, 10, 168–182. [Google Scholar] [CrossRef] [PubMed] [Green Version]
  20. Okegawa, Y.; Motohashi, K. Chloroplastic thioredoxin m functions as a major regulator of Calvin cycle enzymes during photosynthesis in vivo. Plant J. 2015, 84, 900–913. [Google Scholar] [CrossRef] [PubMed]
  21. Benitez-Alfonso, Y.; Cilia, M.; San Roman, A.; Thomas, C.; Maule, A.; Hearn, S.; Jackson, D. Control of Arabidopsis meristem development by thioredoxin-dependent regulation of intercellular transport. Proc. Natl. Acad. Sci. USA 2009, 106, 3615–3620. [Google Scholar] [CrossRef] [Green Version]
  22. Courteille, A.; Vesa, S.; Sanz-Barrio, R.; Cazalé, A.C.; Becuwe-Linka, N.; Farran, I.; Havaux, M.; Rey, P.; Rumeau, D. Thioredoxin m4 controls photosynthetic alternative electron pathways in Arabidopsis. Plant Physiol. 2013, 161, 508–520. [Google Scholar] [CrossRef] [Green Version]
  23. Collin, V.; Lamkemeyer, P.; Miginiac-Maslow, M.; Hirasawa, M.; Knaff, D.B.; Dietz, K.J.; Issakidis-Bourguet, E. Characterization of plastidial thioredoxins from arabidopsis belonging to the new y-type. Plant Physiol. 2004, 136, 4088–4095. [Google Scholar] [CrossRef] [Green Version]
  24. Lamkemeyer, P.; Laxa, M.; Collin, V.; Li, W.; Finkemeier, I.; Schöttler, M.A.; Holtkamp, V.; Tognetti, V.B.; Issakidis-Bourguet, E.; Kandlbinder, A.; et al. Peroxiredoxin Q of Arabidopsis thaliana is attached to the thylakoids and functions in context of photosynthesis. Plant J. 2006, 45, 968–981. [Google Scholar] [CrossRef]
  25. Navrot, N.; Collin, V.; Gualberto, J.; Gelhaye, E.; Hirasawa, M.; Rey, P.; Knaff, D.B.; Issakidis, E.; Jacquot, J.P.; Rouhier, N. Plant glutathione peroxidases are functional peroxiredoxins distributed in several subcellular compartments and regulated during biotic and abiotic stresses. Plant Physiol. 2006, 142, 1364–1379. [Google Scholar] [CrossRef] [PubMed] [Green Version]
  26. Bohrer, A.S.; Massot, V.; Innocenti, G.; Reichheld, J.P.; Issakidis-Bourguet, E.; Vanacker, H. New insights into the reduction systems of plastidial thioredoxins point out the unique properties of thioredoxin z from Arabidopsis. J. Exp. Bot. 2012, 63, 6315–6323. [Google Scholar] [CrossRef] [Green Version]
  27. Arsova, B.; Hoja, U.; Wimmelbacher, M.; Greiner, E.; Ustün, S.; Melzer, M.; Petersen, K.; Lein, W.; Börnke, F. Plastidial thioredoxin z interacts with two fructokinase-like proteins in a thiol-dependent manner: Evidence for an essential role in chloroplast development in Arabidopsis and Nicotiana benthamiana. Plant Cell 2010, 22, 1498–1515. [Google Scholar] [CrossRef] [Green Version]
  28. Laloi, C.; Rayapuram, N.; Chartier, Y.; Grienenberger, J.M.; Bonnard, G.; Meyer, Y. Identification and characterization of a mitochondrial thioredoxin system in plants. Proc. Natl. Acad. Sci. USA 2001, 98, 14144–14149. [Google Scholar] [CrossRef] [Green Version]
  29. Martí, M.C.; Olmos, E.; Calvete, J.J.; Díaz, I.; Barranco-Medina, S.; Whelan, J.; Lázaro, J.J.; Sevilla, F.; Jiménez, A. Mitochondrial and nuclear localization of a novel pea thioredoxin: Identification of its mitochondrial target proteins. Plant Physiol. 2009, 150, 646–657. [Google Scholar] [CrossRef] [Green Version]
  30. Ortiz-Espín, A.; Iglesias-Fernández, R.; Calderón, A.; Carbonero, P.; Sevilla, F.; Jiménez, A. Mitochondrial AtTrxo1 is transcriptionally regulated by AtbZIP9 and AtAZF2 and affects seed germination under saline conditions. J. Exp. Bot. 2017, 68, 1025–1038. [Google Scholar] [CrossRef]
  31. Calderón, A.; Sánchez-Guerrero, A.; Ortiz-Espín, A.; Martínez-Alcalá, I.; Camejo, D.; Jiménez, A.; Sevilla, F. Lack of mitochondrial thioredoxin o1 is compensated by antioxidant components under salinity in Arabidopsis thaliana plants. Physiol. Plant 2018, 164, 251–267. [Google Scholar] [CrossRef]
  32. Calderón, A.; Ortiz-Espín, A.; Iglesias-Fernández, R.; Carbonero, P.; Pallardó, F.V.; Sevilla, F.; Jiménez, A. Thioredoxin (Trx o 1) interacts with proliferating cell nuclear antigen (PCNA) and its overexpression affects the growth of tobacco cell culture. Redox Biol. 2017, 11, 688–700. [Google Scholar] [CrossRef] [PubMed]
  33. Daloso, D.M.; Müller, K.; Obata, T.; Florian, A.; Tohge, T.; Bottcher, A.; Riondet, C.; Bariat, L.; Carrari, F.; Nunes-Nesi, A.; et al. Thioredoxin, a master regulator of the tricarboxylic acid cycle in plant mitochondria. Proc. Natl. Acad. Sci. USA 2015, 112, 1392–1400. [Google Scholar] [CrossRef] [PubMed] [Green Version]
  34. Florez-Sarasa, I.; Obata, T.; Del-Saz, N.F.; Reichheld, J.-P.; Meyer, E.H.; Rodriguez-Concepcion, M.; Ribas-Carbo, M.; Fernie, A.R. The lack of mitochondrial thioredoxin TRXo1 affects in vivo alternative oxidase activity and carbon metabolism under different light conditions. Plant Cell Physiol. 2019, 60, 2369–2381. [Google Scholar] [CrossRef] [PubMed]
  35. Schwarzländer, M.; Fuchs, P. Keeping mitochondrial alternative oxidase reduced and active in vivo does not require thioredoxin o1. Plant Cell Physiol. 2019, 1, 2357–2359. [Google Scholar] [CrossRef]
  36. Reinholdt, O.; Schwab, S.; Zhang, Y.; Reichheld, J.-P.; Fernie, A.R.; Hagemann, M.; Timm, S. Redox-regulation of photorespiration through mitochondrial thioredoxin o1. Plant Physiol. 2019, 181, 442–457. [Google Scholar] [CrossRef] [Green Version]
  37. Meng, L.; Wong, J.H.; Feldman, L.J.; Lemaux, P.G.; Buchanan, B.B. A membrane-associated thioredoxin required for plant growth moves from cell to cell, suggestive of a role in intercellular communication. Proc. Natl. Acad. Sci. USA 2010, 107, 3900–3905. [Google Scholar] [CrossRef] [PubMed] [Green Version]
  38. Traverso, J.A.; Micalella, C.; Martinez, A.; Brown, S.C.; Satiat-Jeunemaître, B.; Meinnel, T.; Giglione, C. Roles of N-terminal fatty acid acylations in membrane compartment partitioning: Arabidopsis h-type thioredoxins as a case study. Plant Cell 2013, 25, 1056–1077. [Google Scholar] [CrossRef] [Green Version]
  39. Meyer, Y.; Vignols, F.; Reichheld, J.P. Classification of plant thioredoxins by sequence similarity and intron position. Methods Enzymol. 2002, 347, 394–402. [Google Scholar] [CrossRef]
  40. Marx, C.; Wong, J.H.; Buchanan, B.B. Thioredoxin and germinating barley: Targets and protein redox changes. Planta 2003, 216, 454–460. [Google Scholar] [CrossRef]
  41. Serrato, A.J.; Cejudo, F.J. Type-h thioredoxins accumulate in the nucleus of developing wheat seed tissues suffering oxidative stress. Planta 2003, 217, 392–399. [Google Scholar] [CrossRef]
  42. Bower, M.S.; Matias, D.D.; Fernandes-Carvalho, E.; Mazzurco, M.; Gu, T.; Rothstein, S.J.; Goring, D.R. Two members of the thioredoxin-h family interact with the kinase domain of a Brassica S locus receptor kinase. Plant Cell 1996, 8, 1641–1650. [Google Scholar] [CrossRef] [Green Version]
  43. Cabrillac, D.; Cock, J.M.; Dumas, C.; Gaude, T. The S-locus receptor kinase is inhibited by thioredoxins and activated by pollen coat proteins. Nature 2001, 410, 220–223. [Google Scholar] [CrossRef]
  44. Park, S.K.; Jung, Y.J.; Lee, J.R.; Lee, Y.M.; Jang, H.H.; Lee, S.S.; Park, J.H.; Kim, S.Y.; Moon, J.C.; Lee, S.Y.; et al. Heat-shock and redox-dependent functional switching of an h-type Arabidopsis thioredoxin from a disulfide reductase to a molecular chaperone. Plant Physiol. 2009, 150, 552–561. [Google Scholar] [CrossRef] [Green Version]
  45. Laloi, C.; Mestres-Ortega, D.; Marco, Y.; Meyer, Y.; Reichheld, J.P. The Arabidopsis cytosolic thioredoxin h5 gene induction by oxidative stress and its W-box-mediated response to pathogen elicitor. Plant Physiol. 2004, 134, 1006–1016. [Google Scholar] [CrossRef] [Green Version]
  46. Reichheld, J.P.; Mestres-Ortega, D.; Laloi, C.; Meyer, Y. The multigenic family of thioredoxin h in Arabidopsis thaliana: Specific expression and stress response. Plant Physiol. Biochem. 2002, 40, 685–690. [Google Scholar] [CrossRef]
  47. Da Fonseca-Pereira, P.; Souza, P.V.L.; Hou, L.-Y.; Schwab, S.; Geigenberger, P.; Nunes-Nesi, A.; Timm, S.; Fernie, A.R.; Thormählen, I.; Araújo, W.L.; et al. Thioredoxin h2 contributes to the redox regulation of mitochondrial photorespiratory metabolism. Plant Cell Environ. 2020, 43, 188–208. [Google Scholar] [CrossRef]
  48. Clough, S.J.; Bent, A.F. Floral dip: A simplified method for Agrobacterium-mediated transformation of Arabidopsis thaliana. Plant J. 1998, 16, 735–743. [Google Scholar] [CrossRef] [Green Version]
  49. LaMontagne, E.D.; Collins, C.A.; Peck, S.C.; Heese, A. Isolation of microsomal membrane proteins from Arabidopsis thaliana. Curr. Protoc. Plant Biol. 2016, 1, 217–234. [Google Scholar] [CrossRef]
  50. Sweetlove, L.J.; Taylor, N.L.; Leaver, C.J. Isolation of intact, functional mitochondria from the model plant Arabidopsis thaliana. Methods Mol. Biol. 2007, 372, 125–136. [Google Scholar] [CrossRef]
  51. Laemmli, U.K. Cleavage of structural proteins during the assembly of the head of bacteriophage T4. Nature 1970, 227, 680–685. [Google Scholar] [CrossRef]
  52. Winer, J.; Jung, C.K.S.; Shackel, I.; Williams, P.M. Development and validation of real-time quantitative reverse transcriptase-polymerase chain reaction for monitoring gene expression in cardiac myocytes in vitro. Anal. Biochem. 1999, 270, 41–49. [Google Scholar] [CrossRef] [PubMed]
  53. Schmittgen, T.D.; Zakrajsek, B.A.; Mills, A.G.; Gorn, V.; Singer, M.J.; Reed, M.W. Quantitative reverse transcription-polymerase chain reaction to study mRNA decay: Comparison of endpoint and real-time methods. Anal. Biochem. 2000, 285, 194–204. [Google Scholar] [CrossRef]
  54. Roessner, U.; Luedemann, A.; Brust, D.; Fiehn, O.; Linke, T.; Willmitzer, L.; Fernie, A.R. Metabolic profiling allows comprehensive phenotyping of genetically or environmentally modified plant systems. Plant Cell 2001, 13, 11–29. [Google Scholar] [CrossRef] [PubMed] [Green Version]
  55. Lisec, J.; Schauer, N.; Kopka, J.; Willmitzer, L.; Fernie, A.R. Gas chromatography mass spectrometry-based metabolite profiling in plants. Nat. Protoc. 2006, 1, 387–396. [Google Scholar] [CrossRef]
  56. Erban, A.; Schauer, N.; Fernie, A.R.; Kopka, J. Nonsupervised construction and application of mass spectral and retention time index libraries from time-of-flight gas chromatography-mass spectrometry metabolite profiles. Metab. Methods Mol. Biol. 2007, 358, 19–38. [Google Scholar] [CrossRef]
  57. Hou, L.Y.; Ehrlich, M.; Thormählen, I.; Lehmann, M.; Krahnert, I.; Obata, T.; Cejudo, F.J.; Fernie, A.R.; Geigenberger, P. NTRC plays a crucial role in starch metabolism, redox balance, and tomato fruit growth. Plant Physiol. 2019, 181, 976–992. [Google Scholar] [CrossRef] [Green Version]
  58. Luedemann, A.; Strassburg, K.; Erban, A.; Kopka, J. TagFinder for the quantitative analysis of gas chromatography—Mass spectrometry (GC-MS)-based metabolite profiling experiments. Bioinformatics 2008, 24, 732–737. [Google Scholar] [CrossRef]
  59. Queval, G.; Noctor, G. A plate reader method for the measurement of NAD, NADP, glutathione, and ascorbate in tissue extracts: Application to redox profiling during Arabidopsis rosette development. Anal. Biochem. 2007, 363, 58–69. [Google Scholar] [CrossRef]
  60. Lintala, M.; Schuck, N.; Thormählen, I.; Jungfer, A.; Weber, K.L.; Weber, A.P.M.; Geigenberger, P.; Soll, J.; Bölter, B.; Mulo, P. Arabidopsis tic62 trol mutant lacking thylakoid-bound ferredoxin-NADP+ oxidoredutase shows distinct metabolic phenotype. Mol. Plant 2014, 7, 45–57. [Google Scholar] [CrossRef] [PubMed] [Green Version]
  61. Hashida, S.N.; Kawai-Yamada, M. Inter-organelle NAD metabolism underpinning light responsive NADP dynamics in plants. Front. Plant Sci. 2019, 10. [Google Scholar] [CrossRef] [Green Version]
  62. Gelhaye, E.; Rouhier, N.; Gérard, J.; Jolivet, Y.; Gualberto, J.; Navrot, N.; Ohlsson, P.-I.; Wingsle, G.; Hirasawa, M.; Knaff, D.B.; et al. A specific form of thioredoxin h occurs in plant mitochondria and regulates the alternative oxidase. Proc. Natl. Acad. Sci. USA 2004, 101, 14545–14550. [Google Scholar] [CrossRef] [Green Version]
  63. Lee, C.P.; Taylor, N.L.; Harvey Millar, A. Recent advances in the composition and heterogeneity of the Arabidopsis mitochondrial proteome. Front. Plant Sci. 2013, 4, 1–8. [Google Scholar] [CrossRef] [PubMed] [Green Version]
  64. Jiménez, A.; Hernández, J.A.; Del Río, L.A.; Sevilla, F. Evidence for the presence of the ascorbate-glutathione cycle in mitochondria and peroxisomes of pea leaves. Plant Physiol. 1997, 114, 275–284. [Google Scholar] [CrossRef] [PubMed] [Green Version]
  65. Marchand, C.; Le Maréchal, P.; Meyer, Y.; Miginiac-Maslow, M.; Issakidis-Bourguet, E.; Decottignies, P. New targets of Arabidopsis thioredoxins revealed by proteomic analysis. Proteomics 2004, 4, 2696–2706. [Google Scholar] [CrossRef] [PubMed]
  66. Yamazaki, D.; Motohashi, K.; Kasama, T.; Hara, Y.; Hisabori, T. Target proteins of the cytosolic thioredoxins in Arabidopsis thaliana. Plant Cell Physiol. 2004, 45, 18–27. [Google Scholar] [CrossRef] [PubMed] [Green Version]
  67. Wong, J.H.; Balmer, Y.; Cai, N.; Tanaka, C.K.; Vensel, W.H.; Hurkman, W.J.; Buchanan, B.B. Unraveling thioredoxin-linked metabolic processes of cereal starchy endosperm using proteomics. FEBS Lett. 2003, 547, 151–156. [Google Scholar] [CrossRef] [Green Version]
  68. Balmer, Y.; Vensel, W.H.; Tanaka, C.K.; Hurkman, W.J.; Gelhaye, E.; Rouhier, N.; Jacquot, J.-P.; Manieri, W.; Schurmann, P.; Droux, M.; et al. Thioredoxin links redox to the regulation of fundamental processes of plant mitochondria. Proc. Natl. Acad. Sci. USA 2004, 101, 2642–2647. [Google Scholar] [CrossRef] [Green Version]
  69. Yoshida, K.; Noguchi, K.; Motohashi, K.; Hisabori, T. Systematic exploration of thioredoxin target proteins in plant mitochondria. Plant Cell Physiol. 2013, 54, 875–892. [Google Scholar] [CrossRef] [PubMed] [Green Version]
  70. Fait, A.; Fromm, H.; Walter, D.; Galili, G.; Fernie, A.R. Highway or byway: The metabolic role of the GABA shunt in plants. Trends Plant Sci. 2008, 13, 14–19. [Google Scholar] [CrossRef] [PubMed]
  71. Shelp, B.J.; Bozzo, G.G.; Trobacher, C.P.; Zarei, A.; Deyman, K.L.; Brikis, C.J. Hypothesis/review: Contribution of putrescine to 4-aminobutyrate (GABA) production in response to abiotic stress. Plant Sci. 2012, 193–194, 130–135. [Google Scholar] [CrossRef]
  72. Michaeli, S.; Fromm, H. Closing the loop on the GABA shunt in plants: Are GABA metabolism and signaling entwined? Front. Plant Sci. 2015, 6, 419. [Google Scholar] [CrossRef] [PubMed] [Green Version]
  73. Slocum, R.D. Genes, enzymes and regulation of arginine biosynthesis in plants. Plant Physiol. Biochem. 2005, 43, 729–745. [Google Scholar] [CrossRef]
  74. Facchini, P.J. Alkaloid biosynthesis in plants: Biochemistry, cell biology, molecular regulation, and metabolic engineering applications. Annu. Rev. Plant Physiol. Plant Mol. Biol. 2001, 52, 29–66. [Google Scholar] [CrossRef] [Green Version]
  75. Slocum, R.D.; Kaur-Sawhney, R.; Galston, A.W. The physiology and biochemistry of polyamines in plants. Arch. Biochem. Biophys. 1984, 235, 283–303. [Google Scholar] [CrossRef]
  76. Hoffmann, C.; Plocharski, B.; Haferkamp, I.; Leroch, M.; Ewald, R.; Bauwe, H.; Riemer, J.; Herrmann, J.M.; Ekkehard Neuhaus, H. From endoplasmic reticulum to mitochondria: Absence of the Arabidopsis ATP antiporter endoplasmic reticulum adenylate transporter1 perturbs photorespiration. Plant Cell 2013, 25, 2647–2660. [Google Scholar] [CrossRef] [Green Version]
  77. Li, T.; Xiao, Z.; Li, H.; Liu, C.; Shen, W.; Gao, C. A Combinatorial reporter set to visualize the membrane contact sites between endoplasmic reticulum and other organelles in plant cell. Front. Plant Sci. 2020, 11, 1280. [Google Scholar] [CrossRef]
  78. Morales, A.; Kaiser, E. Photosynthetic acclimation to fluctuating irradiance in plants. Front. Plant Sci. 2020, 11, 268. [Google Scholar] [CrossRef] [PubMed]
  79. Selinski, J.; Scheibe, R. Malate valves: Old shuttles with new perspectives. Plant Biol. 2019, 21, 21–30. [Google Scholar] [CrossRef] [Green Version]
  80. Huang, J.; Niazi, A.K.; Young, D.; Rosado, L.A.; Vertommen, D.; Bodra, N.; Abdelgawwad, M.R.; Vignols, F.; Wei, B.; Wahni, K.; et al. Self-protection of cytosolic malate dehydrogenase against oxidative stress in Arabidopsis. J. Exp. Bot. 2018, 69, 3491–3505. [Google Scholar] [CrossRef] [PubMed]
  81. Huang, W.; Zhang, S.-B.; Hu, H. Sun leaves up-regulate the photorespiratory pathway to maintain a high rate of CO2 assimilation in tobacco. Front. Plant Sci. 2014, 5. [Google Scholar] [CrossRef] [Green Version]
  82. Ye, Z.P.; Liu, Y.G.; Kang, H.J.; Duan, H.L.; Chen, X.M.; Zhou, S.X. Comparing two measures of leaf photorespiration rate across a wide range of light intensities. J. Plant Physiol. 2019, 240, 153002. [Google Scholar] [CrossRef] [PubMed]
  83. Niedermaier, S.; Schneider, T.; Bahl, M.O.; Matsubara, S.; Huesgen, P.F. Photoprotective Acclimation of the Arabidopsis thaliana Leaf Proteome to Fluctuating Light. Front. Genet. 2020, 11, 154. [Google Scholar] [CrossRef] [PubMed]
  84. Timm, S.; Florian, A.; Arrivault, S.; Stitt, M.; Fernie, A.R.; Bauwe, H. Glycine decarboxylase controls photosynthesis and plant growth. FEBS Lett. 2012, 586, 3692–3697. [Google Scholar] [CrossRef] [PubMed] [Green Version]
  85. Timm, S.; Wittmiß, M.; Gamlien, S.; Ewald, R.; Florian, A.; Frank, M.; Wirtz, M.; Hell, R.; Fernie, A.R.; Bauwe, H. Mitochondrial dihydrolipoyl dehydrogenase activity shapes photosynthesis and photorespiration of Arabidopsis thaliana. Plant Cell 2015, 27, 1968–1984. [Google Scholar] [CrossRef] [Green Version]
  86. Bourguignon, J.; Neuburger, M.; Douce, R. Resolution and characterization of the glycine-cleavage reaction in pea leaf mitochondria. Properties of the forward reaction catalysed by glycine decarboxylase and serine hydroxymethyltransferase. Biochem. J. 1988, 255, 169–178. [Google Scholar] [CrossRef] [Green Version]
Figure 1. The enrichment of the Trx h2 protein in different subcellular fractions. The wild-type plants (Col-0) (A) and overexpression line (Trx h2ox) (B) were grown under medium light condition for two weeks and harvested for sample preparation and cell fractionation. The detection of the TRXH2 protein and other subcellular protein markers was performed via immunoblot analysis. Recombinant Trx h2 protein (rTRXh2) served as positive control; calnexin (CNX) served as microsomal marker; alternative oxidase (AOX) served as mitochondrial marker; cytosolic fructose-1,6-bisphosphatase (cyt-FBPase) served as cytosolic marker. In the lane labeled “Marker,” marker proteins from the protein ladder were loaded. The numbers next to each blot indicate the molecular weight (kDa) of protein markers.
Antioxidants 10 00705 g001
Figure 2. Molecular characterization of trxh2, trxo1 and trxo1h2. (A) The scheme of T-DNA insertion sites in trxh2 and trxo1 mutants. (B) The transcript levels of Trx h2 and Trx o1 in mutant lines compared to the wild type (Col-0). Mean values and standard errors derived from 6 biological replicates. The statistical analyses were performed using ANOVA and the Dunnett’s test (* p < 0.05, in comparison to the wild type).
Antioxidants 10 00705 g002
Figure 3. Growth phenotype of the wild type (Col-0) and mutant lines (trxh2, trxo1 and trxo1h2) grown under medium (ML) or fluctuating (FL) light conditions. (A) Visible phenotype of rosette leaves. (B) The box plot of leaf size. Mean values derived from 10–14 plants. The statistical analyses were performed by using ANOVA and the Dunnett’s test (* p < 0.05, in comparison to the wild type). Scale bar = 2 cm.
Antioxidants 10 00705 g003
Figure 4. The principal component analysis on metabolite profile of the wild type (Col-0) and the mutant lines (trxh2, trxo1 and trxo1h2). Arabidopsis plants grown under medium light conditions were harvested at the end of the night (A) and the end of the day (B), respectively. Arabidopsis grown under fluctuating light conditions were harvested at the high-light phase (C) and low-light phase (D), respectively. The samples were used for metabolite profiling via GC-TOF-MS, and the results were used for principal component analysis by using R software. Dim 1: 1st principal component; Dim 2: 2nd principal component.
Antioxidants 10 00705 g004
Figure 5. Metabolite profile of the wild type (Col-0) and the mutant lines (trxh2, trxo1 and trxo1h2). Arabidopsis plants grown under medium light conditions (AC) were harvested at the end of the night (EN) and the end of the day (ED), respectively. Arabidopsis grown under fluctuating light conditions (DF) were harvested at the high-light phase (HL) and low-light phase (LL), respectively. The samples were used for metabolite profiling via GC-TOF-MS. (A,D), Sugars and sugar alcohols. (B,E), Amino acids. (C,F), Organic acids and TCA cycle intermediates. Results are normalized to Col-0 with log2 transformation and visualized as a heatmap with hierarchical clustering done by R software. Data are taken from Tables S1 and S2.
Antioxidants 10 00705 g005
Figure 6. The redox couples of ascorbate (AsA) and glutathione (GSH) in the wild type (Col-0) and the mutant lines (trxh2, trxo1 and trxo1h2). Arabidopsis plants grown under medium light conditions were harvested at the end of the night (EN) and the end of the day (ED), respectively. Arabidopsis grown under fluctuating light condition were harvested at the high-light phases (HL) and low-light phases (LL), respectively. (A) The level of ascorbate. (B) The level of dehydroascorbate (DHA). (C) The level of total AsA. (D) The reduction state of AsA. (E) The level of reduced GSH. (F) The level of oxidized glutathione (GSSG). (G) The level of total GSH. (H) The reduction state of GSH. Mean values and standard errors derived from 6 biological replicates. The statistical analyses were performed using ANOVA and the Dunnett’s test (* p < 0.05, in comparison to the wild type).
Antioxidants 10 00705 g006
Figure 7. The redox couples of NADP(H) and NAD(H) in the wild type (Col-0) and the mutant lines (trxh2, trxo1 and trxo1h2). Arabidopsis plants grown under medium light conditions were harvested at the end of the night (EN) and the end of the day (ED), respectively. Arabidopsis grown under fluctuating light conditions were harvested at the high-light phases (HL) and low-light phases (LL), respectively. (A) The level of NADPH. (B) The level of NADP+. (C) The NADPH-to-NADP+ ratio. (D) The level of NADH. (E) The level of NAD+. (F) The NADH-to-NAD+ ratio. Mean values and standard errors derived from 6 biological replicates. The statistical analyses were performed using ANOVA and the Dunnett’s test (* p < 0.05, in comparison to the wild type).
Antioxidants 10 00705 g007
Figure 8. The quantum yield of photosystem II (Y(II)) in the wild type (Col-0) and the mutant lines (trxh2, trxo1 and trxo1h2) in fluctuating light. Arabidopsis plants were grown in a fluctuating light environment for four weeks. Chlorophyll fluorescence kinetics during the alternating periods of low light (5 min) and high light (1 min) were recorded by using a PAM system, and the values were used for calculating Y(II). Mean values and standard errors derived from 6 biological replicates. The statistical analyses were performed using ANOVA and the Dunnett’s test (* p < 0.05, in comparison to the wild type).
Antioxidants 10 00705 g008
Publisher’s Note: MDPI stays neutral with regard to jurisdictional claims in published maps and institutional affiliations.

