Article

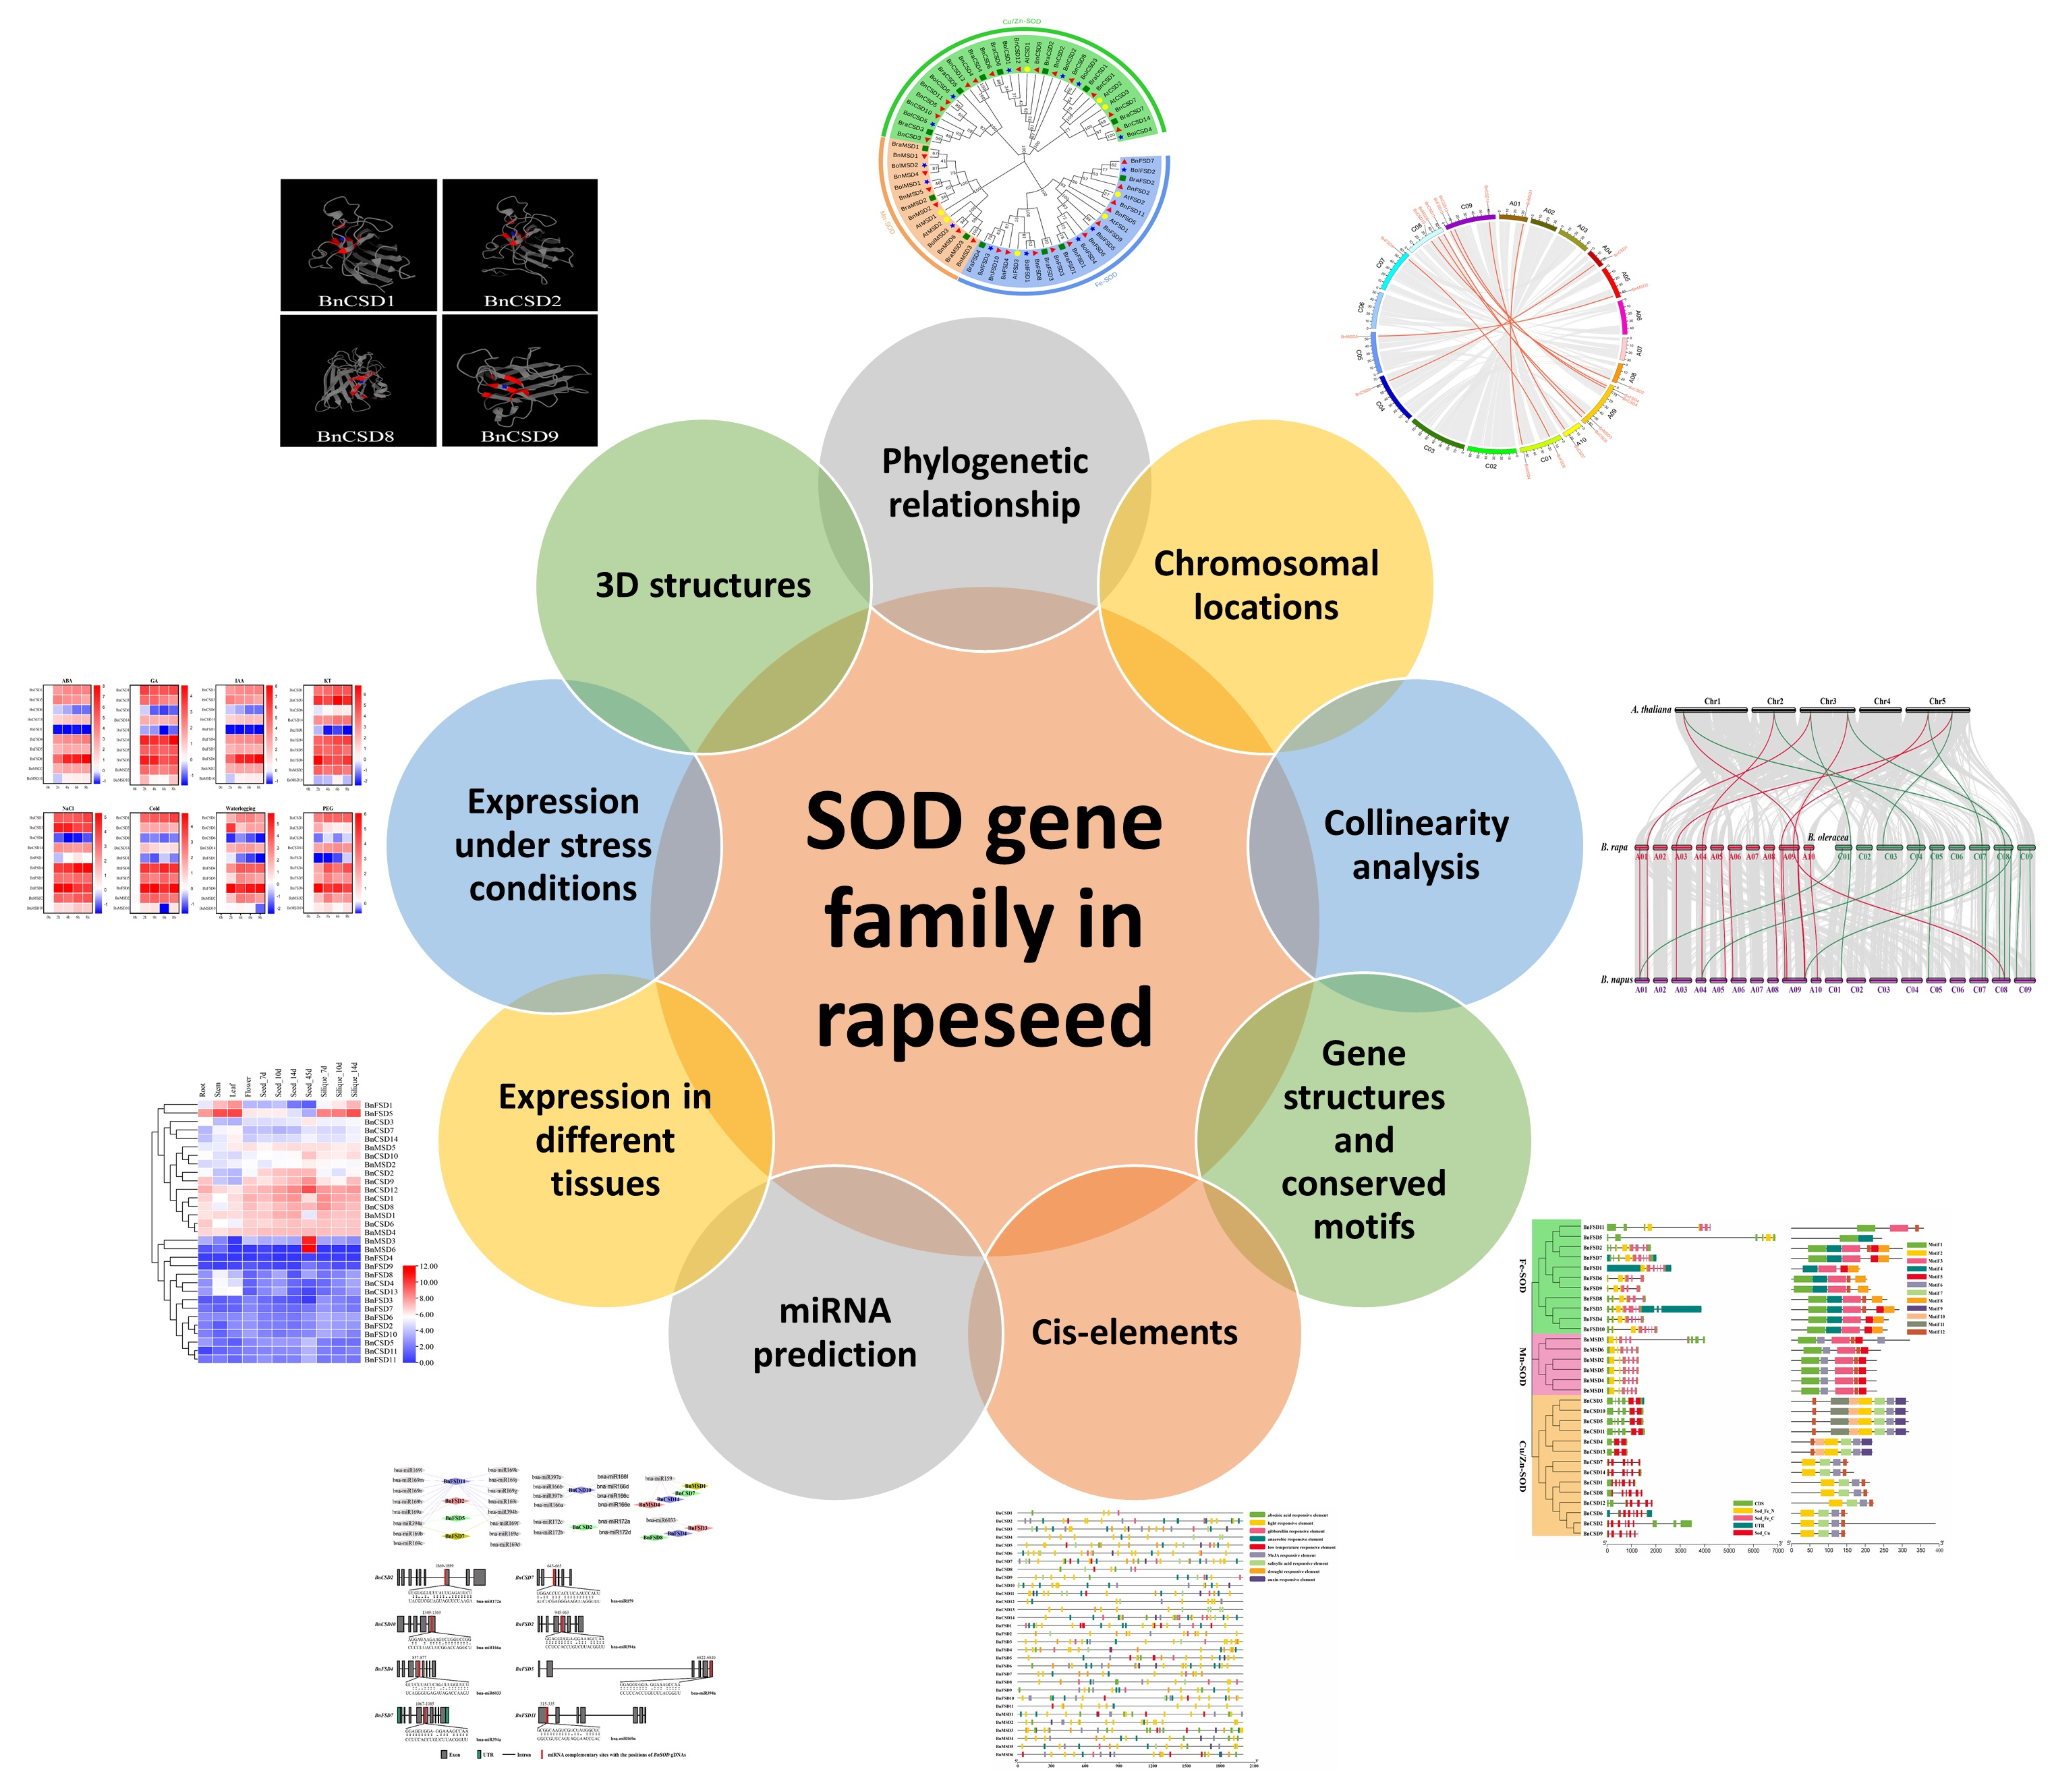
Genome-Wide Analysis and Expression Profile of Superoxide Dismutase (SOD) Gene Family in Rapeseed (Brassica napus L.) under Different Hormones and Abiotic Stress Conditions

Key Lab of Biology and Genetic Improvement of Oil Crops, Oil Crops Research Institute, Chinese Academy of Agricultural Sciences (CAAS), Wuhan 430062, China
*
Authors to whom correspondence should be addressed.
These authors equally contributed to this work.
Submission received: 8 June 2021 / Revised: 12 July 2021 / Accepted: 22 July 2021 / Published: 25 July 2021
(This article belongs to the Special Issue Approaches in Enhancing Antioxidant Defense in Plants)

Abstract

:
Superoxide dismutase (SOD) is an important enzyme that acts as the first line of protection in the plant antioxidant defense system, involved in eliminating reactive oxygen species (ROS) under harsh environmental conditions. Nevertheless, the SOD gene family was yet to be reported in rapeseed (Brassica napus L.). Thus, a genome-wide investigation was carried out to identify the rapeseed SOD genes. The present study recognized 31 BnSOD genes in the rapeseed genome, including 14 BnCSDs, 11 BnFSDs, and six BnMSDs. Phylogenetic analysis revealed that SOD genes from rapeseed and other closely related plant species were clustered into three groups based on the binding domain with high bootstrap values. The systemic analysis exposed that BnSODs experienced segmental duplications. Gene structure and motif analysis specified that most of the BnSOD genes displayed a relatively well-maintained exon–intron and motif configuration within the same group. Moreover, we identified five hormones and four stress- and several light-responsive cis-elements in the promoters of BnSODs. Thirty putative bna-miRNAs from seven families were also predicted, targeting 13 BnSODs. Gene ontology annotation outcomes confirm the BnSODs role under different stress stimuli, cellular oxidant detoxification processes, metal ion binding activities, SOD activity, and different cellular components. Twelve BnSOD genes exhibited higher expression profiles in numerous developmental tissues, i.e., root, leaf, stem, and silique. The qRT-PCR based expression profiling showed that eight genes (BnCSD1, BnCSD3, BnCSD14, BnFSD4, BnFSD5, BnFSD6, BnMSD2, and BnMSD10) were significantly up-regulated under different hormones (ABA, GA, IAA, and KT) and abiotic stress (salinity, cold, waterlogging, and drought) treatments. The predicted 3D structures discovered comparable conserved BnSOD protein structures. In short, our findings deliver a foundation for additional functional investigations on the BnSOD genes in rapeseed breeding programs.

Graphical Abstract

1. Introduction

Several environmental cues, including abiotic and biotic traumas, are considered key influences affecting the plants’ productivity [1,2]. Under stressful conditions, the plant amends its homeostatic apparatus by developing an increased reactive oxygen species (ROS) in plant cells. Usually, ROS overproduction results in several molecular and cellular damages, and ultimately programmed cell death [3,4]. ROS such as superoxide anion, hydrogen peroxide, hydroxyl radical, perhydroxyl radicals, alkoxy radicals, peroxy radicals, singlet oxygen, and organic hydroperoxide, are considered to be major signaling molecules, regulating abiotic and biotic stress responses, and also participate in plant productivity [3,4]. Mainly, ROS are formed in the apoplast, mitochondria, plasma membrane, chloroplast, peroxisomes, endoplasmic reticulum, and cell walls [3,4]. Therefore, to manage ROS noxiousness, plants have established well-organized and composite antioxidant defense systems, including numerous non-enzymatic and enzymatic antioxidants [3,4].
Among numerous antioxidant enzymes, superoxide dismutase (SOD; EC 1.15.1.1), a set of metalloenzymes, largely exists in alive organisms. SOD acts as the first line of ROS scavenging and plays a crucial role in plants’ physio-biochemical procedures to manage environmental cues [3]. Findings revealed that SOD catalyzes the superoxide radicals’ dismutation into oxygen and hydrogen peroxide via disproportionation, and protects the plant cells from oxidative injury [5,6]. According to metal cofactors, plant SODs are largely characterized into four major groups such as copper-zinc SOD (Cu/ZnSOD), iron SOD (FeSOD), manganese SOD (MnSOD), and nickel SOD (NiSOD) [7,8]. Among them, NiSOD mainly exists in Streptomyces, cyanobacteria, and marine life, and is yet to be described in plants [9]. However, FeSODs and MnSODs are primarily extant in lower plants, while Cu/ZnSODs exist in higher plants [10,11]. These SODs are widely distributed in various cell organs. For instance, Cu/ZnSODs are amply present, and mostly distributed in chloroplasts, cytoplasm, and peroxisomes [12]. FeSOD is distributed in the chloroplasts, and MnSODs are distributed in mitochondria and peroxisomes [8,13].
Recently, numerous investigations have revealed that the transcript level of the plant SODs gene responds to several environmental cues and helps plants cope with harsh environmental conditions. For instance, the increased SOD activity helps plants to show resistance to salinity and drought stress in Brassica juncea plants [14], temperature-induced oxidative damage in Acutodesmus dimorphus [15], cold-induced oxidative damage in tomato (Solanum lycopersicum) [16], etc. Moreover, the expression of the Cu/ZnSOD gene was persuaded by the copper-nanoparticle application in cucumber (Cucumis sativus) [17]. Under cold stress, trehalose application modulated the expression profile of the Cu/ZnSOD gene in tomato plants [16]. In a recent study, the overexpression of SikCuZnSOD3 enhances tolerance to cold, drought, and salinity stresses in cotton (Gossypium hirsutum) [18]. Under water deficit conditions, wheat (Triticum aestivum) plants showed a higher expression of different antioxidant encoding genes, including MnSOD [19]. Likewise, under 1-methylcyclopropene (1-MCP) supplementation, apple (Malus×domestica Borkh.) fruits showed a higher expression of Cu/ZnSODs, MnSODs, and FeSODs [20]. In short, these findings showed that improved SOD activity and higher expression of SOD-encoding genes can contribute to plant tolerance to multiple stresses.
Additionally, earlier investigations recommended that miRNA-mediated regulation of ROS-accompanying genes is crucial for plant productivity [21,22] and stress resistance [23,24,25,26]. For example, miR398 targets two Cu/ZnSOD genes in Arabidopsis thaliana [27]. In another study, 20 miRNAs are found to be targeting 14 cotton SOD genes at 33 predicted sites [28]. Moreover, ghr-miR414c, ghr-miR7267, m0081, m0166, and m0362 are found to play a vital role in cotton fiber variation and progress [29,30], and ghr-miR3 controls the transcript level of targeted genes throughout cotton somatic embryogenesis [31]. In A. thaliana, two Cu/ZnSOD genes (CSD1 and CSD2) are induced via the down-regulation of miR398, which helps plants to enhance tolerance to oxidative injury [32]. These discoveries stated that miRNAs might play active roles against environmental cues and plant development through modifying the SOD genes.
Rapeseed (Brassica napus L.) is the second imperative oilseed crop and possesses a complex genome. Several abiotic stresses significantly limit rapeseed productivity [33,34,35,36]. To date, SOD family genes have not been reported in rapeseed. Thus, in the present study, we performed a genome-wide analysis to identify SOD genes in the rapeseed genome. Additionally, their phylogenetic relationships, synteny analysis, gene structures, conserved motifs, cis-elements, miRNA predictions, functional annotations, and 3D structures have been characterized. Moreover, the expression profile in numerous tissues/organs and under numerous hormone and abiotic stress conditions have been extensively appraised, which deeply boosted our understanding of the SOD genes in rapeseed.

2. Materials and Methods

2.1. Identification and Characterization of SOD Genes in Rapeseed

According to our recent study [37], we used two methods to identify SOD genes in the B. napus genome, i.e., BLASTP (protein blast) and the Hidden Markov Model (HMM) [37]. The B. napus genome sequence was downloaded from the BnPIR database (Available online: http://cbi.hzau.edu.cn/bnapus/index.php, accessed on 1 April 2021) [38]. For BLASTP, we used eight A. thaliana SODs (AT1G08830.1/AtCSD1, AT2G28190.1/AtCSD2, AT5G18100.1/AtCSD3, AT4G25100.1/AtFSD1, AT5G51100.1/AtFSD2, AT5G23310.1/AtFSD3, AT3G10920.1/AtMSD1, and AT3G56350.1/AtMSD2) amino acid sequences as a query with an e-value set to 1e−5. The amino acid sequences of eight AtSODs were obtained from the TAIR Arabidopsis genome database (Available online: http://www.arabidopsis.org/, accessed on 1 April 2021). [39]. Further, the local HMMER 3.1 web server (Available online: http://www.hmmer.org/, accessed on 1 April 2021) [40] was used to search the SOD genes with default parameters. Then, the HMM file of the Sod_Cu (PF00080.21) and Sod_Fe_C (PF02777.19) having SOD genes were downloaded from the Pfam protein domain database (Available online: http://pfam.xfam.org/, accessed on 1 April 2021) [41]. Finally, 31 BnSOD genes were identified by combining the two methods in the rapeseed genome. Moreover, we identified SOD genes in different plant species, such as Brassica rapa, and Brassica oleracea, with the genome downloaded from the JGI Phytozome 12.0 database (Available online: https://phytozome.jgi.doe.gov/pz/portal.html, accessed on 1 April 2021) [42] via the same method.
The physico-chemical properties of molecular weight, and isoelectric points, were analyzed by the online ProtParam tool (Available online: http://web.expasy.org/protparam/, accessed on 1 April 2021) [43]. The subcellular localization of BnSOD proteins was predicted from the WoLF PSORT server (Available online: https://wolfpsort.hgc.jp/, accessed on 1 April 2021) [44]. BnSOD gene structures were constructed via TBtools software (V 1.068; https://github.com/CJ-Chen/TBtools, accessed on 1 April 2021) [45]. The conserved motifs about BnSOD protein sequences were identified using the MEME website (Available online: https://meme-suite.org/meme/db/motifs, accessed on 1 April 2021) [46].

2.2. Phylogenetic Tree and Synteny Analysis of BnSOD Proteins

To observe the evolutionary relationship of the BnSOD gene family, we constructed a phylogenetic tree about B. napus, B. oleracea, B. rapa, and A. thaliana protein sequences. The sequence alignment was performed by MEGA 7 software (Available online: https://megasoftware.net/home, accessed on 1 April 2021) [47]. The neighbor-joining (NJ) method was performed to construct a phylogenetic tree with 1000 bootstrap replicates using the Evolview v3 website (Available online: https://www.evolgenius.info/evolview, accessed on 1 April 2021) [48] to display the phylogenetic tree. Synteny relationships of SOD genes were developed by the python-package, JCVI (Available online: https://github.com/tanghaibao/jcvi, accessed on 1 April 2021) [49] from B. napus, B. oleracea, B. rapa, and A. thaliana. We calculated the Ka/Ks ratios of all SODs using KaKs_Calculator 2.0 (Available online: https://sourceforge.net/projects/kakscalculator2/, accessed on 1 April 2021) [50].

2.3. Analysis of Cis-Acting Regulatory Elements in the BnSODs Promoters

To analyze the putative cis-elements in the BnSODs promoters, we extracted the 2Kb sequence upstream of start codons in the B. napus genome. Then, the promoter sequence of each gene was analyzed using the PlantCARE website (Available online: http://bioinformatics.psb.ugent.be/webtools/plantcare/html/, accessed on 1 April 2021) [51] and figures drawn using TBtools (V 1.068) [45].

2.4. Prediction of Putative miRNA Targeting BnSOD Genes and GO Annotation Analysis

The coding sequence (CDS) of BnSODs was used to identify possible target miRNAs in the psRNATarget database (Available online: http://plantgrn.noble.org/psRNATarget/, accessed on 01 April 2021) [52] with default parameters. We drew the interaction network figure between the miRNAs and BnSOD genes by Cytoscape software (V3.8.2; Available online: https://cytoscape.org/download.html, accessed on 1 April 2021). Gene ontology (GO) annotation analysis was performed by uploading all BnSODs protein sequences to the eggNOG website (Available online: http://eggnog-mapper.embl.de/, 1 April 2021) [53]. TBtools was used to perform GO enrichment analysis.

2.5. Expression Profiling of BnSOD Genes in Different Tissues

For tissue-specific expression profiling, we downloaded RNA-seq data (BioProject ID: PRJCA001495) of rapeseed from the National Genomics Data Center. The complete method has been described in our recent work [37]. Briefly, Cuffquant and Cuffnorm were used to produce normalized counts in transcripts per million (TPM) values. Based on TPM values, the expression heat map was created using GraphPad Prism 8 software (https://www.graphpad.com/, accessed on 1 April 2021). [54].

2.6. Plant Material and Stress Conditions

In this study, a typical cultivated variety, “ZS11,” was used for stress treatments. The seeds of the “ZS11” genotype were provided by the OCRI-CAAS, Wuhan, China. The stress treatments were carried out as described in our recent work [37]. Briefly, the vigor seeds were cultivated on water-saturated filter paper in a chamber (25 °C day/night and 16 h/8 h light/dark cycle) till the radicle’s extent extended around 5 mm. For stress treatment, germinated seeds were subjected to 150 mM NaCl solution for salinity stress, 15% PEG6000 solution for drought stress, and 4 °C for cold stress on water-saturated filter paper. For waterlogging stress, the seeds were flooded with water in the Eppendorf tube. To evaluate the impact of diverse hormones, the germinated seeds were grown in Murashige and Skoog (MS) medium supplied with 100 μM abscisic acid (ABA), 100 μM gibberellic acid (GA), 100 μM indole-acetic acid/auxin (IAA), and 100 μM kinetin (KT). The samples were collected at 0 (CK), 2, 4, 6, and 8 h after the treatments. All of the treatments were performed with three biological replications. All of the samples were immediately frozen in liquid nitrogen and were stored at −80 °C for further experiments.

2.7. RNA Extraction and qRT-PCR Analysis

Total RNA extraction and cDNA synthesis were performed using a TransZol Up Plus RNA Kit (TransGen Biotech, Beijing, China) and cDNA Synthesis SuperMix (TransGen Biotech, Beijing, China) according to manufacturer instructions. The detailed information of qRT-PCR reactions has been described in our recently published work [37]. Initially, the expression data were analyzed using the 2−ΔΔCT method. Due to the large difference in the expression levels, we used the log2 fold change method to calculate the expression results for better visualization of differently expressed genes under stress treatments. All of the primers used in this experiment are listed in Table S1. The heatmap was created using GraphPad Prism 8 software [54].

2.8. Prediction of the 3D Structure of BnSOD Proteins

The predicted 3D structures of BnSODs were created with the 3D LigandSite website (https://www.wass-michaelislab.org/3dlig/index.html, accessed on 1 April 2021) [55]. The probability score of the predicted sites shows the possibility of apiece residue to be elaborated in binding. During the 3D model predictions, we choose cluster 1 with a higher Z-score. The higher Z-score value indicates the reliability and trueness of the cluster/model [55].

3. Results

3.1. Identification of SOD Gene Family in B. napus

The current study identified 31 BnSOD genes in the rapeseed genome using eight A. thaliana (AtSODs) protein sequences as queries (Table 1; Table S2). According to the domain scrutiny, 14 proteins were found to have a Cu/Zn-SODs domain (Pfam: 00080), 11 proteins were found to have a Fe-SODs domain (Pfam: 00081), and six proteins were found to have an Mn-SODs domain (Pfam: 02777); hereafter, these genes were named as BnCSD1-BnCSD14, BnFSD1-BnFSD11, and BnMSD1-BnMSD6, respectively (Table 1). Comprehensive statistics of 31 BnSOD genes were documented in Table 1. Out of 31 BnSODs, 15 genes were located on the A subgenome, and 16 genes were located on the C subgenome (Table 1). The gene length extended from 826 bp (BnCSD4) to 6898 bp (BnFSD5) with 3–9 exons in the individual gene sequences. The CDS length, protein length, and molecular weight extended from 441–1173 bp, 146–390 amino acids, and 14.55–42.34 kDa (BnCSD9-BnCSD2), respectively. The isoelectric points extended from 4.88 (BnFSD7) to 9.56 (BnMSD3) (Table 1). The subcellular localization results prophesied that 15 proteins were located on the chloroplast, nine proteins were located on the cytoskeleton, five proteins were located on the mitochondrion, and the remaining two proteins (BnFSD9 and BnMSD6) were located on the endoplasmic reticulum (Table 1).
Additionally, 14 SOD genes were also identified from Brassica oleracea (BolCSD1-BolCSD6, BolFSD1-BolFSD5, and BolMSD1-BolMSD3), and Brassica rapa (BraCSD1-BraCSD7, BraFSD1-BraFSD4, and BraMSD1-BraMSD3) genomes (Table S2).

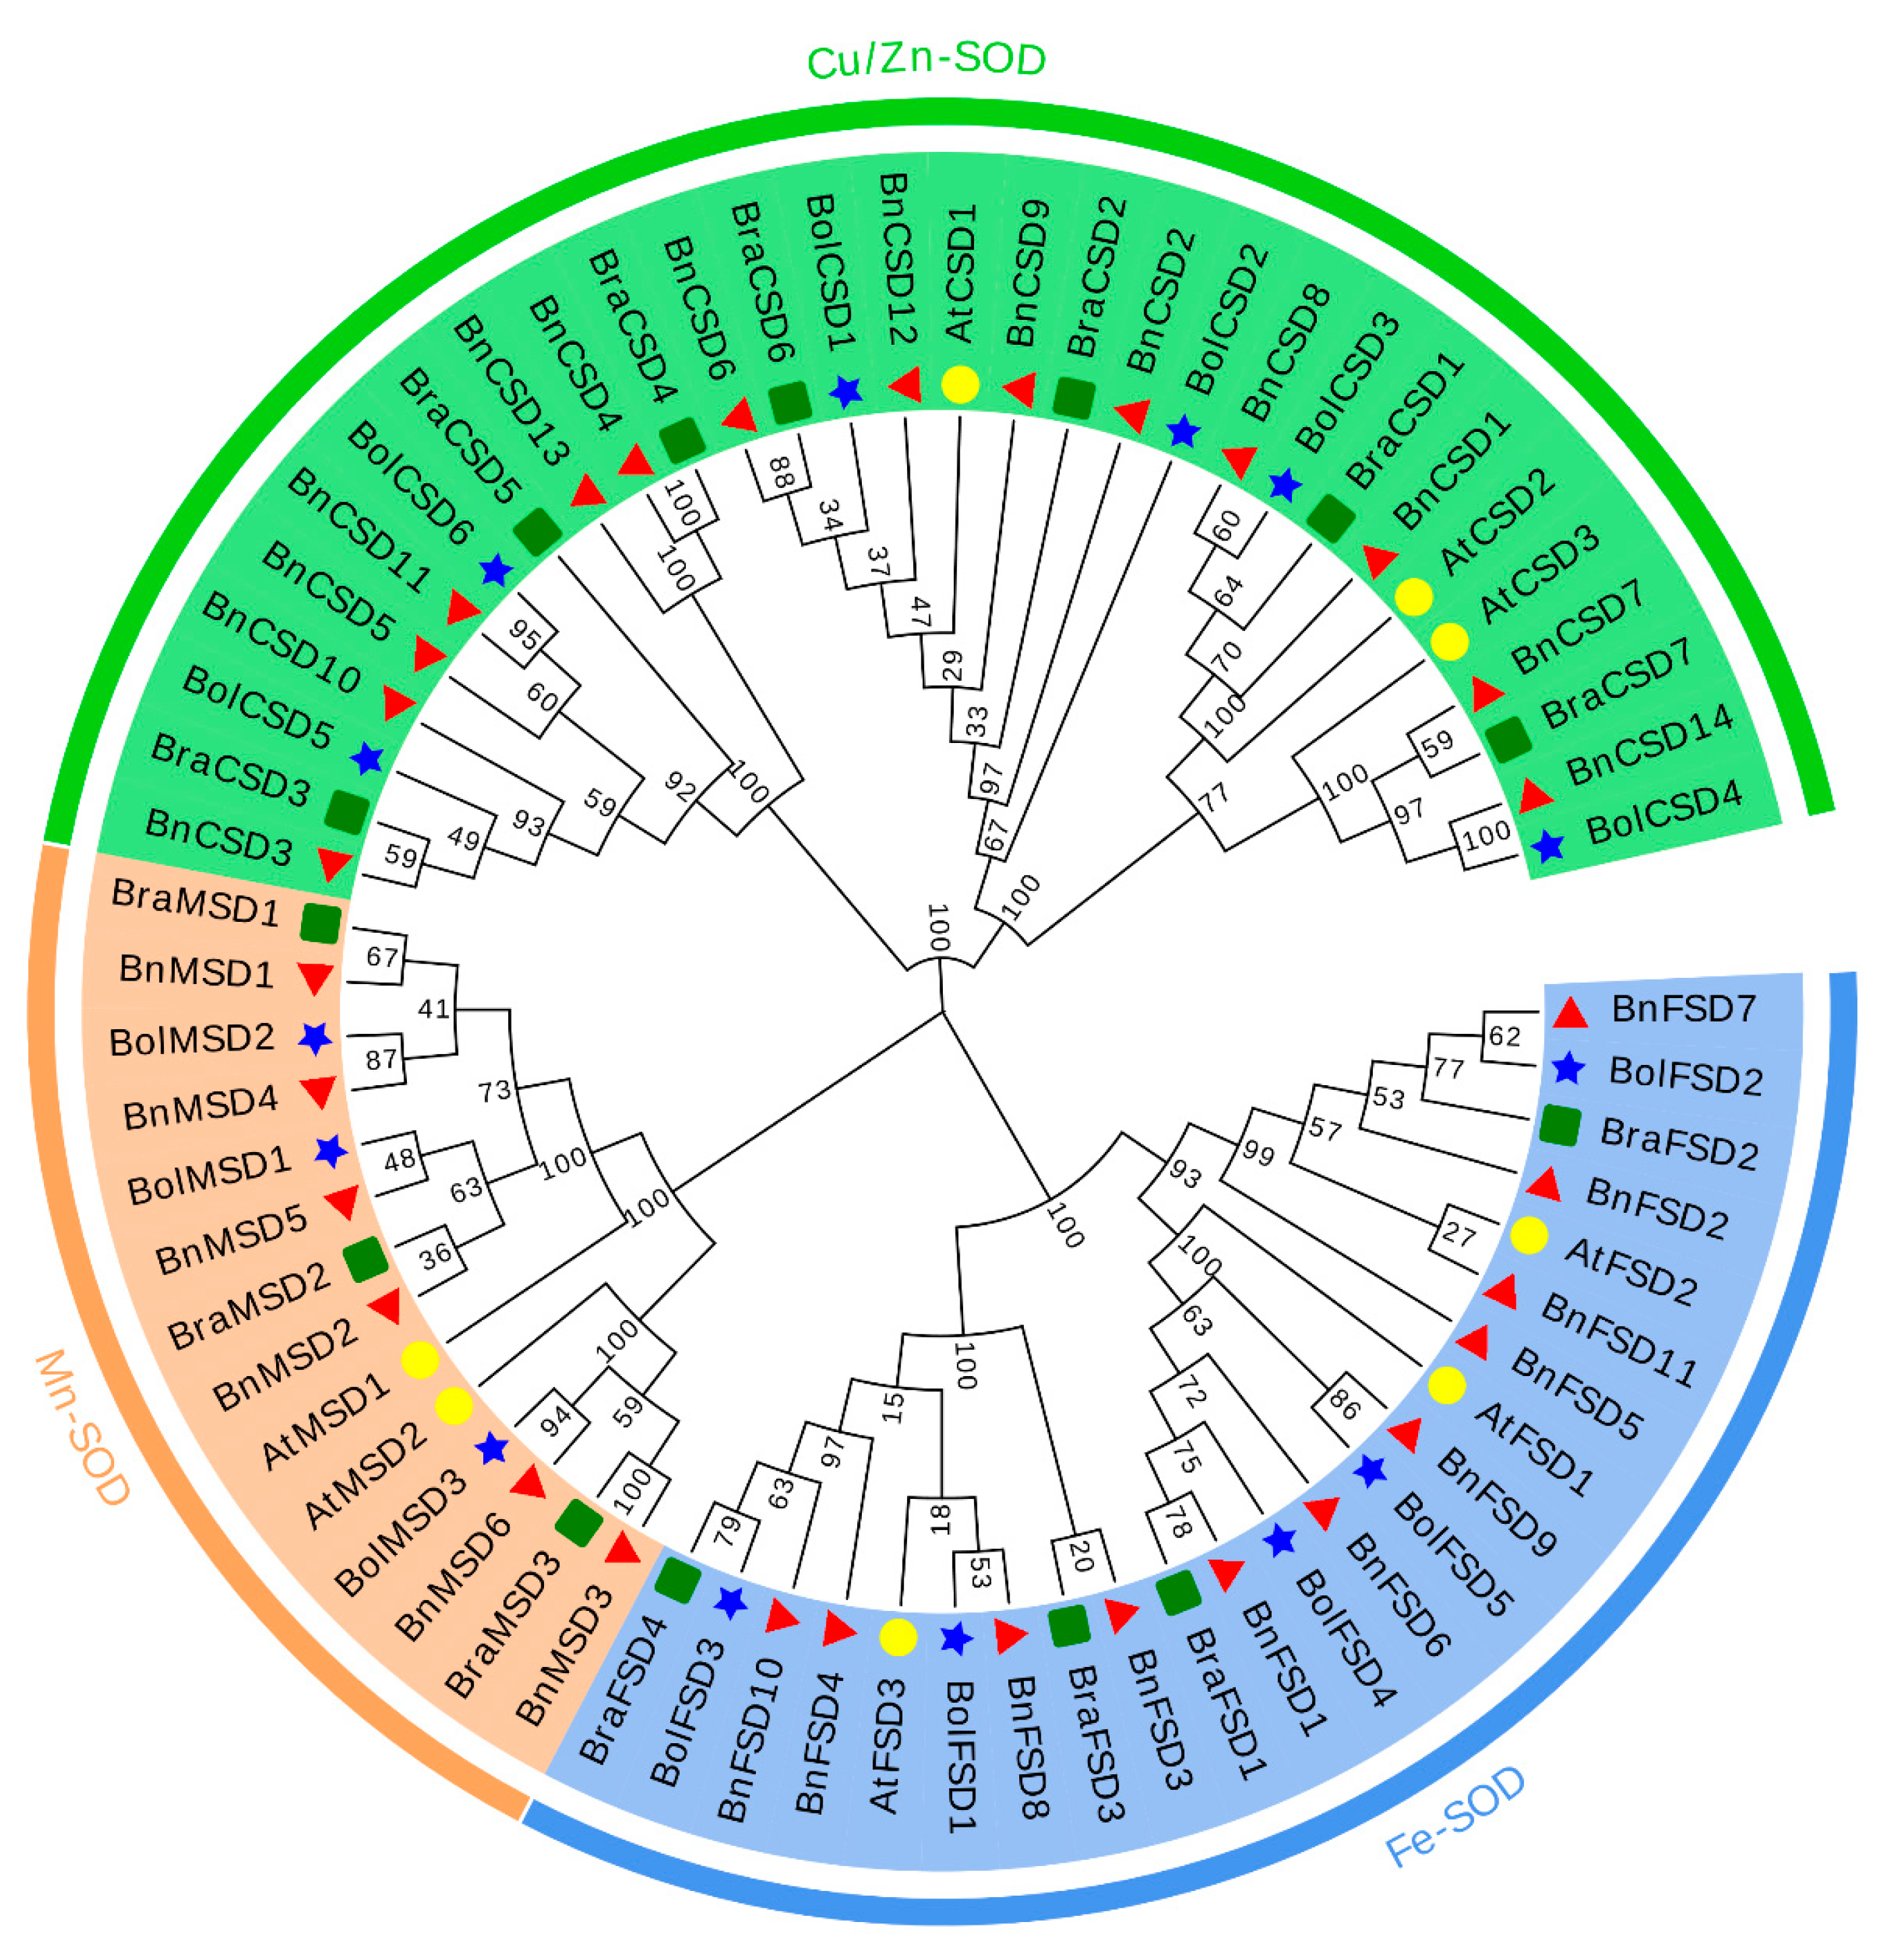
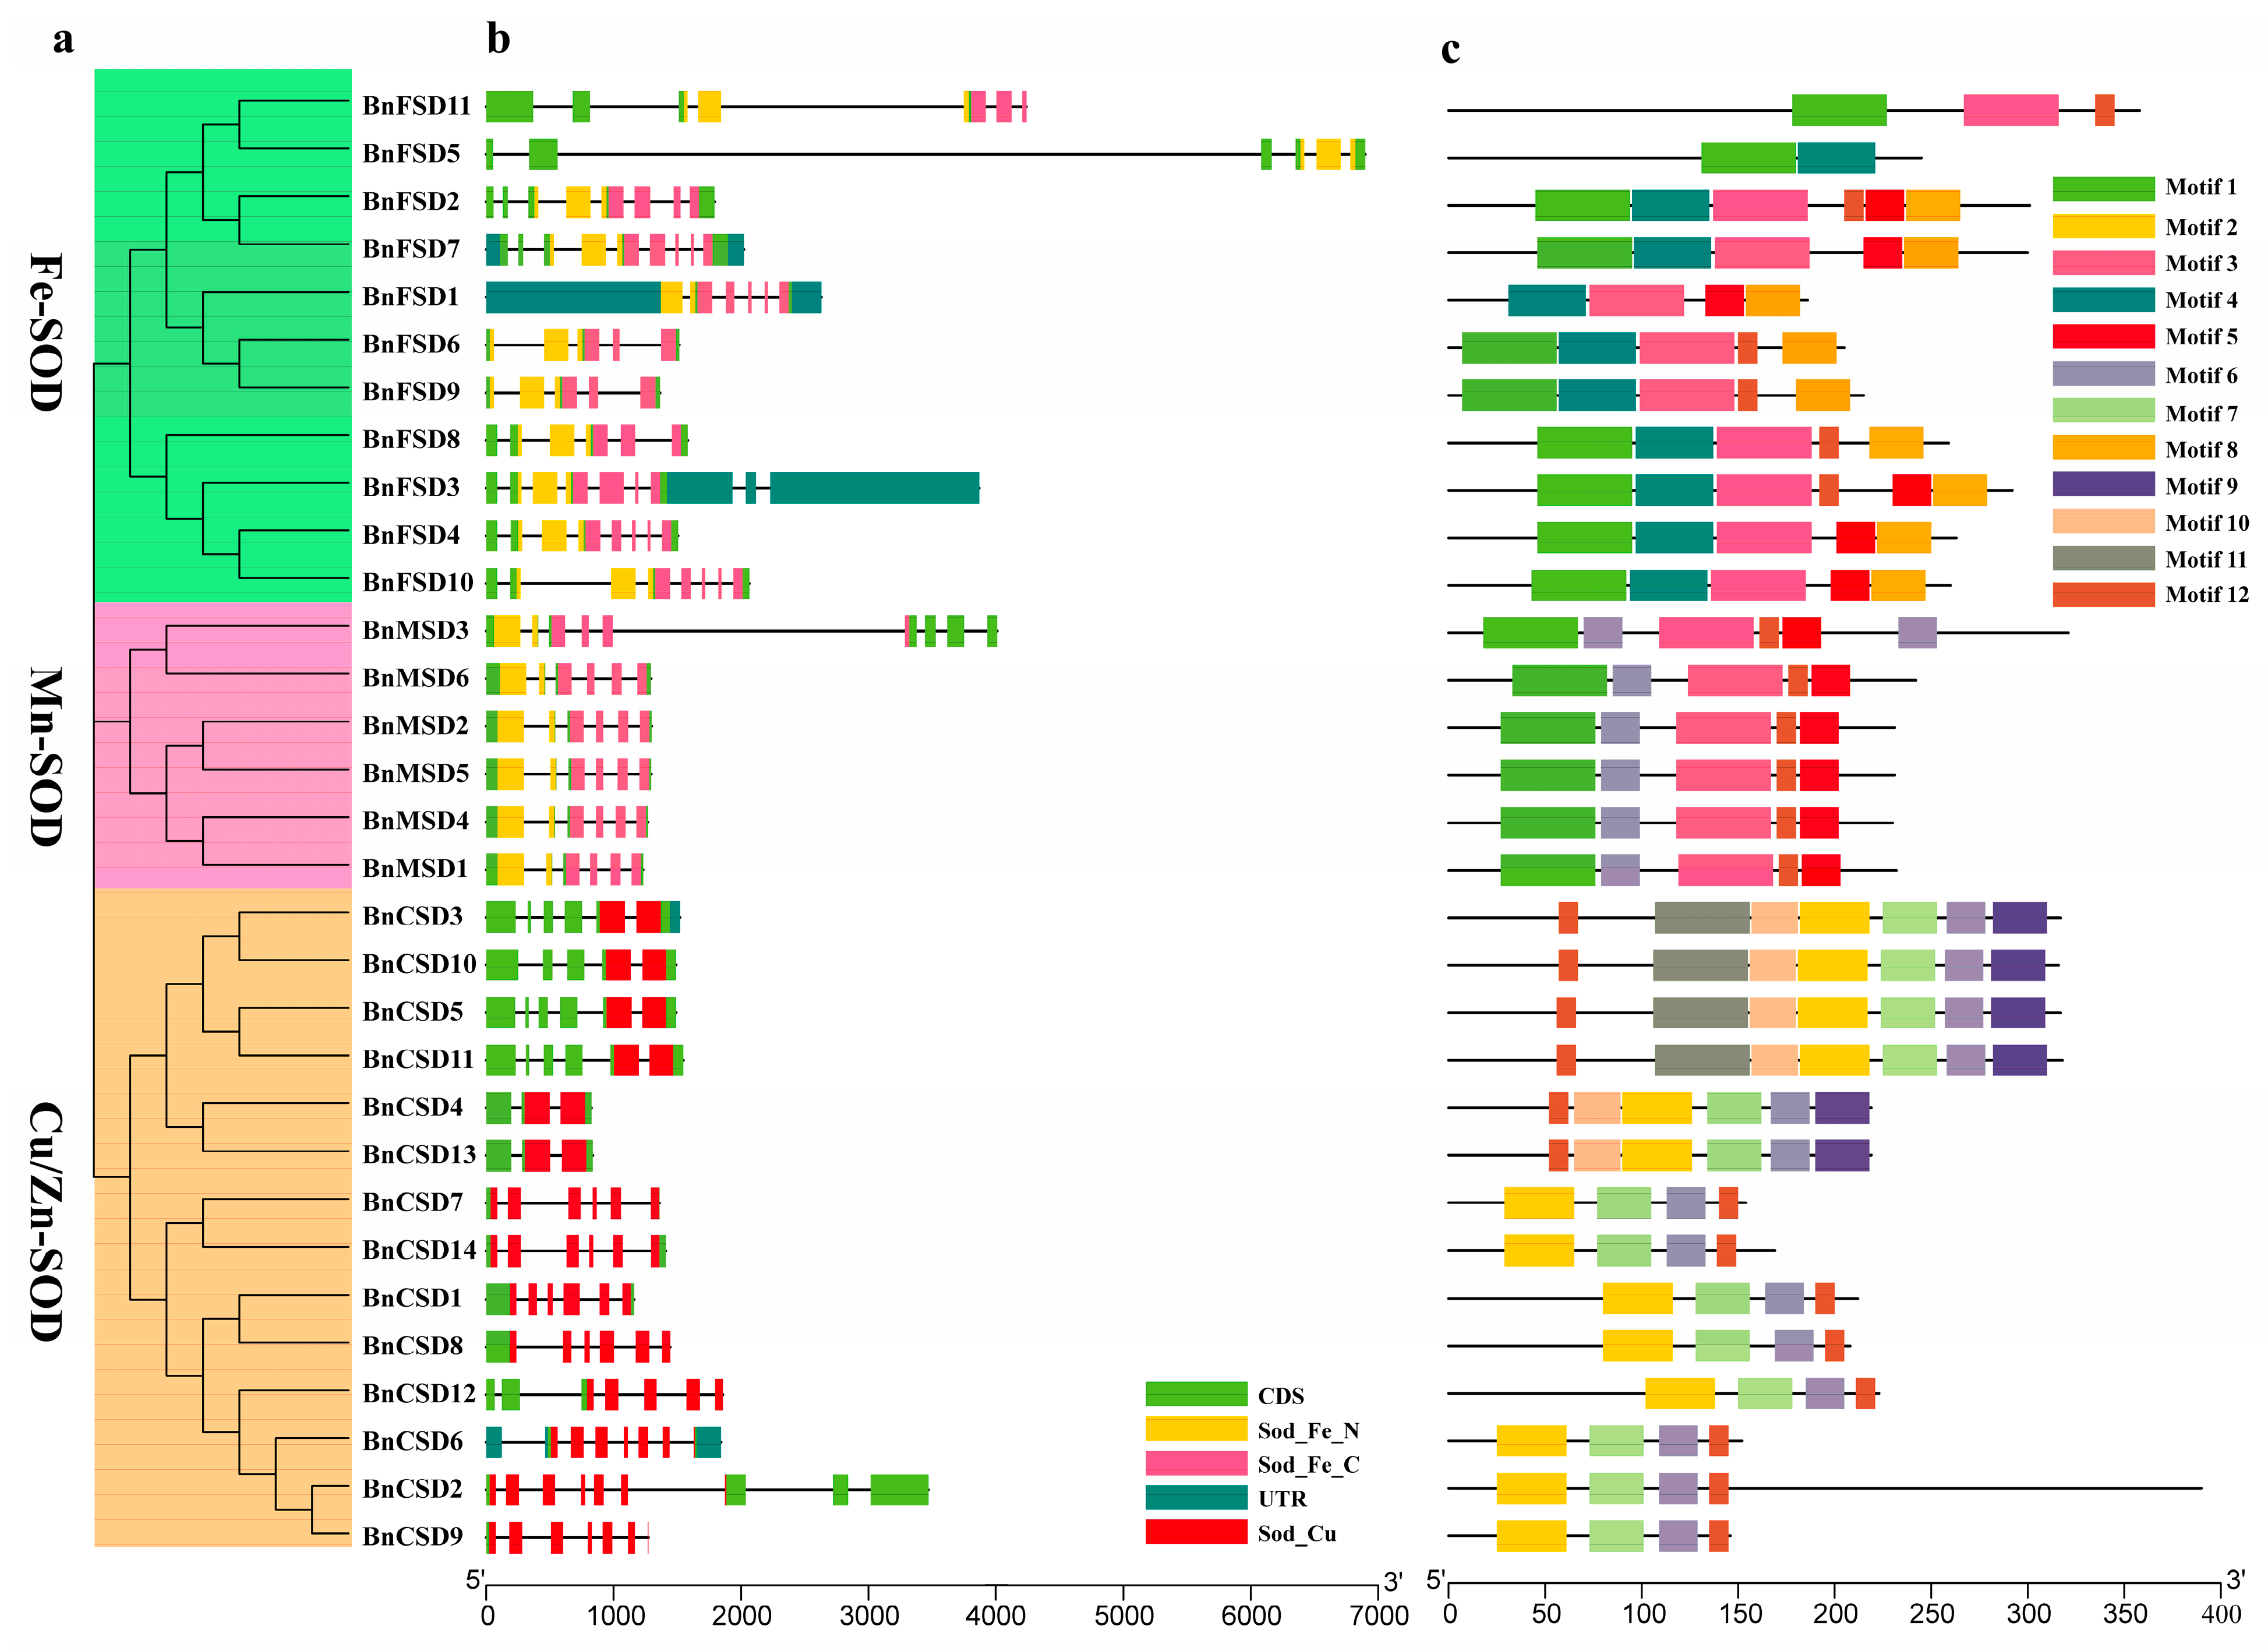
3.2. Phylogenetic Relationships of SOD Genes

In the current study, the evolutionary relationships were explored between BnSODs, BolSODs, BraSODs, and AtSODs genes. Based on domains (Cu/Zn-SODs, Fe-SODs, and Mn-SODs) and a phylogenetic tree, 67 SODs were clustered into three major groups (Figure 1). Results presented that the Cu/Zn-SODs group consists of 30 SODs members (14 BnSODs, 7 BraSODs, 6 BolSODs, and 3 AtSODs), the Mn-SODs group consists of 14 SODs members (6 BnSODs, 3 BraSODs, 3 BolSODs, and 2 AtSODs), and the Fe-SODs group consists of 23 SODs members (11 BnSODs, 4 BraSODs, 5 BolSODs, and 3 AtSODs) (Figure 1). Interestingly, Cu/Zn-SODs and Fe-SODs groups possessed a greater number of SODs than the Mn-SOD group. It was also found that the BnSODs exhibited a more closely phylogenetic relationship with BolSODs and BraSODs in each group.

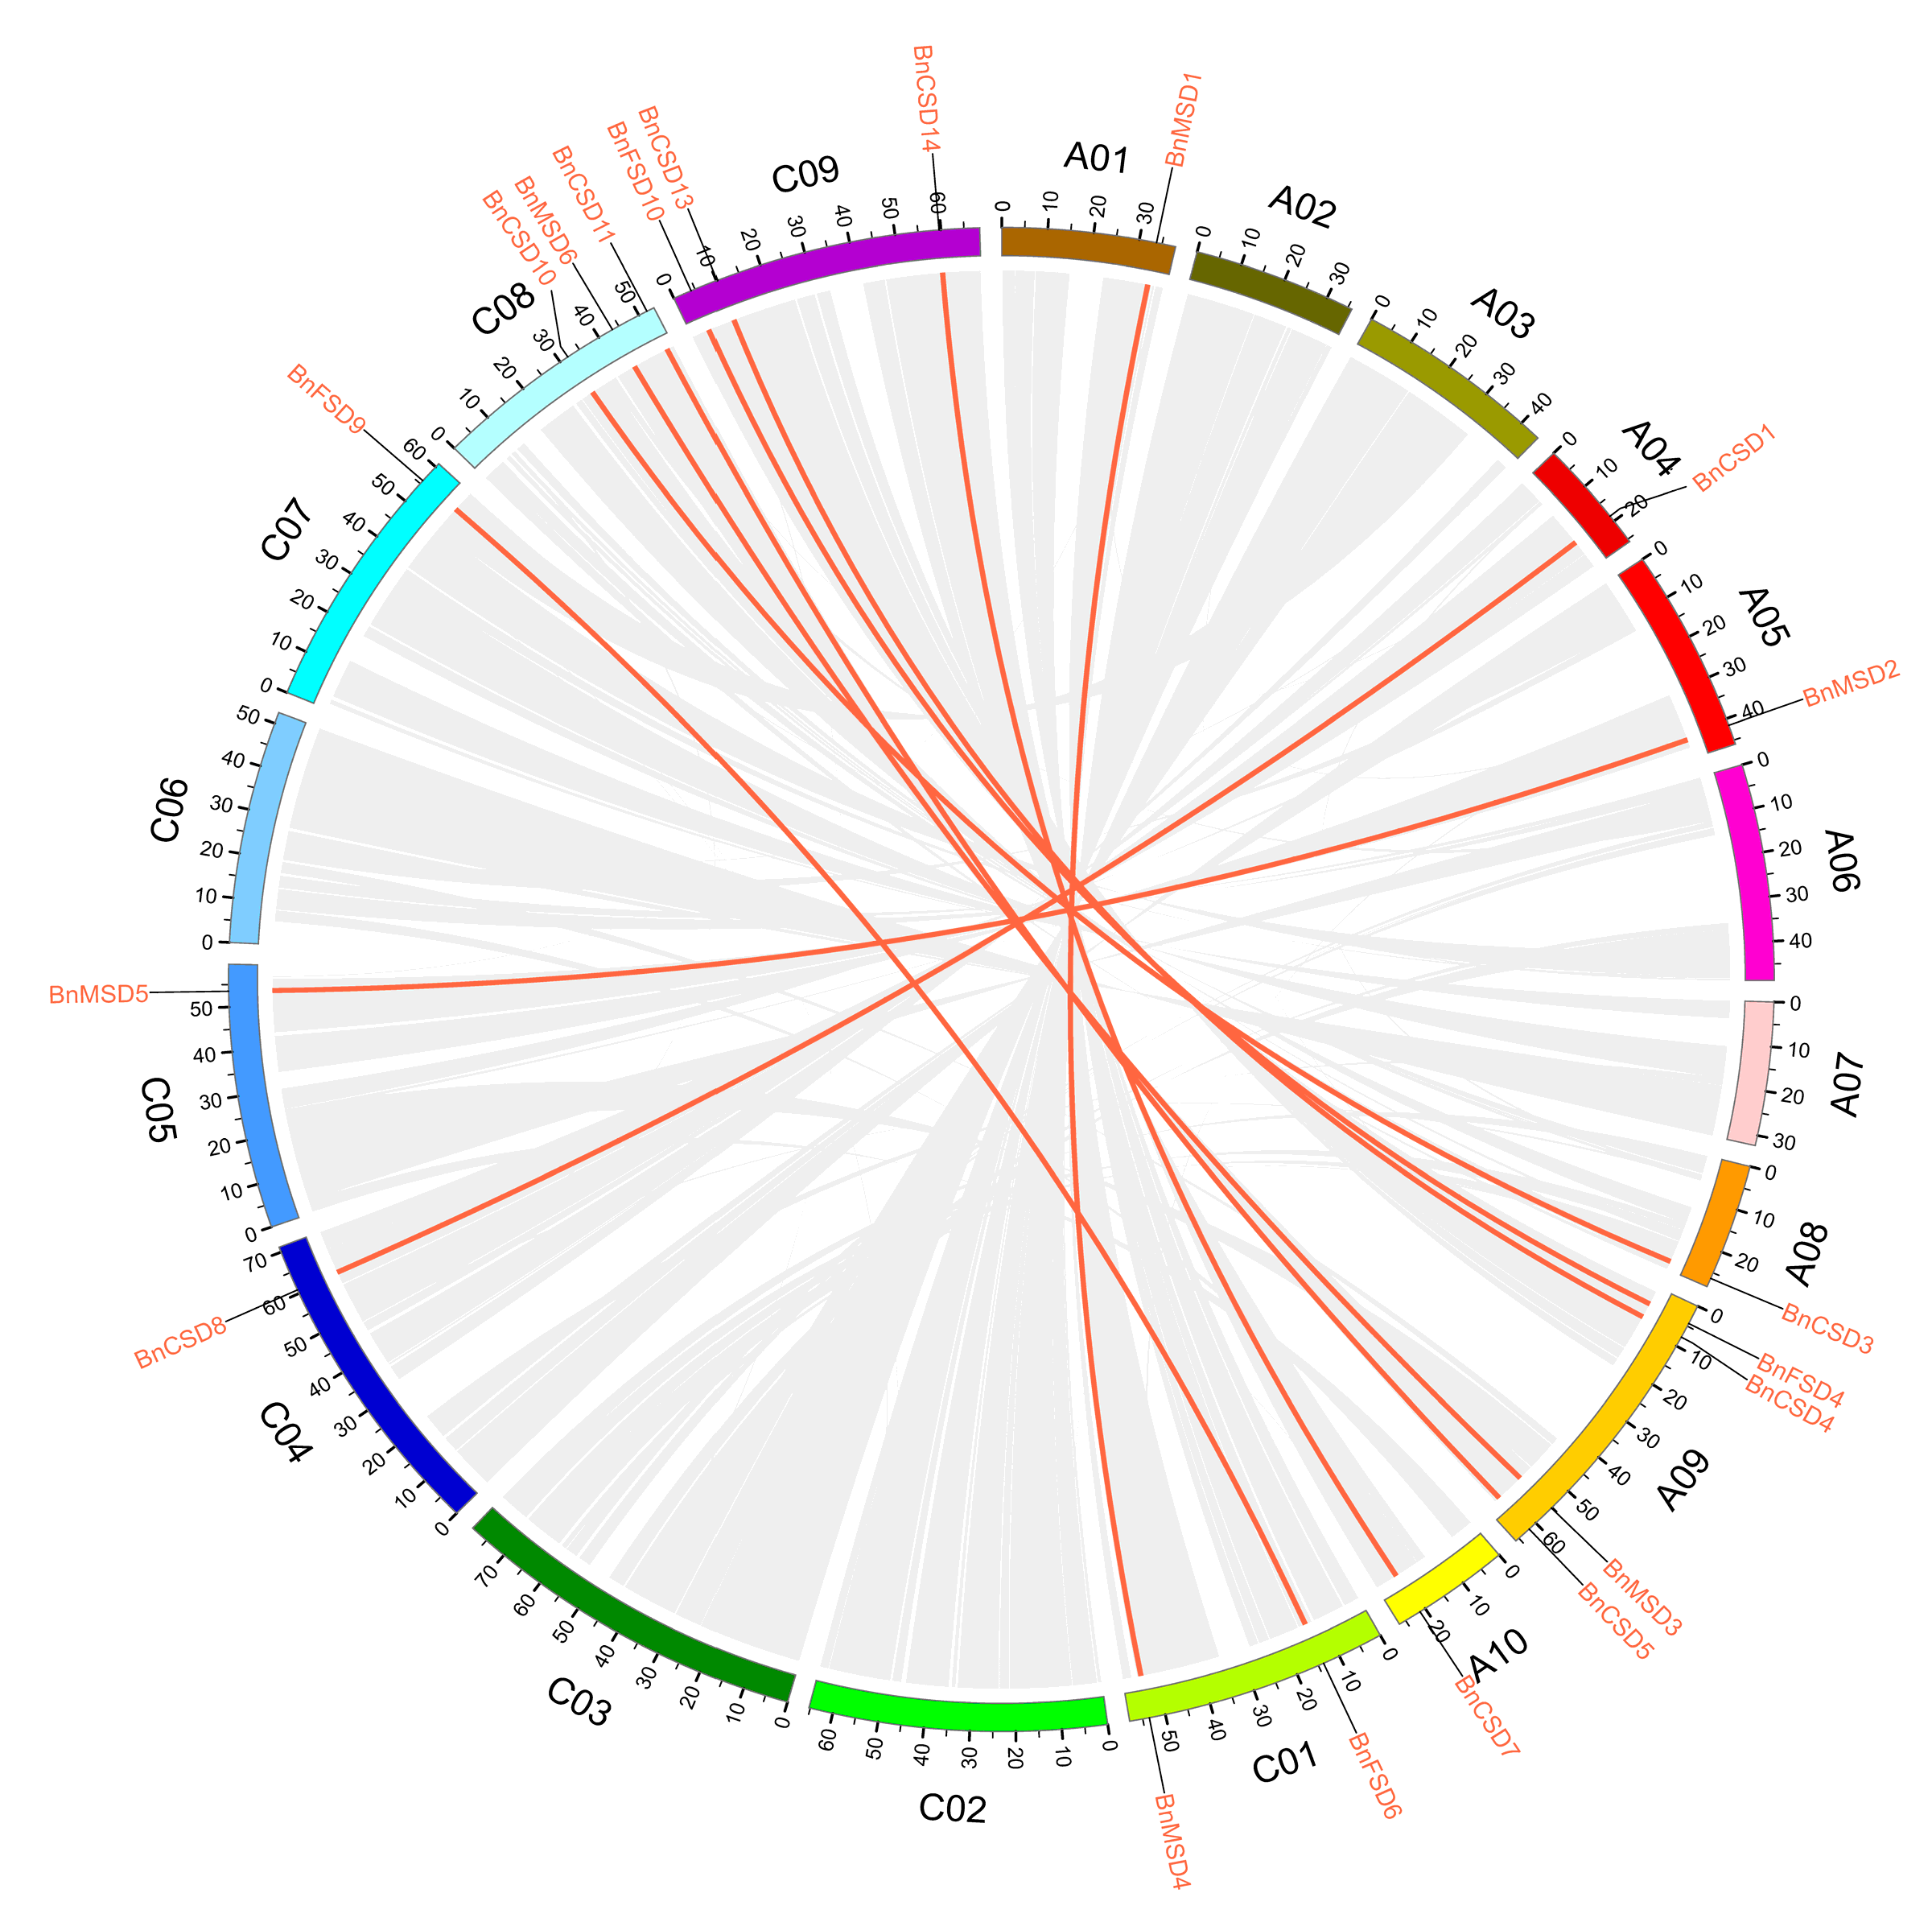
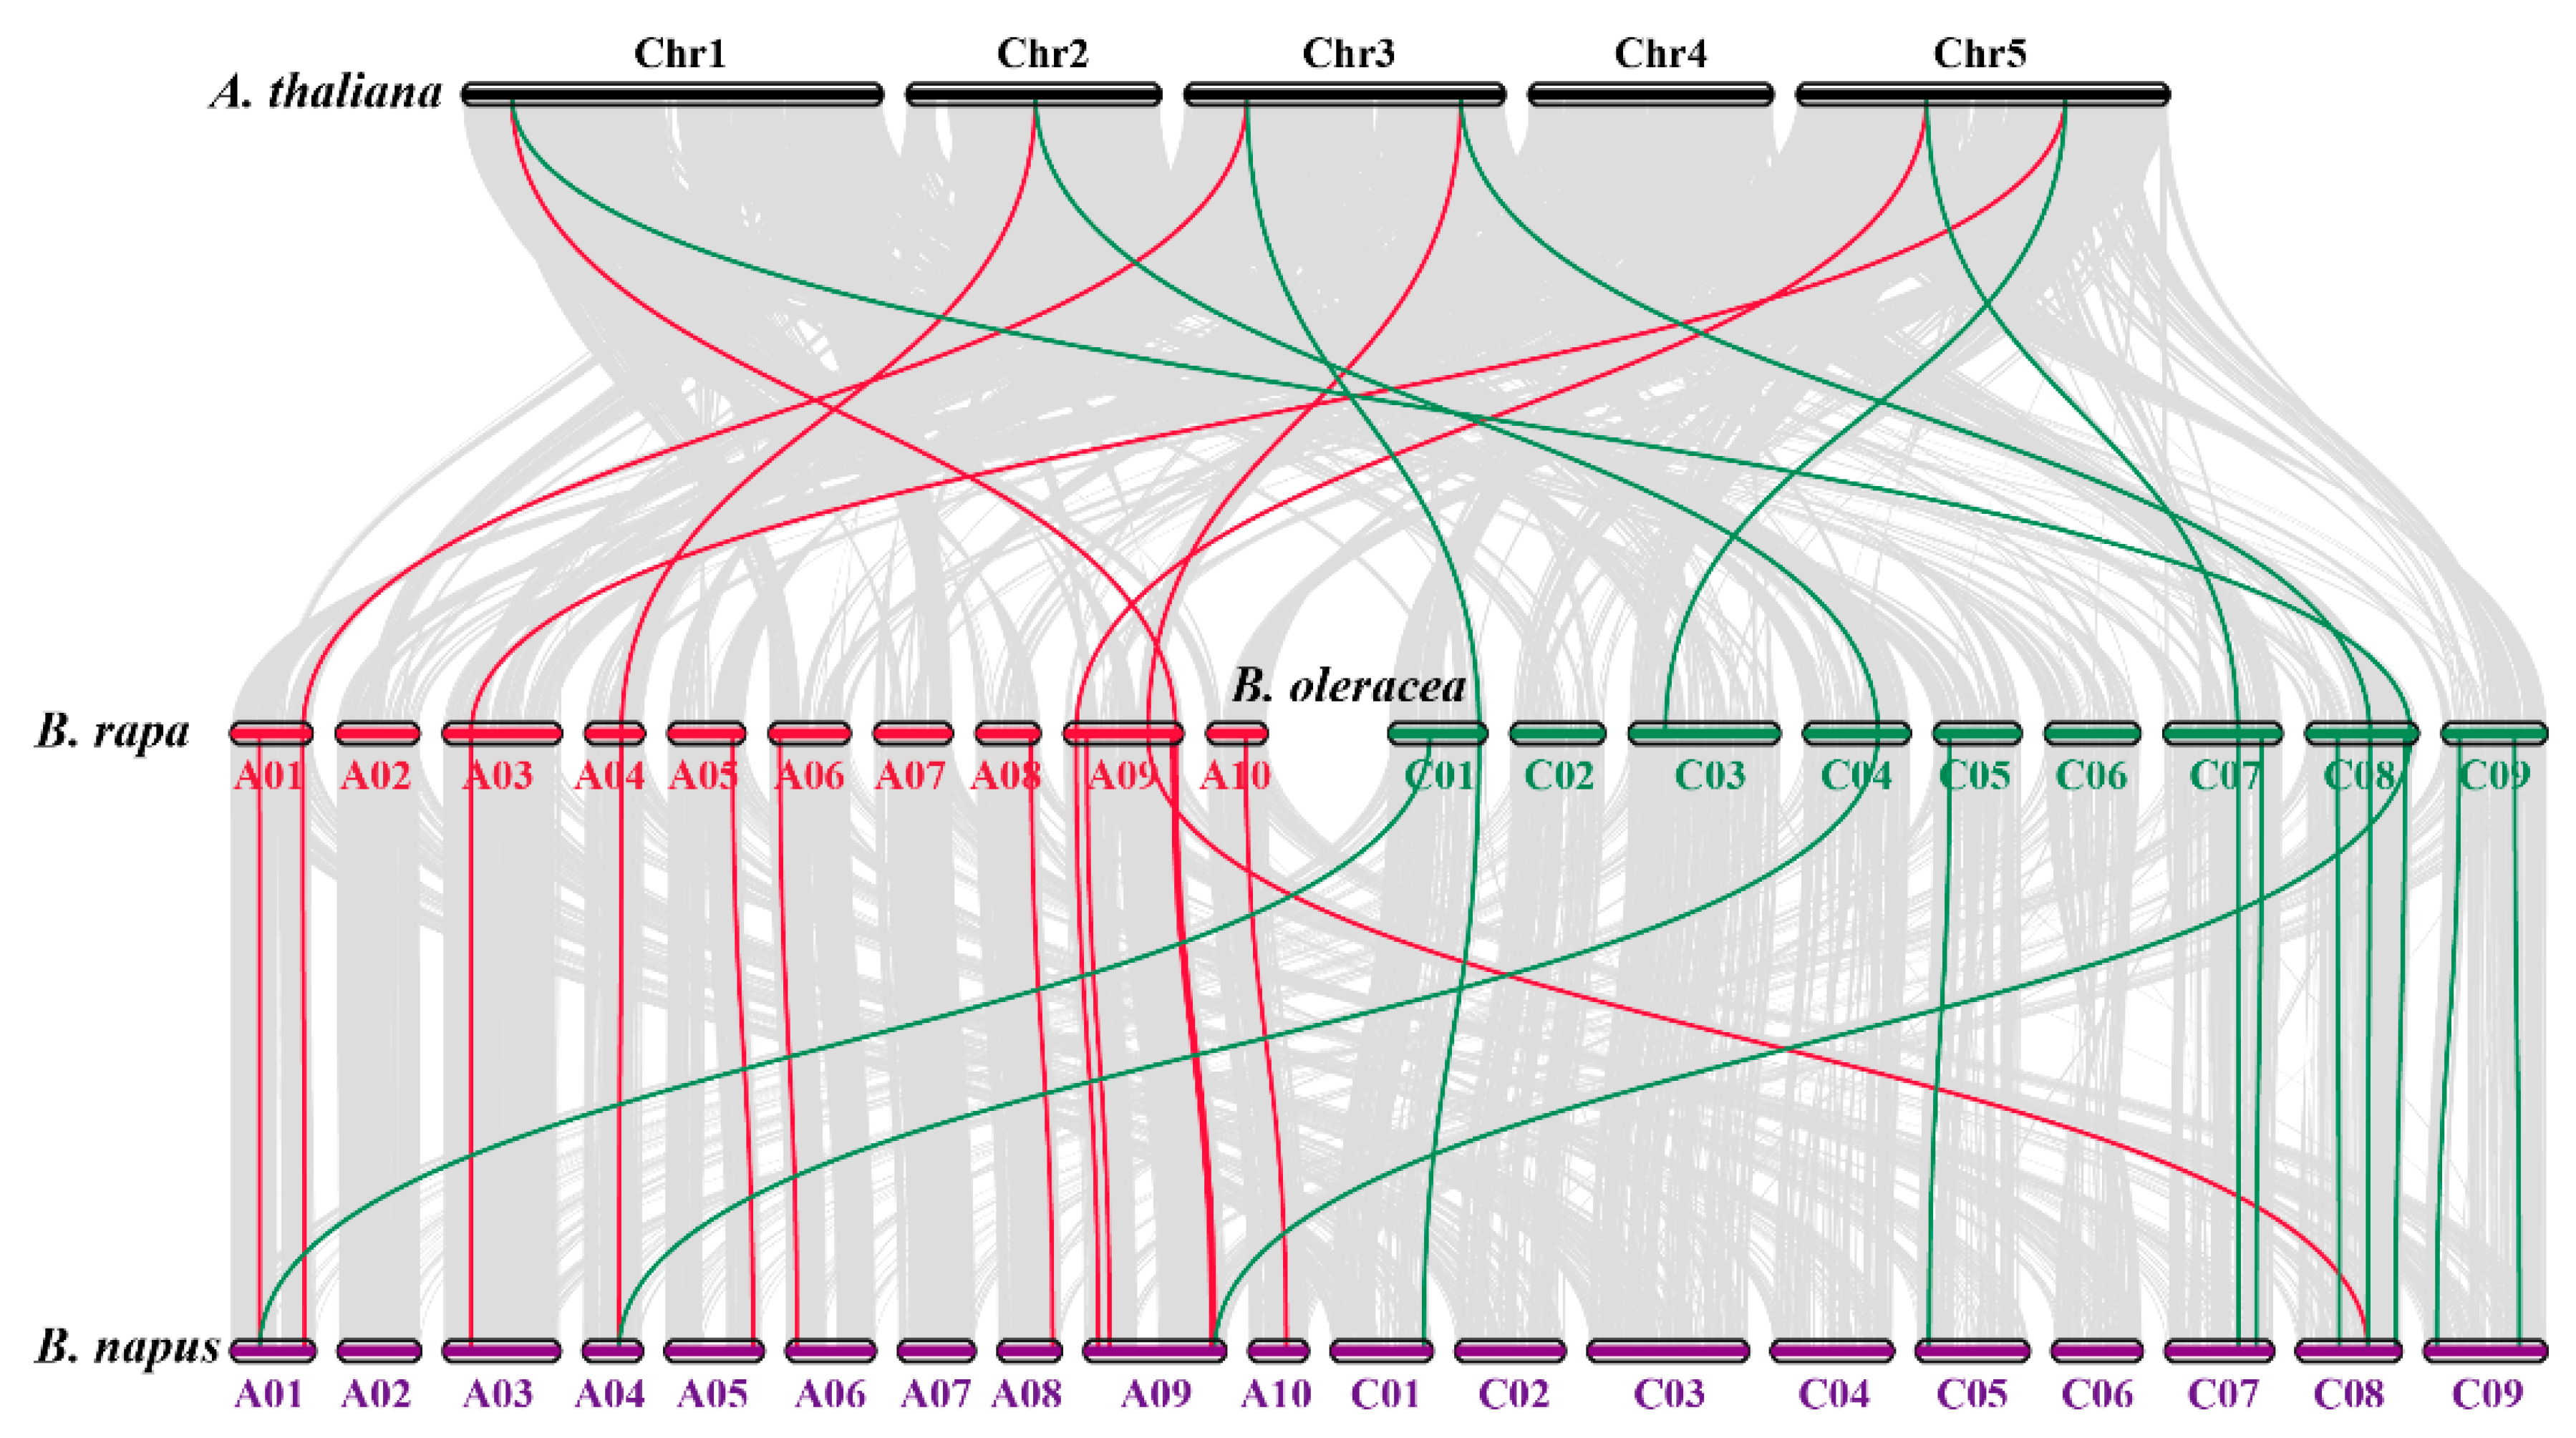
3.3. Chromosomal Locations and Synteny Analysis of SOD Genes

Gene duplications (tandem and segmental) are considered the main driving forces in promoting new genomic evolution [56]. Thus, gene duplication events were evaluated between BnSODs, BolSODs, BraSODs, and AtSODs (Table S3). The chromosol location of 10 BnSODs gene pairs was examined (Figure 2). Twelve out of 19 chromosomes harbored BnSODs. Particularly, chromosomes A01, A04, A05, A08, A10, C04, C05, and C07 possessed one gene, chromosome C01 contained two genes, chromosomes C08 and C09 possessed three genes, and chromosome A09 contained four genes (Figure 2). Surprisingly, the residual chromosomes did not comprehend BnSOD genes. Our results show that segmental duplications have played vital parts in developing BnSOD genes in the rapeseed genome (Table S3). Moreover, no tandem duplication events were detected. Notably, a gene pair (BnMSD6 and BnMSD6) was found to be dispersed, while the remaining gene pairs experienced segmental duplications (Table S3).
Collinearity investigation revealed strong orthologs of SOD genes among B. napus and three closely related species (B. rapa, B. oleracea, and A. thaliana) (Figure 3). In summary, in the A subgenome, seven and five B. napus genes demonstrated syntenic relations with BraSODs and AtSODs, respectively. Three genes exhibited syntenic relations with BolSODs and AtSODs (Figure 3). In contrast, in the C subgenome, six and three B. napus genes displayed syntenic relations with BolSODs and AtSODs. One gene revealed syntenic relations with BnSODs and AtSODs (Figure 3). Our results revealed numerous A. thaliana, B. rapa, and B. oleracea homologous sustained syntenic relations with BnSODs, suggesting that whole-genome duplication or segmental duplications played a significant part in BnSODs gene family progression (Table S3).
The Ka/Ks ratio is considered a significant index in evaluating the duplication events and selection pressures [57]. Therefore, to understand the evolutionary story of the BnSODs, the Ka, Ks, and Ka/Ks ratio was calculated for B. napus and the other three plant species (Table S3). Our results revealed that all of the duplicated BnSOD gene pairs had a Ka/Ks ratio of <1 (Table S3), signifying that the BnSOD genes might have handled intense purifying selective pressure through their evolution (Table S3). Similar findings were observed in B. rapa, B. oleracea, and A. thaliana (Table S3).

3.4. BnSOD Gene Structures and Conserved Motifs Investigation

The exons–introns structures and the introns number play a vital role in gene family evolution [12,58]. The comprehensive examination of the phylogenetic relationships and gene structure illustration supported our knowledge of BnSODs gene structures (Figure 4). The findings exposed that exon and intron numbers of BnSOD genes had high inconsistency and were steady with the evolutionary hierarchy outcomes, i.e., the numbers of introns and exons were found to be relatively similar within the same group (Figure 4a,b). Briefly, the number of exons and introns varied from three to nine and two to eight in the individual gene sequences, respectively (Table 1; Figure 4b). A group with the Fe-SOD domain had five–nine exons and four–eight introns. A group with the Mn-SOD domain had six exons and five introns (five genes), and only one gene (BnMSD3) had nine exons and eight introns. Whereas, the group with Cu/Zn-SOD had five–nine exons and two–eight introns (Table 1; Figure 4b). Notably, group Fe-SOD and Cu/Zn-SOD groups have complex structures compared to the Mn-SOD group.
To systematically appraise BnSODs’ protein structure diversity and envisage their functions, we explored the full-length protein sequences of 31 BnSODs by MEME software to identify their conserved motifs. The investigation outcomes displayed that a total of 12 conserved motifs were found (Figure 4c). The detailed information (name, sequence, width, and E-value) of identified motifs is presented in Table S4. In short, the conserved motifs of SOD proteins varied from two to seven, and the motifs distributions were in agreement with the groups. In the Fe-SOD group, only two proteins (BnFSD11 and BnFSD5) had three and two motifs, respectively (Figure 4c). Interestingly, motifs 1, 3, 4, 5, and 8 were predicted to be specific to Fe-SOD and Mn-SOD groups. Motif 6 was specific to Mn-SOD and Cu/Zn groups. Motifs 2, 9, 10, and 11 were specific to the Cu/Zn group. Only motif 12 was largely distributed among all of the domain groups (Figure 4c). In summary, the group arrangements’ reliability was mightily sustained by investigating conserved motif arrangements, gene structures, and phylogenetic relationships, suggesting that BnSOD proteins have tremendously well-maintained amino acid remains and members within a group. Thus, it can be assumed that proteins with similar structures and motifs might play similar functional roles.

3.5. Examination of Cis-Elements in Promoters of BnSOD Genes

To distinguish the gene functions and regulatory roles, cis-regulatory elements in BnSODs promoter regions were examined by searching a 2000 bp upstream region from each gene’s transcriptional activation site against the PlantCARE database. The detailed information of cis-elements is presented in Table S5. As revealed in Figure 5, five phytohormone-correlated [(abscisic acid (ABA), auxin, methyl jasmonate (MeJA), gibberellin (GA), and salicylic acid (SA)] responsive elements including TCA-element, CGTCA-motif, ABRE, TGACG-motif, TATC-box, GARE-motif, P-box, etc. were recognized (Figure 5; Table S5). Particularly, numerous phytohormone-correlated elements were predicted to be specific to some genes and widely distributed (Figure 5), signifying the crucial role of these genes in phytohormone-mediation.
Furthermore, four stress-responsive (drought, low-temperature, anaerobic, and light) elements, including ARE, LAMP-element, LTR, TCT-motif, chs-CMA1a, MBS, G-box, GT1-motif, MBS, etc. were identified (Figure 5; Table S5). Mainly, numerous light-responsive elements were found to be widely distributed among all of the genes (Figure 5; Table S5), signifying the substantial role of BnSODs in response to light stress. Overall, results advised that BnSODs expression levels may diverge under phytohormone and abiotic stress conditions.

3.6. Genome-Wide Analysis of miRNA Targeting BnSOD Genes

In the recent past, several studies have revealed that miRNA-mediated regulation accompanies the stress responses in plants. Thus, for a deep understanding of miRNA-mediated post-transcriptional regulation of BnSODs, we predicted 30 miRNAs targeting 13 genes (Figure 6a; Table S6). Some of the miRNA-targeted sites are presented in Figure 6b, whereas the detailed information of all miRNAs targeted genes/sites is presented in Table S6. Our results showed that four members of the bna-miR159 family targeted four genes (BnCSD7, BnCSD14, BnMSD1, and BnMSD4). Six members of the bna-miR166 family targeted one gene (BnCSD10). Fourteen members of the bna-miR169 family targeted one gene (BnFSD11). Four members of the bna-miR172 family targeted one gene (BnCSD2). Two members of the bna-miR394 family targeted four genes (BnFSD11, BnFSD2, BnFSD7, and BnFSD5). Two members of the bna-miR397 family targeted one gene (BnCSD10). One member of the bna-miR6033 family targeted three genes (BnFSD4, BnFSD8, and BnFSD3) (Figure 6a; Table S6). Mainly, BnFSD11, BnCSD10, and BnCSD2 were prophesied to be targeted by a greater number of miRNAs (Figure 6a; Table S6). The expression levels of these miRNAs and their targeted genes requires validation in additional research to govern their biological roles in the rapeseed genome.

3.7. Functional Annotation Study of BnSOD Genes

The functions of the BnSODs genes were prophesied through GO annotation investigation based on biological process (BP), molecular function (MF), and cellular component (CC) classes. The GO annotation results revealed numerous significantly enriched terms (Table S7). Analysis of BP annotations indicated that these genes were mainly involved in responses to stimulus (GO:0050896), responses to chemicals (GO:0042221), responses to stress (GO:0006950), responses to inorganic substances (GO:0010035), responses to abiotic stimulus (GO:0009628), cellular oxidant detoxification (GO:0098869), cellular response to oxygen-containing compound (GO:1901701), etc. (Table S7). Analysis of MF annotations revealed that these genes were primarily involved in ion binding (GO:0043167), copper ion binding (GO:0005507), zinc ion binding (GO:0008270), oxidoreductase activity (GO:0016491), superoxide dismutase activity (GO:0004784), antioxidant activity (GO:0016209), etc. (Table S7). A study of CC annotations showed that these genes are mainly involved in cellular anatomical entity (GO:0110165), cytoplasm (GO:0005737), obsolete intracellular part (GO:0044424), cellular component (GO:0005575), intracellular anatomical structure (GO:0005622), membrane-bounded organelle (GO:0043227), etc. (Table S7). In conclusion, GO annotation results confirmed the BnSODs role in response to different stress stimulus, cellular oxidant detoxification processes, metal ion binding activities, SOD activity, and different cellular components.

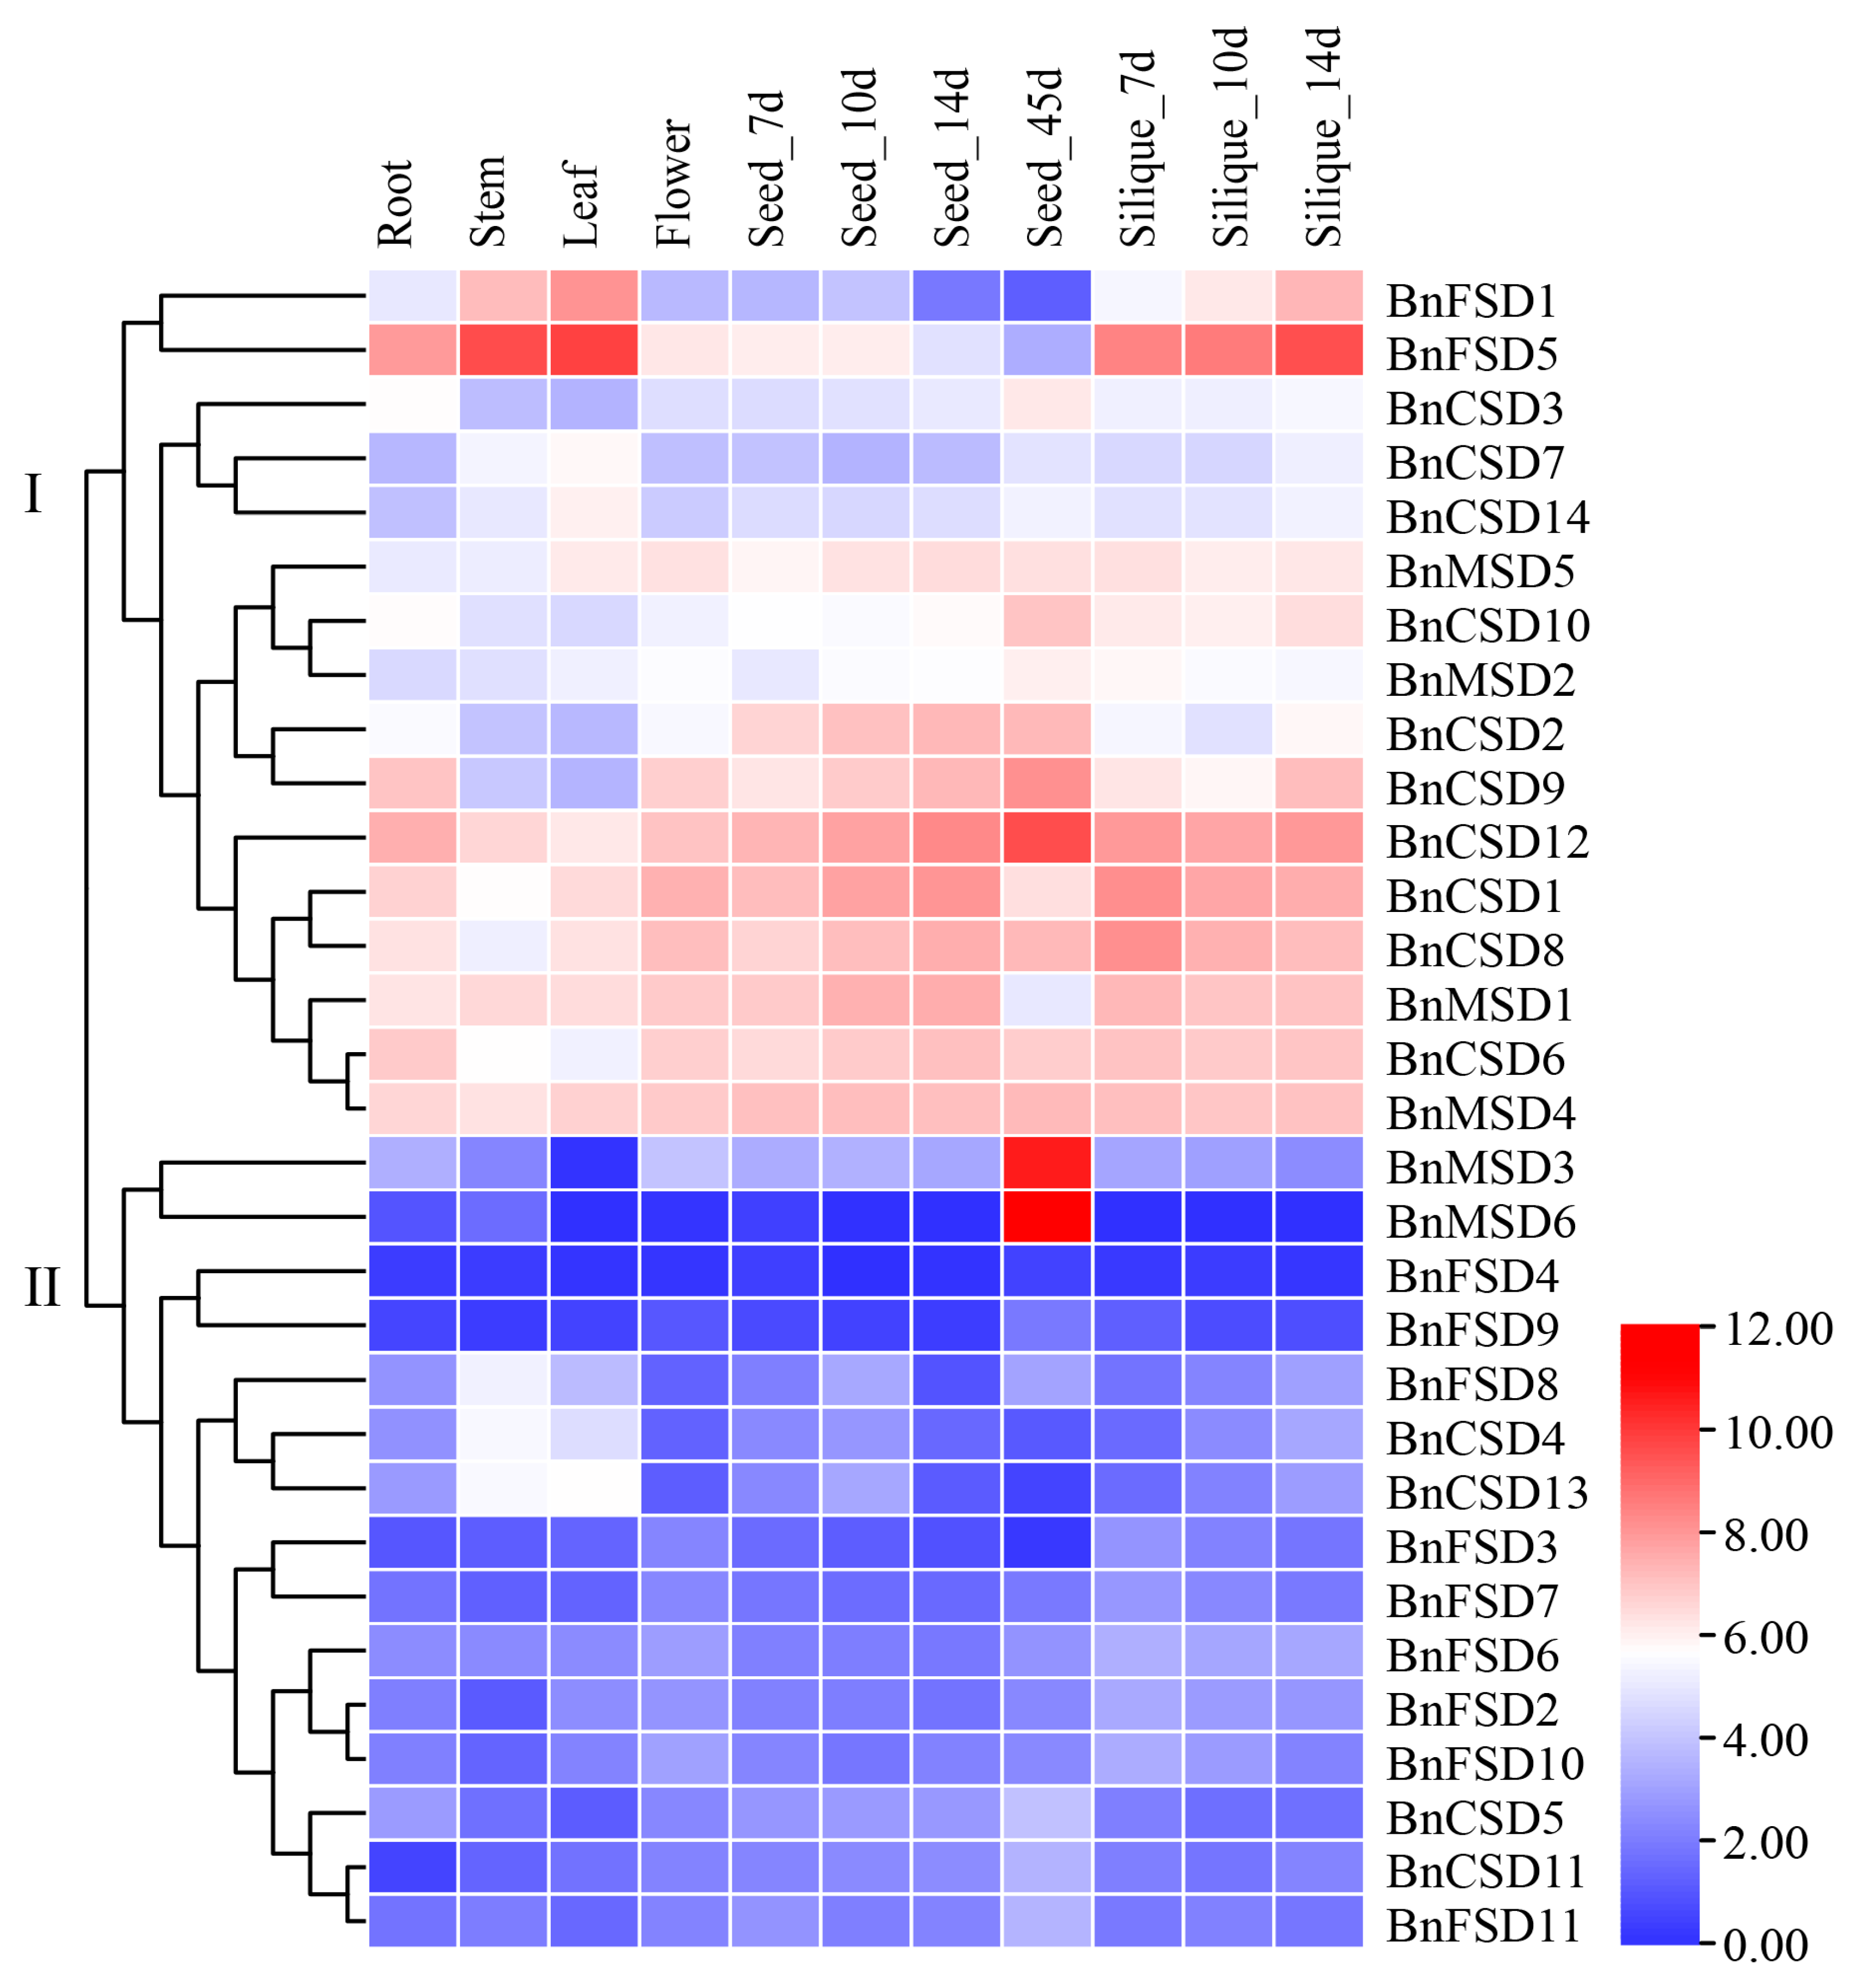
3.8. Expression Analysis of BnSOD Genes in Several Developmental Tissues

Tissue-specific expression levels of BnSODs genes were appraised in six different tissues and organs (including roots, stems, leaves, flowers, seeds, and silique) using RNA-seq data from B. napus (ZS11 variety) (BioProject ID: PRJCA001495). As shown in Figure 7, the group I genes display higher expression in all of the tissues except BnFSD1, BnCSD3, BnCSD7, BnCSD14, BnMSD2, that showed relatively lower expression than other genes (Figure 7). Meanwhile, genes clustered in group II exhibited considerably low expression, whereas BnMSD3 and BnMSD6 showed high expression at the seed_45d stage (Figure 7). Overall, results showed that genes from group I may play significant roles in B. napus growth and development.

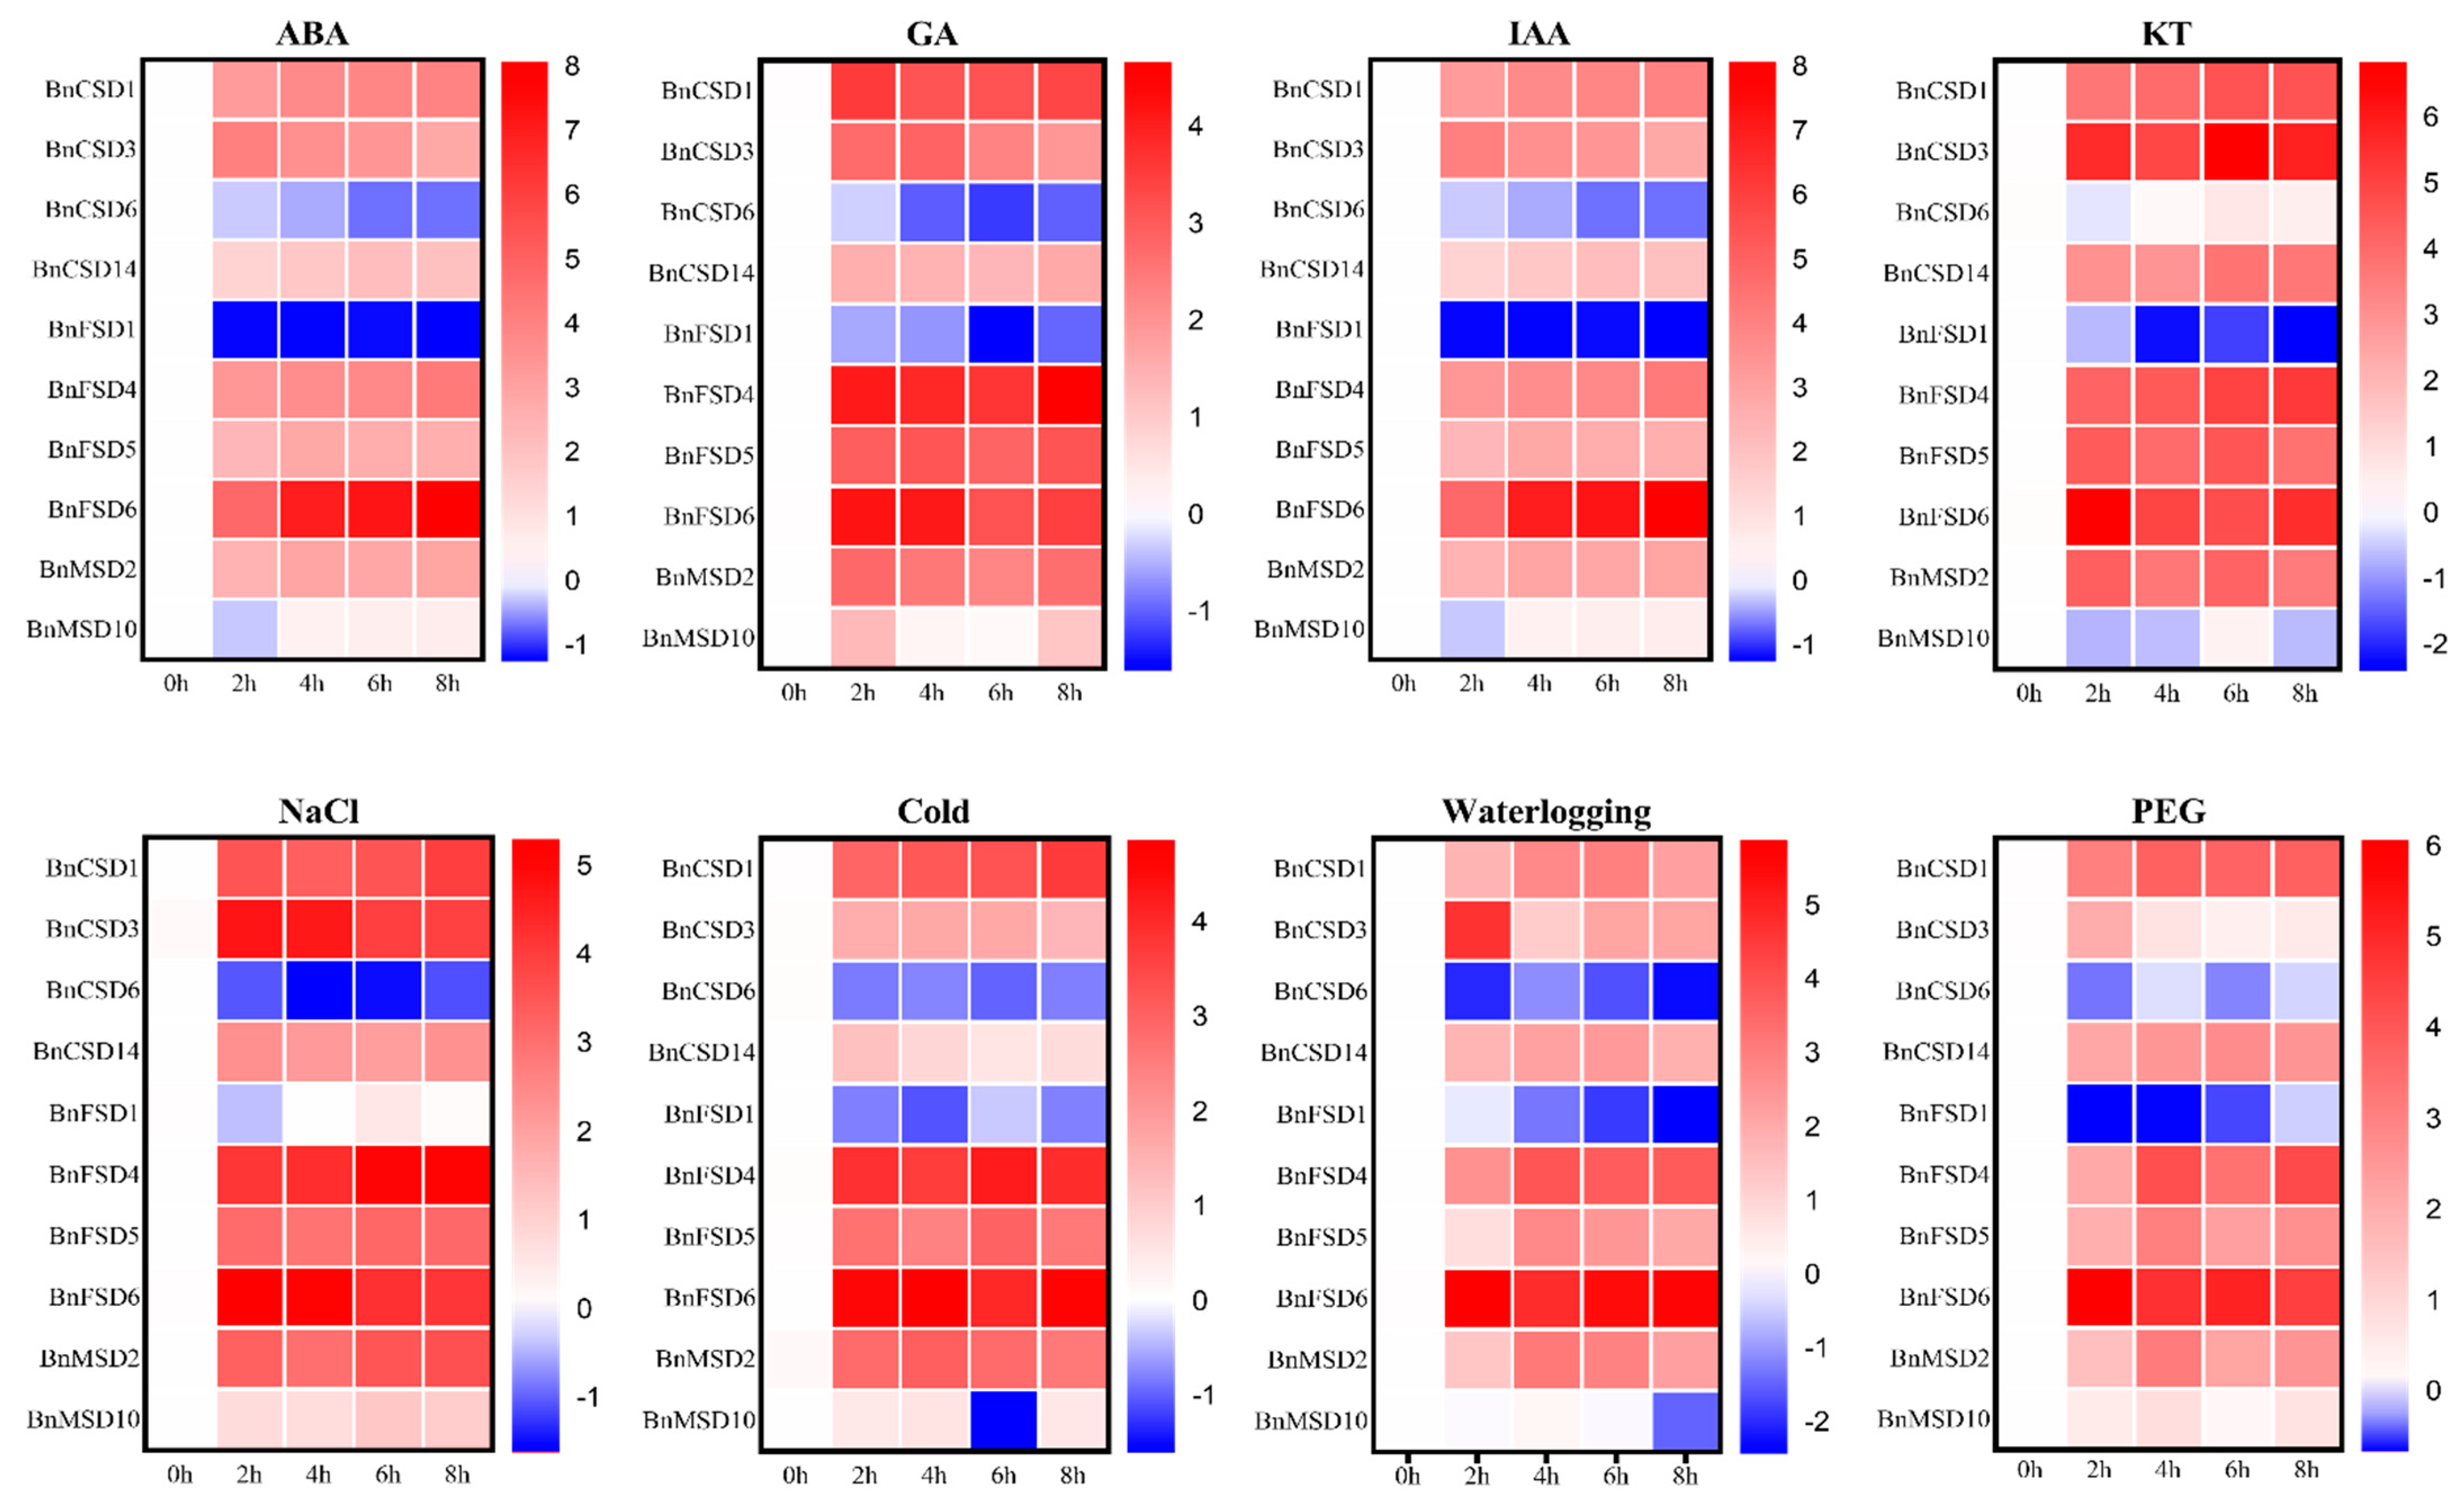
3.9. Expression Profiles of BnSOD Genes under Hormones and Abiotic Stress Treatments

To examine the BnSOD genes’ expression levels under different hormones (ABA, GA, IAA, and KT) and abiotic stress (salinity, cold, waterlogging, and drought) treatments, the qRT-PCR analysis of 10 randomly selected BnSOD genes was applied to govern the transcription profile (Figure 8). Under all of these stress conditions, BnCSD6 and BnFSD1 were down-regulated and showed relatively low expression levels. Likewise, BnMSD10 showed a considerable response to ABA, GA, IAA, salinity, cold, and drought stress at different time points. The other eight genes were significantly up-regulated and showed higher expression to all hormones and abiotic treatments (Figure 8), signifying that these genes may play a significant role in mitigating various hormone and abiotic stresses.

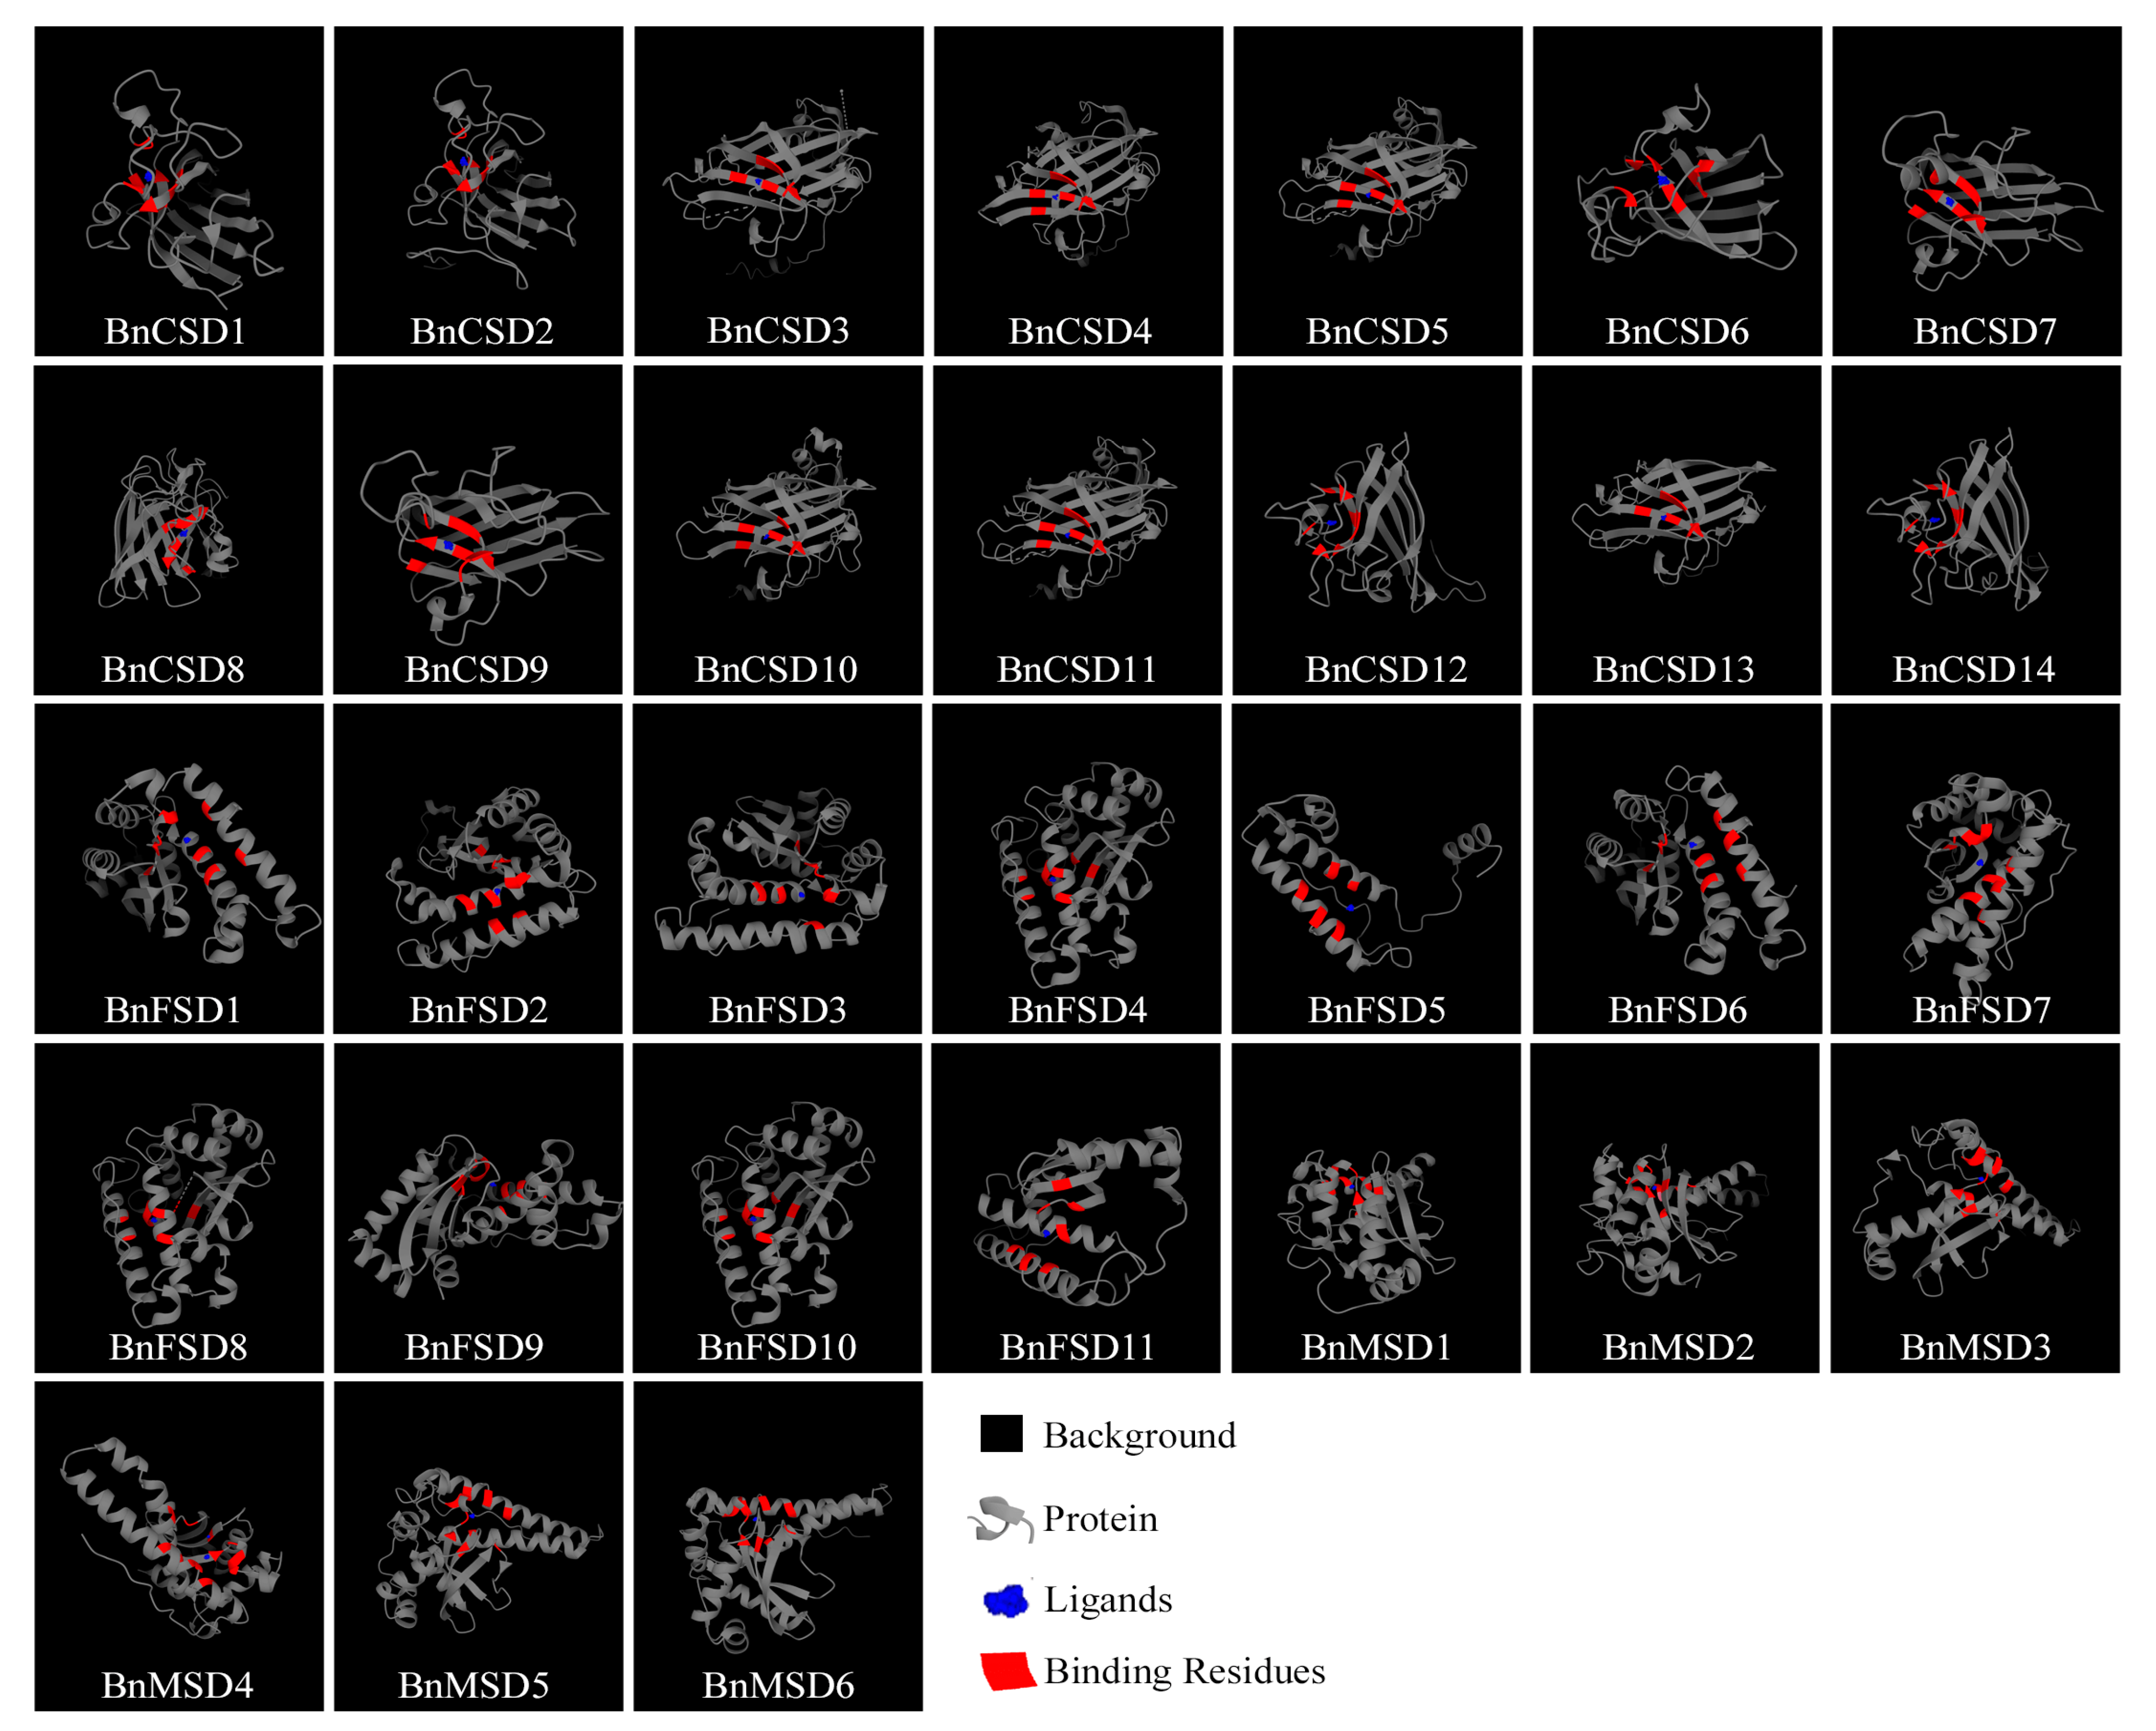
3.10. Prediction of the 3D Structures of BnSODs

The 3D structures of BnSODs proteins were predicted using the 3DLigandSite tool with the default Search probability threshold (80.0%). The created models were downloaded to view the 3D structures (Figure 9). The detailed information of predicted 3D structures is presented in Table S8. The predicted Cu/Zn-SODs (BnCSD1-BnCSD14) model possessed a primarily highly conserved β-barrel structure, including a few short α-helices (Figure 9). The distinctive quaternary model of eukaryotic Cu/ZnSODs proteins contained a β-barrel domain comprised of eight antiparallel β-strands and Cu/Zn binding sites positioned at the exterior of the β-barrel in the active site network [13]. An individual subunit of Cu/ZnSODs proteins, the binding site possessed the Cu/Zn ion ligated by four histidines and important enzymes (such as arginine and alanine) with different conserved residues (Table S8). The conserved disulfide bond residues were examined in the active site channel of Cu/ZnSODs, including Cys202, Cys110, Cys201, and Cys110 in BnCSD3, BnCSD4, BnCSD10, BnCSD13, respectively (Table S8). The remaining Cu/ZnSODs proteins do not possess the Cys–Cys conserved disulfide bonds.
Likewise, the examination of B. napus Fe/MnSODs discovered that the dominant α-helices and β-sheet structures were detected (Figure 9). However, considerable variance in the sum of α-helices was observed and missing the disulfide bonds (exclusive features of Cu/ZnSODs). For instance, the active spot of Mn/FeSODs was positioned among the N- and C-terminal domains, and it varied from that of Cu/ZnSODs as it was comprised of a single metal ion. The metal ion is harmonized in a stressed trigonal bipyramidal geometry through eight–ten amino acid side-chains (including HIS, HIS, TYR, TRP, GLN, ASP, ALA) (Table S8) with solvent molecules. These Mn/FeSODs active sites also comprise hydrogen bonds that spread from the metal-bound solvent molecule to solvent-visible residues at the edge among subunits (Table S8). Additional structural investigation of these amino acids can boost our understanding of the catalytic process and metal ion binding.

4. Discussion

Rapeseed is an allotetraploid crop that experiences extensive genome repetition and integration actions [59]. Nonetheless, rapeseed yield is affected by several abiotic stresses, including cold, heat, salinity, drought, and heavy metals [33,34]. ROS production under typical and stress environments is measured and scavenged through SODs, which act as the primary markers of an enzyme complicated in ROS scavenging, and play a crucial role in plants’ physiological and biochemical procedures to survive with environmental cues [3]. Over the last few years, SOD family genes have been documented in different plant species, such as five SOD genes in Zostera marina [60], seven genes in Medicago truncatula [12] and barley [61], eight genes in sorghum [62], nine genes in tomato [63], ten genes in grapevine [64], 18 genes in cotton [28], 25 genes in banana [65], 26 genes in wheat [66], and 29 genes in B. juncea [67]. Thus far, there is no wide-ranging investigation of the SOD family genes in rapeseed. The obtainability of the whole rapeseed genome permits the genome-wide characterization of the SOD family genes, which may be used for future rapeseed improvement.
In the current study, we identified 31 BnSOD genes, including 14 Cu/Zn-SODs, 11 Fe-SODs, and six Mn-SODs genes (Table 1), which were clustered into three major sets based on the binding domain (Figure 1). So far, this is the largest SOD gene family identified in the rapeseed genome. Changes in the SOD gene numbers among plant species may be accredited to gene repetition events, including tandem and segmental repetitions, and act as a key factor in extending SODs for divergence. Gene doubling of SOD genes was also detected in various plant species [67,68]. Our results showed that BnSODs had experienced segmental duplications (Table S3). Consequently, these outcomes suggested that BnSODs duplication actions might play an important role in gene progression.
Gene structure analysis discovered that the number of exons varied from three to nine, and the number of introns varied from two to eight (Table 1; Figure 4). The Fe-SOD group had five to nine exons and four to eight introns. The Mn-SOD group had six exons and five introns (five genes), and only one gene (BnMSD3) had nine exons and eight introns. In comparison, the group with Cu/Zn-SOD had five to nine exons and two to eight introns (Table 1; Figure 4b). In wheat, seven TaSODs genes were found to have seven introns [66]. In sorghum, intron numbers varied from five to seven [62]. The exon–intron assemblies’ difference was proficient by three critical apparatuses (exon/intron gain/loss, exonization/pseudoexonizationand, insertion/deletion), and they are directly subsidized to structural discrepancy [62,69]. Interestingly, the SOD genes in each cluster presented similar exon–intron association and conserved motifs (Figure 4), signifying that these genes may participate in the same roles connected to numerous abiotic stressors. Comparable findings have also been reported in sorghum [62], tomato [63], cotton [28], and wheat [66].
To better understand the BnSOD genes’ role against several environmental strains, cis-elements in the promoter regions were prophesied. Our results exhibited that three types of cis-elements were recognized: stress-, hormones-, and light-responsive (Figure 5; Table S5). Most of the identified cis-elements were connected with ABA, MeJA, GA, SA, drought, low-temperature, light, and anaerobic induction. According to previous reports, cis-elements subsidize to plant stress responses [70,71]. These consequences were further validated by the GO annotation analysis (Table S7). Moreover, several researchers reported similar findings in different crop plants where SOD genes were found to play a significant part under various stress conditions [62,66,67]. These outcomes can boost our understanding of BnSOD genes under diverse environmental conditions.
Previous investigations have described that SOD genes may show diverse expression levels in tissues and under stress conditions [62,63,72]. Thus, in the current study, tissue-specific expression levels of BnSODs genes were appraised in six different developmental tissues using RNA-seq data (Figure 7), which were in agreement with earlier findings [12,63,66]. Several genes displayed higher expression in all evaluated tissues, indicating that these genes may contribute to rapeseed growth and development. Similarly, the expression levels of 10 BnSOD genes were evaluated under different hormones and abiotic stress treatments (Figure 8). Almost all genes were up-regulated under stress treatments, excluding BnCSD6 and BnFSD1 genes, whose expression levels were down-regulated. These results agreed with previous findings where several SOD genes showed higher expression in response to stresses. For instance, in grapevines, many SODs were up-regulated under cold, heat, salinity, and drought treatment [72]. All SODs were significantly up-regulated in tomatoes under salt and drought stress [63]. In wheat, almost all SODs showed higher expression in response to mannitol, salinity, and drought stress than control conditions [66]. Under cold stress conditions, SOD activity was significantly increased in rapeseed [34]. These findings provided strong evidence that SOD genes play a conserved role in vindicating abiotic stresses in different plant species.
Over the past few years, abundant miRNAs have been recognized through genome-wide examination in rapeseed to participate in diverse environmental factors [73,74,75,76,77]. In the present study, we identified 30 miRNAs from seven families targeting 13 BnSODs genes (Figure 6a; Table S6). In a recent study, 20 miRNAs were predicted to target 14 SOD genes in cotton [28]. Previously, miR398 targeted two Cu/ZnSOD genes in Arabidopsis thaliana [27]. miR166 has been stated to be pointedly up-regulated against UV-B radiation in maize [78]; in cassava against cold and drought stresses [79]; in Chinese cabbage under heat stress conditions [79]. According to recent reports, bna-miR159 plays a vital role in fatty acid metabolism in rapeseed [80,81]. Several members of miR172 have been detected while participating in plant development, including regulation of flowering time and floral patterning [82], and developmental control in A. thaliana [83]. miR394 has been reported to be involved in drought and salinity tolerance in A. thaliana via an ABA-dependent pathway [84]. In another study, miR394 was associated with cold stress responses in A. thaliana [85]. Shortly, these reports support our results and recommend that bna-miRNAs might play pivotal roles against several stresses by altering the transcript levels of SOD genes in rapeseed.
To obtain further insight, we also predicted the 3D structures of BnSODs proteins (Figure 9). The Cu/Zn-SODs (BnCSD1-BnCSD14) models had primarily highly conserved β-barrel structures, including a few short α-helices (Figure 9). According to a recent report, eukaryotic Cu/ZnSODs proteins contain a β-barrel domain comprised of eight antiparallel β-strands and Cu/Zn binding sites positioned at the exterior of the β-barrel in the active site network [13]. In Cu/ZnSODs proteins, the binding site possessed Cu/Zn ions ligated by four histidines and important enzymes (such as arginine and alanine) with different conserved residues (Table S8). These results were in agreement with previously predicted 3D models of SODs in sorghum [62], in Gossypium raimondii, and G. arboretum [86], and in rice [87]. The previous study proved that the binding active site of metal ions and the generation of the conserved disulfide bond in individual subunits would participate in the protein constancy, specificity, and dimer gathering [62,88]. Similarly, conserved residues (including arginine residue) also supported our results, and these residues were considered to be vital players for normal enzymatic movement (Table S8) [88]. Similarly, the Fe/MnSODs models of rapeseed suggested that the β-sheets were conquered by α-helices (Figure 9), and these results were in agreement with recently predicted SOD models in rice [87], soybean [89], and sorghum [62].

5. Conclusions

In the current study, we identified 31 BnSOD genes in the rapeseed genome via genome-wide comprehensive investigation. To boost our understanding, gene structure, phylogenetic and synteny, conserved motifs, cis-elements, GO annotation, miRNA prediction, 3D protein structure, tissue-specific expression, and expression profiling under different hormones and abiotic stress treatments have been performed. The results showed that some genes significantly responded to both hormone and abiotic stress stimuli, enhancing our understanding of the BnSOD genes. Thus, additional investigations are required to confirm the purposeful role of BnSOD genes in rapeseed growth, development, and response to numerous environmental cues.

Supplementary Materials

The following are available online at https://0-www-mdpi-com.brum.beds.ac.uk/article/10.3390/antiox10081182/s1, Table S1: the list primer was used for gene expression analysis by qRT-PCR, Table S2: the protein sequences of SOD family genes in Arabidopsis thaliana, Brassica napus, Brassica oleracea, and Brassica rapa, Table S3: results of segmentally and tandemly duplicated relationships, and Ka, Ks, and Ka/Ks ratio values between B. napus, B. rapa, B. oleracea, and A. thaliana gene pairs, Table S4: the information of identified 12 motifs in BnSOD proteins, Table S5: information of hormone- and stress-related cis-elements detected in the promoter regions of BnSODs, Table S6: information of predicted miRNA targeting BnSOD genes, Table S7: the GO enrichment analysis of BnSOD genes, Table S8: the specifics of predicted BnSODs 3D structures including predicted binding sites, conserved residues, and probability level.

Author Contributions

Conceptualization, A.R. and W.S.; methodology, A.R. and W.S.; software, A.R. and W.S.; formal analysis, A.R., W.S., A.G., Y.Z., Z.J., M.A.H., and S.S.M.; writing—original draft preparation, A.R., W.S., A.G., M.A.H., and S.S.M.; writing—review and editing, A.R., W.S., Y.L., and X.Z.; supervision, Y.C., Y.L. and X.Z.; funding acquisition, Y.L. and X.Z. All authors have read and agreed to the published version of the manuscript.

Funding

This work was supported by the Science and Technology Innovation Project of the Chinese Academy of Agricultural Sciences.

Institutional Review Board Statement

Not applicable.

Informed Consent Statement

Not applicable.

Data Availability Statement

The datasets used and/or analyzed during the current study are shown in the supplementary files. For tissue-specific expression profiling, we downloaded RNA-seq data of rapeseed (BioProject ID: PRJCA001495) from the National Genomics Data Center. The rapeseed genome sequence was downloaded from BnPIR database (http://cbi.hzau.edu.cn/bnapus/index.php, accessed on 1 April 2021). The sequences of Brassica rapa and Brassica oleracea are available at Phytozome database (https://phytozome.jgi.doe.gov/pz/portal.html, accessed on 1 April 2021).

Acknowledgments

We thank all of the members of The Key Lab of Biology and Genetic Improvement of Oil Crops, Oil Crops Research Institute, Chinese Academy of Agricultural Sciences (CAAS), Wuhan, China for their support throughout the study. Further, W.S., A.R., M.A.H., and S.S.M., want to say special thanks to CAAS for providing a Ph.D. Scholarship and research environment.

Conflicts of Interest

The authors declare no conflict of interest.

References

  1. Raza, A.; Razzaq, A.; Mehmood, S.S.; Zou, X.; Zhang, X.; Lv, Y.; Xu, J. Impact of climate change on crops adaptation and strategies to tackle its outcome: A review. Plants 2019, 8, 34. [Google Scholar] [CrossRef] [Green Version]
  2. Raza, A.; Ashraf, F.; Zou, X.; Zhang, X.; Tosif, H. Plant Adaptation and Tolerance to Environmental Stresses: Mechanisms and Perspectives. In Plant Ecophysiology and Adaptation under Climate Change: Mechanisms and Perspectives I; Springer: Singapore, 2020; pp. 117–145. [Google Scholar]
  3. Hasanuzzaman, M.; Bhuyan, M.; Zulfiqar, F.; Raza, A.; Mohsin, S.M.; Mahmud, J.A.; Fujita, M.; Fotopoulos, V. Reactive Oxygen Species and Antioxidant Defense in Plants under Abiotic Stress: Revisiting the Crucial Role of a Universal Defense Regulator. Antioxidants 2020, 9, 681. [Google Scholar] [CrossRef]
  4. Mittler, R. ROS are good. Trends Plant Sci. 2017, 22, 11–19. [Google Scholar] [CrossRef] [Green Version]
  5. Hodgson, E.K.; Fridovich, I. Reversal of the superoxide dismutase reaction. Biochem. Biophys. Res. Commun. 1973, 54, 270–274. [Google Scholar] [CrossRef]
  6. Brawn, K.; Fridovich, I. Superoxide radical and superoxide dismutases: Threat and defense. In Autoxidation in Food and Biological Systems; Springer: Boston, MA, USA, 1980; pp. 429–446. [Google Scholar]
  7. Fink, R.C.; Scandalios, J.G. Molecular evolution and structure–function relationships of the superoxide dismutase gene families in angiosperms and their relationship to other eukaryotic and prokaryotic superoxide dismutases. Arch. Biochem. Biophys. 2002, 399, 19–36. [Google Scholar] [CrossRef]
  8. Abreu, I.A.; Cabelli, D.E. Superoxide dismutases—a review of the metal-associated mechanistic variations. Biochim. Biophys. Acta (BBA)-Proteins Proteom. 2010, 1804, 263–274. [Google Scholar] [CrossRef] [PubMed]
  9. Dupont, C.; Neupane, K.; Shearer, J.; Palenik, B. Diversity, function and evolution of genes coding for putative Ni-containing superoxide dismutases. Environ. Microbiol. 2008, 10, 1831–1843. [Google Scholar] [CrossRef] [PubMed]
  10. Xia, M.; Wang, W.; Yuan, R.; Den, F.; Shen, F. Superoxide dismutase and its research in plant stress-tolerance. Mol. Plant. Breed. 2015, 13, 2633–2646. [Google Scholar]
  11. Zeng, X.; Liu, Z.; Shi, P.; Xu, Y.; Sun, J.; Fang, Y.; Yang, G.; Wu, J.; Kong, D.; Sun, W. Cloning and expression analysis of copper and zinc superoxide dismutase (Cu/Zn-SOD) gene from Brassica campestris L. Acta Agron. Sin. 2014, 40, 636–643. [Google Scholar] [CrossRef]
  12. Song, J.; Zeng, L.; Chen, R.; Wang, Y.; Zhou, Y. In silico identification and expression analysis of superoxide dismutase (SOD) gene family in Medicago truncatula. 3 Biotech. 2018, 8, 1–12. [Google Scholar] [CrossRef]
  13. Perry, J.; Shin, D.; Getzoff, E.; Tainer, J. The structural biochemistry of the superoxide dismutases. Biochim. Biophys. Acta (BBA) Proteins Proteom. 2010, 1804, 245–262. [Google Scholar] [CrossRef] [PubMed] [Green Version]
  14. Alamri, S.; Hu, Y.; Mukherjee, S.; Aftab, T.; Fahad, S.; Raza, A.; Ahmad, M.; Siddiqui, M.H. Silicon-induced postponement of leaf senescence is accompanied by modulation of antioxidative defense and ion homeostasis in mustard (Brassica juncea) seedlings exposed to salinity and drought stress. Plant Physiol. Biochem. 2020, 157, 47–59. [Google Scholar] [CrossRef] [PubMed]
  15. Chokshi, K.; Pancha, I.; Trivedi, K.; Maurya, R.; Ghosh, A.; Mishra, S. Physiological responses of the green microalga Acutodesmus dimorphus to temperature induced oxidative stress conditions. Physiol. Plant 2020, 170, 462–473. [Google Scholar] [CrossRef]
  16. Liu, T.; Ye, X.; Li, M.; Li, J.; Qi, H.; Hu, X. H2O2 and NO are involved in trehalose-regulated oxidative stress tolerance in cold-stressed tomato plants. Environ. Exp. Bot. 2020, 171, 103961. [Google Scholar] [CrossRef]
  17. Mosa, K.A.; El-Naggar, M.; Ramamoorthy, K.; Alawadhi, H.; Elnaggar, A.; Wartanian, S.; Ibrahim, E.; Hani, H. Copper nanoparticles induced genotoxicty, oxidative stress, and changes in Superoxide Dismutase (SOD) gene expression in cucumber (Cucumis sativus) plants. Front. Plant Sci. 2018, 9, 872. [Google Scholar] [CrossRef] [Green Version]
  18. Zhang, L.; Tian, W.; Huang, G.; Liu, B.; Wang, A.; Zhu, J.; Guo, X. The SikCuZnSOD3 gene improves abiotic stress resistance in transgenic cotton. Mol. Breed. 2021, 41, 1–17. [Google Scholar] [CrossRef]
  19. Pour-Aboughadareh, A.; Omidi, M.; Naghavi, M.R.; Etminan, A.; Mehrabi, A.A.; Poczai, P. Wild Relatives of Wheat Respond Well to Water Deficit Stress: A Comparative Study of Antioxidant Enzyme Activities and Their Encoding Gene Expression. Agriculture 2020, 10, 415. [Google Scholar] [CrossRef]
  20. Lv, J.; Zhang, J.; Han, X.; Bai, L.; Xu, D.; Ding, S.; Ge, Y.; Li, C.; Li, J. Genome wide identification of superoxide dismutase (SOD) genes and their expression profiles under 1-methylcyclopropene (1-MCP) treatment during ripening of apple fruit. Sci. Hortic. 2020, 271, 109471. [Google Scholar] [CrossRef]
  21. Cui, C.; Wang, J.-J.; Zhao, J.-H.; Fang, Y.-Y.; He, X.-F.; Guo, H.-S.; Duan, C.-G. A Brassica miRNA Regulates Plant Growth and Immunity through Distinct Modes of Action. Mol. Plant 2020, 13, 231–245. [Google Scholar] [CrossRef]
  22. Khandal, H.; Parween, S.; Roy, R.; Meena, M.K.; Chattopadhyay, D. MicroRNA profiling provides insights into post-transcriptional regulation of gene expression in chickpea root apex under salinity and water deficiency. Sci. Rep. 2017, 7, 1–14. [Google Scholar] [CrossRef] [Green Version]
  23. Ding, Y.; Ding, L.; Xia, Y.; Wang, F.; Zhu, C. Emerging roles of microRNAs in plant heavy metal tolerance and homeostasis. J. Agric. Food Chem. 2020, 68, 1958–1965. [Google Scholar] [CrossRef]
  24. Ravichandran, S.; Ragupathy, R.; Edwards, T.; Domaratzki, M.; Cloutier, S. MicroRNA-guided regulation of heat stress response in wheat. BMC Genom. 2019, 20, 488. [Google Scholar] [CrossRef] [PubMed] [Green Version]
  25. Park, S.-Y.; Grabau, E. Bypassing miRNA-mediated gene regulation under drought stress: Alternative splicing affects CSD1 gene expression. Plant Mol. Biol. 2017, 95, 243–252. [Google Scholar] [CrossRef]
  26. Shi, G.-Q.; Fu, J.-Y.; Rong, L.-J.; Zhang, P.-Y.; Guo, C.-J.; Kai, X. TaMIR1119, a miRNA family member of wheat (Triticum aestivum), is essential in the regulation of plant drought tolerance. J. Integr. Agric. 2018, 17, 2369–2378. [Google Scholar] [CrossRef] [Green Version]
  27. Beauclair, L.; Yu, A.; Bouché, N. microRNA-directed cleavage and translational repression of the copper chaperone for superoxide dismutase mRNA in Arabidopsis. Plant J. 2010, 62, 454–462. [Google Scholar] [CrossRef]
  28. Wang, W.; Zhang, X.; Deng, F.; Yuan, R.; Shen, F. Genome-wide characterization and expression analyses of superoxide dismutase (SOD) genes in Gossypium hirsutum. BMC Genom. 2017, 18, 1–25. [Google Scholar] [CrossRef] [Green Version]
  29. Li, Q.; Jin, X.; Zhu, Y.-X. Identification and analyses of miRNA genes in allotetraploid Gossypium hirsutum fiber cells based on the sequenced diploid G. raimondii genome. J. Genet. Genom. 2012, 39, 351–360. [Google Scholar] [CrossRef]
  30. Zhang, B.; Wang, Q.; Wang, K.; Pan, X.; Liu, F.; Guo, T.; Cobb, G.P.; Anderson, T.A. Identification of cotton microRNAs and their targets. Gene 2007, 397, 26–37. [Google Scholar] [CrossRef] [PubMed]
  31. Yang, X.; Wang, L.; Yuan, D.; Lindsey, K.; Zhang, X. Small RNA and degradome sequencing reveal complex miRNA regulation during cotton somatic embryogenesis. J. Exp. Bot. 2013, 64, 1521–1536. [Google Scholar] [CrossRef]
  32. Sunkar, R.; Kapoor, A.; Zhu, J.-K. Posttranscriptional induction of two Cu/Zn superoxide dismutase genes in Arabidopsis is mediated by downregulation of miR398 and important for oxidative stress tolerance. Plant Cell 2006, 18, 2051–2065. [Google Scholar] [CrossRef] [Green Version]
  33. Raza, A. Eco-physiological and Biochemical Responses of Rapeseed (Brassica napus L.) to Abiotic Stresses: Consequences and Mitigation Strategies. J. Plant Growth Regul. 2020, 40, 1368–1388. [Google Scholar] [CrossRef]
  34. He, H.; Lei, Y.; Yi, Z.; Raza, A.; Zeng, L.; Yan, L.; Xiaoyu, D.; Yong, C.; Xiling, Z. Study on the mechanism of exogenous serotonin improving cold tolerance of rapeseed (Brassica napus L.) seedlings. Plant Growth Regul. 2021, 94, 161–170. [Google Scholar] [CrossRef]
  35. Mehmood, S.S.; Lu, G.; Luo, D.; Hussain, M.A.; Raza, A.; Zafar, Z.; Zhang, X.; Cheng, Y.; Zou, X.; Lv, Y. Integrated Analysis of Transcriptomics and Proteomics provides insights into the molecular regulation of cold response in Brassica napus. Environ. Exp. Bot. 2021, 187, 104480. [Google Scholar] [CrossRef]
  36. Raza, A.; Razzaq, A.; Mehmood, S.S.; Hussain, M.A.; Wei, S.; He, H.; Zaman, Q.U.; Xuekun, Z.; Hasanuzzaman, M. Omics: The way forward to enhance abiotic stress tolerance in Brassica napus L. GM Crop. Food 2021, 12, 251–281. [Google Scholar] [CrossRef]
  37. Raza, A.; Su, W.; Gao, A.; Mehmood, S.S.; Hussain, M.A.; Nie, W.; Lv, Y.; Zou, X.; Zhang, X. Catalase (CAT) Gene Family in Rapeseed (Brassica napus L.): Genome-Wide Analysis, Identification, and Expression Pattern in Response to Multiple Hormones and Abiotic Stress Conditions. Inter. J. Mol. Sci. 2021, 22, 4281. [Google Scholar] [CrossRef]
  38. Song, J.M.; Liu, D.X.; Xie, W.Z.; Yang, Z.; Guo, L.; Liu, K.; Yang, Q.Y.; Chen, L.L. BnPIR: Brassica napus Pan-genome Information Resource for 1,689 accessions. Plant Biotechnol. J. 2021, 19, 412. [Google Scholar] [CrossRef]
  39. Rhee, S.Y.; Beavis, W.; Berardini, T.Z.; Chen, G.; Dixon, D.; Doyle, A.; Garcia-Hernandez, M.; Huala, E.; Lander, G.; Montoya, M. The Arabidopsis Information Resource (TAIR): A model organism database providing a centralized, curated gateway to Arabidopsis biology, research materials and community. Nucleic Acids Res. 2003, 31, 224–228. [Google Scholar] [CrossRef] [PubMed] [Green Version]
  40. Finn, R.D.; Clements, J.; Arndt, W.; Miller, B.L.; Wheeler, T.J.; Schreiber, F.; Bateman, A.; Eddy, S.R. HMMER web server: 2015 update. Nucleic Acids Res. 2015, 43, W30–W38. [Google Scholar] [CrossRef] [PubMed]
  41. El-Gebali, S.; Mistry, J.; Bateman, A.; Eddy, S.R.; Luciani, A.; Potter, S.C.; Qureshi, M.; Richardson, L.J.; Salazar, G.A.; Smart, A. The Pfam protein families database in 2019. Nucleic Acids Res. 2019, 47, D427–D432. [Google Scholar] [CrossRef] [PubMed]
  42. Goodstein, D.M.; Shu, S.; Howson, R.; Neupane, R.; Hayes, R.D.; Fazo, J.; Mitros, T.; Dirks, W.; Hellsten, U.; Putnam, N. Phytozome: A comparative platform for green plant genomics. Nucleic Acids Res. 2012, 40, D1178–D1186. [Google Scholar] [CrossRef] [PubMed]
  43. Gasteiger, E.; Hoogland, C.; Gattiker, A.; Wilkins, M.R.; Appel, R.D.; Bairoch, A. Protein identification and analysis tools on the ExPASy server. In The Proteomics Protocols Handbook; Humana Press Inc.: Totowa, NJ, USA, 2005; pp. 571–607. [Google Scholar]
  44. Horton, P.; Park, K.-J.; Obayashi, T.; Fujita, N.; Harada, H.; Adams-Collier, C.; Nakai, K. WoLF PSORT: Protein localization predictor. Nucleic Acids Res. 2007, 35, W585–W587. [Google Scholar] [CrossRef] [Green Version]
  45. Chen, C.; Chen, H.; Zhang, Y.; Thomas, H.R.; Frank, M.H.; He, Y.; Xia, R. TBtools: An integrative toolkit developed for interactive analyses of big biological data. Mol. Plant 2020, 13, 1194–1202. [Google Scholar] [CrossRef]
  46. Bailey, T.L.; Boden, M.; Buske, F.A.; Frith, M.; Grant, C.E.; Clementi, L.; Ren, J.; Li, W.W.; Noble, W.S. MEME SUITE: Tools for motif discovery and searching. Nucleic Acids Res. 2009, 37, W202–W208. [Google Scholar] [CrossRef] [PubMed]
  47. Kumar, S.; Stecher, G.; Li, M.; Knyaz, C.; Tamura, K. MEGA X: Molecular evolutionary genetics analysis across computing platforms. Mol. Biol. Evol. 2018, 35, 1547–1549. [Google Scholar] [CrossRef] [PubMed]
  48. Subramanian, B.; Gao, S.; Lercher, M.J.; Hu, S.; Chen, W.-H. Evolview v3: A webserver for visualization, annotation, and management of phylogenetic trees. Nucleic Acids Res. 2019, 47, W270–W275. [Google Scholar] [CrossRef]
  49. Tang, H.; Bowers, J.E.; Wang, X.; Ming, R.; Alam, M.; Paterson, A.H. Synteny and collinearity in plant genomes. Science 2008, 320, 486–488. [Google Scholar] [CrossRef] [PubMed] [Green Version]
  50. Wang, D.; Zhang, Y.; Zhang, Z.; Zhu, J.; Yu, J. KaKs_Calculator 2.0: A toolkit incorporating gamma-series methods and sliding window strategies. Genom. Proteom. Bioinform. 2010, 8, 77–80. [Google Scholar] [CrossRef] [Green Version]
  51. Lescot, M.; Déhais, P.; Thijs, G.; Marchal, K.; Moreau, Y.; Van de Peer, Y.; Rouzé, P.; Rombauts, S. PlantCARE, a database of plant cis-acting regulatory elements and a portal to tools for in silico analysis of promoter sequences. Nucleic Acids Res. 2002, 30, 325–327. [Google Scholar] [CrossRef] [PubMed]
  52. Dai, X.; Zhuang, Z.; Zhao, P.X. psRNATarget: A plant small RNA target analysis server (2017 release). Nucleic Acids Res. 2018, 46, W49–W54. [Google Scholar] [CrossRef] [Green Version]
  53. Powell, S.; Forslund, K.; Szklarczyk, D.; Trachana, K.; Roth, A.; Huerta-Cepas, J.; Gabaldon, T.; Rattei, T.; Creevey, C.; Kuhn, M. eggNOG v4. 0: Nested orthology inference across 3686 organisms. Nucleic Acids Res. 2014, 42, D231–D239. [Google Scholar] [CrossRef]
  54. Swift, M.L. GraphPad prism, data analysis, and scientific graphing. J. Chem. Inform. Comput. Sci. 1997, 37, 411–412. [Google Scholar] [CrossRef]
  55. Wass, M.N.; Kelley, L.A.; Sternberg, M.J. 3DLigandSite: Predicting ligand-binding sites using similar structures. Nucleic Acids Res. 2010, 38, W469–W473. [Google Scholar] [CrossRef] [Green Version]
  56. Cannon, S.B.; Mitra, A.; Baumgarten, A.; Young, N.D.; May, G. The roles of segmental and tandem gene duplication in the evolution of large gene families in Arabidopsis thaliana. BMC Plant Biol. 2004, 4, 1–21. [Google Scholar] [CrossRef] [Green Version]
  57. Hurst, L.D. The Ka/Ks ratio: Diagnosing the form of sequence evolution. Trends Genet. 2002, 18, 486. [Google Scholar] [CrossRef]
  58. Xu, X.; Yang, Y.; Liu, C.; Sun, Y.; Zhang, T.; Hou, M.; Huang, S.; Yuan, H. The evolutionary history of the sucrose synthase gene family in higher plants. BMC Plant Biol. 2019, 19, 1–14. [Google Scholar] [CrossRef] [Green Version]
  59. Song, J.-M.; Guan, Z.; Hu, J.; Guo, C.; Yang, Z.; Wang, S.; Liu, D.; Wang, B.; Lu, S.; Zhou, R. Eight high-quality genomes reveal pan-genome architecture and ecotype differentiation of Brassica napus. Nat. Plants 2020, 6, 34–45. [Google Scholar] [CrossRef] [PubMed]
  60. Zang, Y.; Chen, J.; Li, R.; Shang, S.; Tang, X. Genome-wide analysis of the superoxide dismutase (SOD) gene family in Zostera marina and expression profile analysis under temperature stress. PeerJ 2020, 8, e9063. [Google Scholar] [CrossRef] [PubMed]
  61. Zhang, X.; Zhang, L.; Chen, Y.; Wang, S.; Fang, Y.; Zhang, X.; Wu, Y.; Xue, D. Genome-wide identification of the SOD gene family and expression analysis under drought and salt stress in barley. Plant Growth Regul. 2021, 94, 49–60. [Google Scholar] [CrossRef]
  62. Filiz, E.; Tombuloğlu, H. Genome-wide distribution of superoxide dismutase (SOD) gene families in Sorghum bicolor. Turk. J. Biol. 2015, 39, 49–59. [Google Scholar] [CrossRef]
  63. Feng, K.; Yu, J.; Cheng, Y.; Ruan, M.; Wang, R.; Ye, Q.; Zhou, G.; Li, Z.; Yao, Z.; Yang, Y. The SOD gene family in tomato: Identification, phylogenetic relationships, and expression patterns. Front. Plant Sci. 2016, 7, 1279. [Google Scholar] [CrossRef] [Green Version]
  64. Hu, X.; Hao, C.; Cheng, Z.-M.; Zhong, Y. Genome-wide identification, characterization, and expression analysis of the grapevine superoxide dismutase (SOD) family. Inter. J. Genom. 2019, 2019, 7350414. [Google Scholar] [CrossRef]
  65. Feng, X.; Lai, Z.; Lin, Y.; Lai, G.; Lian, C. Genome-wide identification and characterization of the superoxide dismutase gene family in Musa acuminata cv. Tianbaojiao (AAA group). BMC Genom. 2015, 16, 1–16. [Google Scholar] [CrossRef] [PubMed] [Green Version]
  66. Jiang, W.; Yang, L.; He, Y.; Zhang, H.; Li, W.; Chen, H.; Ma, D.; Yin, J. Genome-wide identification and transcriptional expression analysis of superoxide dismutase (SOD) family in wheat (Triticum aestivum). PeerJ 2019, 7, e8062. [Google Scholar] [CrossRef] [PubMed] [Green Version]
  67. Verma, D.; Lakhanpal, N.; Singh, K. Genome-wide identification and characterization of abiotic-stress responsive SOD (superoxide dismutase) gene family in Brassica juncea and B. rapa. BMC Genom. 2019, 20, 1–18. [Google Scholar] [CrossRef] [PubMed] [Green Version]
  68. Wang, W.; Xia, M.; Chen, J.; Deng, F.; Yuan, R.; Zhang, X.; Shen, F. Data set for phylogenetic tree and RAMPAGE Ramachandran plot analysis of SODs in Gossypium raimondii and G. arboreum. Data Brief. 2016, 9, 345–348. [Google Scholar] [CrossRef] [Green Version]
  69. Xu, G.; Guo, C.; Shan, H.; Kong, H. Divergence of duplicate genes in exon–intron structure. Proc. Nati. Acad. Sci. USA 2012, 109, 1187–1192. [Google Scholar] [CrossRef] [Green Version]
  70. Osakabe, Y.; Yamaguchi-Shinozaki, K.; Shinozaki, K.; Tran, L.S.P. ABA control of plant macroelement membrane transport systems in response to water deficit and high salinity. New Phytol. 2014, 202, 35–49. [Google Scholar] [CrossRef]
  71. Maruyama-Nakashita, A.; Nakamura, Y.; Watanabe-Takahashi, A.; Inoue, E.; Yamaya, T.; Takahashi, H. Identification of a novel cis-acting element conferring sulfur deficiency response in Arabidopsis roots. Plant J. 2005, 42, 305–314. [Google Scholar] [CrossRef]
  72. Zhou, Y.; Hu, L.; Wu, H.; Jiang, L.; Liu, S. Genome-wide identification and transcriptional expression analysis of cucumber superoxide dismutase (SOD) family in response to various abiotic stresses. Inter. J. Genom. 2017, 2017, 7243973. [Google Scholar] [CrossRef]
  73. Chen, L.; Chen, L.; Zhang, X.; Liu, T.; Niu, S.; Wen, J.; Yi, B.; Ma, C.; Tu, J.; Fu, T. Identification of miRNAs that regulate silique development in Brassica napus. Plant Sci. 2018, 269, 106–117. [Google Scholar] [CrossRef]
  74. Buhtz, A.; Springer, F.; Chappell, L.; Baulcombe, D.C.; Kehr, J. Identification and characterization of small RNAs from the phloem of Brassica napus. Plant J. 2008, 53, 739–749. [Google Scholar] [CrossRef]
  75. Fu, Y.; Mason, A.S.; Zhang, Y.; Lin, B.; Xiao, M.; Fu, D.; Yu, H. MicroRNA-mRNA expression profiles and their potential role in cadmium stress response in Brassica napus. BMC Plant Biol. 2019, 19, 1–20. [Google Scholar] [CrossRef]
  76. Körbes, A.P.; Machado, R.D.; Guzman, F.; Almerao, M.P.; de Oliveira, L.F.V.; Loss-Morais, G.; Turchetto-Zolet, A.C.; Cagliari, A.; dos Santos Maraschin, F.; Margis-Pinheiro, M. Identifying conserved and novel microRNAs in developing seeds of Brassica napus using deep sequencing. PLoS ONE 2012, 7, e50663. [Google Scholar] [CrossRef]
  77. Shen, E.; Zou, J.; Hubertus Behrens, F.; Chen, L.; Ye, C.; Dai, S.; Li, R.; Ni, M.; Jiang, X.; Qiu, J. Identification, evolution, and expression partitioning of miRNAs in allopolyploid Brassica napus. J. Exp. Bot. 2015, 66, 7241–7253. [Google Scholar] [CrossRef] [Green Version]
  78. Casati, P. Analysis of UV-B regulated miRNAs and their targets in maize leaves. Plant Signal. Behav. 2013, 8, e26758. [Google Scholar] [CrossRef] [PubMed] [Green Version]
  79. Li, S.; Yu, X.; Lei, N.; Cheng, Z.; Zhao, P.; He, Y.; Wang, W.; Peng, M. Genome-wide identification and functional prediction of cold and/or drought-responsive lncRNAs in cassava. Sci. Rep. 2017, 7, 45981. [Google Scholar] [CrossRef] [PubMed]
  80. Wang, Z.; Qiao, Y.; Zhang, J.; Shi, W.; Zhang, J. Genome wide identification of microRNAs involved in fatty acid and lipid metabolism of Brassica napus by small RNA and degradome sequencing. Gene 2017, 619, 61–70. [Google Scholar] [CrossRef] [PubMed]
  81. Wang, J.; Jian, H.; Wang, T.; Wei, L.; Li, J.; Li, C.; Liu, L. Identification of microRNAs actively involved in fatty acid biosynthesis in developing Brassica napus seeds using high-throughput sequencing. Front. Plant Sci. 2016, 7, 1570. [Google Scholar] [CrossRef] [Green Version]
  82. Zhu, Q.-H.; Helliwell, C.A. Regulation of flowering time and floral patterning by miR172. J. Exp. Bot. 2011, 62, 487–495. [Google Scholar] [CrossRef] [Green Version]
  83. Wu, G.; Park, M.Y.; Conway, S.R.; Wang, J.-W.; Weigel, D.; Poethig, R.S. The sequential action of miR156 and miR172 regulates developmental timing in Arabidopsis. Cell 2009, 138, 750–759. [Google Scholar] [CrossRef] [PubMed] [Green Version]
  84. Song, J.B.; Gao, S.; Sun, D.; Li, H.; Shu, X.X.; Yang, Z.M. miR394 and LCR are involved in Arabidopsis salt and drought stress responses in an abscisic acid-dependent manner. BMC Plant Biol. 2013, 13, 1–16. [Google Scholar] [CrossRef] [PubMed] [Green Version]
  85. Song, J.B.; Gao, S.; Wang, Y.; Li, B.W.; Zhang, Y.L.; Yang, Z.M. miR394 and its target gene LCR are involved in cold stress response in Arabidopsis. Plant Gene 2016, 5, 56–64. [Google Scholar] [CrossRef] [Green Version]
  86. Wang, W.; Xia, M.; Chen, J.; Deng, F.; Yuan, R.; Zhang, X.; Shen, F. Genome-wide analysis of superoxide dismutase gene family in Gossypium raimondii and G. arboreum. Plant Gene 2016, 6, 18–29. [Google Scholar] [CrossRef] [Green Version]
  87. Dehury, B.; Sarma, K.; Sarmah, R.; Sahu, J.; Sahoo, S.; Sahu, M.; Sen, P.; Modi, M.K.; Sharma, G.D.; Choudhury, M.D. In silico analyses of superoxide dismutases (SODs) of rice (Oryza sativa L.). J. Plant Biochem. Biotechnol. 2013, 22, 150–156. [Google Scholar] [CrossRef]
  88. Fisher, C.L.; Cabelli, D.E.; Tainer, J.A.; Hallewell, R.A.; Getzoff, E.D. The role of arginine 143 in the electrostatics and mechanism of Cu, Zn superoxide dismutase: Computational and experimental evaluation by mutational analysis. Proteins Struct. Funct. Bioinform. 1994, 19, 24–34. [Google Scholar] [CrossRef] [PubMed]
  89. Ramana Gopavajhula, V.; Viswanatha Chaitanya, K.; Akbar Ali Khan, P.; Shaik, J.P.; Narasimha Reddy, P.; Alanazi, M. Modeling and analysis of soybean (Glycine max. L) Cu/Zn, Mn and Fe superoxide dismutases. Genet. Mol. Biol. 2013, 36, 225–236. [Google Scholar] [CrossRef]
Figure 1. A neighbor-joining phylogenetic tree of 53 SOD proteins from B. napus, B. oleracea, B. rapa, and A. thaliana. Overall, 31 BnSODs (red triangle), 12 BolSODs (blue star), 12 BraSODs (green box), and 8 AtSODs (yellow circles) were grouped into three groups based on domain and 1000 bootstrap values. All of the notes indicate the percentage of bootstrap values.
Antioxidants 10 01182 g001
Figure 2. Chromosomal locations and inter-chromosomal associations of BnSOD genes. Grey lines in the background display all syntenic blocks in the B. napus genome, and the red lines display syntenic BnSODs gene pairs.
Antioxidants 10 01182 g002
Figure 3. Collinearity analysis of SOD genes in B. napus, B. rapa, B. oleracea, and A. thaliana chromosomes. Grey lines in the background show the collinear blocks within B. napus and other plant genomes, whereas the red and green lines represent the syntenic SOD gene pairs. Genes located on the B. napus A subgenome are syntenic with B. rapa, B. oleracea, and A. thaliana, whereas genes located on B. napus C subgenome are mainly syntenic with B. oleracea and A. thaliana except for one gene that showed a syntenic relationship with B. rapa and A. thaliana.
Antioxidants 10 01182 g003
Figure 4. The gene structure and motif analysis of BnSODs. (a) Based on phylogenetic relationships and domain identification, the BnSODs were grouped into three groups. (b) Gene structure of BnSODs. The blue-gray color represents UTR regions, the light green color represents CDS or exons, the yellow color represents Sod_Fe_N, the pink color represents Sod_Fe_C, the red color represents Sod_Cu, and the black horizontal line represents introns. (c) Conserved motif compositions identified in BnSODs. Different color boxes denote different motifs.
Antioxidants 10 01182 g004
Figure 5. Analysis of cis-regulatory elements in the BnSODs promoter regions. Different cis-elements with functional similarity are denoted by similar colors.
Antioxidants 10 01182 g005
Figure 6. miRNA targeting BnSOD genes. (a) Network diagram of predicted miRNA targeting BnSODs genes. Different diamond colors represent BnSODs genes, and gray ellipse shapes represent miRNAs. (b) Schematic illustration indicates the BnSODs targeted by miRNAs. The RNA sequence of each complementary site from 5’-3’ and the predicted miRNA sequence from 3’-5’ are exposed in the long-drawn-out areas. See Table S6 for the detailed data of all predicted miRNAs.
Antioxidants 10 01182 g006
Figure 7. Expression analysis of BnSOD genes in several developmental organs. The 7d, 10d, 14d, and 45d tags indicate the time-points when the samples were harvested. In the expression bar, the red color shows high, and the blue color shows low, expression levels. The expression heat map was created using transcripts per million (TPM) values.
Antioxidants 10 01182 g007
Figure 8. BnSOD gene expression levels under different hormone and abiotic stress conditions at different time points (0 (CK), 2, 4, 6, and 8 h). The expression bars display the comparative gene expression trends based on the log2 fold change values. In the expression bar, the red color displays high, and the blue color displays low, expression levels.
Antioxidants 10 01182 g008
Figure 9. Predicted 3D structures and binding sites of BnSODs proteins using a 3DLigandSite tool. See Table 1 for the complete protein information, including subcellular location. See Table S8 for the complete information of the predicted 3D models, including predicted binding sites, conserved residues, and probability levels.
Antioxidants 10 01182 g009
Table 1. The data of 31 SOD genes identified in rapeseed genome.
Gene IDGene NameGenomic Position (bp)Gene Length (bp)CDS Length (bp)ExonsProtein Length (Amino Acids)Molecular Weight (kDa)Isoelectric Point (pI)Subcellular Localization
BnaA04T0182200ZSBnCSD1A04-18599782:18600942 (+)1160639621222.157.16Chloroplast
BnaA06T0053200ZSBnCSD2A06-3364923:3368393 (+)34701173939042.348.71Cytoskeleton
BnaA08T0278700ZSBnCSD3A08-26336887:26338407 (+)1520954631733.765.19Chloroplast
BnaA09T0129500ZSBnCSD4A09-7757584:7758410 (−)826660321923.605.95Chloroplast
BnaA09T0647100ZSBnCSD5A09-61965958:61967448 (+)1490954631733.455.26Chloroplast
BnaA09T0664700ZSBnCSD6A09-62938095:62939938 (−)1843459815215.175.64Cytoskeleton
BnaA10T0190600ZSBnCSD7A01-21329437:21330797 (−)1360465615415.947.12Cytoskeleton
BnaC04T0482300ZSBnCSD8C04-60854831:60856275 (+)1444627620821.607.84Chloroplast
BnaC05T0066000ZSBnCSD9C05-3767908:3769181 (+)1273441714614.555.44Cytoskeleton
BnaC08T0217500ZSBnCSD10C08-32001876:32003366 (−)1490951531633.716.91Chloroplast
BnaC08T0505400ZSBnCSD11C08-51947641:51949188 (+)1547957631833.584.97Chloroplast
BnaC08T0529200ZSBnCSD12C08-53323394:53325251 (−)1857672722323.426.66Cytoskeleton
BnaC09T0137500ZSBnCSD13C09-10172656:10173492 (−)836660321923.726.83Chloroplast
BnaC09T0484500ZSBnCSD14C09-59599637:59601046 (−)1409510616917.636.82Cytoskeleton
BnaA01T0146300ZSBnFSD1A01-8654405:8657035 (−)2630561618621.126.06Cytoskeleton
BnaA03T0141400ZSBnFSD2A03-7188761:7190553 (+)1792906830134.514.97Chloroplast
BnaA06T0320600ZS.1BnFSD3A06-40740605:40744473 (+)3868879929233.607.58Chloroplast
BnaA09T0072700ZSBnFSD4A09-4315462:4316968 (−)1506792826330.167.76Chloroplast
BnaA10T0083700ZSBnFSD5A10-13303579:13310477 (−)6898738624528.029.44Mitochondrion
BnaC01T0186100ZSBnFSD6C01-13777631:13779146 (−)1515618520522.996.3Cytoskeleton
BnaC03T0164000ZSBnFSD7C03-9109698:9111720 (+)2022903930034.394.88Chloroplast
BnaC07T0373300ZSBnFSD8C07-49894566:49896148 (−)1582780625929.588.58Chloroplast
BnaC07T0462000ZSBnFSD9C07-55868729:55870093 (−)1364648521524.176.65Endoplasmic reticulum
BnaC09T0062700ZSBnFSD10C09-4091989:4094054 (−)2065783826029.726.66Chloroplast
BnaC09T0329400ZSBnFSD11C09-41111988:41116227 (−)42391077735840.408.8Chloroplast
BnaA01T0376200ZSBnMSD1A01-33774266:33775498 (−)1232699623225.508.38Mitochondrion
BnaA05T0446100ZSBnMSD2A05-41549634:41550932 (−)1298696623125.418.47Mitochondrion
BnaA09T0519400ZSBnMSD3A09-55258451:55262461 (−)4010966932135.609.56Cytoskeleton
BnaC01T0471300ZSBnMSD4C01-53548352:53549620 (−)1268693623025.368.94Mitochondrion
BnaC05T0492700ZSBnMSD5C05-53531802:53533097 (−)1295696623125.437.83Mitochondrion
BnaC08T0362400ZSBnMSD6C08-43431847:43433140 (−)1293729624227.116.14Endoplasmic reticulum
In the genomic position, the positive (+) and negative (−) sign shows the presence of a gene on the positive and negative strand of that specific marker correspondingly. CSD means Cu/Zn-SOD; FSD means Fe-SOD; and MSD means Mn-SOD.
Publisher’s Note: MDPI stays neutral with regard to jurisdictional claims in published maps and institutional affiliations.

