Fluid Intake and Beverage Consumption Description and Their Association with Dietary Vitamins and Antioxidant Compounds in Italian Adults from the Mediterranean Healthy Eating, Aging and Lifestyles (MEAL) Study

Abstract
:1. Introduction
2. Materials and Methods
2.1. Study Design and Population
2.2. Data Collection
2.3. Dietary Assessment
2.4. Statistical Analysis
3. Results
4. Discussion
5. Conclusions
Author Contributions
Conflicts of Interest
References
- Arnaud, M.J. Hydration Throughout Life: International Conference, Vittel, France, June 9–12, 1998; John Libbey Eurotext: Montrouge, France, 1998. [Google Scholar]
- Watson, P.; Whale, A.; Mears, S.A.; Reyner, L.A.; Maughan, R.J. Mild hypohydration increases the frequency of driver errors during a prolonged, monotonous driving task. Physiol .Behav. 2015, 147, 313–318. [Google Scholar] [CrossRef] [PubMed] [Green Version]
- Maughan, R.J. Impact of mild dehydration on wellness and on exercise performance. Eur. J. Clin. Nutr. 2003, 57 (Suppl. 2), S19–S23. [Google Scholar] [CrossRef] [PubMed]
- European Food Safety Authority (EFSA) Panel on Dietetic Products, Nutrition and Allergies. Scientific opinion on dietary reference values for water. EFSA J. 2010, 8, 1459. [Google Scholar]
- Nissensohn, M.; Castro-Quezada, I.; Serra-Majem, L. Beverage and water intake of healthy adults in some european countries. Int. J. Food Sci. Nutr. 2013, 64, 801–805. [Google Scholar] [CrossRef] [PubMed]
- Imamura, F.; O’Connor, L.; Ye, Z.; Mursu, J.; Hayashino, Y.; Bhupathiraju, S.N.; Forouhi, N.G. Consumption of sugar sweetened beverages, artificially sweetened beverages, and fruit juice and incidence of type 2 diabetes: Systematic review, meta-analysis, and estimation of population attributable fraction. BMJ 2015, 351, 3576. [Google Scholar] [CrossRef] [PubMed]
- Xi, B.; Huang, Y.; Reilly, K.H.; Li, S.; Zheng, R.; Barrio-Lopez, M.T.; Martinez-Gonzalez, M.A.; Zhou, D. Sugar-sweetened beverages and risk of hypertension and CVD: A dose-response meta-analysis. Br. J. Nutr. 2015, 113, 709–717. [Google Scholar] [CrossRef] [PubMed]
- Ruanpeng, D.; Thongprayoon, C.; Cheungpasitporn, W.; Harindhanavudhi, T. Sugar and artificially sweetened beverages linked to obesity: A systematic review and meta-analysis. QJM 2017, 110, 513–520. [Google Scholar] [CrossRef] [PubMed]
- Larsson, S.C.; Crippa, A.; Orsini, N.; Wolk, A.; Michaelsson, K. Milk consumption and mortality from all causes, cardiovascular disease, and cancer: A systematic review and meta-analysis. Nutrients 2015, 7, 7749–7763. [Google Scholar] [CrossRef] [PubMed]
- Guo, J.; Astrup, A.; Lovegrove, J.A.; Gijsbers, L.; Givens, D.I.; Soedamah-Muthu, S.S. Milk and dairy consumption and risk of cardiovascular diseases and all-cause mortality: Dose-response meta-analysis of prospective cohort studies. Eur. J. Epidemiol. 2017, 32, 269–287. [Google Scholar] [CrossRef] [PubMed]
- Grosso, G.; Micek, A.; Godos, J.; Sciacca, S.; Pajak, A.; Martinez-Gonzalez, M.A.; Giovannucci, E.L.; Galvano, F. Coffee consumption and risk of all-cause, cardiovascular, and cancer mortality in smokers and non-smokers: A dose-response meta-analysis. Eur. J. Epidemiol. 2016, 31, 1191–1205. [Google Scholar] [CrossRef] [PubMed]
- Marventano, S.; Salomone, F.; Godos, J.; Pluchinotta, F.; Del Rio, D.; Mistretta, A.; Grosso, G. Coffee and tea consumption in relation with non-alcoholic fatty liver and metabolic syndrome: A systematic review and meta-analysis of observational studies. Clin. Nutr. 2016, 35, 1269–1281. [Google Scholar] [CrossRef] [PubMed]
- Yang, J.; Mao, Q.X.; Xu, H.X.; Ma, X.; Zeng, C.Y. Tea consumption and risk of type 2 diabetes mellitus: A systematic review and meta-analysis update. BMJ Open 2014, 4, e005632. [Google Scholar] [CrossRef] [PubMed]
- Tang, J.; Zheng, J.S.; Fang, L.; Jin, Y.; Cai, W.; Li, D. Tea consumption and mortality of all cancers, CVD and all causes: A meta-analysis of eighteen prospective cohort studies. Br. J. Nutr. 2015, 114, 673–683. [Google Scholar] [CrossRef] [PubMed]
- Zhang, C.; Qin, Y.Y.; Wei, X.; Yu, F.F.; Zhou, Y.H.; He, J. Tea consumption and risk of cardiovascular outcomes and total mortality: A systematic review and meta-analysis of prospective observational studies. Eur. J. Epidemiol. 2015, 30, 103–113. [Google Scholar] [CrossRef] [PubMed]
- Bagnardi, V.; Rota, M.; Botteri, E.; Tramacere, I.; Islami, F.; Fedirko, V.; Scotti, L.; Jenab, M.; Turati, F.; Pasquali, E.; et al. Alcohol consumption and site-specific cancer risk: A comprehensive dose-response meta-analysis. Br. J. Cancer 2015, 112, 580–593. [Google Scholar] [CrossRef] [PubMed]
- Praud, D.; Rota, M.; Rehm, J.; Shield, K.; Zatonski, W.; Hashibe, M.; La Vecchia, C.; Boffetta, P. Cancer incidence and mortality attributable to alcohol consumption. Int. J. Cancer 2016, 138, 1380–1387. [Google Scholar] [CrossRef] [PubMed]
- Rosado, C.I.; Marin, A.L.V.; Martinez, J.A.; Cabrerizo, L.; Gargallo, M.; Lorenzo, H.; Quiles, J.; Planas, M.; Polanco, I.; de Avila, D.R.; et al. Importance of water in the hydration of the spanish population: Fesnad 2010 document. Nutr. Hosp. 2011, 26, 27–36. [Google Scholar]
- Popkin, B.M.; D’Anci, K.E.; Rosenberg, I.H. Water, hydration, and health. Nutr. Rev. 2010, 68, 439–458. [Google Scholar] [CrossRef] [PubMed]
- Grosso, G.; Marventano, S.; D’Urso, M.; Mistretta, A.; Galvano, F. The mediterranean healthy eating, ageing, and lifestyle (meal) study: Rationale and study design. Int. J. Food Sci. Nutr. 2017, 68, 577–586. [Google Scholar] [CrossRef] [PubMed]
- Craig, C.L.; Marshall, A.L.; Sjostrom, M.; Bauman, A.E.; Booth, M.L.; Ainsworth, B.E.; Pratt, M.; Ekelund, U.; Yngve, A.; Sallis, J.F.; et al. International physical activity questionnaire: 12-country reliability and validity. Med. Sci. Sports Exerc. 2003, 35, 1381–1395. [Google Scholar] [CrossRef] [PubMed]
- Mistretta, A.; Marventano, S.; Platania, A.; Godos, J.; Galvano, F.; Grosso, G. Metabolic profile of the mediterranean healthy eating, lifestyle and aging (meal) study cohort. Mediterr. J. Nutr. Metab. 2017, 10, 131–140. [Google Scholar] [CrossRef]
- World Health Organization. Obesity: Preventing and Managing the Global Epidemic; Report of a Who Consultation Presented at the World Health Organization; June 3–5, 1997; World Health Organization: Geneva, Switzerland, 1997. [Google Scholar]
- Buscemi, S.; Rosafio, G.; Vasto, S.; Massenti, F.M.; Grosso, G.; Galvano, F.; Rini, N.; Barile, A.M.; Maniaci, V.; Cosentino, L.; et al. Validation of a food frequency questionnaire for use in italian adults living in sicily. Int. J. Food Sci. Nutr. 2015, 66, 426–438. [Google Scholar] [CrossRef] [PubMed]
- Marventano, S.; Mistretta, A.; Platania, A.; Galvano, F.; Grosso, G. Reliability and relative validity of a food frequency questionnaire for italian adults living in sicily, southern italy. Int. J. Food Sci. Nutr. 2016, 67, 857–864. [Google Scholar] [CrossRef] [PubMed]
- Marletta, L.; Carnovale, E. Tabelle di Composizione Degli Alimenti; Istituto Nazionale di Ricerca per gli Alimenti e la Nutrizione: Milano, Italy, 2000. [Google Scholar]
- Neveu, V.; Perez-Jiménez, J.; Vos, F.; Crespy, V.; Du Chaffaut, L.; Mennen, L.; Knox, C.; Eisner, R.; Cruz, J.; Wishart, D.; et al. Phenol-explorer: An online comprehensive database on polyphenol contents in foods. Database 2010. [Google Scholar] [CrossRef] [PubMed]
- Godos, J.; Marventano, S.; Mistretta, A.; Galvano, F.; Grosso, G. Dietary sources of polyphenols in the mediterranean healthy eating, aging and lifestyle (meal) study cohort. Int. J. Food Sci. Nutr. 2017, 1–7. [Google Scholar] [CrossRef] [PubMed]
- Willett, W.C. Reproducibility and validity of food frequency questionnaire. In Nutritional Epidemiology, 2nd ed.; Oxford University Press: Oxford, UK, 1998. [Google Scholar]
- Nissensohn, M.; Sanchez-Villegas, A.; Ortega, R.M.; Aranceta-Bartrina, J.; Gil, A.; Gonzalez-Gross, M.; Varela-Moreiras, G.; Serra-Majem, L. Beverage consumption habits and association with total water and energy intakes in the spanish population: Findings of the anibes study. Nutrients 2016, 8, 232. [Google Scholar] [CrossRef] [PubMed]
- Mistura, L.; D’Addezio, L.; Turrini, A. Beverage consumption habits in italian population: Association with total water intake and energy intake. Nutrients 2016, 8. [Google Scholar] [CrossRef] [PubMed]
- Gibson, S.; Shirreffs, S.M. Beverage consumption habits “24/7” among british adults: Association with total water intake and energy intake. Nutr. J. 2013, 12, 9. [Google Scholar] [CrossRef] [PubMed]
- Grosso, G.; Marventano, S.; Giorgianni, G.; Raciti, T.; Galvano, F.; Mistretta, A. Mediterranean diet adherence rates in sicily, southern italy. Public Health Nutr. 2014, 17, 2001–2009. [Google Scholar] [CrossRef] [PubMed]
- Marventano, S.; Godos, J.; Platania, A.; Galvano, F.; Mistretta, A.; Grosso, G. Mediterranean diet adherence in the mediterranean healthy eating, aging and lifestyle (meal) study cohort. Int. J. Food Sci. Nutr. 2018, 69, 100–107. [Google Scholar] [CrossRef] [PubMed]
- Bonaccorsi, G.; Lorini, C.; Santomauro, F.; Sofi, F.; Vannetti, F.; Pasquini, G.; Macchi, C.; Mugello Study, G. Adherence to mediterranean diet and nutritional status in a sample of nonagenarians. Exp. Gerontol. 2018, 103, 57–62. [Google Scholar] [CrossRef] [PubMed]
- De Lorenzo, A.; Noce, A.; Bigioni, M.; Calabrese, V.; Della Rocca, D.G.; Di Daniele, N.; Tozzo, C.; Di Renzo, L. The effects of italian mediterranean organic diet (IMOD) on health status. Curr. Pharm. Des. 2010, 16, 814–824. [Google Scholar] [CrossRef] [PubMed]
- Mistretta, A.; Marventano, S.; Antoci, M.; Cagnetti, A.; Giogianni, G.; Nolfo, F.; Rametta, S.; Pecora, G.; Marranzano, M. Mediterranean diet adherence and body composition among southern italian adolescents. Obes. Res. Clin. Pract. 2017, 11, 215–226. [Google Scholar] [CrossRef] [PubMed]
- Kremer, J.I.; Gompel, K.; Bakuradze, T.; Eisenbrand, G.; Richling, E. Urinary excretion of niacin metabolites in humans after coffee consumption. Mol. Nutr. Food Res. 2018, e1700735. [Google Scholar] [CrossRef] [PubMed]
- Grosso, G.; Stepaniak, U.; Topor-Madry, R.; Szafraniec, K.; Pajak, A. Estimated dietary intake and major food sources of polyphenols in the polish arm of the hapiee study. Nutrition 2014, 30, 1398–1403. [Google Scholar] [CrossRef] [PubMed]
- Ovaskainen, M.L.; Torronen, R.; Koponen, J.M.; Sinkko, H.; Hellstrom, J.; Reinivuo, H.; Mattila, P. Dietary intake and major food sources of polyphenols in finnish adults. J. Nutr. 2008, 138, 562–566. [Google Scholar] [CrossRef] [PubMed]
- Tresserra-Rimbau, A.; Medina-Remon, A.; Perez-Jimenez, J.; Martinez-Gonzalez, M.A.; Covas, M.I.; Corella, D.; Salas-Salvado, J.; Gomez-Gracia, E.; Lapetra, J.; Aros, F.; et al. Dietary intake and major food sources of polyphenols in a spanish population at high cardiovascular risk: The predimed study. Nutr. Metab. Cardiovasc. Dis. 2013, 23, 953–959. [Google Scholar] [CrossRef] [PubMed]
- Perez-Jimenez, J.; Neveu, V.; Vos, F.; Scalbert, A. Identification of the 100 richest dietary sources of polyphenols: An application of the phenol-explorer database. Eur. J. Clin. Nutr. 2010, 64 (Suppl. 3), S112–S120. [Google Scholar] [CrossRef]
- Godos, J.; Rapisarda, G.; Marventano, S.; Galvano, F.; Mistretta, A.; Grosso, G. Association between polyphenol intake and adherence to the mediterranean diet in sicily, southern Italy. NFS J. 2017, 8, 1–7. [Google Scholar] [CrossRef]
- Grosso, G.; Godos, J.; Galvano, F.; Giovannucci, E.L. Coffee, caffeine, and health outcomes: An umbrella review. Annu. Rev. Nutr. 2017, 37, 131–156. [Google Scholar] [CrossRef] [PubMed]
- Caprioli, G.; Cortese, M.; Maggi, F.; Minnetti, C.; Odello, L.; Sagratini, G.; Vittori, S. Quantification of caffeine, trigonelline and nicotinic acid in espresso coffee: The influence of espresso machines and coffee cultivars. Int. J. Food Sci. Nutr. 2014, 65, 465–469. [Google Scholar] [CrossRef] [PubMed]
- Caprioli, G.; Cortese, M.; Sagratini, G.; Vittori, S. The influence of different types of preparation (espresso and brew) on coffee aroma and main bioactive constituents. Int. J. Food Sci. Nutr. 2015, 66, 505–513. [Google Scholar] [CrossRef] [PubMed]
- Godos, J.; Sinatra, D.; Blanco, I.; Mule, S.; La Verde, M.; Marranzano, M. Association between dietary phenolic acids and hypertension in a mediterranean cohort. Nutrients 2017, 9. [Google Scholar] [CrossRef]
- Pounis, G.; Tabolacci, C.; Costanzo, S.; Cordella, M.; Bonaccio, M.; Rago, L.; D’Arcangelo, D.; Di Castelnuovo, A.F.; de Gaetano, G.; Donati, M.B.; et al. Reduction by coffee consumption of prostate cancer risk: Evidence from the Moli-sani cohort and cellular models. Int. J. Cancer 2017, 141, 72–82. [Google Scholar] [CrossRef] [PubMed]
- Solfrizzi, V.; Panza, F.; Imbimbo, B.P.; D’Introno, A.; Galluzzo, L.; Gandin, C.; Misciagna, G.; Guerra, V.; Osella, A.; Baldereschi, M.; et al. Coffee consumption habits and the risk of mild cognitive impairment: The Italian longitudinal study on aging. J. Alzheimers Dis. 2015, 47, 889–899. [Google Scholar] [CrossRef] [PubMed]
- Parodi, S.; Merlo, F.D.; Stagnaro, E. Working Group for the Epidemiology of Hematolymphopoietic Malignancies in, I. Coffee consumption and risk of non-hodgkin’s lymphoma: Evidence from the Italian multicentre case-control study. Cancer Causes Control 2017, 28, 867–876. [Google Scholar] [CrossRef] [PubMed]
- Grioni, S.; Agnoli, C.; Sieri, S.; Pala, V.; Ricceri, F.; Masala, G.; Saieva, C.; Panico, S.; Mattiello, A.; Chiodini, P.; et al. Espresso coffee consumption and risk of coronary heart disease in a large Italian cohort. PLoS ONE 2015, 10, e0126550. [Google Scholar] [CrossRef] [PubMed]
- Filiberti, R.A.; Fontana, V.; De Ceglie, A.; Blanchi, S.; Grossi, E.; Della Casa, D.; Lacchin, T.; De Matthaeis, M.; Ignomirelli, O.; Cappiello, R.; et al. Association between coffee or tea drinking and barrett’s esophagus or esophagitis: An Italian study. Eur. J. Clin. Nutr. 2017, 71, 980–986. [Google Scholar] [CrossRef] [PubMed]
- Giacosa, A.; Barale, R.; Bavaresco, L.; Faliva, M.A.; Gerbi, V.; La Vecchia, C.; Negri, E.; Opizzi, A.; Perna, S.; Pezzotti, M.; et al. Mediterranean way of drinking and longevity. Crit. Rev. Food Sci. Nutr. 2016, 56, 635–640. [Google Scholar] [CrossRef] [PubMed]
- Grosso, G.; Godos, J.; Lamuela-Raventos, R.; Ray, S.; Micek, A.; Pajak, A.; Sciacca, S.; D'Orazio, N.; Del Rio, D.; Galvano, F. A comprehensive meta-analysis on dietary flavonoid and lignan intake and cancer risk: Level of evidence and limitations. Mol. Nutr. Food Res. 2017, 61. [Google Scholar] [CrossRef] [PubMed]
- Grosso, G.; Micek, A.; Godos, J.; Pajak, A.; Sciacca, S.; Galvano, F.; Giovannucci, E.L. Dietary flavonoid and lignan intake and mortality in prospective cohort studies: Systematic review and dose-response meta-analysis. Am. J. Epidemiol. 2017, 185, 1304–1316. [Google Scholar] [CrossRef] [PubMed]
- Chiva-Blanch, G.; Arranz, S.; Lamuela-Raventos, R.M.; Estruch, R. Effects of wine, alcohol and polyphenols on cardiovascular disease risk factors: Evidences from human studies. Alcohol Alcohol. 2013, 48, 270–277. [Google Scholar] [CrossRef] [PubMed]
- Arranz, S.; Chiva-Blanch, G.; Valderas-Martinez, P.; Medina-Remon, A.; Lamuela-Raventos, R.M.; Estruch, R. Wine, beer, alcohol and polyphenols on cardiovascular disease and cancer. Nutrients 2012, 4, 759–781. [Google Scholar] [CrossRef] [PubMed] [Green Version]
- Mocciaro, G.; Ziauddeen, N.; Godos, J.; Marranzano, M.; Chan, M.Y.; Ray, S. Does a mediterranean-type dietary pattern exert a cardio-protective effect outside the mediterranean region? A review of current evidence. Int. J. Food Sci. Nutr. 2017, 1–12. [Google Scholar] [CrossRef] [PubMed]
- Godos, J.; Bergante, S.; Satriano, A.; Pluchinotta, F.R.; Marranzano, M. Dietary phytoestrogen intake is inversely associated with hypertension in a cohort of adults living in the mediterranean area. Molecules 2018, 23. [Google Scholar] [CrossRef] [PubMed]
- Olza, J.; Aranceta-Bartrina, J.; Gonzalez-Gross, M.; Ortega, R.M.; Serra-Majem, L.; Varela-Moreiras, G.; Gil, A. Reported dietary intake and food sources of zinc, selenium, and vitamins A, E and C in the spanish population: Findings from the anibes study. Nutrients 2017, 9. [Google Scholar] [CrossRef] [PubMed]
- Dominguez-Perles, R.; Mena, P.; Garcia-Viguera, C.; Moreno, D.A. Brassica foods as a dietary source of vitamin C: A review. Crit. Rev. Food Sci. Nutr. 2014, 54, 1076–1091. [Google Scholar] [CrossRef] [PubMed]
- Marranzano, M.; Godos, J.; Sumantra, R.; Galvano, F. Association between dietary flavonoids intake and obesity in a cohort of adults living in the Mediterranean area. Int. J. Food Sci. Nutr. 2018. ahead of print. [Google Scholar] [CrossRef] [PubMed]
- World Health Organization. Diet, Nutrition and the Prevention of Chronic Diseases; Report No. 916; World Health Organization: Geneva, Switzerland, 2002. [Google Scholar]
- Lustig, R.H.; Schmidt, L.A.; Brindis, C.D. Public health: The toxic truth about sugar. Nature 2012, 482, 27–29. [Google Scholar] [CrossRef] [PubMed]
- Johnson, R.J.; Segal, M.S.; Sautin, Y.; Nakagawa, T.; Feig, D.I.; Kang, D.H.; Gersch, M.S.; Benner, S.; Sanchez-Lozada, L.G. Potential role of sugar (fructose) in the epidemic of hypertension, obesity and the metabolic syndrome, diabetes, kidney disease, and cardiovascular disease. Am. J. Clin. Nutr. 2007, 86, 899–906. [Google Scholar] [PubMed]
- Johnson, R.K.; Appel, L.J.; Brands, M.; Howard, B.V.; Lefevre, M.; Lustig, R.H.; Sacks, F.; Steffen, L.M.; Wylie-Rosett, J. Dietary sugars intake and cardiovascular health: A scientific statement from the American Heart Association. Circulation 2009, 120, 1011–1020. [Google Scholar] [CrossRef] [PubMed]
- Malik, V.S.; Popkin, B.M.; Bray, G.A.; Despres, J.P.; Hu, F.B. Sugar-sweetened beverages, obesity, type 2 diabetes mellitus, and cardiovascular disease risk. Circulation 2010, 121, 1356–1364. [Google Scholar] [CrossRef] [PubMed]
- Drewnowski, A.; Rehm, C.D.; Constant, F. Water and beverage consumption among adults in the United States: Cross-sectional study using data from NHANES 2005–2010. BMC Public Health 2013, 13, 1068. [Google Scholar] [CrossRef] [PubMed]
- La Verde, M.; Mule, S.; Zappala, G.; Privitera, G.; Maugeri, G.; Pecora, F.; Marranzano, M. Higher adherence to the Mediterranean diet is inversely associated with having hypertension: Is low salt intake a mediating factor? Int. J. Food Sci. Nutr. 2018, 69, 235–244. [Google Scholar] [CrossRef] [PubMed]
- Platania, A.; Zappala, G.; Mirabella, M.U.; Gullo, C.; Mellini, G.; Beneventano, G.; Maugeri, G.; Marranzano, M. Association between mediterranean diet adherence and dyslipidaemia in a cohort of adults living in the Mediterranean area. Int. J. Food Sci. Nutr. 2017, 1–11. [Google Scholar] [CrossRef] [PubMed]
- Zappala, G.; Buscemi, S.; Mule, S.; La Verde, M.; D’Urso, M.; Corleo, D.; Marranzano, M. High adherence to Mediterranean diet, but not individual foods or nutrients, is associated with lower likelihood of being obese in a Mediterranean cohort. Eat. Weight Disord. 2017. [Google Scholar] [CrossRef] [PubMed]


| Male (n = 669) (41.8% column) | Female (n = 933) (58.2% column) | Total (n = 1602) | |
|---|---|---|---|
| Age groups, n (%) | |||
| 18–35 | 210 (31.4) | 260 (27.9) | 470 (29.3) |
| 35–50 | 199 (29.7) | 273 (29.3) | 472 (29.5) |
| >50 | 260 (38.9) | 400 (42.9) | 660 (41.2) |
| Education, n (%) | |||
| Elementary or Middle school | 157 (23.5) | 314 (33.7) | 471 (29.4) |
| Diploma | 308 (46.0) | 341 (36.5) | 649 (40.5) |
| Graduate | 204 (30.5) | 278 (29.8) | 482 (30.1) |
| Occupation, n (%) | |||
| Unemployed | 66 (11.7) | 299 (37.8) | 365 (26.9) |
| Low (unskilled workers) | 96 (17.1) | 122 (15.4) | 218 (16.1) |
| Medium (partially skilled workers) | 170 (30.2) | 153 (19.3) | 323 (23.8) |
| High (skilled workers) | 231 (41.0) | 218 (27.5) | 449 (33.1) |
| Smoking, n (%) | |||
| Yes | 173 (25.9) | 225 (24.1) | 398 (24.8) |
| No | 374 (55.9) | 648 (69.5) | 1022 (63.8) |
| Ex-smoker | 122 (18.2) | 60 (6.4) | 182 (11.4) |
| Body Mass Index (BMI) (kg/m2) mean (SE) | 26.3 (3.7) | 25.1 (4.9) | 25.6 (4.5) |
| BMI category (kg/m2) n (%) | |||
| Underweight/Normal (<18.5–24.9) | 237 (39.4) | 486 (55.7) | 723 (49.1) |
| Overweight (25–29.9) | 280 (46.5) | 231 (26.5) | 511 (34.7) |
| Obese (>29.9) | 85 (14.1) | 155 (17.8) | 240 (15.0) |
| Physical activity (scale) n (%) | |||
| Low | 76 (11.4) | 201 (21.5) | 277 (17.3) |
| Moderate | 317 (47.4) | 481 (51.6) | 798 (49.8) |
| High | 276 (41.3) | 247 (26.5) | 523 (32.6) |
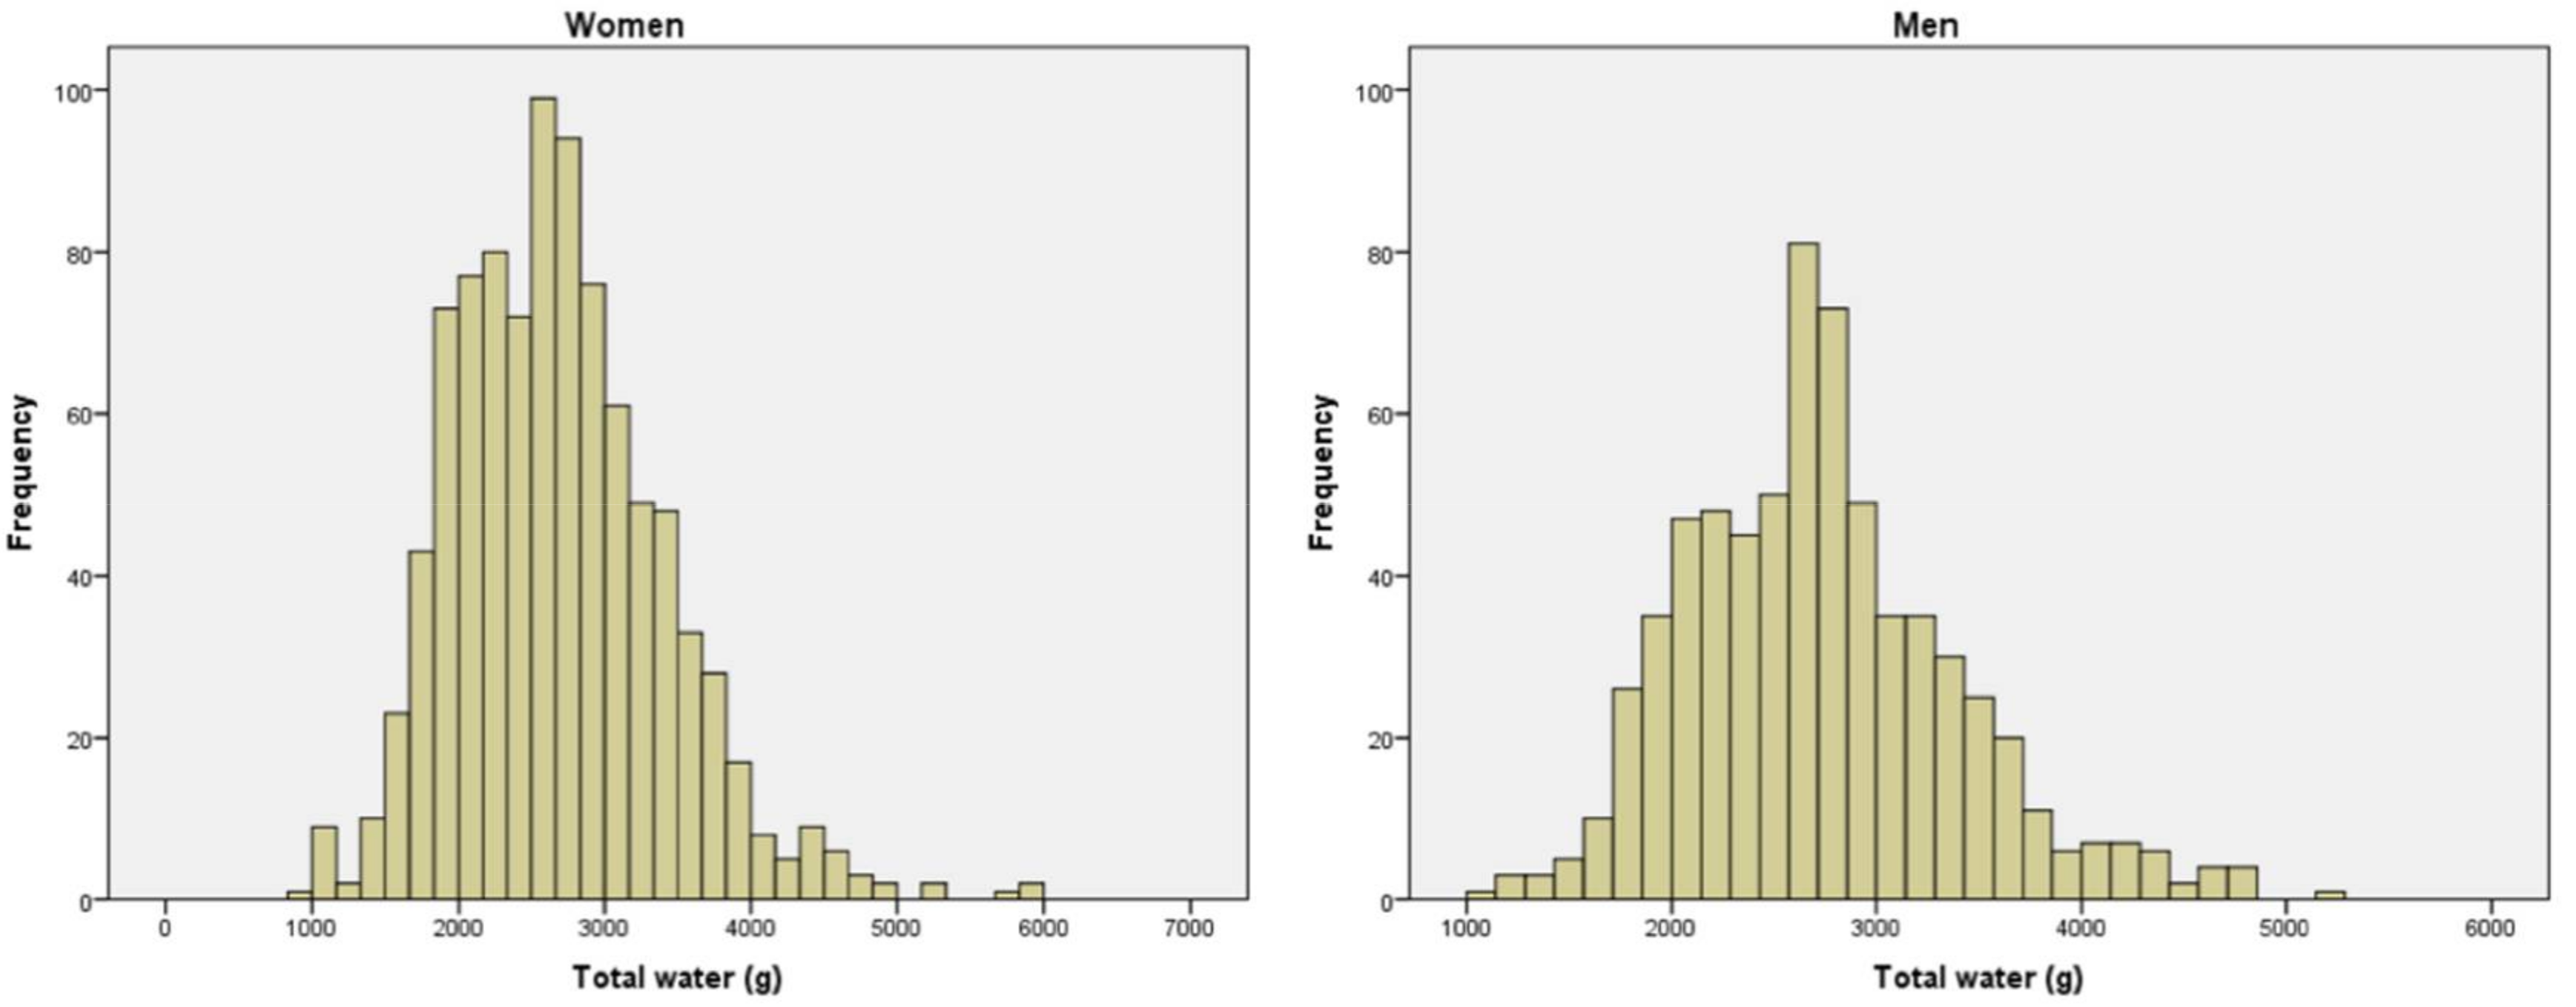
| Total Water Intake (L) mean (SE) | 2729 (25.4) | 2682 (23.6) | 2701 (17.4) |
| Criteria Classification | Men (n = 669) | Women (n = 933) |
|---|---|---|
| Criterion 1: (%) | 63.7 | 82.7 |
| Criterion 2: (%) | 88.3 | 86.4 |
| Criterion 3: (%) | 59.8 | 75.1 |
| Total Weight Consumed (g/day) | Contribution to Energy Intake (kcal/day) | Contribution to Water Intake (g/day) | |||||||
|---|---|---|---|---|---|---|---|---|---|
| Total | Men | Women | Total | Men | Women | Total | Men | Women | |
| All food and drink, mean (SE) | 3072.70 | 3102.36 | 3051.43 | 1950.53 | 1975.22 | 1932.83 | 2701.71 | 2729.08 | 2682.08 |
| (19.76) | (28.07) | (27.31) | (16.89) | (24.81) | (22.90) | (17.35) | (25.40) | (23.57) | |
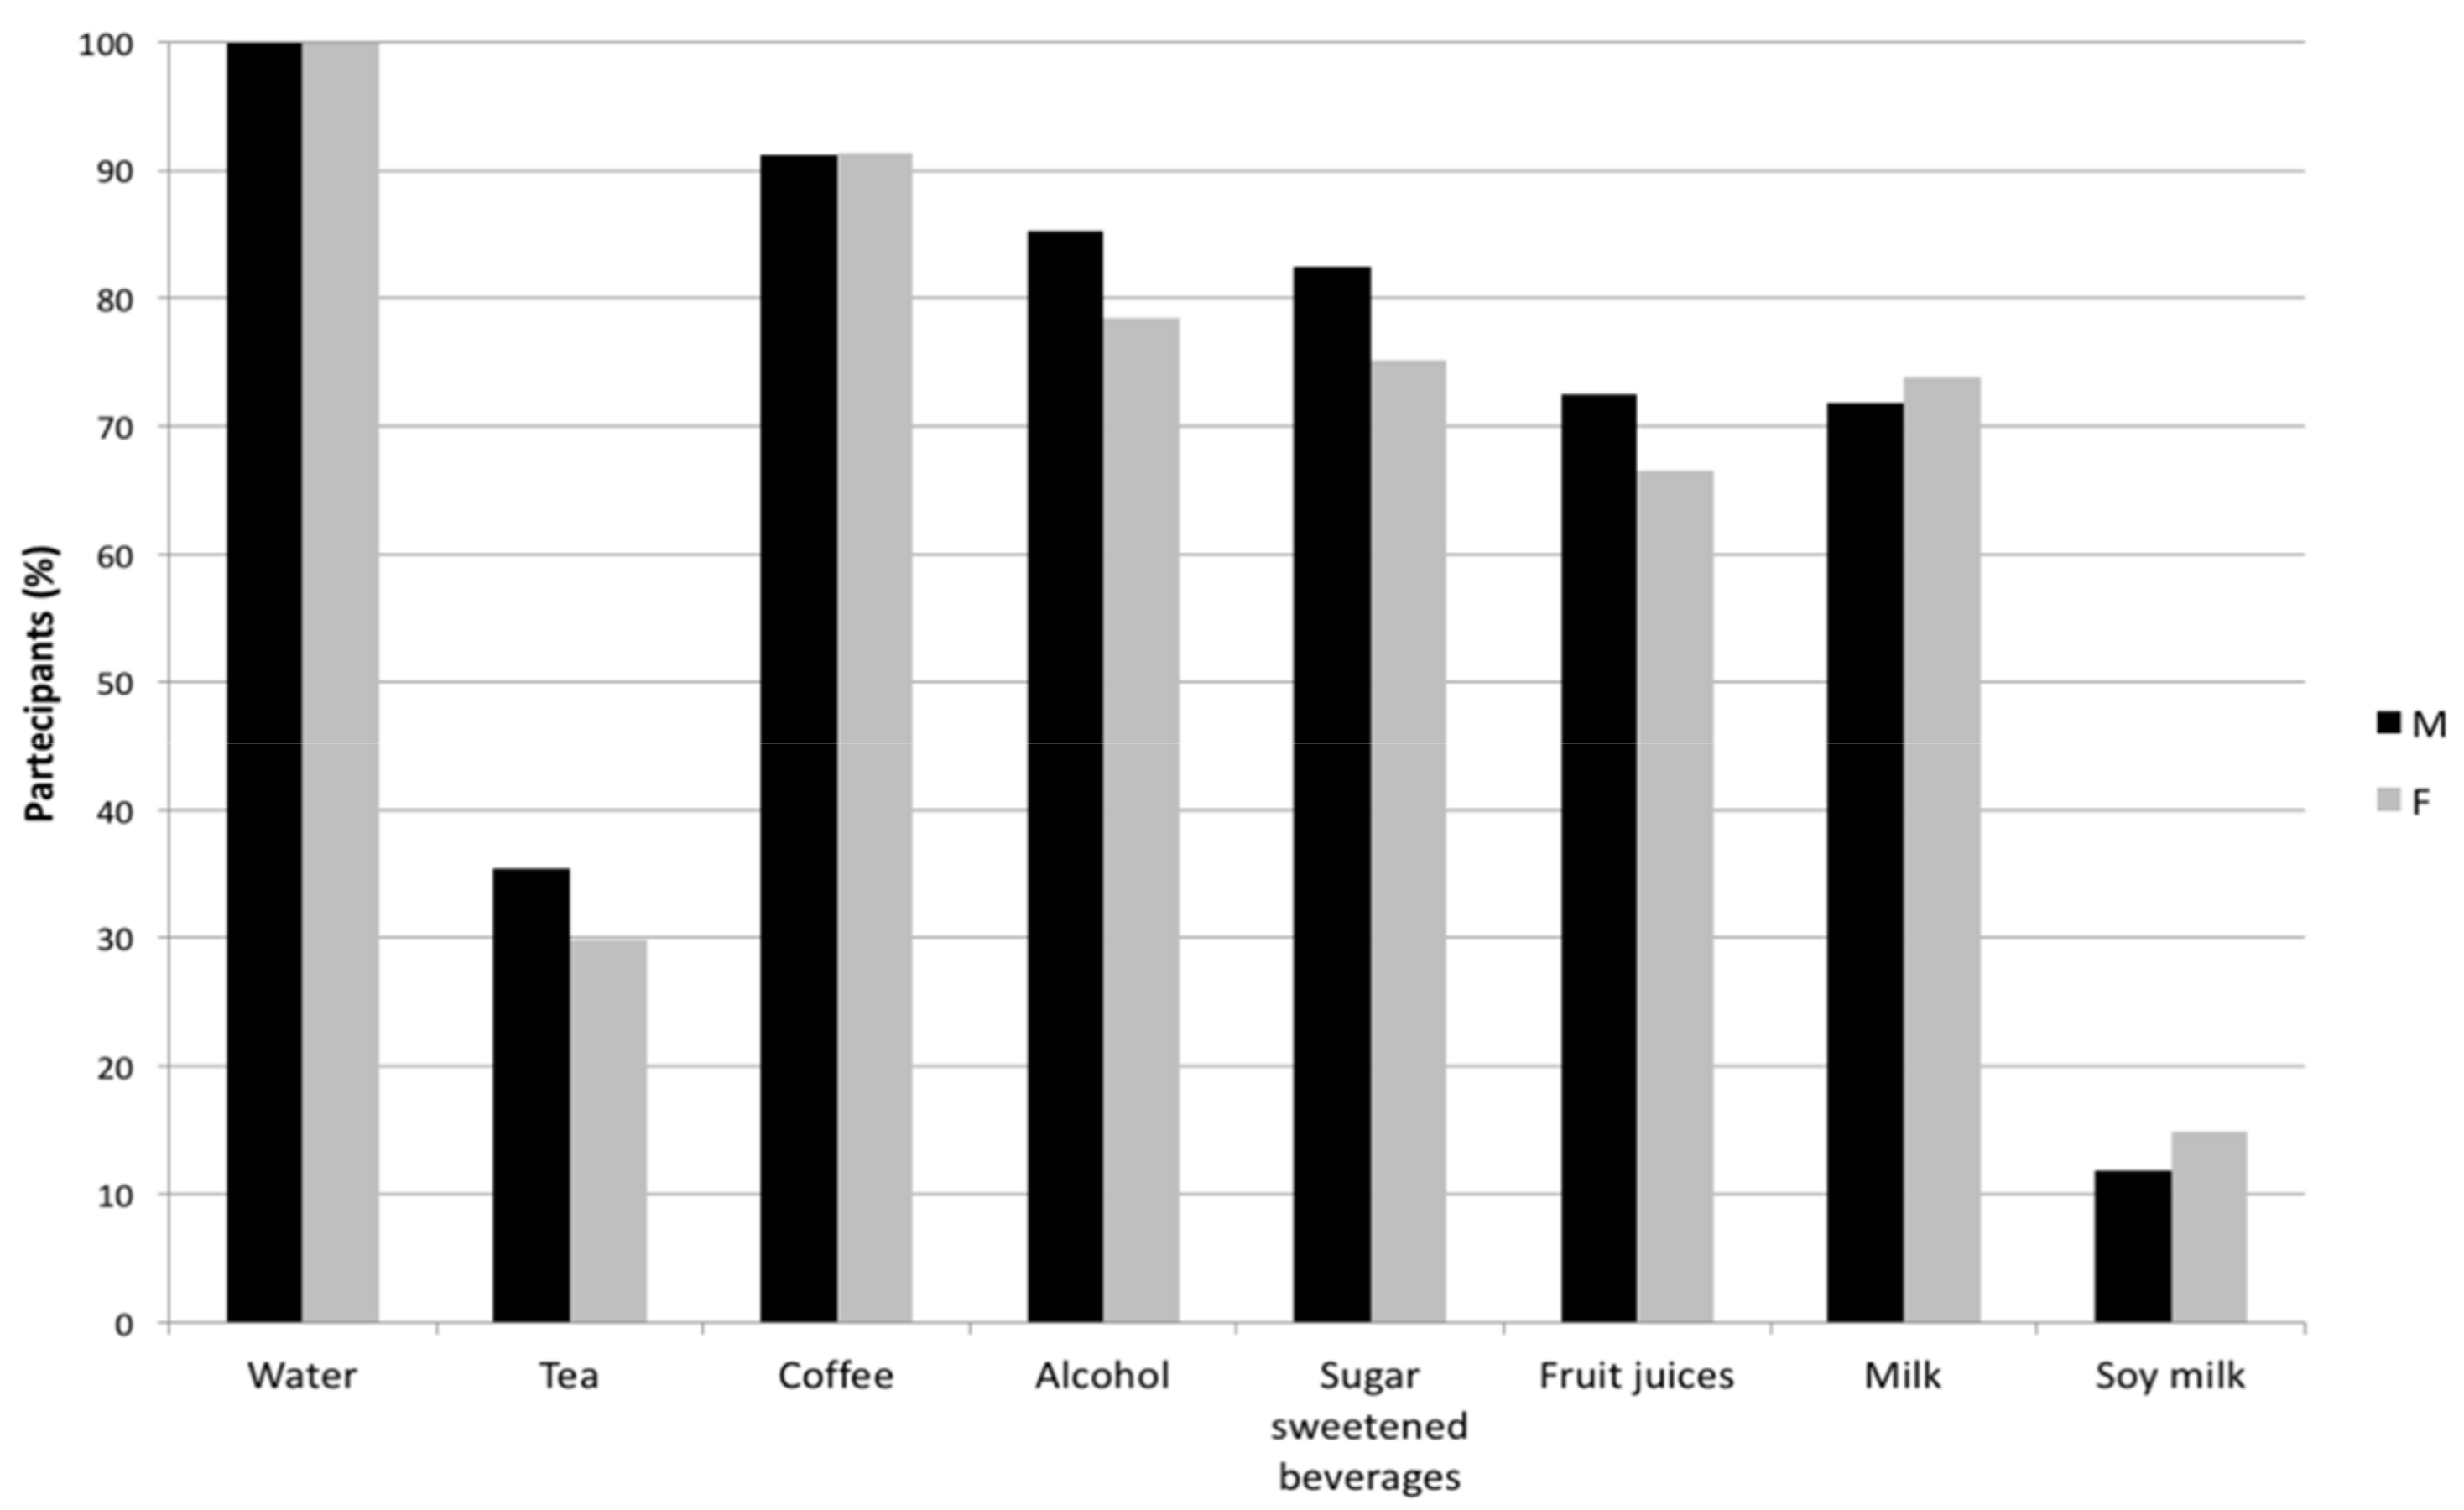
| Food only, mean (SE) | 36.0% | 35.3% | 36.5% | 91.3% | 91.4% | 91.2% | 27.4% | 26.6% | 28.0% |
| (0.3%) | (0.4%) | (0.3%) | (0.1%) | (0.2%) | (0.2%) | (0.3%) | (0.4%) | (0.3%) | |
| Beverages only, mean (SE) | 64.0% | 64.7% | 63.5% | 8.7% | 8.6% | 8.8% | 72.6% | 73.4% | 72.0% |
| (0.3%) | (0.4%) | (0.3%) | (0.1%) | (0.2%) | (0.2%) | (0.3%) | (0.4%) | (0.4%) | |
| Alcohol beverages, mean (SE) | 3.2% | 3.5% | 3.0% | 2.8% | 3.0% | 2.7% | 3.7% | 4.0% | 3.5% |
| (0.1%) | (0.2%) | (0.2%) | (0.1%) | (0.1%) | (0.1%) | (0.1%) | (0.2%) | (0.2%) | |
| Sugar-sweetened beverages, mean (SE) | 2.1% | 2.2% | 2.0% | 1.3% | 1.4% | 1.3% | 2.5% | 2.6% | 2.4% |
| (0.1%) | (0.1%) | (0.1%) | (0.1%) | (0.1%) | (0.1%) | (0.1%) | (0.2%) | (0.2%) | |
| Tea, mean (SE) | 2.4% | 2.0% | 2.7% | 0.0% | 0.0% | 0.0% | 2.7% | 2.3% | 3.0% |
| (0.1%) | (0.2%) | (0.1%) | (0.0%) | (0.0%) | (0.0%) | (0.1%) | (0.2%) | (0.2%) | |
| Coffee, mean (SE) | 1.9% | 1.9% | 1.9% | 0.3% | 0.3% | 0.3% | 2.1% | 2.2% | 2.1% |
| (0.0%) | (0.1%) | (0.0%) | (0.0%) | (0.0%) | (0.0%) | (0.0%) | (0.1%) | (0.1%) | |
| Fruit juices, mean (SE) | 1.1% | 1.2% | 1.1% | 0.7% | 0.8% | 0.7% | 1.3% | 1.4% | 1.2% |
| (0.0%) | (0.1%) | (0.1%) | (0.0%) | (0.1%) | (0.0%) | (0.1%) | (0.1%) | (0.1%) | |
| Milk, mean (SE) | 4.3% | 4.0% | 4.5% | 3.2% | 2.9% | 3.4% | 4.9% | 4.5% | 5.2% |
| (0.1%) | (0.2%) | (0.2%) | (0.1%) | (0.1%) | (0.1%) | (0.1%) | (0.2%) | (0.2%) | |
| Soy milk, mean (SE) | 0.5% | 0.3% | 0.6% | 0.3% | 0.2% | 0.4% | 0.5% | 0.3% | 0.7% |
| (0.0%) | (0.0%) | (0.1%) | (0.0%) | (0.0%) | (0.0%) | (0.0%) | (0.0%) | (0.1%) | |
| Water, mean (SE) | 48.4% | 49.5% | 47.7% | / | / | / | 54.9% | 56.2% | 54.0% |
| (0.3%) | (0.4%) | (0.4%) | / | / | / | (0.3%) | (0.5%) | (0.4%) | |
| Men | Women | |||||||
|---|---|---|---|---|---|---|---|---|
| Age Group | p | Age Group | p | |||||
| 1 | 2 | 3 | 1 | 2 | 3 | |||
| Total water intake from food and beverages, mean (SE) | 2804 | 2676 | 2709 | 0.12 | 2686 | 2739 | 2640 | 0.22 |
| 53 | 43 | 37 | 43 | 44 | 36 | |||
| Water from food, mean (SE) | 745 | 720 | 738 | 0.77 | 770 | 772 | 755 | 0.83 |
| 30 | 24 | 19 | 23 | 30 | 18 | |||
| Water from beverages, mean (SE) | 2059 | 1956 | 1971 | 0.07 | 1916 | 1967 | 1885 | 0.11 |
| 40 | 32 | 29 | 32 | 32 | 26 | |||
| Alcoholic beverages, mean (SE) | 112 | 91 | 127 | 0.05 | 93 | 78 | 98 | 0.20 |
| 9 | 7 | 12 | 8 | 7 | 8 | |||
| Sugar-sweetened beverages, mean (SE) | 84 | 65 | 66 | 0.18 | 76 | 71 | 55 | 0.13 |
| 9 | 8 | 7 | 9 | 8 | 6 | |||
| Tea, mean (SE) | 84 | 60 | 67 | 0.34 | 74 | 102 | 84 | 0.10 |
| 13 | 11 | 10 | 7 | 12 | 7 | |||
| Coffee, mean (SE) | 52 | 57 | 61 | 0.07 | 53 | 50 | 56 | 0.14 |
| 3 | 3 | 3 | 3 | 2 | 2 | |||
| Fruit juices, mean (SE) | 39 | 32 | 44 | 0.10 | 36 | 41 | 31 | 0.19 |
| 4 | 3 | 5 | 4 | 5 | 3 | |||
| Milk, mean (SE) | 126 | 117 | 114 | 0.68 | 129 | 144 | 132 | 0.52 |
| 10 | 11 | 9 | 10 | 11 | 8 | |||
| Soy milk, mean (SE) | 11 | 9 | 7 | 0.48 | 27 | 25 | 16 | 0.10 |
| 3 | 3 | 2 | 5 | 5 | 3 | |||
| Water, mean (SE) | 1552 | 1525 | 1485 | 0.22 | 1428 | 1456 | 1413 | 0.48 |
| 31 | 29 | 26 | 27 | 27 | 24 | |||
| Total Water | Water from Beverages | Water from Food | Food Weight | Total Energy | Energy from Beverages | Energy from Food | |
|---|---|---|---|---|---|---|---|
| Total water | 1.00 | 0.82 ** | 0.66 ** | 0.68 ** | 0.53 ** | 0.37 ** | 0.49 ** |
| Water from beverages | 0.82 ** | 1.00 | 0.12 ** | 0.18 ** | 0.25 ** | 0.40 ** | 0.19 ** |
| Water from food | 0.66 ** | 0.12 ** | 1.00 | 0.96 ** | 0.60 ** | 0.11 ** | 0.61 ** |
| Food weight | 0.68 ** | 0.18 ** | 0.96 ** | 1.00 | 0.73 ** | 0.22 ** | 0.73 ** |
| Total energy | 0.53 ** | 0.25 ** | 0.60 ** | 0.73 ** | 1.00 | 0.39 ** | 0.98 ** |
| Energy from beverages | 0.37 ** | 0.40 ** | 0.11 ** | 0.22 ** | 0.39 ** | 1.00 | 0.22 ** |
| Energy from food | 0.49 ** | 0.19 ** | 0.61 ** | 0.73 ** | 0.98 ** | 0.22 ** | 1.00 |
| Alcohol beverages | 0.22 ** | 0.23 ** | 0.08 ** | 0.10 ** | 0.21 ** | 0.64 ** | 0.10 ** |
| Sugar-sweetened beverages | 0.20 ** | 0.24 ** | 0.05 * | 0.20 ** | 0.35 ** | 0.47 ** | 0.28 ** |
| Tea | 0.34 ** | 0.23 ** | 0.16 ** | 0.15 ** | 0.03 | 0.06 * | 0.02 |
| Coffee | 0.08 ** | 0.06 * | 0.05 * | 0.03 | 0.07 ** | 0.14 ** | 0.05 * |
| Fruit juices | 0.29 ** | 0.21 ** | 0.22 ** | 0.27 ** | 0.18 ** | 0.28 ** | 0.14 ** |
| Milk | 0.12 ** | 0.20 ** | −0.04 | 0.00 | 0.12 ** | 0.51 ** | 0.03 |
| Soy milk | 0.16 ** | 0.14 ** | 0.09 ** | 0.10 ** | 0.05 * | 0.10 ** | 0.04 |
| Water | 0.61 ** | 0.81 ** | 0.02 | 0.02 | 0.03 | −0.14 ** | 0.06 * |
| Title | Total Water | Water from Beverages | Water from Food | Food Weight | Total Energy | Energy from Beverages | Energy from Food | Alcohol Beverages | Sugar-Sweetened Beverages | Tea | Coffee | Fruit Juices | Milk | Soy Milk | Water |
|---|---|---|---|---|---|---|---|---|---|---|---|---|---|---|---|
| Vitamin A | 0.60 ** | 0.21 ** | 0.75 ** | 0.74 ** | 0.54 ** | 0.25 ** | 0.52 ** | 0.11 ** | 0.01 | 0.23 ** | 0.05 | 0.21 ** | 0.01 | 0.15 ** | 0.03 |
| Vitamin B1 | 0.48 ** | 0.22 ** | 0.54 ** | 0.56 ** | 0.76 ** | 0.27 ** | 0.75 ** | 0.15 ** | 0.23 ** | 0.15 ** | 0.05 | 0.09 ** | 0.08 ** | 0.11 ** | 0.07 ** |
| Vitamin B2 | 0.51 ** | 0.27 ** | 0.52 ** | 0.53 ** | 0.72 ** | 0.39 ** | 0.69 ** | 0.17 ** | 0.19 ** | 0.18 ** | 0.12 ** | 0.06 * | 0.27 ** | 0.17 ** | 0.04 |
| Niacin | 0.54 ** | 0.27 ** | 0.60 ** | 0.69 ** | 0.77 ** | 0.25 ** | 0.76 ** | 0.12 ** | 0.16 ** | 0.11 ** | 0.31 ** | 0.10 ** | 0.00 | 0.14 ** | 0.10 ** |
| Vitamin B6 | 0.66 ** | 0.29 ** | 0.73 ** | 0.82 ** | 0.83 ** | 0.30 ** | 0.82 ** | 0.08 ** | 0.12 ** | 0.25 ** | 0.02 | 0.17 ** | 0.05 * | 0.18 ** | 0.08 ** |
| Folate | 0.59 ** | 0.23 ** | 0.73 ** | 0.79 ** | 0.69 ** | 0.25 ** | 0.68 ** | 0.12 ** | 0.06 * | 0.20 ** | 0.06 * | 0.23 ** | 0.01 | 0.21 ** | 0.06 * |
| Vitamin B12 | 0.35 ** | 0.21 ** | 0.35 ** | 0.41 ** | 0.44 ** | 0.14 ** | 0.44 ** | 0.06 * | 0.27 ** | 0.11 ** | −0.03 | 0.11 ** | 0.32 ** | 0.04 | 0.20 ** |
| Vitamin C | 0.62 ** | 0.18 ** | 0.84 ** | 0.85 ** | 0.50 ** | 0.29 ** | 0.47 ** | 0.12 ** | 0.06 * | 0.18 ** | 0.02 | 0.42 ** | 0.00 | 0.13 ** | −0.03 |
| Vitamin D | 0.31 ** | 0.17 ** | 0.32 ** | 0.36 ** | 0.35 ** | 0.04 | 0.37 ** | −0.02 | 0.15 ** | 0.14 ** | −0.05 | 0.14 ** | 0.06* | 0.10 ** | 0.20 ** |
| Vitamin E | 0.57 ** | 0.21 ** | 0.71 ** | 0.74 ** | 0.76 ** | 0.28 ** | 0.76 ** | 0.15 ** | 0.14 ** | 0.19 ** | 0.01 | 0.15 ** | −0.05 * | 0.19 ** | 0.02 |
| Total polyphenols | 0.46 ** | 0.24 ** | 0.43 ** | 0.44 ** | 0.42 ** | 0.32 ** | 0.39 ** | 0.31 ** | −0.07 ** | 0.37 ** | 0.20 ** | 0.13 ** | −0.11 ** | 0.14 ** | 0.04 |
| Total phytoestrogens | 0.34 ** | 0.14 ** | 0.40 ** | 0.39 ** | 0.38 ** | 0.05 * | −0.05 * | 0.15 | 0.01 | 0.12 * | −0.05 * | 0.11 ** | -0.08 ** | 0.78 ** | 0.04 |
© 2018 by the authors. Licensee MDPI, Basel, Switzerland. This article is an open access article distributed under the terms and conditions of the Creative Commons Attribution (CC BY) license (http://creativecommons.org/licenses/by/4.0/).
Share and Cite
Platania, A.; Castiglione, D.; Sinatra, D.; Urso, M.D.; Marranzano, M. Fluid Intake and Beverage Consumption Description and Their Association with Dietary Vitamins and Antioxidant Compounds in Italian Adults from the Mediterranean Healthy Eating, Aging and Lifestyles (MEAL) Study. Antioxidants 2018, 7, 56. https://0-doi-org.brum.beds.ac.uk/10.3390/antiox7040056
Platania A, Castiglione D, Sinatra D, Urso MD, Marranzano M. Fluid Intake and Beverage Consumption Description and Their Association with Dietary Vitamins and Antioxidant Compounds in Italian Adults from the Mediterranean Healthy Eating, Aging and Lifestyles (MEAL) Study. Antioxidants. 2018; 7(4):56. https://0-doi-org.brum.beds.ac.uk/10.3390/antiox7040056
Chicago/Turabian StylePlatania, Armando, Dora Castiglione, Dario Sinatra, Maurizio D’ Urso, and Marina Marranzano. 2018. "Fluid Intake and Beverage Consumption Description and Their Association with Dietary Vitamins and Antioxidant Compounds in Italian Adults from the Mediterranean Healthy Eating, Aging and Lifestyles (MEAL) Study" Antioxidants 7, no. 4: 56. https://0-doi-org.brum.beds.ac.uk/10.3390/antiox7040056