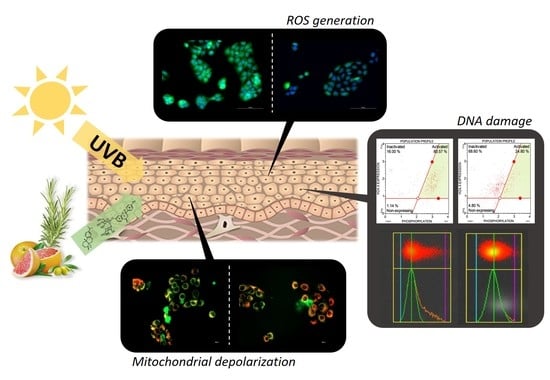
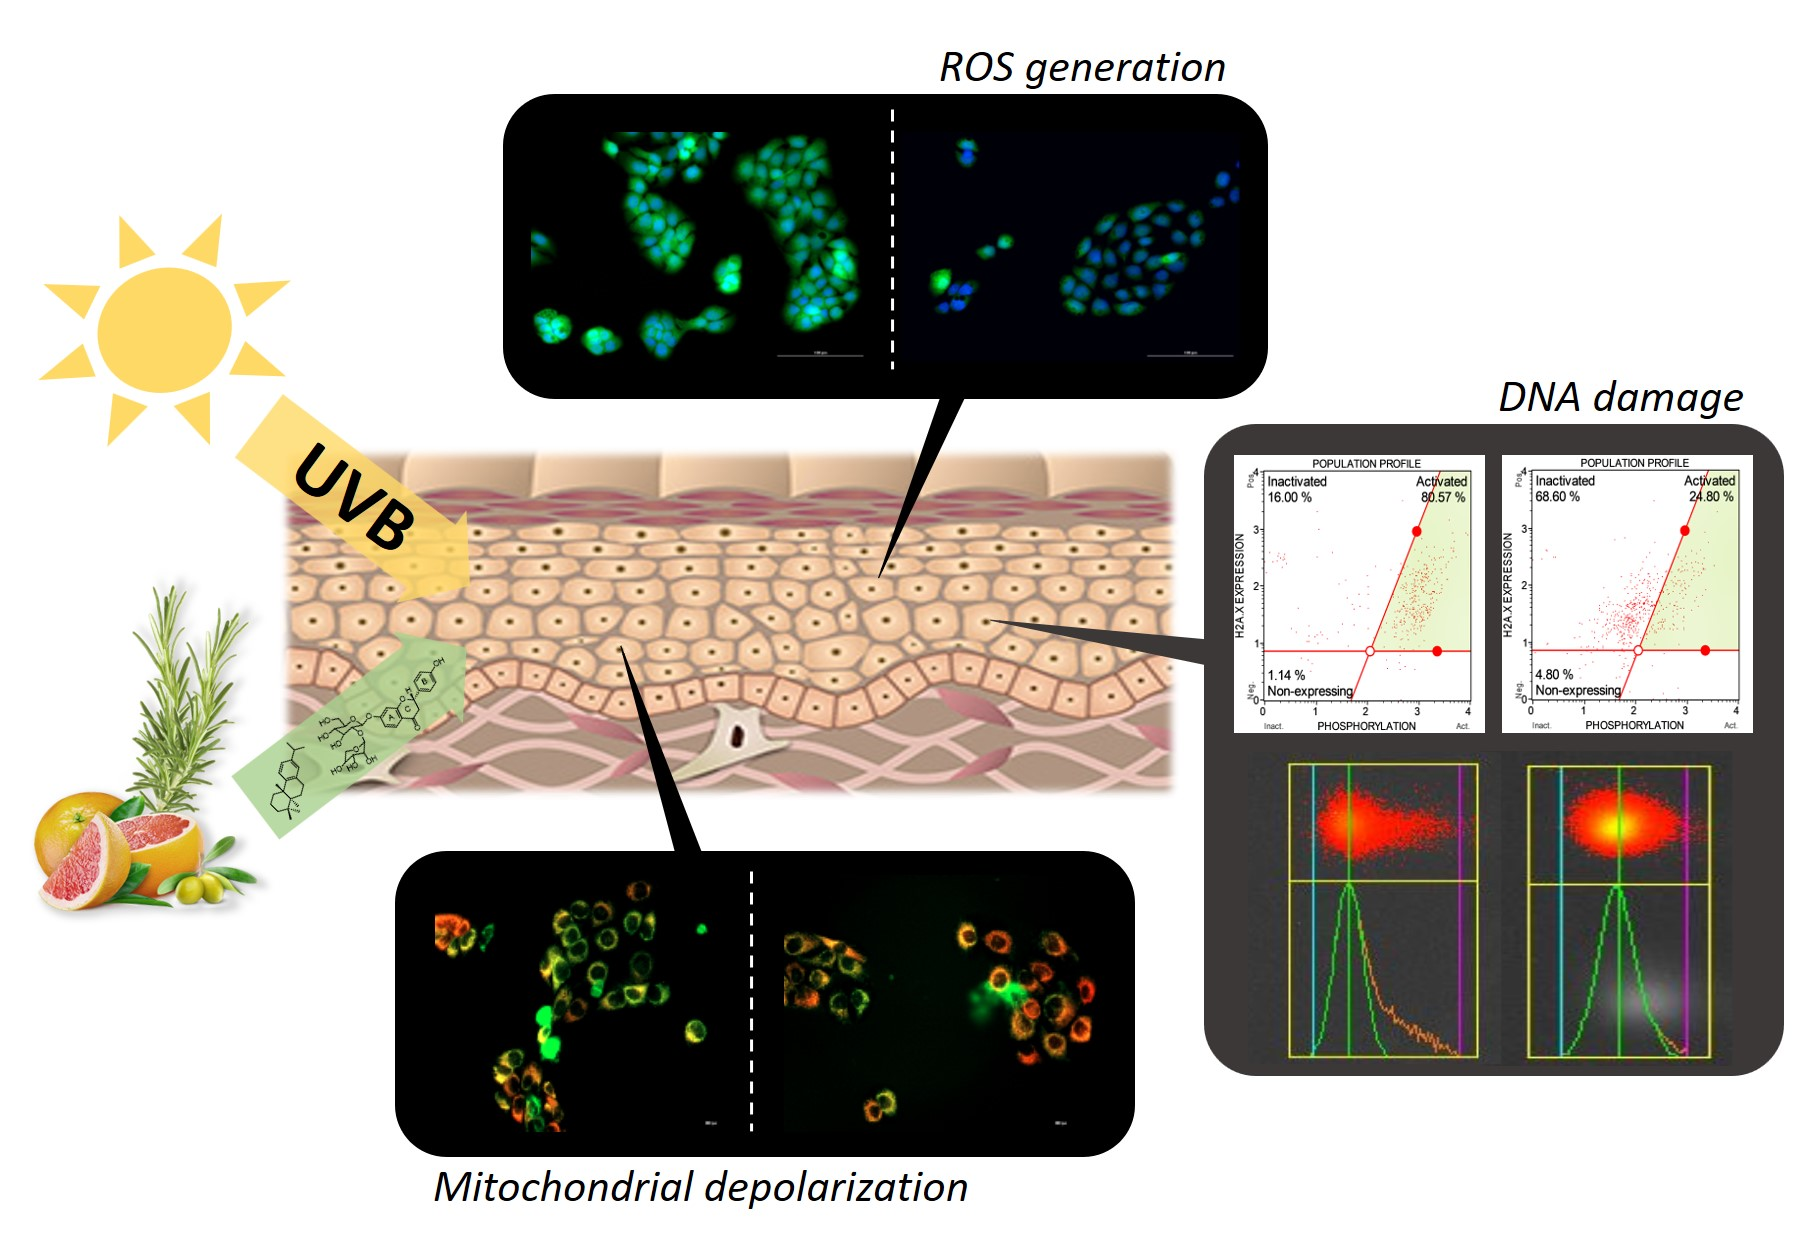
Rosemary Diterpenes and Flavanone Aglycones Provide Improved Genoprotection against UV-Induced DNA Damage in a Human Skin Cell Model

 ,
,  , and
, and 
Abstract
:
1. Introduction
2. Materials and Methods
2.1. Materials
2.2. Formulations
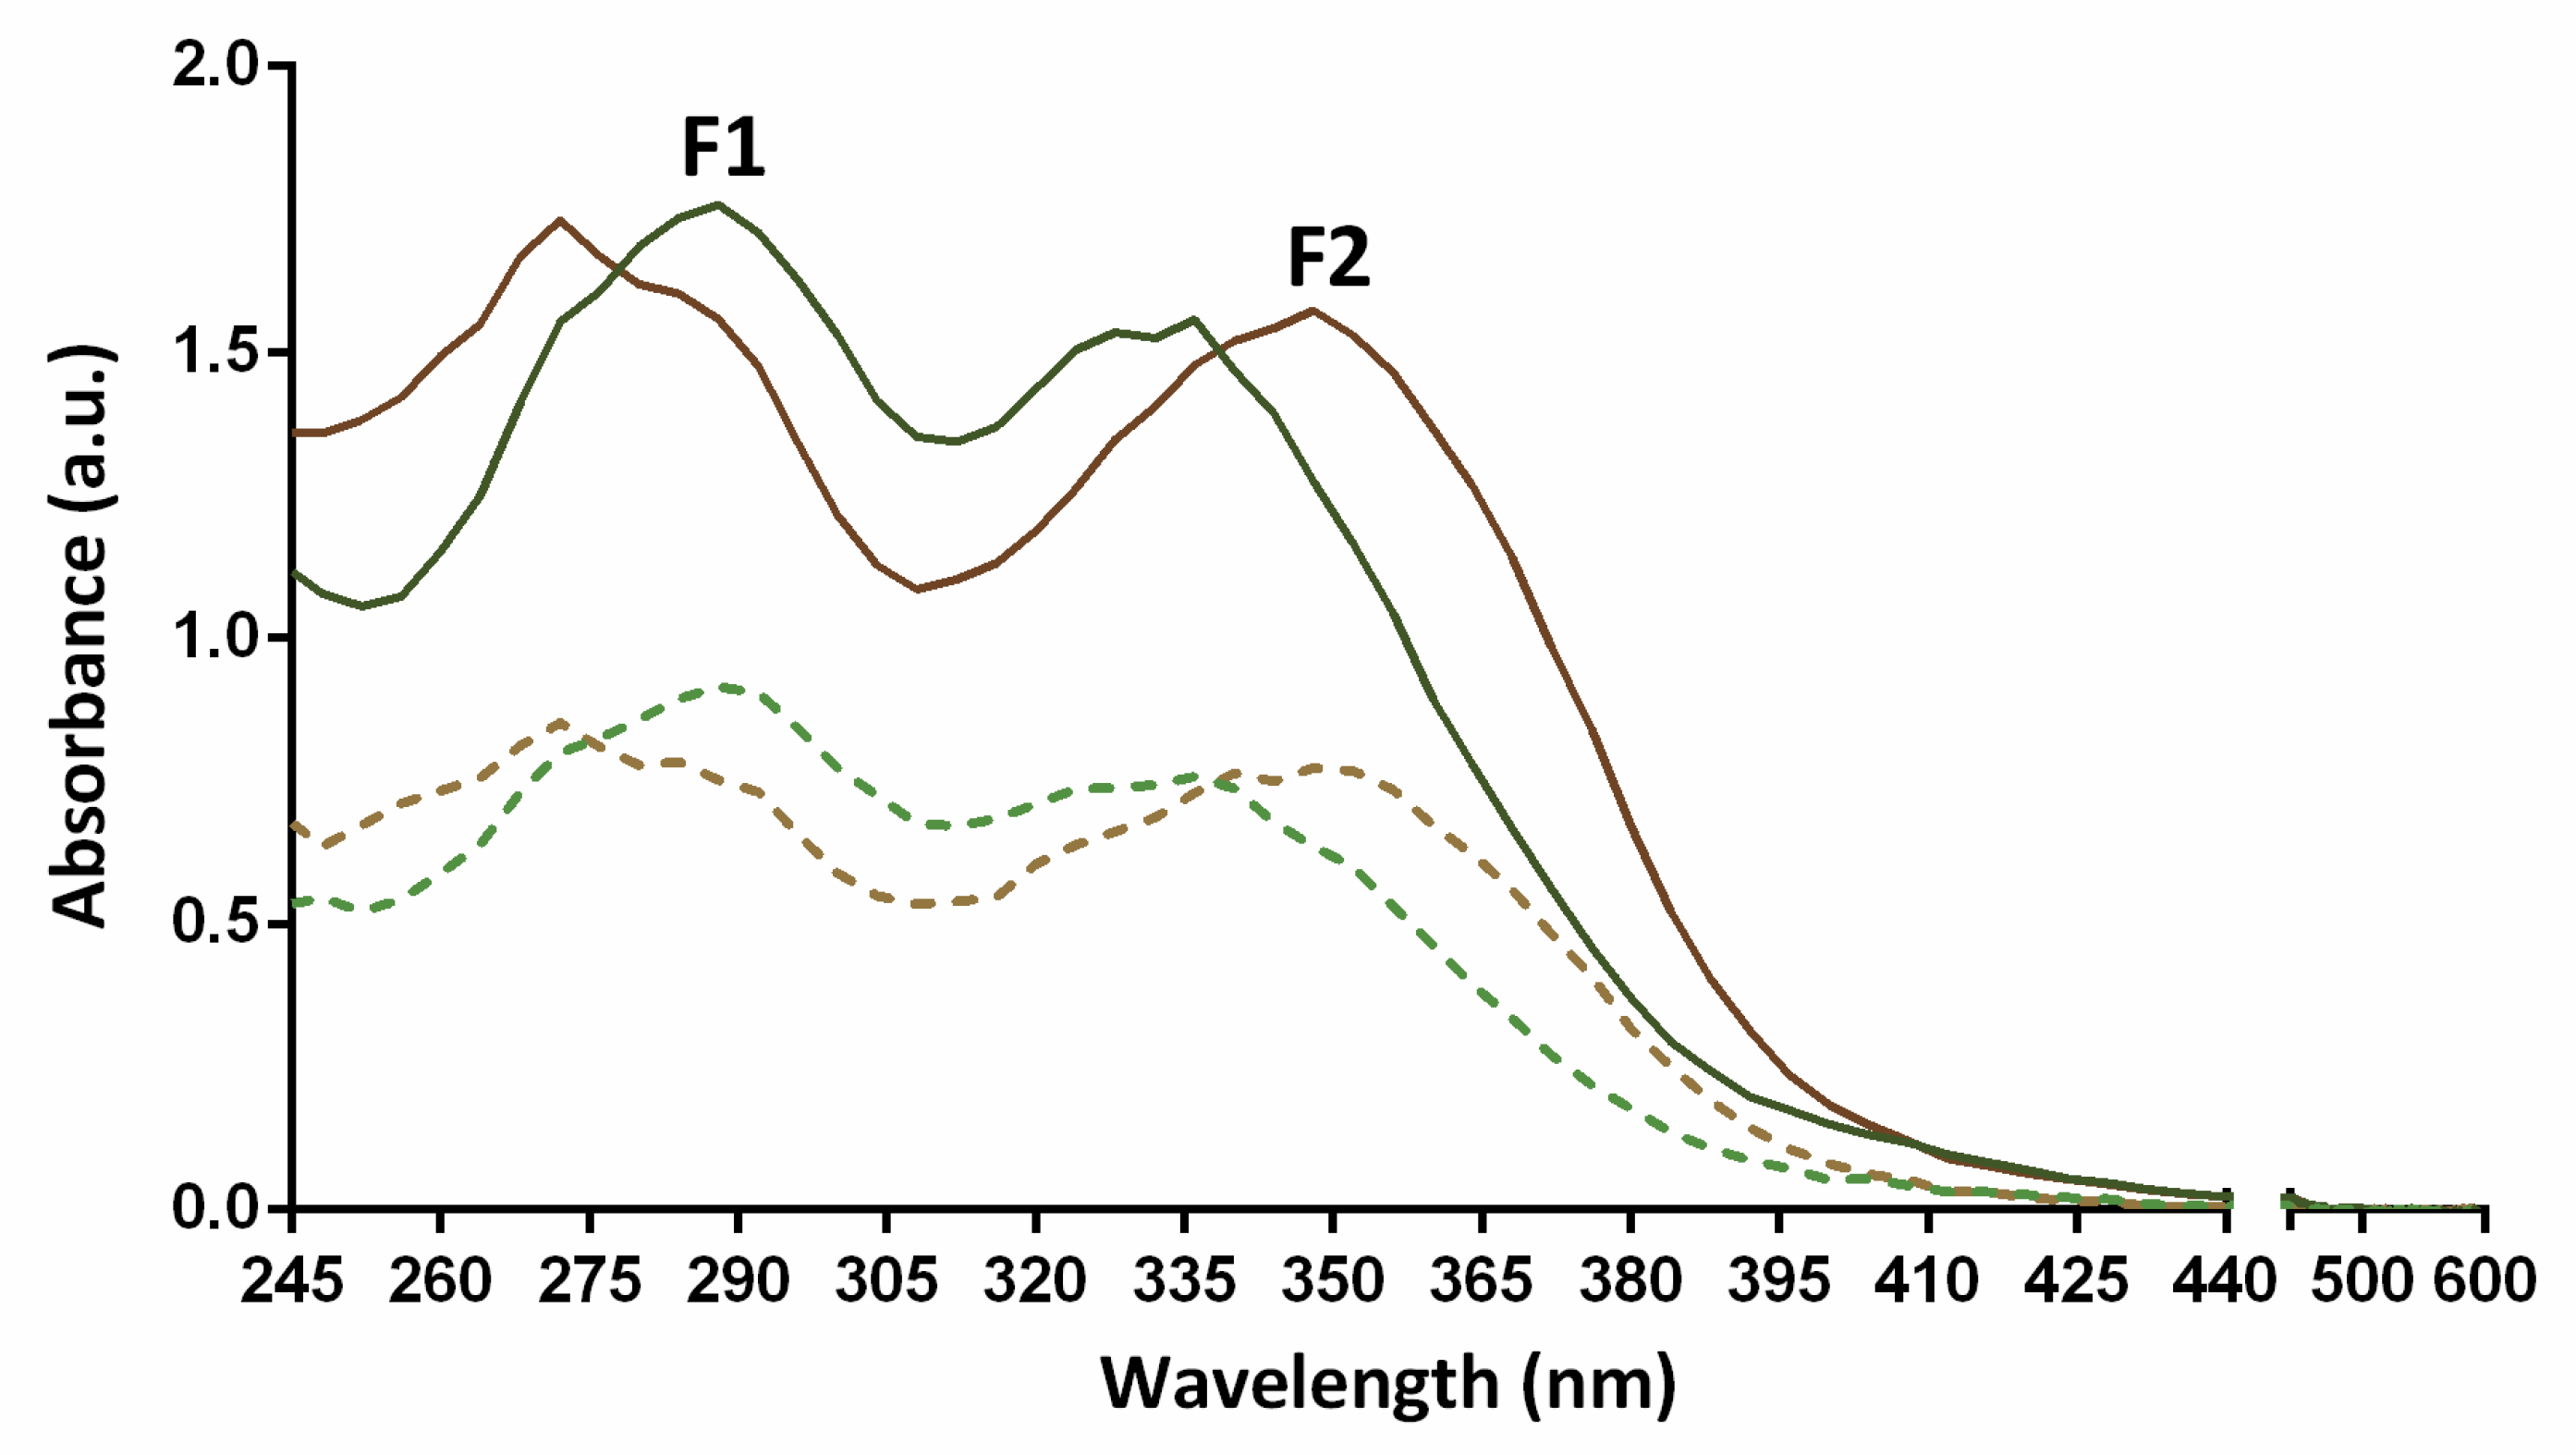
2.3. Total Phenolic Content Determination and Absorption Spectra
2.4. In Vitro Antioxidant Activity Assays
2.5. Maintenance and Treatment of the Keratinocyte Cell Culture
2.6. Cell Survival Quantitation
2.7. Mitochondrial Depolarization Evaluation
2.8. Apoptotic Cell Death and Detection of H2AX Activation
2.9. DNA Double Strand Breaks in Single-Cell Gel Electrophoresis (Comet Assay)
2.10. Intracellular ROS Generation Measurement
2.11. Statistical Analysis
3. Results
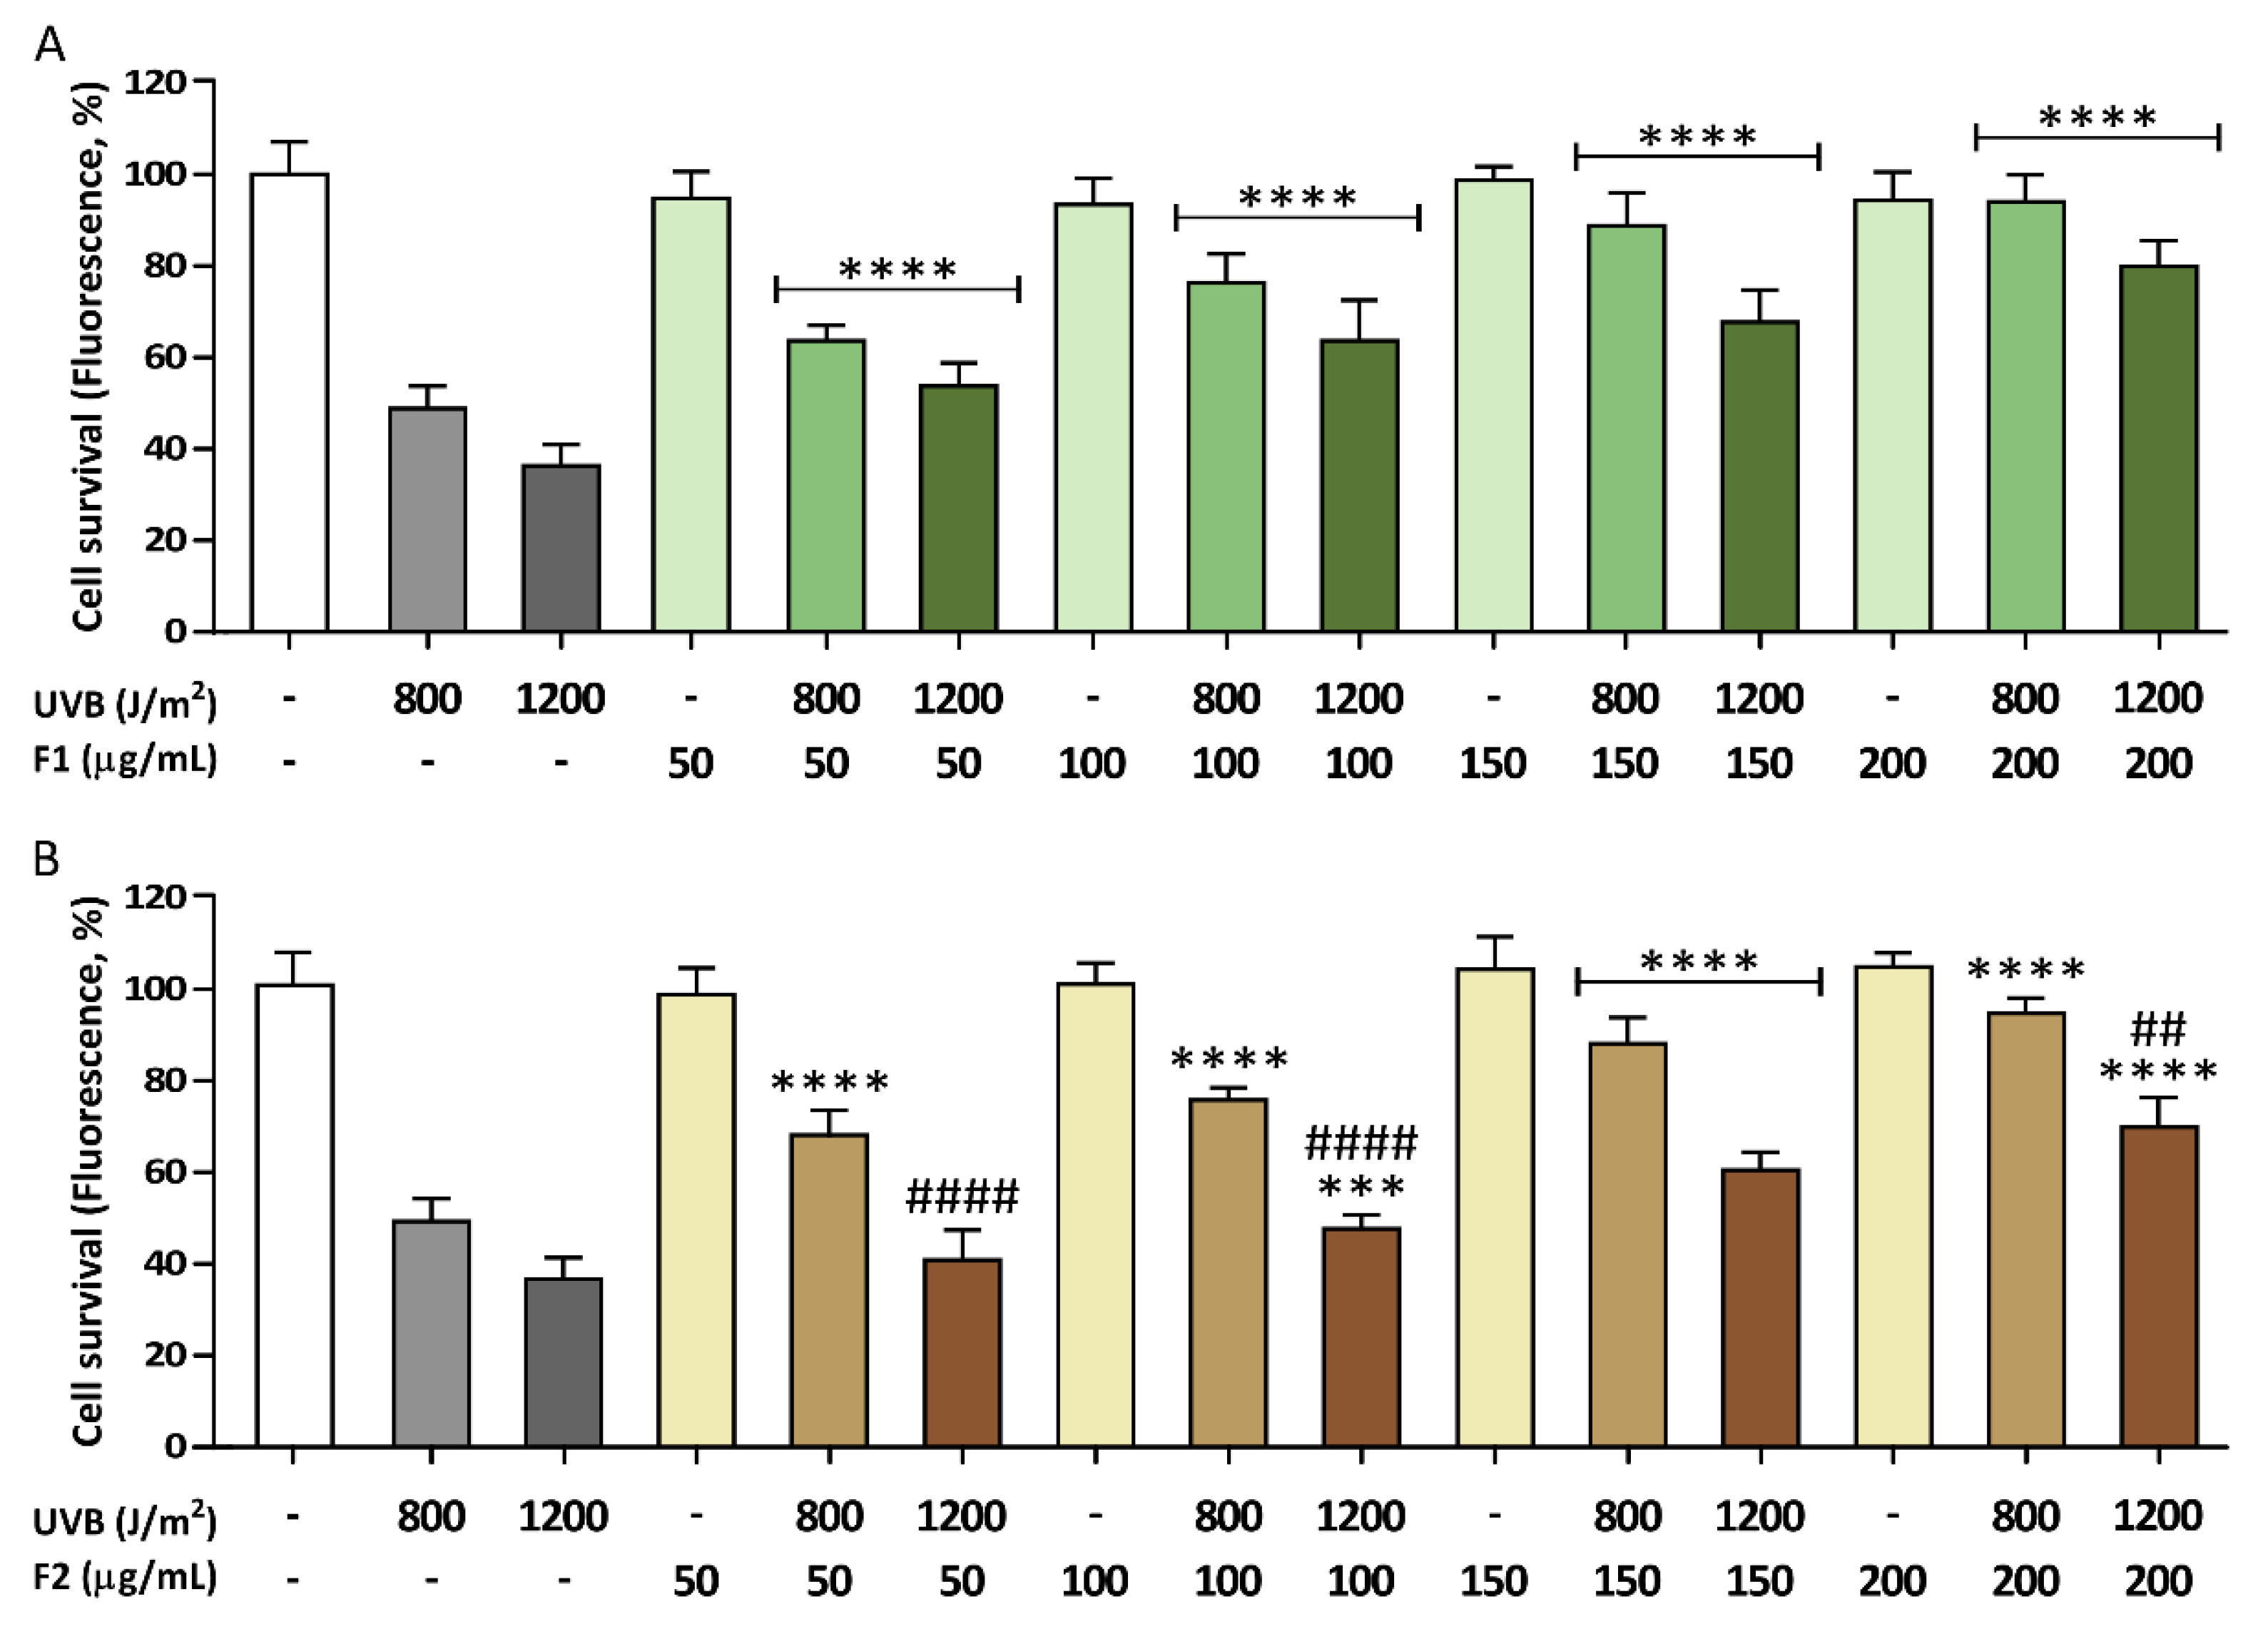
3.1. Photoprotective Effects of the Formulations on the Viability of HaCaT Cells Exposed to UVB Irradiation
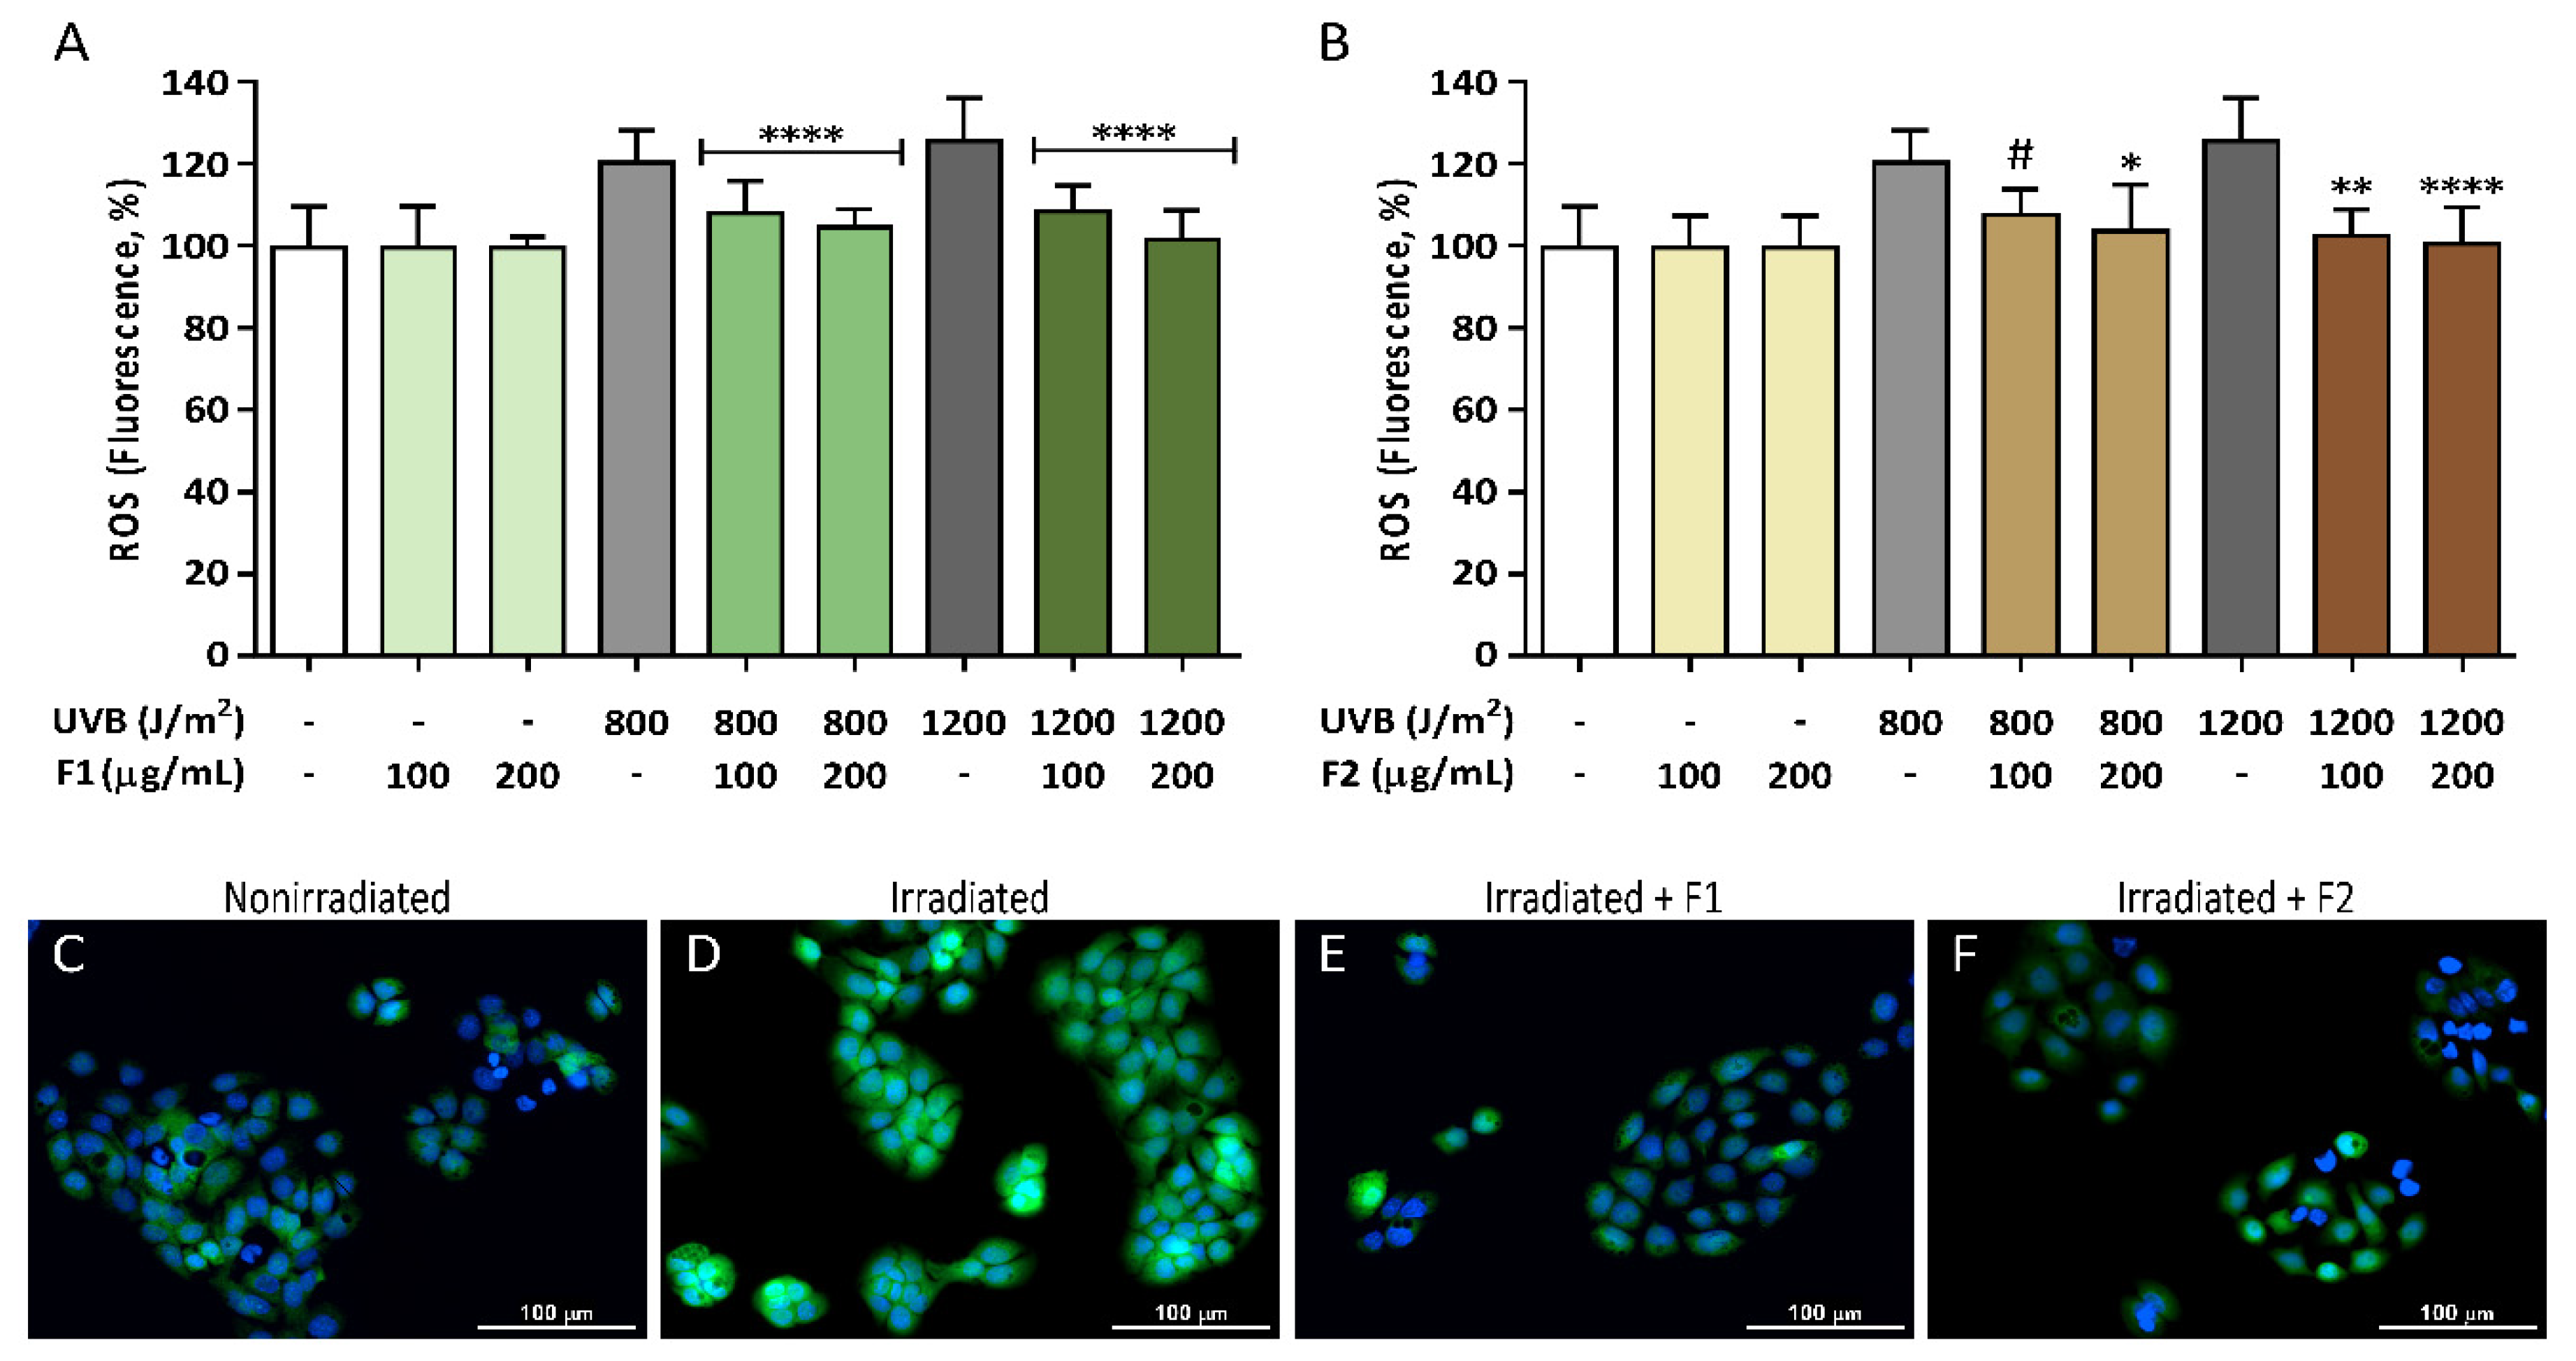
3.2. Antioxidant Activity of the Formulations and Attenuation of ROS Generation in UVB-Irradiated HaCaT Cells
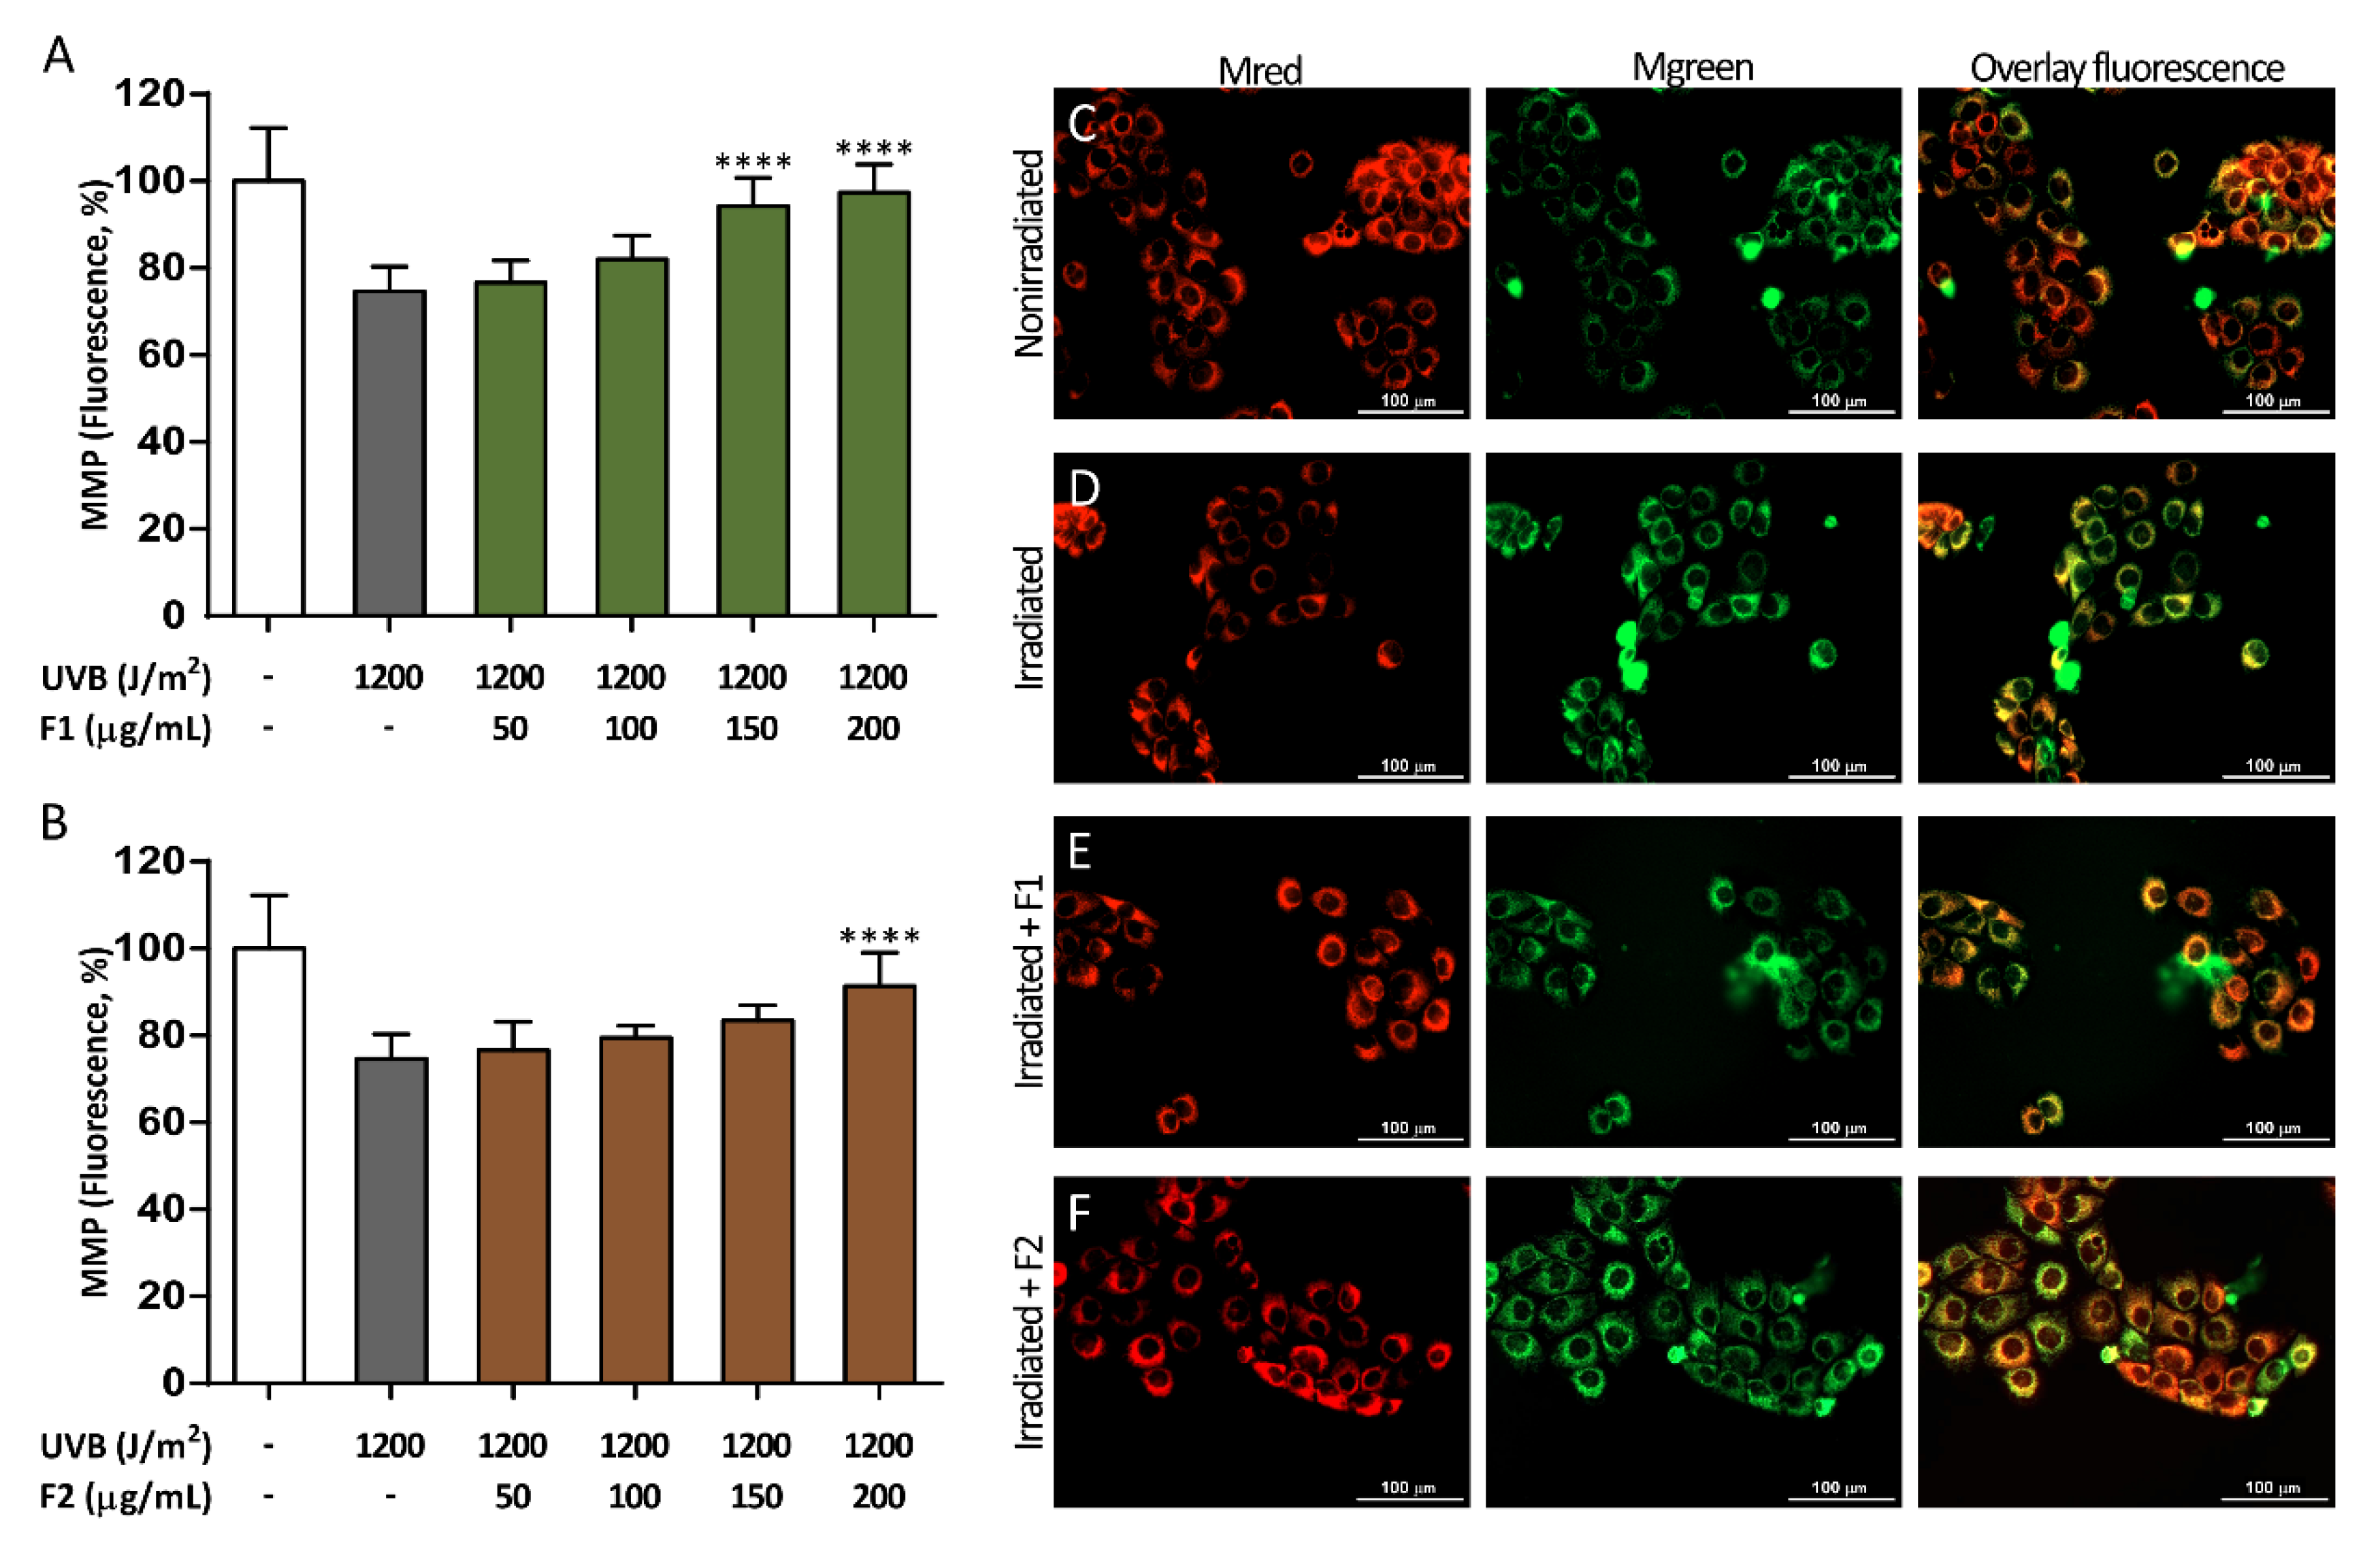
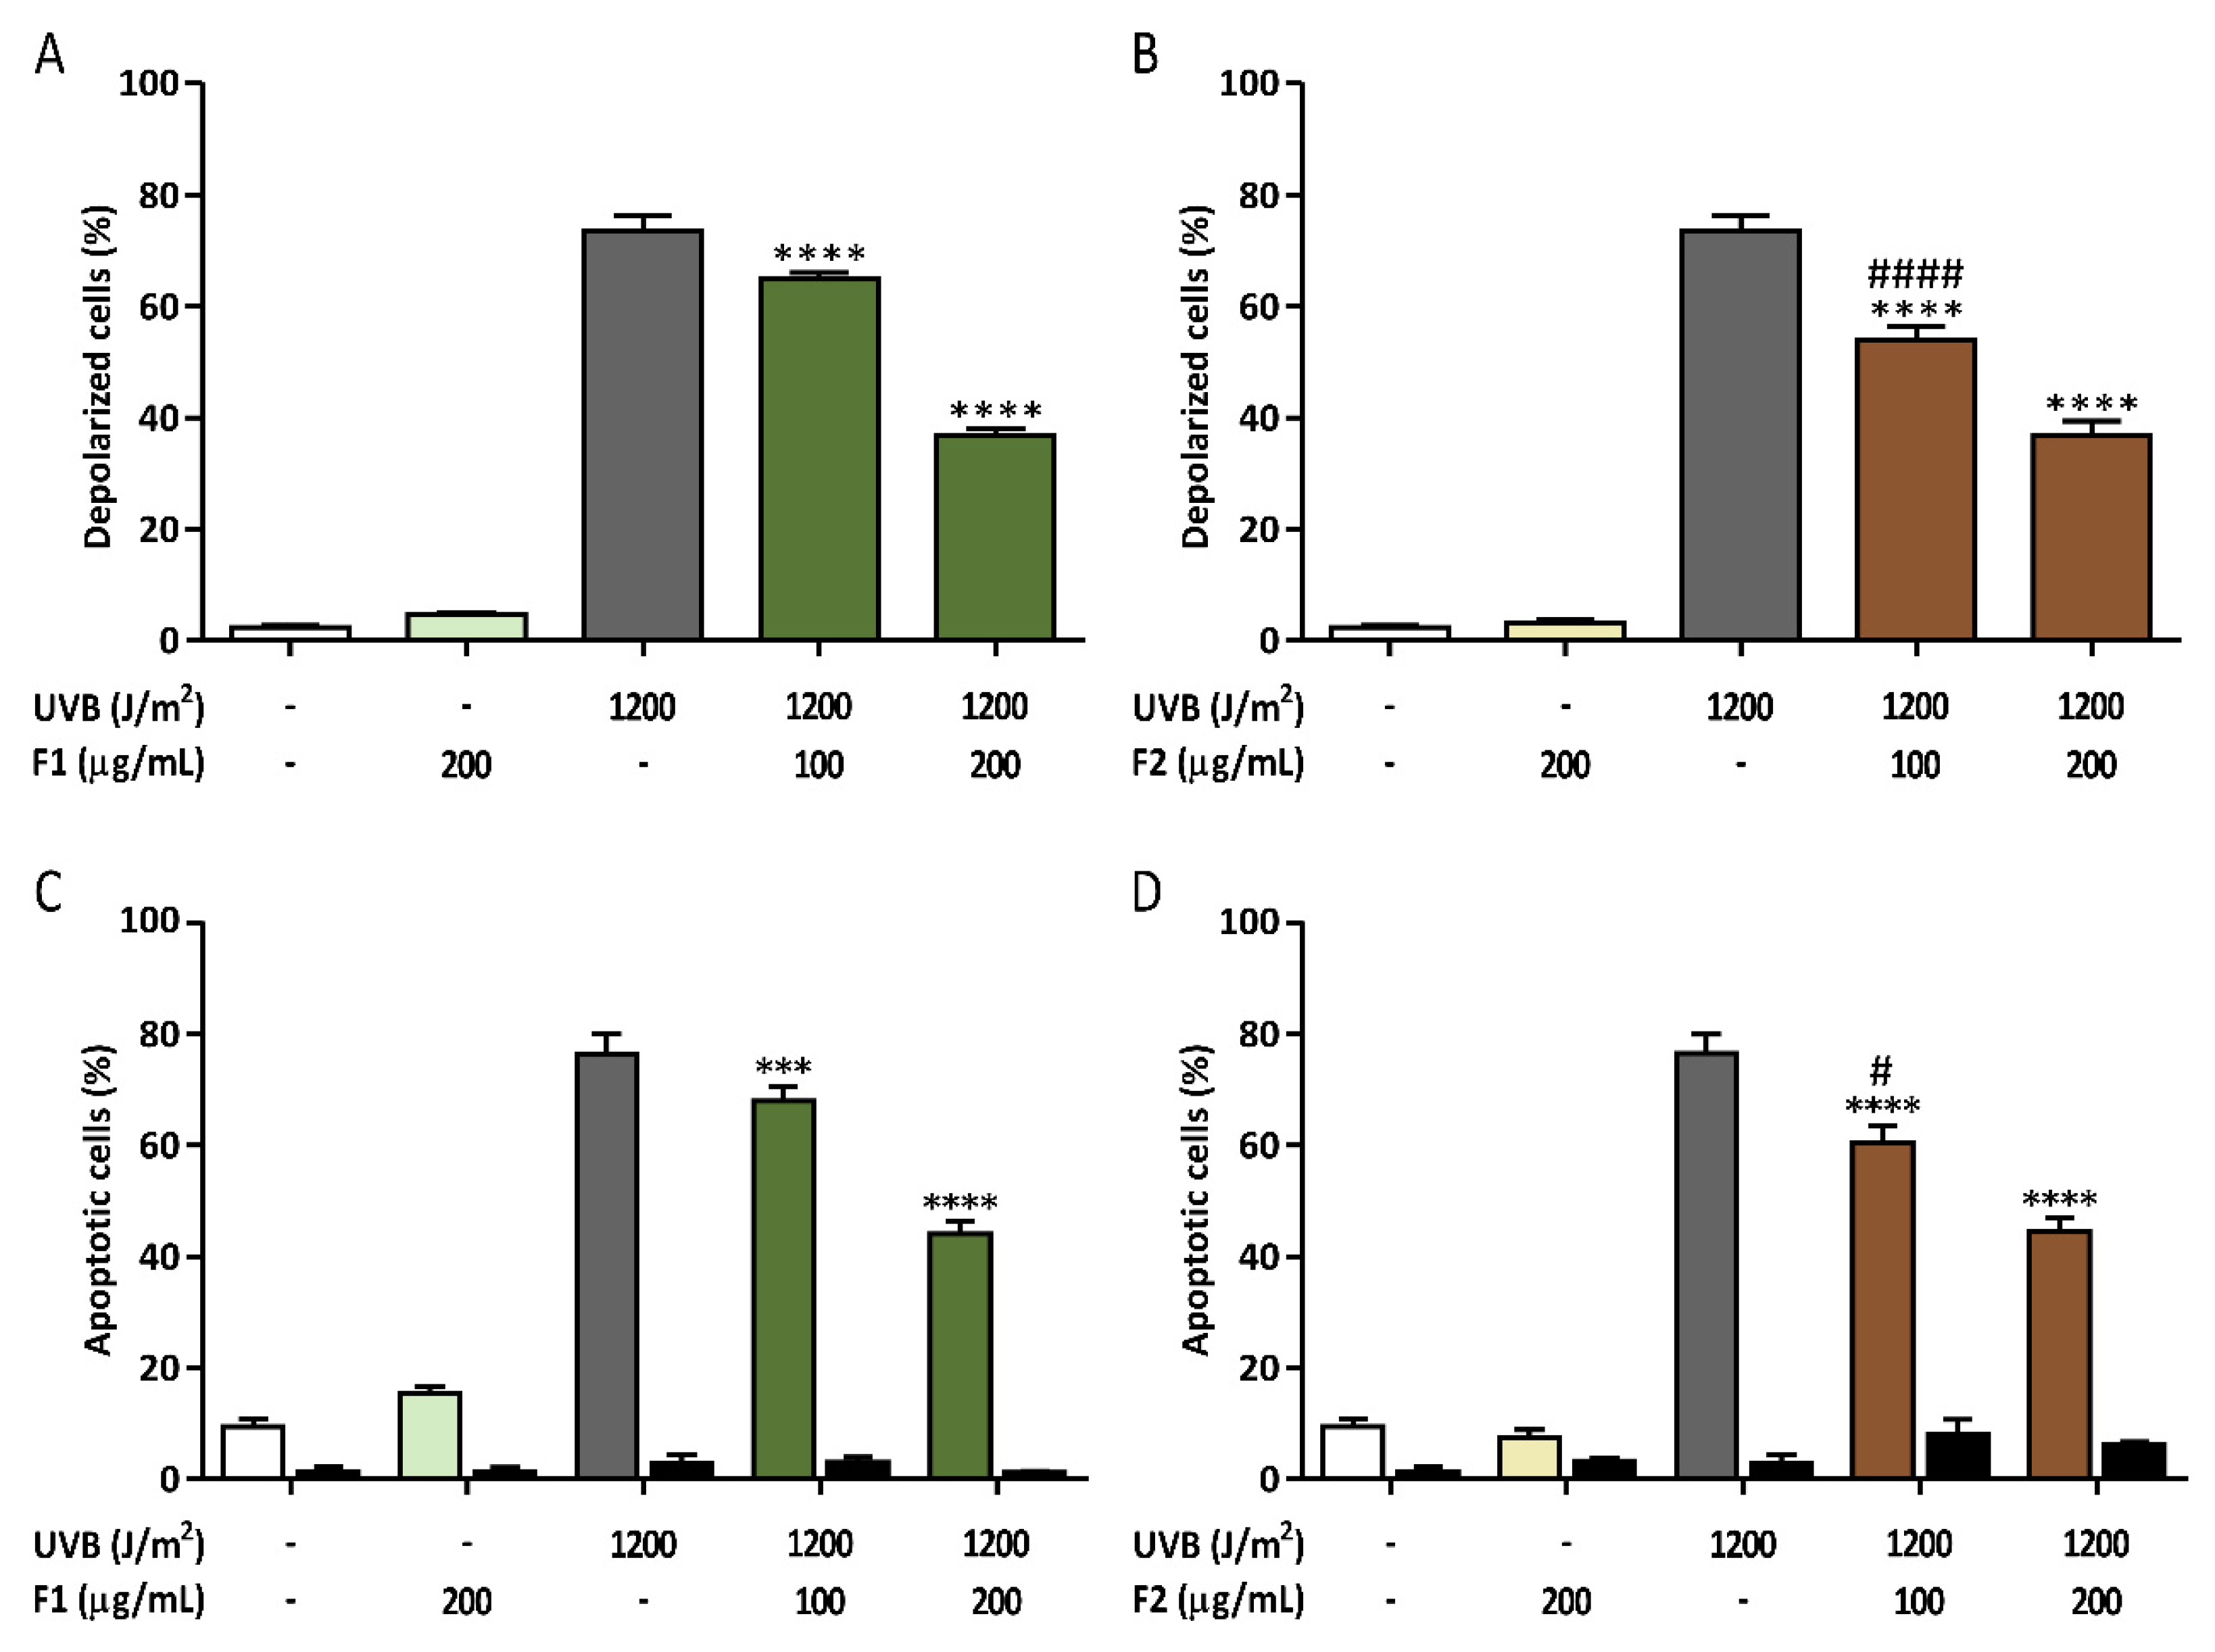
3.3. Influence of the Formulations on UVB-Induced Mitochondrial Depolarization
3.4. Prevention of Late Apoptosis Detected in UVB-Irradiated HaCaT Cells by the Formulations
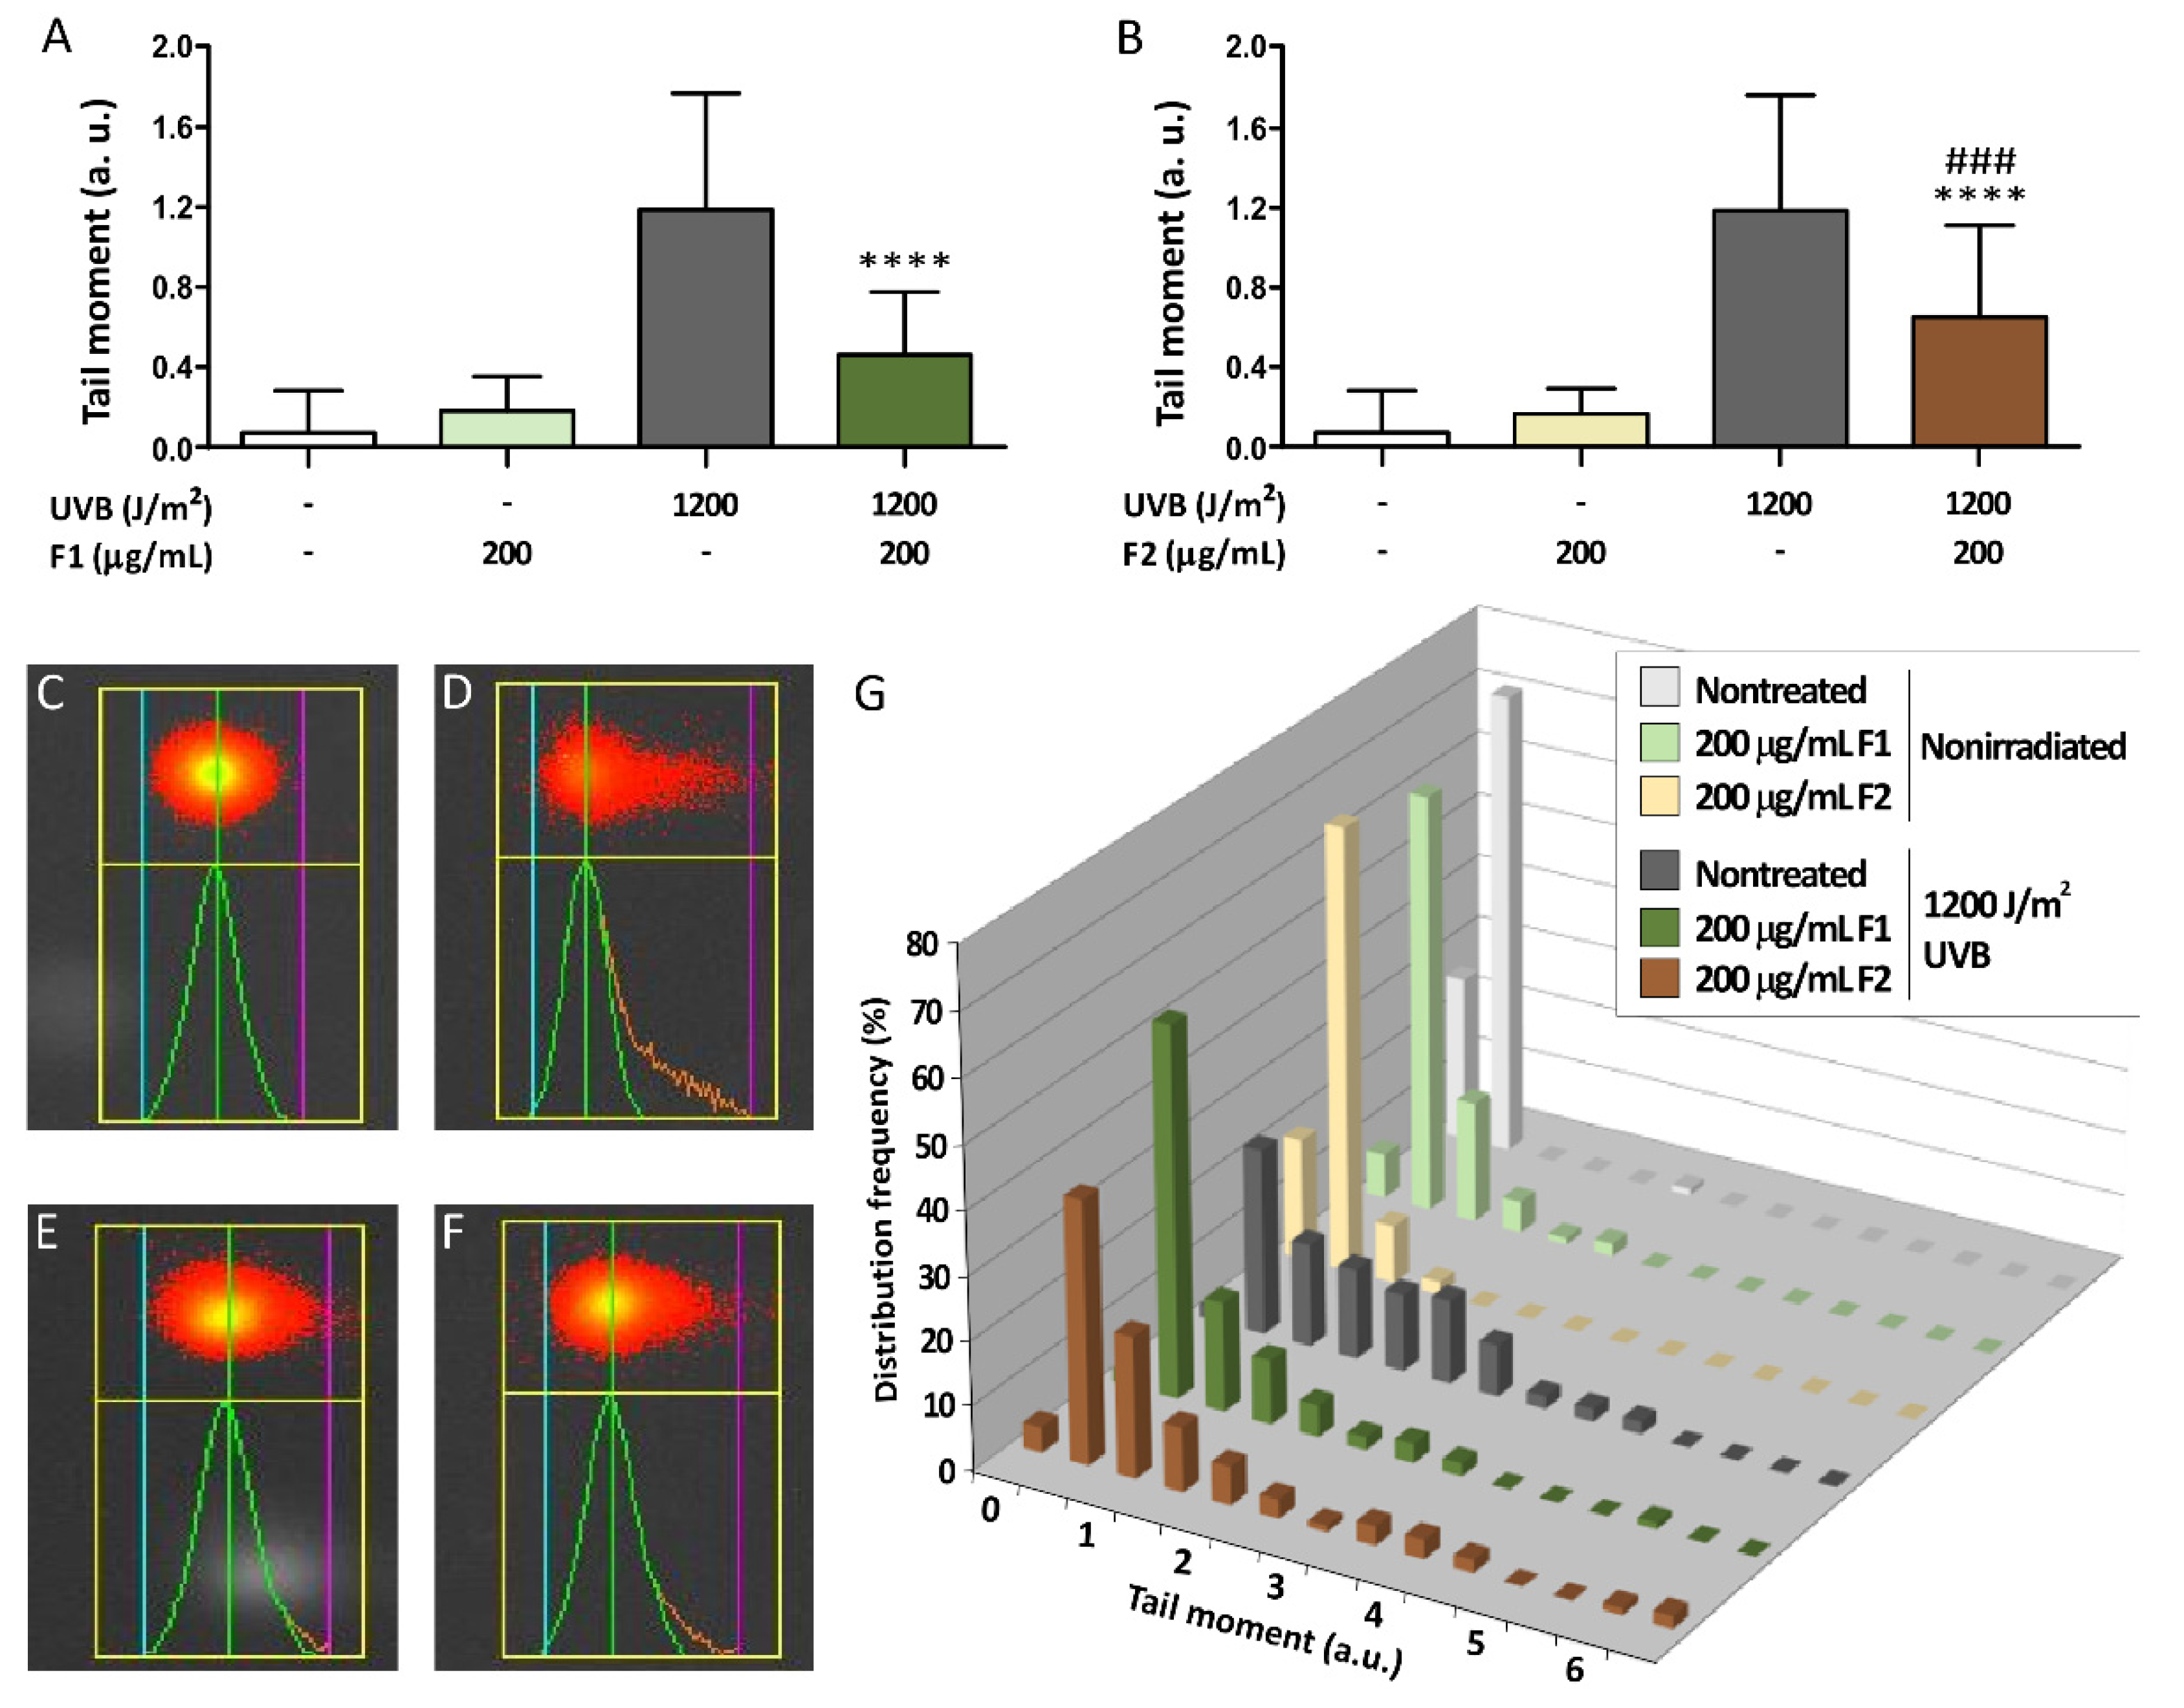
3.5. Influence of the Formulations on UVB-Induced DNA Damage
4. Discussion
Supplementary Materials
Author Contributions
Funding
Conflicts of Interest
References
- Dreno, B. Anatomy and physiology of skin and cutaneous annexes. Ann. Dermatol. Venereol. 2009, 136 (Suppl. 6), S247–S251. [Google Scholar] [CrossRef] [PubMed]
- Afaq, F.; Mukhtar, H. Botanical antioxidants in the prevention of photocarcinogenesis and photoaging. Exp. Dermatol. 2006, 15, 678–684. [Google Scholar] [CrossRef] [PubMed]
- Sander, C.S.; Chang, H.; Hamm, F.; Elsner, P.; Thiele, J.J. Role of oxidative stress and the antioxidant network in cutaneous carcinogenesis. Int. J. Dermatol. 2004, 43, 326–335. [Google Scholar] [CrossRef] [PubMed]
- Briganti, S.; Picardo, M. Antioxidant activity, lipid peroxidation and skin diseases. What’s new. J. Eur. Acad. Dermatol. Venereol. 2003, 17, 663–669. [Google Scholar] [CrossRef] [PubMed]
- Ichihashi, M.; Ueda, M.; Budiyanto, A.; Bito, T.; Oka, M.; Fukunaga, M.; Tsuru, K.; Horikawa, T. UV-induced skin damage. Toxicology 2003, 189, 21–39. [Google Scholar] [CrossRef]
- Chen, A.C.; Halliday, G.M.; Damian, D.L. Non-melanoma skin cancer: Carcinogenesis and chemoprevention. Pathology 2013, 45, 331–341. [Google Scholar] [CrossRef]
- Iliakis, G.; Wang, H.; Perrault, A.R.; Boecker, W.; Rosidi, B.; Windhofer, F.; Wu, W.; Guan, J.; Terzoudi, G.; Pantelias, G. Mechanisms of DNA double strand break repair and chromosome aberration formation. Cytogenet. Genome Res. 2004, 104, 14–20. [Google Scholar] [CrossRef]
- Kulms, D.; Schwarz, T. Molecular mechanisms of UV-induced apoptosis. Photodermatol. Photoimmunol. Photomed. 2000, 16, 195–201. [Google Scholar] [CrossRef]
- Brenner, M.; Hearing, V.J. The protective role of melanin against UV damage in human skin. Photochem. Photobiol. 2008, 84, 539–549. [Google Scholar] [CrossRef] [Green Version]
- Muthusamy, V.; Piva, T.J. The UV response of the skin: A review of the MAPK, NFkappaB and TNFalpha signal transduction pathways. Arch. Dermatol. Res. 2010, 302, 5–17. [Google Scholar] [CrossRef]
- El-Abaseri, T.B.; Hansen, L.A. EGFR activation and ultraviolet light-induced skin carcinogenesis. J. Biomed. Biotechnol. 2007, 2007, 97939. [Google Scholar] [CrossRef] [PubMed] [Green Version]
- Brenneisen, P.; Sies, H.; Scharffetter-Kochanek, K. Ultraviolet-B irradiation and matrix metalloproteinases: From induction via signaling to initial events. Ann. N. Y. Acad. Sci. 2002, 973, 31–43. [Google Scholar] [CrossRef] [PubMed]
- Afaq, F.; Adhami, V.M.; Ahmad, N. Prevention of short-term ultraviolet B radiation-mediated damages by resveratrol in SKH-1 hairless mice. Toxicol. Appl. Pharmacol. 2003, 186, 28–37. [Google Scholar] [CrossRef]
- Katiyar, S.K.; Perez, A.; Mukhtar, H. Green tea polyphenol treatment to human skin prevents formation of ultraviolet light B-induced pyrimidine dimers in DNA. Clin. Cancer Res. 2000, 6, 3864–3869. [Google Scholar] [PubMed]
- Patel, D.; Shukla, S.; Gupta, S. Apigenin and cancer chemoprevention: Progress, potential and promise (review). Int. J. Oncol. 2007, 30, 233–245. [Google Scholar] [CrossRef] [PubMed] [Green Version]
- Wei, H.; Cai, Q.; Rahn, R.O. Inhibition of UV light- and Fenton reaction-induced oxidative DNA damage by the soybean isoflavone genistein. Carcinogenesis 1996, 17, 73–77. [Google Scholar] [CrossRef] [Green Version]
- Fahlman, B.M.; Krol, E.S. Inhibition of UVA and UVB radiation-induced lipid oxidation by quercetin. J. Agric. Food Chem. 2009, 57, 5301–5305. [Google Scholar] [CrossRef]
- Cho, K.S.; Lim, Y.R.; Lee, K.; Lee, J.; Lee, J.H.; Lee, I.S. Terpenes from Forests and Human Health. Toxicol. Res. 2017, 33, 97–106. [Google Scholar] [CrossRef]
- Montes de Oca, M.K.; Pearlman, R.L.; McClees, S.F.; Strickland, R.; Afaq, F. Phytochemicals for the Prevention of Photocarcinogenesis. Photochem. Photobiol. 2017, 93, 956–974. [Google Scholar] [CrossRef]
- Rodrigues, D.; Viotto, A.C.; Checchia, R.; Gomide, A.; Severino, D.; Itri, R.; Baptista, M.S.; Martins, W.K. Mechanism of Aloe Vera extract protection against UVA: Shelter of lysosomal membrane avoids photodamage. Photochem. Photobiol. Sci. 2016, 15, 334–350. [Google Scholar] [CrossRef]
- Zaid, M.A.; Afaq, F.; Syed, D.N.; Dreher, M.; Mukhtar, H. Inhibition of UVB-mediated oxidative stress and markers of photoaging in immortalized HaCaT keratinocytes by pomegranate polyphenol extract POMx. Photochem. Photobiol. 2007, 83, 882–888. [Google Scholar] [CrossRef] [PubMed]
- Feher, P.; Ujhelyi, Z.; Varadi, J.; Fenyvesi, F.; Roka, E.; Juhasz, B.; Varga, B.; Bombicz, M.; Priksz, D.; Bacskay, I.; et al. Efficacy of Pre- and Post-Treatment by Topical Formulations Containing Dissolved and Suspended Silybum marianum against UVB-Induced Oxidative Stress in Guinea Pig and on HaCaT Keratinocytes. Molecules 2016, 21, 1269. [Google Scholar] [CrossRef] [PubMed] [Green Version]
- Pérez-Sánchez, A.; Barrajón-Catalán, E.; Herranz-López, M.; Micol, V. Nutraceuticals for skin care: A comprehensive review of human clinical studies. Nutrients 2018, 10, 403. [Google Scholar] [CrossRef] [PubMed] [Green Version]
- Perez-Sanchez, A.; Barrajon-Catalan, E.; Herranz-Lopez, M.; Castillo, J.; Micol, V. Lemon balm extract (Melissa officinalis, L.) promotes melanogenesis and prevents UVB-induced oxidative stress and DNA damage in a skin cell model. J. Dermatol. Sci. 2016, 84, 169–177. [Google Scholar] [CrossRef] [PubMed]
- Perez-Sanchez, A.; Barrajon-Catalan, E.; Caturla, N.; Castillo, J.; Benavente-Garcia, O.; Alcaraz, M.; Micol, V. Protective effects of citrus and rosemary extracts on UV-induced damage in skin cell model and human volunteers. J. Photochem. Photobiol. B 2014, 136, 12–18. [Google Scholar] [CrossRef]
- Singleton, V.L.; Rossi, J.A. Colorimetry of Total Phenolics with Phosphomolybdic-Phosphotungstic Acid Reagents. Am. J. Enol. Vitic. 1965, 16, 144–158. [Google Scholar]
- Ainsworth, E.A.; Gillespie, K.M. Estimation of total phenolic content and other oxidation substrates in plant tissues using Folin-Ciocalteu reagent. Nat. Protoc. 2007, 2, 875–877. [Google Scholar] [CrossRef]
- Huang, D.; Ou, B.; Prior, R.L. The chemistry behind antioxidant capacity assays. J. Agric. Food Chem. 2005, 53, 1841–1856. [Google Scholar] [CrossRef]
- Ou, B.; Hampsch-Woodill, M.; Prior, R.L. Development and validation of an improved oxygen radical absorbance capacity assay using fluorescein as the fluorescent probe. J. Agric. Food Chem. 2001, 49, 4619–4626. [Google Scholar] [CrossRef]
- Benzie, I.F.; Strain, J.J. The ferric reducing ability of plasma (FRAP) as a measure of “antioxidant power”: The FRAP assay. Anal. Biochem. 1996, 239, 70–76. [Google Scholar] [CrossRef] [Green Version]
- Fahrer, J.; Huelsenbeck, J.; Jaurich, H.; Dorsam, B.; Frisan, T.; Eich, M.; Roos, W.P.; Kaina, B.; Fritz, G. Cytolethal distending toxin (CDT) is a radiomimetic agent and induces persistent levels of DNA double-strand breaks in human fibroblasts. DNA Repair 2014, 18, 31–43. [Google Scholar] [CrossRef] [PubMed]
- Chazal, M.; Roux, E.; Alapetite, C.; Roulin, C.; Moustacchi, E.; Douki, T.; Baudouin, C.; Charveron, M.; Basset-Seguin, N. Interexperimental and interindividual variations of DNA repair capacities after UV-B and UV-C irradiations of human keratinocytes and fibroblasts. Photochem. Photobiol. 2004, 79, 286–290. [Google Scholar] [CrossRef] [PubMed]
- Serafini, M.R.; Guimaraes, A.G.; Quintans, J.S.; Araujo, A.A.; Nunes, P.S.; Quintans-Junior, L.J. Natural compounds for solar photoprotection: A patent review. Expert Opin. Ther. Pat. 2015, 25, 467–478. [Google Scholar] [CrossRef] [PubMed]
- Selvaraj, S.; Krishnaswamy, S.; Devashya, V.; Sethuraman, S.; Krishnan, U.M. Flavonoid-metal ion complexes: A novel class of therapeutic agents. Med. Res. Rev. 2014, 34, 677–702. [Google Scholar] [CrossRef]
- Martinez, R.M.; Pinho-Ribeiro, F.A.; Steffen, V.S.; Silva, T.C.; Caviglione, C.V.; Bottura, C.; Fonseca, M.J.; Vicentini, F.T.; Vignoli, J.A.; Baracat, M.M.; et al. Topical Formulation Containing Naringenin: Efficacy against Ultraviolet B Irradiation-Induced Skin Inflammation and Oxidative Stress in Mice. PLoS ONE 2016, 11, e0146296. [Google Scholar] [CrossRef]
- Serreli, G.; Incani, A.; Atzeri, A.; Angioni, A.; Campus, M.; Cauli, E.; Zurru, R.; Deiana, M. Antioxidant Effect of Natural Table Olives Phenolic Extract Against Oxidative Stress and Membrane Damage in Enterocyte-Like Cells. J. Food Sci. 2017, 82, 380–385. [Google Scholar] [CrossRef]
- Sanchez-Campillo, M.; Gabaldon, J.A.; Castillo, J.; Benavente-Garcia, O.; Del Bano, M.J.; Alcaraz, M.; Vicente, V.; Alvarez, N.; Lozano, J.A. Rosmarinic acid, a photo-protective agent against UV and other ionizing radiations. Food Chem. Toxicol. 2009, 47, 386–392. [Google Scholar] [CrossRef]
- Frankel, E.N.; Huang, S.-W.; Aeschbach, R.; Prior, E. Antioxidant Activity of a Rosemary Extract and Its Constituents, Carnosic Acid, Carnosol, and Rosmarinic Acid, in Bulk Oil and Oil-in-Water Emulsion. J. Agric. Food Chem. 1996, 44, 131–135. [Google Scholar] [CrossRef]
- Xiang, Q.; Liu, Q.; Xu, L.; Qiao, Y.; Wang, Y.; Liu, X. Carnosic acid protects biomolecules from free radical-mediated oxidative damage in vitro. Food Sci. Biotechnol. 2013, 22, 1–8. [Google Scholar] [CrossRef]
- Park, M.; Han, J.; Lee, C.S.; Soo, B.H.; Lim, K.M.; Ha, H. Carnosic acid, a phenolic diterpene from rosemary, prevents UV-induced expression of matrix metalloproteinases in human skin fibroblasts and keratinocytes. Exp. Dermatol. 2013, 22, 336–341. [Google Scholar] [CrossRef]
- Gao, K.; Henning, S.M.; Niu, Y.; Youssefian, A.A.; Seeram, N.P.; Xu, A.; Heber, D. The citrus flavonoid naringenin stimulates DNA repair in prostate cancer cells. J. Nutr. Biochem. 2006, 17, 89–95. [Google Scholar] [CrossRef] [PubMed]
- Funes, L.; Laporta, O.; Cerdán-Calero, M.; Micol, V. Effects of verbascoside, a phenylpropanoid glycoside from lemon verbena, on phospholipid model membranes. Chem. Phys. Lipids 2010, 163, 190–199. [Google Scholar] [CrossRef] [PubMed]
- Herranz-Lopez, M.; Borras-Linares, I.; Olivares-Vicente, M.; Galvez, J.; Segura-Carretero, A.; Micol, V. Correlation between the cellular metabolism of quercetin and its glucuronide metabolite and oxidative stress in hypertrophied 3T3-L1 adipocytes. Phytomed. Int. J. Phytother. Phytopharm. 2017, 25, 25–28. [Google Scholar] [CrossRef] [PubMed]
- Morgan, M.J.; Liu, Z.G. Crosstalk of reactive oxygen species and NF-kappaB signaling. Cell Res. 2011, 21, 103–115. [Google Scholar] [CrossRef] [PubMed] [Green Version]
- Herranz-Lopez, M.; Barrajon-Catalan, E.; Segura-Carretero, A.; Menendez, J.A.; Joven, J.; Micol, V. Lemon verbena (Lippia citriodora) polyphenols alleviate obesity-related disturbances in hypertrophic adipocytes through AMPK-dependent mechanisms. Phytomedicine 2015, 22, 605–614. [Google Scholar] [CrossRef] [PubMed]
- Martinez, R.M.; Pinho-Ribeiro, F.A.; Steffen, V.S.; Caviglione, C.V.; Vignoli, J.A.; Barbosa, D.S.; Baracat, M.M.; Georgetti, S.R.; Verri, W.A., Jr.; Casagrande, R. Naringenin Inhibits UVB Irradiation-Induced Inflammation and Oxidative Stress in the Skin of Hairless Mice. J. Nat. Prod. 2015, 78, 1647–1655. [Google Scholar] [CrossRef] [PubMed]
- Omar, S.H. Oleuropein in olive and its pharmacological effects. Sci. Pharm. 2010, 78, 133–154. [Google Scholar] [CrossRef] [Green Version]
- Johnson, J.J. Carnosol: A promising anti-cancer and anti-inflammatory agent. Cancer Lett. 2011, 305, 1–7. [Google Scholar] [CrossRef] [Green Version]
- Vayssier-Taussat, M.; Kreps, S.E.; Adrie, C.; Dall’Ava, J.; Christiani, D.; Polla, B.S. Mitochondrial membrane potential: A novel biomarker of oxidative environmental stress. Environ. Health Perspect. 2002, 110, 301–305. [Google Scholar] [CrossRef] [Green Version]
- Oliveira, M.R.; Nabavi, S.F.; Daglia, M.; Rastrelli, L.; Nabavi, S.M. Epigallocatechin gallate and mitochondria-A story of life and death. Pharmacol. Res. 2016, 104, 70–85. [Google Scholar] [CrossRef]
- Na, H.K.; Kim, E.H.; Jung, J.H.; Lee, H.H.; Hyun, J.W.; Surh, Y.J. (-)-Epigallocatechin gallate induces Nrf2-mediated antioxidant enzyme expression via activation of PI3K and ERK in human mammary epithelial cells. Arch. Biochem. Biophys. 2008, 476, 171–177. [Google Scholar] [CrossRef] [PubMed]
- Wang, K.; Chen, Z.; Huang, L.; Meng, B.; Zhou, X.; Wen, X.; Ren, D. Naringenin reduces oxidative stress and improves mitochondrial dysfunction via activation of the Nrf2/ARE signaling pathway in neurons. Int. J. Mol. Med. 2017, 40, 1582–1590. [Google Scholar] [CrossRef] [PubMed] [Green Version]
- Hirota, A.; Kawachi, Y.; Itoh, K.; Nakamura, Y.; Xu, X.; Banno, T.; Takahashi, T.; Yamamoto, M.; Otsuka, F. Ultraviolet A irradiation induces NF-E2-related factor 2 activation in dermal fibroblasts: Protective role in UVA-induced apoptosis. J. Investig. Dermatol. 2005, 124, 825–832. [Google Scholar] [CrossRef] [PubMed] [Green Version]
- Zrelli, H.; Kusunoki, M.; Miyazaki, H. Role of Hydroxytyrosol-dependent Regulation of HO-1 Expression in Promoting Wound Healing of Vascular Endothelial Cells via Nrf2 De Novo Synthesis and Stabilization. Phytother. Res. 2015, 29, 1011–1018. [Google Scholar] [CrossRef] [PubMed]
- de Oliveira, M.R.; Ferreira, G.C.; Schuck, P.F. Protective effect of carnosic acid against paraquat-induced redox impairment and mitochondrial dysfunction in SH-SY5Y cells: Role for PI3K/Akt/Nrf2 pathway. Toxicol. In Vitro 2016, 32, 41–54. [Google Scholar] [CrossRef]
- Bivik, C.; Rosdahl, I.; Ollinger, K. Hsp70 protects against UVB induced apoptosis by preventing release of cathepsins and cytochrome c in human melanocytes. Carcinogenesis 2007, 28, 537–544. [Google Scholar] [CrossRef]
- Verschooten, L.; Smaers, K.; Van Kelst, S.; Proby, C.; Maes, D.; Declercq, L.; Agostinis, P.; Garmyn, M. The flavonoid luteolin increases the resistance of normal, but not malignant keratinocytes, against UVB-induced apoptosis. J. Investig. Dermatol. 2010, 130, 2277–2285. [Google Scholar] [CrossRef] [Green Version]
- El-Mahdy, M.A.; Zhu, Q.; Wang, Q.E.; Wani, G.; Patnaik, S.; Zhao, Q.; Arafa el, S.; Barakat, B.; Mir, S.N.; Wani, A.A. Naringenin protects HaCaT human keratinocytes against UVB-induced apoptosis and enhances the removal of cyclobutane pyrimidine dimers from the genome. Photochem. Photobiol. 2008, 84, 307–316. [Google Scholar] [CrossRef] [Green Version]
- Fernandez-Capetillo, O.; Lee, A.; Nussenzweig, M.; Nussenzweig, A. H2AX: The histone guardian of the genome. DNA Repair 2004, 3, 959–967. [Google Scholar] [CrossRef] [Green Version]
- Cadet, J.; Douki, T.; Ravanat, J.L. Oxidatively generated damage to cellular DNA by UVB and UVA radiation. Photochem. Photobiol. 2015, 91, 140–155. [Google Scholar] [CrossRef]
- Burma, S.; Chen, B.P.; Murphy, M.; Kurimasa, A.; Chen, D.J. ATM phosphorylates histone H2AX in response to DNA double-strand breaks. J. Biol. Chem. 2001, 276, 42462–42467. [Google Scholar] [CrossRef] [PubMed] [Green Version]
- Dedon, P.C.; Plastaras, J.P.; Rouzer, C.A.; Marnett, L.J. Indirect mutagenesis by oxidative DNA damage: Formation of the pyrimidopurinone adduct of deoxyguanosine by base propenal. Proc. Natl. Acad. Sci. USA 1998, 95, 11113–11116. [Google Scholar] [CrossRef] [PubMed] [Green Version]
- Del Bano, M.J.; Castillo, J.; Benavente-Garcia, O.; Lorente, J.; Martin-Gil, R.; Acevedo, C.; Alcaraz, M. Radioprotective-antimutagenic effects of rosemary phenolics against chromosomal damage induced in human lymphocytes by gamma-rays. J. Agric. Food Chem. 2006, 54, 2064–2068. [Google Scholar] [CrossRef] [PubMed]
- Alcaraz, M.; Acevedo, C.; Castillo, J.; Benavente-Garcia, O.; Armero, D.; Vicente, V.; Canteras, M. Liposoluble antioxidants provide an effective radioprotective barrier. Br. J. Radiol. 2009, 82, 605–609. [Google Scholar] [CrossRef] [PubMed]
- Cadet, J.; Wagner, J.R. DNA base damage by reactive oxygen species, oxidizing agents, and UV radiation. Cold Spring Harb. Perspect. Biol. 2013, 5, a012559. [Google Scholar] [CrossRef]


| Dry Weight Content (%) | |||
|---|---|---|---|
| F1 | F2 | ||
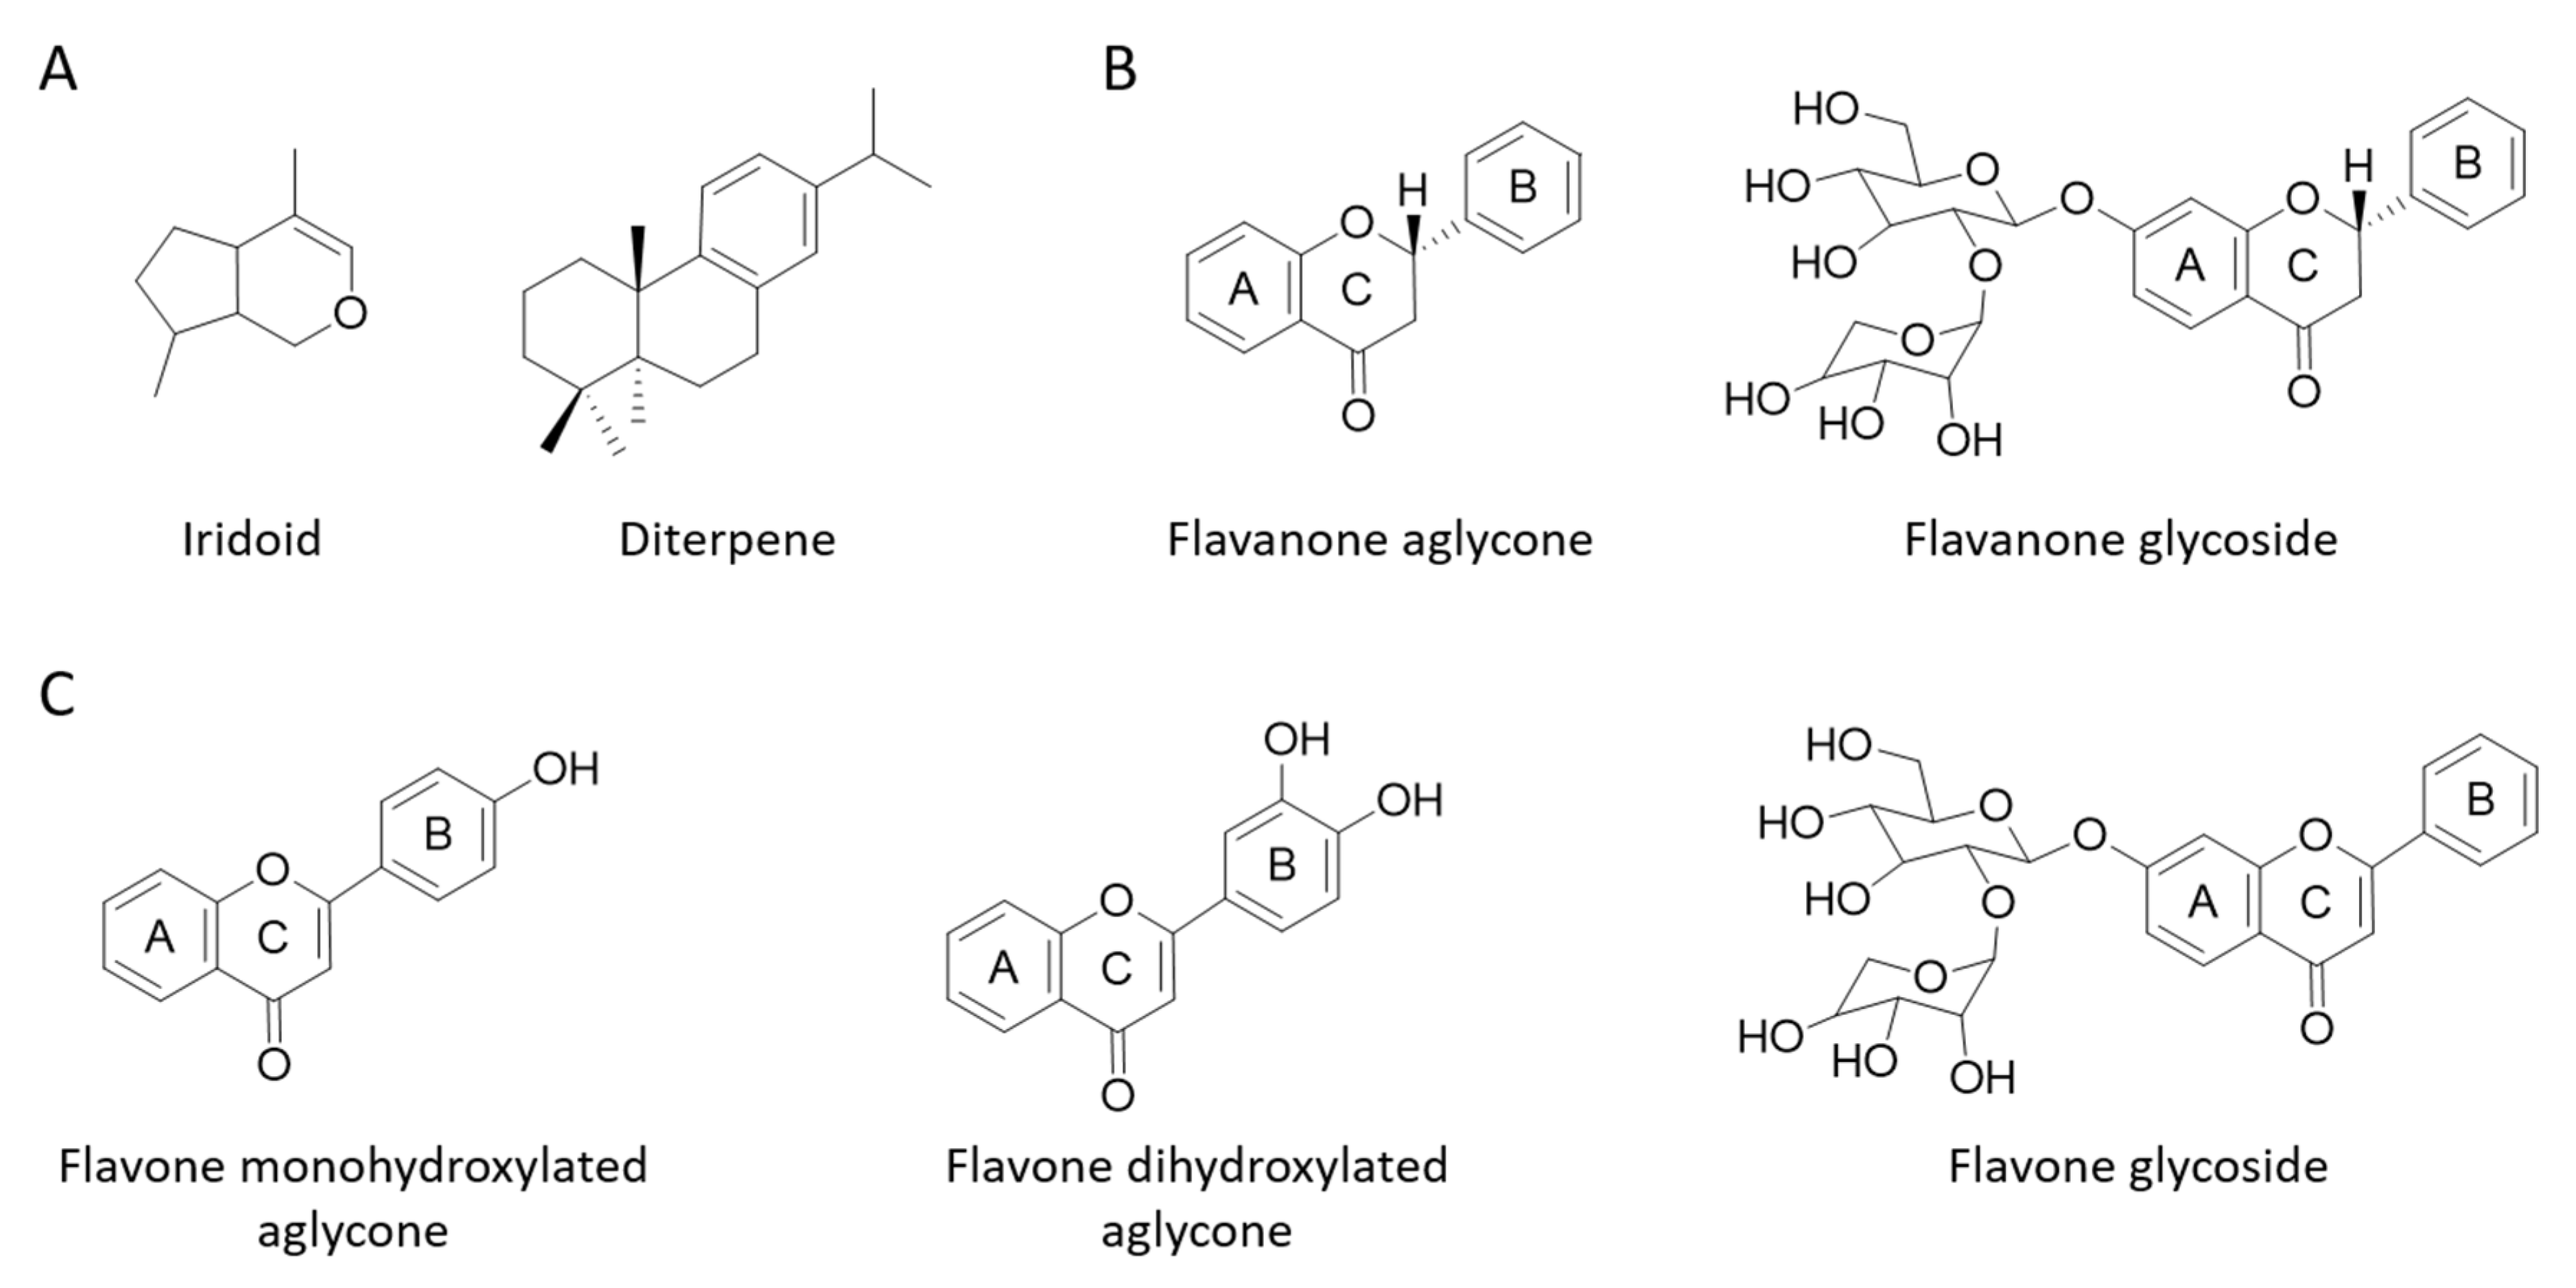
| Iridoids | 15 | 15 | |
| Diterpenes | 5 | 0 | |
| Flavanones | Aglycones | 33 | 0 |
| Glycosides | 12 | 50 | |
| Flavones | Monohydroxylated aglycones | 34 | 17 |
| Dihydroxylated aglycones | 0 | 17 | |
| Glycosides | 1 | 1 | |
| Assay | F1 | F2 | Student’s t-Test |
|---|---|---|---|
| Folin-Ciocalteu (g GAE a/100 g dw c) | 40.8 ± 2.6 | 36.4 ± 2.7 | #### |
| TEAC (mmol TE b/100 g dw c) | 417.6 ± 55.9 | 332.2 ± 56.5 | ## |
| ORAC (μmol TE b/g dw c) | 2638.8 ± 131.8 | 2114.0 ± 252.7 | #### |
| FRAP (mmol Fe2+/100 g dw c) | 719.3 ± 71.2 | 857.7 ± 78.2 | # |
© 2020 by the authors. Licensee MDPI, Basel, Switzerland. This article is an open access article distributed under the terms and conditions of the Creative Commons Attribution (CC BY) license (http://creativecommons.org/licenses/by/4.0/).
Share and Cite
Sánchez-Marzo, N.; Pérez-Sánchez, A.; Barrajón-Catalán, E.; Castillo, J.; Herranz-López, M.; Micol, V. Rosemary Diterpenes and Flavanone Aglycones Provide Improved Genoprotection against UV-Induced DNA Damage in a Human Skin Cell Model. Antioxidants 2020, 9, 255. https://0-doi-org.brum.beds.ac.uk/10.3390/antiox9030255
Sánchez-Marzo N, Pérez-Sánchez A, Barrajón-Catalán E, Castillo J, Herranz-López M, Micol V. Rosemary Diterpenes and Flavanone Aglycones Provide Improved Genoprotection against UV-Induced DNA Damage in a Human Skin Cell Model. Antioxidants. 2020; 9(3):255. https://0-doi-org.brum.beds.ac.uk/10.3390/antiox9030255
Chicago/Turabian StyleSánchez-Marzo, Noelia, Almudena Pérez-Sánchez, Enrique Barrajón-Catalán, Julián Castillo, María Herranz-López, and Vicente Micol. 2020. "Rosemary Diterpenes and Flavanone Aglycones Provide Improved Genoprotection against UV-Induced DNA Damage in a Human Skin Cell Model" Antioxidants 9, no. 3: 255. https://0-doi-org.brum.beds.ac.uk/10.3390/antiox9030255