
Evaluation of Recombinant Herpesvirus of Turkey Laryngotracheitis (rHVT-LT) Vaccine against Genotype VI Canadian Wild-Type Infectious Laryngotracheitis Virus (ILTV) Infection

 , , , , ,
Abstract
:1. Introduction
2. Materials and Methods
2.1. Animals and Ethics Statement
2.2. ILTV Virus
2.3. Vaccine and Vaccine Titration
2.4. Experimental Design
2.5. Serology
2.6. DNA Extraction and Quantitative Polymerase Chain Reaction (qPCR) Assay
2.7. Peripheral Blood Mononuclear Cell (PBMC) Isolation
2.8. Staining for Flow Cytometry Analysis
2.9. Histology
2.10. Data and Statistical Analyses
3. Results
3.1. HVT Genome Loads
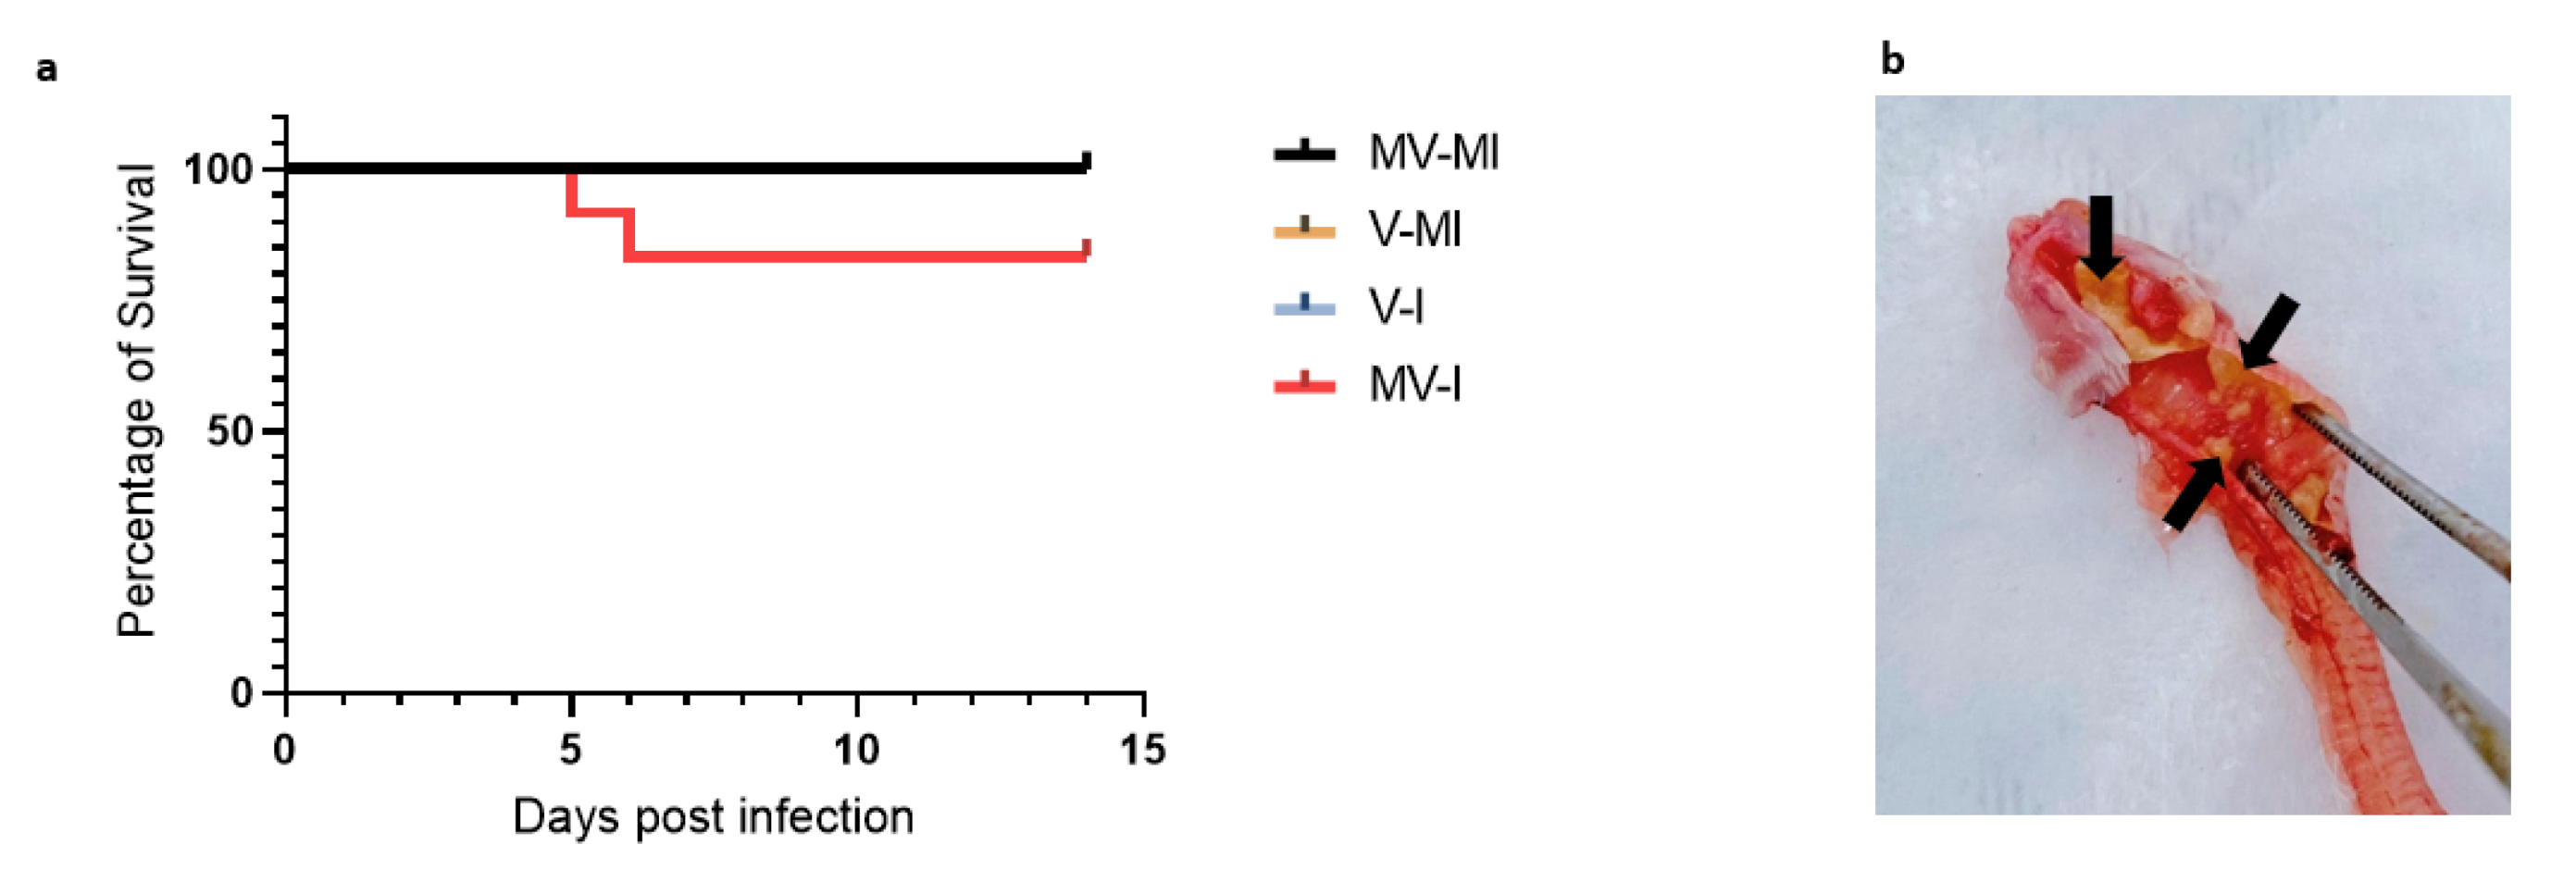
3.2. Percentages of Remaining Animals Following Euthanasia of Chickens Reaching Humane Endpoint
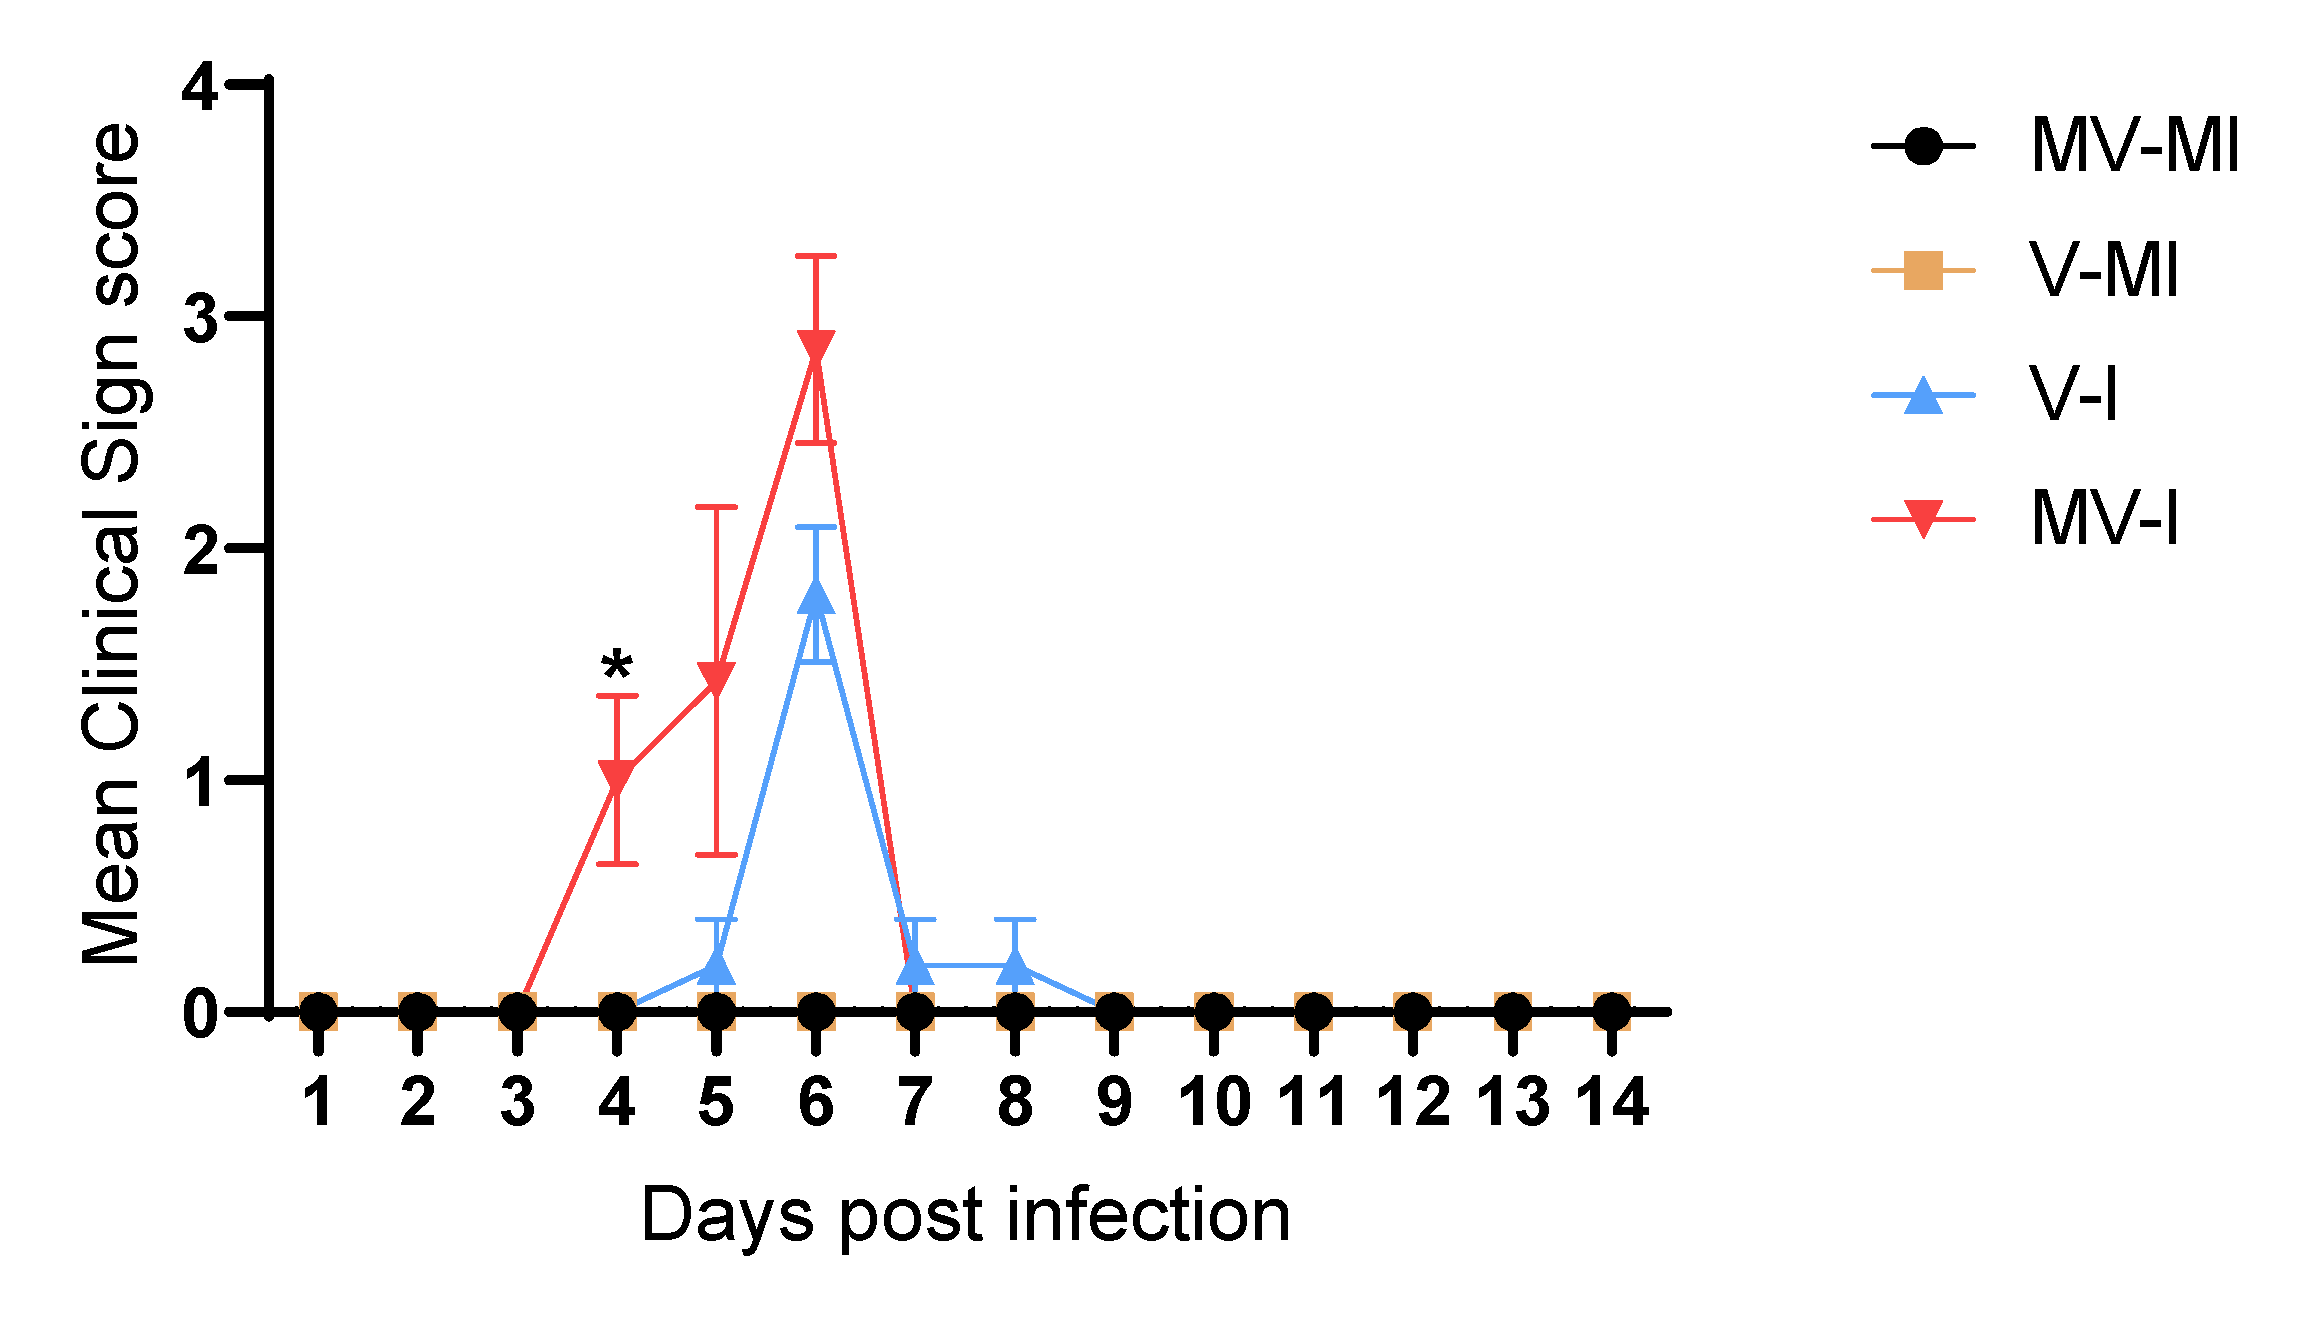
3.3. Clinical Signs
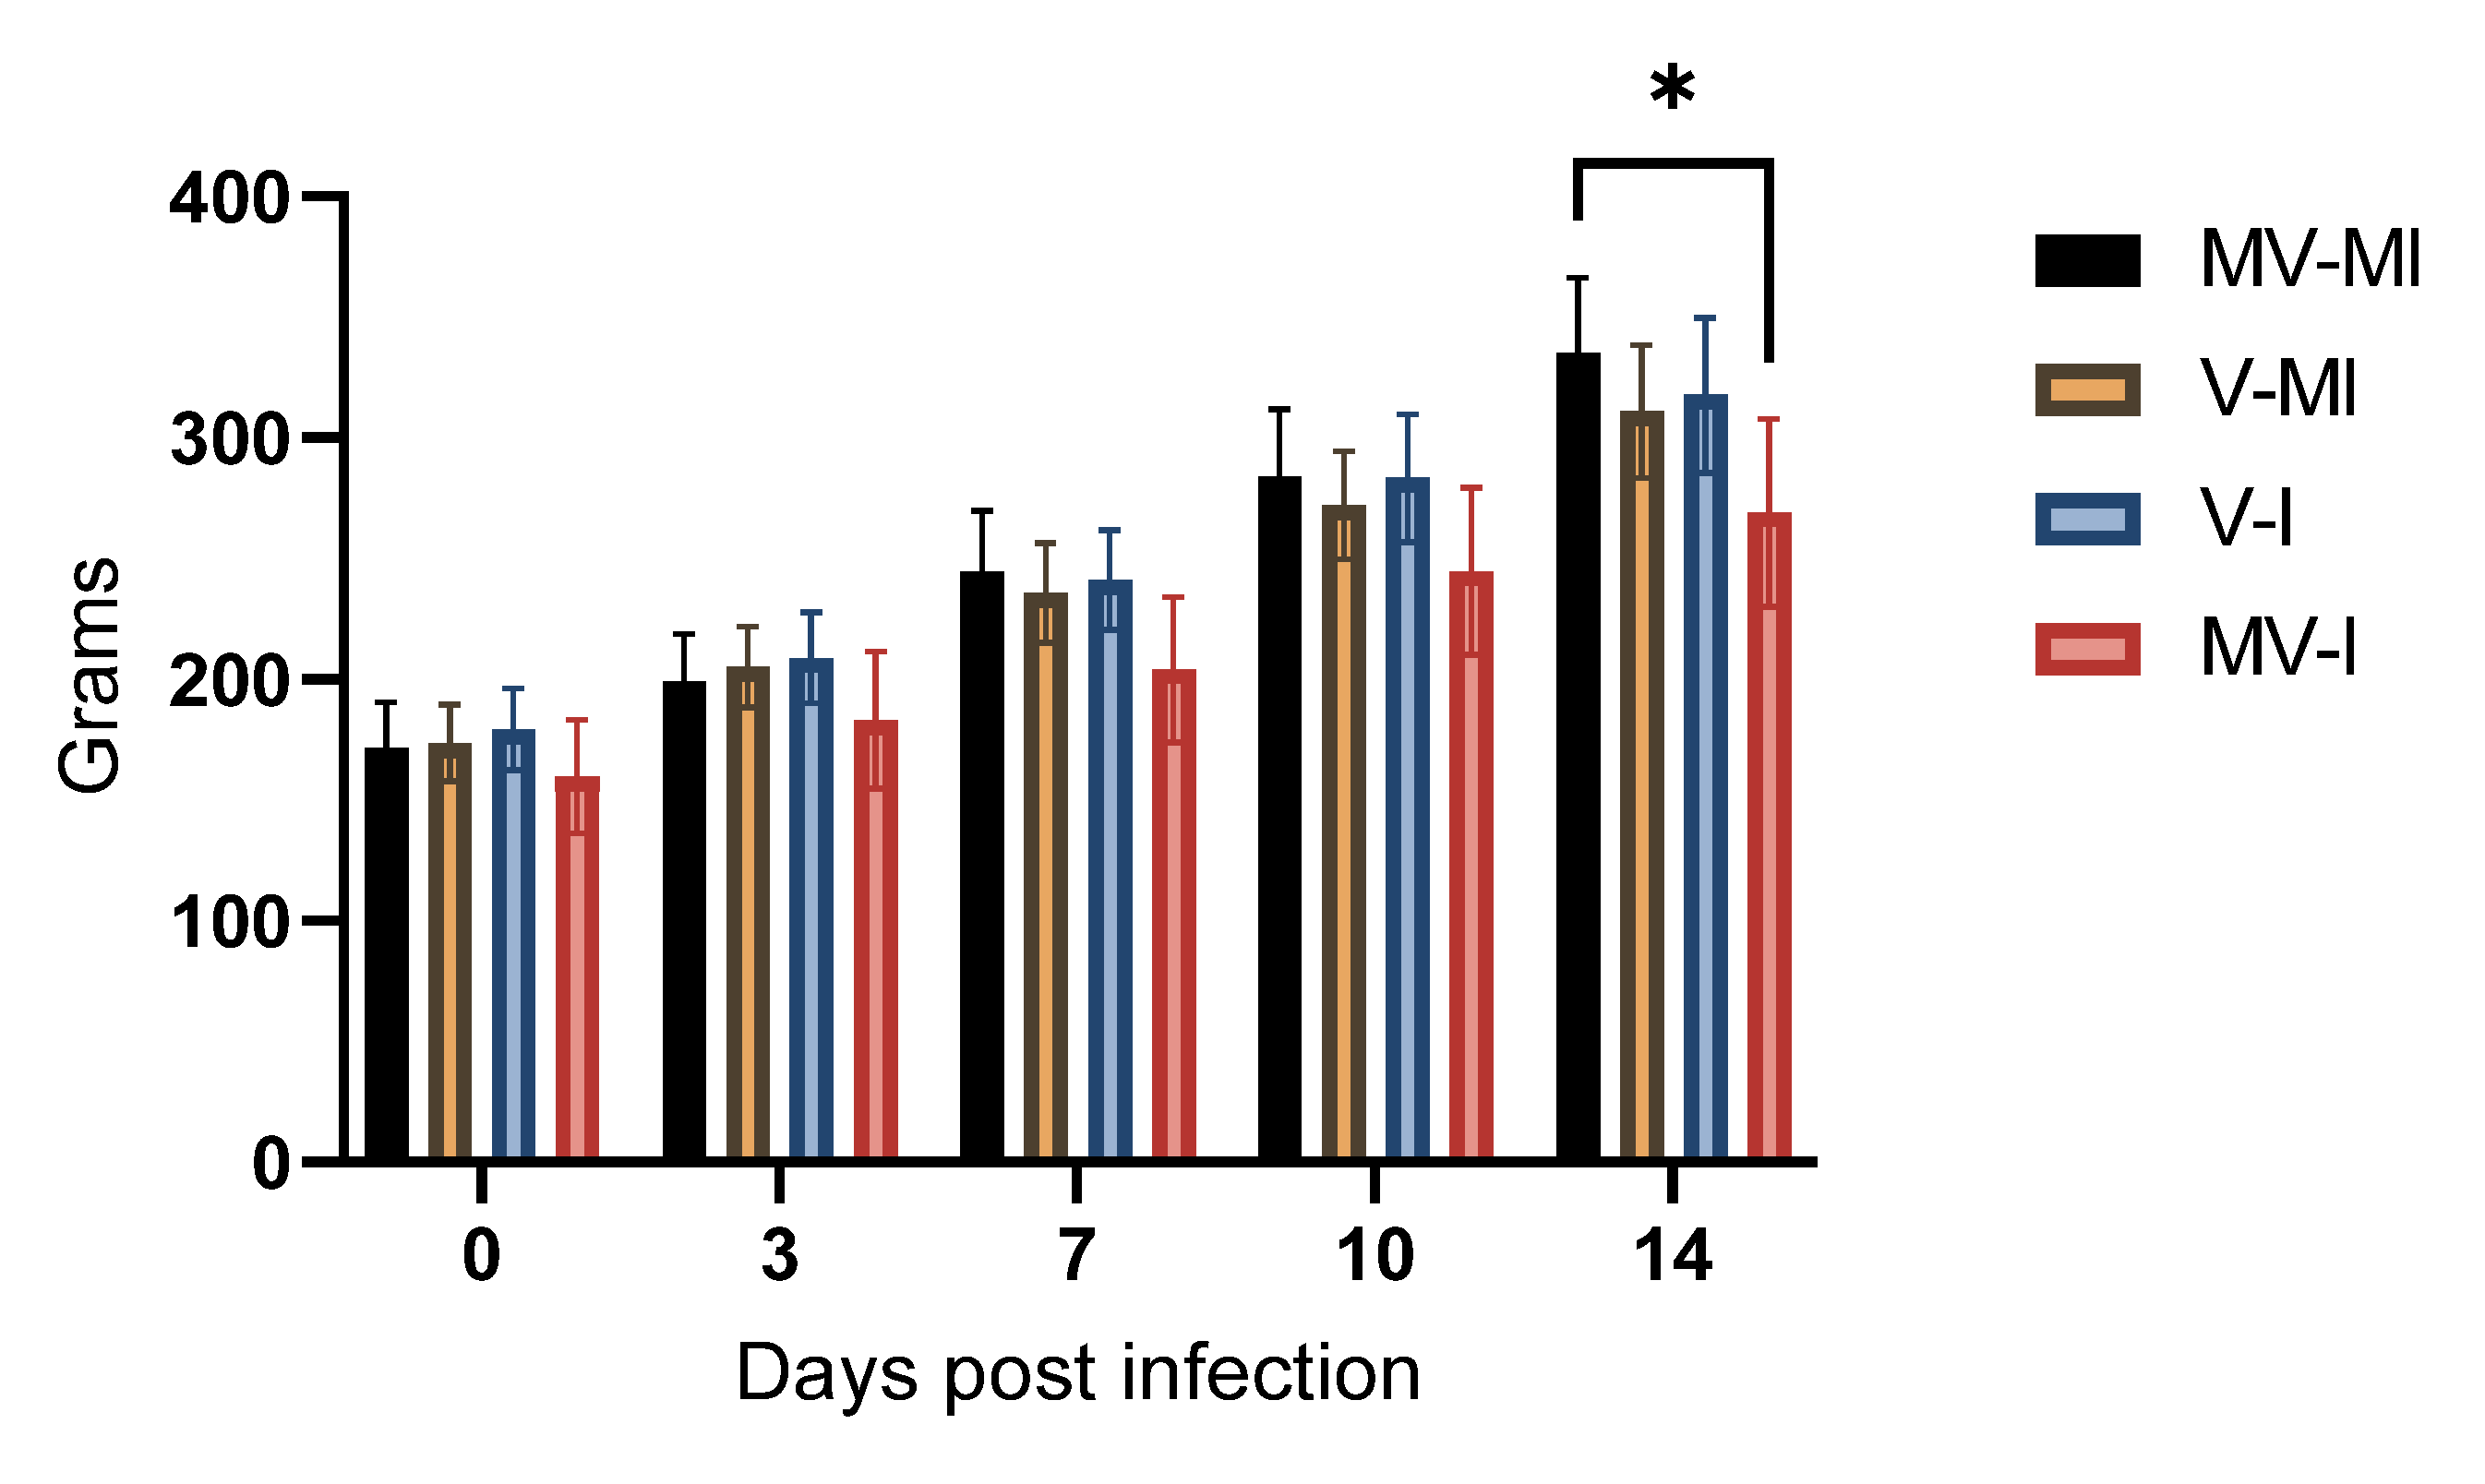
3.4. Bodyweight
3.5. ILTV Genome Loads
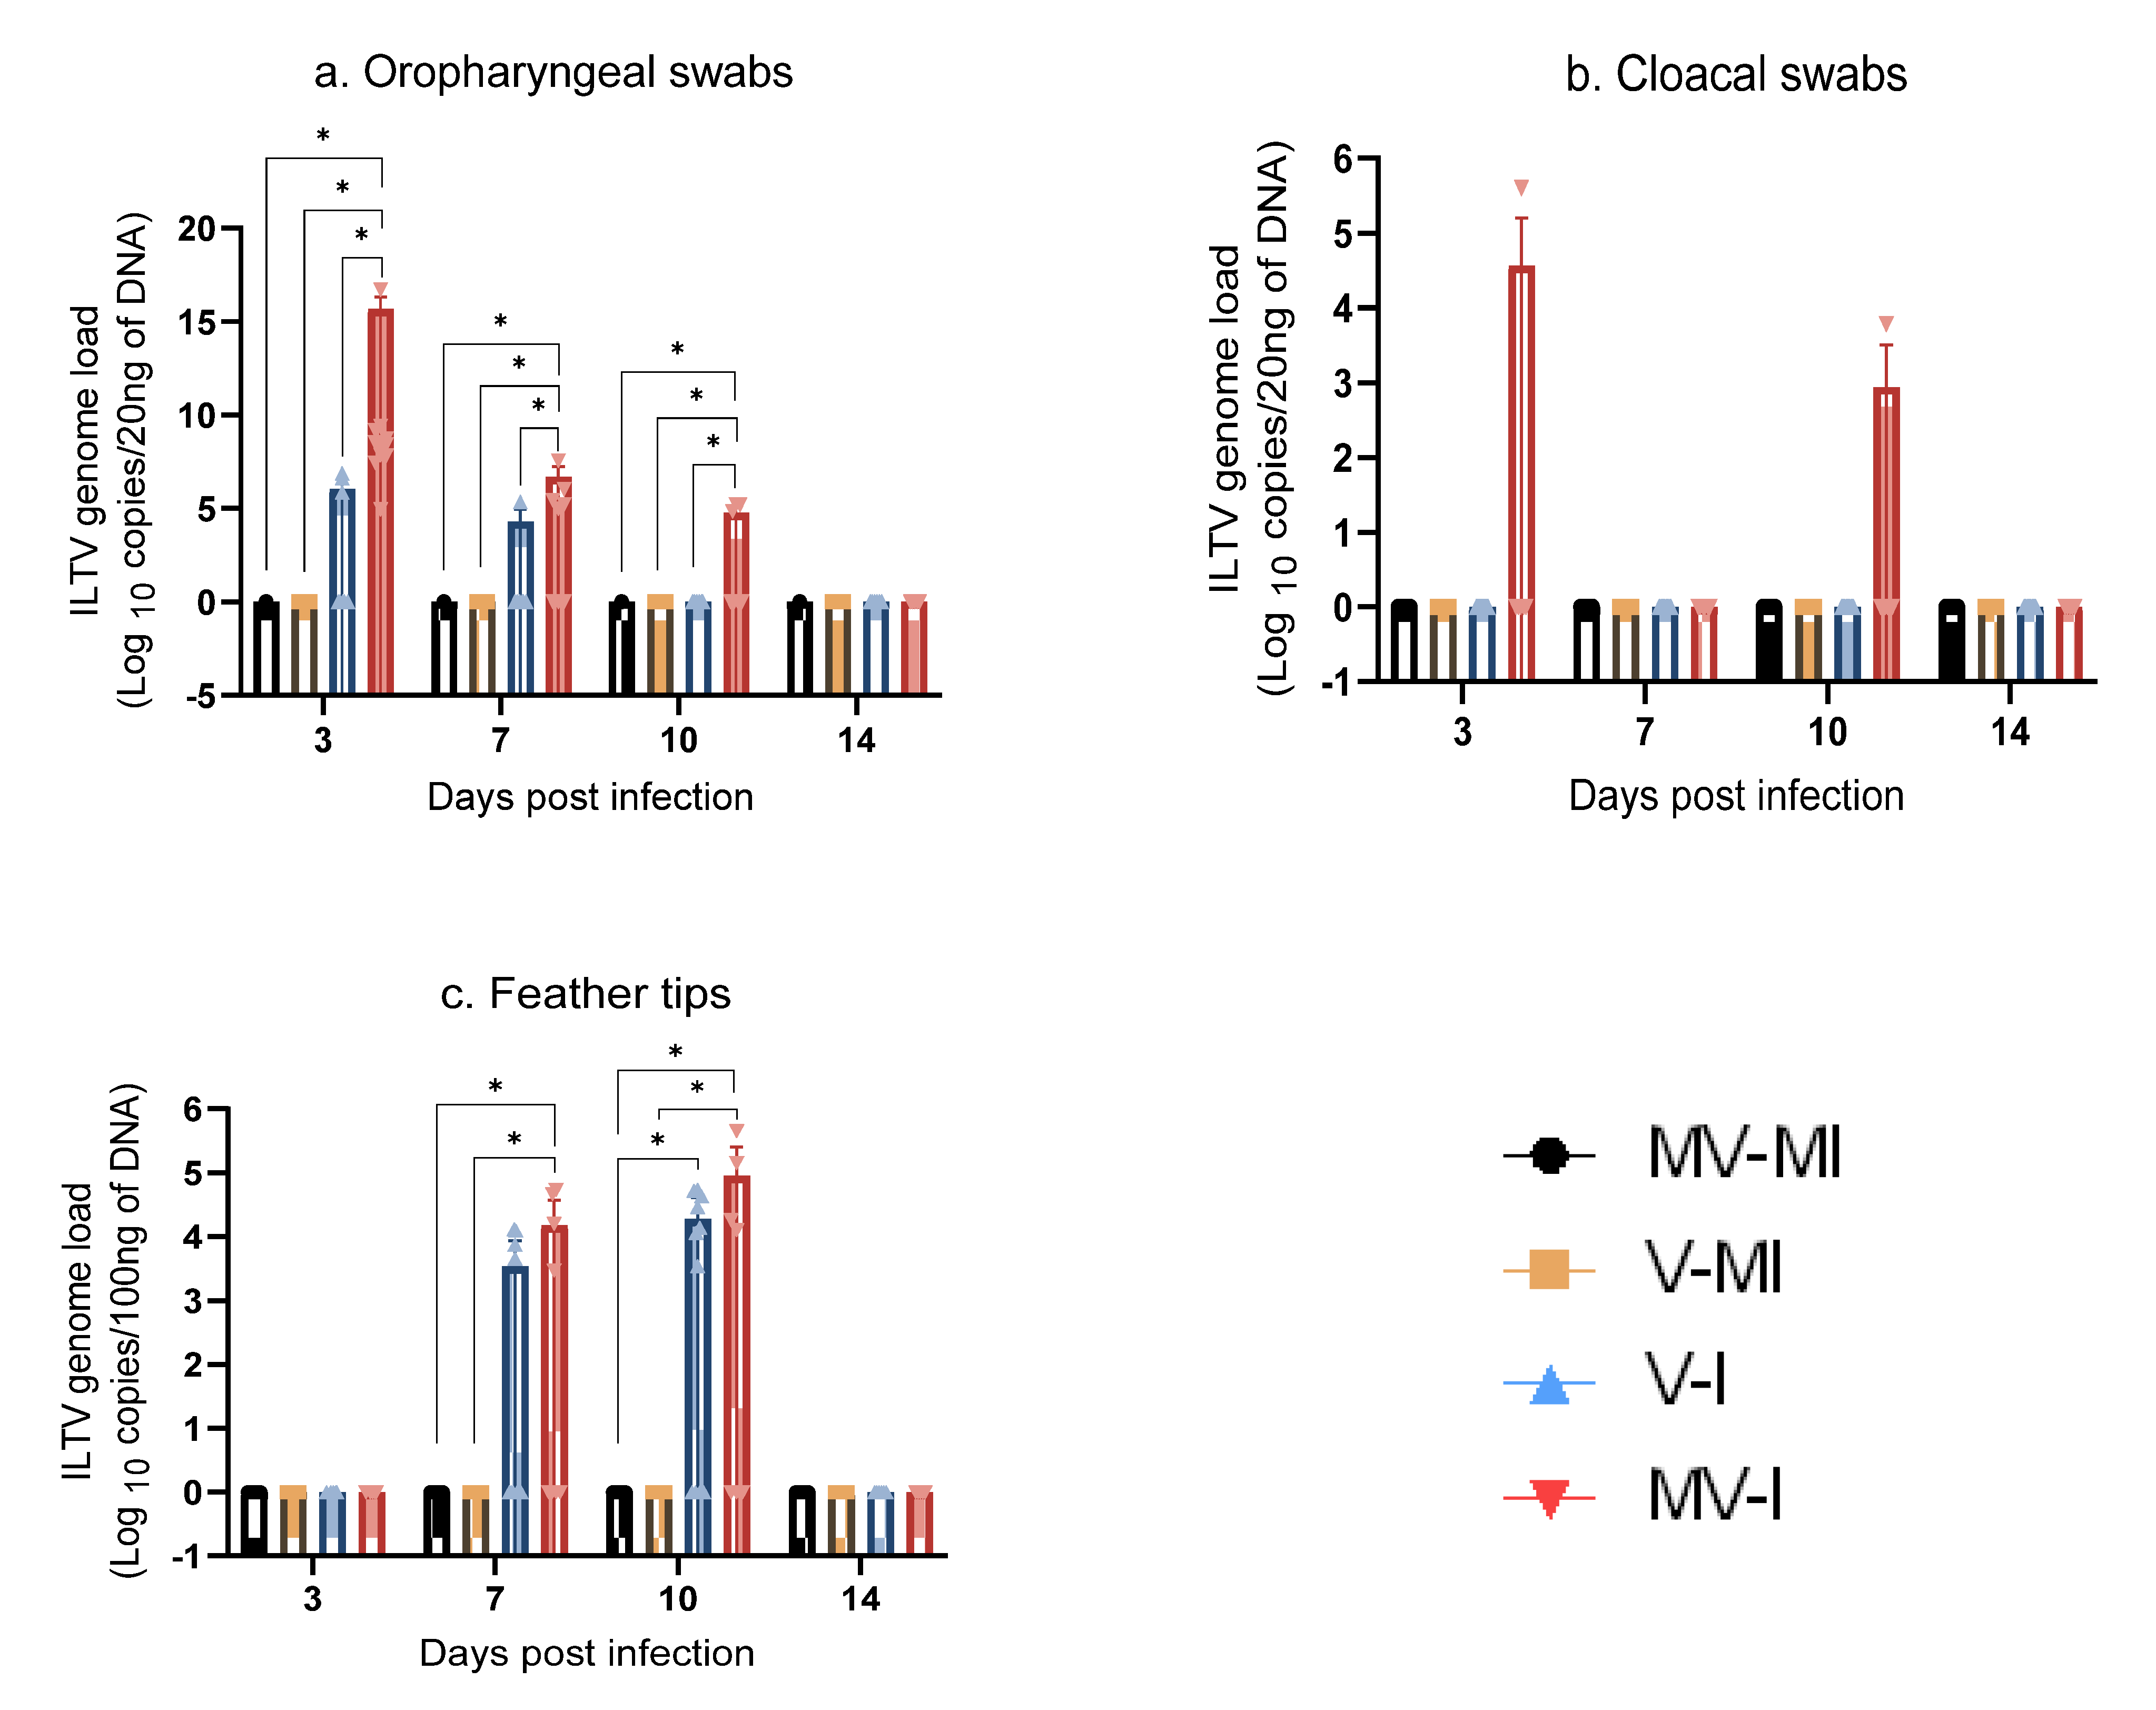
3.5.1. ILTV Genome Loads in Oropharyngeal Swabs
3.5.2. ILTV Genome Loads in Cloacal Swabs
3.5.3. ILTV Genome Loads in Feather Tips
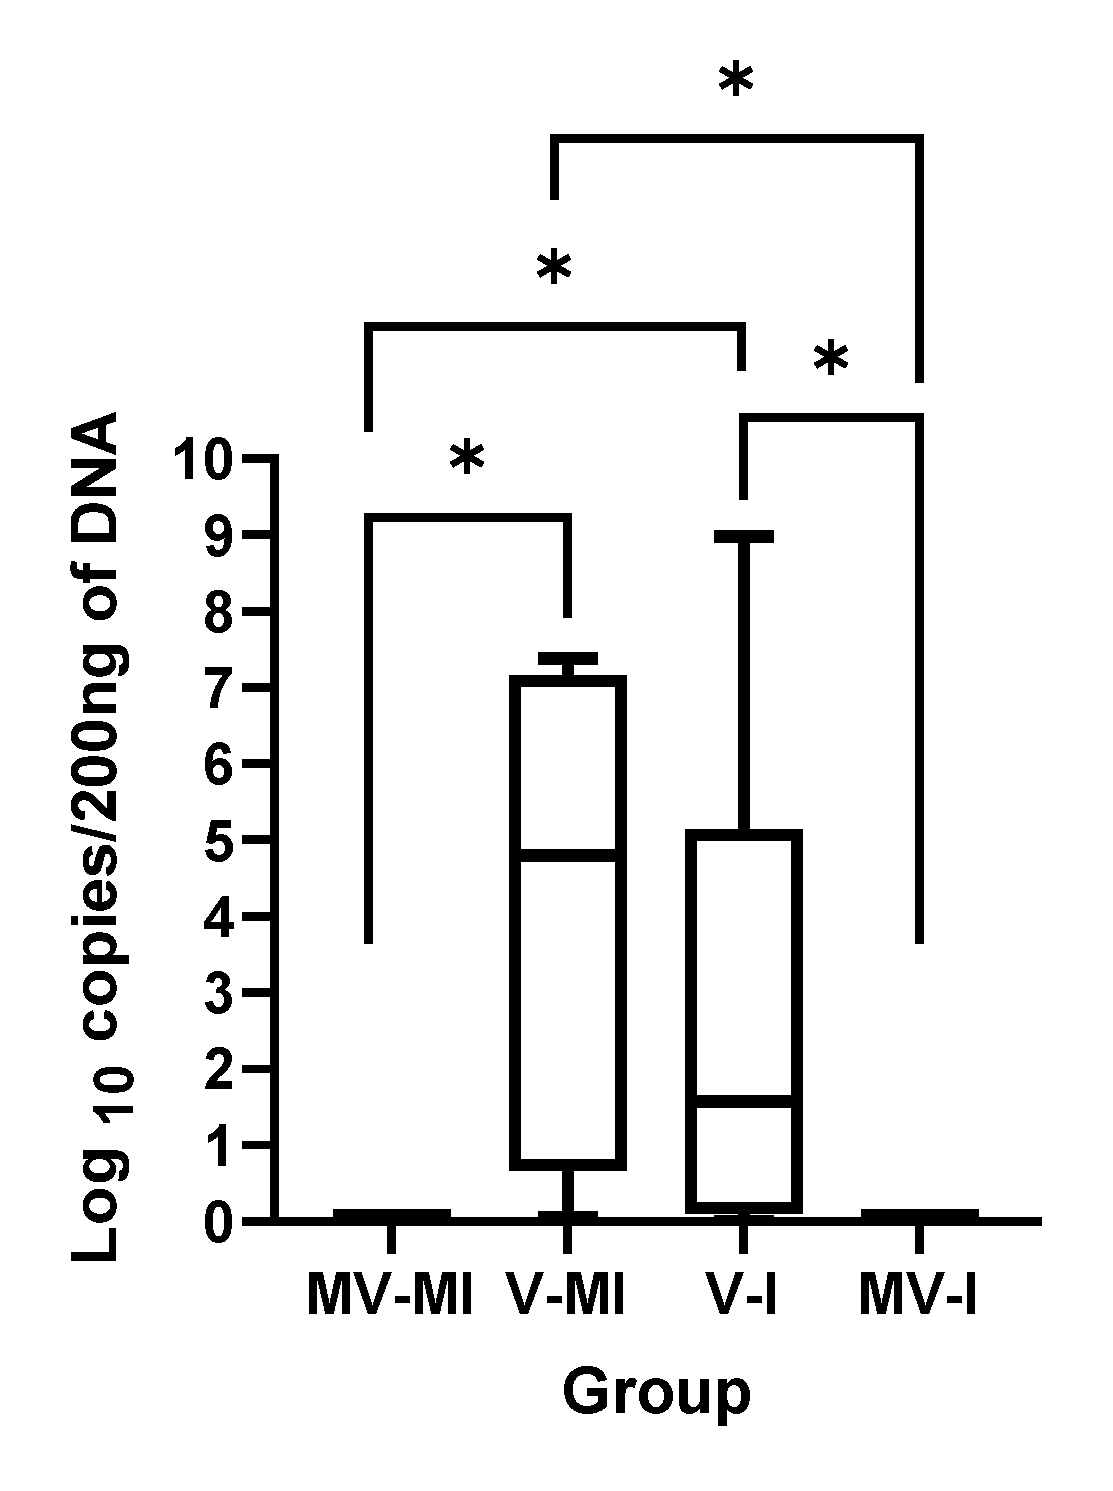
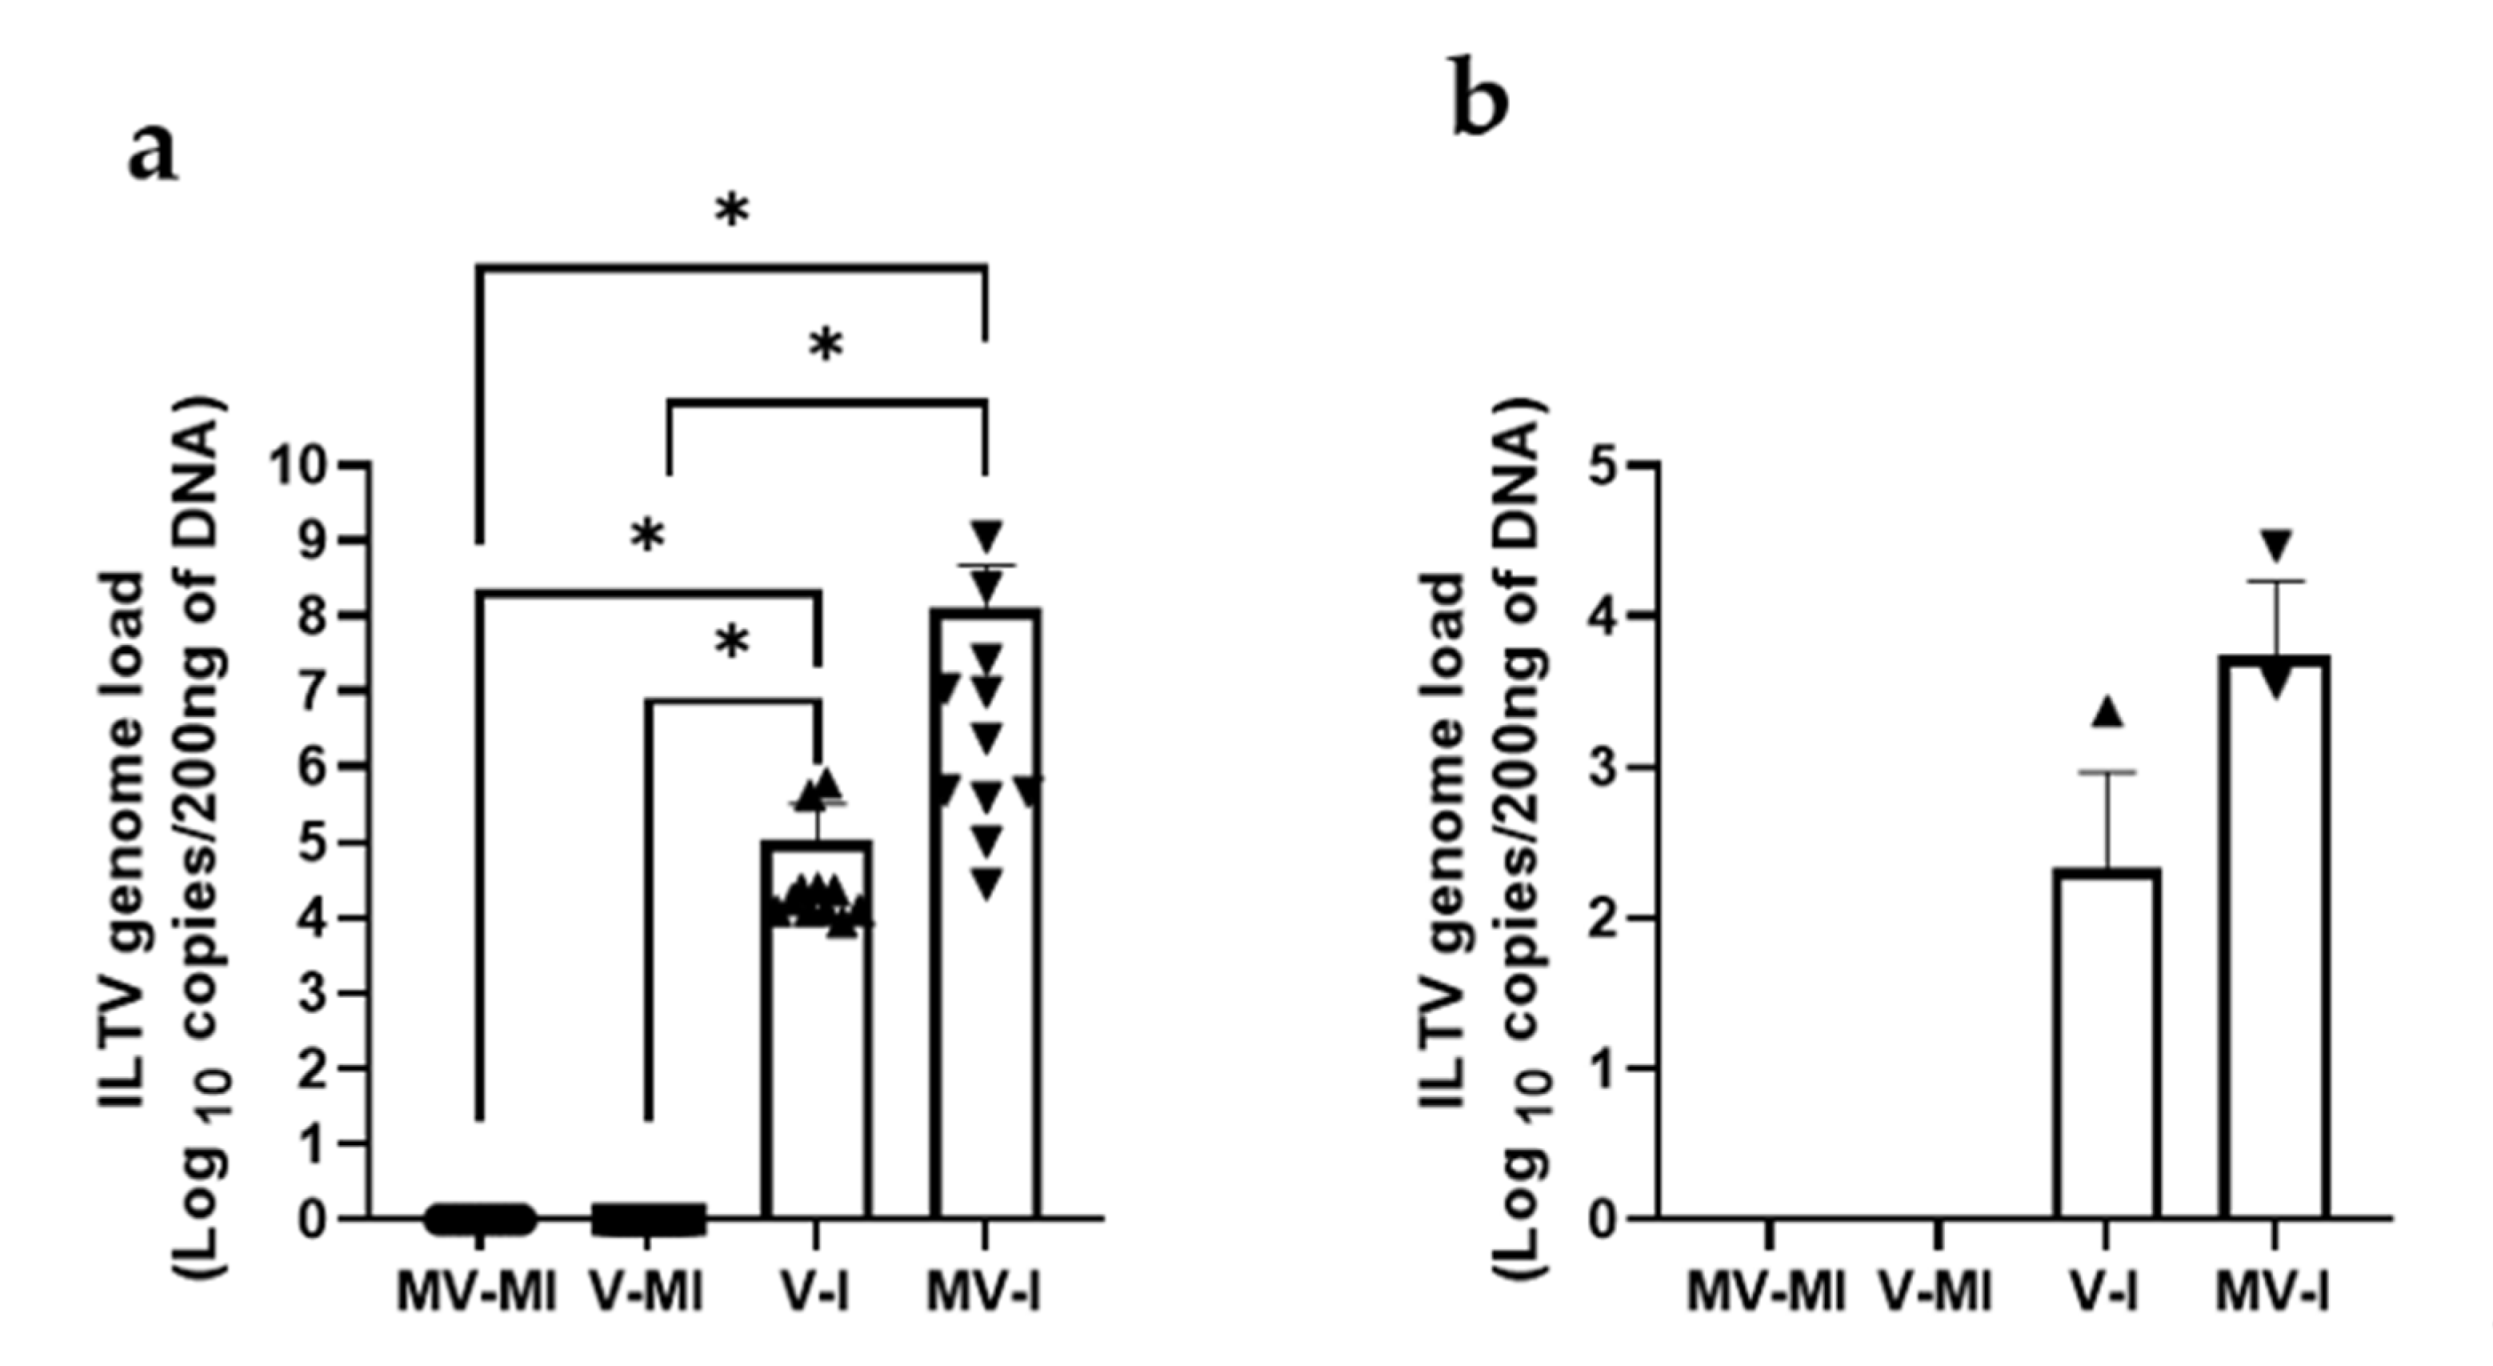
3.5.4. ILTV Genome Loads in Trachea and Lungs
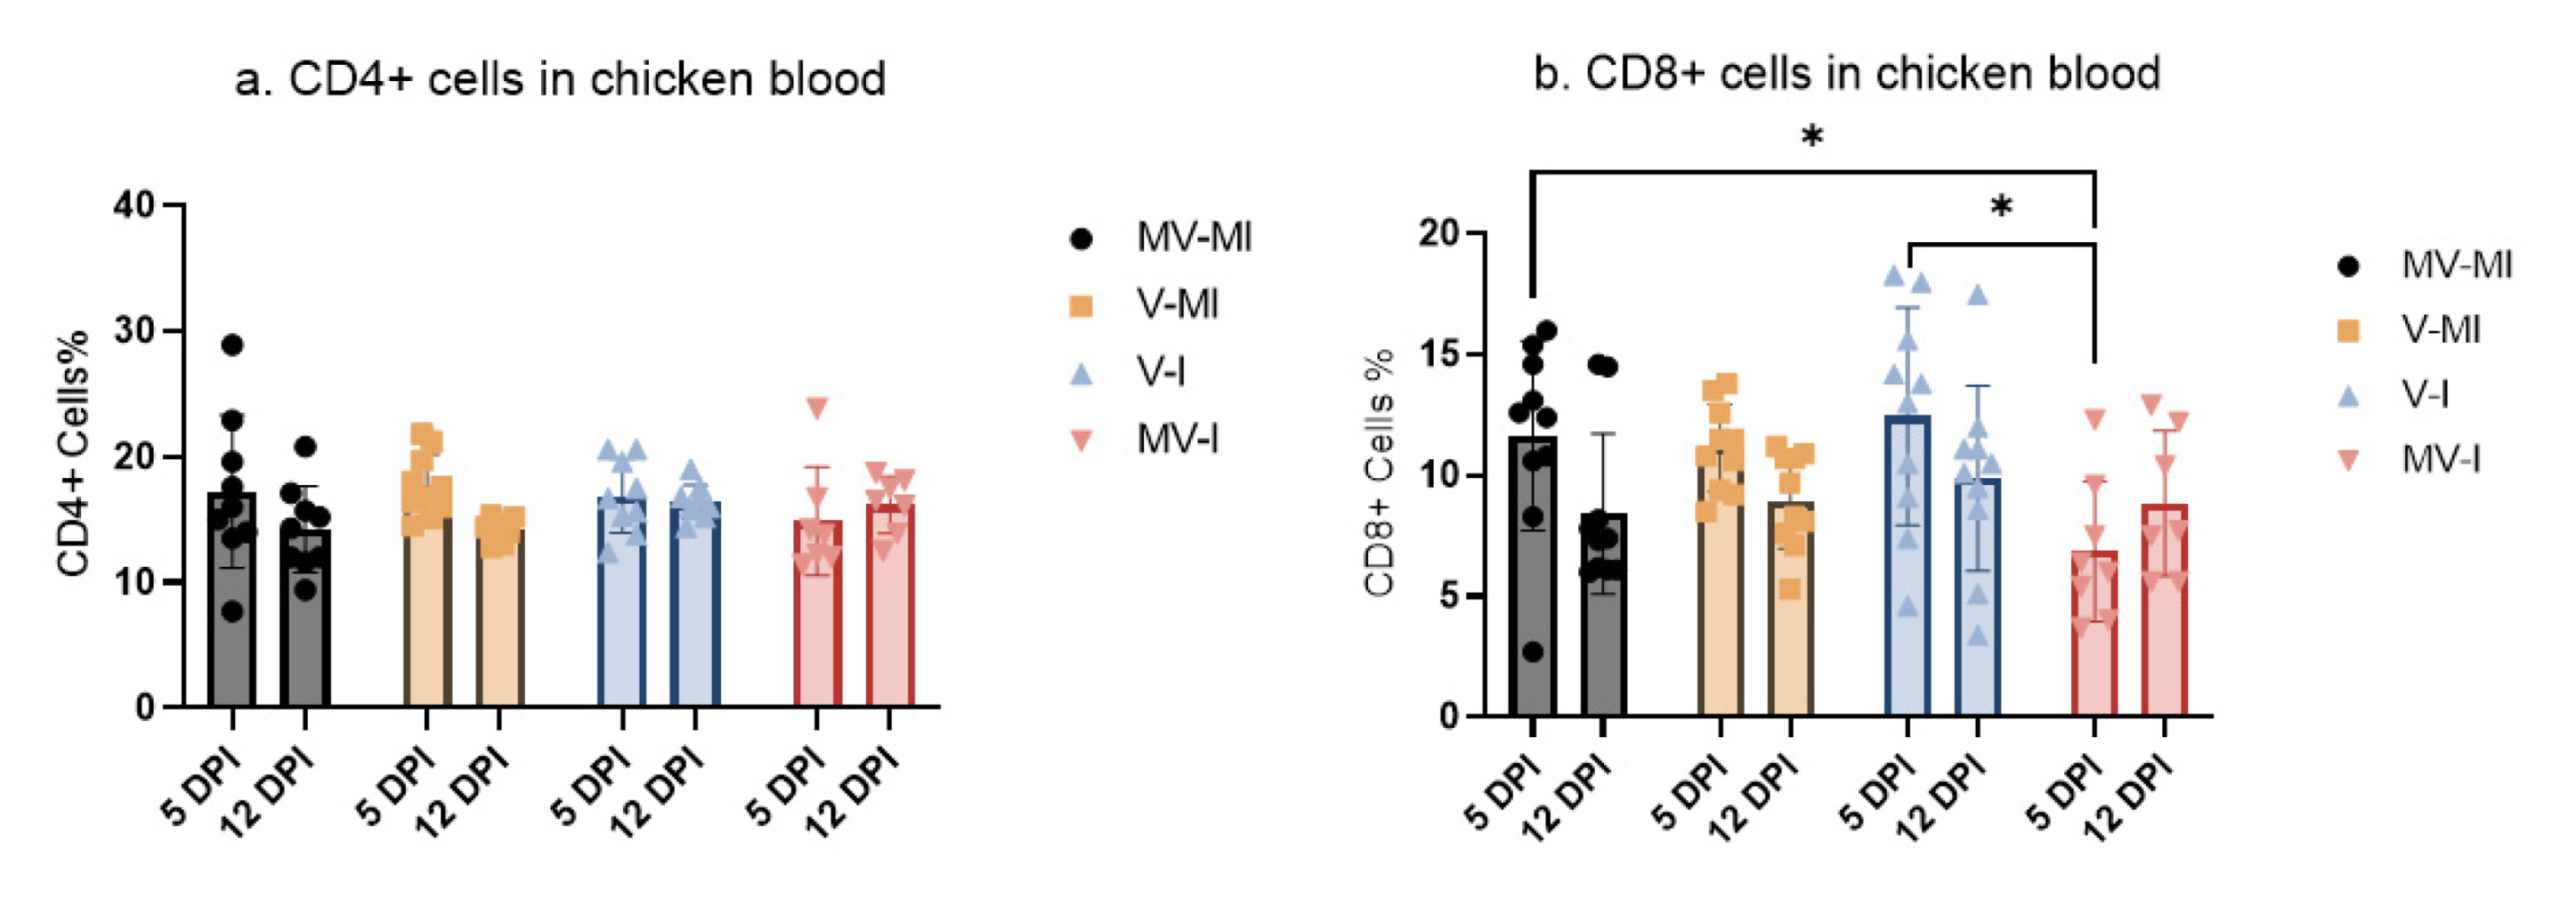
3.6. Peripheral Blood CD4+ and CD8+ T Cells
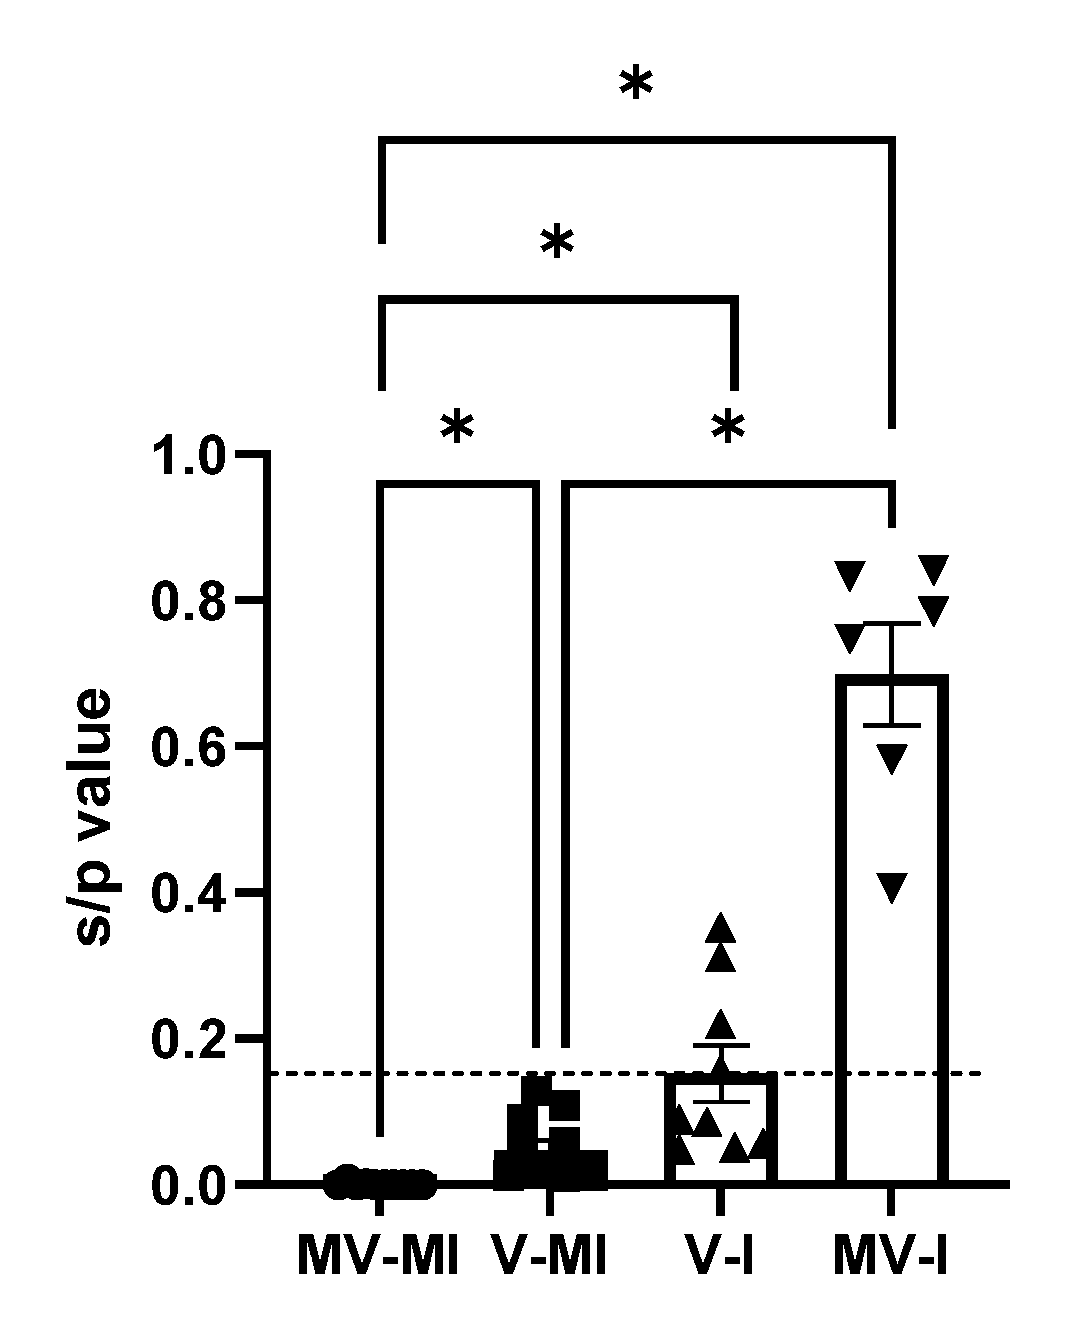
3.7. Anti-ILTV Antibody Response
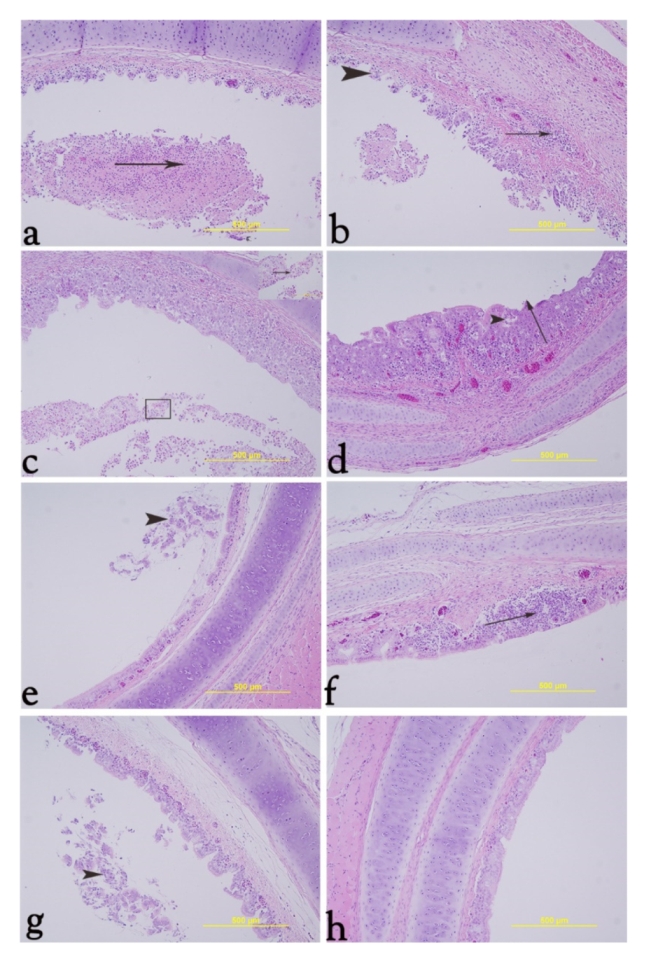
3.8. Histology
4. Discussion
5. Conclusions
Author Contributions
Funding
Institutional Review Board Statement
Informed Consent Statement
Data Availability Statement
Acknowledgments
Conflicts of Interest
References
- La, T.-M.; Choi, E.-J.; Lee, J.-B.; Park, S.-Y.; Song, C.-S.; Choi, I.-S.; Lee, S.-W. Comparative genome analysis of Korean field strains of infectious laryngotracheitis virus. PLoS ONE 2019, 14, e0211158. [Google Scholar] [CrossRef]
- Cover, M.S. The Early History of Infectious Laryngotracheitis. Avian Dis. 1996, 40, 494–500. [Google Scholar] [CrossRef]
- Cruickshank, J.G.; Berry, D.M.; Hay, B. The fine structure of infectious laryngotracheitis virus. Virology 1963, 20, 376–378. [Google Scholar] [CrossRef]
- Winterfield, R.W.; So, I.G. Susceptibility of turkeys to infectious laryngotracheitis. Avian Dis. 1968, 12, 191–202. [Google Scholar] [CrossRef]
- Seddon, H.R.; Hart, L. Infectivity Experiments With the Virus of Laryngotracheitis of Fowls*. Aust. Vet. J. 1936, 12, 13–16. [Google Scholar] [CrossRef]
- Garcia, M.; Spatz, S.; Guy, J.S. Infectious Laryngotracheitis. In Disease of Poultry, 13th ed.; Swayne, D.E., Ed.; Wiley-Blackwell: West Sussex, UK, 2013; pp. 161–174. [Google Scholar]
- Bagust, T.J.; Jones, R.C.; Guy, J.S. Avian infectious laryngotracheitis. Rev. Sci. Tech. 2000, 19, 483–492. [Google Scholar] [CrossRef]
- Fahey, K.J.; Bagust, T.J.; York, J.J. Laryngotracheitis herpesvirus infection in the chicken: The role of humoral antibody in immunity to a graded challenge infection. Avian Pathol. 1983, 12, 505–514. [Google Scholar] [CrossRef]
- Williams, R.A.; Bennett, M.; Bradbury, J.M.; Gaskell, R.M.; Jones, R.C.; Jordan, F.T.W. Demonstration of sites of latency of infectious laryngotracheitis virus using the polymerase chain reaction. J. Gen. Virol. 1992, 73, 2415–2420. [Google Scholar] [CrossRef]
- Bagust, T.J. Laryngotracheitis (Gallid-1) herpesvirus infection in the chicken 4. latency establishment by wild and vaccine strains of ILT virus. Avian Pathol. 1986, 15, 581–595. [Google Scholar] [CrossRef]
- Barboza-Solis, C.; Contreras, A.P.; Palomino-Tapia, V.A.; Joseph, T.; King, R.; Ravi, M.; Peters, D.; Fonseca, K.; Gagnon, C.A.; van der Meer, F.; et al. Genotyping of Infectious Laryngotracheitis Virus (ILTV) Isolates from Western Canadian Provinces of Alberta and British Columbia Based on Partial Open Reading Frame (ORF) a and b. Animals 2020, 10, 1634. [Google Scholar] [CrossRef]
- Perez-Contreras, A.; van der Meer, F.; Checkley, S.; Joseph, T.; King, R.; Ravi, M.; Peters, D.; Fonseca, K.; Gagnon, C.A.; Provost, C.; et al. Analysis of Whole-Genome Sequences of Infectious laryngotracheitis Virus Isolates from Poultry Flocks in Canada: Evidence of Recombination. Viruses 2020, 12, 1302. [Google Scholar] [CrossRef]
- Ojkic, D.; Swinton, J.; Vallieres, M.; Martin, E.; Shapiro, J.; Sanei, B.; Binnington, B. Characterization of field isolates of infectious laryngotracheitis virus from Ontario. Avian Pathol. 2006, 35, 286–292. [Google Scholar] [CrossRef]
- Canadian Poultry Magazine. Available online: https://www.canadianpoultrymag.com/ilt-quebec-30886/ (accessed on 28 December 2018).
- Canadian Poultry Magazine. Available online: https://www.canadianpoultrymag.com/disease-watch-infectious-laryngotracheitis-ilt-canada-30562/ (accessed on 14 July 2018).
- Hein, T. ILT Outbreaks hit Ontario Region. Available online: https://www.canadianpoultrymag.com/ilt-outbreaks-hit-ontario-region/ (accessed on 24 February 2021).
- Centre, F.B.C. Disease Watch: ILT—Niagara, Ont. Available online: https://www.canadianpoultrymag.com/disease-watch-ilt-peterborough-county-ont-2/ (accessed on 3 December 2020).
- Chacon, J.L.; Ferreira, A.J. Differentiation of field isolates and vaccine strains of infectious laryngotracheitis virus by DNA sequencing. Vaccine 2009, 27, 6731–6738. [Google Scholar] [CrossRef] [PubMed]
- Benton, W.J.; Cover, M.S.; Greene, L.M. The Clinical and Serological Response of Chickens to Certain Laryngotracheitis Viruses. Avian Dis. 1958, 2, 383–396. [Google Scholar] [CrossRef]
- Gelenczei, E.F.; Marty, E.W. Studies on a Tissue-Culture-Modified Infectious Laryngotracheitis Virus. Avian Dis. 1964, 8, 105–122. [Google Scholar] [CrossRef]
- Shehata, A.A.; Halami, M.Y.; Sultan, H.H.; El-Razik, A.G.A.; Vahlenkamp, T.W. Chicken embryo origin-like strains are responsible for Infectious laryngotracheitis virus outbreaks in Egyptian cross-bred broiler chickens. Virus Genes 2013, 46, 423–430. [Google Scholar] [CrossRef]
- Guy, J.S.; Barnes, H.J.; Smith, L. Increased Virulence of Modified-Live Infectious Laryngotracheitis Vaccine Virus Following Bird-to-Bird Passage. Avian Dis. 1991, 35, 348–355. [Google Scholar] [CrossRef]
- Garcia, M.; Zavala, G. Commercial Vaccines and Vaccination Strategies Against Infectious Laryngotracheitis: What We Have Learned and Knowledge Gaps That Remain. Avian Dis. 2019, 63, 325–334. [Google Scholar] [CrossRef]
- Bayoumi, M.; El-Saied, M.; Amer, H.; Bastami, M.; Sakr, E.E.; El-Mahdy, M. Molecular characterization and genetic diversity of the infectious laryngotracheitis virus strains circulating in Egypt during the outbreaks of 2018 and 2019. Arch. Virol. 2020, 165, 661–670. [Google Scholar] [CrossRef] [PubMed]
- Agnew-Crumpton, R.; Vaz, P.K.; Devlin, J.M.; O’Rourke, D.; Blacker-Smith, H.P.; Konsak-Ilievski, B.; Hartley, C.A.; Noormohammadi, A.H. Spread of the newly emerging infectious laryngotracheitis viruses in Australia. Infect. Genet. Evol. 2016, 43, 67–73. [Google Scholar] [CrossRef]
- Lee, S.-W.; Hartley, C.A.; Coppo, M.J.C.; Vaz, P.K.; Legione, A.R.; Quinteros, J.A.; Noormohammadi, A.H.; Markham, P.F.; Browning, G.F.; Devlin, J.M. Growth Kinetics and Transmission Potential of Existing and Emerging Field Strains of Infectious Laryngotracheitis Virus. PLoS ONE 2015, 10, e0120282. [Google Scholar] [CrossRef] [Green Version]
- Koski, D.M.; Predgen, A.S.; Trampel, D.W.; Conrad, S.K.; Narwold, D.R.; Hermann, J.R. Comparison of the pathogenicity of the USDA challenge virus strain to a field strain of infectious laryngotracheitis virus. Biologicals 2015, 43, 232–237. [Google Scholar] [CrossRef] [PubMed]
- Lin, G. Infectious laryngotracheitis cases in the Fraser Valley of British Columbia 2017 to 2020. In Proceedings of the 70th Western Poultry Disease Conference, Virtual Conference, 15–16 March 2021; pp. 116–117. [Google Scholar]
- Van Esch, H. Characterization of Alberta Backyard Poultry Flocks. Master’s Thesis, University of Calgary, Calgary, AB, Canada, 2021. [Google Scholar]
- Gimeno, I.M.; Cortes, A.L.; Guy, J.S.; Turpin, E.; Williams, C. Replication of recombinant herpesvirus of turkey expressing genes of infectious laryngotracheitis virus in specific pathogen free and broiler chickens following in ovo and subcutaneous vaccination. Avian Pathol. 2011, 40, 395–403. [Google Scholar] [CrossRef] [PubMed] [Green Version]
- Davison, S.; Eric, N.G.; Susan, C.; Eckroade, R.J. Evaluation of the Efficacy of a Live Fowlpox-Vectored Infectious Laryngotracheitis/Avian Encephalomyelitis Vaccine against ILT Viral Challenge. Avian Dis. 2006, 50, 50–54. [Google Scholar] [CrossRef]
- Esaki, M.; Noland, L.; Eddins, T.; Godoy, A.; Saeki, S.; Saitoh, S.; Yasuda, A.; Dorsey, K.M. Safety and Efficacy of a Turkey Herpesvirus Vector Laryngotracheitis Vaccine for Chickens. Avian Dis. 2013, 57, 192–198. [Google Scholar] [CrossRef]
- Islam, A.; Walkden-Brown, S.W.; Groves, P.J.; Underwood, G.J. Kinetics of Marek’s disease virus (MDV) infection in broiler chickens 1: Effect of varying vaccination to challenge interval on vaccinal protection and load of MDV and herpesvirus of turkey in the spleen and feather dander over time. Avian Pathol. 2008, 37, 225–235. [Google Scholar] [CrossRef]
- Johnson, D.I.; Vagnozzi, A.; Dorea, F.; Riblet, S.M.; Mundt, A.; Zavala, G.; Garcia, M. Protection Against Infectious Laryngotracheitis by In Ovo Vaccination with Commercially Available Viral Vector Recombinant Vaccines. Avian Dis. 2010, 54, 1251–1259. [Google Scholar] [CrossRef]
- Vagnozzi, A.; Zavala, G.; Riblet, S.M.; Mundt, A.; García, M. Protection induced by commercially available live-attenuated and recombinant viral vector vaccines against infectious laryngotracheitis virus in broiler chickens. Avian Pathol. 2012, 41, 21–31. [Google Scholar] [CrossRef] [PubMed]
- Maekawa, D.; Beltran, G.; Riblet, S.M.; Garcia, M. Protection Efficacy of a Recombinant Herpesvirus of Turkey Vaccine Against Infectious Laryngotracheitis Virus Administered In Ovo to Broilers at Three Standardized Doses. Avian Dis. 2019, 63, 351–358. [Google Scholar] [CrossRef]
- Maekawa, D.; Riblet, S.M.; Newman, L.; Koopman, R.; Barbosa, T.; Garcia, M. Evaluation of vaccination against infectious laryngotracheitis (ILT) with recombinant herpesvirus of turkey (rHVT-LT) and chicken embryo origin (CEO) vaccines applied alone or in combination. Avian Pathol. 2019, 48, 573–581. [Google Scholar] [CrossRef]
- Palomino-Tapia, V.A.; Zavala, G.; Cheng, S.; Garcia, M. Long-term protection against a virulent field isolate of infectious laryngotracheitis virus induced by inactivated, recombinant, and modified live virus vaccines in commercial layers. Avian Pathol. 2019, 48, 209–220. [Google Scholar] [CrossRef]
- Perez-Contreras, A.; Barboza-Solis, C.; Najimudeen, S.M.; Checkley, S.; van der Meer, F.; Joseph, T.; King, R.; Ravi, M.; Peters, D.; Fonseca, K.; et al. Pathogenic and Transmission Potential of Wildtype and Chicken Embryo Origin (CEO) Vaccine Revertant Infectious Laryngotracheitis Virus. Viruses 2021, 13, 541. [Google Scholar] [CrossRef]
- Reed, L.J.; Muench, H. A simple method of estimating fifty per cent endpoints. Am. J. Epidemiol. 1938, 27, 493–497. [Google Scholar] [CrossRef]
- Rodenbaugh, C.I.; Lyon, S.D.; Hanzlicek, A.S.; Kanda, I.; Payton, M.E.; Rizzi, T.E.; Holland, L.A.; Brandao, J. Dynamic viscoelastic coagulometry of blood obtained from healthy chickens. Am. J. Vet. Res. 2019, 80, 441–448. [Google Scholar] [CrossRef]
- Thapa, S.; Nagy, E.; Abdul-Careem, M.F. In ovo delivery of toll-like receptor 2 ligand, lipoteichoic acid induces pro-inflammatory mediators reducing post-hatch infectious laryngotracheitis virus infection. Vet. Immunol. Immunopathol. 2015, 164, 170–178. [Google Scholar] [CrossRef]
- Dalgaard, T.S.; Norup, L.R.; Rubbenstroth, D.; Wattrang, E.; Juul-Madsen, H.R. Flow cytometric assessment of antigen-specific proliferation in peripheral chicken T cells by CFSE dilution. Vet. Immunol. Immunopathol. 2010, 138, 85–94. [Google Scholar] [CrossRef] [PubMed]
- Lanier, L.L.; Warner, N.L. Paraformaldehyde fixation of hematopoietic cells for quantitative flow cytometry (FACS) analysis. J. Immunol. Methods 1981, 47, 25–30. [Google Scholar] [CrossRef]
- Guy, J.S.; Barnes, H.J.; Morgan, L.M. Virulence of infectious laryngotracheitis viruses: Comparison of modified-live vaccine viruses and North Carolina field isolates. Avian Dis. 1990, 34, 106–113. [Google Scholar] [CrossRef] [PubMed]
- Marangon, S.; Busani, L. The use of vaccination in poultry production. Rev. Sci. Tech. 2007, 26, 265–274. [Google Scholar] [CrossRef] [Green Version]
- Davidson, I.; Raibshtein, I.; Altori, A.; Elkin, N. Infectious laryngotracheitis virus (ILTV) vaccine intake evaluation by detection of virus amplification in feather pulps of vaccinated chickens. Vaccine 2016, 34, 1630–1633. [Google Scholar] [CrossRef] [PubMed]
- Thilakarathne, D.S.; Noormohammadi, A.H.; Browning, G.F.; Quinteros, J.A.; Underwood, G.J.; Hartley, C.A.; Coppo, M.J.; Devlin, J.M.; Diaz-Mendez, A. Pathogenesis and tissue tropism of natural field recombinants of infectious laryngotracheitis virus. Vet. Microbiol. 2020, 243, 108635. [Google Scholar] [CrossRef]
- Thilakarathne, D.S.; Hartley, C.A.; Diaz-Méndez, A.; Coppo, M.J.C.; Devlin, J.M. Development and application of a combined molecular and tissue culture-based approach to detect latent infectious laryngotracheitis virus (ILTV) in chickens. J. Virol. Methods 2020, 277, 113797. [Google Scholar] [CrossRef]
- Thilakarathne, D.S.; Hartley, C.A.; Diaz-Méndez, A.; Quinteros, J.A.; Fakhri, O.; Coppo, M.J.C.; Devlin, J.M. Latency characteristics in specific pathogen-free chickens 21 and 35 days after intra-tracheal inoculation with vaccine or field strains of infectious laryngotracheitis virus. Avian Pathol. 2020, 49, 369–379. [Google Scholar] [CrossRef]
- Ahmed, R.; Gray, D. Immunological memory and protective immunity: Understanding their relation. Science 1996, 272, 54–60. [Google Scholar] [CrossRef]
- Zinkernagel, R.; Hengartner, H. Antiviral immunity. Immunol. Today 1997, 18, 258–260. [Google Scholar] [CrossRef]
- Fahey, K.J.; York, J.J. The role of mucosal antibody in immunity to infectious laryngotracheitis virus in chickens. J. Gen. Virol. 1990, 71, 2401–2405. [Google Scholar] [CrossRef]
- Honda, T.; Okamura, H.; Taneno, A.; Yamada, S.; Takahashi, E. The Role of Cell-Mediated Immunity in Chickens Inoculated with the Cell-Associated Vaccine of Attenuated Infectious Laryngotracheitis Virus. J. Vet. Med Sci. 1994, 56, 1051–1055. [Google Scholar] [CrossRef] [Green Version]
- Hao, X.L.; Li, S.; Chen, L.N.; Dong, M.L.; Wang, J.J.; Hu, J.; Gu, M.; Wang, X.Q.; Hu, S.L.; Peng, D.X.; et al. Establishing a Multicolor Flow Cytometry to Characterize Cellular Immune Response in Chickens Following H7N9 Avian Influenza Virus Infection. Viruses 2020, 12, 1396. [Google Scholar] [CrossRef]
- Taebipour, M.J.; Dadras, H.; Nazifi, S.; Afsar, M.; Ansari-Lari, M. Evaluation of blood monocyte and lymphocyte population in broiler chicken after vaccination and experimental challenge with Newcastle disease virus. Vet. Immunol. Immunopathol. 2017, 190, 31–38. [Google Scholar] [CrossRef]
- Norup, L.R.; Dalgaard, T.S.; Pedersen, A.R.; Juul-Madsen, H.R. Assessment of Newcastle Disease–Specific T Cell Proliferation in Different Inbred MHC Chicken Lines. Scand. J. Immunol. 2011, 74, 23–30. [Google Scholar] [CrossRef]
- Fahey, K.J.; York, J.J.; Bagust, T.J. Laryngotracheitis herpesvirus infection in the chicken. II. The adoptive transfer of resistance with immune spleen cells. Avian Pathol. 1984, 13, 265–275. [Google Scholar] [CrossRef] [Green Version]
- York, J.J.; Fahey, K.J. Humoral and cell-mediated immune responses to the glycoproteins of infectious laryngotracheitis herpesvirus. Arch. Virol. 1990, 115, 289–297. [Google Scholar] [CrossRef]
- Devlin, J.M.; Browning, G.F.; Gilkerson, J.R. A glycoprotein I- and glycoprotein E-deficient mutant of infectious laryngotracheitis virus exhibits impaired cell-to-cell spread in cultured cells. Arch. Virol. 2006, 151, 1281–1289. [Google Scholar] [CrossRef]
- Devlin, J.M.; Viejo-Borbolla, A.; Browning, G.F.; Noormohammadi, A.H.; Gilkerson, J.R.; Alcami, A.; Hartley, C.A. Evaluation of immunological responses to a glycoprotein G deficient candidate vaccine strain of infectious laryngotracheitis virus. Vaccine 2010, 28, 1325–1332. [Google Scholar] [CrossRef]


| Group | n | Vaccination (1 Day of Age) | ILTV Infection (3 Weeks of Age) |
|---|---|---|---|
| MV-MI 1 | 11 | 0.2 mL of vaccine diluent | 0.2 mL of PBS |
| V-MI 2 | 11 | 0.2 mL of Innovax® ILT vaccine | 0.2 mL of PBS |
| V-I 3 | 11 | 0.2 mL of Innovax® ILT vaccine | 0.2 mL of AB-S63 ILTV |
| MV-I ⁴ | 11 | 0.2 mL of vaccine diluent | 0.2 mL of AB-S63 ILTV |
| Microscopic Lesions | MV-I 1 | V-I 2 | V-MI 3 | MV-MI 4 |
|---|---|---|---|---|
| Lamina epithelialis and intratracheal lumen: | ||||
| Necrotic desquamated epithelial cells and deciliation | 8/11 | 3/11 | 1/11 | 0/11 |
| Cellular exudate (heterophils, necrotic epithelium, erythrocytes) | 3/11 | 0/11 | 0/11 | 0/11 |
| Fibrinohemorrhagic exudate | 2/11 | 0/11 | 0/11 | 0/11 |
| Eosinophilic intra nuclear viral inclusions | 2/11 | 0/11 | 0/11 | 0/11 |
| Lamina propria: | ||||
| Mononuclear cell infiltration | 8/11 | 2/11 | 3/11 | 0/11 |
| Hyperemia | 3/11 | 1/11 | 2/11 | 1/11 |
Publisher’s Note: MDPI stays neutral with regard to jurisdictional claims in published maps and institutional affiliations. |
© 2021 by the authors. Licensee MDPI, Basel, Switzerland. This article is an open access article distributed under the terms and conditions of the Creative Commons Attribution (CC BY) license (https://creativecommons.org/licenses/by/4.0/).
Share and Cite
Barboza-Solis, C.; Najimudeen, S.M.; Perez-Contreras, A.; Ali, A.; Joseph, T.; King, R.; Ravi, M.; Peters, D.; Fonseca, K.; Gagnon, C.A.; et al. Evaluation of Recombinant Herpesvirus of Turkey Laryngotracheitis (rHVT-LT) Vaccine against Genotype VI Canadian Wild-Type Infectious Laryngotracheitis Virus (ILTV) Infection. Vaccines 2021, 9, 1425. https://0-doi-org.brum.beds.ac.uk/10.3390/vaccines9121425
Barboza-Solis C, Najimudeen SM, Perez-Contreras A, Ali A, Joseph T, King R, Ravi M, Peters D, Fonseca K, Gagnon CA, et al. Evaluation of Recombinant Herpesvirus of Turkey Laryngotracheitis (rHVT-LT) Vaccine against Genotype VI Canadian Wild-Type Infectious Laryngotracheitis Virus (ILTV) Infection. Vaccines. 2021; 9(12):1425. https://0-doi-org.brum.beds.ac.uk/10.3390/vaccines9121425
Chicago/Turabian StyleBarboza-Solis, Catalina, Shahnas M. Najimudeen, Ana Perez-Contreras, Ahmed Ali, Tomy Joseph, Robin King, Madhu Ravi, Delores Peters, Kevin Fonseca, Carl A. Gagnon, and et al. 2021. "Evaluation of Recombinant Herpesvirus of Turkey Laryngotracheitis (rHVT-LT) Vaccine against Genotype VI Canadian Wild-Type Infectious Laryngotracheitis Virus (ILTV) Infection" Vaccines 9, no. 12: 1425. https://0-doi-org.brum.beds.ac.uk/10.3390/vaccines9121425